ABN 59 088 110 141 For personal use onl - Home ... Communication Group Limited Annual Report 2009...
120
Mitchell Communication Group Limited Annual Report 2009 ABN 59 088 110 141 …nothing is beyond our reach. For personal use only
-
Upload
nguyendien -
Category
Documents
-
view
216 -
download
2
Transcript of ABN 59 088 110 141 For personal use onl - Home ... Communication Group Limited Annual Report 2009...

Mitchell Communication Group Limited
Annual Report 2009
ABN 59 088 110 141
…nothing is beyond our reach.
For
per
sona
l use
onl
y

…nothing is beyond our reach.
For
per
sona
l use
onl
y

3
ContentsChairman’s report 5
CEO’s report 7
Board of directors 8
Review of operations 12
Media division
Digital division
Diversifi ed division
Technology division
Research division
Human Resources
Corporate social responsibility 35
Directors’ report 36
Auditor’s independence declaration 53
Corporate governance statement 54
Financial report – 30 June 2009 59
Directors’ declaration 114
Independent audit report to members 115
Shareholder information 117
Company particulars 119
For
per
sona
l use
onl
y

Our fi ve divisions –
Media, Digital,
Diversifi ed, Technology
and Research
– have celebrated some great achievements over the past year
4
…nothing is beyond our reach.
For
per
sona
l use
onl
y

5
Chairman’s
Report
Harold Mitchell AO
During the past 12 months there was enough talk and
economic data regarding the global economic downturn for
companies to become selfi sh, concede an honourable loss
and start over again next year. Particularly those companies
in the communications industry.
During this period, the Mitchell Communication Group has
leveraged from its years of strategic planning, supplier and
client relationships and conservative fi nancial management.
Our business model and people were tested but I’m pleased
to report that not only did we succeed, I believe we have
become a stronger company as a result.
We had to work exceptionally hard, nothing unfamiliar to
our people, and as a result our shareholders have been
rewarded.
With such a wide representation of clients and companies,
our Group was able to read the signs of change early on and
prepare. As a result, we were well-positioned when times
became tough.
This year has been a signifi cant challenge to industry and to
the Australian people, but we know that Australia has been
well-prepared with minimum debt and a resilient economy.
Our company is similar.
In establishing the overall Group several years ago, we were
always well prepared for a changing world.
Our fi ve divisions – Media, Digital, Diversifi ed, Technology
and Research – have celebrated some great achievements
over the past year.
We’ve concentrated as always on three important elements
– our staff, our clients and our long-standing supplier
relationships – and they’ve held us in good stead.
Our strategy of diversifi cation has enabled us to
maintain growth. Our offer of integrated marketing and
communication services positions us to create new
opportunities and extend existing relationships with
our clients.
Our local focus has been another major strength as
geography has become more important for both our industry
and industry generally.
Our position as the industry leader in full service Digital
communication solutions positions us exceptionally well for
what we see will be a 50% growth in this industry over the
next four to fi ve years.
Our team has never been stronger, with our staff combining
maturity and experience with fresh and innovative thinking
to consistently deliver outstanding results.
We continue to be a company that serves the interest of
shareholders. I thank our Board for the strength that they’ve
shown during a challenging year, and our Board joins me
in thanking an executive team who, whilst they have youth
on their side, have shown wisdom to so successfully come
through this diffi cult time.
Harold Mitchell AO, ChairmanFor
per
sona
l use
onl
y

6
Billings and cash fl ow
in excess of $1.15 billion
10% earnings growth
year-on-year
…nothing is beyond our reach.
For
per
sona
l use
onl
y

Stuart Mitchell
7
CEO’s Report
Following a successful fi rst year, our second full year of
operation as the Mitchell Communication Group cemented
our position as a leading integrated and diversifi ed media
services and communications group.
We have continued to outperform the market operationally
and fi nancially, and fi nished the year in the number one
position in many of our business pursuits, including digital,
media, search and public relations.
Our unwavering focus on achieving our business objectives
enabled us to deliver a strong result despite challenging
economic and market conditions. The targets set before the
market downturn remained our priority and this ensured we
continued to grow.
Our operating revenue increased by 20% and profi t was up
10% — a notable result driven by organic growth across
all divisions and contributions associated with recent
acquisitions.
Our Media, Digital and Diversifi ed divisions remain strong.
Where the traditional media market contracted 7%, our
Media division reported revenue growth of 3.7%. Our Digital
offering is extremely strong and we are well positioned to
maintain the number one position in the years ahead.
The public relations and brand activation businesses in our
Diversifi ed division performed strongly, underpinning the
market appetite for social media and experiential marketing
services.
Our company has further diversifi ed with a focus on two key
areas – Technology and Research.
The acquisition of Vivid has extended our strategic footprint
in application development with many opportunities ahead
for us in this area.
In August 2008 we commenced operations of Symphony
Analytics & Research, specialising in quantitative research,
marketing analytics, communication planning tools and
processes.
The strength of this diversifi cation is reinforced by
innovation. New systems and processes now enable
our companies to better work together and to develop
opportunities for cross-divisional growth. The introduction
of company-wide accounting and payroll systems has
allowed us to control and monitor all growth from one
central point.
We continue to work across diverse sectors through our
large pool of clients, allowing us to withstand the ebbs
and fl ows of various industries. I would like to take this
opportunity to thank our clients, many of whom we have
long-standing relationships with, for having faith in us to
represent them.
Throughout our history, we have cultivated good
relationships with our suppliers. This continued in FY09,
enabling us to be fi rst-to-market with innovative and
unprecedented solutions for our clients.
Our results refl ect the high calibre of people within our
business and the quality of the services we offer, which has
not faltered under market pressures. Thank you to our staff
who worked with energy, passion and enthusiasm to make
our company the success it is today.
Experience builds capability, and it is through the knowledge
and stamina of our Board that we have achieved such
success. I would like to thank the Directors for their
invaluable input and ongoing dedication to our company.
With another strong year behind us, it is clear that when
times are tough, we need to be resilient and show strength
and leadership. This year has shown us that if we have
determination, confi dence in our ability and stick with our
plan, we will achieve our goals. We look forward to the
opportunities ahead as we continue to lead our industry.
Stuart Mitchell, CEOFor
per
sona
l use
onl
y

8
…nothing is beyond our reach.
Board of Directors
Harold Mitchell is the founder
of Mitchell & Partners and
Executive Chairman of the
Mitchell Communication
Group. Since he started
Mitchell & Partners in 1976,
the company has evolved to
become the largest media
and communications group in
Australia today, with a growing
presence in New Zealand and
across the Asia-Pacifi c region.
In December 2000, he
launched the Harold Mitchell
Foundation which distributes
funds between health and the
arts. He has been Chairman of
the National Gallery Australia,
President of the Melbourne
International Festival of Arts,
President of the Museums
Board of Victoria and a Board
Member of the Opera
Australia Council.
Mr Mitchell holds a large
number of community roles
including Vice-Chairman
CARE Australia; Chairman
of the Melbourne Symphony
Orchestra; Chairman of
ThoroughVision; Director of
Tennis Australia; Director
of Art Exhibitions Australia;
Director of Television Sydney;
and Director of Deakin
Foundation.
Stuart Mitchell is the Chief
Executive Offi cer of Mitchell
Communication Group. Under
his leadership, Mitchells
has grown to incorporate
more than 20 separate but
integrated businesses across
a broad range of media and
communication services.
Stuart has more than 17 years
experience with the company
across all aspects of media,
from planning to negotiating
annual buying deals with
major media organisations.
Stuart has led the
diversifi cation of the Mitchell
Communication Group from
a traditional and digital focus
to cover all communication
channels. Under Stuart’s
leadership, the Group has
expanded geographically into
Western Australia and secured
a market-leading position for
a number of businesses within
the group.
Mr Hounsell is a former
Senior Partner of Ernst &
Young and Chief Executive
Offi cer and Country Managing
Partner of Arthur Andersen.
He is also a Fellow of The
Institute of Chartered
Accountants in Australia, and
a Fellow of the Australian
Institute of Company
Directors. He holds a Bachelor
of Business (Accounting)
degree from Swinburne
Institute of Technology and
is a Certifi ed Practicing
Accountant.
Mr Hounsell is currently
Chairman of PanAust Limited,
and a director of Qantas
Airways Limited, Orica Limited
and Nufarm Limited. He is
also Chairman of Investec
Global Aircraft Fund and a
director of Ingeus Limited
and Freehills.
Mr Stewart is a company
director and management
consultant with broad
general management
experience and a legal
background. He has been
a director of a number
of public and private
companies in a diverse
range of industries
covering information
technology, biotechnology,
high technology fi ltration,
manufacturing, packaging,
telecommunications and
forestry. For 11 years, he
was National Managing
Partner of Minter Ellison,
one of Australia’s leading
law fi rms, before retiring in
June 1999. Mr Stewart spent
fi ve years with Pacifi c Dunlop
from 1976 to 1981 in a variety
of general management
positions. He has also served
on the boards of a number of
not for profi t organisations.
Mr Stewart is Chairman of
Melbourne IT Limited and
Chairman of the Baker
IDI Heart & Diabetes
Institute Ltd.
Harold Mitchell AOEXECUTIVE CHAIRMAN
Garry HounsellDEPUTY CHAIRMAN
Stuart MitchellCHIEF EXECUTIVE OFFICER
Rob Stewart
For
per
sona
l use
onl
y

9
Mr Cameron has over 35
years of experience in the
advertising and marketing
industry. Since 1970, he
has worked primarily in the
advertising industry with a
variety of global marketers
in Australia and Asia, and on
world-leading brands such as
Coca-Cola, McDonalds, Mars,
Nestlé, Levi’s and Goodyear.
Mr Cameron has held
a number of senior
management positions in
advertising agencies and was
a partner with advertising
agency George Patterson
Bates for eight years.
For seven years to December
2005, Mr Cameron was
Director of Corporate
Marketing for Optus. Mr
Cameron presently owns and
runs eight Yes Optus retail
stores in metropolitan Sydney.
Ms Sparks has a background
in pharmaceutical marketing,
strategic consulting and
over 20 years experience in
the advertising industry. She
has held senior positions in
leading agencies in Australia
and UK, her most recent being
Managing Director of M&C
Saatchi. She is currently a
professional non-executive
director and brand/corporate
reputation consultant.
Ms Sparks is currently
director of Blackmores Ltd,
Vice Chairman of Osteoporosis
Australia, Director of Sydney
Dance Company and National
President of Chief Executive
Women.
Mr Nankervis has spent
more than 30 years in various
accounting, fi nancial and
commercial roles with BHP
and Cadbury Schweppes. He
has been Finance Director
of Cadbury Schweppes
Australia Limited and Chief
Financial Offi cer for Cadbury
Schweppes Asia Pacifi c. He
has also been a member
of the Cadbury Schweppes
Global Senior Finance
Committee and a member
of the Asia Pacifi c Audit
Committee. Mr Nankervis
also served as a Trustee,
Director and Chairman of the
Superannuation Fund.
Mr Nankervis is currently a
director of Onesteel Limited
and Dairy Australia Limited.
Mr Lamplugh has over
20 years experience as
a commercial lawyer
assisting with the
acquisition of businesses
and major business
transactions in the media
sector.
Mr Lamplugh has been
a director of Mitchell
Communication Group
since its inception. Mr
Lamplugh is also a director
of all the Group’s subsidiary
companies.
Stephen Cameron Peter NankervisNaseema Sparks Rod Lamplugh
For
per
sona
l use
onl
y

10
Mediamedia communications strategy
media planning and buying
consumer insights research
specialist strategic advice
branded content solutions
Mitchell & Partners Offline planning & buying
MPG Offline planning & buying
Digital digital communications strategy
digital media planning and buying
ROI planning and tracking
search engine marketing
search strategy
e-marketing
digital creative services
emitch Online planning & buying
NeoDigital Online planning & buying
Media Contacts Online planning & buying
The Internet Bureau Online planning &
buying (NZ)
Columbus Search engine marketing
Brand Tube Digital video distribution platform
Visual Jazz Digital creative agency
Catch! Digital direct response media agency
…nothing is beyond our reach.
For
per
sona
l use
onl
y

11
Diversifiedpublic relations
corporate social responsibility
brand experience
sponsorships
mobile marketing
printing and signage
sports ground marketing
video and event production services
Stadia Media Sports ground signage
Haystac Public relations
Spark Public relations
Impact Brand activation
Coleman Group Signage & production
Picture This! Video and event production
services
Mocom Mobile loyalty programs
Positive Outcomes Corporate social
responsibility
Rodeo Creative design services
Technology branding, digital media
and application development
automated ad agency templating
Vivid Group Branding, digital media
& application development
Agile Automated ad template system
Researchqualitative and quantitative research
marketing analytics
communication planning tools and process
Symphony Analytics & research
Mitchell Communication Group Business Divisions
For
per
sona
l use
onl
y

FY’09 Financial Results…
Key Financial Highlights:
Operating Revenues
20% to $225.2 million
Operating EBITDA
11% to $34.2 million
Gross Billings
Steady at $1,158.5 million
12
…nothing is beyond our reach.
For
per
sona
l use
onl
y

13
Introduction
The principal activities of the economic entity constituted
by Mitchell Communication Group Limited and the entities
it controls (the Group) are the provision of communication
services, including:
traditional and online media strategy, planning and buying
interactive marketing, digital creative and technology
services
search engine marketing
public relations, experiential marketing and brand
experience
direct marketing
sponsorship, rights management and outdoor advertising
corporate social responsibility consulting services
video and event production services
quantitative and qualitative research, market analytics,
communication planning tools and processes.
Year in Review
The fi nancial year ended 30 June 2009 was an outstanding
year for the Group, with double digit growth in revenue, profi ts
and cash fl ow. The excellent result was driven by strong
organic revenue growth by existing Group entities and the
acquisition of exciting new companies in the past year.
We maintain our leadership position in the market and are
number 1 in many of our business pursuits. Our long held
client and supplier relationships have held us in good stead
to deliver despite challenging conditions.
We are driven by client service and continue to focus on
delivering outstanding results for clients – consistently
exceeding expectations. The strength of our relationships
and our focus on innovation puts us in an enviable position to
perform well again in FY10.
Gross billings topped the billion dollar mark at $1,158.5
million, in line with the previous corresponding period (pcp).
Total revenues were $225.2 million, an increase of 20% on pcp.
”Cash earnings” or EBITDA grew 11% to $34.2 million.
Similarly net profi t after tax also grew 10% over the pcp
to $19.3 million.
As a Group, we continued to outperform the market. Our
Australian based Digital division experienced exceptional
growth, with gross billings up by 26% compared with the
market rate of 19%. We have the number one full service
digital agency and search marketing company in the country,
and maintained consistent operating margins year on year
despite more challenging conditions in New Zealand.
Our Media division recorded revenue growth of 3.7%,
despite the overall market ad spend contracting by 7%
(source: Nielsen Adex excluding online and pay TV), We were
Australia’s largest Media Agency for the fi fth consecutive year
(source: Nielsen Media Research 2009).
It was also a strong year for our Diversifi ed division,
encompassing the Technology and Research business
segments, with revenue up by 35.8% whilst investing in the
future.
A fi nal dividend of 2.1 cents per share, fully franked, has been
declared, resulting in a full year dividend of 4.0 cents per
share. Earning per share also increased from 6.3 cents per
share to 6.6 cents per share, an increase of 5%.
Operating cash fl ow was $29.4 million, up $3.5 million or 13%,
demonstrating the strong cash fl ow nature of the business.
Market conditions
FY09 presented challenging conditions, which our diversifi ed
model, market leadership position and strong client and
supplier relationships placed us in a position to withstand.
With the strong performance of our Digital division and
emerging new areas of our Diversifi ed division, the Group
is ideally positioned to capitalise on emerging media
opportunities.
Outlook
We are conscious that the current challenging market
conditions are likely to be with us for another 12 months
however we are confi dent that the company and our business
model positions us well.
We will continue to leverage from our long standing
reputation, strong customer and client relationships and
number 1 position in many of our fi elds of pursuit.
We are driven by innovation and an ethic of hard work, which
we believe will result in us increasing our market share.
We believe that we’ll see a further convergence of traditional
to digital media. With a number one position in the Digital
communications industry and as an integrated business we
are well placed to capitalise on this structural change.
Review of OperationsF
or p
erso
nal u
se o
nly

AUSTRALIA’S
LARGEST media agency for 5th consecutive year
14
…nothing is beyond our reach.
For
per
sona
l use
onl
y

15
Media Division
The principal activities of the Media division are the provision
of media communications strategy, media planning and
buying, consumer insights research, specialist strategic
advice and branded content solutions.
Year in Review
The fi nancial year to 30 June 2009 ended very strongly.
The performance of this division underscored its reputation,
strength of supplier and client relationships and business
model.
Although the established traditional media market in
Australia declined by 7% during the fi nancial year (source:
Nielsen Adex excluding online and pay TV), the Media
Division’s revenues grew to $39.7 million and EBITDA
increased to $9.3 million. Both these results were well
ahead of industry competitors. Billings exceeded $970
million.
Mitchell & Partners was ranked number one as the largest
media buyer in the country for the fi fth consecutive year.
Both MPG and Mitchell & Partners achieved for the fi rst
time an A+ rating by the international media agencies
benchmark organisation RECMA, two of only four A+ results
awarded in Australia.
Our Sydney operation ended the year with a very pleasing
result adding to previous year’s growth. Billings increased to
$350 million with a total of 12 new client wins. Our Sydney
media operation continues to deliver impressive results in a
very competitive market.
Our foundation offi ce in Melbourne also had a very strong
year with billings of $400 million and more than 60 new
clients won. It is extremely pleasing to report contract
extensions for several major clients including the Victorian
State Government Master Media, ANZ Bank and The Good
Guys.
Our Brisbane offi ce celebrated its ninth birthday by
continuing to dominate the Queensland market. A string of
new business wins has pushed billings to $170 million.
Our successful purchase of the remaining 49% of Mitchell &
Partners WA not previously owned allowed us to bring on line
a full service Mitchell & Partners offering. Subsequent to
year end we also announced the acquisition of the business
of a Western Australian media buying agency, headed by Mr
Alan Matthews. The acquisition instantly elevated the Group
to the position of Western Australia’s largest media buyer.
The acquisition, strong management and new business wins
have positioned us for continued growth and success in
Perth.
A restructure of the New Zealand Media operation
comprising full service offerings from Mitchell & Partners
and MPG and the appointment of a new Managing Director
has been completed. We believe that this new structure will
position us well for growth and positive results in the new
fi nancial year.
Billings for the Media division were driven by a mixture of
organic growth and new business wins. Notable successes
were: Fairfax Media; WA Government - Department of
Education and Training and Edith Cowen University; Super
Amart; Betta Electrical; RMIT; Nylex; Mt Buller; and
Melbourne Aquarium.
We were also successful in defending competitive pitches
for incumbent clients including Hoyts; Tourism Queensland;
Flight Centre; Terry White Chemists and Members Equity.
Companies within Media Division
Mitchell & Partners
Mitchell & Partners is Australia’s leading media agency with
offi ces in Melbourne, Sydney, Brisbane, Perth and Auckland.
Mitchell & Partners represents over 2000 clients across
many different categories, aiming to deliver communications
to the right people – at the right time, in the right place
with the right message at the best possible price. Services
include media strategy, media planning, media buying,
competitive analysis, research and post campaign reporting.
MPG
MPG is an international media service group with more
than three decades of experience, dedicated to establishing
relevant points of contact between brands and consumers
in order to obtain optimal business results. In Australia and
New Zealand, MPG is a joint venture between the Mitchell
Communication Group and Havas, one of the world’s
leading groups in communications consulting. As media
specialists, MPG offer a full range of services including
strategic communications development, media planning and
buying, market research and effi ciency measurement, and
interactive and online advertising for a range of clients.
Review of OperationsMedia Division
For
per
sona
l use
onl
y

16
…nothing is beyond our reach.
A+ RECMA rating for pitch competitiveness & buying
For
per
sona
l use
onl
y

17
Market Conditions
FY09 has been a challenging year for the industry where
total ad-spend declined for the fi rst time since the post-
Olympics advertising recession in 2001.
Established traditional media were the most affected; with
spend levels declining 7% (source: Nielsen Adex). Digital
media continued to grow with Online up by 19% (source:
IAB June 2008) and Subscription TV achieving uplift of 6%
(source: CEASA).
Ad-spending began slowing in the last quarter of 2008 and
accelerated its decline in the New Year. January to June
2009 saw traditional media spend decline by 12% year-on-
year. During this period the major losers were Newspapers,
down 15% and Metropolitan TV down 12%.
On the brighter side the market appeared to bottom out
during this period and the economic indicators now point
to improvement and growth for the coming fi nancial year.
The worst is over for Australia at least. This division has
minimal exposure to foreign domiciled clients.
On the media consumption front we have a much more
positive story, with time spent by consumers with media
continuing to grow. Predictably this growth is being led
by digital media, particularly internet which is benefi ting
from growth in the uptake of broadband and mobile
communications technologies. These technologies are
enabling consumers to access more media, more of the
time, from more places. Consumers are also experimenting
with new media consumption behaviours such as
multitasking, where more than one medium is consumed
at any one time. Free TV has also benefi tted from a more
frugal outlook by consumers who have been spending more
time entertaining themselves at home.
These changes in media consumption are making the
task of planning and buying media for communications
increasingly complex. There is a growing need to
measure and understand these new behaviours more
thoroughly and completely. This is a high priority for our
business. Knowledge is power, and to this end, Mitchell
Communication Group is increasing our investment in
research and analytics.
The digital revolution is opening new frontiers of access to
consumers where we can interact with them and understand
them much better than ever before. The metrics we are
able to assemble from this interaction signifi cantly improve
our capability to measure return on advertising investment.
At Mitchell’s, we are committed to pushing the boundaries
of understanding and exploring these new frontiers so that
we can continue to provide our clients with market leading
solutions to their communications challenges.
Outlook
We believe that the Australia market is now past the bottom
of a two year down swing, with growth expected from the
mid point of CY10.
Review of OperationsMedia Division (continued)
For
per
sona
l use
onl
y

Out performed
market growth by 37%
18
…nothing is beyond our reach.
For
per
sona
l use
onl
y

19
Review of OperationsDigital Division
Digital Division
The principal activities of the Digital division are the
provision of digital media strategy, planning and buying,
search engine marketing and creative services.
Year in review
This has been a very strong year for the Digital division.
Successive years of investment in our people and in the
development of technologies and processes have enabled
us to deliver a market leading performance. In a year that
has seen the Australian digital media market grow by 19%
(source: IAB June 2008), our turnover from Australian digital
media operations (excluding Visual Jazz) has grown by 26%,
out performing the market by 37%.
Our singular belief in innovation as a critical factor
in delivering fi rst class solutions and as a driver in
protecting and enhancing our margins has seen Mitchell
Communication Group Digital in the fi nancial year 2009:
Become the number one search business in Australia;
Invest in best of breed technology;
Launch a Social Media Unit in Melbourne and Sydney;
Develop our fi rst iPhone games;
Launch Catch! In New Zealand;
Secure a new business win every week; and
Out perform the Australian digital media market by 37%
Companies within Digital Division
emitch
Australia’s longest established and only truly national digital
offering with offi ces in Sydney, Melbourne, Brisbane and
Perth, emitch had a strong year in 2009.
Our most established offi ces, Sydney and Melbourne,
generated over 25 new business wins over the course of
the year. Our newest offi ces in Brisbane and Perth enjoyed
stellar growth which saw their gross billings grow by over
50% in each territory.
The year has seen emitch compete for and win full service
digital pitches by utilising the assets and intellectual
property that exist within the Digital division.
We fi nished the year launching e-channel, our own video
player and analysis tool that enables clients to take
advantage of the explosion of video content online.
Media Contacts
This was a great year for Media Contacts. The team grew
from ten people to 21, we launched the Social Media Unit
in Sydney and became the fi rst country in APAC to
implement Artemis (Havas’ proprietary data analytics
platform). We won new business from Ssangyong, AHM,
Hamilton Island, Suntory, 1300 Flowers and Voyages. Media
Contacts ended the year by winning an ICON award and
were shortlisted in the Cannes, IAB Australia and Valencia
advertising awards.
Columbus
Columbus has gone from strength to strength in FY09
becoming Google’s number one search agency in Australia,
and achieving 40% growth year on year. Our new business
efforts have been particularly successful with direct clients
growing by 60% on the previous year.
With a key focus on staff and our rigorous process to recruit
‘best in market’, the team now comprises 25 specialists in
Sydney and Melbourne.
Columbus continues to develop and acquire best of breed
solutions witnessed by our investment in bid management
technology with Omniture.
Visual Jazz
Visual Jazz enjoyed a successful and profi table year
retaining all key clients and staff, backed up by an
impressive list of new business wins including Icon
Films, Prime Life, RAC, Refl ex paper, Medibank and Visy
Industries.
We continued to reinforce our position as one of Australia’s
leading Digital Creative Agencies with a highlight being a
fi nalist at the prestigious 2008 MIXX awards in New York.
We embraced the opportunities offered by social media and
developed a range of entertainment applications, including
our fi rst iPhone games.
For
per
sona
l use
onl
y

integrated, full service digital
and search company in Australia#1
20
…nothing is beyond our reach.
For
per
sona
l use
onl
y

21
New Zealand operations
The Internet Bureau
Despite experiencing the diffi cult trading conditions that
the New Zealand media industry faced in the last fi nancial
year, a clear strategy enabled us to meet our target. We took
the next step in the evolution of the Bureau’s business by
reaching an exclusive sales representation agreement with
global media network Adconion.
CATCH!
CATCH! launched in September 2008 and has enjoyed a
successful fi rst nine months of operations, reaching all
targets and growing our capabilities to operate as a full
service digital direct response agency.
Client wins include Universal Music, Total Interactive and
New Zealand Tourism’s i-Site Network, as well as search
advertising for the Accor Hotel Group and Go Rentals.
Market Conditions
Online advertising expenditure in Australia for the 12
months ended 30 June 2009 totaled $1.806 billion, an
increase of $282 million or 19% year on year
(source: IAB June 2009).
Growth was led by search and directories and general
display at 20% (source: IAB).
The highest spending Advertiser Industry category in
general advertising and search was fi nance with recruitment
leading the way within classifi eds (source: IAB).
Outlook
The general advertising internet market has not been able
to avoid the downturn in economic conditions but has fared
signifi cantly better than its traditional media cousins.
We expect to see double digit growth in the coming fi nancial
year.
This growth will be driven in the fi rst part by increased
spend from the fi nance, automotive, telecommunications
and travel sectors as the communications industry becomes
better at understanding how integrated media can drive
success for our clients, and the role digital plays in those
combinations.
We also anticipate signifi cant growth from the retail sector
as it becomes ever more obvious that digital has changed
the consumer purchasing process, creating new and
signifi cant opportunities for clients.
As a Group we will be at the forefront of these changes
whilst continuing to invest in new technologies and
processes that give all of our businesses a distinct
competitive advantage.
We confi dently expect to continue to out-perform
the market.
Review of OperationsDigital Division (continued)
For
per
sona
l use
onl
y

Premium assets & properties
22
…nothing is beyond our reach.
For
per
sona
l use
onl
y

23
Diversifi ed Division
The principal activities of the Diversifi ed division are the
provision of marketing services and brand communication.
Year in Review
Divisional performance over FY09 has been positive within a
year that presented a series of economic challenges.
Underlying our positive results was very strong performance
within the division’s PR and Marketing Services businesses;
all of which delivered results in excess of expectation.
Digital creative has developed as a core element of our PR
offer with the ongoing and rapid growth of Rodeo within
Haystac.
Haystac successfully established a Social Media practice
within the Melbourne offi ce to meet client demands to
monitor and credibly respond to online consumer discussion
relative to their businesses and brands. The demand for
and success of this practice area further reinforces the
need to deliver creative and strong on-line capability within
our PR offer. To this extent the business is well positioned
for FY10.
The establishment of Haystac in Auckland presents this
company as a true regional player.
Within the year we launched Haystac Positive Outcomes
(HPO) which represents the integration of Haystac’s social
marketing with the division’s corporate social responsibility
practice.
The PR and marketing services businesses ability to
coordinate and integrate their offer both within the division
and across the Group has continued to develop strongly. The
experience for Mitchell Communication Group clients has
been positive as they are delivered both effi cient and truly
integrated campaigns. FY10 will see a continued focus on
multi-company and multi-divisional presentation and sales.
Our Rights Management business achieved a solid
performance notwithstanding a very diffi cult advertising
market across the second half of FY09.
The division’s production services capability was enhanced
early in the year with the acquisition of video and event
production services business Picture This! Productions
Pty Ltd.
This acquisition paid immediate dividends with Picture This!
and Stadia Media being jointly appointed to manage all
Cricket Australia’s at-venue event presentations.
Consolidating the Group’s video and event production
capability to the Picture This! entity is an ongoing process
that will allow the Group to benefi t from economies of scale
and continue to invest in and develop strong content creation
capabilities.
The division’s digital printing company Coleman Group has
had a diffi cult year due to economic conditions signifi cantly
affecting the exhibition industry, a key sector for this
business.
Companies within Diversifi ed Division
Rights Management – Stadia Media and Mocom
Stadia Media offers a comprehensive range of stadium
advertising and signage solutions at some of the most
prestigious sports environments in Australia.
Stadia delivered a strong start to FY09 posting another
record AFL revenue result for the 2008 AFL Season, up 10%
against the 2007 AFL Season.
2008/09 Cricket revenues were similarly strong, growing 7%
season on season.
In conjunction with Picture This! Productions, Stadia Media
further consolidated its relationship with Cricket Australia
with the award of a multi-year event presentation contract.
A retainer based relationship for this agreement appoints
the company to deliver event presentation activity across all
International Cricket matches played in Australia; building
our Group’s content creation reputation and providing the
basis to build new advertising and sponsorship opportunities
under the Cricket rights agreement.
The strong performance of Stadia Media’s rights
demonstrates that sport continues to provide a resilient
media offering.
Stadia Media successfully completed the upgrade of its
signage infrastructure at the MCG, sold its proprietary
scoring application to ANZ Stadium in Homebush and
continues to be successful in building consulting revenues
to media rights owners.
Review of OperationsDiversifi ed Division
For
per
sona
l use
onl
y

24
Specialist mobile marketing agency Mocom established a
strategic relationship with ACP Magazines which will see the
Mocom image recognition technology become a key feature
of major advertising campaigns across all ACP magazines
across FY10.
PR and Marketing Services - Haystac, Haystac Positive
Outcomes, Rodeo, Spark and Impact
Haystac / Haystac Positive Outcomes / Rodeo Agency
Haystac is the premier marketing and communications
agency in Australia and New Zealand. It is a strategy
driven agency delivering a diverse range of marketing
communications services to a strong portfolio of leading-
brand clients.
The Haystac business comprises three key operating
entities:
Haystac PR
Haystac Positive Outcomes (CSR / Social marketing)
Rodeo (Studio and Digital Creative)
FY09 turnover was up 18% as compared to FY08.
Highlights over the year were:
Signifi cant growth in size of Haystac, Rodeo and
Haystac Positive Outcomes (HPO);
Expansion of offi ce network to include international
presence in Auckland and Singapore, adding to
Melbourne and Sydney;
Increased profi tability of business in a diffi cult economic
environment;
Signifi cant growth in digital creative business ;
Established HPO, a business dedicated to providing
positive social change through communications and
CSR consulting services;
HPO’s CSR benchmarking tool, LBG, reached 44
memberships, including the addition of Australia Post,
Village, Wesfarmers and Woodside Energy;
Haystac client wins including: eBay, 7-Eleven, Tourism
Australia, Quest, Australia Post and SEEK;
Signifi cant growth in major long term clients including:
Jetstar, Toyota Australia, ANZ, Walt Disney Studio Home
Entertainment and GlaxoSmithKline
Spark and Impact
Spark and Impact are professional public relations and
marketing communications consultancies with an enviable
track record in delivering results for clients. The agencies
provide public relations, experiential and brand activation
services.
FY09 was a strong year for Spark and Impact with turnover
up 15%. The agencies have continued to build on their
unique integrated public relations and experiential
marketing offer.
Key account wins over the year were: John West;
Kraft - Captain’s Table; Department of Sustainability &
Environment; Ansell; Federation Square; and Pretty Girl
Fashion Group.
In addition the company strengthened and grew its
relationship with Nintendo, Boost and 3Mobile and in FY09
developed campaigns for clients such as the Australian
Grand Prix Corporation, Boost Juice Bars and John West
that generated results beyond expectation.
Impact continues to cement itself as one of the pre-eminent
experiential marketing agencies in Australia delivering
highly engaging and memorable consumer experiences for
clients.
Production Services - Coleman and Picture This!
Coleman Group
Coleman Group specialises in the design, manufacture
and installation of signage to large corporate clients in the
sporting and exhibition industries.
Reductions in demand have created some surplus capacity
within the short run large format print sector, which has had
a fl ow on effect to price and margin.
Business effi ciency and production capacity has been
improved with the commissioning of a new printing plant
which positions this company well to take advantage of
renewed opportunity as economic conditions improve and
demand grows.
Picture this! Productions
Picture this! Productions is a leading media, event and
broadcast solutions company. The business was acquired in
November 2008.
The Group’s video and event production capability is to be
consolidated within this operating entity. From a strategic
…nothing is beyond our reach.
For
per
sona
l use
onl
y
25
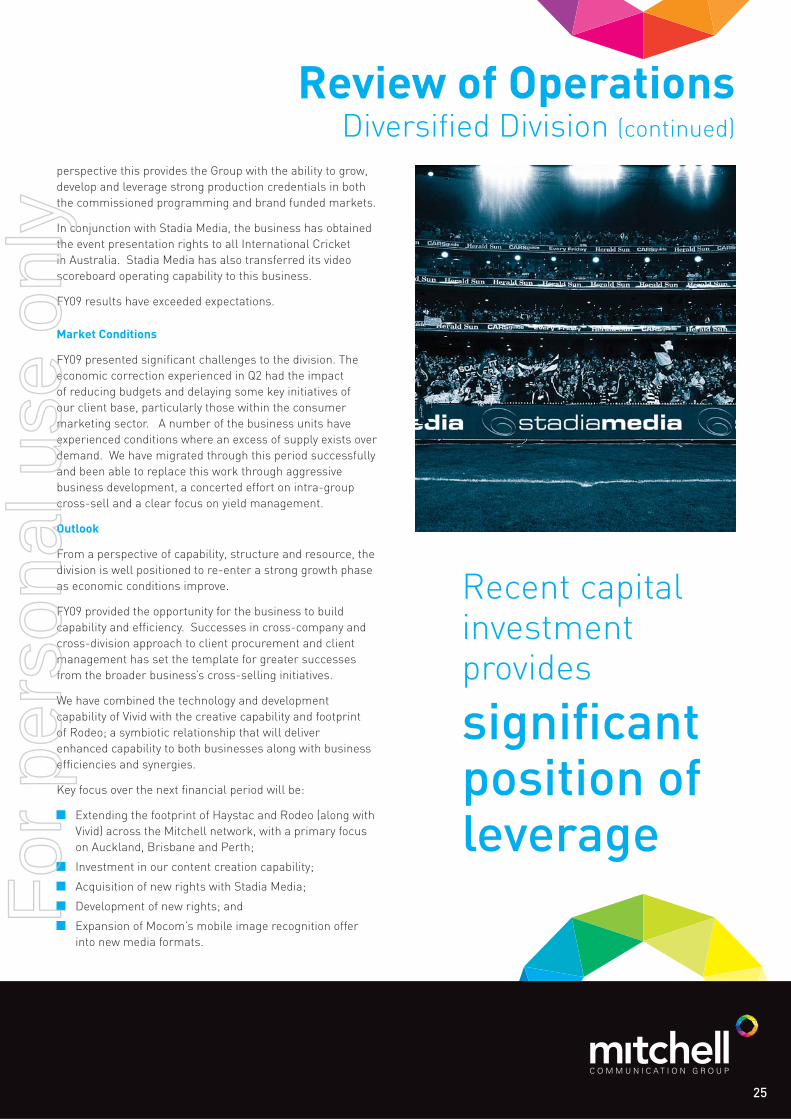
perspective this provides the Group with the ability to grow,
develop and leverage strong production credentials in both
the commissioned programming and brand funded markets.
In conjunction with Stadia Media, the business has obtained
the event presentation rights to all International Cricket
in Australia. Stadia Media has also transferred its video
scoreboard operating capability to this business.
FY09 results have exceeded expectations.
Market Conditions
FY09 presented signifi cant challenges to the division. The
economic correction experienced in Q2 had the impact
of reducing budgets and delaying some key initiatives of
our client base, particularly those within the consumer
marketing sector. A number of the business units have
experienced conditions where an excess of supply exists over
demand. We have migrated through this period successfully
and been able to replace this work through aggressive
business development, a concerted effort on intra-group
cross-sell and a clear focus on yield management.
Outlook
From a perspective of capability, structure and resource, the
division is well positioned to re-enter a strong growth phase
as economic conditions improve.
FY09 provided the opportunity for the business to build
capability and effi ciency. Successes in cross-company and
cross-division approach to client procurement and client
management has set the template for greater successes
from the broader business’s cross-selling initiatives.
We have combined the technology and development
capability of Vivid with the creative capability and footprint
of Rodeo; a symbiotic relationship that will deliver
enhanced capability to both businesses along with business
effi ciencies and synergies.
Key focus over the next fi nancial period will be:
Extending the footprint of Haystac and Rodeo (along with
Vivid) across the Mitchell network, with a primary focus
on Auckland, Brisbane and Perth;
Investment in our content creation capability;
Acquisition of new rights with Stadia Media;
Development of new rights; and
Expansion of Mocom’s mobile image recognition offer
into new media formats.
Review of OperationsDiversifi ed Division (continued)
Recent capital investment provides signifi cant position of leverage
For
per
sona
l use
onl
y

Over 300 active clients, providing strong annuity revenue streams
26
…nothing is beyond our reach.
For
per
sona
l use
onl
y

27
Review of OperationsTechnology Division
Technology Division
The principle activities of the Technology division are the
provision of Web development, Microsoft Business software
and Web hosting solutions for advertisers and other
commercial purposes.
Year in Review
The fi nancial year ended 30 June 2009 produced a strong
result for the Technology division, delivering a positive
contribution in its fi rst year within the Group.
The Technology division brings a new and complimentary
range of products and services to the Group that assist
clients of the Group to take advantage of Technology
solutions that deliver competitive advantage in the areas of:
1. New revenue generation opportunities taking advantage
of eCommerce for “bricks and mortar” advertisers;
2. Cost management through operational effi ciencies in the
areas of collaboration and workfl ow; and
3. Improved customer engagement utilising Customer
Relationship Management tools.
The Web development and hosting arm of the company
continues to perform strongly, leveraging the growth in the
trend to digital advertising media investment. The business
unit services over 300 active clients, providing strong annuity
revenue streams.
In 2009 the Technology division successfully completed a
three year, $2 million Research and Development program,
supported by the Federal Government, which resulted in
the development of a range of Microsoft based Enterprise
Content Management Technology products. The R&D
program resulted in immediate Microsoft Business Solution
account wins including Coote Industrial, Chevron, CSR, QR
group of companies, Newmont Mining, Rio Tinto, WA State
Government and WesTrac Caterpillar.
Company within Technology Division
Vivid Group
Vivid Group is a Microsoft Gold partner, specialising in
Portals and Collaboration, Custom Application Development
and Web Hosting Solutions. Vivid has offi ces in Perth and
Melbourne.
Vivid Group delivered a strong fi nancial outcome in a
competitive market place that saw many competitors post
signifi cant declines.
Market Conditions
Technology investment in Australia is being impacted by the
current economic conditions, with organisations pursuing
Web based Technology solutions that will enable them
to provide better service to customers whilst reducing
operating costs.
Key strategic imperatives for the Technology division can be
segmented into three core growth opportunities;
1. New revenue generation opportunities for advertisers
through eCommerce
With Mitchell Communication Group’s strong portfolio
of retail brands, the Group is well positioned to deliver
eCommerce Technology solutions that will open new
online trading markets to advertisers.
A recent report by Hitwise demonstrates that visits to
Bricks and Mortar Retailers by Australian internet users
attracted year-on-year growth of 19.2% in December
2008. There are several reasons for this movement:
the ‘fl ight to quality’ or attractiveness of brands
that consumers know and trust during an economic
downturn; the drop in the Australian dollar; and the
improved online marketing performance by some
traditional brands.
Market research fi rm IBISWorld writes that in Australia,
‘‘The entire retail sector is highly mature and saturated,
with every business trying to fi nd a competitive edge.’’
Online is being revisited as a key channel for brands to
differentiate themselves against competitors (source:
Hitwise February 2009).
For
per
sona
l use
onl
y

Well positioned to capitalise on this
INDUSTRYGROWTH
28
…nothing is beyond our reach.
For
per
sona
l use
onl
y

29
Review of OperationsTechnology Division (continued)
2. Cost management through operational effi ciencies
IDC predicts the Enterprise Content Management
software licensing market will total $3.7 billion in 2010.
Microsoft reports that for every $1 in licensing revenue,
Microsoft partner’s such as Vivid Group generate $3 in
services revenue, providing a conservative market size of
$11 billion globally.
The exponential growth in the amount of data
organisations are producing, which is growing at 36%
per annum (source: Doculabs, Inc.) is fuelling demand
for Technology solutions in content management,
workfl ow, enterprise search, collaboration and business
intelligence.
The Technology division is well positioned to capitalise
on this industry growth due to the $2 million we have
invested in Enterprise Content Management Research
and Development over the last three years.
3. Improved customer engagement utilising Customer
Relationship Management
A key challenge for many organisations in the current
economic environment is how to do more with less.
Customer Relationship Management (CRM) is proving
to be a high growth area for the Technology division,
with many organisations looking to provide “online self
service” tools to clients that decreases operational
costs, whilst delivering improved 24/7 customer service.
This is a strong growth area for larger retailers in the
pursuit of membership loyalty initiatives that can deliver;
1. Seamless integration across all customer touch
points
2. Easy analysis of customer transactions and loyalty
trends
3. Access to up-to-date customer details at all times for
proactive marketing campaigns
The softening demand from the corporate sector due to
tough trading conditions has decreased discretionary capital
expenditure on Technology solutions in 2009, however the
Technology division has moved quickly to open new markets,
achieving strong demand from the federal, state and local
public sector. In the year ahead, we expect revenue from
the public sector to increase by 300% to offset the expected
continued depressed corporate market.
Outlook
Mitchell Communication Group’s acquisition of Vivid Group
and its Technology Intellectual Property puts the Group in
a strong position to capitalise on the growth of eCommerce
through their current and prospective clients in Australia
and the larger Enterprise Content Management sector.
Forrester forecasts that 72% of organisations plan to
purchase new or upgrade existing Web content management
solutions over the next twelve months. The two key business
drivers for Technology investment are; 63% pursuing
improved Website customer experiences, and 53% wanting
to reduce operations and IT costs (source: Forrester:
January 2009).
As part of the Group’s offering, we are confi dent that the
Technology division is well placed to capitalise on these
market trends.
For
per
sona
l use
onl
y

30
…nothing is beyond our reach.
More than
$1 million in project
commitments secured during fi rst yearF
or p
erso
nal u
se o
nly

31
Review of OperationsResearch Division
Research Division
The principal activities of the Research division are to
conduct consumer research and marketing analytics.
Year in Review
Mitchell Communication Group has a strong track record
in the fi eld of consumer research, offering insight from
established consumer surveys to drive planning and buying
across our client portfolio. We saw a need to extend this
capability driven by our clients.
Marketers are becoming even more demanding in seeking
to understand the contribution their activities make to sales
and profi ts. Our clients are looking to measure intermediate
performance, through metrics such as brand awareness,
perception and preference. They also seek to analyse the
effect of different investment strategies on sales and profi ts.
In August 2008 we established a Research division and a
new business called Symphony Analytics & Research to help
address these challenges.
Symphony offers customised research and marketing
analytics. Our research capability allows us to deliver both
qualitative and quantitative research across Australia. The
marketing analytics service helps marketers understand
which parts of their investments best contribute to sales and
profi ts, facilitating optimisation of future spending.
Our fi rst year performance has signifi cantly exceeded
expectations, securing in excess of $1 million of project
commitments during the fi scal year.
We have delivered consumer insight projects using
conventional focus groups, and through adopting new
on line research methodologies. We have also delivered
brand health analysis projects, and are measuring brand
performance across a number of our clients.
Our most outstanding success has been in the area of
econometrics. We are focused on Marketing Return on
Investment (MROI). Our capability in this area allows us
to help clients invest optimally by product, brand, channel,
area and time to deliver best results. We are working with
clients on a continuous basis to deliver improved profi tability
from their marketing budgets.
Company within Research Division
Symphony
Symphony conducts research and analytics into consumer
markets, helping clients determine how to achieve the best
results for their brand.
Symphony’s services cover all forms of consumer research,
including online consumer panel, telephone, secondary
analysis and access to an online panel of over 25,000
Australians.
In the analytic fi eld, Symphony has recently developed
customised tools to manage budget allocation and channel
planning. The channel planning tool is the only one of
its kind specifi cally tailored for the Australian media and
market. They are also able to offer econometric analysis
helping clients optimise marketing investments.
Market Conditions
The Australian market is highly competitive in Research.
It is dominated by several big players, with the top nine
companies representing over 70% of billings in a market
estimated to be worth $US 532 million (source: ESOMAR).
Quantitative research forms the largest part of this (in
excess of 65%), the nature of this research means that
clients tend to rely on data comparisons over time and are
somewhat conservative in adopting new suppliers.
Whilst this presents a challenge, the new approaches to
research that embrace online surveys and forums and
mobile telephony create new opportunities. We see the
opportunity is to provide higher frequency of insight, more
rapidly and at lower entry costs. This increased agility
in consumer insight can be used to create competitive
advantage for our clients who are looking forward, rather
than backward.
The substantial growth area is likely to be in analytics. As
we can see from the inexorable rise of digital, driven by the
ability to link spend to sales, so too will marketing analytics
continue to grow. We believe that marketers will continue to
invest in this area to aid better marketing decision making.
For
per
sona
l use
onl
y

We are focused on
motivating, developing
& empowering staff
at all levels of our business
32
…nothing is beyond our reach.
For
per
sona
l use
onl
y

33
Review of OperationsResearch Division (continued)
Human Resources
Our consumer insights and analytics will not only allow
Mitchell’s clients to identify how to make better investment
decisions but the link with other Group companies will
allow us to execute recommendations seamlessly. This
integration is a key strength that has already delivered
substantial benefi ts to clients.
Outlook
We see the main engine of growth being in analytics over the
next 12 months.
Clients have experienced a period of relative caution in their
marketing spending over the last 12 months. However their
aim remains to stimulate profi table demand. Given that,
the implementation of programmes that create incremental
insights and show how best to spend on communications
will allow budgets to go further.
One of the strengths of the Mitchell Communication Group
is the quality, diversity, skill and experience of our people.
We are focused on motivating, developing and empowering
staff at all levels of our business.
The foundation of our Human Resources strategy is based
on the consideration of fi ve key areas:
The working environment which is designed to develop
a dynamic and positive organisational culture that
embraces quality values;
Performance management which maximises the
contribution of employees to the fulfi lment of business
priorities and goals;
Learning and development to foster continual learning at
the individual, team and organisational level;
Policy and procedures to establish clear and consistent
guidelines that are in line with current legislative
requirements and best practice; and
Strategic and risk management for ongoing review and
alignment of resources to the Group’s strategic plan.
In the last 12 months we have undertaken a number of
activities designed to:
Attract, secure and retain the most talented people in
the market to work with us; and
Train, develop and provide staff with the resources in
order to do their job to the best of their ability now and
into the future.
Some of the initiatives undertaken during the year have
included:
Centralised systems, policies and procedures including
the introduction of an online payroll information
workfl ow, with employee and management self service;
The appointment of a new Group Learning &
Development Manager who has reviewed our approach
to learning and development and is developing a new
group competency framework;
Staff wellbeing and benefi ts such as the provision of a
confi dential and professional counselling service for
our staff and their immediate families, subsidised fl u
vaccinations, access to discount private health insurance
and discounted gym memberships for staff. Fresh fruit
is also delivered to our offi ces several times a week for
all staff to enjoy.
Recruitment has also been a strong focus and our employee
referral policy has proved successful.
Our continued aim is to ensure that Mitchell’s is an
outstanding place to work, leading us to attract the best
available people in every city in which we operate and
provide those members of staff with an enjoyable and
rewarding workplace.
Full time equivalent staff within the Group as at 30 June
2009 was 577.
For
per
sona
l use
onl
y

34
Virgin Blue soars to new heights with
the Mitchell Communication Group
Virgin Blue Group is recognised as a leader of innovation in
the global aviation industry. The airline group includes the
Virgin Blue, Pacifi c Blue, Polynesian Blue and V Australia
brands.
Virgin Blue engaged several Mitchell Communication Group
companies from different divisions throughout the year. The
result was a diverse program which supported Virgin Blue’s
marketing goals and helped cement the prominent presence
of the Virgin Blue brands.
Mitchell & Partners worked with APN Outdoor to develop
the largest billboard site in Australia for Virgin Blue’s
newest international carrier V Australia. The idea for
the landmark 200m long billboard at Sydney Airport was
developed by Mitchell’s to make a bold statement for
V Australia, with maximum visual impact close to the
airport.
With a high proportion of Virgin Blue passengers
researching and booking fl ights online, digital is a key
communication channel for Virgin Blue. emitch and
Mitchell & Partners collaborated with Yahoo7 and
ninemsn to develop purpose built ‘ticker’ placements,
which enable Virgin Blue to communicate live updates
on their fare prices at any time. The ticker strategy
has delivered exceptional results for Virgin Blue, with
direct-from-click revenue consistently exceeding the
benchmark ROI target by up to fi ve times.
emitch is working with the Group’s Social Media Unit
to support Virgin Blue’s social media strategy which
includes Twitter, Facebook and YouTube.
Columbus Search successfully launched tactical
campaigns around major retail marketing events and
developed agile online marketing strategies for Virgin
Blue to allow constant refreshing of creative and fare
changes.
Visual Jazz provided digital creative for the launch of
V Australia’s direct to L.A. services from Sydney and
Brisbane. Based on the extensive offl ine campaign,
this work consisted of display ads and an over the page
banner spread.
Michelle Lee, General Manager, Marketing for Virgin Blue,
says, “As an airline Group, we have a modest advertising
budget so our mission is to come up with new and fresh
ways to showcase our brands and maximise impact and
dollar spend.”
“Mitchell Communication Group has delivered, and
continues to deliver, innovative campaigns that maximise our
return on investment and compliment the pioneering nature
and entrepreneurial spirit of our company.”
…nothing is beyond our reach.
Delivering Integrated Solutions
V Australia 200m long billboard at Sydney Airport
Purpose built ‘ticker’ placement advert on Yahoo7
For
per
sona
l use
onl
y
Working in partnership with our clients, staff and suppliers
to contribute to the wider community
At the Mitchell Communication Group, we’re serious about
leveraging our networks, resources and reputation to help
the community. We increased our efforts in FY09 to deliver
our biggest ever contribution.
We support the community in a number of ways, including:
Supporting our people to help school-aged children
learn to read as part of the children’s charity, Learning
Links’ Reading for Life program.
Using our strong media and publishing relationships to
negotiate valuable pro bono advertising value for more
than 65 charities. In FY09, we secured free air time value
for our community partners valued at $14.3 million (up
from $8 million in FY08).
Supporting staff volunteering activities. In FY09, 152
of our people volunteered, with the Group contributing
more than 2,412 hours in company time worth $298,540.
This involved staff providing their time free of charge
to help our community-partner clients to get their
messages out to the Australian and New Zealand public.
Mitchells and the Harold Mitchell Foundation contributed
over $34,000 to the Red Cross Bushfi re Appeal after the
devastating Black Saturday fi res in Victoria in February.
Our staff contributed thousands of items - clothing,
bedding and toys - for those affected by the fi res and we
held a fundraising barbeque at our Melbourne offi ce in
which the staff raised a further $9,236 in cash.
When the Homeless World Cup arrived in Melbourne
in December, the Melbourne branches of Mitchell &
Partners, emitch and Visual Jazz offered their support to
ensure prominent media exposure of the event.
Mitchell & Partners worked with Kidney Health
Australia, negotiating 500 signs valued at over $415,000
to appear nationally at no cost to Kidney Health.
Our Brisbane offi ce team leveraged their skills, expertise
and industry networks to make a real difference for the
Leukaemia Foundation’s Shave for a Cure campaign.
Mitchell & Partners Brisbane were named the number
one fundraiser in Queensland and number fi ve
fundraiser in the country for the Leukaemia Foundation’s
2009 World’s Greatest Shave after raising nearly $68,000.
Stadia Media and Haystac supported Drawtism,
Australia’s fi rst ever national campaign to increase
awareness, empathy and understanding of autism.
Haystac managed an extensive media relations campaign
while Stadia promoted the campaign at the MCG.
On ANZAC Day, Stadia Media organised a live cross
from the MCG to soldiers in Afghanistan, encouraging
the crowd to recognise our troops serving overseas. The
team were presented with the only ever commemorative
coin given to an individual or company in Australia by the
Mentoring and Reconstruction Task Force as a thank you
for their efforts.
We are always looking for ways to reduce our impact on
the environment. Construction has commenced on a
building which will become our new eco-friendly head offi ce
in York St, South Melbourne, which is due for completion in
late 2010.
Our priority, in conjunction with the building owner, when
developing plans for this new building was to lead the way
for media agencies with our environmental policies and
practices.
The building will have a 5-star environmental certifi cation
from the Green Building Council of Australia. The main
environmental features of the building include:
Grey water harvesting: collection of waste water to be
used in fl ushing of toilets
Chilled beams: using chilled water passing through
piping embedded in the concrete slabs to keep the
building cool
Solar energy: two banks of solar arrays on the roof
High performance glass: allows excellent lighting but
reduced heat gain
Bicycle racks and showers for staff, to encourage riding
to work
We are a founding member of the London
Benchmarking Group (LBG), a group
of international businesses seeking to
manage, measure and report on their
involvement in the community. LBG has
increased its membership to 44 in FY09,
up from 37 in the previous year.
We worked with LBG in FY09 to enable better data collection
from all our businesses, which is refl ected in the signifi cant
growth in our CSR program.
Corporate Social Responsibility
35
For
per
sona
l use
onl
y

2009 2008
$’000 $’000
Final dividend for the year ended 30 June 2008 of 2.1 cents (2007: 1.2 cents) per
fully paid share paid on 26 September 2008 (2007: 12 October 2007). Fully franked
(2007: fully franked) based on tax paid at 30% 6,048 3,329
Interim Dividend for the year ended 30 June 2009 of 1.9 cents (2008: 1.8 cents) per
fully paid share paid on 17 April 2009 (2008: 28 March 2008). Fully franked (2008: fully
franked) based on tax paid at 30% 5,516 5,182
Total 11,564 8,511
36
Directors’ Report
Your directors present their report on the Group consisting of Mitchell Communication Group Limited and the entities
(referred to hereafter as the ‘Group’) it controlled at the end of, or during, the year ended 30 June 2009.
Directors
The following persons were directors of Mitchell Communication Group Limited (‘the company’) during the whole of the fi nancial
year and up to the date of this report:
Harold C Mitchell AO (Executive Chairman)
Stuart J Mitchell (Chief Executive Offi cer)
Robert J Stewart
Garry A Hounsell
Rodney J Lamplugh
Stephen A Cameron
Peter G Nankervis
Naseema Sparks
Principal activities
During the year the principal continuing activities of the Group consisted of:
The provision of services to clients for communications strategy and the planning and buying of traditional media.
The provision of services to clients for interactive marketing and communications strategy and planning and buying of
interactive media, and digital creative services.
The development and implementation of communications campaigns across a broad range of disciplines including public
relations, experiential marketing, brand experience, sponsorship, sports-ground marketing, direct marketing and corporate
social responsibility.
The following signifi cant changes in the nature of activities of the Group occurred during the period:
new activity resulting from the acquisition of a subsidiary:
- advertising templating systems
- video production services
Dividends
Dividends paid to members during the fi nancial year were as follows:
Since the end of the fi nancial year, the directors have approved the payment of a fully franked fi nal dividend, inclusive of the
Dividend Reinvestment Plan, of $6,246,393 (2008: $6,048,390) to be paid on 2 October 2009 out of profi ts earned for the fi nancial
year ended 30 June 2009.
Review of operations
The directors’ review of operations is contained on pages 12 to 33.
For
per
sona
l use
onl
y

2009
$’000
An increase in contributed equity of $3,270,000 (2008: $46,127,000) as a result of:
Issue of 7,134,839 (2008: nil) shares under the Dividend Reinvestment Plan 3,139
Issue of 500,000 shares under employment contract (2008: nil) 213
Issue of 1,793,871 fully paid ordinary shares as part consideration of earn-out payments on the
acquisitions of Visual Jazz and the Coleman Group 44
Transaction costs, net of tax (126)
Net increase in share capital 3,270
2009 2008
Cents Cents
Basic earnings per share 6.6 6.3
Diluted earnings per share 6.6 6.3
37
Signifi cant changes in the state of affairs
Signifi cant changes in the state of affairs of the Group during the fi nancial year were as follows:
(a) Acquisitions and new business operations:
During the fi nancial year, Mitchell Communication Group completed the purchase of the following companies and
businesses:
Mitchell & Partners (WA) Pty Ltd (100%)
Vivid Holdings Australia Pty Ltd and its subsidiaries (100%)
Agile Automated Advertising Pty Ltd (100%)
Picture This! Productions (100%)
Also during the fi nancial year, the Group commenced the operations of Symphony Analytics & Research, specialising
in qualitative and quantitative research, marketing analytics, communication planning tools and processes.
(b)
Earnings per share
Matters subsequent to the end of the fi nancial year
The directors declared a 2.1 cent a share, fully franked dividend on 26 August 2009 payable on 2 October 2009 with a record date
of 11 September 2009.
On 4 September 2009, with effect from 1 July 2009 the Mitchell Communication Group Limited acquired 100% of the business
of a Western Australian media buying agency, which instantly elevated the Group to the position of Western Australia’s largest
media buyer.
Except for the dividend and acquisitions discussed above, the directors’ are not aware of any matter or circumstance that has
occurred since the end of the fi nancial year that has signifi cantly affected, or may signifi cantly affect the operations of the Group,
the results of those operations or state of affairs of the Group in subsequent fi nancial years.
Likely developments and expected results of operations
Additional comments on expected results of the operations of the Group are included in this report under the review
of operations and activities on pages 12 to 33.
Further information on likely developments in the operations of the Group and the expected results of operations has not been
included in this report because the directors believe it would be likely to result in unreasonable prejudice to the Group.
Environmental regulation
The Group is not subject to any signifi cant environmental regulations.
For
per
sona
l use
onl
y

38
Information on directors
Harold Mitchell AO Executive Chairman. Age 67.
Experience and expertise
Non-executive director for 9 years. Executive Chairman since 25 May 2007. Founder and principal of Mitchell & Partners,
Australia’s largest media and communications group, with a growing presence in New Zealand and across the Asia-Pacifi c
region. Active involvement in arts and charitable organisations.
Other current directorships
Vice-Chairman of the Care Australia Corporate Council (from 2005), Chairman of the Melbourne Symphony Orchestra (from
2009), Chairman of ThoroughVision (from 2009), non-executive director of Tennis Australia (from 2009), non-executive director
of Art Exhibitions Australia (from 2009), non-executive director of Television Sydney (from 2009) and non-executive director of
Deakin Foundation (from 2009).
Former directorships in last 3 years
President of the Museums Board of Victoria (from 2001 – 2007), non-executive director of Copperart Holdings Limited
(from 2006 – 2007), non-executive director of Opera Australian (from 1997 – 2009), non-executive director of CARE Australia
(from 2006 – 2009).
Special responsibilities
Executive Chairman of the Board.
Interests in shares and options
108,008,504 ordinary shares in Mitchell Communication Group Limited. As at the date of this report the Mitchell & Partners
Executive Share Plan Trust holds 1,877,727 shares in the company, which are included above. Mr H.C. Mitchell is the trustee of
the Mitchell & Partners Executive Share Plan Trust but not a benefi ciary thereof.
Stuart Mitchell Chief Executive Offi cer. Age 39.
Experience and expertise
Non-executive director for 9 years. Executive director since 25 May 2007. Involvement in media planning and buying operations
since 1992.
Other current directorships
None.
Former directorships in last 3 years
None.
Special responsibilities
Chief Executive Offi cer.
Interests in shares and options
13,414,063 ordinary shares in Mitchell Communication Group Limited.
Directors’ Report (continued)F
or p
erso
nal u
se o
nly

39
Garry Hounsell B.Bus (Acctg) FCA CPA FAICD. Deputy Chairman – Independent non-executive. Age 54.
Experience and expertise
Director for 3 years. Former CEO and Country Managing Partner of Arthur Andersen and Senior Partner of Ernst & Young.
Other current directorships
Non-executive director of four other publicly listed companies: Chairman of PanAust Limited (director since July 2008), Qantas
Airways Limited (director since 2005), Orica Limited (director since 2004), and Nufarm Limited (director since 2004). Also
chairman of Investec Global Aircraft Fund and a non-executive director of Ingeus Limited and Freehills.
Former directorships in last 3 years
Was formerly a chairman of Prudentia Investments and The Macfarlane Burnet Institute for Medical Research and Public
Health Ltd.
Special responsibilities
Deputy Chairman of the Board.
Member of Human Resources, Remuneration and Nomination Committee from 16 October 2006.
Interests in shares and options
1,758,282 ordinary shares in Mitchell Communication Group Limited.
Robert Stewart LL.B (Hons), BCom, MBA (Harvard). Independent non-executive. Age 60.
Experience and expertise
Director for 9 years. Former national managing partner of major legal fi rm.
Other current directorships
Non-executive Chairman of Melbourne IT Ltd (director since 1999) and Chairman of Baker IDI Heart & Diabetes Institute.
Former directorships in last 3 years
Non-executive director of an unlisted public company, Plantic Technologies Limited, from 2004 to 2006, non-executive director
of Meditech Research Limited from 2005 to 2006 and non-executive director of Metabolic Pharmaceuticals Limited from 2007
to 2009.
Special responsibilities
Lead independent director.
Chairman of Human Resources, Remuneration and Nomination Committee.
Interests in shares and options
347,222 ordinary shares in Mitchell Communication Group Limited.
Rodney Lamplugh LL.B, B.Juris Non-executive director. Age 46.
Experience and expertise
Director for 9 years. Legal practitioner specialising in commercial, media and intellectual property law.
Other current directorships
None.
Former directorships in last 3 years
None.
Special responsibilities
Member of the Audit and Corporate Governance Committee.
Interests in shares and options
1,084,908 ordinary shares in Mitchell Communication Group Limited.
For
per
sona
l use
onl
y
40
Information on directors (continued)
Stephen Cameron Independent non-executive director. Age 57.
Experience and expertise
Director for 3 years. Senior advertising and marketing executive with over 35 years industry experience.
Other current directorships
None.
Former directorships in last 3 years
None.
Special responsibilities
Member of the Audit and Corporate Governance Committee.
Interests in shares and options
74,376 ordinary shares in Mitchell Communication Group Limited.
Peter Nankervis B Ec. (Hons), FCPA, GAICD Independent non-executive director. Age 59.
Experience and expertise
Director for 2 years. Senior fi nancial executive with more than 30 years experience. Formerly Finance Director of Cadbury
Schweppes Australia and CFO of Cadbury Schweppes Asia Pacifi c.
Other current directorships
Non-executive director of Onesteel Ltd (director since 2004) and Dairy Australia Limited (director since 2005).
Former directorships in last 3 years
None.
Special responsibilities
Chairman of the Audit and Corporate Governance Committee.
Interests in shares and options
67,806 ordinary shares in Mitchell Communication Group Limited.
Naseema Sparks B Pharm, M Pharm (Pharmacol), MBA, GAICD Independent Non-executive director. Age 56.
Experience and expertise
Director for 2 years. Background in pharmacology and strategic consulting. Senior Advertising Agency executive for 12 years.
Formerly Managing Director and Partner of M&C Saatchi.
Other current directorships
Non-executive director of Blackmores Ltd (director since 2005); Deputy Chair of Osteoporosis Australia, Director of Sydney
Dance Company and National President of Chief Executive Women.
Former directorships in last 3 years
Non-executive director of Racing Victoria Limited from 2007 to December 2008 and Vice President of the Melbourne
International Arts Festival (until December 2008).
Special responsibilities
Member Human Resources, Remuneration and Nomination Committee.
Interests in shares and options
None.
Directors’ Report (continued)F
or p
erso
nal u
se o
nly

41
Company Secretaries
Mr Andrew Seaburgh FCPA.
Mr Seaburgh was appointed on 4 October 2005. Mr Seaburgh has many years experience as a senior fi nance executive and
company secretary in various industries for over 30 years.
Mr Dion Cust B.Bus CA
Mr Cust was appointed to the position of company secretary on 23 August 2005. Mr Cust has been the CFO of Mitchell
Communication Group Limited for the past 9 years, and prior to that he worked as a chartered accountant for a major chartered
accounting fi rm.
Meetings of directors
The numbers of meetings of the company’s Board of directors and of each Board Committee held during the year ended 30 June
2009, and the numbers of meetings attended by each director were:
A = Number of meetings attended
B = Number of meetings held during the time the director held offi ce or was a member of the Committee during the year
* = Not a member of the relevant Committee† = S J Mitchell attends the Human Resources, Remuneration and Nomination Committee meetings as an observer
^ = G A Hounsell attends the Audit and Corporate Governance Committee meetings as an observer
Retirement, election and continuation in offi ce of directors
There were no changes to directors during the year ended 30 June 2009. Mr Stuart Mitchell, Mr Stephen Cameron and
Mr Robert Stewart are directors retiring by rotation who, being eligible, offer themselves for re-election at the Annual
General Meeting.
Meetings of Committees
Full meeting of
Directors
Audit and Corporate
Governance
HR/Remuneration
Nomination
A B A B A B
H C Mitchell 10 10 * * * *
S J Mitchell† 10 10 * * 2 2
G A Hounsell ^ 9 10 1 3 2 2
R J Stewart 9 10 * * 2 2
R J Lamplugh 10 10 3 3 * *
S A Cameron 9 10 3 3 * *
P G Nankervis 9 10 3 3 * *
N Sparks 9 10 * * 2 2
For
per
sona
l use
onl
y

Base fee 2009 2008
Chairman Nil Nil
Deputy Chairman ^ $120,000 $120,000
Other non-executive directors $80,000 $80,000
Additional Fees
Audit and Corporate Governance Committee chairman $15,000 $15,000
Human Resources, Remuneration and Nomination Committee chairman $15,000 $15,000
42
The remuneration report is set out under the following main headings:
A Principles used to determine the nature and amount of remuneration
B Details of remuneration
C Service agreements
D Share-based compensation
E Additional information
The information provided in this remuneration report has been audited as required by section 308(3C) of the Corporations
Act 2001.
A Principles used to determine the nature and amount of remuneration
The objective of the Group’s executive reward framework is to ensure that reward for performance is competitive with the
market and appropriate for the results delivered. The framework aligns executive reward with the achievement of company
goals, and therefore, the creation of value for shareholders. The Board, through the Human Resources, Remuneration and
Nomination Committee, ensures that executive rewards satisfy the following criteria:
Competitiveness in the marketplace;
Acceptability to shareholders; and
Alignment to performance.
The framework is aligned to shareholders’ interests in that it:
has revenue and profi t growth as a core component of the framework, and
assists in attracting and retaining high calibre executives.
The framework is aligned to the executives’ interests in that it:
rewards capability and performance;
refl ects competitive reward for contribution to profi t and shareholder growth; and
provides a clear structure for earning rewards.
The Human Resources, Remuneration and Nomination Committee provides advice on remuneration and incentive policies and
practices and specifi c recommendations on remuneration packages and other terms of employment for executive directors,
other senior executives and non-executive directors. The Corporate Governance Statement provides further information on the
role of this committee.
The framework consists of a mix of fi xed pay, short and long term incentives.
Non-Executive directors
Fees and payments to non-executive directors refl ect the demands, which are made on, and the increasing responsibility of, the
directors. Non-executive directors’ fees are reviewed annually by Human Resources and the Remuneration and Nomination
Committee, on behalf of the Board. The Chairman does not receive remuneration for his role.
Directors’ fees
The current global limit on directors’ remuneration is $1,500,000 and was set on 28 November 2007. Directors who chair
Committees receive additional fees.
No retirement allowances are payable to directors.
The following fees have applied:
^ During the year ended 30 June 2008, the Deputy Chairman also received a consultancy fee of $300,000 for additional services provided to the
Group for mergers and acquisition activity. This agreement ended on 30 June 2008.
Directors’ Report (continued)
Remuneration Report
For
per
sona
l use
onl
y

43
Executive Pay
The executive pay and reward framework has three components:
base pay and benefi ts
short and long term performance incentives
other remuneration such as superannuation
The combination of these comprises the executive’s total remuneration.
Base Pay
Structured as a total employment cost, which may be delivered as a mix of cash and non-fi nancial benefi ts within approved
guidelines at the discretion of the executive.
Executives are offered a competitive base pay, which is reviewed annually on 1 July to ensure it remains competitive with the
market for a comparative role. There are no guaranteed base pay increases for executives.
Benefi ts
Executives can receive car fringe benefi ts as part of their total remuneration package
Short-term Incentives
Should the company reach pre-determined gross revenue and profi t targets set by the Board, and achieve personal performance
based indicators, senior executives are entitled to short-term incentives. The short-term incentives are payable by 30
September each year. The targets are set so as to ensure shareholder value is increased and the maximum available incentive
is only available for out-performance.
Each executive has a profi t target, along with individual non-fi nancial performance objectives aligned to their key performance
indicators and linked to the drivers of performance in future reporting periods including staff management, systems
improvement, and strategy development.
Long-term Incentives
Performance rights are granted to certain executives as part of their total remuneration package. The value of a performance
right attributed to the total remuneration package is independently valued using the Monte Carlo approach. All grants
of performance rights vest to shares over a 3 year period, subject to vesting conditions and performance conditions. The
performance conditions comprise Total Shareholder Return (‘TSR’) and Earnings Per Share (‘EPS’).
The Human Resources, Remuneration and Nomination Committee are responsible for assessing whether targets and KPI’s have
been met. To help make this assessment, the Committee receives detailed reports on performance from management.
Mitchell Communication Group Limited Performance Rights Plan and Employee Option Plan
Information on the Mitchell Communication Group Limited Performance Rights Plan and Employee Option Plan is set out in
note 33 to the fi nancial statements. Option grants under the scheme are not subject to performance conditions apart from
the exercise price. Exercise prices of option grants are determined by the Human Resources, Remuneration and Nomination
Committee having regard to the share price at grant date to ensure robust growth in share value is required for the exercise
price to be reached. The plan is now closed to all employees and directors.
B Details of remuneration
Amounts of remuneration
Details of the remuneration of the directors and key management personnel (as defi ned in AASB 124 Related Party Disclosures)
of Mitchell Communication Group Limited and the Group are set out in the following tables. The key management personnel of
Mitchell Communication Group Limited and the Group includes the directors as per pages 8 to 9 above and the following fi ve
executive offi cers, who have authority and responsibility for planning, directing and controlling the activities of the entity:
Luke Littlefi eld – Chief Operating Offi cer
John Murray – Managing Director – Digital
Jonathon White – Managing Director – Corporate
Anthony Charles – Managing Director – Diversifi ed
Dion Cust – Chief Financial Offi cer
In addition the following employees must be disclosed under the Corporations Act 2001 as they are among the fi ve highest
remunerated Group executives:
Teena Jameson – Managing Director – Mitchell & Partners (QLD) Pty Ltd
Allen Scash – Managing Director – Mitchell & Partners Pty Ltd
The cash bonuses are dependent on the satisfaction of performance conditions as set out in the section headed Short-term
incentive above.
For
per
sona
l use
onl
y

44
B Details of remuneration (continued)
Key management personnel of the Group and other executives of the company and the Group
^ Denotes one of the fi ve highest paid executives of the Group, as required to be disclosed under the Corporations Act 2001.
* Ceased employment with Mitchell Communication Group on 31 July 2009.
2009 Short-term employee benefi ts
Post-
employment
benefi ts
Long-term
benefi tsEquity
Name
Cash salary
and fees
$
Cash
bonus
$
Non-
monetary
benefi ts
$
Super-
annuation
$
Long service
leave
$
Shares and
options
$
Total
$
Non-executive directors
G A Hounsell 120,000 - - 10,800 - - 130,800
R J Stewart 95,000 - - 8,550 - - 103,550
R J Lamplugh 60,000 - - 27,200 - - 87,200
S A Cameron 80,000 - - 7,200 - - 87,200
P G Nankervis 28,945 - - 74,605 - - 103,550
N Sparks 80,000 - - 7,200 - - 87,200
Sub-total non-
executive directors 463,945 - - 135,555 - - 599,500
Executive directors
H C Mitchell AO - - - - - - -
S J Mitchell^ 343,750 - - 30,937 1,932 - 376,619
Other key management personnel
L Littlefi eld^ 265,000 - - 50,000 610 212,500 528,110
J N Murray^ 343,693 - 23,280 33,027 2,037 11,928 413,965
J White* 275,229 - - 24,771 2,976 - 302,976
A Charles 275,229 - - 24,771 8,670 - 308,670
D G Cust 189,925 - 21,084 18,991 1,765 4,470 236,235
Total key
management
personnel
compensation 1,692,826 - 44,364 182,497 17,990 228,898 2,166,575
Other Group executives
T Jameson^ 340,855 - - 100,002 13,796 - 454,653
A Scash^ 266,602 25,000 - 63,398 6,574 - 361,574
Directors’ Report (continued)
Remuneration Report (continued)
For
per
sona
l use
onl
y

2008 Short-term employee benefi ts
Post-
employment
benefi ts
Long-term
benefi tsEquity
Name
Cash salary
and fees
$
Cash
bonus
$
Non-
monetary
benefi ts
$
Super-
annuation
$
Long service
leave
$
Options *
$
Total
$
Non-executive directors
G A Hounsell 420,000 - - 10,800 - - 430,800
R J Stewart 95,000 - - 8,550 - - 103,550
R J Lamplugh 60,000 - - 27,200 - - 87,200
S A Cameron 80,000 - - 7,200 - - 87,200
P G Nankervis 28,945 - - 74,605 - - 103,550
N Sparks 80,000 - - 7,200 - - 87,200
Sub-total non-
executive directors 763,945 - - 135,555 - - 899,500
Executive directors
H C Mitchell AO - - - - - - -
S J Mitchell^ 375,000 375,000 - 33,750 675 - 784,425
Other key management personnel
L Littlefi eld
(from 3 Dec 2007) 138,141 166,000 - 25,038 100 - 329,279
J N Murray^ 251,720 75,000 23,280 24,750 317 46,942 422,009
J White^ 256,881 76,000 - 23,119 1,696 - 357,696
A Charles^ 255,019 76,000 1,984 22,952 8,200 - 364,155
D G Cust 189,925 - 21,084 18,991 3,670 10,763 244,433
Total key
management
personnel
compensation 1,466,686 768,000 46,348 148,600 14,658 57,705 2,501,997
Other Group executives
T Jameson^ 391,200 - 4,452 28,800 7,500 - 431,952
45
Key management personnel of the Group and other executives of the Company and the Group
* On the 25th June 2008 directors forfeited their rights to options issued to them. The company subsequently cancelled the options. The
remuneration in the form of options disclosure does not include the negative value of options forfeited by the directors. The negative values of
the options were as follows: HC Mitchell - ($35,447), GA Hounsell - ($68,824), RJ Stewart - ($35,608), SA Cameron - ($35,608), PG Nankervis -
Nil, and N Sparks – Nil.
^ Denotes one of the fi ve highest paid executives of the Group, as required to be disclosed under the Corporations Act 2001.
For
per
sona
l use
onl
y

Fixed remuneration At risk - STI
2009 2008 2009 2008
Other key management personnel
S J Mitchell 62.7% 67.1% 37.3% 32.9%
L Littlefi eld 67.7% 66.7% 32.3% 33.3%
J N Murray 79.2% 80.0% 20.8% 20.0%
J White 66.7% 87.0% 33.3% 13.0%
A Charles 74.1% 87.0% 25.9% 13.0%
D Cust 100.0% 100.0% 0% 0%
46
B Details of remuneration (continued)
The relative proportions of contracted full-year remuneration that are linked to performance and those that are fi xed are as
follows:
C Service Agreements
On appointment to the Board, all non-executive directors enter into a service agreement with the company in the form of a letter
of appointment, which summarises the Board policies and terms, including compensation, relevant to the director.
Mr G Hounsell had entered into a consultancy agreement with the Board, which outlined additional services to be provided to the
Group in relation to mergers and acquisition activity. This agreement ran for one year from 1 July 2007 to 30 June 2008 and was
not renewed.
Remuneration and other terms of employment for the Chief Executive Offi cer, Chief Financial Offi cer and other key management
personnel are also formalised in service agreements. Some of these agreements provide for the provision of performance-
related cash bonuses and participation, when eligible, in the Mitchell Communication Group Limited Performance Rights Plan
and Employee Option Plan. Other major provisions of the agreements relating to remuneration are set out below.
S J Mitchell, Chief Executive Offi cer
Term of agreement - 3 years commencing 25 May 2007
Short-term incentive bonus based on achievement of agreed performance indicators, both fi nancial and non-fi nancial to a
maximum of $250,000. Additional incentive payable for internal budget out-performance.
Agreement may be terminated by either party giving six months notice.
Annual remuneration package, inclusive of superannuation, for the year ending 30 June 2010 of $420,000, reviewed annually
by the Board.
Payment in lieu of notice capped at six months salary.
L Littlefi eld, Chief Operating Offi cer
Agreement, dated 3 December 2007, may be terminated by either party giving 90 days notice.
Short-term incentive bonus based on achievement of agreed performance indicators, both fi nancial and non-fi nancial to a
maximum of $150,000. Additional incentive payable for internal budget out-performance.
Base salary, inclusive of superannuation, for the year ending 30 June 2010 of $315,000, to be reviewed annually by the
Human Resources, Remuneration and Nomination Committee.
Payment of termination benefi t is capped at three months salary.
Directors’ Report (continued)
Remuneration Report (continued)
For
per
sona
l use
onl
y

47
A Charles, Managing Director – Diversifi ed
Agreement, dated 27 May 2002, may be terminated by either party giving 90 days notice.
Short-term incentive bonus based on achievement of agreed performance indicators, both fi nancial and non-fi nancial to a
maximum of $105,000. Additional incentive payable for internal budget out-performance.
Base salary, inclusive of superannuation, for the year ending 30 June 2010 of $300,000, to be reviewed annually by the
Human Resources, Remuneration and Nomination Committee.
Payment of termination benefi t is capped at three months salary.
J Murray, Managing Director – Digital
Agreement, dated 9 January 2007, may be terminated by either party giving 90 days notice.
Short-term incentive bonus based on achievement of agreed performance indicators, both fi nancial and non-fi nancial to a
maximum of $105,000.
Base salary, inclusive of superannuation, for the year ending 30 June 2010 of $400,000, to be reviewed annually by the
Human Resources, Remuneration and Nomination Committee.
Payment of termination benefi t is capped at three months salary.
D Cust, Chief Financial Offi cer
Agreement, dated 19 February 2001, may be terminated by either party giving 30 days notice.
Base salary, inclusive of superannuation, for the year ending 30 June 2010 of $230,000, to be reviewed annually by the
Human Resources, Remuneration and Nomination Committee.
Payment of termination benefi t is capped at one month salary.
D Share-based compensation
Options are granted under the Mitchell Communication Group Limited Employee Option Plan (Option Plan). The plan is now
closed to all employees and directors. Options were granted under the Option Plan, which was created prior to the listing of
the company but included in the prospectus dated 9 February 2000. All staff were eligible to participate in the plan (including
directors). Options were granted under the plan for no consideration. Options granted under the plan carry no dividend or
voting rights, and were granted at the discretion of the Human Resources, Remuneration and Nomination Committee.
There were no perfomance rights issued to the directors or key management personnel of the company under the Mitchell
Communication Group Limited Perfomance Rights Plan during the fi nancial year.
On 25 June 2008 the directors elected to forfeit all options outstanding to them and the company subsequently cancelled these
options. The options were not replaced and the directors were not compensated for the forfeiture.
For
per
sona
l use
onl
y

Number of options granted
during the year
Number of options vested
during the year
2009 2008 2009 2008
Directors of Mitchell Communication Group Limited
P G Nankervis - 200,000^ - -
N Sparks - 200,000^ - -
Grant date Expiry date Exercise priceValue per option
at grant dateDate exercisable
29 November 2005 28 November 2010 $0.60 $0.203 29 November 2007
29 November 2005 28 November 2010 $0.70 $0.182 29 November 2007
29 November 2005 28 November 2010 $0.80 $0.164 29 November 2007
2 October 2006 2 October 2011 $0.55 * $0.290 2 October 2008
2 October 2006 2 October 2011 $0.65 * $0.258 2 October 2008
2 October 2006 2 October 2011 $0.75 * $0.290 2 October 2008
23 November 2006 28 November 2011 $0.75 * $0.599 29 November 2008
23 November 2006 28 November 2011 $1.05 * $0.463 29 November 2008
2 April 2007 2 April 2012 $1.42 * $0.288 2 April 2009
2 April 2007 30 September 2011 $1.55 * $0.234 1 October 2008
29 November 2007 29 November 2012 $1.50 $0.168 29 November 2009
48
D Share-based compensation (continued)
The terms and conditions of each grant of options affecting remuneration in this and previous reporting periods are as follows:
* The dilution to existing shareholders caused by the rights issue has led to a reduction in the exercise price of options on issue at the date of the
rights issue. The reduction was 4.7 cents per option.
When exercisable, each option is convertible into one ordinary share. Options may only be exercised in accordance with the
company policy on trading in securities. The exercise price of options is determined by the Human Resources, Remuneration
and Nomination Committee at the date of grant.
Details of options over ordinary shares in the company provided as remuneration to each director of Mitchell Communication
Group Limited and each of the key management personnel of the Group are set out below. When exercisable, each option is
convertible into one ordinary share of Mitchell Communication Group Limited. Further information on the options is set out in
note 23 and 33 to the fi nancial statements.
^ Options granted during the year were later forfeited in full on 25 June 2008
Directors’ Report (continued)
Remuneration Report (continued)
For
per
sona
l use
onl
y

49
The assessed fair value at grant date of options granted to the individuals is allocated equally over the period from grant date to
vesting date, and the amount is included in the remuneration tables above. Fair values at grant date are determined using an
enhanced Hull-White Trinomial Lattice option pricing model that takes into account the exercise price, the term of the option,
the vesting criteria, the impact of dilution, the non-tradeable nature of the option, the share price at grant date and expected
price volatility of the underlying share, the expected dividend yield and the risk-free interest rate for the term of the option.
Whilst no options were granted during the year ended 30 June 2009, the model inputs for options granted during the year ended
30 June 2008 included:
(a) 2008: options are granted for no consideration, and vest two years after grant date
(b) 2008: exercise price of $1.50
(c) 2008: grant date of 29 November 2007
(d) 2008: vesting date of 29 November 2009
(e) 2008: expiry date of 29 November 2012
(f) 2008: share price at grant date of $1.17
(g) 2008: expected price volatility of the company’s shares between 21% and 42%
(h) 2008: expected dividend yield between 3.9% and 5.5%
(i) 2008: risk-free interest rate of 6.25%
Shares provided on exercise of remuneration options
During the fi nancial year, there were no remuneration options exercised, as such no ordinary shares in the company were
provided as a result of the exercise of remuneration options to key management personnel of the Group (2008: nil).
E Additional information
Principles used to determine the nature and amount of remuneration: relationship between remuneration and company
performance
The overall level of executive reward takes into account the performance of the Group over a number of years, with greater
emphasis given to the current year. Over the past fi ve years, the Group’s profi t from ordinary activities after income tax has
grown at an average rate of 95% per annum, and total shareholder return has grown at an average rate of 78% per annum.
During the same period, average executive remuneration has grown at an average of 25% per annum.
For
per
sona
l use
onl
y

A B C
Remuneration consisting of
options and sharesValue at grant date Total
% $ $
L Littlefi eld 40% 212,500 212,500
J Murray 3% 11,928 11,928
D G Cust 2% 4,470 4,470
Options
Year Granted Vested Forfeited
% %
H C Mitchell 2007 - 100%
G A Hounsell 2007 - 100%
R J Stewart 2007 - 100%
S A Cameron 2007 - 100%
P G Nankervis 2008 - 100%
N Sparks 2008 - 100%
J Murray 2007 100% -
D G Cust 2007 100% -
50
E Additional information (continued)
Details of remuneration: Options
For each grant of options included in the tables on pages 44 to 49, the percentage of the available grant that was vested, in the
fi nancial year, and the percentage that was forfeited is set out below. No part of the grant of options is payable in future years.
Share-based compensation: options and shares
Further details relating to options and shares are set out below.
A = The percentage of the value of remuneration consisting of options and shares, based on the value at grant date set out in column B.
B = The value at grant date calculated in accordance with AASB 2 Share-based payments of options and shares granted during the year as part
of remuneration.
Loans to directors
There were no loans to directors at 30 June 2009 (2008: nil) as set out in note 23 to the fi nancial statements.
Directors’ Report (continued)
Remuneration Report (continued)
For
per
sona
l use
onl
y

Consolidated
During the year the following fees were paid or payable for services provided by the auditor of the
parent entity, its related practices and non-related audit fi rms: 2009 2008
Audit services $ $
PricewaterhouseCoopers – Australian fi rm:
Audit and review of fi nancial reports and other audit work under the Corporations Act 2001 317,212 338,550
Agreed upon procedures 10,000 5,000
Related practices of PricewaterhouseCoopers Australian fi rm 31,288 44,950
Total audit and other assurance services 358,500 388,500
51
Shares under option
Unissued ordinary shares of Mitchell Communication Group Limited under option at the date of this report are as follows:
No option holder has any right under the options to participate in any other share issue of the company or of any other entity.
Shares issued on the exercise of options
There were no ordinary shares of Mitchell Communication Group Limited issued during the year ended 30 June 2009 and
subsequent to the end of the fi nancial year on the exercise of options granted under the Mitchell Communication Group Limited
Employee Option Plan.
Insurance of offi cers
During the period, Mitchell Communication Group Limited paid a premium of $81,778 to insure the directors and offi cers of the
company and its controlled entities.
The liabilities insured are costs and any damages, judgments or settlements that may be incurred in defending civil or criminal
proceedings that may be brought against the offi cers in their capacity as offi cers of entities in the Group.
Proceedings on behalf of company
No person has applied to the Court under section 237 of the Corporations Act 2001 for leave to bring proceedings on behalf
of the company, or to intervene in any proceedings to which the company is a party, for the purpose of taking responsibility on
behalf of the company for all or part of those proceedings.
No proceedings have been brought or intervened in on behalf of the company with leave of the Court under section 237 of the
Corporations Act 2001.
Non-audit services
During the year ended 30 June 2009, the company did not use the auditor (PricewaterhouseCoopers) for any non-audit related
services.
Details of the amounts paid or payable to the auditor for audit services provided during the year are set out below.
Mitchell Communication Group Limited Employee Option Plan options
Number Issue price of shares Grant date First exercise date Expiry date
137,233 $0.55 2 Oct 2006 2 Oct 2008 2 Oct 2011
137,233 $0.65 2 Oct 2006 2 Oct 2008 2 Oct 2011
137,233 $0.75 2 Oct 2006 2 Oct 2008 2 Oct 2011
300,000 $1.55 2 April 2007 1 Oct 2008 30 Sept 2011
711,699
For
per
sona
l use
onl
y

52
Auditors’ Independence Declaration
A copy of the auditors’ independence declaration as required under section 307C of the Corporations Act 2001 is set out
on page 53.
Rounding of amounts
The company is of a kind referred to in Class Order 98/100, issued by the Australian Securities & Investments Commission,
relating to the “rounding off” of amounts in the directors’ report. Amounts in the directors’ report have been rounded off in
accordance with that Class Order to the nearest thousand dollars, or in certain cases, to the nearest dollar.
This report is made in accordance with a resolution of the directors.
Harold C Mitchell AO
Executive Chairman
Melbourne, 23 September 2009
Directors’ Report (continued)F
or p
erso
nal u
se o
nly

53
PricewaterhouseCoopersABN 52 780 433 757
Freshwater Place2 Southbank BoulevardSOUTHBANK VIC 3006GPO Box 1331MELBOURNE VIC 3001DX 77Telephone 61 3 8603 1000Facsimile 61 3 8603 1999
Auditor’s Independence Declaration
As lead auditor for the audit of Mitchell Communication Group Limited for the year ended30 June 2009, I declare that to the best of my knowledge and belief, there have been:
a) no contraventions of the auditor independence requirements of the Corporations Act 2001 inrelation to the audit; and
b) no contraventions of any applicable code of professional conduct in relation to the audit.
This declaration is in respect of Mitchell Communication Group Limited and the entities it controlledduring the period.
Nadia Carlin MelbournePartner 23 September 2009PricewaterhouseCoopers
For
per
sona
l use
onl
y

Corporate governance statement
Mitchell Communication Group Limited (‘the company’) and the Board are committed to achieving and demonstrating the
highest standards of corporate governance. The corporate governance framework is continually reviewed to ensure best
practice developments are incorporated. Changes to the company’s governance arrangements made in the course of the last
year are highlighted in this statement.
The company acknowledges the requirement to report against the Revised Principles released on 2 August 2007 in the annual
report for the fi nancial year ended 30 June 2009.
A description of the company’s main corporate governance practices are set out below. All these practices, unless otherwise
stated, were in place for the entire year. In order to assist shareholders understand the approach taken by the company to
corporate governance, the report has been set out using the same headings as used by the ASX Corporate Governance Council’s
“Principals of Good Corporate Governance”.
Principle 1
Lay Solid Foundations for Management and Oversight
The Board of directors is responsible for guiding and monitoring the company on behalf of the shareholders by whom it is
elected and to whom it is accountable. In discharging its stewardship it makes use of sub-Committees which are able to focus
in greater detail on relevant issues in their areas of responsibility. The current sub-Committees are the Human Resources,
Remuneration and Nomination Committee and the Audit and Corporate Governance Committee.
The key functions of the Board of directors are:
to set strategic direction and to manage and monitor strategy against key objectives and targets;
adopting the annual budget and monitoring performance on a regular basis;
appointment and removal of the CEO and setting appropriate remuneration and performance targets;
appointment and removal of the company secretary;
approval of the appointment and removal of the Chief Financial Offi cer;
monitoring and reviewing the performance of management;
set in place effective audit, compliance and control mechanisms;
ensuring the company has effective risk management processes;
approving and monitoring fi nancial and other reporting;
approving and monitoring the progress of major capital expenditure, acquisitions and divestitures;
reviewing Board performance and remuneration and ensuring a formal and transparent Board nomination process;
ensuring that the company complies with the law and has a high standard of ethical behaviour; and
monitoring and managing potential confl icts of interest of management, Board members and shareholders.
Management’s responsibilities are:
to be responsible to the Board for the overall performance of the company;
establishing the strategic direction of the company in conjunction with, and for approval by the Board;
implementing decisions in accordance with the strategic direction of the company as approved by the Board;
providing leadership and direction for all staff;
maintaining an effective risk management and internal control system;
ensuring integrity and timeliness of reporting to the Board and shareholders; and
ensuring that all management and staff comply with company policies.
54
For
per
sona
l use
onl
y

The Chairman’s role is to ensure that the relationship between the Board, management, shareholders, other stakeholders and
the individual directors is effective, effi cient and furthers the best interests of the company, shareholders, the Board and other
stakeholders.
The Board meets on a regular basis, with special meetings called if required between scheduled meetings. Agendas are
established to ensure proper coverage of strategic, fi nancial and major risk areas throughout the year.
Principle 2
Structure the Board to Add Value
The Constitution of Mitchell Communication Group Limited allows for the appointment of up to twelve directors. There are
currently eight directors. Six directors are non-executive, fi ve of whom are considered independent by the Board. The directors
have been chosen so as to provide an appropriate mix of experience and qualifi cations for the governance of the company.
The Board of Mitchell Communication Group appreciates the need for corporate transparency and accountability whilst also
balancing the need for skills, commitment, effective knowledge management and workable Board size. The current level of skill
and experience is appropriate to ensure the highest level of scrutiny.
Mr Robert Stewart, lead independent director, Mr Garry Hounsell, Deputy Chairman, Mr Stephen Cameron, Mr Peter Nankervis
and Ms Naseema Sparks are independent under ASX guidelines.
The Deputy Chairman, Mr Garry Hounsell, became independent on 1 July 2008 when a consultancy agreement lapsed.
Mr Rodney Lamplugh is not independent under ASX guidelines (being associated directly with a substantial shareholder);
however he brings formal legal qualifi cations, which are highly regarded by the Board and management.
Mr Harold Mitchell, whilst not an independent director (because he is Executive Chairman), has extensive industry experience
and knowledge and, as the founder of Mitchell & Partners, a company now owned by Mitchell Communication Group Limited, he
adds signifi cant knowledge and strategic vision at Board level as Executive Chairman. This is a departure from ASX corporate
governance recommendations, however the Board believes the Chairman is able to and does, bring quality and independent
judgement to all relevant issues falling within the scope of the role of the Chairman.
Mr Stuart Mitchell (Chief Executive Offi cer), whilst also not independent under ASX Guidelines, brings a combination of
professional expertise and industry knowledge (media placement) to the Board. These skills are highly regarded by the
company’s Board.
In summary, the company’s Board has a majority of independent directors, and the Board believes the current structure is
appropriate for the company and its current state of development. The company’s Code of Conduct also ensures that directors
are aware of their responsibilities in areas such as confl icts of interest and related party transactions.
The Board is committed to developing an ongoing dialogue with its key stakeholders over any matters of concern with Board
structure and/or independence.
The company recognises the need for a clear division of responsibility at the head of the company and as such, the roles of
Chairman and CEO roles have been separated.
Materiality is assessed on a case-by-case basis by reference to each director’s individual circumstances rather than applying
materiality thresholds.
One third of directors must retire from offi ce at the time of the Annual General Meeting each year. Directors are eligible for
re-election. The directors who retire by rotation are those with the longest period in offi ce since their appointment or last
election. At the time when any director is coming up for re-election, the Board considers that question and makes a conscious
decision as to whether to recommend the re-election to shareholders.
Directors and Board Committees have the right, in connection with their duties and responsibilities, to seek independent
professional advice at the company’s expense. Prior written approval of the Chairman is required, but this will not be
unreasonably withheld.
The Board has established a Human Resources, Remuneration and Nominations Committee. This Committee has the
responsibility for ensuring that proper human resource management and remuneration policies are developed and followed by
the company and for assisting the Board in reviewing the performance of the Board, its committees and individual directors and
in selecting any new directors. The committee follows the policy set down by the Board for appointment of new directors.
The Committee is chaired by Mr Robert Stewart.
Details of directors’ attendance at Human Resources, Remuneration and Nominations Committee meetings are set out in the
Directors’ Report.
55
For
per
sona
l use
onl
y

The Committee’s responsibilities include:
assisting in the annual performance review of the CEO;
recommending to the Board the compensation and key performance targets for the CEO;
assisting in the performance review of the Board;
identifying, evaluating and recommending suitable candidates for appointment as directors;
recommending to the Board appropriate remuneration policies for non-executive directors;
approving compensation packages and performance targets for senior executives;
succession planning for the Board, CEO and key executives;
review of human resource and remuneration policies and practices for the company as brought forward by the CEO and
where appropriate, recommend adoption by the Board; and
review and approve recommendations from the CEO on appointments and terminations to senior executive positions
reporting to the CEO with the exception of the CFO and company secretary whose appointment or termination must be
approved by the Board.
The Charter of the Human Resources, Remuneration and Nominations Committee can be viewed on the company’s website.
Principle 3
Promote Ethical and Responsible Decision-making
The company has a Code of Conduct applicable to all directors and staff. The Code is based on the premise that, in all conduct,
the company directors and staff are to act honestly, diligently, lawfully and fairly. The Code is regularly reviewed and updated
to ensure it refl ects the highest standards of behaviour and professionalism. A copy of the Code is available on the company’s
website.
The company has also developed a Securities Trading Policy. This applies to all directors, senior executives and staff and sets
out the approach to be followed should any of them wish to buy or sell Mitchell Communication Group Limited securities. A
copy of this policy can also be viewed on the company’s website.
Principle 4
Safeguard Integrity in Financial Reporting
The Board has established an Audit and Corporate Governance Committee with responsibility for ensuring that proper
accounting and auditing practices are maintained; that business risks are identifi ed and managed effectively; that assets are
protected against fi nancial loss; and that legal and regulatory obligations are met.
The Audit and Corporate Governance Committee is chaired by Mr Peter Nankervis. The committee has three members and
is comprised of a majority of independent, non-executive directors. Details of directors’ attendance at Audit and Corporate
Governance Committee meetings are set out in the Directors’ Report.
The Committee also receives regular reports from the external auditors concerning any matters which arise in connection with
the performance of their role, including adequacy of internal controls. The Committee reports to the Board on its activities after
each meeting, and copies of the minutes of the Committee’s meetings are provided to all directors.
Its role includes:
reviewing reports submitted by external auditors;
reviewing and recommending to the Board for approval half-yearly and annual fi nancial statements;
reviewing the performance of the auditors and recommending to the Board any change in the company’s auditors;
monitoring and confi rming to the Board the continuing independence of the external auditors and the level of assurance
given by the auditors;
monitoring regulatory compliance;
evaluating the appropriateness of the company’s administrative, operating and accounting policies; and
risk management generally (including such issues as insurances, management of information systems and internal controls).
.
56
Corporate governance statement (continued)F
or p
erso
nal u
se o
nly

The removal and nomination of auditors will be determined in accordance with the Corporations Act 2001. The Charter of the
Audit and Corporate Governance Committee can be viewed on the company’s website.
The CEO and the CFO are required to state to the Board in writing, at the time of submitting the half-year and full year accounts
for Board approval, that the company’s fi nancial reports are complete and present a true and fair view, in all material respects,
of the fi nancial condition and operational results of the company and Group and are in accordance with relevant accounting
standards and that the company’s risk management and internal compliance and control system is operating effi ciently and
effectively in all material respects.
Principle 5
Make Timely and Balanced Disclosure
The Board has adopted a Disclosure Protocol to ensure the timely and appropriate release of disclosable information to the
market in accordance with the ASX Listing Rules. Details of the Protocol are available on the company’s website.
Mr Dion Cust, company secretary, has been appointed as the Continuous Disclosure Offi cer. The Chairman or CEO approve the
fi nal form of announcements, subject to any comments from directors, who are given the opportunity to comment on proposed
material announcements prior to their release.
Principle 6
Respect the Rights of Shareholders
It is a fundamental tenet that the Board must act in the interests of all shareholders and, when Board decisions may affect
different shareholder groups differently, the Board must treat all shareholders fairly.
The company is committed to ensuring that shareholder’s are fully informed of the company’s affairs. Effective communications
with shareholders is, therefore, very important. The ways in which the company does this include:
Regular reports to shareholders, including the company’s Annual Report;
The Annual General Meeting, where the external auditor is in attendance to answer any shareholder questions about the
audit and the auditor’s report; and
Disclosure of all announcements made to the ASX on the company website, located at www.mitchells.com.au, as soon as
they have been lodged.
Principle 7
Recognise and Manage Risk
It is a key part of the role of the Audit and Corporate Governance Committee to oversee the establishment and implementation
of the risk management system. During the year ended 30 June 2008, a risk management framework and register was formally
developed and adopted.
Management has reported to the Board as to the effectiveness of the company’s management of material business risks during
the year ended 30 June 2009. The company has, taking into account its current size and structure, a relatively strong system of
risk management and internal controls in place. As such, the system is operating effectively in all material respects in relation
to fi nancial reporting risks.
Principle 8
Remunerate Fairly and Responsibly
The expected performance of the CEO and the senior executive staff reporting directly to him is specifi ed each year using key
performance indicators (‘KPI’s’). These KPI’s include, where appropriate, fi nancial targets for the company overall, as well as
personal objectives and targets, appropriate for each individual’s role.
The Human Resources, Remuneration and Nominations Committee assists the Board to address the various issues in this
area (see Principle 2 above). The CEO reviews the performance of staff reporting directly to him and makes recommendations
to the Committee for approval. The CEO’s own performance is reviewed by the Board, facilitated by the Human Resources,
Remuneration and Nominations Committee and the Chairman.
Enhanced performance by executives and senior staff is encouraged by structuring their remuneration with fi xed and variable
elements.
It is vital that directors are provided with and have access to all relevant information to enable them to properly discharge their
duties. Management is responsible for ensuring that reporting to the Board is comprehensive and timely.
57
For
per
sona
l use
onl
y

Principle 8
Remunerate Fairly and Responsibly (continued)
Directors can request from management (through the CEO, CFO or the company secretary) whatever information they require
to enable the Board to make informed decisions. As mentioned previously, if necessary, directors may also access independent
professional advice at the company’s expense.
The company secretary is appointed, and can only be removed, by the Board and is accountable to the Board on all governance
matters.
The company’s remuneration policy has been set to ensure that remuneration of all directors and all staff properly refl ects each
person’s accountabilities, duties and their level of performance, and to ensure that remuneration is competitive in attracting,
motivating and retaining staff of the highest quality.
All remuneration packages are reviewed at least annually, taking into account individual and company performance, market
movements and expert advice.
The remuneration of non-executive directors consists of a fi xed fee, with the total payable not exceeding a global limit (currently
$1,500,000) set by shareholders at a General Meeting from time to time. Directors do not receive a fee for their membership of
Committees of the Board.
Directors are not entitled to retirement benefi ts.
The remuneration of the CEO and senior executives comprises the following four elements:
Fixed salary;
Short term incentives;
Long term incentives; and
Superannuation.
Short term incentives are payable based on a formula based on achievement of budget as approved by the Board, achievement
of a defi ned level of out-performance and the assessment of qualitative criteria.
Long term incentives consist of membership of the Mitchell Communication Group Limited Employee Option Plan (now closed)
and membership of the new Mitchell Communication Group Executive Performance Rights Plan.
Details of remuneration paid to directors and senior executives are set out in full in the Directors Report on pages 42 to 51.
58
Corporate governance statement (continued)F
or p
erso
nal u
se o
nly

Financial report – 30 June 2009
This fi nancial report covers both Mitchell Communication Group Limited as an individual entity and the consolidated entity
consisting of Mitchell Communication Group Limited and its controlled entities. The fi nancial report is presented in Australian
currency.
Mitchell Communication Group Limited is a company limited by shares, incorporated and domiciled in Australia. Its registered
offi ce and principal place of business is:
Mitchell Communication Group Limited
Level 4, 111 Cecil Street
South Melbourne Vic 3205
A description of the nature of the Group’s operations and its principal activities is included in the review of operations and
activities on pages 12 to 33 and in the Directors’ Report on pages 36 to 52, both of which are not part of this fi nancial report.
The fi nancial report was authorised for release by the directors on 23 September 2009. The company has the power to amend
and reissue the fi nancial report.
Press releases and other information are available on our website: www.mitchells.com.au
For queries in relation to our reporting please call (03) 9690 5544 or e-mail [email protected]
Contents Page
Financial report – 30 June 2009 60
Income statements 60
Balance sheets 61
Statements of changes in equity 62
Cash fl ow statements 64
Notes to the fi nancial statements 65
Directors’ declaration 114
Independent audit report to the members 115
59
For
per
sona
l use
onl
y

Consolidated Parent entity
2009 2008 2009 2008
Note $’000 $’000 $’000 $’000
Revenues from the rendering of services 5 225,183 187,796 - -
Other revenue 5 963 3,023 28,590 11,473
Total revenues 226,146 190,819 28,590 11,473
Cost of revenue
- Media delivery expenses 120,670 95,869 - -
Total cost of revenue 120,670 95,869 - -
Gross profi t before expenses 105,476 94,950 28,590 11,473
Expenses
- Employee, director and contractor expenses 52,641 44,409 6,521 5,177
- Occupancy expense 5,070 3,585 531 84
- Media research expense 2,735 2,744 - -
- Finance expense 6 2,527 3,655 2,525 3,627
- Travel and accommodation expense 2,254 2,803 362 574
- Accounting, legal and consultant’s expenses 1,563 1,822 1,060 1,236
- Software and infrastructure maintenance expenses 1,168 1,009 187 47
- Communication expense 1,097 943 300 60
- Insurance expense 831 820 120 63
- Other operating expenses 2,971 2,899 482 576
Total expenses 72,857 64,689 12,088 11,444
Share of net losses of joint venture entity accounted for using
the equity method 30 - (13) - -
Profi t before income tax expense, depreciation and
amortisation 32,619 30,248 16,502 29
Depreciation and amortisation expenses 6 5,220 4,600 652 128
Profi t before income tax expense 27,399 25,648 15,850 (99)
Income tax expense/(benefi t) 7 8,081 7,454 (2,375) (2,830)
Profi t after income tax attributable to members of the
company before minority interest 19,318 18,194 18,225 2,731
Minority interest - 633 - -
Profi t after income tax attributable to members of the
company after minority interest 19,318 17,561 18,225 2,731
Basic earnings per share (cents) 32 6.6 6.3
Diluted earnings per share (cents) 32 6.6 6.3
Income statements
For the year-ended 30 June 2009
The above income statements should be read in conjunction with the accompanying notes.
60
For
per
sona
l use
onl
y

Consolidated Parent entity
2009 2008 2009 2008
Note $’000 $’000 $’000 $’000
ASSETS
Current assets
Cash and cash equivalents 8 76,112 73,318 47,242 10,146
Trade and other receivables 9 127,458 146,368 41,688 39,415
Other assets 10 9,139 9,471 533 2,389
Deferred tax assets 13 2,395 1,705 541 424
Total current assets 215,104 230,862 90,004 52,374
Non-current assets
Property and equipment 12 9,999 5,993 1,051 623
Intangible assets 14 215,904 204,741 346 207
Other fi nancial assets 11 - - 207,495 188,127
Deferred tax assets 13 - 77 - 77
Total non-current assets 225,903 210,811 208,892 189,034
Total assets 441,007 441,673 298,896 241,408
LIABILITIES
Current liabilities
Trade and other payables 15 205,408 218,255 2,394 2,275
Provisions 17 3,299 2,268 302 199
Other fi nancial liabilities 16 1,630 6,101 87,814 52,178
Current tax liabilities 2,475 3,902 3,223 4,466
Total current liabilities 212,812 230,526 93,733 59,118
Non-current liabilities
Borrowings 18 73,000 60,000 73,000 60,000
Provisions 17 1,191 989 195 84
Other fi nancial liabilities 16 - 279 - 279
Deferred tax liabilities 19 2,260 2,501 - -
Total non-current liabilities 76,451 63,769 73,195 60,363
Total liabilities 289,263 294,295 166,928 119,481
Net assets 151,744 147,378 131,968 121,927
EQUITY
Contributed equity 20 136,341 133,071 136,341 133,071
Reserves 21(a) (71) (220) 273 163
Retained earnings/(accumulated losses) 21(b) 15,474 7,695 (4,646) (11,307)
Parent entity interest 151,744 140,546 131,968 121,927
Minority interest - 6,832 - -
Total equity 151,744 147,378 131,968 121,927
Balance sheets
As at 30 June 2009
The above balance sheets should be read in conjunction with the accompanying notes.
61
For
per
sona
l use
onl
y

Consolidated June 2008
Issued
capital
Retained
earnings
Equity plan
reserve
Foreign
currency
reserve
Minority
interestTotal
$’000 $’000 $’000 $’000 $’000 $’000
At 1 July 2007 86,944 (1,331) 238 97 25 85,973
Total recognised income and expense for
the period - 17,561 - - 633 18,194
Dividends declared and paid - (8,535) - - - (8,535)
Share consideration on acquisitions 8,178 - - - - 8,178
Share placement and share purchase plan 39,904 - - - - 39,904
Share buy back (923) - - - - (923)
Transaction costs arising on share issues
(net of tax) (1,032) - - - - (1,032)
Minority interest 49% of M&P WA - - - - 6,174 6,174
Foreign currency translation - - - (480) - (480)
Share-based payments - - (75) - - (75)
At 30 June 2008 133,071 7,695 163 (383) 6,832 147,378
Consolidated June 2009
Issued
capital
Retained
earnings
Equity plan
reserve
Foreign
currency
reserve
Minority
interestTotal
$’000 $’000 $’000 $’000 $’000 $’000
At 1 July 2008 133,071 7,695 163 (383) 6,832 147,378
Total recognised income and expense for
the year - 19,318 - - - 19,318
Dividends declared and paid - (11,564) - - - (11,564)
Changes in minority interest - 25 - - (6,832) (6,807)
Share placement and purchase plan 3,139 - - - - 3,139
Share consideration on acquisitions 44 - - - - 44
Transaction costs arising on share issues
(net of tax) (126) - - - - (126)
Foreign currency translation - - - 39 - 39
Share-based payments 213 - 110 - - 323
At 30 June 2009 136,341 15,474 273 (344) - 151,744
Statements of changes in equity
For the year ended 30 June 2009
The above statements of changes in equity should be read in conjunction with the accompanying notes.
62
For
per
sona
l use
onl
y

Parent entity June 2008
Issued capitalRetained
earnings
Equity plan
reserveTotal
$’000 $’000 $’000 $’000
At 1 July 2007 86,944 (5,527) 238 81,655
Total recognised income and expense for
the period - 2,731 - 2,731
Dividends declared and paid - (8,511) - (8,511)
Share placement and purchase plan 39,904 - - 39,904
Share consideration on acquisitions 8,178 - - 8,178
Transaction costs arising on share issues
(net of tax) (1,032) - - (1,032)
Share buy back (923) - - (923)
Share-based payments - - (75) (75)
At 30 June 2008 133,071 (11,307) 163 121,927
Statements of changes in equity (continued)
For the year ended 30 June 2009
The above statements of changes in equity should be read in conjunction with the accompanying notes.
63
Parent entity June 2009
Issued capitalRetained
earnings
Equity plan
reserveTotal
$’000 $’000 $’000 $’000
At 1 July 2008 133,071 (11,307) 163 121,927
Total recognised income and expense for
the year - 18,225 - 18,225
Dividends declared and paid - (11,564) - (11,564)
Share placement and purchase plan 3,139 - - 3,139
Share consideration on acquisitions 44 - - 44
Transaction costs arising on share issues
(net of tax) (126) - - (126)
Share-based payments 213 - 110 323
At 30 June 2009 136,341 (4,646) 273 131,968
For
per
sona
l use
onl
y

Cash fl ow statements
For the year ended 30 June 2009
Consolidated Parent entity
2009 2008 2009 2008
Note $’000 $’000 $’000 $’000
Cash fl ows from operating activities
Cash receipts in the course of operations 1,315,895 1,280,457 6,965 3,197
Cash payments in the course of operations (1,273,532) (1,246,346) (10,902) (6,898)
Income taxes paid (11,399) (7,825) (10,757) (4,688)
Borrowing costs paid (2,508) (3,331) (2,506) (3,302)
Interest received 940 2,976 51 232
Net cash infl ow/(outfl ow) from operating activities 31 29,396 25,931 (17,149) (11,459)
Cash fl ows from investing activities
Payment for investments in controlled entities, net of cash
acquired 28 (24,264) (34,739) (18,208) (15,602)
Payments for property and equipment (5,564) (3,443) (976) (691)
Loans (to)/from related parties (838) 829 66,998 4,835
Proceeds from sale of joint venture 137 274 137 274
Repayment of other loans 6 6 - -
Payments for intangible software assets - (430) (244) (236)
Dividends received - 187 1,984 187
Proceeds from disposal of property and equipment - 35 - -
Investment in joint venture - (13) - (13)
Net cash infl ow/(outfl ow) from investing activities (30,523) (37,294) 49,691 (11,246)
Cash fl ows from fi nancing activities
Proceeds from borrowings 13,000 33,829 13,000 33,829
Dividends paid 22 (9,057) (8,535) (8,424) (8,511)
Share issue costs (22) (928) (22) (928)
Proceeds of issue of shares - 41,189 - 41,189
Share buy back - (923) - (923)
Repayment of borrowings - (61) - -
Repayment of lease liabilities - (1,055) - -
Payment of deferred consideration - (40,414) - (40,414)
Net cash infl ow from fi nancing activities 3,921 23,102 4,554 24,242
Net increase in cash held 2,794 11,739 37,096 1,537
Cash at the beginning of the fi nancial year 73,318 62,100 10,146 8,609
Effects of exchange rate changes on cash and cash
equivalents - (521) - -
Cash at the end of the fi nancial year 8 76,112 73,318 47,242 10,146
The above statements of cash fl ows should be read in conjunction with the accompanying notes.
64
For
per
sona
l use
onl
y

Notes to the fi nancial statements
30 June 2009
Note Contents Page
1 Summary of signifi cant accounting policies 66
2 Financial risk management 73
3 Critical accounting estimates and judgements 75
4 Segment information 76
5 Revenue 79
6 Expenses 79
7 Income tax 80
8 Cash and cash equivalents 81
9 Trade and other receivables 81
10 Other assets 82
11 Other fi nancial assets 83
12 Property and equipment 83
13 Deferred tax assets 85
14 Intangible assets 86
15 Trade and other payables 88
16 Other fi nancial liabilities 88
17 Provisions 89
18 Borrowings 89
19 Deferred tax liabilities 91
20 Contributed equity 92
21 Reserves and retained earnings/(accumulated losses) 94
22 Dividends 95
23 Key management personnel disclosures 96
24 Remuneration of auditors 100
25 Contingencies 100
26 Commitments 100
27 Related parties 101
28 Business combinations 102
29 Investments in controlled entities 107
30 Interests in joint ventures 108
31 Reconciliation of profi t after income tax to net cash infl ow/(outfl ow) from operating activities 108
32 Earnings per share 109
33 Share-based payments 109
34 Events occurring after reporting date 112
35 Deed of cross guarantee 112
65
For
per
sona
l use
onl
y

Notes to the fi nancial statements (continued)
30 June 2009
NOTE 1. SUMMARY OF SIGNIFICANT ACCOUNTING POLICIES
The principal accounting policies adopted in the preparation of the fi nancial report are set out below. These policies have been
consistently applied to all the periods presented, unless otherwise stated. The fi nancial report includes separate fi nancial
statements for Mitchell Communication Group Limited as an individual entity and the consolidated entity consisting of Mitchell
Communication Group Limited and its subsidiaries.
(a) Basis of preparation
This general purpose fi nancial report for the fi nancial year ended 30 June 2009 has been prepared in accordance with Australian
equivalents to International Financial Reporting Standards (AIFRSs), other authoritative pronouncements of the Australian
Accounting Standards Board, Urgent Issues Group and the Corporations Act 2001.
Compliance with IFRSs
Australian Accounting Standards include AIFRSs. Compliance with AIFRSs ensures that the consolidated fi nancial statements
and notes of Mitchell Communication Group Limited comply with International Financial Reporting Standards (IFRSs).
Historical cost convention
These fi nancial statements have been prepared under the historical cost convention.
Critical accounting estimates
The preparation of fi nancial statements in conformity with AIFRS requires the use of certain critical accounting estimates.
It also requires management to exercise its judgement in the process of applying the Group’s accounting policies. The areas
involving a higher degree of judgement or complexity, or areas where assumptions and estimates are signifi cant to the fi nancial
statements are disclosed in note 3.
(b) Principles of consolidation
(i) Subsidiaries
The consolidated fi nancial statements incorporate the assets and liabilities of all subsidiaries of Mitchell Communication Group
Limited (’company’ or ’parent entity’) as at 30 June 2009 and the results of all subsidiaries for the fi nancial year then ended.
Mitchell Communication Group Limited and its subsidiaries together are referred to in this fi nancial report as the Group.
Subsidiaries are all those entities (including special purpose entities) over which the Group has the power to govern the fi nancial
and operating policies, generally accompanying a shareholding of more than one half of the voting rights. The existence and
effect of potential voting rights that are currently exercisable or convertible are considered when assessing whether the Group
controls another entity.
Subsidiaries are fully consolidated from the date on which control is transferred to the Group. They are de-consolidated from
the date that control ceases.
The purchase method of accounting is used to account for the acquisition of subsidiaries by the Group (refer to note 1(h)).
Intercompany transactions, balances and unrealised gains on transactions between Group companies are eliminated.
Unrealised losses are also eliminated unless the transaction provides evidence of the impairment of the asset transferred.
Accounting policies of subsidiaries have been changed where necessary to ensure consistency with the policies adopted by the
Group.
Minority interests in the results and equity of subsidiaries are shown separately in the consolidated income statement and
balance sheet respectively.
(ii) Joint ventures
The interest in a joint venture entity is accounted for in the consolidated fi nancial statements using the equity method and is
carried at cost by the parent entity. Under the equity method, the share of the profi ts or losses of the entity is recognised in the
income statement, and the share of movements in reserves is recognised in reserves in the balance sheet. Details relating to
the joint venture entity are set out in note 30.
Profi ts or losses on transactions establishing the joint venture entity and transactions with the joint venture are eliminated to the
extent of the Group’s ownership interest until such time as they are realised by the joint venture entity on consumption or sale,
unless they relate to an unrealised loss that provides evidence of the impairment of an asset transferred.
66
For
per
sona
l use
onl
y

(c) Foreign currency translation
(i) Functional and presentation currency
Items included in the fi nancial statements of each of the Group’s entities are measured using the currency of the primary
economic environment in which the entity operates (‘the functional currency’). The consolidated fi nancial statements are
presented in Australian dollars, which is Mitchell Communication Group Limited’s functional and presentation currency.
(ii) Transactions and balances
Foreign currency transactions are translated into the functional currency using the exchange rates prevailing at the dates of the
transactions. Foreign exchange gains and losses resulting from the settlement of such transactions and from the translation
at year end exchange rates of monetary assets and liabilities denominated in foreign currencies are recognised in the income
statement.
(iii) Group companies
The results and fi nancial position of all the Group entities that have a functional currency different from the presentation
currency are translated into the presentation currency as follows:
assets and liabilities for each balance sheet presented are translated at the closing rate at the date of that balance sheet;
income and expenses for each income statement are translated at average exchange rates; and
all resulting exchange differences are recognised as a separate component of equity.
Goodwill and fair value adjustments arising on the acquisition of a foreign entity are treated as assets and liabilities of the
foreign entities and translated at the closing rate.
(d) Revenue recognition
Revenue is measured at the fair value of the consideration received or receivable. Intercompany revenue is eliminated based
on commissions earned by the mainstream media segment from sales by the Digital and Diversifi ed segments. Revenue is
recognised for the major business activities as follows:
(i) Media
The Media division acts as agent for its clients. Amounts disclosed as revenue represent the amount earned for planning,
buying and delivering media and is recognised in the period that the media is delivered and it is probable that the revenue will
be received, and are net of payments to media suppliers and rebates of commission to clients and to advertising agencies that
transact with the Group on behalf of their clients.
(ii) Digital
The Digital division acts as a principal and not as an agent in its transactions with clients and suppliers. Amounts disclosed
as revenue and gross billings represent the amount earned for planning, buying and delivering media impressions and
performance activity on third party websites and is recognised in the period that the impression or performance activity is
delivered and it is probable that the revenue will be received. This amount includes the value of the media impressions that are
purchased from third party websites and sold to clients. The Group is liable for the payment to third party websites for the cost
of media impressions and performance activity acquired from those websites.
Gross billings are shown before the deduction of commissions allowed to advertising agencies that transact with the Group on
behalf of their clients. Amounts disclosed as revenue are shown net of these commissions.
(iii) Diversifi ed
Revenue from the delivery of services is recognised upon the delivery of the service. Revenue relating to a specifi c contract is
recognised based over the contract and service period. Income received in advance of the service or contract period is recorded
as unearned revenue. Amounts disclosed as revenue are net of commissions paid to advertising agencies that transact with the
Group on behalf of their clients.
(iv) Interest income
Interest income is recognised on a time proportion basis using the effective interest method.
(e) Deferred revenue
Deferred revenue represents gross billings received in advance for which the media has not yet been delivered. These amounts
are recognised as revenue in accordance with the revenue recognition policy in note 1(d).
67
For
per
sona
l use
onl
y

Notes to the fi nancial statements (continued)
30 June 2009
NOTE 1. SUMMARY OF SIGNIFICANT ACCOUNTING POLICIES (continued)
(f) Income tax
The income tax expense or revenue for the period is the tax payable on the current period’s taxable income based on the
national income tax rate for each jurisdiction adjusted by changes in deferred tax assets and liabilities attributable to temporary
differences between the tax bases of assets and liabilities and their carrying amounts in the fi nancial statements, and to unused
tax losses.
Deferred tax assets and liabilities are recognised for temporary differences at the tax rates expected to apply when the assets
are recovered or liabilities are settled, based on those tax rates which are enacted or substantively enacted for each jurisdiction.
The relevant tax rates are applied to the cumulative amounts of deductible and taxable temporary differences to measure the
deferred tax asset or liability. An exception is made for certain temporary differences arising from the initial recognition of an
asset or a liability. No deferred tax asset or liability is recognised in relation to these temporary differences if they arose in a
transaction, other than a business combination, that at the time of the transaction did not affect either accounting profi t or
taxable profi t or loss.
Deferred tax assets are recognised for deductible temporary differences and unused tax losses only if it is probable that future
taxable amounts will be available to utilise those temporary differences and losses.
Deferred tax liabilities and assets are not recognised for temporary differences between the carrying amount and tax bases
of investments in controlled entities where the parent entity is able to control the timing of the reversal of the temporary
differences and it is probable that the differences will not reverse in the foreseeable future.
Current and deferred tax balances attributable to amounts recognised directly in equity are also recognised directly in equity.
Tax consolidation legislation
Mitchell Communication Group Limited and its wholly owned Australian controlled entities have implemented the tax
consolidation legislation as of 1 July 2006.
The head entity, Mitchell Communication Group Limited, and the controlled entities in the tax consolidated group continue
to account for their own current and deferred tax amounts. These tax amounts are measured as if each entity in the tax
consolidated group continues to be a stand alone taxpayer in its own right.
Mitchell Communication Group Limited has fi nalised a Tax Funding and Sharing Agreement. Under the Agreement the
wholly-owned entities fully compensate Mitchell Communication Group Limited for any current tax payable assumed and are
compensated by Mitchell Communication Group Limited for any current tax receivable and deferred tax assets relating to
unused tax losses or unused tax credits that are transferred to Mitchell Communication Group Limited under tax consolidation
legislation. The funding amounts are determined by reference to the amounts recognised in the wholly owned entities’ fi nancial
accounts.
In addition to its own current and deferred tax amounts, Mitchell Communication Group Limited also recognises the current tax
liabilities (or assets) and the deferred tax assets arising from unused tax losses and unused tax credits assumed from controlled
entities in the tax consolidated group.
Assets or liabilities arising under tax funding agreements with the tax consolidated entities are recognised as amounts
receivable from or payable to other entities in the Group.
Any difference between the amounts assumed and amounts receivable or payable under the tax funding agreement are
recognised as a contribution to (or distribution from) wholly owned tax consolidated entities.
(g) Leases
Leases in which a signifi cant portion of the risks and rewards of ownership are retained by the lessor are classifi ed as operating
leases. Payments made under operating leases (net of any incentives received from the lessor) are charged to the income
statement on a straight line basis over the period of the lease.
68
For
per
sona
l use
onl
y

(h) Business combinations
The purchase method of accounting is used to account for all business combinations, including business combinations involving
entities or businesses under common control regardless of whether equity instruments or other assets are acquired. Cost is
measured as the fair value of the assets given, shares issued or liabilities incurred or assumed at the date of exchange plus
costs directly attributable to the acquisition. Where equity instruments are issued in an acquisition, the value of the instruments
is their published market price as at the date of exchange unless, in rare circumstances, it can be demonstrated that the
published price at the date of exchange is an unreliable indicator of fair value and that other evidence and valuation methods
provide a more reliable measure of fair value. Transaction costs arising on the issue of equity instruments are recognised
directly in equity.
Identifi able assets acquired and liabilities and contingent liabilities assumed in a business combination are measured initially
at their fair values at the acquisition date, irrespective of the extent of any minority interest. The excess of the cost of acquisition
over the fair value of the Group’s share of the identifi able net assets acquired is recorded as goodwill (refer to note 1(p)). If the
cost of acquisition is less than the fair value of the net assets of the subsidiary acquired, the difference is recognised directly in
the income statement, but only after a reassessment of the identifi cation and measurement of the net assets acquired.
Where settlement of any part of cash consideration is deferred, the amounts payable in the future are discounted to their
present value as at the date of exchange. The discount rate used is the entity’s incremental borrowing rate, being the rate at
which a similar borrowing could be obtained from an independent fi nancier under comparable terms and conditions.
(i) Impairment of assets
Assets that have an indefi nite useful life are not subject to amortisation and are tested annually for impairment. Assets that are
subject to amortisation are reviewed for impairment whenever events or changes in circumstances indicate that the carrying
amount may not be recoverable. An impairment loss is recognised for the amount by which the asset’s carrying amount exceeds
its recoverable amount. The recoverable amount is the higher of an asset’s fair value less costs to sell and value in use. For the
purposes of assessing impairment, assets are grouped at the lowest levels for which there are separately identifi able cash fl ows
(cash-generating units).
(j) Cash and cash equivalents
Cash and cash equivalents includes cash on hand, deposits held at call with fi nancial institutions, and other short term, highly
liquid investments with original maturities of three months or less that are instantly convertible to known amounts of cash and
which are subject to no risk of changes in value.
(k) Trade and other receivables
Trade receivables are recognised initially at fair value and subsequently measured at amortised cost, less provision for doubtful
debts. Trade receivables are due for settlement no more than 45 days from the date of recognition.
Collectability of trade receivables is reviewed on an ongoing basis. Debts which are known to be uncollectible are written off
by reducing the carrying amount directly. An allowance account (provision for impairment of trade receivables) is established
when there is objective evidence that the Group will not be able to collect all amounts due according to the original terms
of receivables. Signifi cant fi nancial diffi culties of the debtor, probability the debtor will enter bankruptcy or fi nancial
reorganisation, and defaults on payment arrangements are considered indicators that the trade receivable is impaired. The
amount of the provision is the difference between the asset’s carrying amount and the present value of estimated future cash
fl ows, discounted at the effective interest rate. Cash fl ows relating to short term receivables are not discounted if the effect of
discounting is immaterial.
The amount of the impairment loss is recognised in the income statement within other expenses. When a trade receivable for
which an impairment allowance had been recognised becomes uncollectible in a subsequent period, it is written off against the
allowance account. Subsequent recoveries of amounts previously written off are credited against other expenses in the income
statement.
(l) Investments and other fi nancial assets
The Group classifi es its investments as loans and receivables. The classifi cation depends on the purpose for which the
investments were acquired. Management determines the classifi cation of its investments at initial recognition and re evaluates
this designation at each reporting date.
(i) Loans and receivables
Loans and receivables are non derivative fi nancial assets with fi xed or determinable payments that are not quoted in an active
market. They arise when the Group provides money, goods or services directly to a debtor with no intention of selling the
receivable. They are included in current assets, except for those with maturities greater than 12 months after the balance sheet
date which are classifi ed as non current assets. Loans and receivables are included in receivables in the balance sheet.
69
For
per
sona
l use
onl
y

Notes to the fi nancial statements (continued)
30 June 2009
NOTE 1. SUMMARY OF SIGNIFICANT ACCOUNTING POLICIES (continued)
(m) Fair value estimation
The fair value of fi nancial assets and fi nancial liabilities must be estimated for recognition and measurement, or for disclosure
purposes.
The nominal value less estimated credit adjustments of trade receivables and payables are assumed to approximate their fair
values. The fair value of fi nancial liabilities for disclosure purposes is estimated by discounting the future contractual cash fl ows
at the current market interest rate that is available to the Group for similar fi nancial instruments.
(n) Property and equipment
Property and equipment is stated at historical cost less depreciation. Historical cost includes expenditure that is directly
attributable to the acquisition of the items.
Subsequent costs are included in the asset’s carrying amount or recognised as a separate asset, as appropriate, only when it is
probable that future economic benefi ts associated with the item will fl ow to the Group and the cost of the item can be measured
reliably. All other repairs and maintenance are charged to the income statement during the fi nancial period in which they are
incurred.
Depreciation on assets is calculated using the straight line method to allocate their cost, net of their residual values, over their
estimated useful lives, as follows:
Plant and equipment 3-10 years
Furniture and fi ttings 5-10 years
The assets’ residual values and useful lives are reviewed, and adjusted if appropriate, at each balance sheet date.
An asset’s carrying amount is written down immediately to its recoverable amount if the asset’s carrying amount is greater than
its estimated recoverable amount (note 1(i)).
Gains and losses on disposals are determined by comparing proceeds with carrying amount. These are included in the income
statement.
(o) Leasehold improvements
The cost of improvements to or on leasehold properties is amortised over the unexpired period of the lease or the estimated
useful life of the improvements to the Group, whichever is the shorter. Leasehold improvements held at the reporting date are
being amortised over between 3 and 5 years.
(p) Intangible assets
(i) Goodwill
Goodwill represents the excess of the cost of an acquisition over the fair value of the Group’s share of the net identifi able assets
of the acquired subsidiary/associate at the date of acquisition. Goodwill on the acquisition of subsidiaries would be included
in intangible assets. Goodwill on acquisitions of associates would be included in investments in associates. Goodwill acquired
in business combinations will not be amortised. Instead, goodwill will be tested for impairment annually or more frequently
if events or changes in circumstances indicate that it might be impaired, and is carried at cost less accumulated impairment
losses. Gains and losses on the disposal of an entity include the carrying amount of goodwill relating to the entity sold.
Goodwill is allocated to cash generating units for the purpose of impairment testing.
(ii) Software
Software has a fi nite useful life and is carried at cost less accumulated amortisation and impairment losses. Amortisation is
calculated using the straight-line method to allocate the cost of the software over its estimated useful life, which is currently
between 3 and 4 years.
(iii) Brand names
Brand names recognised by the company have an indefi nite useful life and are not amortised. Each period, the useful life of the
asset is reviewed to determine whether events and circumstances continue to support an indefi nite useful life assessment for
the asset.
70
For
per
sona
l use
onl
y

(iv) Customer related
Customer contracts acquired as part of a business combination are recognised separately from goodwill. The customer
relationships are carried at their fair value at the date of acquisition less accumulated amortisation and impairment losses.
Amortisation is calculated based on the timing of projected cash fl ows of the contracts over their estimated useful lives, which
currently vary from 3 to 10 years.
(v) Stadia rights
Stadia rights acquired as part of a business combination had a fi nite useful life and were carried at their fair value at the date
of acquisition less accumulated amortisation and impairment losses. Amortisation was calculated based on the timing of
projected cash fl ows of the rights over their estimated useful lives, which varied between 6 to 18 months. Stadia rights were fully
amortised at 30 June 2009.
(q) Trade and other payables
These amounts represent liabilities for goods and services provided to the Group prior to the end of fi nancial year which are
unpaid. The amounts are unsecured and are usually paid within 45 days of recognition.
(r) Borrowings
Borrowings are initially recognised at fair value, net of transaction costs incurred. Borrowings are subsequently measured at
amortised cost. Any difference between the proceeds (net of transaction costs) and the redemption amount is recognised in the
income statement over the period of the borrowings using the effective interest method. Fees paid on the establishment of loan
facilities, which are not incremental costs relating to the actual draw down of the facility, are recognised as prepayments and
amortised on a straight line basis over the term of the facility.
Borrowings are removed from the balance sheet when the obligation specifi ed in the contract is discharged, cancelled or
expired. The difference between the carrying amount of a fi nancial liability that has been extinguished or transferred to another
party and the consideration paid, including and non-cash assets transferred or liabilities assumed, is recognised in other
income or other expenses.
Borrowings are classifi ed as current liabilities unless the Group has an unconditional right to defer settlement of the liability for
at least 12 months after the balance sheet date.
(s) Employee benefi ts
(i) Wages and salaries, annual leave and sick leave
Liabilities for wages and salaries, including non monetary benefi ts and annual leave expected to be settled within 12 months of
the reporting date are recognised in payables in respect of employees’ services up to the reporting date and are measured at the
amounts expected to be paid when the liabilities are settled. Liabilities for non accumulating sick leave are recognised when the
leave is taken and measured at the rates paid or payable.
(ii) Long service leave
The liability for long service leave is recognised in provisions and measured as the present value of expected future payments to
be made in respect of services provided by employees up to the reporting date. Consideration is given to expected future wage
and salary levels, experience of employee departures and periods of service. Expected future payments are discounted using
market yields at the reporting date on national government bonds with terms to maturity and currency that match, as closely as
possible, the estimated future cash outfl ows.
(iii) Share-based payments
Equity based compensation benefi ts have been provided to employees via the Mitchell Communication Group Limited Employee
Option Plan (‘option plan’) and the Mitchell Communication Group Performance Rights Plan (‘performance rights plan’). The
option plan has been closed and no new grants will be made in future.
Performance rights plan
The performance rights are structured as zero exercise price options. Specifi cally, in the event that the performance conditions
associated with the performance rights are satisfi ed, the recipient is entitled to convert the performance rights to shares at
no cost. All grants of performance rights vest to shares over a 3 year period, subject to vesting conditions and performance
hurdles. The performance conditions comprise Total Shareholder Return (‘TSR’) and Earnings Per Share (‘EPS’).
The fair value of performance rights granted under the rights plan is recognised as an employee benefi t expense with a
corresponding increase in equity. The fair value is measured at grant date and recognised over the period during which the
performance rights vest.
71
For
per
sona
l use
onl
y

Notes to the fi nancial statements (continued)
30 June 2009
NOTE 1. SUMMARY OF SIGNIFICANT ACCOUNTING POLICIES (continued)
(s) Employee benefi ts (continued)
Performance rights plan (continued)
The fair value at grant date is independently determined using the Monte Carlo approach. The Monte Carlo approach simulates
many time-series paths of the underlying asset assuming that share price evolves according to the geometric Brownian motion
model, a model that assumes that continuously-compounded returns are normally distributed.
Option plan
The fair value of options granted under the option plan is recognised as an employee benefi t expense with a corresponding
increase in equity. The fair value is measured at grant date and recognised over the period during which the employees become
unconditionally entitled to the options.
The fair value at grant date is independently determined using an enhanced Hull-White Trinomial Lattice option pricing model
that takes into account the exercise price, the term of the option, the vesting, the impact of dilution, the non tradeable nature of
the option, the share price at grant date and expected price volatility of the underlying share, the expected dividend yield and the
risk free interest rate for the term of the option. Upon the exercise of options, the balance of the share based payments reserve
relating to those options is transferred to share capital.
(iv) Bonus plans
The Group recognises a liability and an expense for bonuses based on certain bonus criteria. The Group recognises a provision
where contractually obliged or where there is a past practice that has created a constructive obligation and a reliable estimation
of the obligation can be made.
(t) Contributed equity
Ordinary shares are classifi ed as equity. Incremental costs directly attributable to the issue of new shares or options are shown
in equity as a deduction, net of tax, from the proceeds. Incremental costs directly attributable to the issue of new shares or
options are not included in the cost of the acquisition as part of the purchase consideration.
If the entity re-acquires its own equity instruments, for example as the result of a share buy-back, those instruments are
deducted from equity and the associated shares are cancelled. No gain or loss is recognised in the profi t or loss and the
consideration paid including any directly attributable incremental costs (net of income taxes) is recognised directly in equity.
(u) Dividends
Provision is made for the amount of any dividend declared, being appropriately authorised and no longer at the discretion of the
entity, on or before the end of the fi nancial year but not distributed at balance date.
(v) Earnings per share
(i) Basic earnings per share
Basic earnings per share is calculated by dividing the profi t attributable to equity holders of the company, excluding any costs of
servicing equity other than ordinary shares, by the weighted average number of ordinary shares outstanding during the fi nancial
year, adjusted for bonus elements in ordinary shares issued during the fi nancial year.
(ii) Diluted earnings per share
Diluted earnings per share adjusts the fi gures used in the determination of basic earnings per share to take into account the
after income tax effect of interest and other fi nancing costs associated with dilutive potential ordinary shares and the weighted
average number of shares assumed to have been issued for no consideration in relation to dilutive potential ordinary shares.
(w) Segment reporting
A business segment is a group of assets and operations engaged in providing services that are subject to risks and returns that
are different to those of other business segments. A geographical segment is engaged in providing products or services within
a particular economic environment and is subject to risks and returns that are different from those segments operating in other
economic environments.
72
For
per
sona
l use
onl
y

(x) Goods and Services Tax (GST)
Revenues, expenses and assets are recognised net of the amount of associated GST, unless the GST incurred is not recoverable
from the taxation authority. In this case it is recognised as part of the cost of acquisition of the asset or as part of the expense.
Receivables and payables are stated inclusive of the amount of GST receivable or payable. The net amount of GST recoverable
from, or payable to, the taxation authority is included with other receivables or payables in the balance sheet.
Cash fl ows are presented on a gross basis. The GST components of cash fl ows arising from investing or fi nancing activities
which are recoverable from, or payable to the taxation authority, are presented as operating cash fl ow.
(y) Rounding of amounts
The company is of a kind referred to in Class order 98/0100, issued by the Australian Securities and Investments Commission,
relating to the ‘’rounding off’’ of amounts in the fi nancial report. Amounts in the fi nancial report have been rounded off in
accordance with that Class Order to the nearest thousand dollars, or in certain cases, the nearest dollar.
(z) New accounting standards and UIG interpretations
The following standards, amendments to standards and interpretations have been identifi ed as those which may impact the
entity in the period of initial application. They are available for early adoption at 30 June 2009, however have not been applied in
preparing this fi nancial report.
(i) AASB 3 Business Combinations
The revised AASB 3 incorporates the following changes that are likely to be relevant to the Group’s operations: transaction costs,
other than share and debt issue costs will be expensed as incurred; and contingent consideration will be measured at fair value,
with subsequent changes therein recognised in profi t and loss. The revised AASB 3, which becomes mandatory for the Group’s
30 June 2010 fi nancial statements, will be applied prospectively and therefore there will be no impact on prior periods in the
Group’s 2010 consolidated fi nancial statement.
(ii) AASB 8 Operating Segments
The revised AASB 8 becomes mandatory for the Group’s 30 June 2010 fi nancial statements and introduces the ‘management
approach’ to segment reporting. Application of the standard will not affect any of the amounts recognised in the fi nancial
statements, but may impact the nature of information disclosed in relation to the Group’s operating segments.
(iii) AASB 101 Presentation of Financial Statements
The revised AASB 101 introduces the term total comprehensive income, which represents changes in equity during a period
other than those changes resulting from transactions with owners in their capacity as owners. Revised AASB 101, which
becomes mandatory for the Group’s 30 June 2010 fi nancial statements, will not have any impact on the amounts recognised in
the fi nancial statements, but is expected to have an impact on the presentation of the consolidated fi nancial statements.
(iv) AASB 123 Borrowing Costs
The revised AASB 123 removes the option to expense borrowing costs and requires that an entity capitalise borrowing costs
directly attributable to acquisitions. The revised AASB 123 will become mandatory for the Group’s 30 June 2010 fi nancial
statements and in accordance with the transitional provisions the Group will apply the revised standard on or after the effective
date. Therefore, there will be no impact on prior periods in the Group’s 30 June 2010 fi nancial statements.
NOTE 2. FINANCIAL RISK MANAGEMENT
The Group’s activities expose it to a variety of fi nancial risks; market risk (including currency risk and fair value interest rate
risk), credit risk, liquidity risk and cash fl ow interest rate risk. The Group’s overall risk management program focuses on the
unpredictability of fi nancial markets and seeks to minimise potential adverse effects on the fi nancial performance of the Group.
The Group uses different methods to measure different types of risk to which it is exposed. These methods include sensitivity
analysis for interest rate and currency risk, and aging analysis for credit risk.
Risk management is carried out by the Chief Financial Offi cer under direction of the Board of directors.
73
For
per
sona
l use
onl
y

30 June 2009 30 June 2008
Weighted
average
interest rate
Balance
Weighted
average
interest rate
Balance
% $’000 % $’000
Bank loans 3.73 73,000 8.13 60,000
Notes to the fi nancial statements (continued)
30 June 2009
NOTE 2. FINANCIAL RISK MANAGEMENT (continued)
(a) Market risk
(i) Foreign exchange risk
Foreign exchange risk arises when future commercial transactions and recognised assets and liabilities are denominated in
a currency that is not the entity’s functional currency.
The Group operates internationally and is exposed to foreign exchange risk arising from currency exposures to the New Zealand
dollar.
The international operations act as a natural hedge, with the only risk arising on translation to functional currency. No hedges
are in place for this translation risk on the basis of materiality. The carrying amounts of the parent entities fi nancial assets and
liabilities are wholly denominated in Australian dollars.
(ii) Cash fl ow and fair value interest rate risk
The Group holds its funds in cash and term deposits. Term deposit maturity dates are based on future operating cash fl ow
requirements. The value and term of the cash and deposits are such that the Group’s income and operating cash fl ows are not
materially exposed to changes in market interest rates.
The Group’s interest rate risk arises from long term borrowings. Borrowings issued at variable rates expose the Group to cash
fl ow interest rate risk. There is currently no Group policy to fi x interest-rates. As at the reporting date, the Group had the
following variable rate borrowings denominated wholly in Australian Dollars:
(iii) Cash fl ow and fair value interest rate
The Group manages its interest rate exposure by actively managing excess cash balances to reduce the outstanding debt
balances. Interest rates on cash balances and borrowings are based on short-term money markets and act as a natural hedge
against interest rate movements. Cash on hand at 30 June 2009 held as a natural hedge was $76.1 million.
Group sensitivity
At 30 June 2009, if interest rates had changed by +/- 100 basis points from the year end rates with all other variables held
constant, post tax profi t for the year would have been $33,000 lower/higher (2008: change of +/- 100 bps: $19,000 higher/lower),
mainly as a result of higher interest expense on borrowing offset by higher interest revenue on bank deposits.
(b) Credit risk
Credit risk is managed on a segment basis. Credit risk arises from cash and cash equivalents as well as credit exposures on
clients, including outstanding receivables and commitments. The Group holds a mercantile insurance policy over the trade
receivable debts with the exception of related parties and government-related customers in the Media and Digital segments.
The Group is responsible for a deductible amount under the policy, which ranges from nil to $250,000 in aggregate. The
insurance policy has minimum coverage levels and where the client spend is expected to fall beneath this level, the Group has
policies in place to ensure that appropriate checks are made to customer’s credit history, including checking trade references
and obtaining a clear adverse credit report. Client insurance limits are regularly checked against outstanding commitments
with adjustments made to credit limits as necessary.
74
For
per
sona
l use
onl
y

Consolidated Parent entity
2009 2008 2009 2008
$’000 $’000 $’000 $’000
Trade receivables
- Covered by credit insurance policy 87,059 106,518 - 292
- Uninsurable trade receivables 15,563 13,748 - -
- Not covered by credit insurance policy – Media and Digital 6,007 9,528 - -
- Not covered by credit insurance policy – Diversifi ed and Corporate 10,268 9,386 124 -
Total 118,897 139,180 124 292
The maximum exposure to credit risk at the reporting date is the carrying amount of the fi nancial assets. Refer to note 8 and 9
for further details. The credit quality of fi nancial assets that are neither past due nor impaired can be assessed by reference to
the level of insurance coverage held:
The majority of the Media and Digital receivables not covered by insurance relate to clients where coverage is pending, or where
increased limits are being sought. Uninsurable trade receivables relate to government clients which are not able to be covered
by insurance.
(c) Liquidity risk
Prudent liquidity risk management implies maintaining suffi cient cash balances to cover working capital needs, with excess
funds used to pay down debt or invested. These invested funds have varying maturity dates set with regards to potential cash
fl ow needs, with the ability to access the funds at any time. The Group has the availability of funding through an adequate
amount of undrawn credit facilities – refer note 18. For details of the maturity profi le of fi nancial liabilities refer note 18.
(d) Cash fl ow and fair value interest rate risk
The Group holds its funds in cash, term deposits and 11am deposits. The value and term of the cash and deposits are such
that the Group’s income and operating cash fl ows are not materially exposed to changes in market interest rates. The Group’s
interest rate risk arises from long term borrowings. Borrowings issued at variable rates expose the Group to cash fl ow interest
rate risk. There is currently no Group policy to fi x interest rates.
NOTE 3. CRITICAL ACCOUNTING ESTIMATES AND JUDGEMENTS
Estimates and judgements are continually evaluated and are based on historical experience and other factors, including
expectations of future events that may have a fi nancial impact on the entity and that are believed to be reasonable under the
circumstances.
(a) Critical accounting estimates
The Group makes estimates and assumptions concerning the future. The resulting accounting estimates will, by defi nition,
seldom equal the related actual results. The estimates and assumptions that have a signifi cant risk of causing a material
adjustment to the carrying amounts of assets and liabilities within the next fi nancial year are discussed below.
(i) Estimated impairment of goodwill and other indefi nite life intangible assets
The Group tests annually whether goodwill and other indefi nite life intangible assets have suffered any impairment, in
accordance with the accounting policy stated in note 1(p). The recoverable amounts of cash generating units (CGU’s) have been
determined based on value in use calculations. These calculations require the use of assumptions. Refer to note 14 for details
of these assumptions. Management does not consider a change in any key assumptions will have a signifi cant risk of causing a
material adjustment to the carrying amount of the goodwill due to the large excess of value-in-use over the carrying amount of
the CGU’s.
(b) Critical accounting judgements
(i) Revenue recognition
The Group has made the judgement to recognise revenue from the Media division on an agency basis, while revenue from
the Digital and Diversifi ed segments is recognised as principal. Refer to note 1(d) for further details regarding the revenue
recognition policy of the Group.
75
For
per
sona
l use
onl
y

Notes to the fi nancial statements (continued)
30 June 2009
NOTE 4. SEGMENT INFORMATION
Business segments
The Group is organised on a global basis into the following divisions by product and service type:
Media: The provision of services to clients for communications strategies and the planning and buying of traditional media.
Digital: The provision of services to clients for interactive marketing and communications strategies and the planning and
buying of interactive media and digital creative production.
Diversifi ed: The development and implementation of communications campaigns across a broad range of disciplines
including public relations, experimental marketing, brand experience, sponsorship, sports ground marketing, direct
marketing, corporate social responsibility, video and event production services, application development and automated ad
templating, qualitative and quantitative research, marketing analytics, communication planning tools and processes.
Corporate Central Services: The corporate and fi nancial control functions of running the Group, including Group
management, fi nance, human resources, information technology and administration activities.
Geographical segments
Although the Group is managed on a global basis, it operates in two geographical areas:
Australia: The home country of the parent entity, which is also the main operating entity. The areas of operation are
principally Media, Digital, Diversifi ed and Corporate Central Services.
New Zealand: Includes operations in the Media and Digital.
76
For
per
sona
l use
onl
y

77
BALANCE SHEET 2009 2008 2009 2008 2009 2008 2009 2008 2009 2008
$’000 $’000 $’000 $’000 $’000 $’000 $’000 $’000 $’000 $’000
Assets
Segment assets 249,127 296,420 38,976 43,273 104,278 88,877 48,626 13,103 441,007 441,673
Liabilities
Segment liabilities 171,256 185,441 28,066 29,073 8,957 11,571 80,984 68,210 289,263 294,295
Consolidated net assets 77,871 110,979 10,910 14,200 95,321 77,306 (32,358) (55,107) 151,744 147,378
Primary reporting segment
– Business segmentsMedia Digital Diversifi ed
Corporate
central servicesConsolidated
2009 2008 2009 2008 2009 2008 2009 2008 2009 2008
INCOME STATEMENT $’000 $’000 $’000 $’000 $’000 $’000 $’000 $’000 $’000 $’000
Revenue
Revenue from the rendering
of services 39,712 38,251 131,261 109,581 54,210 39,964 - - 225,183 187,796
Segment result
Profi t/(loss) before interest,
income tax, depreciation and
amortisation 9,322 9,045 20,083 16,797 9,637 9,602 (4,836) (4,517) 34,206 30,927
Depreciation of property and
equipment (765) (556) (562) (377) (915) (445) (489) (99) (2,731) (1,477)
Amortisation of intangible
assets (663) (655) (1,245) (1,257) (418) (1,182) (163) (29) (2,489) (3,123)
Profi t/(loss) before interest
and income tax 7,894 7,834 18,276 15,163 8,304 7,975 (5,488) (4,645) 28,986 26,327
Interest revenue 940 2,976
Interest expense (2,527) (3,655)
Profi t before income tax 27,399 25,648
Income tax expense (8,081) (7,454)
Net profi t after income tax
attributable to members of
the company before minority
interest 19,318 18,194
Minority interest - 633
Net profi t after income tax
attributable to members of
the company after minority
interest 19,318 17,561
Non-cash expenses other
than depreciation and
amortisation 588 (124) (3) 72 181 44 110 75 876 67
For
per
sona
l use
onl
y

78
Notes to the fi nancial statements (continued)
30 June 2009
NOTE 4. SEGMENT INFORMATION (continued)
Secondary reporting segment – Geographical
segmentsAustralia New Zealand Consolidated
2009 2008 2009 2008 2009 2008
INCOME STATEMENT $’000 $’000 $’000 $’000 $’000 $’000
Revenue
Revenue from the rendering of services 214,901 171,074 10,282 16,722 225,183 187,796
Segment result
Profi t/(loss) before interest, income tax,
depreciation and amortisation 34,474 29,571 (268) 1,356 34,206 30,927
Depreciation of property and equipment (2,657) (1,453) (74) (24) (2,731) (1,477)
Amortisation of intangible assets (2,414) (3,048) (75) (75) (2,489) (3,123)
Profi t/(loss) before interest and income tax 29,403 25,070 (417) 1,257 28,986 26,327
Interest revenue 940 2,976
Interest expense (2,527) (3,655)
Profi t before tax 27,399 25,648
Income tax expense (8,081) (7,454)
Net profi t after income tax attributable to
members of the company before minority
interest 19,318 18,194
Minority interest - 633
Net profi t after income tax attributable to
members of the company after minority
interest 19,318 17,561
2009 2008 2009 2008 2009 2008
BALANCE SHEET $’000 $’000 $’000 $’000 $’000 $’000
Assets
Segment assets 425,159 422,105 15,848 19,568 441,007 441,673
Liabilities
Segment liabilities 285,471 287,312 3,792 6,983 289,263 294,295
Consolidated net assets 139,688 134,793 12,056 12,585 151,744 147,378
For
per
sona
l use
onl
y

79
Consolidated Parent entity
2009 2008 2009 2008
$’000 $’000 $’000 $’000
Revenues
Revenue from the rendering of services 225,183 187,796 - -
Other revenue
Interest received 940 2,976 149 232
Dividends received - - 23,443 8,250
Management fees - - 4,998 2,991
Foreign exchange gains (net) 23 47 - -
963 3,023 28,950 11,473
Revenue from continuing operations 226,146 190,819 28,950 11,473
NOTE 5. REVENUE
Profi t before income tax expense includes the following specifi c
expenses:Consolidated Parent entity
2009 2008 2009 2008
$’000 $’000 $’000 $’000
Expenses
Depreciation
Property and equipment 1,884 955 470 98
Furniture and fi ttings 193 191 6 1
Leasehold improvements 517 187 13 -
Plant and equipment under fi nance leases 124 133 - -
Motor vehicles 13 11 - -
Total depreciation 2,731 1,477 489 99
Amortisation
Customer related 1,602 1,544 - -
Software 729 620 163 29
Stadia rights 158 959 - -
Total amortisation 2,489 3,123 163 29
Total depreciation and amortisation 5,220 4,600 652 128
Finance costs
Interest and fi nance charges paid/payable 2,527 3,655 2,525 3,627
Finance costs expensed 2,527 3,655 2,525 3,627
Net loss on disposal of property, plant and equipment 65 115 - -
Rental expense relating to operating leases
Minimum lease payments 4,305 2,953 429 43
Defi ned contribution superannuanuation expense 3,887 3,411 401 294
NOTE 6. EXPENSES
For
per
sona
l use
onl
y

Consolidated Parent entity
2009 2008 2009 2008
$’000 $’000 $’000 $’000
(a) Income tax expense
Current tax – relating to current year 9,555 7,855 (2,482) (2,770)
Current tax - under/(over) provision in prior year 42 114 79 (70)
Deferred tax – origination and reversal of timing differences (1,516) (515) 28 10
Aggregate income tax expense/(benefi t) 8,081 7,454 (2,375) (2,830)
Deferred income tax expense/(benefi t) included in income tax
expense comprises:
- (Increase)/decrease in deferred tax assets (704) (341) 28 10
- (Decrease) in deferred tax liabilities (812) (174) - -
(1,516) (515) 28 10
(b) Reconciliation of prima facie income tax expense calculated
at 30% (2008: 30%)
Profi t from continuing operations before income tax expense 27,399 25,648 15,850 (99)
Income tax expense calculated at 30% (2008: 30%) 8,220 7,695 4,755 (30)
Increase in income tax expense due to:
- Expenditure not deductible for tax purposes 107 142 110 25
- Difference in overseas tax rates - 45 - -
- Under/(over) provision in prior year 42 114 79 (70)
Decrease in income tax due to:
- Deductible acquisition costs (286) (280) (286) (280)
- Non-taxable dividends - - (7,033) (2,475)
- Tax losses not recognised in deferred tax assets (2) 24 - -
- Other - (286) - -
Income tax expense for the year 8,081 7,454 (2,375) (2,830)
(c) Amounts recognised directly in equity
Aggregate current and deferred tax arising in the reporting period
and not recognised in net profi t or loss but directly credited or
debited to equity.
Net deferred tax debited directly to equity 104 104 104 104
(d) Tax losses
Unused tax losses for which no deferred tax asset has been
recognised 121 277 - -
Potential tax benefi t @ 30% 36 83 - -
Differences in overseas tax rates - 3 - -
Total potential tax benefi t 36 86 - -
(e) Unrecognised deductible temporary differences
Unrealised foreign exchange loss – New Zealand subsidiary - 24 - -
Notes to the fi nancial statements (continued)
30 June 2009
NOTE 7. INCOME TAX
80
For
per
sona
l use
onl
y

Consolidated Parent entity
2009 2008 2009 2008
Note $’000 $’000 $’000 $’000
Trade receivables (a) 128,153 146,694 670 292
Less: Provision for impaired receivables (b) (695) (326) - -
127,458 146,368 670 292
Loans to related parties * - - 45,877 43,982
Less: Provision for impairment of related party receivable - - (4,859) (4,859)
- - 41,018 39,123
Total 127,458 146,368 41,688 39,415
81
(f) Tax consolidation legislation
Mitchell Communication Group Limited and its wholly owned Australian controlled entities have implemented the tax
consolidation legislation as of 1 July 2006. The wholly owned Australian controlled entities in the Mitchell & Partners
acquisition joined the Group on 1 April 2007. Other acquired entities join the Group on the date of their acquisition. The
accounting policy in relation to this legislation is set out in note 1(f).
The entities in the tax consolidated group have entered into tax sharing agreements which, in the opinion of the directors, limits
the joint and several liability of the wholly owned entities in the case of a default by the head entity, Mitchell Communication
Group Limited.
The entities have also entered into a tax funding agreement under which the wholly owned entities fully compensate Mitchell
Communication Group Limited for any current tax payable assumed and are compensated by Mitchell Communication Group
Limited for any current tax receivable and deferred tax assets relating to unused tax losses or unused tax credits that are
transferred to Mitchell Communication Group Limited under the tax consolidation legislation. The funding amounts are
determined by reference to the amounts recognised in the wholly owned entities’ fi nancial statements.
The amounts receivable/payable under the tax funding agreement are due upon receipt of the funding advice from the head
entity, which is issued as soon as practicable after the end of each fi nancial year. The head entity may also require payment of
interim funding amounts to assist with its obligations to pay tax instalments. The funding amounts are recognised as current
intercompany receivables or payables.
NOTE 8. CASH AND CASH EQUIVALENTS
(a) Cash at bank and on hand
The cash at bank and on hand is bearing a fl oating interest rate from 2.25% to 3.0% (2008: 0% to 7.0%).
(b) Deposits at call
The deposits are bearing fl oating interest rates of 3.70% (2008: 4.55% to 7.40%). Deposits at call in New Zealand of $1.956
million (2008: $2.072 million) are bearing fl oating interest rates of between 3.15% to 8.50% (2008: 8.0% to 8.9%)
NOTE 9. TRADE AND OTHER RECEIVABLES
* Further information relating to loans to related parties is set out in note 27.
Consolidated Parent entity
2009 2008 2009 2008
$’000 $’000 $’000 $’000
Cash at bank and on hand 74,090 71,176 47,242 10,146
Deposits at call 2,022 2,142 - -
Total 76,112 73,318 47,242 10,146
For
per
sona
l use
onl
y

Notes to the fi nancial statements (continued)
30 June 2009
NOTE 9. TRADE AND OTHER RECEIVABLES (continued)
(a) Trade receivables
The average credit period on sale of services is 45 days. Material credit risk on trade receivables is covered by a comprehensive
mercantile insurance policy, refer note 2(b) for further detail.
Before accepting new media customers, the Group applies for mercantile insurance against the potential debt. Where the
debtor falls below the insurable limit, or does not receive coverage, the Group performs a background credit check to determine
the potential customers’ credit quality and then defi nes the credit limits for that customer. Limits attributed to customers are
reviewed regularly.
(b) Impaired trade receivables
Included in the Group’s trade receivable balance are debtors with a carrying amount of $8.6m (2008: $7.2m) which are past due
at the reporting date and for which the Group has not provided for, as the amounts are considered recoverable.
NOTE 11. CURRENT ASSETS – OTHER ASSETS Consolidated Parent entity
2009 2008 2009 2008
$’000 $’000 $’000 $’000
Prepayments 4,319 6,234 220 146
Accrued revenue 1,034 342 - -
Inventory 571 456 - -
Loans to joint venture entities 8 16 8 1
Other assets 3,207 2,423 305 2,242
Total 9,139 9,471 533 2,389
82
Consolidated Parent entity
2009 2008 2009 2008
$’000 $’000 $’000 $’000
Ageing past due but not impaired:
60 – 90 days 4,016 5,000 9 -
90 – 120 days 1,514 1,877 73 -
120+ days 3,031 311 - -
Total 8,561 7,188 82 -
Movement in the provision for impaired receivables:
Opening balance 326 517 - 34
Acquired balance 40 15 - -
Impairment losses recognised on receivables 765 162 - -
Amounts written off as not collectible (436) (15) - -
Amounts recovered during the year - 5 - -
Transfer to Group entity - - - (34)
Impairment losses reversed - (358) - -
Balance at the end of the year 695 326 - -
Ageing of impaired trade receivables:
60 – 90 days 27 4 - -
90 – 120 days 49 12 - -
120+ days 619 310 - -
Total 695 326 - -
NOTE 10. OTHER ASSETS
For
per
sona
l use
onl
y

Plant &
equipment
Furniture &
fi ttings
Leasehold
improve-
ments
Leased
plant &
equipment
Motor
vehiclesTotal
Consolidated $’000 $’000 $’000 $’000 $’000 $’000
At 1 July 2007
Cost 6,419 1,527 614 128 52 8,740
Less: accumulated depreciation (4,259) (987) (301) (118) (52) (5,717)
Net book amount 2,160 540 313 10 - 3,023
Year ended 30 June 2008:
Additions 1,860 620 903 - 11 3,394
Acquisition of subsidiary 552 75 77 451 52 1,207
Disposals (87) (42) (5) - - (134)
Foreign exchange movement (12) (8) - - - (20)
Depreciation/amortisation charge (955) (191) (187) (133) (11) (1,477)
Closing net book amount 3,518 994 1,101 328 52 5,993
At 1 July 2008
Cost 9,992 2,134 1,577 1,082 132 14,917
Less: accumulated depreciation (6,474) (1,140) (476) (754) (80) (8,924)
Net book amount 3,518 994 1,101 328 52 5,993
Year ended 30 June 2009:
Additions 4,974 372 1,283 6 12 6,647
Acquisition of subsidiary 149 - 39 - - 188
Disposals (17) (34) (31) - (16) (98)
Depreciation/amortisation charge (1,884) (193) (517) (124) (13) (2,731)
Closing net book amount 6,740 1,139 1,875 210 35 9,999
At 30 June 2009
Cost 15,111 2,472 2,868 1,088 128 21,667
Less: accumulated depreciation (8,371) (1,333) (993) (878) (93) (11,668)
Net book amount 6,740 1,139 1,875 210 35 9,999
Consolidated Parent entity
2009 2008 2009 2008
$’000 $’000 $’000 $’000
Shares in subsidiaries - - 207,495 188,127
Total - - 207,495 188,127
83
NOTE 11. OTHER FINANCIAL ASSETS
The fi nancial assets are carried at cost.
NOTE 12. PROPERTY AND EQUIPMENT
For
per
sona
l use
onl
y

Notes to the fi nancial statements (continued)
30 June 2009
NOTE 12. PROPERTY AND EQUIPMENT (continued)
84
Plant &
equipment
Furniture &
fi ttings
Leasehold
improvements
Leased plant
& equipmentTotal
Parent entity $’000 $’000 $’000 $’000 $’000
At 1 July 2007
Cost 402 352 166 118 1,038
Less: accumulated depreciation (265) (175) (75) (108) (623)
Net book amount 137 177 91 10 415
Year ended 30 June 2008:
Additions 712 9 - - 721
Transfer to subsidiary (136) (177) (91) (10) (414)
Depreciation/amortisation charge (98) (1) - - (99)
Closing net book amount 615 8 - - 623
At 1 July 2008
Cost 713 9 - - 722
Less: accumulated depreciation (98) (1) - - (99)
Net book amount 615 8 - - 623
Year ended 30 June 2009:
Additions 806 52 59 - 917
Depreciation/amortisation charge (470) (6) (13) - (489)
Closing net book amount 951 54 46 - 1,051
At 30 June 2009
Cost 1,519 61 59 - 1,639
Less: accumulated depreciation (568) (7) (13) - (588)
Net book amount 951 54 46 - 1,051
For
per
sona
l use
onl
y

Tax lossesEmployee
benefi ts
Share issue
expensesOther Total
Movements – Consolidated $’000 $’000 $’000 $’000 $’000
At 1 July 2007 4 669 414 299 1,386
Charged to the income statement 3 168 - 170 341
Charged directly to equity - - (103) - (103)
Acquisition of subsidiary - 153 - 5 158
At 30 June 2008 7 990 311 474 1,782
Charged to the income statement 65 231 - 362 658
Charged directly to equity - - (103) - (103)
Acquisition of subsidiary - 64 - (6) 58
At 30 June 2009 72 1,285 208 830 2,395
Movements – Parent entity $’000 $’000 $’000 $’000 $’000
At 1 July 2007 - 63 414 (30) 447
Charged to the income statement - 22 - 135 157
Charged directly to equity - - (103) - (103)
At 30 June 2008 - 85 311 105 501
Charged to the income statement - 63 - 80 143
Charged directly to equity - - (103) - (103)
At 30 June 2009 - 148 208 185 541
Consolidated Parent entity
2009 2008 2009 2008
$’000 $’000 $’000 $’000
The balance comprises temporary differences attributable to:
Doubtful debts 314 127 - -
Employee benefi ts 1,285 990 148 85
Accrued expenses 523 578 185 105
Depreciation (7) (100) - -
Leased assets - (37) - -
Work in progress - (94) - -
Tax losses* 72 7 - -
Share issue expenses 208 311 208 311
Net deferred tax assets 2,395 1,782 541 501
Deferred tax assets to be recovered within 12 months 2,395 1,705 541 424
Deferred tax assets to be recovered after more than 12 months - 77 - 77
Total 2,395 1,782 541 501
85
NOTE 13. DEFERRED TAX ASSETS
* The deferred tax asset attributable to tax losses does not exceed taxable amounts arising from the reversal of existing
assessable temporary differences.
For
per
sona
l use
onl
y

Notes to the fi nancial statements (continued)
30 June 2009
NOTE 14. INTANGIBLE ASSETS
86
SoftwareBrand
name
Customer
related
Stadia
rightsGoodwill Total
Consolidated $’000 $’000 $’000 $’000 $’000 $’000
At 1 July 2007
Cost 1,323 5,750 6,400 1,600 145,928 161,001
Less: accumulated amortisation (150) - (164) (483) - (797)
Net book amount 1,173 5,750 6,236 1,117 145,928 160,204
Year ended 30 June 2008:
Additions 443 - - - - 443
Disposals (25) - - - - (25)
Acquisition of subsidiary 34 - 3,570 - 43,638 47,242
Amortisation charge (620) - (1,544) (959) - (3,123)
Closing net book amount 1,005 5,750 8,262 158 189,566 204,741
At 1 July 2008
Cost 1,775 5,750 9,970 1,600 189,566 208,661
Less: accumulated amortisation (770) - (1,708) (1,442) - (3,920)
Net book amount 1,005 5,750 8,262 158 189,566 204,741
Year ended 30 June 2009:
Additions 322 - - - - 322
Acquisition of subsidiary 59 - - - 13,271 13,330
Amortisation charge (729) - (1,602) (158) - (2,489)
Closing net book amount 657 5,750 6,660 - 202,837 215,904
At 30 June 2009
Cost 2,156 5,750 9,970 1,600 202,837 222,313
Less: accumulated amortisation (1,499) - (3,310) (1,600) - (6,409)
Net book amount 657 5,750 6,660 - 202,837 215,904
For
per
sona
l use
onl
y

(a) Software
The software has a useful life of between 3 and 4 years (refer note 1(p))
(b) Determination of intangibles relating to prior year acquisition
The goodwill that was provisionally assessed, relating to the acquisitions of the Visual Jazz Pty Ltd, Haystac Public Affairs and
the Coleman Group Pty Ltd during the year ended 30 June 2008, has been fi nalised during the period. The Group has identifi ed
and independently valued intangibles of the acquired businesses, which has resulted in a reduction of the goodwill provisionally
booked in 2008 of $2.7 million and a corresponding increase in customer-related and software intangible assets, with no change
to total intangible assets. The intangibles identifi ed are specifi ed in the note above.
(c) Impairment tests for goodwill
Goodwill is allocated to the Group’s cash generating units (CGU’s) at the lowest level for which there are separate identifi able
cash fl ows. The recoverable amount of a CGU is determined based on value-in-use calculations. At 30 June 2009, the Group has
determined that there is no impairment to intangible asset values based on the calculations performed.
Since 1 July 2008, the Group’s CGU’s have been consolidated into business segments, due to the centralised management and
reporting structure of those segments.
Software Total
Parent $’000 $’000
At 1 July 2007
Cost 1,022 1,022
Less: accumulated amortisation (109) (109)
Net book amount 913 913
Year ended 30 June 2008:
Additions 236 236
Transfer to subsidiary (913) (913)
Amortisation charge (29) (29)
Closing net book amount 207 207
At 1 July 2008
Cost 236 236
Less: accumulated amortisation (29) (29)
Net book amount 207 207
Year ended 30 June 2009:
Additions 244 244
Acquisition of subsidiary 58 58
Amortisation charge (163) (163)
Closing net book amount 346 346
At 30 June 2009
Cost 480 480
Less: accumulated amortisation (134) (134)
Net book amount 346 346
87
For
per
sona
l use
onl
y

Consolidated Parent entity
2009 2008 2009 2008
Note $’000 $’000 $’000 $’000
Current
Deferred consideration – acquisitions 1,630 6,101 1,630 1,036
Other – related party loans 27 - - 86,184 51,142
Total 1,630 6,101 87,814 52,178
Non-current
Deferred consideration - acquisitions - 279 - 279
Consolidated Parent entity
2009 2008 2009 2008
$’000 $’000 $’000 $’000
Trade payables 182,184 193,066 1,615 678
Other payables 16,355 16,564 663 1,249
Deferred revenue 6,753 8,277 - -
Accrued interest 116 348 116 348
Total 205,408 218,255 2,394 2,275
CGU Carrying value
of goodwill *
Carrying value
of brand name
Gross margin ** Growth rateˆ Discount rate †
2009 2009 2009 2008 2009 2008 2009 2008
$‘000 $‘000 % % % % % %
Media 106,176 5,750 n/a n/a 4.0 3.5-4.5 11.4 10.0
Diversifi ed 57,368 - 30 33 5.0 4.5 11.4 10.0
Public Relations 14,475 - n/a n/a 4.0 4.5 11.4 10.0
Digital Advertising & Technology 24,817 - n/a n/a 6.0 4.5 11.4 10.0
88
Notes to the fi nancial statements (continued)
30 June 2009
NOTE 14. INTANGIBLE ASSETS (continued)
(d) Key assumptions used for value-in-use calculations
* No comparative fi gures due to change in determination of CGU’s in current fi nancial year.
** Budgeted gross margin. Revenue from Mitchell & Partners Group is recognised on an agency principle. Refer note 1(d).
ˆ Weighted average growth rate used to extrapolate cash fl ows beyond the budget period
† In performing the value in use calculations for each CGU, the company has applied post tax discount rates to discount the forecast future
attributable post tax cash fl ows.
Management determined budgeted gross margin based on past performance, economic and industry data and its future
expectations.
(e) Impact of possible changes in key assumptions
There are no reasonably possible changes in the key assumptions that would cause the CGU’s carrying amount to exceed its
recoverable amount.
NOTE 15. TRADE AND OTHER PAYABLES
Risk exposure
Information about the Group’s and parent entities exposure to foreign exchange risk is provided in note 2.
NOTE 16 OTHER FINANCIAL LIABILITIES
Deferred consideration is payable to the vendors of acquired entities pursuant to Sale and Purchase Agreements.
For
per
sona
l use
onl
y

Consolidated Parent entity
2009 2008 2009 2008
Total secured liabilities $’000 $’000 $’000 $’000
Bank loans 73,000 60,000 73,000 60,000
Consolidated Parent entity
2009 2008 2009 2008
$’000 $’000 $’000 $’000
Current
Employee entitlements 3,049 2,268 302 199
Provision for insurance excess 250 - - -
Total 3,299 2,268 302 199
Non-current
Employee entitlements 1,191 989 195 84
NOTE 17. PROVISIONS
NOTE 18 BORROWINGS
(a) Assets pledged as security
The bank loans of the parent entity are secured by registered mortgage debentures over the assets of the parent entity,
Neodigital Pty Ltd, Digital Artists Pty Ltd, Digital Advertising New Zealand Limited, Mitchell & Partners Pty Ltd, Mitchell &
Partners (NSW) Pty Ltd, Mitchell & Partners (Qld) Pty Ltd, Mitchell & Partners Australia Pty Ltd, Stadia Media Pty Ltd, Positive
Outcomes Pty Ltd, Spark PR Pty Ltd, Drive Communications Pty Ltd, Mitchell & Partners (NZ) Limited, emitch Pty Ltd, Vivid
Holdings Australia Pty Ltd, Vivid Group Pty Ltd and Web Data Group Pty Ltd. (2008: the parent entity, Neodigital Pty Ltd, Digital
Artists Pty Ltd, The Internet Bureau Limited, Mitchell & Partners Pty Ltd, Mitchell & Partners (NSW) Pty Ltd, Mitchell &
Partners (Qld) Pty Ltd, Mitchell & Partners Australia Pty Ltd, Stadia Media Pty Ltd, Positive Outcomes Pty Ltd, Spark PR Pty Ltd,
Drive Communications Pty Ltd and Mitchell & Partners (NZ) Limited).
The carrying amount of assets pledged as security for the non-current borrowings are:
(b) Cash advance facility (Bank loans)
The facility consists of two pools, $50 million for working capital purposes and $30 million for merger and acquisition activity.
The facility is repayable in full by 31 August 2010. The working capital pool is drawn down as required as a bank overdraft. The
mergers and acquisition pool is drawn down as required as a separate fully drawn advance. Each drawn advance has a variable
interest rate based on the bank bill swap rate for the period of the advance. The overdraft has a variable interest rate based on
the 30-day bank bill swap rate.
The current interest rate on the bank overdraft is 3.73% and 3.71% on the cash advance facility (2008: 8.05% to 8.20%).
Non-current
Floating charge
Property and equipment 9,999 3,483 1,051 623
Total non-current assets pledged as security 9,999 3,483 1,051 623
Total assets pledged as security 201,931 218,447 90,514 52,573
89
Consolidated Parent entity
2009 2008 2009 2008
Current $’000 $’000 $’000 $’000
Floating charge
Cash and cash equivalents 76,049 68,361 47,242 10,146
Trade and other receivables 108,402 139,778 41,688 39,415
Other assets 7,481 6,825 533 2,389
Total current assets pledged as security 191,932 214,964 89,463 51,950
For
per
sona
l use
onl
y

Notes to the fi nancial statements (continued)
30 June 2009
NOTE 18 BORROWINGS (continued)
(c) Financing arrangements
Unrestricted access was available at balance date to the following lines of credit:
The cash advance facility may be drawn at any time up to the facility limit.
(d) Interest rate risk exposures
The following table sets out the Group’s exposure to interest rate risk, including the contractual re-pricing dates and weighted
average interest rate by maturity periods.
Exposures arise from liabilities bearing variable interest rates.
Consolidated Parent entity
2009 2008 2009 2008
$’000 $’000 $’000 $’000
Bank loan facilities – Pool “A”
Total facilities 50,000 50,000 50,000 50,000
Used at balance date 44,300 46,558 44,300 46,558
Unused at balance date 5,700 3,442 5,700 3,442
Bank loan facilities – Pool “B”
Total facilities 30,000 30,000 30,000 30,000
Used at balance date 28,700 13,442 28,700 13,442
Unused at balance date 1,300 16,558 1,300 16,558
Fixed interest rate
Floating
interest
rate
1 year or
less
Over 1 to
2 years
Over 2 to
3 years
Over 3 to
4 years
Over 4 to
5 years
Over 5
yearsTotal
2009 $’000 $’000 $’000 $’000 $’000 $’000 $’000 $’000
Bank loans 73,000 - - - - - - 73,000
Weighted average interest rate 3.73% - - - - - - 3.73%
Fixed interest rate
Floating
interest
rate
1 year or
less
Over 1 to
2 years
Over 2 to
3 years
Over 3 to
4 years
Over 4 to
5 years
Over 5
yearsTotal
2008 $’000 $’000 $’000 $’000 $’000 $’000 $’000 $’000
Bank loans 60,000 - - - - - - 60,000
Weighted average interest rate 8.13% - - - - - - 8.13%
90
For
per
sona
l use
onl
y

2009 2008
Carrying
amountFair value
Carrying
amountFair value
$’000 $’000 $’000 $’000
On balance sheet
Non-traded fi nancial liabilities
Bank loans 73,000 73,000 60,000 60,000
(e) Fair value
The carrying amounts and fair values of borrowings at balance date are for the Group and Parent:
None of the classes of borrowings are readily traded on organised markets in standardised form. Fair value is inclusive of costs,
which would be incurred on settlement of a liability.
On balance sheet
The fair value of borrowings is based upon market prices where a market exists or by discounting the expected future cash fl ows
by the current interest rates for liabilities with similar risk profi les.
(f) Risk exposures
Information about the Group’s and parent entities exposure to interest rate and foreign exchange changes is provided in note 2.
NOTE 19. DEFERRED TAX LIABILITIES
NOTE 22. NON-CURRENT LIABILITIES – PROVISIONS
91
Intangibles Other Total
Movements – Consolidated $’000 $’000 $’000
At 1 July 2007 2,675 - 2,675
Credited to the income statement (174) - (174)
At 30 June 2008 2,501 - 2,501
Charged/(credited) to the income statement (470) 229 (241)
At 30 June 2009 2,031 229 2,260
Consolidated
2009 2008
The balance comprises temporary differences attributable to: $’000 $’000
Amounts recognised in profi t or loss
Intangibles 2,031 2,501
Work in progress 128 -
Depreciation 60 -
Grants receivable 41 -
Net deferred tax liabilities 2,260 2,501
Deferred tax liabilities to be recovered after more than 12 months 1,598 2,327
Deferred tax liabilities to be recovered within 12 months 662 174
Total 2,260 2,501
For
per
sona
l use
onl
y

Parent entity Parent entity
2009 2008 2009 2008
Note Shares ‘000 Shares ‘000 $’000 $’000
(a) Share capital
Ordinary shares, fully paid (b)(c) 297,447 288,019 136,341 133,071
(b) Movements in ordinary share capital:
Date Details Number of sharesAverage
issue price$’000
2008
30 Jun 2007 Opening balance 246,357,454 86,944
16 Aug 2007Issued as part consideration on the purchase
of Mitchell & Partners (WA) Pty Ltd(d)
1,028,160 $1.25 1,285
4 Sep 2007 Share placement to institutions (e) 30,000,000 $1.10 33,000
19 Oct 2007 Issued under share purchase plan (f) 6,334,532 $1.09 6,904
29 Nov 2007Issued pursuant to earn-out on purchase of
Mitchell & Partners Group(g)
4,166,667 $1.15 4,792
7 May 2008Issued as part consideration of the purchase
of Visual Jazz Pty Ltd(h)
1,513,773 $0.66 999
Share buy-back, net of transaction costs (i) (1,382,025) $0.67 (923)
Shares issued as part consideration of
earn-out payments on the purchase of Visual
Jazz Pty Ltd and Coleman Group Pty Ltd
(j)
1,102
Less: Transaction costs arising on share issue (928)
Deferred tax credit recognised directly in
equity (104)
30 Jun 2008 Closing balance 288,018,581 133,071
2009
3 Oct 2008Issued as part consideration on the purchase
of Visual Jazz Pty Ltd(j)
1,012,590 $0.62 (68)
24 Oct 2008
Issued as part consideration of earn-out
payments on the purchase of Coleman Group
Pty Ltd
(j)
781,281 $0.67 112
13 Mar 2009 Shares issued under employment contract 500,000 $0.43 213
17 Apr 2009Shares issued under the Dividend
Reinvestment Plan
(k)
7,134,839 $0.44 3,139
Less: Transaction costs arising on share
issue, including the tax benefi t from previous
share issues (126)
30 Jun 2009 Closing balance 297,447,291 136,341
Notes to the fi nancial statements (continued)
30 June 2008
NOTE 20. CONTRIBUTED EQUITY
(c) Ordinary shares
Ordinary shares entitle the holder to participate in dividends and the proceeds on winding up of the company in proportion to the
number of and amounts paid on the shares held.
On a show of hands every holder of ordinary shares present at a meeting in person or by proxy, is entitled to one vote, and upon
a poll each share is entitled to one vote.
92
For
per
sona
l use
onl
y

(d) Issued relating to purchase of Mitchell & Partners (WA) Pty Ltd
The company purchased 51% of the issued capital of Workhouse Advertising Pty Ltd, details of which can be found in note 28,
effective 16 August 2007 for consideration including 1,028,160 fully paid ordinary shares in the capital of Mitchell Communication
Group Limited. The fair value of ordinary shares issued was calculated by taking the average price of the fi ve trading during the
period 25 June to 30 June 2007.
(e) Share placement to institutional investors
On 4 September 2007, the company announced the placement of 30,000,000 shares at $1.10 per share to institutional investors.
The equity raised will be used in part to fund future acquisitions.
(f) Share purchase plan
On 4 September 2007, the company announced a “Shareholder Purchase Plan” whereby shareholders were offered the
opportunity to buy shares in the company at $1.09 for a maximum value of $5,000 per shareholder. Under the plan the company
issued 6,334,532 shares.
(g) Purchase of business’ of the Mitchell & Partners group
At 30 June 2007, the company owed the Mitchell family $45.415m in deferred consideration for the sale of the Mitchell &
Partners group. During the year ended 30 June 2008, the Mitchell family elected to take part of the payment due in the form
of 4,166,667 ordinary shares. The fair value of ordinary shares issued was calculated by taking the average price of fi ve trading
days prior to the date of exchange.
(h) Purchase of the Visual Jazz Pty Ltd
Effective 7 September 2007, the company purchased 100% of the issued capital of Visual Jazz Pty Ltd, details of which can be
found in note 28, for consideration including 1,513,773 fully paid ordinary shares in the capital of Mitchell Communication Group
Limited. The fair value of ordinary shares issued was calculated by taking the average price of the fi ve trading days prior to the
date of exchange.
(i) Share buy-back program
On 22 January 2008, the company executed a publicly announced share buy-back program. The company made the decision
to buy back up to 10% of the company’s shares, with the strategy of effi cient capital management and maximising shareholder
value. All the shares purchased on market were cancelled. The company bought back 1,382,025, which were cancelled.
(j) Shares issued as deferred consideration
The company issued shares to the vendors of Visual Jazz Pty Ltd and Coleman Group Pty Ltd as part payment of deferred
consideration under the Sale and Purchase agreements. The shares were issued before 30 September 2008. An estimate value
was taken up in contributed equity at 30 June 2008. The current year fi gure represents the variance between the estimated and
actual value issued.
(k) Shares issued under the Dividend Reinvestment Plan
On 19 February 2009, the company announced a Dividend Reinvestment Plan (DRP), whereby shares would be issued based
upon the daily volume weighted average market price of MCU shares during the fi ve trading days ended 30 March 2009, less a
5% discount, which equated to a value of $0.44 per share. A total of 7,134,839 were issued under the DRP on 17 April 2009 to
those shareholders who elected to take part in the Plan.
(l) Capital risk management
The Group’s and parent entity’s objectives when managing capital is to safeguard their ability to continue as a going concern, so
that they can continue to provide returns for shareholders and benefi ts for other stakeholders and to maintain an optimal capital
structure to reduce the cost of capital.
In order to maintain or adjust the capital structure, the Group may adjust the amount of dividends paid to shareholders, return
capital to shareholders, issue new shares or sell assets to reduce debt.
The Group and parent monitor capital by analysing the net cash / debt position and gearing ratio. The gearing ratio is calculated
as net debt divided by total capital. The business is currently in a net cash position, which is consistent with the fact that the
parent is running a share buy-back program to optimise the return to shareholders.
93
For
per
sona
l use
onl
y

Consolidated Parent entity
2009 2008 2009 2008
$’000 $’000 $’000 $’000
(a) Reserves
Share-based payments reserve 273 163 273 163
Foreign currency translation reserve (344) (383) - -
(71) (220) 273 163
Movements:
Share-based payments reserve
Balance 1 July 163 238 163 238
Option and performance rights expense 110 (75) 110 (75)
Balance 30 June 273 163 273 163
Foreign currency translation reserve
Balance 1 July (383) 97 - -
Currency translation differences arising during the year 39 (480) - -
Balance 30 June (344) (383) - -
(b) Retained earnings/(accumulated losses)
Retained earnings/(accumulated losses) at the beginning of the
fi nancial year 7,695 (1,331) (11,307) (5,527)
Net profi t attributable to members of Mitchell Communication Group
Limited 19,318 17,561 18,225 2,731
Dividends declared and paid during the year (11,564) (8,535) (11,564) (8,511)
Changes in minority interest 25 - - -
Retained earnings/(accumulated losses) at the end of the fi nancial
year 15,474 7,695 (4,646) (11,307)
Notes to the fi nancial statements (continued)
30 June 2009
NOTE 21. RESERVES AND RETAINED EARNINGS/(ACCUMULATED LOSSES)
(c) Nature and purpose of reserves
(i) Share-based payments reserve
The share-based payments reserve is used to recognise the fair value of options and performance rights issued but not
exercised.
(ii) Foreign currency translation reserve
Exchange differences arising on translation of the foreign controlled entity are taken to the foreign currency translation reserve,
as described in note 1(c). The reserve is recognised in profi t and loss when the net investment is disposed of.
94
For
per
sona
l use
onl
y

Consolidated Parent entity
2009 2008 2009 2008
$’000 $’000 $’000 $’000
(a) Ordinary shares
Final dividend for the year ended 30 June 2008 of 2.1 cents (2007:
1.2 cents) per fully paid share paid on 26 September 2008 (2007: 12
October 2007). 100% franked (2007: 100% franked) based on tax paid
at 30% 6,048 3,329 6,048 3,329
Interim dividend for the year ended 30 June 2009 of 1.9 cents (2008:
1.8 cents) per fully paid share paid on 17 April 2009 (2008: 28 March
2008). 100% franked (2008: 100% franked) based on tax paid at 30% 5,516 5,182 5,516 5,182
Dividend paid by subsidiary to minority interest - 24 - -
Total dividends provided for or paid 11,564 8,535 11,564 8,511
NOTE 22. DIVIDENDS
b) Dividends not recognised at year end
Details of dividends declared subsequent to the year ended 30 June 2009 are as follows:
The above amounts represent the balance of the franking account as at the end of the fi nancial year, adjusted for:
(a) franking credits that will arise from the payment of the current tax liability;
(b) franking debits that will arise from the payment of dividends recognised as a liability at the reporting date; and
(c) franking credits that will arise from the receipt of dividends recognised as receivables at the reporting date.
The consolidated amounts include franking credits that would be available to the parent entity if distributable profi ts of
controlled entities were paid as dividends.
The impact on the franking account of the dividend recommended by the directors since year-end, but not recognised as
a liability at year-end, will be a reduction in the franking account of $2,677,026 (2008: $2,592,000).
95
Consolidated Parent entity
2009 2008 2009 2008
$’000 $’000 $’000 $’000
(c) Franked dividends
Franking credits available for subsequent fi nancial years based on a
tax rate of 30% (2008: 30%) 19,811 14,734 19,811 14,734
Record date Payment date TypeAmount per
securityTotal dividend
Franked amount per
security
Foreign sourced
dividend amount per
security
11 September
2009
2 October
2009Final 2.1 cents 6,246,393 2.1 cents Nil
For
per
sona
l use
onl
y

Consolidated Parent entity
2009 2008 2009 2008
$ $ $ $
Short-term employee benefi ts 2,201,135 3,044,979 2,201,135 3,044,979
Post-employment benefi ts 318,052 284,155 318,052 284,155
Long-term benefi ts 17,990 14,658 17,990 14,658
Share-based payments 228,898 57,705 228,898 57,705
Total 2,766,075 3,401,497 2,766,075 3,401,497
Notes to the fi nancial statements (continued)
30 June 2009
NOTE 23. KEY MANAGEMENT PERSONNEL DISCLOSURES
(a) Directors
The following persons were directors of Mitchell Communication Group Limited during the fi nancial year:
Chairman H C Mitchell AO (Executive Chairman)
Executive directors S J Mitchell (Chief Executive Offi cer)
Non-executive directors G A Hounsell
R J Stewart
R J Lamplugh
S A Cameron
P G Nankervis
N Sparks
(b) Other key management personnel
The following persons also had authority and responsibility for planning, directing and controlling the activities of the Group,
directly or indirectly, during the fi nancial year:
(c) Key management personnel compensation
The company has taken advantage of the relief provided by Corporations Regulation 2M.3.03 and has transferred the detailed
remuneration disclosures to the Directors’ Report. The relevant information can be found in sections A-C of the remuneration
report on pages 42 to 47.
96
Name Position Employer
L Littlefi eld Chief Operating Offi cer Mitchell Communication Group Management Services Pty Ltd
J Murray Managing Director – Digital Mitchell Communication Group Management Services Pty Ltd
J White Managing Director – Corporate Mitchell Communication Group Management Services Pty Ltd
A Charles Managing Director – Diversifi ed Mitchell Communication Group Management Services Pty Ltd
D G Cust Chief Financial Offi cer Mitchell Communication Group Management Services Pty Ltd
For
per
sona
l use
onl
y

(d) Equity instrument disclosures relating to key management personnel
(i) Options and performance rights provided as remuneration and shares issued on exercise of such options and
performance rights
Details of options and performance rights over ordinary shares in the company provided as remuneration and shares issued on
the exercise of such options and performance rights, together with terms and conditions of the options can be found in Section D
of the remuneration report on pages 47 to 49.
(ii) Option and performance rights holdings
The numbers of options over ordinary shares in the company held during the fi nancial year by each director of Mitchell
Communication Group Limited and other key management personnel of the Group, including their personally-related entities,
are set out below. There are no performance rights held by any director or key management personnel.
97
Options
2009
Name
Balance at the
start of the year
Granted during
the year as
remuneration
Forfeited during
the year
Balance at the end
of the year
Vested and
exercisable at the
end of the year
Specifi ed executives of the Group
D G Cust 81,204 - - 81,204 81,204
J Murray 300,000 - - 300,000 300,000
Options
2008
Name
Balance at the
start of the year
Granted during
the year as
remuneration
Forfeited during
the year
Balance at the end
of the year
Vested and
exercisable at the
end of the year
Directors of Mitchell Communication Group Limited
H C Mitchell 1,000,000 - (1,000,000) - -
G A Hounsell 500,000 - (500,000) - -
R J Stewart 200,000 - (200,000) - -
S A Cameron 200,000 - (200,000) - -
P G Nankervis - 200,000 (200,000) - -
N Sparks - 200,000 (200,000) - -
Specifi ed executives of the Group
D G Cust 81,204 - - 81,204 -
J Murray 300,000 - - 300,000 -
For
per
sona
l use
onl
y

2009
Name
Balance at the
start of the year
Shares issued
under employment
contract
Other changes
during the year
Balance at the end
of the year
Directors of Mitchell Communication Group Limited - Ordinary shares
H C Mitchell 102,408,827 - 5,599,677 108,008,504
S J Mitchell 12,858,797 - 555,266 13,414,063
G A Hounsell 1,660,500 - 97,782 1,758,282
R J Stewart 307,849 - 39,373 347,222
R J Lamplugh 1,040,000 - 44,908 1,084,908
S A Cameron 71,298 - 3,078 74,376
P G Nankervis - - 67,806 67,806
Other key management personnel of the Group - Ordinary shares
L Littlefi eld - 500,000 21,590 521,590
J White 20,510 - - 20,510
D G Cust 371,254 - - 371,254
2008
Name
Balance at the
start of the year
Shares issued
under employment
contract
Other changes
during the year
Balance at the end
of the year
Directors of Mitchell Communication Group Limited - Ordinary shares
H C Mitchell 100,242,160 - 2,166,667 102,408,827
S J Mitchell 12,858,797 - - 12,858,797
G A Hounsell 72,000 - 1,588,500 1,660,500
R J Stewart 305,556 - 2,293 307,849
R J Lamplugh 1,040,000 - - 1,040,000
S A Cameron 71,298 - - 71,298
Other key management personnel of the Group - Ordinary shares
J White - - 20,510 20,510
D G Cust 366,667 - 4,587 371,254
Notes to the fi nancial statements (continued)
30 June 2009
NOTE 23. KEY MANAGEMENT PERSONNEL DISCLOSURES (continued)
(d) Equity instrument disclosures relating to key management personnel (continued)
(iii) Share holdings
The numbers of shares in the company held during the fi nancial year by each director of Mitchell Communication Group Limited
and other key management personnel of the Group, including their personally-related entities, are set out below.
(e) Loans to key management personnel
There were no loans made to directors of Mitchell Communication Group Limited and other key management personnel of the
Group, including their personally related parties during the years ended 30 June 2009 (2008: nil).
98
For
per
sona
l use
onl
y

(f) Other transactions with directors and specifi ed executives
Directors of Mitchell Communication Group Limited
Two directors, H C Mitchell and S J Mitchell were directors and shareholders of the Mitchell & Partners Group, which was
purchased by the company on 1 April 2007. Part of the proceeds payable to the vendors was deferred, which was funded by way
of a share placement on 4 September 2007. Refer to note 20 for further information. All deferred consideration was paid during
the fi nancial year ended 30 June 2008 as follows. No payments were made during the year ended 30 June 2009.
From 21 May 2007 until 8 September 2008, a private entity related to Mr H C Mitchell and Mr S J Mitchell leased offi ce space to
an entity in the Group. The rental was based on arms length terms.
Two directors, H C Mitchell and S J Mitchell are directors and shareholders of the Mitchell Family Offi ce Pty Ltd. The Mitchell
Family Offi ce sub-leased space from an entity within the Group from 21 May 2007 until 8 September 2008. The rental was based
on arms length terms.
A director, H C Mitchell is founder of the Harold Mitchell Foundation. The Harold Mitchell Foundation sub-let space from an
entity within the Group from 21 May 2007 until 8 September 2008. The rental was based on arms length terms.
A director, R J Lamplugh is a partner in the law fi rm Lamplugh McIntosh. This fi rm provided legal services to the company on
normal terms and conditions. Lamplugh McIntosh sub-leased offi ce space from an entity within the Group from 21 May 2007.
The rental was based on arms length terms.
A director, G A Hounsell provided mergers and acquisitions consultancy services to the Group until 30 June 2008.
Aggregate amounts of each of the above types of other transactions with key management personnel of Mitchell Communication
Group Limited:
99
2009 2008
$ $
Cash paid - 39,893,226
Equity issued - 5,000,000
Total deferred consideration - 44,893,226
2009 2008
$ $
Amounts recognised as revenue
Rent 256,133 43,125
Total 256,133 43,125
Amounts recognised as expense
Consultancy services - 300,000
Legal fees 156,056 138,025
Rent of offi ce building - 45,100
Total 156,056 483,125
Aggregate amounts of assets at balance date relating to the above types of other transactions
with key management personnel of the Group:
Current assets 2,892 470
Aggregate amounts payable to key management personnel of the Group at balance date
relating to the above types of other transactions:
Current liabilities – other related parties 28,508 12,620
For
per
sona
l use
onl
y

Consolidated Parent entity
2009 2008 2009 2008
$’000 $’000 $’000 $’000
Operating leases
The Group leases various offi ces under non cancellable operating
leases expiring within two to six years. The leases have varying
terms, escalation clauses and renewal rights. On renewal, the
terms of the leases are renegotiated.
Commitments for minimum lease payments in relation to
non cancellable operating leases are payable as follows:
Within one year 2,751 3,079 119 268
Later than one year but not later than fi ve years 3,363 4,464 - 164
Later than fi ve years - 89 - -
Total 6,114 7,632 119 432
Consolidated Parent entity
2009 2008 2009 2008
$ $ $ $
PricewaterhouseCoopers − Australian fi rm
Audit and review of fi nancial reports and other audit work under
the Corporations Act 2001 317,212 338,550 309,500 338,550
Agreed upon procedures 10,000 5,000 - -
Related practices of PricewaterhouseCoopers Australian fi rm 31,288 44,950 - -
Total audit and other assurance services 358,500 388,500 309,500 338,550
Notes to the fi nancial statements (continued)
30 June 2009
NOTE 24. REMUNERATION OF AUDITORS
Audit Services
During the year the following fees were paid or payable for services provided by the auditor of the parent entity, and non-related
audit fi rms:
100
NOTE 25. CONTINGENCIES
The Group had no contingent liabilities at balance date.
NOTE 26. COMMITMENTS
For
per
sona
l use
onl
y

Current receivables (management fees)
Subsidiaries - - 575,847 292,124
Joint venture entity 14,689 - - -
Current receivables (tax funding agreements)
Wholly owned tax consolidated entities - - 22,983,856 11,238,084
Current payables (purchases of services)
Subsidiaries - - 1,212,102 109,775
Joint venture entity 157,635 - - -
Consolidated Parent entity
2009 2008 2009 2008
$ $ $ $
Purchases of goods and services
Purchase of mobile marketing services from joint venture entity 56,554 60,350 - -
Tax consolidation legislation
Current tax payable assumed from wholly owned tax consolidated
entities - - 11,745,772 10,317,257
Dividend revenue
Subsidiaries - - 23,442,792 8,250,000
Other transactions
Management fees paid to the parent entity by controlled entity - - 4,998,338 2,991,738
NOTE 27. RELATED PARTIES
(a) Key management personnel
Disclosures relating to key management personnel are set out in note 23.
(b) Subsidiaries
Interests in subsidiaries are set out in note 29.
(c) Transactions with related parties
The following transactions occurred with related parties:
(d) Outstanding balances arising from sales/purchases of good and services
The following balances are outstanding at the reporting date in relation to transactions with related parties:
No provision for impaired receivables has been raised in relation to any outstanding balances, and no expense has been
recognised in respect of bad or doubtful debts due from related parties.
101
For
per
sona
l use
onl
y

Note Principal activityDate of
acquisition
Proportion
of shares
/ business
acquired
%
Cost of
acquisition
$’000
2009
Mitchell & Partners (WA) Pty Ltd (a) Offl ine planning & buying 1/7/08 49 6,330
Vivid Holdings Australia Pty Ltd (d)Branding, digital media &
application development1/7/08 100 11,745
Agile Automated Advertising Pty Ltd (e)Automated ad agency
templating 1/7/08 100 1,200
Picture This! Productions Pty Ltd (f) Video & event production 1/11/08 100 70
2008
Mitchell & Partners (WA) Pty Ltd (a) Offl ine planning & buying 1/7/07 51 7,108
Coleman Group Pty Ltd (b) Sign production 1/11/07 100 7,645
Visual Jazz Pty Ltd (c) Digital Creative 1/9/07 100 15,896
Consolidated Parent entity
2009 2008 2009 2008
$ $ $ $
Loans to subsidiaries
Beginning of the year - - 39,123,454 463,749
Loans advanced by parent - - 72,641,663 74,783,789
Loan repayments received from subsidiaries - - (70,844,785) (36,192,360)
Interest charged - - 97,879 68,276
End of the year - - 41,018,211 39,123,454
Loans from subsidiaries
Beginning of the year - - (51,142,063) (28,711,250)
Loans transferred by parent - - (62,088,388) (36,482,229)
Loan transfer made by subsidiaries - - 27,046,279 14,051,416
End of the year - - (86,184,172) (51,142,063)
Loans to/(from) joint venture entities
Beginning of the year 559 - 559 -
Loans advanced by parent 38,695 559 38,695 559
Loan payments advanced by joint venture entity (30,825) - (30,825) -
End of the year 8,429 559 8,429 559
Notes to the fi nancial statements (continued)
30 June 2009
NOTE 27. RELATED PARTIES (continued)
(e) Loans to / (from) related parties
A provision for impaired receivables of $4.6 million has been raised in relation to outstanding balances in the fi nancial year
(2008: nil) and no expense has been recognised in respect of bad or doubtful debts due from related parties.
NOTE 28. BUSINESS COMBINATIONS
102
For
per
sona
l use
onl
y

$’000
Cash paid 11,471
Equity issued 1,285
Direct costs relating to the acquisition 682
Total purchase consideration 13,438
Fair value of net identifi able liabilities acquired (refer below) (55)
Goodwill 13,493
(a) Acquisition of Mitchell & Partners (WA) Pty Ltd
(i) Summary of acquisition
On 16 August 2007, the Mitchell Communication Group Limited announced it had acquired 51% of the issued capital of Mitchell
& Partners (WA) Pty Ltd, a media planner and buyer, for consideration of $6,426,000, consisting of $5,140,800 in cash and
$1,285,200 in equity. The fair value of shares issued was $1.25 based on the weighted average price of the shares during the
period 25 June to 30 June 2007. In addition, on 3 September 2007, the Mitchell Communication Group Limited announced
that Mitchell & Partners (WA) Pty Ltd had acquired the media buying assets of The Media Shop for consideration of $1,001,000
in cash. Effective 1 July 2008, the Mitchell Communication Group Limited acquired from Workhouse Advertising Pty Ltd the
remaining 49% of the issued capital in Mitchell & Partners (WA), for consideration of $6,174,000 in cash.
Details of the fair value of the assets and liabilities acquired, intangible assets and goodwill are as follows:
(ii) Purchase consideration
(iii) Assets and liabilities acquired
The assets and liabilities arising from the acquisition are as follows:
The fair values of assets and liabilities acquired are based on discounted cash fl ow models. The goodwill is attributable to
the profi table nature of the business, which is generated via customer relationships, the ability of the business to attract high
performing personnel, buying power and market dominance. Since the acquisition, the Company has performed a detailed
value-in-use calculation that supports the carrying value of all intangible assets arising from the acquisition.
(b) Acquisition of Coleman Group Pty Ltd
(i) Summary of acquisition
On 3 September 2007, the Mitchell Communication Group Limited announced the acquisition of 100% of the issued capital of the
Coleman Group Pty Ltd, one of the largest suppliers of sign production services to major stadia and sporting events in Australia,
for initial consideration of $5,764,781 in cash. Additional consideration of $1,737,047 was paid to the vendors for the year ended
30 June 2008. Further consideration is payable to the vendors subject to achievement of profi t before tax targets for the year
ending 30 June 2010. The payment of additional consideration for the fi nancial year ending 30 June 2010 is not probable at 30
June 2009 and has not been included in the cost of acquisition. A reassessment of the contingent consideration will be made at
31 December 2009.
103
Acquiree’s
carrying
amount
Fair value
$’000 $’000
Property and equipment 20 -
Deferred tax asset - 24
Provision for employee entitlements (79) (79)
Net identifi able assets acquired (59) (55)
For
per
sona
l use
onl
y

$’000
Cash paid 10,722
Equity issued 999
Additional consideration 4,165
Direct costs relating to the acquisition 10
Total purchase consideration 15,896
Fair value of net identifi able assets acquired (refer below) 452
Intangible assets 2,920
Goodwill 12,524
$’000
Cash paid 5,765
Direct costs relating to the acquisition 143
Additional consideration 1,737
Total purchase consideration 7,645
Fair value of net identifi able assets acquired (refer below) 266
Intangible assets 125
Goodwill 7,254
Notes to the fi nancial statements (continued)
30 June 2009
NOTE 28. BUSINESS COMBINATIONS (continued)
(b) Acquisition of Coleman Group Pty Ltd (continued)
Details of the fair value of the assets and liabilities acquired, intangible assets and goodwill are as follows:
(ii) Purchase consideration
The fair value of assets and liabilities acquired was based on discounted cash fl ow models. The goodwill is attributable to
the profi table nature of the business, which is generated via customer relationships, the ability of the business to attract high
performing personnel, buying power and market dominance.
The intangible assets are customer-related intangible assets, which have a useful life of three years. Since the acquisition, the
company has performed a detailed value-in-use calculation that supports the carrying value of all intangible assets arising from
the acquisition.
(c) Acquisition of Visual Jazz Pty Ltd
(i) Summary of acquisition
On 7 September 2007, the Mitchell Communication Group Limited announced it had acquired the business and assets of Visual
Jazz Pty Ltd, a digital advertising agency, for initial consideration of $10,722,582 in cash and $999,090 in equity. Additional
consideration of $4,165,119 was paid to the vendors for the year ended 30 June 2008. No further consideration is payable.
Details of the fair value of the assets and liabilities acquired, intangible assets and goodwill are as follows:
(ii) Purchase consideration
The fair value of assets and liabilities acquired was based on discounted cash fl ow models. The goodwill is attributable to the
profi table nature of the business, future growth prospects, the ability of the business to attract high performing personnel,
and the current workforce in use. The intangible assets are customer-related intangible assets, which have a useful life of
four years.
Since the acquisition, the company has performed a detailed value-in-use calculation, which supports the carrying value of all
intangible assets arising from the acquisition.
104
For
per
sona
l use
onl
y

Acquiree’s
carrying
amount
Fair value
$’000 $’000
Cash and cash equivalents 988 988
Receivables 1,249 1,016
Investments 1,875 -
Fixed assets 188 188
Deferred tax asset 58 58
Other assets 46 46
Trade and other payables (680) (980)
Tax liabilities (452) (452)
Provision for employee entitlements (212) (212)
Net identifi able assets acquired 3,060 652
$’000
Cash paid 11,700
Direct costs relating to the acquisition 45
Total purchase consideration 11,745
Fair value of net identifi able assets acquired (refer below) 652
Goodwill - provisional (refer below) 11,093
(d) Acquisition of Vivid Holdings Australia Pty Ltd
(i) Summary of acquisition
On 27 August 2008, with effect from 1 July 2008, the Mitchell Communication Group acquired 100% of the issued capital in Vivid
Holdings Australia Pty Ltd (‘Vivid Group’), a communications and technology services company which delivers innovation in
branding, digital media and application development, for consideration of $11,700,000 in cash. Further consideration is payable
on the achievement of certain profi t hurdles for the year ending 30 June 2010. An assessment of the contingent consideration
will be made at 31 December 2009.
Details of the fair value of the assets and liabilities acquired, intangible assets and goodwill are as follows:
(ii) Purchase consideration
Assets and liabilities acquired
The assets and liabilities arising from the acquisition are as follows:
The fair value of identifi able assets and liabilities acquired has been assessed provisionally. The company is in the process
of appraising the fair value of the identifi able intangible assets. The company will determine and disclose the allocation to
intangible assets and associated tax effect within 12 months of the acquisition date in accordance with AASB 3 Business
Combinations.
Since the acquisition, the company has performed a detailed value-in-use calculation that supports the carrying value of
intangibles arising out of the acquisition.
105
For
per
sona
l use
onl
y

$’000
Cash paid 70
Total purchase consideration 70
Goodwill – provisional (refer below) 70
$’000
Cash paid 1,200
Total purchase consideration 1,200
Goodwill – provisional (refer below) 1,200
Notes to the fi nancial statements (continued)
30 June 2009
NOTE 28. BUSINESS COMBINATIONS (continued)
(e) Acquisition of Agile Automated Advertising Pty Ltd
(i) Summary of acquisition
On 21 July 2008, with effect from 1 July 2008, the Mitchell Communication Group acquired a licence, software and customers
from the Adcast Group Pty Ltd, for consideration of $1,200,000 in cash. The main driver of the business combination was to
acquire Adcast’s Automated Ad Templating Technology.
Details of the fair value of the assets and liabilities acquired, intangible assets and goodwill are as follows:
(ii) Purchase consideration
The fair value of identifi able assets and liabilities acquired has been assessed provisionally. The company is in the process
of appraising the value of the identifi able intangible assets, if any. The company will determine and disclose the allocation to
intangible assets and its associated tax effect within 12 months of the acquisition date in accordance with AASB 3 Business
Combinations.
Since the acquisition, the company has performed a detailed value-in-use calculation that supports the carrying value of
intangibles arising out of the acquisition.
(f) Acquisition of Picture This! Productions
(i) Summary of acquisition
On 11 November 2008, with effect from 1 November 2008, the Mitchell Communication Group announced it has acquired the
business and assets of Picture This! Productions Pty Ltd, for consideration of $70,000 in cash. Picture This! Productions Pty Ltd
provides video and event production services to clients. Further consideration is payable on the achievement of certain profi t
hurdles in the 12 months to 10 November 2009. The payment of additional consideration is not probable at 30 June 2009 and
has not been included in the cost of acquisition. A reassessment of the contingent consideration will be made at 31 October
2009.
Details of the fair value of the assets and liabilities acquired, intangible assets and goodwill are as follows:
(ii) Purchase consideration
The fair value of identifi able assets and liabilities acquired has been assessed provisionally. The company is in the process
of appraising the value of the identifi able intangible assets, if any. The company will determine and disclose the allocation to
intangible assets and its associated tax effect within 12 months of the acquisition date in accordance with AASB 3 Business
Combinations.
Since the acquisition, the company has performed a detailed value-in-use calculation, which supports the carrying value of the
goodwill arising from the acquisition.
(g) Impact on income statement
The contribution to net profi t after tax of the consolidated entity by the acquired entities listed above from the date of their
acquisition or 1 July 2008, whichever is the latter, to 30 June 2009 was $3,617,408. It is not practical to disclose the full year
impact of the acquisitions due to the owner-related transactions that occurred in the period up until their purchase.
106
For
per
sona
l use
onl
y

107
NOTE 29. INVESTMENTS IN CONTROLLED ENTITIES
Note:
(i) Acquired during the fi nancial year, as detailed in note 28.
(ii) Effective 1 July 2008, the Mitchell Communication Group Limited acquired the remaining 49% of the issued capital in Mitchell & Partners
(WA) Pty Ltd.
(iii) First Purchaso Pty Ltd was incorporated on 11 November 2008. On the 16 December 2008, the company changed its name to Picture This!
Productions Pty Ltd.
(iv) Symphony Analytics & Research Pty Ltd was incorporated on 7 October 2008.
(v) Name changed from The Internet Bureau on 1 July 2008 to Digital Advertising New Zealand Limited.
(vi) Deregistered on 3 November 2008.
The proportion of ownership interest is equal to the proportion of voting power held.
Equity Holding
Name of entity NoteCountry of
incorporationClass of shares
2009
%
2008
%
Agile Automated Advertising Pty Ltd Australia Ordinary 100 -
Coleman Group Pty Ltd Australia Ordinary 100 100
Digital Artists Pty Ltd Australia Ordinary 100 100
dmitch Pty Ltd Australia Ordinary 100 100
Drive Communications Pty Ltd Australia Ordinary 100 100
emitch New Zealand Limited New Zealand Ordinary 100 100
emitch Pty Ltd Australia Ordinary 100 100
Haystac Public Affairs Pty Ltd Australia Ordinary 100 100
Kiwispace Limited (vi) New Zealand Ordinary - 67
Mitchell & Partners Pty Ltd Australia Ordinary 100 100
Mitchell & Partners (NSW) Pty Ltd Australia Ordinary 100 100
Mitchell & Partners (NZ) Limited New Zealand Ordinary 100 100
Mitchell & Partners (Qld) Pty Ltd Australia Ordinary 100 100
Mitchell & Partners (WA) Pty Ltd (ii) Australia Ordinary 100 51
Mitchell & Partners Australia Pty Ltd Australia Ordinary 100 100
Mitchell Communication Group Management
Services Pty LtdAustralia Ordinary 100 100
MPG New Zealand Limited New Zealand Ordinary 100 100
Neo digital Pty Ltd Australia Ordinary 100 100
Positive Outcomes Pty Ltd Australia Ordinary 100 100
Picture This! Productions Pty Ltd (iii) Australia Ordinary 100 -
Spark PR Pty Ltd Australia Ordinary 100 100
Stadia Media Pty Ltd Australia Ordinary 100 100
Symphony Analytics & Research Pty Ltd (iv) Australia Ordinary 100 -
Digital Advertising New Zealand Limited (v) New Zealand Ordinary 100 100
Visual Jazz Pty Ltd Australia Ordinary 100 100
Vivid Group Pty Ltd (i) Australia Ordinary 100 -
Vivid Holdings Australia Pty Ltd (i) Australia Ordinary 100 -
Web Data Group Pty Ltd (i) Australia Ordinary 100 -
WSA Media Buying Pty Ltd Australia Ordinary 100 100
For
per
sona
l use
onl
y

Consolidated
2009 2008
$’000 $’000
Carrying amount of investment
At cost - 13
Equity accounted profi ts/(losses) - (13)
Profi t on sale - -
Share of entities revenue expenses and results
Revenues 109 102
Expenses (127) (136)
Profi t/(loss) before income tax (18) (34)
Income tax - -
Profi t/(loss) after income tax (18) (34)
Notes to the fi nancial statements (continued)
30 June 2009
NOTE 30. INTERESTS IN JOINT VENTURES
On 3 July 2007 the Group entered into a Joint Venture to establish Mocom Pty Ltd, a company that operates a Mobile Advertising
business.
The interest in the joint venture entity is accounted for in the fi nancial statements using the equity method of accounting and is
carried at cost by the parent entity. Information relating to the joint venture entity is set out below.
NOTE 31. RECONCILIATION OF PROFIT AFTER INCOME TAX TO NET CASH INFLOW/(OUTFLOW)
FROM OPERATING ACTIVITIES
108
Consolidated Parent entity
2009 2008 2009 2008
$’000 $’000 $’000 $’000
Profi t from ordinary activities after income tax 19,318 17,561 18,225 2,731
Depreciation and amortisation 5,220 4,600 652 128
Share-based payments 323 (75) 323 (75)
Net loss on sale of non-current assets 98 122 - -
Net exchange differences 39 128 - -
Accrued interest on deferred consideration - 381 250 -
Dividends received - - (1,984) -
Dividends receivable - - (21,459) (8,250)
Share of losses of joint venture not received as distributions or
dividend - 13 - -
Change in operating assets and liabilities
Decrease/(increase) in receivables 20,942 (13,258) (377) (292)
(Increase)/decrease other assets (1,122) (8,755) 21 446
(Increase) in deferred tax assets (1,198) (334) (40) -
(Decrease)/increase in payables (12,893) 24,453 118 1,374
(Decrease)/increase in provision for tax payable (1,848) 404 (13,092) (7,521)
(Decrease)/increase in deferred tax liability (272) 193 - -
Increase in provisions 789 498 214 -
Net cash infl ow/(outfl ow) from operating activities 29,396 25,931 (17,149) (11,459)
For
per
sona
l use
onl
y

Consolidated
2009 2008
Cents Cents
Basic earnings per share 6.6 6.3
Diluted earnings per share 6.6 6.3
$’000 $’000
Earnings used in calculating basic and diluted earnings per share 19,318 17,561
2009 2008
Number of
shares
Number of
shares
Weighted average number of shares used in calculating basic earnings per share 291,553,335 278,839,852
Effect of dilutive securities:
Weighted average number of share options - 190,739
Weighted average number of ordinary shares and options used in calculating diluted earnings
per share 291,553,335 279,030,591
109
NOTE 32. EARNINGS PER SHARE
The following refl ects the income and share data used in the calculations of basic and diluted earnings per share:
The earnings as stated in the income statement have been used to calculate basic and diluted earnings per share.
Information concerning the classifi cation of securities
Equity securities granted to non-executive directors and to executive directors and employees under the Mitchell
Communication Group Limited Performance Rights Plan and Employee Option Plan are considered potential ordinary shares
to the extent the exercise price is lower than the average market price for the year ended 30 June 2009. The equity instruments
have not been included in the determination of basic earnings per share. Details relating to the options are set out in note 33.
NOTE 33. SHARE-BASED PAYMENTS
(a) Mitchell Communication Group Limited Employee Options Plan
All full time employees of Mitchell Communication Group Limited and its controlled entities were eligible to participate in the
plan.
Options were granted under the plan for no consideration. The options vest as soon as they become exercisable. Employee’s
entitlements to the options cease upon the termination of their employment. The options granted carry no dividend or voting
rights. Each option is convertible into one ordinary share.
The option plan is now closed.
For
per
sona
l use
onl
y

110
Notes to the fi nancial statements (continued)
30 June 2009
NOTE 33. SHARE-BASED PAYMENTS (continued)
(a) Mitchell Communication Group Limited Employee Options Plan (continued)
Set out below are summaries of options granted under the plan.
The dilution to existing shareholders caused by the rights issue has led to a reduction in the exercise price of options on issue at
the date of the rights issue. The reduction was 4.7 cents per option.
The weighted average remaining contractual life of share options outstanding at the end of the period was 2.26 years
(2008: 3.26 years).
Exercise
priceGrant date
First
exercise
date
Expiry date
On issue at
start of the
year
Granted
during the
year
Exercised
during the
year
Lapsed
during the
year
Forfeited
during the
year
On issue at
end of the
year
Vested and
exercisable
at end of
the year
$ Date Date Date Number Number Number Number Number Number Number
Consolidated and parent entity – 2009
$0.55 2-Oct-06 2-Oct-08 2-Oct-11 150,767 - - - (13,534) 137,233 137,233
$0.65 2-Oct-06 2-Oct-08 2-Oct-11 150,767 - - - (13,534) 137,233 137,233
$0.75 2-Oct-06 2-Oct-08 2-Oct-11 150,767 - - - (13,534) 137,233 137,233
$1.55 2-Apr-07 1-Oct-08 30-Sep-11 300,000 - - - - 300,000 300,000
752,301 - - - (40,602) 711,699 711,699
Weighted average exercise price $1.01 - - - $0.65 $1.03
Consolidated and parent entity – 2008
$0.55 2-Oct-06 2-Oct-08 2-Oct-11 180,000 - - (29,233) - 150,767 -
$0.65 2-Oct-06 2-Oct-08 2-Oct-11 180,000 - - (29,233) - 150,767 -
$0.75 2-Oct-06 2-Oct-08 2-Oct-11 180,000 - - (29,233) - 150,767 -
$0.75 23-Nov-06 29-Nov-08 28-Nov-11 400,000 - - - (400,000) - -
$1.05 23-Nov-06 29-Nov-09 29-Nov-11 500,000 - - - (500,000) - -
$1.42 2-Apr-07 2-Apr-09 2-Apr-11 1,000,000 - - - (1,000,000) - -
$1.55 2-Apr-07 1-Oct-08 30-Sep-11 300,000 - - - - 300,000 -
$1.50 29-Nov-07 29-Nov-09 29-Nov-12 - 400,000 - - (400,000) - -
2,740,000 400,000 - (87,699) (2,300,000) 752,301 -
Weighted average exercise price $1.12 $1.50 - $0.65 $1.28 $1.01
For
per
sona
l use
onl
y

Grant dateFirst exercise
dateExpiry date
On issue at
start of the year
Granted during
the year
On issue at end
of the year
Vested and
exercisable at
end of the year
Date Date Date Number Number Number Number
Consolidated and parent entity – 2009
1-Jan-09 1-Jan-10 1-Jan-14 - 1,770,172 1,770,172 -
111
NOTE 33. SHARE-BASED PAYMENTS (continued)
(a) Mitchell Communication Group Limited Employee Options Plan (continued)
Fair value of options granted
No options were granted during the year ended 30 June 2009 however, the assessed fair value at grant date of options granted
in the year ended 30 June 2008 was 17 cents. Fair value at grant date was determined using an enhanced Hull-White Trinomial
Lattice option pricing model that takes into account the exercise price, the term of the option, the vesting criteria, the impact of
dilution, the non-tradable nature of the option, the share price at grant date and expected price volatility of the underlying share,
the expected dividend yield and the risk-free interest rate for the term of the option.
The model inputs for options granted during the year ended 30 June 2008 included:
(a) Options are granted for no consideration, and vest two years after grant date
(b) Exercise price of $1.50
(c) Grant date of 29 November 2007
(d) Vesting date of 29 November 2009
(e) Expiry date of 29 November 2012
(f) Share price at grant date of $1.17
(g) Expected price volatility* of the company’s shares between 21% and 42%
(h) Expected dividend yield between 3.9% and 5.5%
(i) Risk-free interest rate of 6.25%
* The expected price volatility is based on historic volatility (based on the remaining life of the options), adjusted for any expected
changes to future volatility due to publicly available information.
(b) Mitchell Communication Group Limited Performance Rights Plan
The Mitchell Communication Group Limited Performance Rights Plan (‘performance rights plan’) has been established to
reward certain employees on the basis of the level of long-term performance achieved by the Mitchell Communication Group
Limited.
Performance rights are granted to certain individuals as part of their total remuneration package. The value of a performance
right attributed to the total remuneration package is independently valued using the Monte Carlo approach. All grants
of performance rights vest to shares over a 3 year period, subject to vesting conditions and performance conditions. The
performance conditions comprise Total Shareholder Return (‘TSR’) and Earnings Per Share (‘EPS’).
Performance rights can be exercised if and when the performance rights vest. Employee’s entitlements to the performance
rights cease upon their termination of their employment. A performance right expires fi ve years after the grant date should it
not vest or be exercised. Performance Rights granted carry no dividend or voting rights.
Each performance right is convertible into one ordinary share. The performance rights are structured as zero exercise price
options. Specifi cally, in the event that the performance conditions associated with the performance rights are satisfi ed, the
recipient is entitled to convert the performance rights to shares at no cost.
Set out below is a summary of performance rights granted under the performance rights plan.
For
per
sona
l use
onl
y

Consolidated Parent entity
2009 2008 2009 2008
$’000 $’000 $’000 $’000
Share-based payment expense/(gain) 323 (75) 323 (75)
Notes to the fi nancial statements (continued)
30 June 2009
NOTE 33. SHARE-BASED PAYMENTS (continued)
(b) Mitchell Communication Group Limited Performance Rights Plan (continued)
Fair value of performance rights granted
The independently assessed fair value at grant date of performance rights granted in the year ended 30 June 2009 was 18.84
cents. Fair value at grant date was determined using the Monte Carlo approach. The Monte Carlo approach simulates many
time-series paths of the underlying asset assuming that share price evolves according to the geometric Brownian motion model,
a model that assumes that continuously-compounded returns are normally distributed.
The model inputs for performance rights granted during the year ended 30 June 2009 included:
(a) Zero exercise price options
(b) Grant date of 1 January 2009
(c) Vesting dates of: 1 January 2010 (20%); 1 January 2011 (30%); and 1 January 2012 (50%)
(d) Expiry date of 1 January 2014
(e) Vesting is subject to testing (on an annual basis) of Total Shareholder Return (‘TSR’) and Earnings Per Share (‘EPS’)
performance conditions. These tests occur on the fi rst, second and third anniversary of the grant date. In the event that less
than the maximum performance rights vest at these dates, re-testing can occur on the fourth anniversary of the grant date
(f) Share price at grant date of $0.45
(g) Expected price volatility of company’s shares of 34%
(h) Expected dividend yield of 8.31%
(i) Risk-free interest rate of 3.51%
(j) Comparator group of 20 stocks for the purpose of testing TSR
(c) Expenses arising from share-based payment transactions
Total expenses arising from share-based payment transactions recognised during the period as part of employee benefi t
expense were as follows:
NOTE 34. EVENTS OCCURRING AFTER REPORTING DATE
(a) Dividend
The directors declared a 2.1 cent a share fully franked dividend on 26 August 2009 payable on 2 October 2009 with a record date
of 11 September 2009.
(b) Acquisition of Western Australian media buying agency
On 4 September 2009, with effect from 1 July 2009 the Mitchell Communication Group Limited acquired 100% of the business
of a Western Australian media buying agency, which instantly elevated the Group to the position of Western Australia’s largest
media buyer. The acquisition of the business will not involve any borrowings. The impact of this aquisition is not disclosed as it
is not practical given the proximity of the acquistion to the issue date of these fi nancial statements.
NOTE 35. DEED OF CROSS GUARANTEE
Mitchell Communication Group Limited, Mitchell & Partners Pty Ltd and emitch Pty Ltd are parties to a deed of cross guarantee
under which each company guarantees the debts of the others. By entering into the deed, the wholly-owned entities have been
relieved of the requirement to prepare a fi nancial report and directors’ report under Class Order 98/1418 (as amended) issued
by the Australian Securities and Investments Commission. The year ended 30 June 2009, represents the fi rst year that the deed
has been in place.
112
For
per
sona
l use
onl
y

(a) Financial statements
The above companies represent a ‘Closed Group’ for the purpose of the Class Order, and as there are no other parties to the
Deed of Cross Guarantee that are controlled by Mitchell Communication Group Limited, they also represent the ‘Extended
Closed Group’. Set out below is a consolidated income statement, a summary of movements in the consolidated retained profi ts
for the year ended 30 June 2009 and a consolidated balance sheet as at 30 June 2009 of the Closed Group consisting of Mitchell
Communication Group Limited, Mitchell & Partners Pty Ltd and emitch Pty Ltd.
Consolidated
2009
$’000
Consolidated income statement
Profi t before income tax expense 21,077
Income tax expense (2,852)
Profi t after income tax expense 18,225
Accumulated losses at beginning of year (1,654)
Dividends declared and paid during the year (11,564)
Retained earnings at end of year 5,007
Consolidated balance sheet
Current assets
Cash and cash equivalents 47,733
Trade and other receivables 40,768
Other assets 21,551
Deferred tax assets 449
Total current assets 110,501
Non-current assets
Property and equipment 2,565
Intangible assets 10,514
Investments in subsidiaries not subject to the Deed of Cross Guarantee 189,081
Total non-current assets 202,160
Total assets 312,661
Current liabilities
Trade and other payables 27,423
Provisions 1,205
Other fi nancial liabilities 65,433
Current tax liabilities 3,120
Total current liabilities 97,181
Non-current liabilities
Borrowings 73,000
Provisions 483
Deferred tax liabilities 376
Total non-current liabilities 73,859
Total liabilities 171,040
Net assets 141,621
Contributed equity 136,341
Reserves 273
Retained earnings 5,007
Total equity 141,621
113
For
per
sona
l use
onl
y

Mitchell Communication Group LimitedDirectors’ declaration
In the directors’ opinion:
(a) the financial statements and notes set out on pages 60 to 113 are in accordance with the Corporations Act 2001, including:
(i) complying with Accounting Standards, the Corporations Regulations 2001 and other mandatory professional reporting requirements; and
(ii) giving a true and fair view of the company’s and Group’s financial position as at 30 June 2009 and of their performance, for the financial year ended on that date; and
(b) there are reasonable grounds to believe that the company will be able to pay its debts as and when they become due and payable, and
(c) at the date of this declaration, there are reasonable grounds to believe that the members of the Closed Group identified in note 35 will be able to meet any obligations or liabilities to which they are, or may become, subject by virtue of the deed of cross guarantee described in note 35.
The directors have been given the declarations by the chief executive officer and chief financial officer required by section 295A of the Corporations Act 2001.
This declaration is made in accordance with a resolution of the directors.
Harold C Mitchell AOExecutive Chairman
Melbourne
23 September 2009
114
For
per
sona
l use
onl
y
PricewaterhouseCoopersABN 52 780 433 757
Freshwater Place2 Southbank BoulevardSOUTHBANK VIC 3006GPO Box 1331MELBOURNE VIC 3001DX 77Telephone 61 3 8603 1000Facsimile 61 3 8603 1999
Independent auditor’s report to the members ofMitchell Communication Group Limited
Report on the financial report
We have audited the accompanying financial report of Mitchell Communication Group Limited (thecompany), which comprises the balance sheet as at 30 June 2009, and the income statement,statement of changes in equity and cash flow statement for the year ended on that date, asummary of significant accounting policies, other explanatory notes and the directors’ declarationfor both Mitchell Communication Group Limited and the Mitchell Communication Group (theconsolidated entity). The consolidated entity comprises the company and the entities it controlled atthe year's end or from time to time during the financial year.
Directors’ responsibility for the financial report
The directors of the company are responsible for the preparation and fair presentation of thefinancial report in accordance with Australian Accounting Standards (including the AustralianAccounting Interpretations) and the Corporations Act 2001. This responsibility includes establishingand maintaining internal controls relevant to the preparation and fair presentation of the financialreport that is free from material misstatement, whether due to fraud or error; selecting and applyingappropriate accounting policies; and making accounting estimates that are reasonable in thecircumstances. In Note 1, the directors also state, in accordance with Accounting StandardAASB 101 Presentation of Financial Statements, that compliance with the Australian equivalents toInternational Financial Reporting Standards ensures that the financial report, comprising thefinancial statements and notes, complies with International Financial Reporting Standards.
Auditor’s responsibility
Our responsibility is to express an opinion on the financial report based on our audit. We conductedour audit in accordance with Australian Auditing Standards. These Auditing Standards require thatwe comply with relevant ethical requirements relating to audit engagements and plan and performthe audit to obtain reasonable assurance whether the financial report is free from materialmisstatement.
An audit involves performing procedures to obtain audit evidence about the amounts anddisclosures in the financial report. The procedures selected depend on the auditor’s judgement,including the assessment of the risks of material misstatement of the financial report, whether dueto fraud or error. In making those risk assessments, the auditor considers internal control relevantto the entity’s preparation and fair presentation of the financial report in order to design auditprocedures that are appropriate in the circumstances, but not for the purpose of expressing anopinion on the effectiveness of the entity’s internal control. An audit also includes evaluating theappropriateness of accounting policies used and the reasonableness of accounting estimatesmade by the directors, as well as evaluating the overall presentation of the financial report.
Our procedures include reading the other information in the Annual Report to determine whether itcontains any material inconsistencies with the financial report.
Our audit did not involve an analysis of the prudence of business decisions made by directors ormanagement.
115
Liability limited by a scheme approved under Professional Standards Legislation
For
per
sona
l use
onl
y

Independent auditor’s report to the members ofMitchell Communication Group Limited (continued)
We believe that the audit evidence we have obtained is sufficient and appropriate to provide abasis for our audit opinions.
Independence
In conducting our audit, we have complied with the independence requirements of the CorporationsAct 2001.
Auditor’s opinion
In our opinion:
(a) the financial report of Mitchell Communication Group Limited is in accordance with theCorporations Act 2001, including:
(i) giving a true and fair view of the company’s and consolidated entity’s financialposition as at 30 June 2009 and of their performance for the year ended on thatdate; and
(ii) complying with Australian Accounting Standards (including the AustralianAccounting Interpretations) and the Corporations Regulations 2001; and
(b) the financial report also complies with International Financial Reporting Standards asdisclosed in Note 1.
Report on the Remuneration Report
We have audited the Remuneration Report included in sections A to E of the directors’ report forthe year ended 30 June 2009. The directors of the company are responsible for the preparationand presentation of the Remuneration Report in accordance with section 300A of the CorporationsAct 2001. Our responsibility is to express an opinion on the Remuneration Report, based on ouraudit conducted in accordance with Australian Auditing Standards.
Auditor’s opinion
In our opinion, the Remuneration Report of Mitchell Communication Group Limited for the yearended 30 June 2009, complies with section 300A of the Corporations Act 2001.
PricewaterhouseCoopers
Nadia Carlin MelbournePartner 23 September 2009
116
For
per
sona
l use
onl
y

Name
Number
on issue
Number
of holders
Options issued under the emitch Limited Employee Option Plan to take up ordinary shares 711,699 10
Performance rights issued under the Mitchell Communication Group Executive Performance Rights Plan to
take up ordinary shares1,770,172 21
Ordinary shares
Name
Number held
Percentage of
issued shares
%
Harold Mitchell 52,740,248 17.73%
Tora Bran Nominees Pty Ltd 32,936,517 11.07%
HSBC Custody Nominees (Australia) Limited 14,734,634 4.95%
Stuart Mitchell 13,414,063 4.51%
Amanda Mitchell 13,414,062 4.51%
National Nominees Pty Ltd 10,639,817 3.58%
Cogent Nominees Pty Ltd 9,412,114 3.16%
J P Morgan Nominees Australia Limited 8,495,024 2.86%
I7 Pty Ltd 8,442,508 2.84%
Citicorp Nominees Pty Ltd 7,534,485 2.53%
J T Campbell & Co Private Equity Pty Ltd 6,346,068 2.13%
M F Custodians Limited 5,963,025 2.00%
Beverly Mitchell 5,862,470 1.97%
UBS Wealth Management Australia Nominees Pty Ltd 4,053,637 1.36%
RBC Dexia Investor Services Australia Nominees Pty Ltd 3,849,709 1.29%
Amcil Limited 3,390,628 1.14%
John, Meghann and Ian Stewart 2,638,099 0.89%
Citicorp Nominees Pty Ltd 2,283,661 0.77%
Mitchell & Partners Executive Share Plan Trust 1,877,727 0.63%
Lafi te Pty Ltd 1,564,772 0.53%
Total 209,593,268 70.45%
Shareholder information
The shareholder information set out below was applicable as at 31 August 2009.
A. Distribution of equity securities
Analysis of numbers of equity security holders by size of holding:
There were 632 holders of less than a marketable parcel of ordinary shares.
B. Equity security holders
Twenty largest quoted equity security holders
The names of the twenty largest holders of quoted equity securities are listed below:
Unquoted equity securities
The names of the largest holders of unquoted equity securities are listed below:
Ordinary shares
Shares Options Performance
rights
1 - 1,000 838 - -
1,001 – 5,000 1,744 - -
5,001 – 10,000 894 - -
10,001 – 100,000 1,437 9 18
100,001 and over 158 1 3
Total 5,071 10 21
117
For
per
sona
l use
onl
y

Shareholder information (continued)
C. Substantial holders
Substantial holders of ordinary shares in the company are set out below:
D. Voting rights
The voting rights attaching to each class of equity security are set out below:
(a) Ordinary shares
On a show of hands every member present at a meeting in person or by proxy shall have one vote and upon a poll each share
shall have one vote.
(b) Options and performance rights
No voting rights.
118
Name
Number
held
Percentage of
issued shares
%
Harold Mitchell 52,740,248 17.73%
Tora Bran Nominees Pty Ltd 32,936,517 11.07%
For
per
sona
l use
onl
y

Mitchell Communication Group Limited
Company particulars
Directors
Harold C Mitchell AO
Chairman
Garry A Hounsell
Deputy Chairman
Stephen A Cameron
Rodney J Lamplugh
Stuart J Mitchell
Peter G Nankervis
Naseema Sparks
Robert J Stewart
Secretaries
Andrew J Seaburgh
Dion G Cust
Principal registered offi ce in Australia
Level 4, 111 Cecil Street
South Melbourne Victoria 3205
Ph: 03 9690 5544
Country of incorporation
Australia
Share registry
Computershare Investor Services Pty Ltd
452 Johnson Street
Abbotsford Victoria 3067
Ph: 1300 85 05 05
Auditor
PricewaterhouseCoopers
Freshwater Place
2 Southbank Boulevard
Melbourne Victoria 3006
Solicitors
Mallesons Stephen Jacques
Level 50, 600 Bourke Street
Melbourne Victoria 3000
Bankers
Australia and New Zealand Banking Group Limited
287 Collins Street
Melbourne Victoria 3000
Stock exchange listings
Shares are listed on the Australian Stock Exchange
and trade under the code MCU.
Website address
www.mitchells.com.au
119
The Mitchell Communication Group Annual Report has been printed by an ISO 14001 EMS & ISO 9001 QMS certifi ed printer,
which holds Sustainability Victoria Wastewise Gold accreditation and is printed on an ecologically rated printing press using
a chemical recirculation system and 100% vegetable based inks. The paper is an environmentally responsible product
manufactured under the environmental management system ISO 14001 using elemental chlorine free pulp sourced from
certifi ed, well managed forests. It is Forest Stewardship Council Chain of Custody (COC) certifi ed. www.completecolour.com.au
119
For
per
sona
l use
onl
y

MEDIA PLANNING AND BUYING (OFFLINE AND ONLINE)
SEARCH ENGINE MARKETING
PR AND BRAND EXPERIENCE
DIGITAL CREATIVE AND TECHNOLOGY
VIDEO PRODUCTION
SPORTS GROUND MEDIA
CORPORATE SOCIAL RESPONSIBILITY
RESEARCH AND ANALYTICS
SYDNEY MELBOURNE BRISBANE CANBERRA PERTH AUCKLAND
For
per
sona
l use
onl
y