Ability of Experience Design Elements to Elicit Emotions and
29
Decision Sciences Volume 35 Number 3 Summer 2004 Printed in the U.S.A. Ability of Experience Design Elements to Elicit Emotions and Loyalty Behaviors Madeleine E. Pullman † School of Hotel Administration, 338 Statler Hall, Cornell University, Ithaca, NY, e-mail: [email protected] Michael A. Gross Department of Management, Colorado State University, Fort Collins, CO 80523-1275, e-mail: [email protected] ABSTRACT Experience design, an approach to create emotional connection with guests or customers through careful planning of tangible and intangible service elements, has gained popular- ity in many hospitality and retail businesses. With ever-increasing competition, service providers seek to develop loyalty by aggressively designing, continuously innovating, and managing their customer experiences. This article explores the relationship between different service elements designed to create enhanced experience and customer loyalty. In addition, it looks at emotional responses as mediating factors between the physical and relational elements and loyalty behaviors. A model is proposed and tested with a VIP hospitality tent for an internationally renowned touring circus. Results of the study in- dicate that while a few design elements directly affect loyalty behavior, the relationship between most design elements and loyalty behavior is strongly mediated by eliciting certain types of emotional behavior. This connection has implications for the focus of service managers’ efforts in different environments. Subject Areas: Emotion and Loyalty Modeling, Experience, and Service Design. INTRODUCTION Recently, there has been increasing interest in creating “experiences” for customers, particularly for those in the service sector. Along these lines, a number of authors argue that the service economy has been transformed into an attention economy (Davenport & Beck, 2002), entertainment economy (Wolf, 1999), a dream society (Jensen, 1999), emotion economy (Gob´ e & Zyman, 2001), or an experience econ- omy (Pine & Gilmore, 1998, 1999; Schmitt, 1999). The authors indicate that as commoditization of many service offerings continues, companies must find new ways to achieve a competitive advantage particularly by focusing on design and management of customers’ experiences. Typical examples of new service experi- ence concepts are the following: boutique hotels, such as Starwood’s W hotels or † Corresponding author. 551
Transcript of Ability of Experience Design Elements to Elicit Emotions and

Decision SciencesVolume 35 Number 3Summer 2004Printed in the U.S.A.
Ability of Experience Design Elementsto Elicit Emotions and Loyalty Behaviors
Madeleine E. Pullman†
School of Hotel Administration, 338 Statler Hall, Cornell University, Ithaca, NY,e-mail: [email protected]
Michael A. GrossDepartment of Management, Colorado State University, Fort Collins, CO 80523-1275,e-mail: [email protected]
ABSTRACT
Experience design, an approach to create emotional connection with guests or customersthrough careful planning of tangible and intangible service elements, has gained popular-ity in many hospitality and retail businesses. With ever-increasing competition, serviceproviders seek to develop loyalty by aggressively designing, continuously innovating,and managing their customer experiences. This article explores the relationship betweendifferent service elements designed to create enhanced experience and customer loyalty.In addition, it looks at emotional responses as mediating factors between the physicaland relational elements and loyalty behaviors. A model is proposed and tested with a VIPhospitality tent for an internationally renowned touring circus. Results of the study in-dicate that while a few design elements directly affect loyalty behavior, the relationshipbetween most design elements and loyalty behavior is strongly mediated by elicitingcertain types of emotional behavior. This connection has implications for the focus ofservice managers’ efforts in different environments.
Subject Areas: Emotion and Loyalty Modeling, Experience, and ServiceDesign.
INTRODUCTION
Recently, there has been increasing interest in creating “experiences” for customers,particularly for those in the service sector. Along these lines, a number of authorsargue that the service economy has been transformed into an attention economy(Davenport & Beck, 2002), entertainment economy (Wolf, 1999), a dream society(Jensen, 1999), emotion economy (Gobe & Zyman, 2001), or an experience econ-omy (Pine & Gilmore, 1998, 1999; Schmitt, 1999). The authors indicate that ascommoditization of many service offerings continues, companies must find newways to achieve a competitive advantage particularly by focusing on design andmanagement of customers’ experiences. Typical examples of new service experi-ence concepts are the following: boutique hotels, such as Starwood’s W hotels or
†Corresponding author.
551

552 Ability of Experience Design Elements to Elicit Emotions and Loyalty Behaviors
Ian Schrager’s unique properties; “Try and Buy” retail concepts, such as AmericanGirl Stores, Xscape (U.K.), or Case Tomahawk Customer Experience Center;theme park retail, such as Toys R US, New York City flagship store, and fullexperience portfolios, such as those provided by Lego International through theirtheme parks, Web sites and user groups, and extensive products.
While experience design authors argue that well-designed experiences buildloyalty (Davenport & Beck, 2002; Gobe & Zyman, 2001; Pine & Gilmore, 1998,1999; Reichheld, 1996; Schmitt, 1999), the relationship between different servicedesign elements and loyalty behavior warrants further examination. Experiencesare inherently emotional and personal; many factors are beyond the control of man-agement such as personal interpretation of a situation based on cultural background,prior experience, mood, sensation seeking personality traits, and many other fac-tors (Belk, 1975; Gardner, 1985; Hirschman & Holbrook, 1982; Zuckerman,1971). Nevertheless, within management’s domain, the service designer can designfor experience and operations manager can facilitate an environment for experienceby manipulating key elements. A considerable amount of marketing research hasexamined how brands create experiences (Gobe & Zyman, 2001; Schmitt, 1999;Wolf, 1999; Zaltman, 2003). Limited research focuses on the influences of ex-perience design and management in services. In addition, minimal research existsconcerning the mediating role of emotions between experience design elements andcustomer loyalty behaviors in the evaluation of services (Cook et al., 2002). Ourstudy’s major contribution is to develop further understanding of this relationshipand provide a useful framework for experience service design and management.The purpose of this article is to improve management understanding of experiencedesign by addressing the following questions:
� How do services create an experience that can influence loyalty behaviors?� What role do customer’s emotions play?� What specific service design elements influence desired emotions and loy-
alty behaviors?� What are the implications for service managers?� Can we learn lessons in one sector and translate this knowledge to other
service sectors?
To address these questions, we first look at definitions of experience andthe current literature on designing and managing experiences. Next, we developan exploratory framework to integrate the vital pieces of experience design withcustomer loyalty behavior. We test the proposed framework with a VIP hospitalitytreatment for an internationally renowned touring circus company. We then analyzeand discuss the managerial and research implications of the model and experimentalresults. In addition, we offer suggestions for future research.
CONCEPTS
Experience Design
While operations management research has focused on service design, the area ofexperience design has received less attention. To see what it takes to create a service

Pullman and Gross 553
“experience,” we first look at definitions of experience. Early research by Dewey(1963) focused on the event qualities of an experience. According to this work,engaging in an experience involves progression over time, anticipation, emotionalinvolvement, a uniqueness that makes it stand out from the ordinary, and it reachessome sort of completion. Gupta and Vajic (1999) state that an experience occurswhen a customer has any sensation or knowledge acquisition resulting from somelevel of interaction with different elements of a context created by a service provider.Successful experiences are those that the customer finds unique, memorable andsustainable over time, would want to repeat and build upon, and enthusiasticallypromotes via word of mouth (Pine & Gilmore, 1998, 1999).
Several researchers have focused on extraordinary or optimal experiences.Csikszentmihalyi (1991, 1997) refers to optimal experiences as “flow.” Flow ex-periences offer absorption, personal control, joy, values, spontaneity, and a new-ness of perception and process. The activity or goal object completely absorbsone’s attention and the experience has a level of skill and challenge. Arnould andPrice (1993) define extraordinary experiences as those characterized by high lev-els of emotional intensity (usually triggered by an unusual event) and disclosureover time. The customer is never sure what the exact outcome will be due tothe context, behavior of other customers, and unclear expectations. According toMcLellan (2000), the goal of experience design is to orchestrate experiences thatare functional, purposeful, engaging, compelling, and memorable. Similarly, Pineand Gilmore’s (1998) richest experiences have a “sweet spot” or elements of ac-tive and passive customer participation and immersive and absorptive connectionin the context. The context should be mutable so each customer can choose theextent of participation and connection with people, physical objects, or technology.They stress that all context elements should have a consistent theme and engageall senses. Similarly, Berry, Carbone, and Haeckel (2002) discuss the importanceof clues of quality in experience design. These clues emanate from people andtangibles and communicate important themes or mission of an organization. Forexample, the clues for a medical facility such as the Mayo Clinic should signalcompetence, caring, and integrity (Berry & Bendapudi, 2003). Within a manager’scontrol, there are several common ideas relating to the design and management ofcustomer experiences. Properly executed experiences will encourage loyalty notonly through a functional design but also by creating emotional connection throughengaging, compelling, and consistent context.
Context
Context is the primary concern for experience design and management. Previousresearchers have alternative definitions for context. Carbone and Haeckel (1994)differentiate context from a service’s performance by design clues or elementsemitted by the service and the environment. Similarly, Gupta and Vajic (1999)define context as the physical and relational setting where the customer consumesthe service and everything that the customer interacts with in that setting. Accordingto Bitner (1990, 1992, 2000), context is the “servicescape” and dictates what theorganization should consider in terms of environmental dimensions, participantmediating responses (cognitive, emotional, and physiological), and employee and

554 Ability of Experience Design Elements to Elicit Emotions and Loyalty Behaviors
customer behaviors including staying longer, expressing commitment and loyalty,spending money, and carrying out the purpose of the organization. Here, the socialenvironment is an important dimension of the servicescape because people withina physically built environment can shape and influence the physical space andits impact (see Baker, Grewal, & Parasuraman, 1994; Baker, Levy, & Grewall,1992).
Particularly, memorable context allows for different levels of customer par-ticipation and connection with the event or performance both through relationaland physical elements (Pine & Gilmore, 1998). Context design allows the guest tochoose between passive participation (not affecting the performance outcome) andactive participation (helping to create the experience). Similarly, context designersaffect the level of guest connection by allowing guests to stand on the sidelinesand absorb activities or immerse them in the center of activities with all the ac-companying sensory stimuli (Pine & Gilmore, 1998). Our model contributes tothe experiential design framework by further explicating how the service provider“creates” a loyal relationship with the customer by manipulating the social andphysical environment.
Similar to previous research addressing elements of experiential design, wepropose two primary components to context: physical and relational. Carboneand Haeckel (1994) refer to physical context as “mechanics clues” for sights,smells, sounds, and textures generated by things. They refer to relational context as“humanics clues” for those behaviors emanated from people. From this perspec-tive, managing customer experience means orchestrating all the “clues” that peo-ple detect so that they collectively meet or exceed people’s emotional needs andexpectations in addition to functional expectations (Berry et al., 2002). From a ser-vice operations design perspective, service design factors such as location, facilitylayout, product design, scheduling, worker skills, quality control and measures,time standards, demand and capacity planning, industrialization level, standard-ization of service offering, customer contact level, front line personnel discretion,sales opportunity, and customer participation affect both context elements (Metters,King-Metters, & Pullman, 2003).
The particular context of this study is a VIP hospitality tent for an internation-ally renowned touring circus. Traditionally, hospitality tents or venues are luxuryenvironments for socializing, eating, and drinking before, during, and/or after anevent. Golf tournaments, ski competitions, theatre performances, pro sports, orfashion shows typically use these venues. Today, VIP experiences are key revenuegenerators for many performance arts and sports venues due to limited perish-able capacity, competition from alternative entertainment options, and ticket pricesensitivity (Barnes, 2000; Boraks, 2002; Buzalka, 2000). Because of premiumpricing associated with these venues, increasingly sponsors or owners examinedifferent context elements to see where they will get “bang for the buck.” Hence,VIP venues have increasingly become the focus of experience design with thegoal of creating memorable guest experiences. Because the venues are often tem-porary (set up specifically for an event, moved, or changed for other functions)or take up significant space relative to regular seating, the design and manage-ment of context elements can dramatically affect the operation’s management andcost.

Pullman and Gross 555
The industry used for the study, a touring circus company, recently intro-duced a new VIP tent concept with many experiential context elements. AlthoughVIP guests pay a premium of $100 for the tent experience, the increased cost andcomplexity of the new service delivery reduced profit margins considerably. Forexample, large special effects and lounge seating required additional trucks andsetup time; special interactive entertainers created additional cost through cos-tumes, salaries, and yearly living/touring expenses; and carefully designed foodand beverages created increased management costs for selection, materials, labor,quality control, and training costs of touring city caterers. The company was con-sidering an international rollout of the new tent concept but needed to determinewhat to modify for both improved margins and loyalty behavior.
As seen in the previous review of experience design literature, the key contextdesign elements are (1) opportunities for customer interaction with other peopleand (2) design or atmosphere that conveys certain messages or themes. In the nextsections, we will explore these conceptual definitions and their relevance to thespecific VIP tent context.
Relational Context
Relational context refers to two important types of interaction: (1) between the guestand service provider and (2) between the guest and the other guests. While previousexperience design research has acknowledged these two important relationships,the mechanism for its impact on customer loyalty has not been explicit. In ourproposed model, this interaction is important to experience design because it fostersidentification with the service provider and with the other guests. Identification isthe perception of oneness with or belongingness to a collective (Mael & Ashforth,1992). When a guest identifies with the service provider and other guests, theguest takes on the interests of the service provider and accepts those interests ashis or her own, thus creating loyalty behavior. A successful service experienceprovider such as Disney spends many months training employees on relationalmethods to explicitly identify with and connect emotionally with guests duringsocial interactions (Rubis, 1998). In the circus VIP tent, relational methods suchas interacting with circus performers could enhance the guest’s identification withthe troupe and behind-the-scenes life.
Several previous researchers examined the implications of relational contextdesign factors. The well-known customer contact approach (Chase, 1981) outlinedthe implications of higher degrees of customer to server contact for increased salesopportunities. In her study of critical incident outcomes in hospitality settings,Bitner (1990) found the ability of employees to respond appropriately to the cus-tomer needs or service delivery failures and unprompted employee actions stronglyrelated to customer satisfaction. In their study of customers’ participation, Kellogg,Youngdahl, and Bowen (1997) found customers experience higher frequency ofsatisfactory service outcomes when allowed to engage in relationship buildingbehaviors. Thus, relational context has positively influenced sales and ratings ofsatisfaction.
For experience design research, we go beyond satisfaction to focus on theconnection between relational context and future behaviors. Research by Gutek,

556 Ability of Experience Design Elements to Elicit Emotions and Loyalty Behaviors
Bhappu, Liao-Troth, and Cherry (1999) illustrates the importance of serviceproviders and the long-term relationship they build with their customers. Whena provider focuses on this relationship, he or she is creating an emotional contextfor future interaction. Loyalty building between the service provider and customermeans creating a history of shared interactions, which can lead to trust (Gutek,1995), fostering an immediate bond between the provider and customer that meetsunique emotional needs of the customer (Ford, 1998, 1999, 2001, 2003). Price,Arnould, and Tierney (1995) found that perceptions of positive relational context(duration, affective content, and proxemic intimacy between client and serviceproviders) played a significant role in customer’s positive affect and satisfaction inlong-duration encounters. In her study of hospitality venues, Bitner (1990) showedthat satisfactory encounters result when contact employees make customers “feelunique or pampered” by giving them special attention, being attentive, and takingextra time. Thus, we argue that effective experiential design creates loyalty whenthe service provider relies on its employees and customers to enact a shared identityand emotional connection during the customer’s experience.
For the VIP venue, perceptions of relational context depend on how the venuefacilitates guest interactions among themselves and with employees. Guests oftenparticipate in VIP venues to interact with other VIPs because “people who havemoney want to be seen around other people who have money” (Barnes, 2000).Similar to certain restaurant experiences, the context serves the leisure function ofseeing and being seen in public and being entertained by others (Scapp & Seitz,1998). Additionally, guests participate because of some unique behind-the-scenesopportunities only available in a VIP tent. Here, memorable experiences can comefrom providing the guests with special interactions with celebrities and performers(Barnes, 2000; Boraks, 2002; Buzalka, 2000). Because of the small scale and highemployee to guest ratio, employees in a VIP venue have an opportunity to makeguests feel special and pampered. The performers can customize their routines forindividuals in the tent, acknowledge special events like birthdays and anniversaries,and encourage intimacy, uniqueness, and caring.
Physical Context
Physical context applies to the tangible aspects of service design. Analogous tothe customer benefit package (Collier, 1994), physical context design addressesthe supporting facility, facilitating goods, and sensual and psychological benefitsassociated with the services that emanate from things. These benefits could includesensory things like sights, smells, and sounds or feelings of status, privacy, orsecurity.
Several authors have emphasized the emotion-eliciting or affective qualitiesof physical context (Mehrabian & Russell, 1974; Nasar, 1988; Statis, 1999). In theirseminal research, Mehrabian and Russell (1974) found that peoples’ emotionalresponse to a place could be captured on two dimensions, pleasure-displeasure anddegree of stimulation or excitement. In particular, environments that elicit feelingsof pleasure are likely to be ones where people want to spend time and money.Wasserman, Rafaeli, and Kluger (2000) found that different restaurant layouts andinterior design influenced behavior and emotion. By altering aesthetic physical

Pullman and Gross 557
cues or symbols, they could generate a predictable pattern of emotional scriptsalong the dimensions of pleasantness, arousal, and power.
Customers’ evaluations of physical context play a significant role in cus-tomer’s evaluation of loyalty behaviors and length of stay in service settings(Bitner, 1990, 1992; Wakefield & Blodgett, 1996). In a study of travel agencyservice failures, the appearance of physical surroundings was positively relatedto service encounter evaluations and customer loyalty behaviors (Bitner, 1990).Wakefield and Blodgett (1996) found that facility aesthetics, layout, seating com-fort, electronic equipment, and cleanliness positively influenced repatronage in-tentions and desire to stay in casinos and sports venues.
In the VIP tent, physical context refers to elements similar to a restaurant,that is, catering, design, and overall ambiance. According to Finkelstein’s “parodic”restaurant design (1989), firms create VIP venues so that the guest is “lifted out ofthe ordinary and deposited in a stylized atmosphere and theatrical setting designedin such a way that it requires the patron to enact a theatrical role.” The design offood, beverages, and their presentation play a key role in evoking positive emotionalresponses (Finkelstein, 1989; Hanefors & Mossberg, 2003; Scapp & Seitz, 1998).Researchers have found that ambiance factors such as music, lighting, and coloraffect customers’ pleasure and arousal emotions in these settings (e.g., Baker &Cameron, 1996; Dube, Chebat, & Morin, 1995).
Good experience design uses all physical context elements to support anunderlying vision, metaphor, or theme (Alben, 1996; Carbone & Haeckel, 1994;Pine & Gilmore, 1998). Effective physical context is concise, compelling, andengages all senses reflected in interior design, employee dress and behavior, and alltangible props (Pine & Gilmore, 1998). Alben’s (1996) quality experience criterionrequires consistency of spirit and style for interactive design. Along these lines,the VIP experience tent creators designed the physical context so that a guest feelsas if he or she is part of circus life. All employees and performers have specialcostumes and the tent materials lighting, music, and interior design reflect thistheme. The layout allows for more participation with performers by putting guestseating (specially designed couches and bar stools) and mobile food carts in thecenter of the tent (rather than at the perimeters in the former tent). In addition,interactive holograms and videos allow the guests to see behind the scenes, that is,watching costume design and creation or performers preparing their makeup andrehearsing to go on stage. There are elaborate costumes on display from the currentshow that guests can touch. All special effects allow for full sensory connection ata level the guest chooses (active or passive; immersive or absorptive).
Assessing Experience Design
Experience design is primarily concerned with (1) the affective or emotional natureof customer reactions to the service design and encounter and (2) the connectionbetween this affective state and loyalty behaviors (Davenport & Beck, 2001; Gobe& Zyman, 2001; Pine & Gilmore, 1998, 1999; Schmitt, 1999; Zaltman, 2003).According to Pine and Gilmore (1998, 1999), the best relationships with customersare affective or emotional in nature and when companies succeed in not onlysatisfying certain needs but also making the interactions pleasurable, people are

558 Ability of Experience Design Elements to Elicit Emotions and Loyalty Behaviors
more inclined to stay loyal, even when a mistake takes place. Zaltman (2003)indicates that the tangible attributes of a product or service have far less influenceon consumer preference than the subconscious sensory and emotional elementsderived from the total experience.
Emotional Response, Satisfaction, and Loyalty Literature
Typically, service operations management research has considered cognitive as-sessments of customer satisfaction as the key outcome measurement of servicedesign (e.g., Johnston, 1995; Kellogg et al., 1997). In most cases, researchers con-ceptualize satisfaction and service quality either as an attitude-like judgment whereconfirmation/disconfirmation of preconsumption product or service attributes is theessential determinant of satisfaction (e.g., Parasuraman, Zeithaml, & Berry, 1994).In other words, service quality depends on perception of the customer of whatwas delivered and how, and the expectation that the customer has of the serviceand company delivering the service (Zeithaml, Parasuraman, & Berry, 1990). Al-ternatively, researchers measure satisfaction as overall impressions or perceptionsof service quality attributes (Cronin & Taylor, 1992; Teas, 1993, 1994). Recently,several researchers have stressed that satisfaction is not a simple cognitive measureand instead a complex, affective state (Oliver, 1996; Westbrook, 1987). Initially,Westbrook (1980, 1983) equated satisfaction with emotion and later tested emo-tion as an antecedent to satisfaction (Westbrook & Oliver, 1991). Oliver (1989)suggested that there are five different modes of satisfaction: contentment, pleasure,relief, novelty, and surprise. In a comprehensive model, Oliver (1993) includedcognitive, affective, and attribute performance assessments as determinants of aglobal satisfaction measure. In assessing the current state of satisfaction research,Fournier and Mick (1999) have encouraged an expansion of the role of emotions.
Previous research on VIP venues is negligible but in most respects, this en-vironment is similar to other types of hospitality venues in terms of emotionalresponse. In their study of extraordinary restaurant experiences, Hanefors andMossberg (2003) found that those with memorable experiences generated strongfeelings of excitement, curiosity, joy, and surprise. Barksy and Nash (2002) showthat different emotions (comfort, content, important, pampered, practical, relaxed,respected, secure, sophisticated, and welcome) play a strong role in the decision-making process regarding loyalty behavior at various hotel segments. Emotionssuch as happiness, pleasure, and warm-heartedness play key roles in outcome as-sessments measures such as best experience, price-worthy, and unique for mul-tiday river trips (Arnould & Price, 1993; Price et al., 1995). Bloemer and deRuyter (1999) found a significant relationship between positive emotions (inter-ested, excited, strong, enthusiastic, proud, alert, inspired, and active) and loyaltyin high-involvement hospitality settings such as restaurants and holiday camps.Similar to Oliver’s (1989, 1996) assessment, these researchers indicate that differ-ent positive emotions modes create a better representation of the complex idea ofsatisfaction.
For this study’s-specific context, we look at emotions that fall into two cat-egories, basic pleasure-arousal or satisfaction-related emotions and VIP-specificor esteem emotions, those emotions related to the need to protect and enhance

Pullman and Gross 559
one’s self-concept or feel important. The first category (what we call basic emo-tions) relates to overall satisfaction and fun that one could expect from attendinga hospitality venue at a circus. Here, we include the following emotions related tosatisfaction (comfort, relaxed, happy, pampered, and satisfied) and those related tothe fun circus environment (entertained, amused, and excited). These emotions aresimilar to those used in previous hospitality-related studies as mentioned above.The other category, emotions specific to VIP or special behind-the-scenes sta-tus, include sophisticated, privileged, hip, important, inspired, curious, and partof show. These emotions are those expected in luxury and status-seeking environ-ments (Barksy & Nash, 2002) and those emotions specific to viewing behind thescenes of the circus.
Loyalty
In many contexts, an overall measure of satisfaction is important (Anderson &Fornell, 1994). However, return or loyal customers are key to the success of manyservices particularly those in the hospitality, insurance, and financial sectors. Asmall increase in the percentage of loyal customers can amount to a much higherincrease in profits and overall value to the firm (Heskett, Reichfeld, & Sasser,1990; Heskett, Sasser, & Schlesinger, 1997; Holbrook, 1994). Satisfaction, as anoutcome measure, does not necessarily indicate that the customer will be loyalto the company (Gitomer, 1998). Loyal customers have behaviors such as repeatbusiness and promotion of the company through word of mouth to others (Godin &Gladwell, 2001; Heskett et al., 1990, 1997). Thus, the proposed model contributesto further this expansion of experience design theory by evaluating the effect ofspecific design elements on emotions and loyalty behaviors.
HYPOTHESES
A number of hypotheses derive from the previous discussion. Figure 1 proposesa general model of the antecedents and outcomes of customer loyalty behaviorin hospitality experience design with corresponding hypotheses. The first partof the model suggests that customer perceptions of key experience design el-ements (created and managed by the service provider) will influence the leveland type of emotions generated in a particular service setting. The second phaseof the model suggests that the level and type of emotional connection will me-diate customer loyalty behaviors. That is, perceptions of the experience designcan both directly and indirectly (through emotional connection) influence loyaltybehaviors.
Physical Context, Emotions, and Loyalty Behaviors
The first set of hypothesis address the fit of physical context elements to a two-dimensional structure of emotions and loyalty behaviors. Other research effortsmentioned above have found support for either a relationship between physicalcontext elements and emotions or a relationship between certain emotions andloyalty. Past research has not investigated the direct relationship between physical

560 Ability of Experience Design Elements to Elicit Emotions and Loyalty Behaviors
Figure 1: Latent path model for VIP experience design.
X4 Quality
y1 Satisfaction y2 Fun
y4 Behind Sceney3 Sophisticate
y5 Repurchase
y6 Recommend
Sensoryξ5
Basic Emotionη1
VIP Emotionη2
Loyalty Behaviorη3
X11 Ambiance
X10 Immersive
X9 Passive
X2 Stunts
X1 Animator
Interactionξ1
1
λ2,1
λ2,1
1
1
1
X5 Full Bar
X6 Beer
Beverageξ3
λ6,3
1
1X3Range
Foodξ2
λ4,2
1
λ4,2
λ11,5
λ10,5
γ3,1
γ1,1γ2,1
γ1,2
γ2,2γ3,2
γ2,3
γ1,3 γ3,3
γ1,5γ2,5
γ3,5
β3,1
β2,1
β3,2
λ6,3
X7 Couches
X8 Bar Stools
Seatingξ4
λ8,4
1
γ2,4
γ3,4γ1,4
Note: Solid lines represent statistically significant paths (p < .01); dashed lines indicatenonsignificant paths.
experience design elements and loyalty behaviors or mediating role of differentemotions.
H1a: Customer perceptions of physical context variables (food, bev-erage, seating, and special effects) will be positively related tobasic emotions.
H1b: Customer perceptions of physical context variables (food, bev-erage, seating, and special effects) will be positively related toVIP emotions.
H1c: Customer perceptions of physical context variables (food, bev-erage, seating, and special effects) will be positively related toloyalty behaviors.
Relational Context, Emotions, and Loyalty Behaviors
The second set of hypotheses address the fit of relational context elements to atwo-dimensional structure of emotions and loyalty behaviors. As mentioned in theliterature review, past research has found support for relations between relationalcontext and positive affect or satisfaction measures (here referred to as “basicemotions”) but there is limited empirical evidence of the link between relationalcontext and loyalty behaviors. Additionally, Bitner (1990) found qualitative ev-idence to support the relationship between relational context and VIP emotions
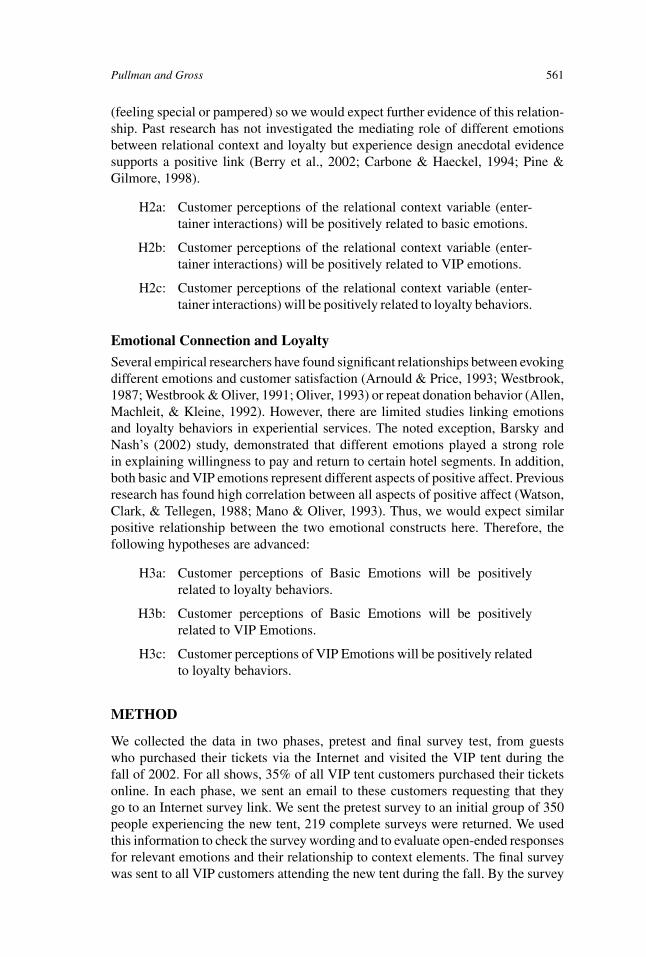
Pullman and Gross 561
(feeling special or pampered) so we would expect further evidence of this relation-ship. Past research has not investigated the mediating role of different emotionsbetween relational context and loyalty but experience design anecdotal evidencesupports a positive link (Berry et al., 2002; Carbone & Haeckel, 1994; Pine &Gilmore, 1998).
H2a: Customer perceptions of the relational context variable (enter-tainer interactions) will be positively related to basic emotions.
H2b: Customer perceptions of the relational context variable (enter-tainer interactions) will be positively related to VIP emotions.
H2c: Customer perceptions of the relational context variable (enter-tainer interactions) will be positively related to loyalty behaviors.
Emotional Connection and Loyalty
Several empirical researchers have found significant relationships between evokingdifferent emotions and customer satisfaction (Arnould & Price, 1993; Westbrook,1987; Westbrook & Oliver, 1991; Oliver, 1993) or repeat donation behavior (Allen,Machleit, & Kleine, 1992). However, there are limited studies linking emotionsand loyalty behaviors in experiential services. The noted exception, Barsky andNash’s (2002) study, demonstrated that different emotions played a strong rolein explaining willingness to pay and return to certain hotel segments. In addition,both basic and VIP emotions represent different aspects of positive affect. Previousresearch has found high correlation between all aspects of positive affect (Watson,Clark, & Tellegen, 1988; Mano & Oliver, 1993). Thus, we would expect similarpositive relationship between the two emotional constructs here. Therefore, thefollowing hypotheses are advanced:
H3a: Customer perceptions of Basic Emotions will be positivelyrelated to loyalty behaviors.
H3b: Customer perceptions of Basic Emotions will be positivelyrelated to VIP Emotions.
H3c: Customer perceptions of VIP Emotions will be positively relatedto loyalty behaviors.
METHOD
We collected the data in two phases, pretest and final survey test, from guestswho purchased their tickets via the Internet and visited the VIP tent during thefall of 2002. For all shows, 35% of all VIP tent customers purchased their ticketsonline. In each phase, we sent an email to these customers requesting that theygo to an Internet survey link. We sent the pretest survey to an initial group of 350people experiencing the new tent, 219 complete surveys were returned. We usedthis information to check the survey wording and to evaluate open-ended responsesfor relevant emotions and their relationship to context elements. The final surveywas sent to all VIP customers attending the new tent during the fall. By the survey

562 Ability of Experience Design Elements to Elicit Emotions and Loyalty Behaviors
closing date, 47% of these customers responded to the survey. After discardingincomplete surveys, the final sample was 400 respondents.
Qualitative Research
We based the initial context measures on items generated by the VIP tent sales staff,marketing managers, and a previous company survey for the old style tent. The salesand marketing managers reviewed the emotion measures to insure that all relevantmeasures were included. In both questionnaires, respondents were asked generalopen-ended questions about the VIP tent experience, that is, “tell us about the VIPexperience, how was it?,” “tell us about the highlights of the VIP experience,”“what elements would you change or improve and how could we make it betterfor you?” The survey was designed so that each emotion measure was followedby a question asking which elements contributed to the feeling and to explain theresponse. In addition, the emotion section was followed by a question to find anyother relevant emotions, e.g., “besides the aforementioned items, what did the VIPtent experience feel like? Why?”
During the first phase, we looked at both quantitative and qualitative measuresto insure that people understood the questions and that the emotion concepts wererelevant. In particular, we looked at the open-ended responses to see if we werecapturing appropriate emotions and their relationship to context elements. In open-ended responses, 70% of the guests spoke about VIP feelings. Here the respondentsspoke about association with the circus troupe and disassociation from “otherpeople” who are not VIP. Generally, respondents indicated that the tent is a placethat reinforces one’s own worth, a place where privileged people and circus peoplemingle and others are not allowed. Typical association comments include: “fromthe time I entered and even the next day, I was still feeling special. . . hip, cool, andspecial,” “the VIP experience made me feel like I was part of the show,” and “itseems like you are part of an exclusive group.” From champagne to frozen fruitpops, we were above the “normal group.” Typical disassociation comments were“we were able to see costumes and photographs that others were not lucky enoughto view” and “it’s like we had inside information that the majority of people didn’thave, like we were closer.” Similarly, 57% of guests spoke of being part of thetheatrical community or part of the show. They said things such as: “I was part ofthe show,” “to be part of the extended show, to hobnob with wizards, to eat suchdelightful food. . . ,” “they gave me every opportunity to be a clown with them, howcould I not be inspired?” and “made the show an unforgettable event, like going toa good friend’s house and having a great time and not wanting to leave.” Thus, thecomments reinforce the idea that people felt VIP-type emotions and that differentelements of the context contributed to these feelings.
Many respondents (65%) discussed experience and entertainment. These peo-ple spoke of “entering or extending the experience” in an immersion sense or ob-serving as spectators with a focus on “entertainment.” Typical comments include“it felt like a give and take experience that was incomplete without participation”and “it didn’t just seem as if you were attending a show; you were attending an ex-perience.” From these comments, it appears that the experience design was havingthe desired effect on creating connection with guests.

Pullman and Gross 563
Almost 80% of all guests made comments about sensing and feeling. Theyconvey the idea that the guests react to and interact with a plethora of sensory stimulithat the tent presents to the guests. In particular, the performers tend to generatefeelings for guests. Guests use words about feeling (65%), exciting (25%), musicor sounds (18%), visual (3%) and inspiring (3%). As one guest reflects, “it wasa very interactive, visual experience, very exciting, and the staff and entertainersin the VIP were provocative and exciting in many ways.” Other typical commentsinclude “to experience as well as watching the interactions with other patrons,sensual overload,” “I felt that the visual stimuli made the biggest impression onme,” “very exciting, satisfying curiosity of seeing it all close up, total immersion,”“interaction with the staff made me feel like part of the team,” and “they madeeveryone feel important. The people were funny and made me feel good. In someways it felt like a family.”
In terms of physical context, food and drinks were mentioned by 64% of allrespondents while 26% mentioned atmosphere or ambiance. According to theircomments, food and drink are part of the entire sensory experience but almost asa secondary motivator. For example, respondents said the following: “Quality offood and availability of performers enhanced the performance experience,” “thefood and drink was amazing but the main decision to do it again would be basedon the displays and the performer(s),” and “the food was impressive.” In termsof ambiance, the lights, sounds, show members, and amenities are perceived asuser-friendly and contribute to an atmosphere where guests can relax. Along theselines, respondents indicate the following: “the atmosphere is a delight for all thesenses,” “the whole atmosphere of the tent just helped you get into the theme of theevening,” “the ambiance of the tent felt a little surreal in a good way,” “laid backatmosphere; the entertainers talked to you,” and “the ambiance and music tendedto lull you into a dream state.”
Relational context, interacting with the clowns, was mentioned by 23% ofthe guests. Here the guests stress that the clowns seem to be able to involve them insatisfying personal encounters and bring the guests “into the clown’s energy.” Typ-ical comments are: “biggest impression would have to be the interaction with theclowns,” “I had an ongoing personal interaction going with one of the lead clowns,”“the tent entertainers interacted with everyone,” and “the interaction with the enter-tainers in the tent was very close and personal.” In all comments about participationwith other people, guests talk about the performers and occasionally the staff (foodservers), with negligible comments about interacting with other guests. Therefore,we did not ask any questions about guests interacting amongst themselves, sincethe experience is specifically designed for interaction with performers.
Scale Development for Exogenous Variables
As mentioned above, specific items were developed for each context factor basedon company input and qualitative analysis. The instrument measured 35 specificcontext items. After evaluating qualitative comments and scale purification, for thesecond phase we reduced the questionnaire to 21 context items with four physicalcontext factors specific to the new VIP tent (food, beverages, seating, and sensorydesign) and one relational context factor (interaction with entertainers). To measure

564 Ability of Experience Design Elements to Elicit Emotions and Loyalty Behaviors
these variables, respondents were asked to respond using a 5-point scale (1 = poorto 5 = outstanding) how well each item contributed to their VIP tent experience.The Appendix provides all measures and factors.
Scale Development for Endogenous Variables
The basic (pleasure-arousal) emotion variables were measured using items fromthe PANAS scale (Watson et al., 1988) and Mano’s domains (1991) for “inspired,”“excited,” “satisfied,” “happy,” and “relaxed.” In her work on measuring emotions,Richins (1997) illustrates the complexity of determining appropriate emotionalmeasures for different products and stresses that measures used in prior researchdo not represent the diversity of emotions. This issue is particularly true whentheory offers little prior information about the kinds of emotional states that maybe relevant to the VIP venues and circus-related behavior under investigation. Inthis case, we used modified VIP emotion items from Barksy and Nash’s (2002)scales for luxury and upscale hotels (“comfortable,” “pampered,” “hip or cool,”“sophisticated,” “important,” and “privileged”). Additional context-specific itemsfor a circus environment such as “entertained,” “amused,” “curious,” and “part ofthe troupe” were suggested by Hirshman and Holbrook’s (1982) work on fun andfantasy hedonics.
We retained all of the above 15 emotion items in both phases. The initialqualitative and quantitative analysis supported the use of all these emotions. Tomeasure these variables, respondents were asked to respond to a 5-point scale (1 =strongly disagree to 5 = strongly agree) with their level of agreement to statementssuch as, “overall, the VIP experience made me feel relaxed.”
The future intent behavior variables were measure with two items. Respon-dents were asked to express their level of agreement on a 5-point scale (1 = stronglydisagree to 5 = strongly agree) to statements of repurchase intent and recommendto others (Godin & Gladwell, 2001; Dabholkar, Shepard, & Thorpe, 2000).
Principal Component and Confirmatory Factor Analysis
We first examined the underlying structure of the endogenous emotion variables(Churchill, 1979). Principal component analysis of the items revealed two itemswith eigenvalues greater than one, explaining 68% of the variance. The items“excited” and “pampered” items had cross loadings on two factors. On further re-flection, “pampered” had ambiguous connotations with both factors and “excited”did not fit well with either set of items, thus we eliminated these items from furtheranalysis. The remaining six items for basic emotion were comfortable, relaxed,happy, satisfied, entertained, and amused; the seven for VIP emotion were sophis-ticated, hip or cool, privileged, important, inspired, curious, and part of the show.The basic emotions reflect similar positive affect items found in Mano and Oliver’sstudy (1993) with the exception of “inspired,” which loaded on VIP emotions. Theirstudy did not include these context-specific VIP emotions therefore the exceptionmakes sense. The factor loading results from the principal components analysis areshown in Table 1.
Principal component analysis and confirmatory factor analysis were con-ducted with the exogenous context variables according to the approach suggested

Pullman and Gross 565
Table 1: Factor loadings and reliabilities for emotions and loyalty measurementmodel.
Factor Reliability Percent ofConstruct/Indicator Loadings Analysis α Variance Explained
Basic EmotionComfort 0.908 0.929 0.740Happy 0.910Satisfied 0.867Entertained 0.833Relaxed 0.831Amused 0.806
VIP EmotionSophisticated 0.848 0.893 0.613Privileged 0.843Inspired 0.798Important 0.794Part of show 0.743Hip or cool 0.732Curious 0.710
Loyalty BehaviorRepurchase 0.928 0.931 0.935Future intent 0.906
by Gerbing and Anderson (1988). Table 2 reports the estimates of factor load-ings from an unconstrained analysis and the reliability analysis (Cronbach’s alphaand average variance extracted) for each construct. The analysis items revealedfive items with eigenvalues greater than one, explaining 77% of the variance. Theresults of the both analysis confirmed that all constructs were unidimensional.
The reliability alphas range between 0.79 and 0.93 significant at p ≤ 0.001.In addition, the square roots of the average variance explained exceed 0.7 indicatingthat each construct is accounting for at least 50% of the variance in its items and95% confidence intervals for interconstruct correlations exclude the value of 1. Theloadings of the measurement items on their constructs are all above 0.6 (Tables 1and 2 from factor analysis; Table 3 from structural equation model) and significantat p ≤ 0.01 indicating good convergent validity.
The indicators display solid discriminant validity in which all possible indi-vidual comparisons showed the correlations between indicators for a given con-struct to be higher than their corresponding correlations with indicators of otherconstructs (Fornell, 1992). Therefore, the indicators used to operationalize the con-structs are appropriate for testing the hypothesized linkages in the full structuralequation model.
To obtain a sufficient number of indicators for causal modeling and reducethe model’s complexity, we divided the exogenous food and ambiance scale intotwo and three parallel measures respectively based on an extract-eight factor so-lution for all exogenous variables. We then formed composite variables for theseconstructs in the model (Homer & Yoon, 1992). The latent construct, sensory, is

566 Ability of Experience Design Elements to Elicit Emotions and Loyalty Behaviors
Table 2: Factor loadings and reliabilities for context measurement model.
Factor Reliability Percent ofConstruct/Indicator Loadings Analysis α Variance Explained
Entertainment InteractionAnimator interaction 0.872 0.793 0.828Animator stunts 0.836
FoodVariety 0.888 0.930 0.74Quality 0.878Desirability 0.877Freshness 0.860Quantity 0.835Display 0.821
BeverageBeer 0.919 0.877 0.891Full bar 0.896
SeatingCouch 0.888 0.849 0.869Bar stools 0.877
Sensory DesignInteractive heads 0.819 0.914 0.750Interactive masks 0.796Costumes 0.776Videos 0.736Interactive high-wire toys 0.722Photos 0.706Ambiance tent materials 0.627Ambiance music 0.611Ambiance lighting 0.531
measure by three summated variables (passive special effects = photo, video, andcostume; immersive special effects = heads, mask, and high wire; and ambiance =lighting, tent, and music). The latent construct, food, is measured by two summatedvariables (range = desirable, variety, and quantity; quality = quality, freshness, anddisplay). Similarly, we divided the endogenous emotions scales into two parallelmeasures for each using the same technique. The latent construct, basic emotion,is measured by two summated variables (satisfaction emotions = relaxed, comfort,happy, and satisfied; fun emotions = entertained and amused). The latent construct,VIP emotion, is measured by two summated variables (sophisticated emotions =sophisticated, hip, privileged, and important; behind scenes = inspired, curious,and part of show). Multiple indicators in the structural equation analysis representedall other constructs.
STRUCTURAL EQUATION DATA ANALYSIS
LISREL 8 was used to examine the relationships between the experience designlatent elements (entertainer interaction, food, beverage, and sensory), emotions,

Pullman and Gross 567
Table 3: Parameter estimates for LISREL model.
UnstandardizedEstimate Unstandardized
Parameter (standardized) t-Value Parameter Estimate t Value
λy1,1 — (2.71) γ 11 1.01 3.90∗λy2,1 0.52 (1.40) 27.51∗ γ 21
λy3,2 — (2.95) γ 31
λy4,2 0.82 (2.41) 20.59∗ γ 1,2 0.52 7.23∗λy5,3 — (0.85) γ 2,2 −0.17 −1.89∗λy6,3 0.98 (0.73) 29.33∗ γ 3,2 −0.10 −3.33∗λx1,1 — (0.73) γ 1,3
λx2,1 0.67 (0.49) 14.52∗ γ 2,3
λx3,2 — (2.52) γ 3,3
λx4,2 0.72 (1.82) 20.04∗ γ 1,4 0.61 4.15λx5,3 — (1.11) γ 2,4
λx6,3 0.74 (0.82) 12.01∗ γ 3,4 −0.15 −2.88λx7,4 — (0.97) γ 1,5
λx8,4 0.93 (0.90) 15.62∗ γ 2,5
λx9,5 — (1.97) γ 3,5 0.07 1.91λx10,5 0.87 (1.71) 16.81∗ β2,1 0.96 9.66∗λx11,5 0.68 (1.34) 15.74∗ β3,1 0.38 7.20∗
β3,2 —
χ2 208.82 df 91p 0.13AGFI 0.90RMSEA 0.05
AGFI, adjusted goodness-of-fit index; df, degrees of freedom; RMSEA, root mean squareerror of approximation.∗Significant paths at p < 0.01 for t values based on one-tailed test.
and loyalty behavior as shown in Figure 1. The η latent endogenous constructsin this model are emotions (basic and VIP) and loyalty behavior, and the ξ latentexogenous constructs are interaction factors, food factors, beverage factors, andsensory factors. The first measurement variable of each latent construct was spec-ified as having a factor loading of λ = 1 in order to assign units of measurementto the unobserved variables.
Because of the hypothesis testing capability of LISREL, we could determinethe likelihood that the relationship among the latent variables actually fit the rela-tionship defined in the hypothesized model. We first analyzed the observed variabledata to assess whether or not the model is correctly specified and then conducteda chi-squared likelihood test. An overall χ2 goodness-of-fit test with a p-valuegreater than 0.05 and a χ2-value that is less than five times the degrees of freedomwould indicate a correctly specified model (Joreskog & Sorbom, 1989). Table 3provides the results of the LISREL analysis for the VIP tent model. Here, LISRELis used to solve the structural equations and the maximum likelihood method wasused to derive the parameter estimates.
568 Ability of Experience Design Elements to Elicit Emotions and Loyalty Behaviors
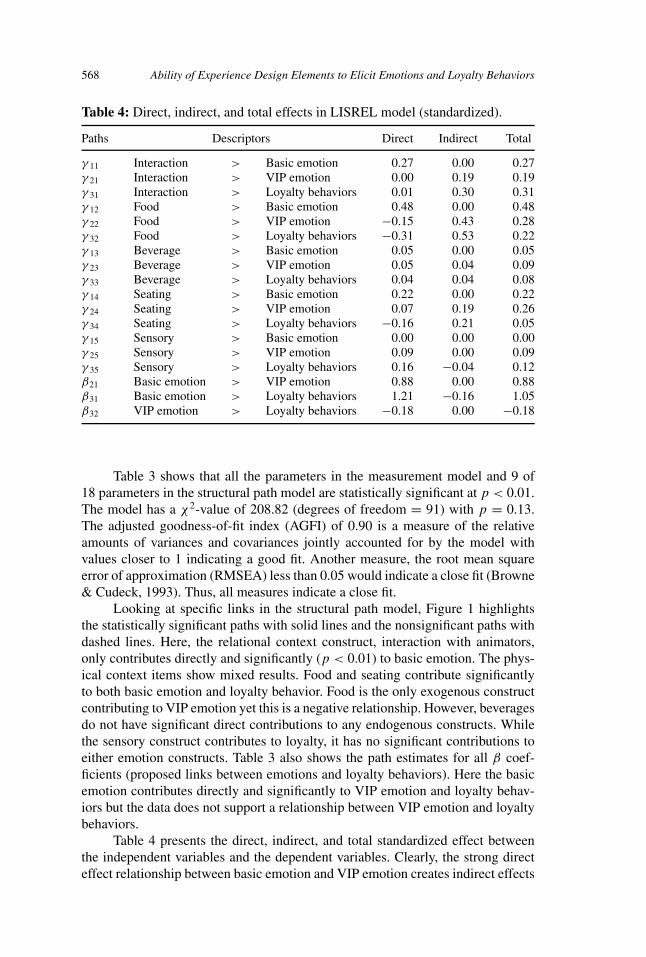
Table 4: Direct, indirect, and total effects in LISREL model (standardized).
Paths Descriptors Direct Indirect Total
γ 11 Interaction > Basic emotion 0.27 0.00 0.27γ 21 Interaction > VIP emotion 0.00 0.19 0.19γ 31 Interaction > Loyalty behaviors 0.01 0.30 0.31γ 12 Food > Basic emotion 0.48 0.00 0.48γ 22 Food > VIP emotion −0.15 0.43 0.28γ 32 Food > Loyalty behaviors −0.31 0.53 0.22γ 13 Beverage > Basic emotion 0.05 0.00 0.05γ 23 Beverage > VIP emotion 0.05 0.04 0.09γ 33 Beverage > Loyalty behaviors 0.04 0.04 0.08γ 14 Seating > Basic emotion 0.22 0.00 0.22γ 24 Seating > VIP emotion 0.07 0.19 0.26γ 34 Seating > Loyalty behaviors −0.16 0.21 0.05γ 15 Sensory > Basic emotion 0.00 0.00 0.00γ 25 Sensory > VIP emotion 0.09 0.00 0.09γ 35 Sensory > Loyalty behaviors 0.16 −0.04 0.12β21 Basic emotion > VIP emotion 0.88 0.00 0.88β31 Basic emotion > Loyalty behaviors 1.21 −0.16 1.05β32 VIP emotion > Loyalty behaviors −0.18 0.00 −0.18
Table 3 shows that all the parameters in the measurement model and 9 of18 parameters in the structural path model are statistically significant at p < 0.01.The model has a χ2-value of 208.82 (degrees of freedom = 91) with p = 0.13.The adjusted goodness-of-fit index (AGFI) of 0.90 is a measure of the relativeamounts of variances and covariances jointly accounted for by the model withvalues closer to 1 indicating a good fit. Another measure, the root mean squareerror of approximation (RMSEA) less than 0.05 would indicate a close fit (Browne& Cudeck, 1993). Thus, all measures indicate a close fit.
Looking at specific links in the structural path model, Figure 1 highlightsthe statistically significant paths with solid lines and the nonsignificant paths withdashed lines. Here, the relational context construct, interaction with animators,only contributes directly and significantly (p < 0.01) to basic emotion. The phys-ical context items show mixed results. Food and seating contribute significantlyto both basic emotion and loyalty behavior. Food is the only exogenous constructcontributing to VIP emotion yet this is a negative relationship. However, beveragesdo not have significant direct contributions to any endogenous constructs. Whilethe sensory construct contributes to loyalty, it has no significant contributions toeither emotion constructs. Table 3 also shows the path estimates for all β coef-ficients (proposed links between emotions and loyalty behaviors). Here the basicemotion contributes directly and significantly to VIP emotion and loyalty behav-iors but the data does not support a relationship between VIP emotion and loyaltybehaviors.
Table 4 presents the direct, indirect, and total standardized effect betweenthe independent variables and the dependent variables. Clearly, the strong directeffect relationship between basic emotion and VIP emotion creates indirect effects

Pullman and Gross 569
between the context design elements, VIP emotions, and loyalty behaviors. Largepositive indirect effects counter the negative direct effects of food and seatingon loyalty behaviors and the negative effect of food on VIP behavior. Overall,interaction with performers has the largest total effect on loyalty followed by foodand sensory design elements. The beverages and seating have only minor totaleffects.
Basic emotion plays a strong mediating role in the model according to thecriteria outlined by Baron and Kenny (1996). Their criteria suggest that mediation isdemonstrated when the predictors (i.e., interaction, food, and seating) is statisticallyrelated to the mediator (i.e., basic emotion) and the mediator is statistically relatedto the dependent variable (i.e., loyalty). According to this criterion, basic emotionis a mediator for most of the design variables, while VIP emotion has a statisticallyinsignificant role as a mediator.
Thus, it appears H1a, the relationship between physical context variable andbasic emotion is only partially supported for food and seating. H1b, the direct rela-tionship between physical context variables and VIP emotions, is not supported andthe only significant path between food and VIP emotions is a negative relationship.On the other hand, the total effect between these variables and VIP emotions issignificant due to the mediating role of basic emotion. Similarly, H1c, the relation-ship between physical context variables and loyalty is only partially supported withsignificance for sensory elements and significant but negative for food and seating.Again, there is a significant total effect for food, seating, and sensory elements dueto mediation by basic emotion variables.
We found support for the proposed relationships between relational contextand basic emotions (H2a); and we found support with total effects but not the directeffect for the relationship between relational context (H2b) and VIP emotion andloyalty (H2c). Again, this occurs due to the mediating role of basic emotion. Fi-nally, H3a and H3b, the proposed relationships between basic emotions and loyaltyand VIP emotions, respectively, were supported. H3c, the proposed relationshipbetween VIP emotions and loyalty behaviors, was not supported.
DISCUSSION AND IMPLICATIONS
This purpose of this article was to explore the relationship between different serviceelements designed to create enhanced experience and customer loyalty. A modelwas proposed and tested in a specific experiential service setting. However, as anexploratory exercise, many interesting results emerged that have implications forservice managers and researchers. First, much of the previous empirical serviceoperations research has focused on relating functional and attribute levels to overallassessments of customer satisfaction. For many services, loyalty behavior measuresare more significant and are meaningful indicators of a firm’s future performance.Consistent with Barsky and Nash’s (2002) research, this study shows that the typeof customer emotions evoked in a hospitality setting significantly influence loyaltybehaviors. In this case, because basic emotion played a strong mediating role,all of the design variables affected loyalty behavior. The other relevant emotionalconstruct, VIP emotions, played a largely insignificant role with only one significantyet negative relationship to food perceptions. Surprisingly, even though the tent
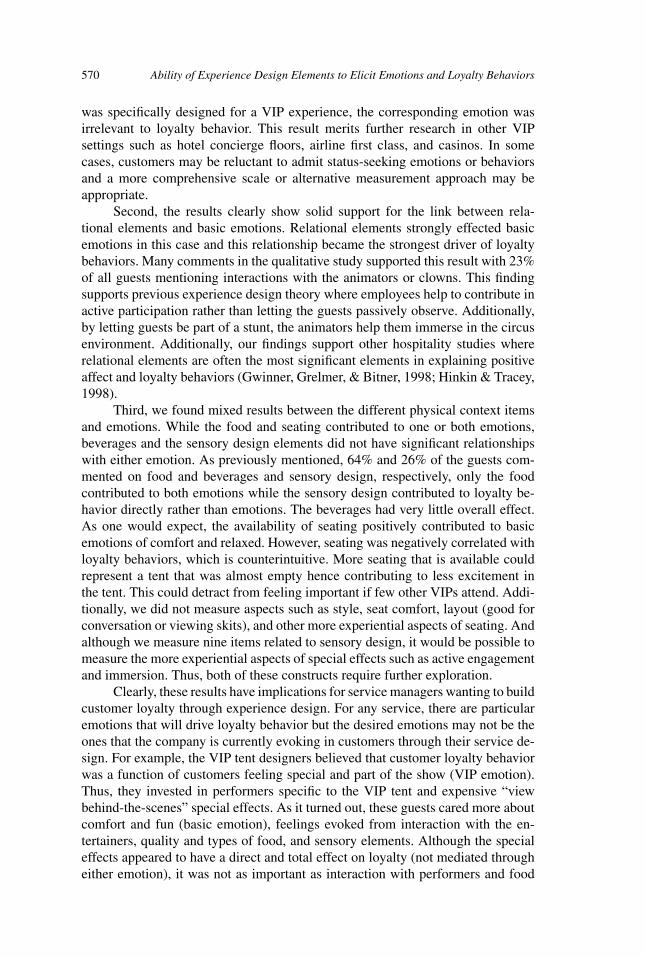
570 Ability of Experience Design Elements to Elicit Emotions and Loyalty Behaviors
was specifically designed for a VIP experience, the corresponding emotion wasirrelevant to loyalty behavior. This result merits further research in other VIPsettings such as hotel concierge floors, airline first class, and casinos. In somecases, customers may be reluctant to admit status-seeking emotions or behaviorsand a more comprehensive scale or alternative measurement approach may beappropriate.
Second, the results clearly show solid support for the link between rela-tional elements and basic emotions. Relational elements strongly effected basicemotions in this case and this relationship became the strongest driver of loyaltybehaviors. Many comments in the qualitative study supported this result with 23%of all guests mentioning interactions with the animators or clowns. This findingsupports previous experience design theory where employees help to contribute inactive participation rather than letting the guests passively observe. Additionally,by letting guests be part of a stunt, the animators help them immerse in the circusenvironment. Additionally, our findings support other hospitality studies whererelational elements are often the most significant elements in explaining positiveaffect and loyalty behaviors (Gwinner, Grelmer, & Bitner, 1998; Hinkin & Tracey,1998).
Third, we found mixed results between the different physical context itemsand emotions. While the food and seating contributed to one or both emotions,beverages and the sensory design elements did not have significant relationshipswith either emotion. As previously mentioned, 64% and 26% of the guests com-mented on food and beverages and sensory design, respectively, only the foodcontributed to both emotions while the sensory design contributed to loyalty be-havior directly rather than emotions. The beverages had very little overall effect.As one would expect, the availability of seating positively contributed to basicemotions of comfort and relaxed. However, seating was negatively correlated withloyalty behaviors, which is counterintuitive. More seating that is available couldrepresent a tent that was almost empty hence contributing to less excitement inthe tent. This could detract from feeling important if few other VIPs attend. Addi-tionally, we did not measure aspects such as style, seat comfort, layout (good forconversation or viewing skits), and other more experiential aspects of seating. Andalthough we measure nine items related to sensory design, it would be possible tomeasure the more experiential aspects of special effects such as active engagementand immersion. Thus, both of these constructs require further exploration.
Clearly, these results have implications for service managers wanting to buildcustomer loyalty through experience design. For any service, there are particularemotions that will drive loyalty behavior but the desired emotions may not be theones that the company is currently evoking in customers through their service de-sign. For example, the VIP tent designers believed that customer loyalty behaviorwas a function of customers feeling special and part of the show (VIP emotion).Thus, they invested in performers specific to the VIP tent and expensive “viewbehind-the-scenes” special effects. As it turned out, these guests cared more aboutcomfort and fun (basic emotion), feelings evoked from interaction with the en-tertainers, quality and types of food, and sensory elements. Although the specialeffects appeared to have a direct and total effect on loyalty (not mediated througheither emotion), it was not as important as interaction with performers and food
Pullman and Gross 571
when considering the basic emotion mediation. This result has implications fordetermining how management focuses resources. In this case, management shouldallocate resources primarily at the animators and food. The more costly aspectsof special effects, serving additional alcoholic beverages (beyond champagne),and the tent ambience were much less important because they did not contributeto basic emotion. In their comments, guests rarely mentioned the large and costlyimmersive effects. Adding a full bar and additional seating are the lowest priorities.
This study has implications for current service assessment and management.Most hospitality organizations are not measuring customer emotions. Instead, theyrely on one measurement of satisfaction. As an alternative, experiential servicesshould determine key emotions driving loyalty and then design and manage serviceprocesses that positively affect those emotions. For example, the priority of VIP tentmanagement should be toward developing their relational context through hiringand training for all employees that can interact with the guests. Equally importantis the consistent delivery and presentation of high-quality food through carefulselection and training of caterers in the tour cities.
In the data collection reported here, the emotion response scales were verysimplistic and of an exploratory nature. We chose a simple method similar to thePANAS scale (Watson et al., 1988) due to a lengthy survey. In addition, there wereno negative emotions included for this context. Different services evoke differentranges of emotions (Richins, 1997). For example, the use of recreational servicesor products is usually pleasurable but medical services evoke both positive (i.e.,comfort) and negative (i.e., worry or frustration) emotions. For some contexts, itwould be equally important to know which service design elements could provokenegative emotions.
In conclusion, this exploratory study took a few steps toward understandinghow different experience design elements can contribute toward emotional con-nection and loyalty behaviors. Future research work could focus on other typesof service industries, different service design elements, and alternative emotions.Because measuring emotions is quite complex and challenging, there are manychallenging opportunities available for both qualitative and quantitative perspec-tives. [Received: February 2003. Accepted: March 2004.]
REFERENCES
Alben, L. (1996). Quality of experience: Defining the criteria for effective interac-tion design. Interactions, 3(3), 11–15.
Allen, C., Machleit, K., & Kleine, S. (1992). A comparison of attitudes and emo-tions as predictors of behavior at diverse levels of behavioral experience.Journal of Consumer Research, 18, 493–504.
Anderson, E. W., & Fornell, C. (1994). A customer satisfaction research prospectus.In R. T. Rust & R. Oliver (Eds.), Service quality: New directions in theoryand practice. Thousand Oaks, CA: Sage, 241–268.
Arnould, E., & Price, L. (1993). River magic: Extraordinary experience and theextended service encounter. Journal of Consumer Research, 20, 24–45.

572 Ability of Experience Design Elements to Elicit Emotions and Loyalty Behaviors
Bacon, P. (2002). There goes the suite life. Time, 160(18), 22.
Baker, J., & Cameron, M. (1996). The effects of service environment on affectand consumer perception of waiting time: An integrative review and researchpropositions. Journal of the Academy of Marketing Science, 24(4), 338–349.
Baker, J., Grewal, D., & Parasuraman, A. (1994). The influence of store envi-ronment on quality inferences and store image. Journal of the Academy ofMarketing Science, 22(4), 328–339.
Baker, J., Levy, M., & Grewal, D. (1992). An experimental approach to makingretail store environment decisions. Journal of Retailing, 68(4), 445–460.
Barksy, J., & Nash, L. (2002). Evoking emotion: Affective keys to hotel loyalty.Cornell Hospitality and Restaurant Administration Quarterly, 43(1), 39–46.
Barnes, B. (2000, April 26). Theaters create luxury class for sponsors. Wall StreetJournal.
Baron, R., & Kenny, D. (1986). The mediator-moderator variable distinction insocial psychological research: Conceptual, strategic, and statistical consider-ations. Journal of Personality and Social Psychology, 51, 1173–1182.
Belk, R. (1975). Situational variables and consumer behavior. Journal of ConsumerResearch, 2, 157–164.
Berry, L., & Bendapudi, N. (2003). Clueing in the customers. Harvard BusinessReview, 81(2), 100–106.
Berry, L., Carbone, L., & Haeckel, S. (2002). Managing the total customer expe-rience. MIT Sloan Management Review, 43(3), 85–89.
Bitner, M. J. (1990). Evaluating service encounters—The effects of physical sur-roundings and employee response. Journal of Marketing, 54, 69–82.
Bitner, M. J. (1992). Servicescapes: The impact of physical surroundings on cus-tomers and employees. Journal of Marketing, 56, 57–71.
Bitner, M. J. (2000). The servicescape. In T. A. Swartz & D. Iacobucci (Eds.),Handbook of services marketing and management. Thousand Oaks, CA:Sage, 37–50.
Bloemer, J., & de Ruyter, K. (1999). Customer loyalty in high and low involvementservice settings: The moderating impact of positive emotions. Journal ofMarketing Management, 15, 315–330.
Boraks, D. (2002). Preferred issues; Financing pro sports no longer just a niche.American Banker, 167(229), 9.
Browne, M. W., & Cudeck, R. (1993). Alternative ways of assessing model fit. InK. A. Bollen & J. S. Long (Eds.), Testing structural equation models. BeverlyHills, CA: Sage, 94–118.
Buzalka, M. (2000). Catering to the suite life. Food Management, 35(7), 54–57.
Carbone, L. & Haeckel, S. (1994). Engineering customer experience. MarketingManagement, 3(3), 8–19.
Chase, R. (1981). The customer contact approach to services: Theoretical basesand practical extensions. Operations Research, 29(4).

Pullman and Gross 573
Churchill, G. A. (1979). A paradigm for developing better measures of marketingconstructs. Journal of Marketing Research, 16, 64–73.
Collier, D. (1994). The service/quality solution: Using service management to gaincompetitive advantage. New York: Irwin and ASQC Quality Press.
Cook, L. S., Bowen, D. E., Chase, R. B., Dasu, S., Stewart, D. M., & Tansik, D. A.(2002). Human issues in service design. Journal of Operations Management,20, 159–174.
Cronin, J. J., & Taylor, S. A. (1992). Measuring service quality: A reexaminationand extension. Journal of Marketing, 56, 55–68.
Csikszentmihalyi, M. (1991). Flow: The psychology of optimal experience. NewYork: Harper Perennial.
Csikszentmihalyi, M. (1997). Finding flow: The psychology of engagement witheveryday life. New York: BasicBooks.
Dabholkar, P., Shepherd, C., & Thorpe, D. (2000). A comprehensive frameworkfor service quality: An investigation of critical conceptual and measurementissues through a longitudinal study. Journal of Retailing, 76(2), 139–173.
Davenport, T., & Beck, J. (2002). The attention economy: Understanding the newcurrency of business. Boston: Harvard Business School Press.
Dewey, J. (1963). Experience and education. New York: Collier Books.
Dube, L., Chebat, J. C., & Morin, S. (1995). The effects of background musicon consumers’ desire to affiliate in buyer-seller interaction. Psychology andMarketing, 12(4), 305–319.
Finkelstein, J. (1989). Dining out: A sociology of modern manners. Cambridge,UK: Polity Press.
Ford, W. S. Z. (1998). Communicating with customers: Service approaches, ethics,and impact. Cresskill, NJ: Hampton.
Ford, W. S. Z. (1999). Communication and customer service. In M. E. Roloff (Ed.),Communication yearbook, Vol. 22, 341–375. Thousand Oaks, CA: Sage.
Ford, W. S. Z. (2001). Customer expectations for interactions with serviceproviders: Relationship versus encounter orientation and personalized servicecommunication. Journal of Applied Communication Research, 29, 1–29.
Ford, W. S. Z. (2003). Communication practices of professional service providers:Predicting customer satisfaction and loyalty. Journal of Applied Communi-cation Research, 31, 189–211.
Fornell, C. (1992). A national customer satisfaction barometer: The Swedish ex-perience. Journal of Marketing, 56, 6–21.
Fournier, S., & Mick, D. G. (1999). Rediscovering satisfaction. Journal of Mar-keting, 63, 5–23.
Gerbing, D. W., & Anderson, J. C. (1988). An updated paradigm for scale de-velopment incorporating unidimensionality and its assessment. Journal ofMarketing Research, 25, 186–192.

574 Ability of Experience Design Elements to Elicit Emotions and Loyalty Behaviors
Gitomer, J. (1998). Customer satisfaction is worthless: Customer loyalty is price-less. Austin, TX: Bard Press.
Gardner, M. (1985). Mood states and consumer behavior: A critical review. Journalof Consumer Research, 12, 281–300.
Gobe, M., & Zyman, S. (2001). Emotional branding: The new paradigm for con-necting brands to people. New York: Allworth Press.
Godin, S., & Gladwell, M. (2001). Unleashing the idea virus. New York: HyperionBooks.
Gupta, S., & Vajic, M. (1999). The contextual and dialectical nature of experiences.In J. Fitzsimmons & M. Fitzsimmons (Eds.), New service development. Thou-sand Oaks, CA: Sage, 33–51.
Gutek, B. (1995). The dynamics of service: Reflections on the changing nature ofcustomer/provider interactions. San Francisco: Jossey-Bass.
Gutek, B., Bhappu, A. D., Liao-Troth, M. A., & Cherry, B. (1999). Distinguishingbetween service relationships and encounters. Journal of Applied Psychology,84, 218–233.
Gwinner, K., Gremler, D., & Bitner, M. J. (1998). Relational benefits in servicesindustries: The customer’s perspective. Journal of the Academy of MarketingScience, 26(2), 101–114.
Hanefors, M., & Mossberg, L. (2003). Searching for the extraordinary meal expe-rience. Journal of Business and Management, 9(3), 249–270.
Heskett, J., Reichheld, F., & Sasser, W. (1990). Zero defections: Quality comes toservices. Harvard Business Review, 68(5), 105–112.
Heskett, J., Sasser, W., & Schlesinger, L. (1997). Service profit chain: How leadingcompanies link profit and growth to loyalty, satisfaction, and value. New York:Free Press.
Hinkin, T., & Tracey, J. B. (1998). The service imperative. Cornell Hospitality andRestaurant Administration Quarterly, 10, 59–67.
Hirschman, E. C., & Holbrook, B. M. (1982). Hedonic consumption: Emergingconcepts, methods, and propositions. Journal of Marketing, 46(3), 92–101.
Holbrook, M. (1994). The nature of customer value. In R. Rust & R. Oliver (Eds.),Service quality: New directions in theory and practice. Thousand Oaks, CA:Sage.
Homer, P., & Yoon, S. (1992). Message framing and the interrelationships amongad-based feelings, affect, and cognition. Journal of Advertising, 21, 19–33.
Jensen, R. (1999). The dream society: How the coming shift from information toimagination will transform your business. New York: McGraw-Hill.
Johnston, R. (1995). The zone of tolerance: Exploring the relationship between ser-vice transactions and satisfaction with overall service. International Journalof Service Industry Management, 6(2), 46–61.
Joreskog, K., & Sorbom, D. (1989). LISREL 7: A guide to the program and appli-cations (2nd ed.). Chicago: SPSS Inc.

Pullman and Gross 575
Kellogg, D., Youngdahl, W., & Bowen, D. (1997). On the relationship between cus-tomer participation and satisfaction: Two frameworks. International Journalof Service Industry Management, 8(3), 206–219.
Mael, F., & Ashforth, B. (1992). Alumni and their alma matter: A partial test ofthe reformulated model of organizational identification. Journal of Organi-zational Behavior, 13, 103–123.
Mano, H. (1991). The structure and intensity of emotional experiences: Methodand context convergence. Multivariate Behavioral Research, 26(3), 389–411.
Mano, H. & Oliver, R. (1993). Assessing the dimensionality and structure of con-sumption experience: Evaluation, feeling, and satisfaction. Journal of Con-sumer Research, 20(3), 451–466.
McLellan, H. (2000). Experience design. Cyberpsychology & Behavior, 3(1), 59–69.
Mehrabian, A., & Russell, J. (1974). An approach to environmental psychology.Cambridge: Massachusetts Institute of Psychology.
Metters, R., King-Metters, K., & Pullman, M. (2003). Successful service operationsmanagement. Mason, OH: South-Western Publishing.
Nasar, J. (1988). Environmental aesthetics: Theory, research, and applications (1sted.). Cambridge, UK: Cambridge University Press.
Oliver, R. (1989). Processing of the satisfaction response in consumption: Asuggested framework and research propositions. Journal of ConsumerSatisfaction/Dissatisfaction and Complaining Behavior, 2, 1–16.
Oliver, R. (1993). Cognitive, affective, and attribute bases of the satisfaction re-sponse. Journal of Consumer Research, 20, 418–430.
Oliver, R. (1996). Satisfaction: A behavioral perspective on the consumer. NewYork: McGraw-Hill.
Parasuraman, A., Zeithaml, V. A., & Barry, L. L. (1994). Reassessment of expec-tations as a comparison standard for measuring service quality: Implicationsfor future research. Journal of Marketing, 58, 111–124.
Pine, B., & Gilmore, J. (1998). Welcome to the experience economy. HarvardBusiness Review, (July–August), 97–105.
Pine, B., & Gilmore, J. (1999). The experience economy. Boston: Harvard BusinessSchool Press.
Price, L., Arnould, L., & Tierney, P. (1995). Going to extremes: Managing serviceencounters and assessing provider performance. Journal of Marketing, 59,83–97.
Reichheld, F. (1996). The loyalty effect: The hidden forces behind growth, profits,and lasting value. Boston: Harvard Business School Press.
Richins, M. (1997). Measuring emotions in the consumption experience. Journalof Consumer Research, 24, 127–146.
Rubis, L. (1998). Show and tell. Human Resources Magazine (April), 110–117.
576 Ability of Experience Design Elements to Elicit Emotions and Loyalty Behaviors
Scapp, R., & Seitz, B. (1998). Introduction. In R. Scapp & B. Seitz (Eds.), Eatingculture. Albany, NY: State University of New York Press, 1–10.
Schmitt, B. (1999). Experiential marketing. New York: The Free Press.
Statis, A. (1999). Organization and aesthetics (1st ed.). London: Sage.
Teas, R. K. (1993). Expectations, performance evaluation, and consumer’s percep-tions of quality. Journal of Marketing, 57, 18–34.
Teas, R. K. (1994). Expectations as comparison standard in measuring servicequality: An assessment of a reassessment. Journal of Marketing, 58, 132–139.
Wakefield, K., & Blodgett, G. (1996). The effect of the servicescape on customers’behavioral intentions in leisure service settings. Journal of Services Market-ing, 10(6), 45–61.
Wasserman, V., Rafaeli, A., & Kluger, A. (2000). Aesthetic symbols as emotionalcues. In S. Fineman (Ed.), Emotion in organizations. London: Sage, 140–165.
Watson, D., Clark, L. A., & Tellegen, A. (1988). Development and validation ofbrief measures of positive and negative affect: The PANAS scales. Journalof Personality and Social Psychology, 54, 219–235.
Westbrook, R. A. (1980). A rating scale for measuring product/service satisfaction.Journal of Marketing, 44, 68–72.
Westbrook, R. A. (1983). Consumer satisfaction and the phenomenology of emo-tions during automobile ownership experiences. In R. L. Day & H. K. Hunt(Eds.), International fare in consumer satisfaction and complaining behav-ior. Bloomington, IN: Indiana University, 2–9.
Westbrook, R. (1987). Product/consumption-based affective responses and postpurchase processes. Journal of Marketing Research, 24, 258–270.
Westbrook, R., & Oliver, R. (1991). The dimensionality of consumption emotionpatterns and consumer satisfaction. Journal of Consumer Research, 18, 84–91.
Wolf, M. J. (1999). The entertainment economy—How mega-media forces aretransforming our lives. New York: Times Books, Random House.
Zaltman, G. (2003). How customers think: Essential insights into the mind of themarket. Boston: Harvard Business School Press.
Zeithaml, V., Parasuraman, A., & Berry, L. (1990). Delivering quality service:Balancing customer perceptions and expectations. New York: Free Press.
Zuckerman, M. (1971). Dimensions of sensation seeking. Journal of ConsultingPsychology, 36, 45–52.

Pullman and Gross 577
APPENDIX
Experience Design Factors and Measures
Exogenous Endogenous
Entertainment Interactions Basic EmotionInteractions with tent entertainers • Satisfaction compositeEntertainer stunts Comfort
Food Relaxed• Food range composite Happy
Availability of an adequate variety of food SatisfiedAvailability of desired food types • Fun compositeFood quantity composite: Entertained
• Food quality AmusedFood quality Pampered∗Food freshness VIP emotionDisplay of food on carts • Sophisticated composite
Beverages Bar SophisticatedAvailability of a full cocktail bar PrivilegedAvailability of beer Important
Seating Hip or coolAvailability of couches • Behind-the-scene composite:Availability of bar style seats Inspired
Sensory Design Curious• Passive Effects Composite: Part of the show
Photographs of performers Excited∗Costume displays from various shows Loyalty BehaviorsVideos of backstage activities You would purchase the
• Immersive effects composite VIP package for your next showLarge head sculptures with special effects You would recommend theGiant mask with 3D effects VIP experience to othersHigh-wire suspended toys and props
• Tent ambience compositeVIP tent lightingVIP tent colors and materialsVIP tent music and sound effects
∗Item dropped during exploratory factor analysis.
Madeleine (Mellie) Pullman is associate professor of operations management atCornell School of Hotel Administration. She earned her PhD in business adminis-tration at the University of Utah in 1997. She has taught in Graduate and Execu-tive programs at Cornell University, London Business School, Southern MethodistUniversity, CSU, CU, and University of Utah. Her major research and consultinginterests include service operations management, global operations, entertainmentand recreational services, service and experience design, and operations/marketinginterdisciplinary issues. Her articles have appeared in various journals includingJournal of Operations Management, Decision Sciences, Production and Opera-tions Management, Journal of Service Research, International Journal of Service

578 Ability of Experience Design Elements to Elicit Emotions and Loyalty Behaviors
Industry Management, Cornell Hotel and Restaurant Administration Quarterly,Omega, and Journal of Product Innovation Management.
Michael A. Gross (PhD, Arizona State University) is assistant professor ofmanagement in the College of Business at Colorado State University. Recently,Dr. Gross was a guest editor for a special issue on conflict and decision making inorganizations for the Journal of Business and Management. He has published in theInternational Journal of Conflict Management, Journal of Management Education,and Journal of Applied Communication Research. Dr. Gross’s current research in-terests focus on managing perceptions of competence and conflict management,conflict during family business succession, conflict during customer experienceencounters, verbal aggression and workplace violence.