ABCs and AYP in North Carolina & Charlotte Mecklenburg Schools
23
ABCs and AYP in North Carolina & Charlotte Mecklenburg Schools Christopher I Cobitz, Ph.D. Director of Assessment March 2009
-
Upload
shannon-dominguez -
Category
Documents
-
view
19 -
download
1
description
ABCs and AYP in North Carolina & Charlotte Mecklenburg Schools. Christopher I Cobitz, Ph.D. Director of Assessment March 2009. ABCs Accountability NCLB Accountability CMS Progress Reports. Three issues to cover. Accountability Basic Skills with high educational standards - PowerPoint PPT Presentation
Transcript of ABCs and AYP in North Carolina & Charlotte Mecklenburg Schools

ABCs and AYP in North Carolina
&
Charlotte Mecklenburg Schools
Christopher I Cobitz, Ph.D.Director of Assessment
March 2009

Three issues to cover
• ABCs Accountability
• NCLB Accountability
• CMS Progress Reports

ABCs Accountability
• Accountability
• Basic Skills with high educational standards
• Control (at the local level)

NC Testing Program
• Based on the NC Standard Course of Study – the State’s Curriculum
• End-of-Grade (Grades 3-8)
• End-of-Course (High School and some Middle Schools)
• Alternate Assessments
• Other tests

Percent of Students’ Scores At or Above Achievement Level III in:
– EOG Science (Grades 5, 8), – Reading and Math (Grades 3-8)– 10 EOC Tests– Alternate Assessments (NC CLAS,
NCEXTEND2, NCEXTEND1)– Writing 10 (with confidence interval)– Computer Skills at grade 8 (as percent of
8th graders)
Performance Composite 08-09

Proficient
• In NC– Based on pass rate in first year of a test
(usually)– Tests are Global knowledge– Average student is a mid level III– Level I for math is almost worse than
guessing
• Does include retest1 for EOG’s• Includes alternate assessments• Only true level III or IV
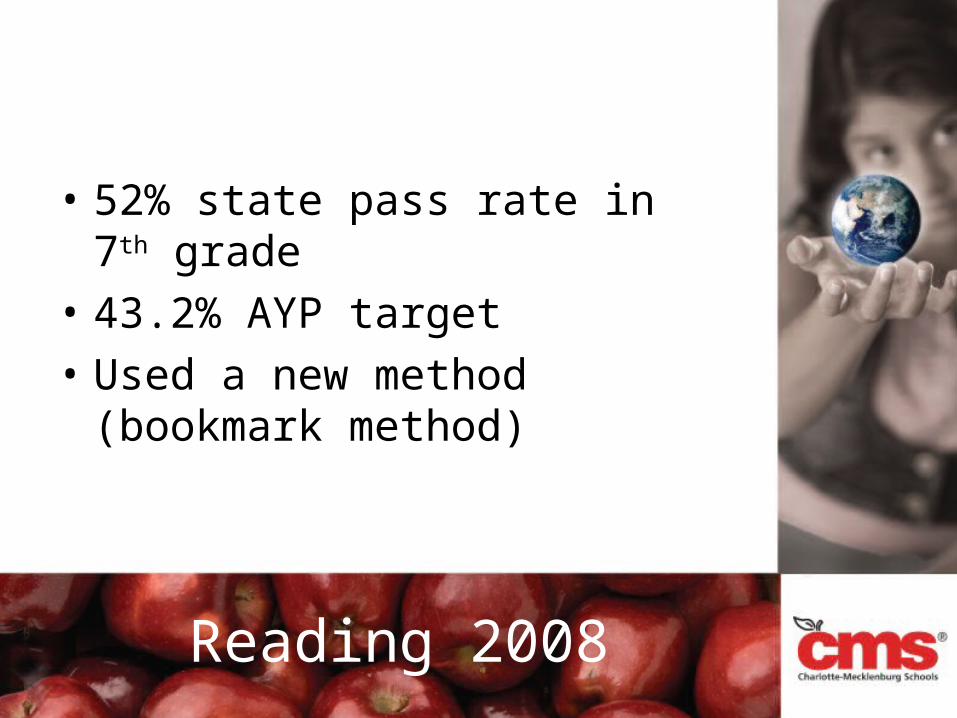
Reading 2008
• 52% state pass rate in 7th grade
• 43.2% AYP target
• Used a new method (bookmark method)

Growth
• In NC– How the typical child with this test
history does– Average child meets expected growth– Expectation is also the predicted
score
• Each child has a specific target– Each child is different

Details
• Alternate assessments are not included in growth
• Growth is calculated per student using newer formulas
• High growth requires greater than 60% of scores meeting the growth standard
• Only Full Academic Year students– 140 days for EOG or year long EOC– 70 days for 4x4 EOC

Growth 08-09
• Only includes the 5 exit standard EOC’s
• Only EOG reading and EOG Math (no EOG Science)
• No Alternate assessments

ABCs Awards and Recognition Categories
Performance LevelBased on Percent of
Students’ Scores at or above Achievement Level III
Academic Growth
Schools Making Expected Growth or
High Growth
Schools Making Less than Expected
Growth
90% to 100% Met AYP- HonorNot met –School of
Excellence
No Recognition80% to 89% School of Distinction
60% to 79% School of Progress
50% to 59% Priority School
Less than 50% Priority School Low-Performing

Incentive Awards
Financial awards based on Growth
Expected Growth ($750)
High Growth ($1,500)
Not enough money in 07-08
No Child Left Behind
• All or none model
• School and specific groups
• Other Academic Indicator
• Reporting requirements
• Sanctions not rewards

Participation vs. Proficient
• Participation– 95% in each group having at least 40
students on the day of testing– HS -10th graders using banked scores
• Proficiency– Only tested FAY (140 day) students count– Only groups with 40 or more tested FAY
students– HS – 10th graders using banked scores

AYP Targets
Year 3-8 10
Reading Math Reading Math
04 68.9 74.6 52.0 54.9
05 76.7 81.0 35.4 70.8
07 76.7 65.8 35.4 70.8
08 43.2 77.2 38.5 68.4
14 100 100 100 100

2006-07 AYPDisaggregations
Analysis of number of AYP targets and percent of schools
meeting AYP reveals no major trend

CMS Progress ReportsA Framework
• AYP is a noble Goal• ABCs measure using tests• Not all schools start with the same clientele
– Some students know enough to pass a
test on day one!– Some students can make 3 years
progress and still not be proficient

How do we handle this?
• In addition to providing some plain information about the school:– Provide information that measures what
the school does for and with their students
– Generally does not measure who comes
to the school

Some Examples
• A school does not control the ethnicity of its students– The progress reports focus on how the
school is serving its students
• A School does not control the level of poverty of its students– The progress reports show how well
the school is helping the poor students

The Progress Report Measures
• Growth of all the students• Growth of the lowest achieving group
of students (elementary and middle schools)
• Percent of students making at least a year’s growth
• AP test pass rate– For students who show the skills to be
successful

Unusual measures
• Percent of students that feel safe at school• Percent of students that feel engaged by the
school• Percent of students that feel encouraged by the
school• Participation in weighted courses
– Of those students who enter at grade level
• Participation in AP or IB course– Of those students who show the skills to be successful
• Graduation Rate (high schools only)

Graduation Rate
• Federal guidelines
• All States agree
• NC does the calculations
• Those students who graduate in 4 years or less– Compared to the students who come
into the school over the 4 years

Questions?