Abbott Laboratories (ABT)
29
ABBOTT LABORATORIES (ABT) SHOAIB HAROON | ANGELA JIANG April 21, 2011
Transcript of Abbott Laboratories (ABT)
ABBOTT LABORATORIES (ABT)SHOAIB HAROON | ANGELA JIANGApril 21, 2011

Agenda Company Overview Industry Analysis Competition and SWOT Analysis MD&A Financial Analysis Valuation Recommendation

Company Overview Founded in 1900 by Dr. Wallace C.
Abbott Discovery, development, manufacture,
and sale of diversified line of healthcare products
6th largest global pharmaceutical provider
Headquartered in Abbot Park, Illinois Employees about 90,000
Data from Google Finance

Key Financials FY ‘09 Revenues: $30.76B up 4.2% Market Capitalization: $79.11B P/E: 17.19 Current Share Price: $50.80 Operating Margin: 17.31% Net Profit Margin: 13.15% RoA: 8.27% RoE: 20.45%
Data from Google Finance

Major ProductsMarket Segment
Revenues % Target End User Major Products
Pharmaceuticals
53.60 Government, retailers
Humira, TriCor, TriLipix, Synthroid
Diagnostic Products
11.60 Hospitals, blood banks, clinics
Architect, Imx, Commander, Prism
Nutritional Products
17.20 Retailers, wholesalers, third party distributors
Similac and Isomil brands
Vascular Products
8.80 Hospitals and Abbot owned distribution centers
Xience V, Multi-Link, Starclose
Other 8.90 Healthcare facilities, mail order pharmacies, public warehouses
Blood glucose monitoring meters and stripes, data management software
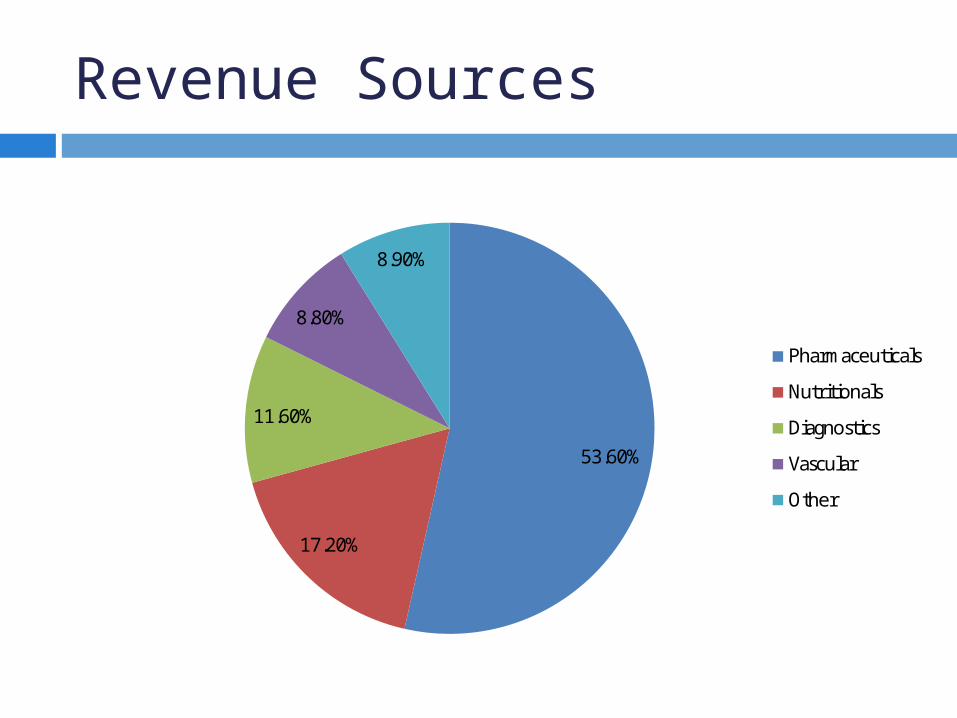
Revenue Sources
53.60%
17.20%
11.60%
8.80%
8.90%
Pharmaceuticals
Nutritionals
Diagnostics
Vascular
Other

Geographic Sales
U.S., 47%
Eurozone, 21%
UK, 3%
Others, 25%

Industry Drivers M&A activity and licensing activity
In-Licensing Both activities needed to maintain growth
Cost Containment Regulation
Increased use in generics Rising healthcare expenses Aging population
Biologics New manufacturing methods Different treatments
Part D Companies contributing to Medicare Donut hole

Industry Analysis Decelerating growth in recent years
Limited projects in R&D pipelines Decreasing prescription drug needs
Stabilizing growth through 2014 Consolidating industry Increasing product diversification to
maintain competition Cardiovascular and central nervous system
sales most profitable Strong revenue gains from Emerging Markets

Industry Growth
Year Sales (Billions) Growth2005 545.32006 571.5 4.80%2007 601.4 5.20%2008 625.6 4.00%2009 644.2 3.00%
0.00%
1.00%
2.00%
3.00%
4.00%
5.00%
6.00%
2005 2006 2007 2008
Growth Rate for Pharmaceuticals
480500520540560580600620640660
2005 2006 2007 2008 2009
Reve
nue
(In B
illio
ns)
Year
Sales for Pharmaceuticals

Porter’s 5 Forces
Source: Company 10-K
Industry RivalryHigh
Threat of New Entrants
Low
Supplier Power High
Buyer PowerModerate
Threat of Substitutes
Low

Threat of New Entrants: Low New drugs requires large investments Consolidating industry Multiple drugs already exist for known
conditions

Supplier Power: High Manufacturers supplying active
ingredients critical to all parts of pharmaceutical industry R&D Current production
R&D requires new range of drugs Generally sold on contract basis

Buyer Power: Moderate More sales to pharmacies diversifying
target markets Focus on marketing strategy
Different effects of drugs Differentiation of products
Increase in generic prescriptions increasing buying power

Threat of Substitutes: Low Patents protecting revenues Alternative treatments not widely used
but available Generics more targeted towards OTC
medicines Multiple drugs already exist for known
conditions

Rivalry: High Top pharmaceutical companies using
M&A to keep top market share High fixed costs and exit costs Multiple drugs competing to treat same
problem Stress on marketing and sales

Competition
Company Share Price ($)
Market Cap ($mm)
Debt / Equity
2010 Revenue ($mm)
LTM EPS ($)
Johnson & Johnson (JNJ)
64.39 165,678 0.30 61,587 4.8
Sanofi-Aventis (SNY) 38.06 94,054 0.16 45,468 5.9 Medtronic, Inc. (MDT) 40.68 43,053 0.70 15,834 3.0
Boston Scientific (BSX) 7.08 10,665 0.48 7,806 (0.7) Merck Ltd. (MRK) 34.04 231 -- 117 0.9
Novartis A.G. (NVS) 57.92 61 0.38 39 0.9
Abbott (ABT) 50.80 79,360 0.84 35,167 3.0
ABT is generally larger and more leveraged than its competitors with strong EPS
Source: Capital IQ as of 4/20/11

Competition
-20.00
-15.00
-10.00
-5.00
0.00
5.00
Apr-19
-2010
May-04-
2010
May-19-
2010
Jun-03
-2010
Jun-18
-2010
Jul-05-
2010
Jul-20-
2010
Aug-04
-2010
Aug-19
-2010
Sep-03
-2010
Sep-20
-2010
Oct-05-2
010
Oct-20-2
010
Nov-04-
2010
Nov-19-
2010
Dec-06
-2010
Dec-21
-2010
Jan-06
-2011
Jan-21
-2011
Feb-07
-2011
Feb-22
-2011
Mar-09-
2011
Mar-24-
2011
Apr-08
-2011
Index: JNJ, SNY, MDT, BSX, 2 more (Market Cap) - Index Value Abbott Laboratories (NYSE:ABT) - Share Pricing
Source: Capital IQ as of 4/20/11

SWOT Analysis
Market leader in lucrative I&I space
Very diverse dyslipidemia portfolio
Strong revenue base across multiple healthcare segments
Weak pipeline with only 3 drug launches expected out to 2014
Increasing reliance on flagship drug Humira
Weak IP position; faces generic erosion
Strengths Weaknesses
Opportunities Threats Pursue M&A to strengthen
pipeline Collaboration with
AstraZeneca could reinforce Abbott’s positon in the US dyslipidemia market
Continued litigation with J&J and Bayer on patent position of Humira
New biological launches threaten market share in autoimmune disorder space

Management Discussion & Analysis Reshape business portfolio for long-term
growth Focus on acquiring early and late stage
pipeline technologies and growth platforms Solvay Pharmaceuticals (pharma) Advanced Medical Optics (vision care) Visiogen (vision care) Evalve (stuctural heart repair)
Invest $2.9bn on R&D
Source: Company 10-K

Management Discussion & Analysis Grow Pharmaceuticals business internationally
Leverage Humira in emerging markets Acquisition of Solvay Pharmaceuticals to create
presence in Eastern Europe Focus on US growth for Nutrition business
New product launches and leadership in infant formula
Improve profitability for Medical Products business Underwent thorough rebuilding process to
improve margins
Source: Company 10-K

DuPont Analysis

Financial Ratios
Company Operating Margin Net Margin ROA ROE
Boston Scientific (BSX) 14.31% 7.00% 3.10% 4.92%
Johnson & Johnson (JNJ) 26.33% 19.77% 13.50% 24.88%
Medtronic, Inc. (MDT) 30.53% 20.68% 10.84% 22.06%
Merck Ltd. (MRK) 20.22% 1.87% 5.33% 1.66%
Sanofi-Aventis (SNY) 24.75% 17.07% 5.99% 11.23%
Abbott (ABT) 18.93% 12.29% 8.27% 20.45%
Industry 14.10% 10.10% 12.40% 13.80%
ABT’s margins slightly trail competitors’ but its ability to take on leverage is shown by a strong ROE

Debt Ratios
Company Debt/Equity Debt/Capital Interest Coverage Current Ratio
Boston Scientific (BSX) 43.41% 30.27% 2.97 1.75
Johnson & Johnson (JNJ) 29.65% 22.87% 34.23 2.05
Medtronic, Inc. (MDT) 70.05% 41.19% 10.99 1.56
Merck Ltd. (MRK) 31.49% 23.95% 13.01 1.86
Sanofi-Aventis (SNY) 15.51% 13.42% 20.59 1.99
Abbott (ABT) 84.33% 45.75% 11.75 1.70
Industry 17.30% 14.80% 17.50 2.70
ABT has the liquidity to capture the benefits of leverage while covering its debt obligations

Comparable Valuation Trading comparables yield a valuation of
$51.41/share at 8.5x EBITDA (mean)
Source: Capital IQ as of 4/20/11
Boston Scientific Corporation (NYSE:BSX) NYSE:BSX $7.08 $10,169.3 2.1x 7.3xJohnson & Johnson (NYSE:JNJ) NYSE:JNJ $64.39 $176,144.7 2.7x 8.5xMedtronic, Inc. (NYSE:MDT) NYSE:MDT $40.68 $37,428.9 3.2x 7.4xMerck & Co. Inc. (NYSE:MRK) NYSE:MRK $34.04 $106,413.6 2.5x 10.8xNovartis A.G. (NYSE: NVS) NYSE: NVS $11.24 $154.6 2.0x 11.5xSanofi-Aventis (ENXTPA:SAN ENXTPA:SAN $76.15 $64,706.9 2.2x 5.3x
Abbott Laboratories (NYSE:ABT) NYSE:ABT $50.80 $74,446.50 2.53x 10.28x
Summary Statistics Share Price TEV TEV/Revenue TEV/EBITDAHigh $76.15 $176,144.7 3.2x 11.5xLow $7.08 $154.6 2.0x 5.3xMean $38.93 $65,836.3 2.4x 8.5xMedian $37.36 $51,067.9 2.3x 8.0x

DCF ValuationProjected Year Ending Dec. 31,
2011 2012 2013 2014 2015
Sales $38,332 $39,865 $41,061 $42,703 $44,839EBT $7,556 $7,694 $7,718 $7,204 $7,318Plus: Interest Expense ($494) ($678) ($494) ($910) ($1,201)EBIT $8,050 $8,372 $8,212 $8,114 $8,519Plus: Depreciation $3,085 $3,641 $3,623 $4,007 $4,572EBITDA $11,135 $12,013 $11,835 $12,121 $13,091 EBITDA Margin 29.0% 30.1% 28.8% 28.4% 29.2%
Less: Taxes 1,467 1,517 1,544 1,441 1,464 Less: Capex (1,917) (1,196) (1,232) (1,281) (1,345) Less: Changes in NWC 278 881 518 (377) (1,119)
Unlevered Free Cash Flow $8,029 $8,419 $8,542 $9,776 $11,401 Unlevered Free Cash Flow Growth Rate na 4.9% 1.5% 14.5% 16.6%
Discount Rate 11%Discounted FCFs $7,241 $6,848 $6,267 $6,469 $6,805

DCF Valuation
WACC Calculation
CAPMRisk Free Rate 3.40%Market Risk Premium 6.40%Beta 0.3Cost of Equity 4.30%
RoE 20.50%
Cost of Equity 18.88%Cost of Debt 5.50%
Capital StructureDebt 55.30%Equity 44.70%
WACC 10.87%
Terminal Value CalculationLong-term Grow th Rate 2.5%Terminal Value $139,568Discounted TV $83,301
Value / Share CalculationNPV of FCFs $33,631PV of TV $83,301
Enterprise Value $116,932
Less: Net Debt $14,341Equity Value $102,591
Shares Outstanding 1,556
Value / Share $65.93
DCF yields a valuation of $64.76/share

Valuation Summary
LT Growth Rate$65.93 1.5% 2.0% 2.5% 3.0% 3.5%
7.0% $111.24 $121.40 $133.82 $149.35 $169.319.0% $77.97 $82.91 $88.62 $95.27 $103.14
11.0% $58.78 $61.60 $64.76 $68.31 $72.3313.0% $46.32 $48.10 $50.04 $52.18 $54.5515.0% $37.59 $38.79 $40.08 $41.47 $42.99
WAC
C
DCF yields a valuation of $64.76/share
Comparables yield a valuation of $51.41/share Triangulated value of $58.67/share
Triangulated ValuePrice Weight
DCF $65.93 0.5Comps $51.41 0.5Triangulated Value $58.67

Recommendation Buy 200 shares of ABT at market
Current price: $50.80 Currently undervalued
DCF: $64.76 Comps: $51.41 Triangulated: $58.67 (Price target)