ABB Group Annual Report 2003 Financial revie · The complete ABB Group Annual Report 2003 consists...
113
ABB Group Annual Report 2003 Financial review Important information regarding the ABB 2003 Annual Report consolidated figures During the second quarter of 2004, an internal inquiry uncovered an overstatement by the medium-voltage business in Italy of its earnings before interest and taxes (EBIT) of approximately $70 million from the first quarter of 1998 through the first quarter of 2004. That corresponds to 1.4 percent of ABB’s total reported consolidated EBIT during the period. According to the company’s initial review, the annual impact on EBIT over the period ranged between about $2 million in 1998 to a maximum of some $20 million in 2002. ABB has stated it would take corrective action regarding its consolidated results for the period in question and intends to file an amended 2003 Annual Report on Form 20-F with the United States Securities and Exchange Commission later in 2004 with restated consolidated financial statements. Therefore, the accompanying financial statements should be read taking into account the impact of such overstatements on the results of operations and financial position.
Transcript of ABB Group Annual Report 2003 Financial revie · The complete ABB Group Annual Report 2003 consists...
ABB Group Annual Report 2003Financial review
AB
B G
roup A
nnual Rep
ort 2003 Financial review
ABB LtdCorporate CommunicationsP.O. Box 8131CH-8050 ZurichSwitzerlandTel: +41 (0)43 317 7111Fax: +41 (0)43 317 7958
www.abb.com
ABB LtdInvestor RelationsP.O. Box 8131CH-8050 ZurichSwitzerlandTel: +41 (0)43 317 7111Fax: +41 (0)43 317 9817
ABB Inc.Investor RelationsP.O. Box 5308Norwalk CT 06856-5308USATel: +1 203 750 7743Fax: +1 203 750 2262
ABB LtdInvestor RelationsSE-721 83 VästeråsSwedenTel: +46 (0)21 32 50 00Fax: +46 (0)21 32 54 48
© C
opyright 2004 AB
B. A
ll rights reserved.©
Designed by w
illiams &
phoa.
Important information regarding the ABB 2003 Annual Reportconsolidated figuresDuring the second quarter of 2004, an internal inquiry uncovered an overstatement by the medium-voltage business in Italy of its earnings before interest and taxes (EBIT) of approximately $70 million from the first quarter of 1998 through the first quarter of 2004. That corresponds to 1.4 percent of ABB’s total reported consolidated EBIT during the period.According to the company’s initial review, the annual impact on EBIT over the period ranged between about $2 million in 1998 to a maximum of some $20 million in 2002.ABB has stated it would take corrective action regarding its consolidated results for the period in question and intends to file an amended 2003 Annual Report on Form 20-F with the United States Securities and Exchange Commission later in 2004 with restated consolidated financial statements. Therefore, the accompanying financial statements should be read taking into account the impact of such overstatements on the results ofoperations and financial position.

The complete ABB Group Annual Report 2003 consists of anOperational review, a Financial review and a Sustainability review. For an additional copy of this or any other of the reviews, please use the contact information on the back of this document, or download copies from www.abb.com. The complete report is published in English, German, Swedish and French. The English-language version is binding.
Caution concerning forward-looking statementsThe ABB Group Annual Report 2003 includes forward-lookingstatements. In the Operational review, such statements areincluded in “Letter to shareholders,” “Chief financial officer’s report,”“Power Technologies,” “Automation Technologies” and “HumanResources” and in the Financial review, such statements areincluded in “Management discussion and analysis.” Additionally,the words “believe,” “may,” “will,” “estimate,” “continue,”“anticipate,” “intend,” “expect,” and similar words are intended toidentify forward-looking statements. We have based these forward-looking statements largely on current expectations and projectionsabout future events, financial trends and economic conditionsaffecting our business. These forward-looking statements aresubject to risks, uncertainties and assumptions, including amongother things, the following: (i) the difficulty of forecasting futuremarket and economic conditions; (ii) the effects of, and changesin, laws, regulations, governmental policies, taxation, or accountingstandards and practices; (iii) our ability to dispose of certain of ournon-core businesses on terms and conditions acceptable to us; (iv) our ability to manage our liquidity and further reduce ourindebtedness as planned; (v) the resolution of asbestos claimson terms and conditions satisfactory to us; (vi) the effects ofcompetition in the product markets and geographic areas inwhich we operate; (vii) our ability to anticipate and react to
technological change and evolving industry standards in themarkets we operate; (viii) the timely development of new products,technologies, and services that are useful for our customers; (ix)unanticipated cyclical downturns in some of the industries that weserve; (x) the risks inherent in large, long-term projects served byparts of our business; (xi) the difficulties encountered in operating inemerging markets; and (xii) other factors described in documentsthat we may furnish from time to time with the U.S. Securities andExchange Commission, including our Annual Reports on Form20-F. Although we believe that the expectations reflected in anysuch forward-looking statements are based on reasonableassumptions, we can give no assurance that they will be achieved.
We undertake no obligation to update publicly or revise anyforward-looking statements because of new information, futureevents or otherwise. In light of these risks and uncertainties, theforward-looking information, events and circumstances might notoccur. Our actual results and performance could differ substantially from those anticipated in our forward-looking statements.

ABB Group Financial review 2003 1
Financial review
2 Operating and financialreview and prospects
2 About ABB5 Application of critical
accounting policies7 Accounting for discontinued
operations10 New accounting
pronouncements12 Restructuring expenses14 Acquisitions, investments and
divestitures17 Summary financial data19 Analysis of results
of operations24 Business divisions31 Discontinued operations36 Liquidity and capital
resources40 Financial Position44 Contractual obligations 44 Commercial commitments45 Related and
Certain Other Parties47 Contingencies and
retained liabilities
53 Consolidated Financial StatementsNotes to the Consolidated Financial Statements
57 Note 1 The company57 Note 2 Significant accounting policies63 Note 3 Discontinued operations66 Note 4 Business combinations and
other divestments67 Note 5 Marketable securities68 Note 6 Financial instruments69 Note 7 Receivables70 Note 8 Variable interest entities71 Note 9 Inventories72 Note 10 Prepaid expenses and other72 Note 11 Financing receivables72 Note 12 Property, plant and equipment72 Note 13 Goodwill and other intangible assets74 Note 14 Equity accounted companies75 Note 15 Borrowings77 Note 16 Accrued liabilities and other77 Note 17 Leases78 Note 18 Commitments and contingencies84 Note 19 Taxes85 Note 20 Other liabilities85 Note 21 Employee benefits89 Note 22 Management incentive plan90 Note 23 Stockholders’ equity91 Note 24 Earnings per share92 Note 25 Restructuring charges94 Note 26 Segment and geographic data97 ABB Ltd Group Auditors’ Report
98 Financial Statements of ABB Ltd, ZurichNotes to Financial Statements
99 Note 1 General99 Note 2 Cash and equivalents99 Note 3 Receivables99 Note 4 Long-term loans
to subsidiary99 Note 5 Participations99 Note 6 Current liabilities99 Note 7 Provisions
100 Note 8 Bonds100 Note 9 Stockholders’ equity101 Note 10 Contingent liabilities101 Note 11 Credit facility agreement102 Proposed appropriation
of available earnings103 Report of the Statutory Auditors
104 Investor information108 ABB Group statistical data109 Exchange rates

2 ABB Group Financial review 2003
You should read the following discussion of our financialcondition and results of operations in conjunction with ourConsolidated Financial Statements and the related notes andother financial information contained elsewhere in this annualreport. This discussion contains forward-looking statementsthat involve risks and uncertainties. See “Forward-lookingstatements” at the beginning of this annual report.
About ABBWe are a leader in power and automation technologies that enable utility and industry customers to improveperformance while lowering environmental impact. Weemploy approximately 116,000 people and operate inapproximately 100 countries.
We are headquartered in Zurich, Switzerland and our sharesare traded on the stock exchanges in Zurich, Stockholm,New York, Frankfurt and London.
We were formed in 1988, when Asea AB of Sweden andBBC Brown Boveri of Switzerland merged under the nameABB Ltd. Asea AB’s history dates back to 1883. BBC BrownBoveri was founded in 1891.
Organizational structureEffective January 1, 2003, we realigned our businessdivisions to combine our former Power Technology Productsand Utilities divisions into a new Power Technologies divisionand combined our former Automation Technology Productsand Industries divisions into a new Automation Technologiesdivision. Our Oil, Gas and Petrochemicals businesses, a part of which we have agreed to sell, and our Insurancebusiness area were reclassified as discontinued operationsalong with a number of other businesses in 2003 and 2002,respectively. Our remaining activities were grouped as Non-core activities and the remaining headquarter typefunctions were grouped into a Corporate/Other division. Webegan reporting our financial results to reflect this newstructure effective January 1, 2003.
We streamlined our divisional structure to help sharpen our focus on power and automation technologies, toincrease efficiency and to create a sustainable lower costbase. We consider the Power Technologies and AutomationTechnologies divisions to be our core divisions, and ourmanagement intends to focus its attention on, and futureinvestments in, these divisions.
Effective January 1, 2004, some business areas within ourbusiness divisions were combined. The changes are furtherdiscussed within the “Our business divisions” section below.
Our business divisions
Power technologies divisionThe ABB Power Technologies division serves electric, gasand water utilities, as well as industrial and commercialcustomers, with a broad range of products, systems andservices for power transmission, distribution and power plantautomation. The division had approximately 39,000employees at December 31, 2003. The distribution ofrevenues of this division by business areas for the year 2003,approximately, are as follows:
Business areas and percentage of revenues
Power Systems 28%Medium-Voltage Products 17%High-Voltage Products 16%Utility Automation Systems 15%Power Transformers 14%Distribution Transformers 10%
The Power Technologies division at January 1, 2004 consistsof five business areas:
1. Power Systems
2. Utility Automation Systems
3. High-Voltage Products
4. Medium-Voltage Products
5. Transformers
Our Power Systems business area generated approximately$ 2.3 billion in revenues in 2003 and had approximately8,000 employees at December 31, 2003. Key product linesin this business area include transmission and distributionsubstations, flexible alternating current transmission systems(FACTS) and high-voltage direct current (HVDC) systems,which are technologically advanced concepts to increasetransmission capacity and stability in power networks. OurHVDC and FACTS business lines are supported by our ownin-house power semiconductor factory. In addition, thisbusiness area undertakes turnkey contracts to install andupgrade transmission and distribution systems.
Our Power Systems business area sells primarily to utilities,but also to industrial end-users, and is complimented by a consulting and power systems services arm. Ordersand revenues are evenly distributed among the Americas,Europe, the Middle East and Africa, and Asia-Pacific.
Our Utility Automation Systems business area generatedapproximately $ 1.3 billion in revenues in 2003 and hadapproximately 5,500 employees at December 31, 2003. This business area is focused on automation, control andprotection systems for power generation, powertransmission and distribution networks, the energy marketand water management. It also offers substation automationand protection products and systems and complete utility
Operating and financial review and prospects

ABB Group Financial review 2003 3
communication networks. Europe, Middle East and theUnited States are major markets, while activities in Asia areexpanding.
Our High-Voltage Products business area generatedapproximately $ 1.4 billion in revenues in 2003 and hadapproximately 6,000 employees at December 31, 2003. This business area’s primary products include high-voltageswitchgear and high-current systems and cables. We sell high-voltage products primarily to utilities, as well as todistributors, wholesalers, installers, original equipmentmanufacturers and industrial end-users. We export mostlyfrom Europe to all parts of the world.
Our Medium-Voltage Products business area generatedapproximately $ 1.5 billion in revenues in 2003 and hadapproximately 7,000 employees at December 31, 2003. Thisbusiness area develops, manufactures and sells a widerange of circuit breakers and contactors, fuses, sensors,switches, vacuum interrupters and outdoor distributionproducts and sells primarily to utilities, industrial end-users,distributors, wholesalers, installers and original equipmentmanufacturers. Revenues of this business are primarilygenerated in Western Europe, followed by Asia, NorthAmerica and the Middle East.
The former Distribution Transformers and PowerTransformers business areas, which shared many locations,were merged to form a single Transformers business area atthe beginning of 2004. The merger is intended to helpreduce product overlaps, eliminate redundant research anddevelopment efforts, and improve supply chain management.
The combined Transformers business area generatedapproximately $ 2 billion in revenues in 2003 and, atDecember 31, 2003, had approximately 13,000 employees.The business area sells a wide range of transformers – fromsingle-phase transformers, to small, medium and largedistribution transformers, reactors, traction, phase-shifting,converter and extra high-voltage transformers. Europe andthe Americas account for a major portion of this businessarea’s revenues while the revenues in Asia and the MiddleEast are improving.
Automation technologies divisionThe ABB Automation Technologies division providesproducts, systems, software and services for the automationand optimization of industrial and commercial processes.Key technologies include measurement and control,instrumentation, process analysis, drives and motors, powerelectronics, robots and low-voltage products. The divisionhad approximately 55,000 employees at December 31,2003. The distribution of revenues of this division by businessareas for the year 2003, approximately, are as follows:
Business areas and percentage of revenues
Low-Voltage Products and and Instrumentation 27%Paper, Minerals, Marine and Turbocharging 21%Drives, Motors and Power Electronics 17%Robotics, Automotive and Manufacturing industries 14%Petroleum, Chemicals and Consumer industries 14%Control Platform and Enterprise Products 7%
The Automation Technologies division at January 1, 2004consists of three business areas:
1. Automation Products
2. Process Automation
3. Manufacturing Automation
The Automation Products business area generatedapproximately $ 4.5 billion in revenues in 2003 and hadapproximately 27,000 employees at December 31, 2003.Key products in the Automation Products business areainclude low and medium-voltage drives, as well as low andhigh-voltage motors, which are used in the buildingautomation, marine, power, transportation, manufacturingand process industries. The business area also offers powerelectronics systems, which are sold to metals smelters,railway manufacturers and power plants.
Other low-voltage products offered by the AutomationProducts business area include devices for power qualityand protection, wire management, switching and motorcontrol. Instrumentation products include actuators andpositioners, analytical instruments, as well as devices tomeasure flow, pressure, level, temperature and similarprocess variables.
Many of this business area’s automation products are highvolume products sold through channel partners, such asdistributors, wholesalers, installers, and original equipmentmanufacturers. The business area is geographically diverse,with operations and customers throughout Europe, theAmericas and Asia.
The Process Automation business area generatedapproximately $ 4.0 billion in revenues in 2003 and hadapproximately 21,500 employees at December 31, 2003. Itcombines the resources of three former business areas:Control Platform and Enterprise Products; Petroleum,Chemical and Consumer; and Paper, Minerals, Marine andTurbocharging.
This new business area includes control, forcemeasurement, marine and turbocharging systems among its key technologies. Largest among these is the design of systems for control and plant optimization in the processand utility industries, where our employees apply their

4 ABB Group Financial review 2003
extensive knowledge of customer processes to application-specific requirements.
Marine sector solutions include our systems for electricpropulsion, power generation and distribution, automationand heating, ventilation and air conditioning systems aboardcruise, cargo and other offshore vessels. Our turbochargers add performance, environmental and fuel efficiency to largegasoline and diesel engines.
Our Process Automation business area is geographicallydiverse, with strategic hubs of activity, including research anddevelopment, in the United States, Europe, India, China andSoutheast Asia. Revenues of this business area are primarilygenerated in Europe followed by the Americas and Asia with equal share and the Middle East with a comparativelylower share.
The Manufacturing Automation business area generatedapproximately $ 1.4 billion in revenues in 2003 and hadapproximately 6,500 employees at December 31, 2003. OurManufacturing Automation business has a large installedbase of industrial robots – more than 100,000 – and sellsrobots and related equipment and software to the auto-motive, material handling, foundry and packaging industries.
This business area also develops standardizedmanufacturing cells for machine tending, welding, cutting,painting and finishing and provides packaged systems toauto manufacturers for press automation, paint processautomation and power train assembly.
This business area’s research and development andmanufacturing locations are focused in the United Statesand Sweden – near major automotive centers. Most of ourrevenues in this business area are generated in theAmericas, Western Europe and China.
Non-core activitiesBusiness activities that are not directly linked to our PowerTechnologies and Automation Technologies divisions (coredivisions) and which we intend in the majority to divest ordiscontinue are grouped together and their results arereported under the heading of Non-core activities. Theseactivities comprise primarily the remaining parts of EquityVentures business area, the remaining parts of theStructured Finance business area, the remaining parts of theBuilding Systems business area, the remaining parts ofthe New Ventures business area and a number of otheractivities, including Customer Service Workshops, LogisticSystems and the Group Processes business areas. TheInsurance business area, which was previously included inNon-core activities, is now discussed as part of discontinuedoperations following our agreement in December 2003 tosell this business to White Mountains Insurance Group
Limited of Bermuda. Non-core activities had approximately8,700 employees at December 31, 2003.
Our Equity Ventures business area owns and operates infrastructure projects in various countries. Our EquityVentures business area originally focused its investmentactivities on independent power projects because it providedbusiness opportunities for our former power generationdivision. Subsequent projects also were selected primarily todevelop opportunities to sell our equipment and systems.Therefore, the Equity Ventures portfolio reflects some of the businesses in which we were engaged when the investments were made. Our Equity Ventures business areais not pursuing further project development or additionalinvestments and we will consider selling investments of thisbusiness area when we believe we have received an optimaloffer. During 2003, we sold our stakes in ABB RedbankProject Pty Ltd. and ElectraNet Pty Ltd.
Our Structured Finance business area provides financing,including export, trade and project financing and asset-based leasing and lending. In 2002, we decided to sell ourStructured Finance businesses. In 2003, we continued thedivestment of our remaining Structured Finance businessarea, including our ownership interest in the Swedish Export Credit Corporation, certain lease and loan portfolios,ownership interests in infrastructure projects and otherfinancial assets. We sold ABB Export Bank, previously partof our Structured Finance business area in December 2003.
Our Building Systems business area designs, builds andmaintains complete installations for industrial, infrastructureand commercial facilities, integrating products manufacturedby our Power Technologies and Automation Technologiesdivisions, as well as those from third-party suppliers.Following our decision to divest our Building Systemsbusinesses in 2002, we finalized the divestment of a numberof our activities in the Building Systems business area during2003, including our activities in Austria, Benelux, the Nordicregion (Baltic states, Denmark, Finland, Norway, Russia andSweden), Portugal and the United Kingdom. We have notyet sold the Building Systems businesses in Germany,Poland, the United States, Hong Kong and Egypt. InFebruary 2004, we signed an agreement to sell our BuildingSystems business in Switzerland to an investor group, whileretaining a 10% interest in the business.
We established New Ventures in 2001 as a “fast lane”business incubator that would find, develop and invest innew business opportunities, both internally and externally.New Ventures had three investment portfolios – the IndustrialIT Venture Fund and Operational Ventures, both of whichfocused on investment opportunities externally, andInnovisions, which focused on opportunities internally.Activities involved providing both seed funding for start-upsand growth funding for mature businesses. It also directly

ABB Group Financial review 2003 5
managed several majority-owned companies. In October2002, we announced a restructuring program to discontinueNon-core activities in New Ventures and transfer out anumber of core activities to other business areas. InDecember 2003, we announced the sale of our Wind Energybusiness in Germany, which was primarily focused on thedevelopment and engineering, procurement and constructionof wind parks, primarily in Europe. The remaining part of thebusiness area includes the Distributed Energy business andinvestments in emerging technology businesses.
We originally formed Group Processes as a business division in January 2001 to drive growth and cut costs byestablishing common working processes and a common ITinfrastructure. The areas of focus included supply anddemand chain management, project management, financialprocesses, internal audit, quality control and marketing andsales. In addition, this division provided shared services inareas such as accounting and payroll and training throughlocal services centers in many countries. This division alsoprovided IT infrastructure services and applications support.The division was dissolved in October 2002 when supplyand demand chain management as well as marketing andsales activities were moved into the core divisions to moreclosely link them to those businesses. The financialprocesses and shared services activities were moved intoour finance function, under the auspices of our chief financialofficer. In February 2003, all the IT operations were movedinto the office of the chief information officer. Effective January1, 2004, activities in the Group Processes business area hadbeen dissolved or integrated into the core divisions, GroupProcesses no longer functions as a separate business area.
Our Customer Service Workshop operations consist ofoverhaul, repair and rewinding of rotating machine productsmanufactured by the Automation Technologies division, as well as those from third-party suppliers. Following thedecision we made in 2002 to strategically reduce ouractivities in this business, most of our activities were eithertransferred to the core divisions, closed or divested. Wecontinue our efforts to divest or close the remaining portionof this business during 2004.
The Logistic Systems business area provides informationtechnology packages and automation services to airports for baggage and material handling, air traffic management,as well as turnkey electromechanical and airfield lightingsystems. In the Logistic Systems business area in 2003, we finalized our exit from Norway whereas our units in Italy,Singapore and Zimbabwe are completing certain projectsbefore closure. We continue efforts to divest our Germanbusiness.
Corporate/Other Our Corporate/Other comprises headquarters andstewardship activities, research and development activitiesand other activities, as described below. Corporate/Otherhad approximately 3,000 employees at December 31, 2003.
Headquarters and stewardship activities include theoperations of our head office in Zurich, Switzerland, as wellas corresponding local holding companies in approximately65 countries. These operations cover staff functions withgroup-wide responsibilities, such as group accounting andconsolidation, finance and controlling, audit, tax, financialadvisory, legal affairs, risk management and insurance,communications, investor relations and human resources.
Group Research and Development supports the divisions indeveloping cross-divisional technology platforms and buildsup our protected technology. By close cooperation with the world’s leading universities, cutting edge technology istransferred to our products and systems.
Other activities include our Real Estate and Group TreasuryOperations. Our Real Estate management objective is toenhance our competitiveness and effectively support ourbusiness activities, with the most efficient and profitable use of our real estate assets and facilities. Group TreasuryOperations act as a cost center for internal treasury activities.
The discussion that follows reflects how we managed andreported our businesses during 2003. Therefore, we refer to the business areas as they were prior to their realignmentin 2004, discussed above. We have included a separatediscussion of discontinued operations.
Application of critical accounting policies
GeneralWe prepare our Consolidated Financial Statements inaccordance with accounting principles generally accepted inthe United States (U.S. GAAP).
The preparation of our financial statements requires us tomake estimates and judgments that affect the reportedamounts of assets, liabilities, revenues and expenses, andthe related disclosure of contingent assets and liabilities. Weevaluate our estimates on an ongoing basis, including those related to: costs expected to be incurred to completeprojects; the costs of product guarantees and warranties:provisions for bad debts, inventories, investments, intangible assets and income taxes; provisions for restructuring, long-term service contracts, pensions andother post-retirement benefits, and contingencies and litigation. We base our estimates on historical experienceand on various other assumptions that we believe to bereasonable under the circumstances, the results of whichform the basis for making judgments about the carrying

6 ABB Group Financial review 2003
values of assets and liabilities that are not readily apparentfrom other sources. Actual results may differ from theseestimates under different assumptions or conditions.
We deem an accounting policy to be critical if it requires an accounting estimate to be made based on assumptionsabout matters that are highly uncertain at the time theestimate is made, and if different estimates that reasonablycould have been used, or changes in the accountingestimates that are reasonably likely to occur periodically,could materially impact our Consolidated FinancialStatements. We believe the following critical accountingpolicies reflect the more significant estimates andassumptions that we use in the preparation of ourConsolidated Financial Statements. These policies shouldbe considered in reviewing our Consolidated FinancialStatements.
Revenues and cost of sales recognitionWe recognize revenues from the sale of manufacturedproducts when all of the following conditions are met: apersuasive evidence of an arrangement exists, the salesprice is fixed and determinable, collectibility is reasonablyassured and title, including the risks and rewards ofownership, has been transferred to the customer. Whenmultiple elements such as products and services arecontained in a single arrangement or in related arrangementswith the same customer, we allocate revenue to eachelement based on its relative fair value, provided that suchelement meets the criteria for treatment as a separate unit ofaccounting. The allocation of the sales price betweendelivered elements and undelivered elements might affectthe timing of revenue recognition, but would not change thetotal revenue recognized on the contract. Revenues fromshort-term contracts to deliver services are recognized uponcompletion of required services to the customer. Revenuesfrom contracts that contain customer acceptance provisionsare deferred until customer acceptance occurs or thecontractual acceptance period has lapsed. As a result,significant contract interpretation is sometimes required todetermine the appropriate period of revenue recognition.
These revenue recognition methods assume collectibility ofthe revenues recognized. When recording the respectiveaccounts receivable, loss reserves are calculated to estimatethose receivables that will not be collected. These reservesassume a level of default based on historical information, as well as knowledge about specific invoices and customers.There remains the risk that greater defaults will occur than originally estimated. As such, the amount of revenuesrecognized might exceed that which will be collected,resulting in a deterioration of earnings in the future. This riskis likely to increase in a period of significant negative industryor economic trends.
Revenues under long-term contracts are recognized usingthe percentage-of-completion method of accounting. Weprincipally use the cost-to-cost or delivery events methodsto measure progress towards completion on contracts. Wedetermine the method to be used by type of contract basedon our experience and judgment as to which method bestmeasures actual progress towards completion.
The percentage-of-completion method of accountinginvolves the use of assumptions and projections, relating tofuture material, labor, construction and overhead costs. As a consequence, there is a risk that total contract costswill exceed those which we originally estimated. These risksare heightened if the duration of a contract increases or if theproject is a turnkey project and the price is fixed, becausethere is a higher probability that the circumstances uponwhich we originally developed the estimates will change in amanner that increases our costs and that we will not recoverthem. Factors that could cause costs to increase include:
■ unanticipated technical problems with the equipmentbeing supplied or developed by us which may require thatwe incur additional costs to remedy the problem;
■ changes in the cost of components, materials or labor;
■ difficulties in obtaining required governmental permits orapprovals;
■ project modifications creating unanticipated costs;
■ suppliers’ or subcontractors’ failure to perform;
■ penalties incurred as a result of not completing portions ofthe project in accordance with agreed upon time limits;and
■ delays caused by unexpected conditions or events.
Changes in our initial assumptions, which we review on aregular basis between balance sheet dates, may result inrevisions to total estimated costs, current earnings andanticipated earnings. We recognize these changes in theperiod in which the changes in estimate are determined. Webelieve that this approach, referred to as the “catch-upapproach”, produces more accurate information becausethe cumulative revenue-to-date reflects the current estimatesof the stage of completion. Additionally, losses on long-termcontracts are recognized in the period when they areidentified and are based upon the anticipated excess ofcontract costs over the related contract revenues. Any suchlosses are recorded as a component of cost of sales.
We accrue anticipated costs for warranties when werecognize the revenue on the related contracts. Warrantycosts include calculated costs arising from imperfections indesign, material and workmanship, performance guarantees(technical risks) and delays in contract fulfillment. Althoughwe generally make assessments on an overall, statistical

ABB Group Financial review 2003 7
basis, we make individual assessments on orders with risksresulting from order-specific conditions or guarantees, suchas plants or installations. There is a risk that actual warrantycosts will exceed the amounts provided for, which wouldresult in a deterioration of earnings in the future when theseactual costs are determined.
Revenues under cost-reimbursement contracts arerecognized as costs are incurred. Shipping and handlingcosts are recorded as a component of cost of sales.
Accounting for discontinued operationsOur strategy is to focus on power and automationtechnologies for utility and industry customers. In accordancewith our strategy, we have sold or plan to sell certainbusinesses that are not part of our core power andautomation technologies businesses. On January 1, 2002we adopted Statement of Financial Accounting StandardsNo.144 (SFAS 144), Accounting for the Impairment orDisposal of Long Lived Assets. SFAS 144 broadened thepresentation of discontinued operations to include disposaltransactions involving less than an entire reporting segment,if certain criteria are met. The purpose of SFAS 144 is toallow for historically comparable data to be available toinvestors without the distortions created by divestments orthe closure or abandonment of businesses, therebyimproving the predictive value of financial statements. SFAS144 requires the revenues and associated costs, net oftaxes, of certain divestments and abandonments, to beclassified as discontinued operations, net of taxes, belowincome from continuing operations in the ConsolidatedIncome Statement and requires the related assets andliabilities to be classified as assets or liabilities held for saleand in discontinued operations in the Consolidated BalanceSheet.
In order to classify a business as a discontinued operation,SFAS 144 requires that certain criteria be met. In certaincases, significant interpretation is sometimes required todetermine the appropriate classification. Changes in plansregarding the sale of a business may change ourinterpretation as to whether a business should be classifiedas a discontinued operation. Any such reclassification may have a material impact on our income from continuingoperations and the individual components thereof.
In the Consolidated Statement of Cash Flows, we haveincluded the businesses classified as discontinuedoperations in the individual line items within cash fromoperating, investing and financing activities, together withcontinuing operations, as permitted by U.S. GAAP.
For a description of the discontinued operations reflected inour Consolidated Financial Statements, see “Discontinuedoperations” below.
Goodwill and other intangible assets impairmentWe review goodwill for impairment annually and wheneverevents or changes in circumstances indicate the carryingvalue of an asset may not be recoverable in accordance with the Statement of Financial Accounting Standards No.142 (SFAS 142), Goodwill and Other Intangible Assets. SFAS 142requires that a two-step impairment test be performed ongoodwill. In the first step, we compare the fair value of eachreporting unit to its carrying value. Our reporting units areone level below the reportable segments identified in Note26 of our Consolidated Financial Statements. We use adiscounted cash flow model to determine the fair value ofreporting units unless there is a readily determinable fairmarket value. If the fair value of the reporting unit exceedsthe carrying value of the net assets assigned to that unit,goodwill is not impaired and we are not required to performfurther testing. If the carrying value of the net assetsassigned to the reporting unit exceeds the fair value of thereporting unit, then we must perform the second step todetermine the implied fair value of the reporting unit’sgoodwill and compare it to the carrying value of the reportingunit’s goodwill. If the carrying value of a reporting unit’sgoodwill exceeds its implied fair value, then we must recordan impairment loss equal to the difference.
The discounted cash flow model, which we use to estimatethe fair value of our reporting units is dependent on anumber of factors including estimates of future cash flows,appropriate discount rates and other variables. Estimatingfuture cash flows requires us to make significant estimatesand judgments involving variables such as sales volumes,sales prices, sales growth, production and operating costs,capital expenditures, market conditions and other economicfactors. We base our fair value estimates on assumptions we believe to be reasonable, but which are unpredictableand inherently uncertain. Actual future results may differ fromthose estimates.
We review intangible assets in accordance with SFAS 144,and accordingly test for impairment upon the occurrence ofcertain triggering events such as a decision to divest abusiness.
We record any related impairment charge in other income(expense), net in our Consolidated Income Statement, unlessit is related to a discontinued operation, in which case thecharge is recorded in loss from discontinued operations, netof tax.
Pension and post-retirement benefitsAs more fully described in Note 21 to our ConsolidatedFinancial Statements, we operate pension plans which coverthe majority of our employees. We use actuarial valuations to determine our pension and post retirement benefit costsand credits. The amounts calculated depend on a variety of

8 ABB Group Financial review 2003
key assumptions, including discount rates and expectedreturn on plan assets. We are required to consider currentmarket conditions, including changes in interest rates, inselecting these assumptions. The discount rate is reviewedannually and considered for adjustment based on changesin long-term, highly rated corporate bond yields. Decreasesin the discount rate result in an increase in the projectedbenefit obligation and to pension costs (as shown in Note 21to our Consolidated Financial Statements).
The expected return on plan assets is reviewed annually andconsidered for adjustment based on current and expectedasset allocations and represents the long-term returnexpected to be achieved. Decreases in the expected returnon plan assets result in an increase to pension costs. If theexpected rate of return on assets for 2004 was to decreaseby 0.5 percent from the 2003 rate of 6.01 percent, then our2004 pension costs would be approximately $ 29 millionhigher.
Under U.S. GAAP, we accumulate and amortize over futureperiods actual results that differ from the assumptions used.Therefore, actual results generally affect our recognizedexpense and recorded liabilities for pension and other postretirement benefit obligations in future periods.
The “unfunded” balance, which can increase or decreasebased on the performance of the financial markets orchanges in our assumption rates, does not represent amandatory short-term cash obligation. Instead, the unfundedbalance of a pension plan is the difference between theprojected obligation to employees (PBO) and the fair value ofthe plan assets. While we comply with appropriate statutoryfunding requirements, at December 31, 2003, the unfundedbalance of our pension plans was $ 1,636 million. Inaccordance with Statement of Financial AccountingStandards No.87 (SFAS 87), Employers’ Accounting forPensions, we have recorded on the Consolidated BalanceSheet a net liability of $ 866 million in relation to thisunfunded benefit balance. The difference is primarily due toan unrecognized actuarial loss of $ 737 million, which isamortized using the “minimum corridor” approach as definedby SFAS 87.
In May 2003, the Emerging Issues Task Force of theFinancial Accounting Standards Board reached a consensuson Emerging Issues Task Force No.03-4 (EITF 03-4),Determining the Classification and Benefit Attribution Methodfor a “Cash Balance” Pension Plan, which requires the“traditional unit credit method” to be used for the calculationof the liability and attribution of the costs for pension planswith certain characteristics. We determined that certain ofour pension plans covering the employees of Switzerlandhad the characteristics described in EITF 03-4 and thereforewe changed the approach to calculating the PBO from theprojected unit credit method to the traditional unit credit
method. The change in cost attribution methods resulted inan actuarial gain of $ 406 million which is included in theunrecognized actuarial loss of $ 737 million and asdescribed above, will result in lower net pension costs infuture years, but did not affect earnings in the current year.
We have multiple non-pension post-retirement benefit plans.Our health care plans are generally contributory withparticipants’ contributions adjusted annually. For purposes of estimating our health care costs, we have assumed healthcare cost increases per annum to be 11.81 percent for2003, then gradually declining to 5.96 percent per annum in 2013, and to remain at that level thereafter.
Assumed health care cost trends have a significant effect on the amounts reported for the health care plans. A one-percentage-point change in assumed health care costswould have had the following effects at December 31, 2003:
One-percentage- One-percentage-point increase point decrease
($ in millions)
Effect on total of service andinterest cost components 2 (2)Effect on accumulated post-retirementbenefit obligation 23 (20)
TaxesIn preparing our Consolidated Financial Statements we arerequired to estimate income taxes in each of the jurisdictionsin which we operate. We account for deferred taxes by using the asset and liability method. Under this method, wedetermine deferred tax assets and liabilities based ontemporary differences between the financial reporting andthe tax bases of assets and liabilities. The differences aremeasured using the enacted tax rates and laws that areexpected to be in effect when the differences are expectedto reverse. We recognize a deferred tax asset when wedetermine that it is more likely than not that the asset will berealized. We regularly review our deferred tax assets forrecoverability and establish a valuation allowance basedupon historical losses, projected future taxable income andthe expected timing of the reversals of existing temporarydifferences. To the extent we increase or decrease thisallowance in a period, we recognize the change in theallowance within Provision for taxes in the ConsolidatedIncome Statement unless the change relates to discontinuedoperations, in which case the change is recorded in income(loss) from discontinued operations, net of tax. Unforeseenchanges in tax rates and tax laws as well as differences inthe projected taxable income compared to the actual taxableincome may affect these estimates.

ABB Group Financial review 2003 9
ConsolidationWe evaluate our investments in joint ventures and othertypes of investments for purposes of determining whetherconsolidation or the cost or equity method of accounting isappropriate. This determination is based upon our ability toretain and exercise control through our decision-makingpowers and our ability to exercise significant influence overthe entity, as well as our ownership interests in the entity.
Material changes to our ability to retain control and exercisesignificant influence over an entity could change theaccounting method between consolidation or the cost orequity method, which could have a material impact on ourConsolidated Financial Statements.
In January 2003, the Financial Accounting Standards Boardissued Interpretation No.46 (FIN 46), Consolidation ofVariable Interest Entities – an Interpretation of ARB No.51.FIN 46 requires variable interest entities (VIEs) to beconsolidated by their primary beneficiaries. Accordingly, VIEsentered into after January 31, 2003, are consolidated whenwe are considered the primary beneficiary. Also after January31, 2003, previously consolidated variable interest entitieswould be deconsolidated when a triggering event, as definedby FIN 46, indicates we are no longer the primary beneficiary.For those VIEs where we are not the primary beneficiary, we apply our existing consolidation policies in accordancewith U.S. GAAP.
In determining the primary beneficiary of a VIE, we arerequired to make projections of expected losses andexpected residual returns to be generated by that VIE. Theprojected expected losses and expected residual returns arecritical to the identification of the primary beneficiary. Theseprojections require us to use assumptions, including theprobability of cash flows. Expected losses and expectedresidual returns materially different from those projectedcould identify another entity as the primary beneficiary. Achange in the contractual arrangements or ownershipbetween the parties involved in the VIE could have an impacton our determination of the primary beneficiary, which inturn, could have a material impact on our ConsolidatedFinancial Statements.
ContingenciesAs more fully described in Note 18 to our ConsolidatedFinancial Statements, we are subject to proceedings,lawsuits and other claims related to environmental, labor,product and other matters. We are required to assess thelikelihood of any adverse judgments or outcomes to thesematters, as well as potential ranges of probable losses. Adetermination of the amount of provision required, if any, forthese contingencies is made after careful analysis of eachindividual issue, often with assistance from both internal andexternal counsel and technical experts. The required amount
of provision for contingencies of any type may change in thefuture due to new developments in the particular matter,including changes in approach to its resolution, such as insettlement strategy.
RestructuringWe recorded significant provisions in connection with our restructuring programs. These provisions includeestimates pertaining to employee termination costs and thesettlements of contractual obligations resulting from ouractions. Although we do not anticipate significant changes,the actual costs may differ from these estimates due tosubsequent developments such as voluntary retirement ofemployees and other business developments. These costsare recorded primarily in other income (expense), net, in the Consolidated Income Statement unless the costs relateto discontinued operations in which case the change is recorded in discontinued operations, net of tax. See“Restructuring expenses” below.
Our Insurance businessIn December 2003 we entered into an agreement to sell our Reinsurance business and consequently we havereflected the results of operations in loss from discontinuedoperations, net of tax, and the assets and liabilities in assetsand liabilities held for sale and in discontinued operations for all periods presented.
We generally recognize premiums in earnings on a pro rata basis over the period coverage is provided. Premiumsearned include estimates of certain premiums not yetcollected. These premium receivables include premiumsrelating to retrospectively rated contracts. For suchcontracts, a provisional premium is collected that willeventually be adjusted. We include an estimated value of the actual premium in receivables. Unearned premiumsrepresent the portion of premiums written that is applicableto the unexpired terms of reinsurance contracts orcertificates in force. These unearned premiums arecalculated by the monthly pro rata method or are based on reports from ceding companies that we reinsure.
Insurance liabilities are reflected in liabilities held for sale andin discontinued operations, in our Consolidated BalanceSheet and represent unpaid claims, losses, and related loss expenses based upon estimates for losses reported,estimates received from ceding reinsurers, and estimates of incurred but not reported losses related to direct andassumed business, less amounts ceded to reinsurers.Reserves for unreported losses are determined by anestimate established using various statistical and actuarialtechniques reflecting historical patterns of development ofpaid and reported losses adjusted for current trends. Theinherent variability of the estimate is analyzed in order to

10 ABB Group Financial review 2003
ascertain whether it is reasonable before application. We donot discount loss and loss adjustment expense reserves. We develop our estimate considering a range of reserveestimates bounded by a high and a low estimate. The highand low ends of the range do not correspond to an absolutebest and worst case scenario of ultimate settlementsbecause such estimates may be the result of unlikelyassumptions. Our best estimate therefore does not includethe set of all possible outcomes but only those outcomesthat are considered reasonable. Those estimates are subject to the effects of trends in loss severity and frequency.Although considerable variability is inherent in such estimates,we believe the reserves for losses and loss adjustmentexpenses are adequate. The estimates are continuallyreviewed and adjusted as necessary as experience developsor new information becomes known; such adjustments areincluded in discontinued operations. Adjustments to reservesare reflected in the loss from discontinued operations, net oftax, in the periods in which the estimates are changed.
We reflect our liability for losses net of anticipated salvageand subrogation recoveries. Salvage and subrogationreceived and changes in estimates of future recoveries arereflected in current year underwriting results. We believe theliabilities for losses and loss adjustment expenses areadequate to cover the ultimate liability; however, due to theunderlying risks and high degree of uncertainty associatedwith the determination of the liability for losses, suchestimates may be more or less than the amounts ultimatelypaid when the claims are settled.
We seek to reduce the loss from our underwriting liabilitiesby reinsuring certain levels of risks with other insuranceenterprises or reinsurers. We used recoverable amounts forboth paid and unpaid losses. We estimate these recoverableamounts in a manner consistent with the claim liabilityassociated with the reinsurance policy. The risk ofcollectibility of these reinsurance receivables arises fromdisputes relating to the policy terms and the ability of thereinsurer to pay.
New accounting pronouncementsIn June 2001, the Financial Accounting Standards Boardissued Statement of Financial Accounting StandardsNo.141, Business Combinations, and SFAS 142 whichmodified the accounting for business combinations, goodwilland identifiable intangible assets. All business combinationsinitiated after June 30, 2001, must be accounted for by thepurchase method. Goodwill from acquisitions completedafter that date is not amortized, but charged to operationswhen specified tests indicate that the goodwill is impaired,that is, when the goodwill’s fair value is lower than itscarrying value. Certain intangible assets are recognizedseparately from goodwill, and are amortized over their useful lives. During 2002, all goodwill was required to be
tested for impairment as of January 1, 2002, with a transitionadjustment recognized for any impairment found. Wedetermined that no impairment of goodwill existed atJanuary 1, 2002. All goodwill amortization also ceased atthat date. We recognized goodwill amortization expense incontinuing operations of $ 148 million in 2001, and goodwillamortization expense in discontinued operations of $ 43million in 2001. Accordingly, income from continuingoperations in 2001 would have been $ 319 million ($ 0.28per share), loss from discontinued operations in 2001 wouldhave been $ 794 million ($ 0.70 per share) and net loss in2001 would have been $ 538 million ($ 0.48 per share) if wehad not recognized amortization expense for goodwill that is no longer being amortized in accordance with SFAS 142.
In June 2001, the Financial Accounting Standards Boardissued Statement of Financial Accounting Standards No.143(SFAS 143), Accounting for Asset Retirement Obligations,which is effective for fiscal years beginning after June 15,2002, and requires that the fair value of a legal obligationassociated with the retirement of tangible long-lived assetsbe recognized in the period in which it is incurred. Theassociated asset retirement costs are capitalized as part ofthe carrying amount of the asset and allocated to expenseover its useful life. We adopted SFAS 143 effective January 1, 2003. The adoption of SFAS 143 did not have amaterial impact on our results of operations.
In August 2001, the Financial Accounting Standards Boardissued Statement of Accounting Standards No.144 (SFAS144), Accounting for the Impairment or Disposal of Long-Lived Assets. This Statement supersedes Statement ofFinancial Accounting Standards No.121, Accounting for theImpairment of Long-Lived Assets and for Long-lived Assetsto Be Disposed Of, while retaining many of its requirementsregarding impairment loss recognition and measurement. In addition, SFAS 144 broadens the presentation ofdiscontinued operations to include more sold andabandoned businesses. We adopted this statement effectiveJanuary 1, 2002, and, as a result, reflected the assets,liabilities and results of operations of several businesses andgroups of assets as discontinued operations for all periodspresented to the extent these businesses and groups ofassets met the new criteria during 2003 and 2002. Disposalsand abandonments in previous years were not re-evaluatedor reclassified. See “Application of critical accounting policies– Accounting for discontinued operations” above.
In April 2002, the Financial Accounting Standards Boardissued Statement of Financial Accounting StandardsNo.145, Rescission of FASB Statements No.4, 44 and 64,Amendment of FASB Statement No.13, and TechnicalCorrections, which rescinds previous requirements to reflectall gains and losses from debt extinguishment asextraordinary. We elected to early adopt the new standardeffective April 1, 2002, and, as a result, the gains from

ABB Group Financial review 2003 11
extinguishment of debt of $ 12 million recorded asextraordinary items in 2001, are no longer reflected asextraordinary items.
In June 2002, the Financial Accounting Standards Boardissued Statement of Financial Accounting Standards No.146(SFAS 146), Accounting for Costs Associated with Exit orDisposal Activities, which requires that a liability for a costassociated with an exit or disposal activity be recognizedwhen the liability is incurred. The standard became effectiveJanuary 1, 2003 and was applied to restructuring activitiesinitiated after that date. Prior to January 1, 2003, weaccounted for restructuring activities in accordance withEmerging Issues Task Force No.94-3, Liability Recognitionfor Certain Employee Termination Benefits and Other Coststo Exit an Activity (Including Certain Costs Incurred in aRestructuring). The adoption of SFAS 146 did not have amaterial impact on our financial position or results ofoperations.
In November 2002, the Financial Accounting StandardsBoard issued Interpretation No.45 (FIN 45), Guarantor’sAccounting and Disclosure Requirements for Guarantees,Including Indirect Guarantees of Indebtedness of Others. FIN45 requires the guarantor to recognize a liability for the non-contingent component of a guarantee; that is the obligationto stand ready to perform in the event that specifiedtriggering events or conditions occur. The initial measurementof this liability is the fair value of the guarantee at its inception.The recognition of the liability is required even if it is notprobable that payments will occur under the guarantee or ifthe guarantee was issued with a premium payment or aspart of a transaction with multiple elements. FIN 45 alsorequires additional disclosures related to guarantees. Weadopted the disclosure requirements of FIN 45 on December 31, 2002. The recognition and measurementprovisions of FIN 45 are effective for all guarantees enteredinto or modified after December 31, 2002. We adopted the recognition and measurement requirements of FIN 45 on January 1, 2003. The adoption of the recognition andmeasurement requirements of FIN 45 did not have a materialimpact on our results of operations.
In November 2002, the Emerging Issues Task Force of theFinancial Accounting Standards Board issued EmergingIssues Task Force No.00-21 (EITF 00-21), Accounting forRevenue Arrangements with Multiple Deliverables, whichwas amended in January 2003 and requires that (a) revenueshould be recognized separately for separate units ofaccounting in multiple deliverables arrangements, (b) revenuefor a separate unit of accounting should be recognized onlywhen the arrangement consideration is reliably measurableand the earnings process is substantially complete, and (c)consideration should be allocated among the separate unitsof accounting based on their relative fair value. EITF 00-21 isapplicable to transactions entered into after June 30, 2003.
The adoption of EITF 00-21 did not have a material impacton our financial position at December 31, 2003, or on ourresults of operations for the year then ended.
In December 2002, the Financial Accounting StandardsBoard issued Statement of Financial Accounting StandardsNo.148 (SFAS 148), Accounting for Stock-BasedCompensation – Transition and Disclosure – an Amendmentof FASB Statement No.123. We have elected to continuewith our current practice of applying the recognition andmeasurement principles of APB No.25, Accounting forStock Issued to Employees. We have adopted the disclosurerequirements of SFAS 148 effective December 31, 2002.
In January 2003, the Financial Accounting Standards Boardissued Interpretation No.46 (FIN 46), Consolidation ofVariable Interest Entities – an Interpretation of ARB No.51.FIN 46 requires variable interest entities (VIEs) to beconsolidated by their primary beneficiaries. During 2003, we adopted the requirements of FIN 46 and applied theguidance to VIEs in which we have an interest. See Note 8 of our Consolidated Financial Statements for informationrelating to the impact of adopting FIN 46. FIN 46 was revisedin December 2003. We will adopt the December revision(FIN 46R) by March 2004. We continue to evaluate theeffects of the adoption of FIN 46R and do not expect sucheffects to be material to our consolidated financial positionsor results of operations.
In May 2003, the Financial Accounting Standards Boardissued Statement of Financial Accounting Standards No.150(SFAS 150), Accounting for Certain Financial Instrumentswith Characteristics of both Liabilities and Equity. SFAS 150establishes how an issuer classifies and measures certainfinancial instruments with characteristics of both liabilitiesand equity. This statement requires that an issuer classify afinancial instrument that is within the scope of the statementas a liability. SFAS 150 applies to all financial instrumentsentered into after May 31, 2003, and otherwise becameeffective for us after June 15, 2003. In November 2003,SFAS 150 was amended to indefinitely defer themeasurement and recognition guidance for non-controllinginterests that are classified as equity in a subsidiary, but thatwould be classified as a liability in our financial statementsunder SFAS 150. However, SFAS 150, as amended,provides guidance on classification and disclosure ofmandatorily redeemable non-controlling interests. We haveadopted the measurement, classification and disclosurecriteria of SFAS 150, as amended. The adoption of SFAS150 did not have a material impact on our financial positionat December 31, 2003, or on our results of operations forthe year then ended.
In May 2003, the Emerging Issues Task Force of theFinancial Accounting Standards Board reached a consensuson Emerging Issues Task Force No.03-4 (EITF 03-4),

12 ABB Group Financial review 2003
Determining the Classification and Benefit Attribution Methodfor a “Cash Balance” Plan. EITF 03-4 clarifies that a cashbalance plan, as defined by the guidance, should beaccounted for as a defined benefit plan using the traditionalunit credit attribution method. We adopted EITF 03-4 in May 2003. As a result, we account for certain of our pensionplans in Switzerland as cash balance plans in accordancewith EITF 03-4. The adoption of EITF 03-4 reduced the unfunded amount of our Swiss pension plans byapproximately $ 406 million, but did not have a materialimpact on our financial position at December 31, 2003, oron our results of operations for the year then ended.
Restructuring expenses
2001 ProgramIn July 2001, we announced and initiated a restructuringprogram (2001 Program) in an effort to improve productivity,reduce our cost base, simplify product lines, reduce multiplelocation activities and perform other downsizing in responseto weakening markets and consolidation of major customersin certain industries.
Restructuring charges relating to workforce reductions, lease terminations and other exit costs associated with the2001 Program are included in other income (expense), net.We paid termination benefits of $ 99 million, $ 149 millionand $ 32 million to approximately 2,270, 4,000 and 2,150 employees in 2003, 2002 and 2001, respectively.Workforce reductions included production, managerial andadministrative employees. Additionally, we paid approximately$ 12 million, $ 29 million and $ 31 million to cover costsassociated with lease terminations and other exit costs in2003, 2002 and 2001, respectively. Based on changes inour original estimate, a $ 22 million and $ 21 millionreduction in the amounts accrued for workforce reductions,lease terminations and other exit costs have been includedin other income (expense), net, in 2003 and 2002,respectively. Currency fluctuations resulted in a $ 23 millionand $ 25 million increase in the liabilities accrued forworkforce reductions, lease terminations and other exit costsin 2003 and 2002, respectively. Accrued liabilities included $ 9 million and $ 94 million for termination benefits and $ 27 million and $ 52 million for lease terminations and otherexit costs at December 31, 2003 and 2002, respectively.
As a result of the 2001 Program, certain assets, inventoriesand property, plant and equipment have been identified asimpaired or will no longer be used in continuing operations.We recorded $ 18 million and $ 41 million in 2002 and 2001,respectively, to write down these assets to fair value. Thesecosts are included in cost of sales and other income(expense), net.
Step change programIn October 2002, we announced the Step change program.We estimate that restructuring costs under the Step changeprogram will be approximately $ 200 million in 2004. Thegoals of the Step change program are to increase thecompetitiveness of our core businesses, reduce overheadcosts and streamline operations by approximately $ 900 million on an annual basis by 2005. The Step changeprogram is expected to be completed by mid-2004.
In order to achieve the desired cost savings, over 1,400specific initiatives have been established and are beingclosely monitored by our management. We expect that thetermination of between 10,000 and 12,000 employees willcontribute to approximately 40 percent of the recurring costsavings on an annual basis, through the reduction of payrolland payroll-related costs. Additionally, we expect thatproductivity increases as a result of improved productionmethods and the continued consolidation of office spaceand manufacturing facilities and closure of non-profitableunits will generate approximately 20 percent of the costsavings. We expect to realize the major part of the remaining40 percent cost savings through outsourcing of selectedactivities. A large portion of the savings is related to the reorganization of our IT activities. This included theoutsourcing of the major part of our information systemsinfrastructure services to the IBM Corporation (IBM), thereplacement of multiple finance platforms in the countriesand concentration of local processes in shared units, as well as the outsourcing of new applications with externalsuppliers. Other savings result from changes in the materialsupply process, logistics and efficiency gains in use ofmaterials in our products. Approximately two thirds of our1,400 initiatives have been completed by the end of 2003.
Restructuring charges relating to workforce reductions, leaseterminations and other exit costs associated with the Stepchange program are included in other income (expense), net.We paid termination benefits of $ 145 million and $ 13 millionto approximately 1,500 and 200 employees in 2003 and2002, respectively. Workforce reductions include production,managerial and administrative employees. Additionally, wepaid approximately $ 48 million and $ 1 million to covercosts associated with lease terminations and other exit costsin 2003 and 2002, respectively. Based on changes in ouroriginal estimate, a $ 4 million reduction in the amountsaccrued for workforce reductions, lease terminations and
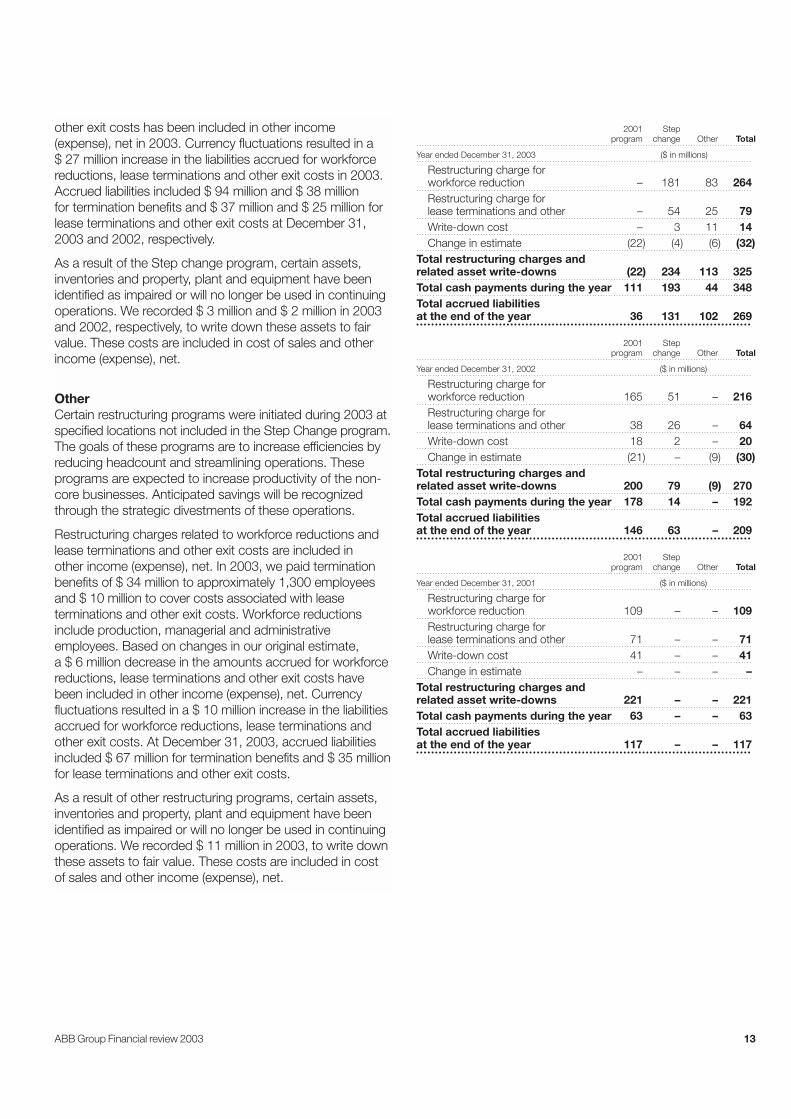
ABB Group Financial review 2003 13
other exit costs has been included in other income(expense), net in 2003. Currency fluctuations resulted in a $ 27 million increase in the liabilities accrued for workforcereductions, lease terminations and other exit costs in 2003.Accrued liabilities included $ 94 million and $ 38 million for termination benefits and $ 37 million and $ 25 million forlease terminations and other exit costs at December 31,2003 and 2002, respectively.
As a result of the Step change program, certain assets,inventories and property, plant and equipment have beenidentified as impaired or will no longer be used in continuingoperations. We recorded $ 3 million and $ 2 million in 2003and 2002, respectively, to write down these assets to fairvalue. These costs are included in cost of sales and otherincome (expense), net.
OtherCertain restructuring programs were initiated during 2003 atspecified locations not included in the Step Change program.The goals of these programs are to increase efficiencies byreducing headcount and streamlining operations. Theseprograms are expected to increase productivity of the non-core businesses. Anticipated savings will be recognizedthrough the strategic divestments of these operations.
Restructuring charges related to workforce reductions andlease terminations and other exit costs are included in other income (expense), net. In 2003, we paid terminationbenefits of $ 34 million to approximately 1,300 employeesand $ 10 million to cover costs associated with leaseterminations and other exit costs. Workforce reductionsinclude production, managerial and administrativeemployees. Based on changes in our original estimate, a $ 6 million decrease in the amounts accrued for workforcereductions, lease terminations and other exit costs havebeen included in other income (expense), net. Currencyfluctuations resulted in a $ 10 million increase in the liabilitiesaccrued for workforce reductions, lease terminations andother exit costs. At December 31, 2003, accrued liabilitiesincluded $ 67 million for termination benefits and $ 35 millionfor lease terminations and other exit costs.
As a result of other restructuring programs, certain assets,inventories and property, plant and equipment have beenidentified as impaired or will no longer be used in continuingoperations. We recorded $ 11 million in 2003, to write downthese assets to fair value. These costs are included in cost of sales and other income (expense), net.
2001 Stepprogram change Other Total
Year ended December 31, 2003 ($ in millions)
Restructuring charge for workforce reduction – 181 83 264Restructuring charge forlease terminations and other – 54 25 79Write-down cost – 3 11 14Change in estimate (22) (4) (6) (32)
Total restructuring charges andrelated asset write-downs (22) 234 113 325Total cash payments during the year 111 193 44 348Total accrued liabilities at the end of the year 36 131 102 269
2001 Stepprogram change Other Total
Year ended December 31, 2002 ($ in millions)
Restructuring charge for workforce reduction 165 51 – 216Restructuring charge forlease terminations and other 38 26 – 64Write-down cost 18 2 – 20Change in estimate (21) – (9) (30)
Total restructuring charges andrelated asset write-downs 200 79 (9) 270Total cash payments during the year 178 14 – 192Total accrued liabilities at the end of the year 146 63 – 209
2001 Stepprogram change Other Total
Year ended December 31, 2001 ($ in millions)
Restructuring charge for workforce reduction 109 – – 109Restructuring charge forlease terminations and other 71 – – 71Write-down cost 41 – – 41Change in estimate – – – –
Total restructuring charges andrelated asset write-downs 221 – – 221Total cash payments during the year 63 – – 63Total accrued liabilities at the end of the year 117 – – 117
14 ABB Group Financial review 2003
Acquisitions, investments and divestitures
Acquisitions and investmentsIn 2003, 2002 and 2001, we paid aggregate considerationof $ 55 million, $ 154 million and $ 597 million, respectively,related to acquisitions and investments in new businesses,joint ventures and affiliated companies. Payments made forthese acquisitions and investments, net of cash acquired,were $ 55 million, $ 144 million and $ 578 million in 2003,2002 and 2001, respectively.
In 2003 and 2002, we made no significant new acquisitions.However, in 2003 we increased our participation in a limitednumber of companies as part of our preparations for theireventual divestment and in 2002 we increased ourinvestment in a small number of companies in which we hada controlling interest. In 2002, we also acquired an Italiansmall-ticket leasing business from Xerox Corp., which waslater sold as part of Structured Finance business.
In June 2001, we completed the acquisition of EntrelecGroup, a France-based supplier of industrial automation andcontrol products, for total consideration of $ 284 million. Theacquisition of Entrelec, which had operations in 17 countries,diversified our product range and expanded our customerbase in high growth markets.
In June 2000, we entered into a share subscriptionagreement to acquire a 42 percent interest in b-businesspartners B.V. During 2001, we sold most of our interest toInvestor AB (a related party), and b-business partners B.V.repurchased a number of shares. As a result, at December31, 2003 we hold a 4 percent interest. We are committed toprovide additional capital to b-business partners B.V. ofapproximately $ 5 million (a euro-denominated commitmentthat may fluctuate with exchange rates). Further, b-businesspartners B.V. retains a put right to compel us to purchase150,000 shares of b-business partners B.V. at a cost ofapproximately $ 19 million (a euro denominated commitmentthat may fluctuate with exchange rates).
Divestitures
Sales of businesses, joint ventures and affiliatedcompaniesIn 2003, 2002 and 2001, we received cash, net of cashdisposed, from sales of businesses, joint ventures andaffiliated companies of $ 543 million, $ 2,509 million and $ 283 million. We recognized net gains in 2003, 2002, and2001 within other income (expense), net, of $ 43 million, $ 98 million and $ 34 million, respectively. We also recognized net losses in 2003, 2002, and 2001 within lossfrom discontinued operations, net of tax, of $ 37 million, $ 194 million and $ 0 million, respectively. The materialdispositions are described below.
In December 2003, as part of the divestment of ourStructured Finance business, we sold ABB Export Bank to a financial investor. We received cash proceeds ofapproximately $ 50 million from the sale of ABB Export Bankand recorded a loss on disposal of $ 12 million which isincluded in loss from discontinued operations, net of tax.
Also in December 2003, as part of the planned divestmentof the Wind Energy business, we sold the related business in Germany to GI Ventures GmbH for consideration of $ 35 million including a vendor note of $ 10 million. Werecognized a loss on disposal of approximately $ 25 millionfrom the sale of this business, which is included in loss from discontinued operations, net of tax.
In August 2003, as part of our intention to gradually dispose of our Building Systems businesses, we sold to YIT Corporation of Helsinki, Finland our Building Systemsbusinesses located in Sweden, Norway, Denmark, Finland,Russia and the Baltic states for consideration of $ 213 millionand we recorded a gain on disposal of approximately $ 124 million. Additionally, throughout 2003, we sold otherBuilding Systems businesses in a number of countriesincluding Belgium, the Netherlands, Austria, Hungary andthe United Kingdom. The aggregate proceeds from thesedivestments were $ 21 million and we recorded a loss ondisposal of approximately $ 41 million from the sale of thesebusinesses which is recognized within other income(expense), net.
In June 2003, we sold our entire 35 percent interest in theSwedish Export Credit Corporation to the government ofSweden for net proceeds of approximately $ 149 million andrecorded a loss on disposal of approximately $ 80 millionwhich is included in other income (expense), net.
Also in June 2003, we sold our interests in certain equityinvestments in Australia for cash proceeds of approximately$ 90 million and recorded a gain on disposal of approximately$ 28 million which is included in other income (expense), net.
In March 2003, we sold our aircraft leasing business forapproximately $ 90 million. This business consisted of a portfolio of loans and leases related to commuter aircraftand helicopters used primarily in the northern European andNordic markets. We provided significant financial support tothe VIE formed by the buyer upon acquisition. Following theintroduction of FIN 46, we determined that, as a result ofretaining such financing receivables, we are the primarybeneficiary of the VIE and, accordingly, we consolidated thisdisposed entity in our Consolidated Financial Statements.

ABB Group Financial review 2003 15
In December 2002, we completed the sale of our Meteringbusiness, to Ruhrgas Industries GmbH for consideration ofapproximately $ 223 million. Cash held in escrow of $ 15million was released after resolution of certain disputed itemsin 2003. We recorded a loss on disposal of approximately $ 48 million from the sale of this business, which is includedin loss from discontinued operations, net of tax.
In November 2002, we completed the sale of most of ourStructured Finance business to General Electric CapitalCorporation (GE) and received cash proceeds ofapproximately $ 2 billion, including a contingent payment of$ 20 million to be released to us, should amounts ultimatelycollected by GE, from a portfolio transferred by us to GEreach specified targets. The $ 20 million contingent paymentremains unpaid as of December 31, 2003, as the amountscollected by GE have not met such specified targets. Werecorded a loss on disposal of approximately $ 146 millionfrom the sale of this business, which is included in loss fromdiscontinued operations, net of tax.
Pursuant to the sale and purchase agreement, we providedGE with cash collateralized letters of credit aggregating $ 202 million as security for certain performance-relatedobligations retained by us, of which approximately $ 128 million was outstanding as of December 31, 2003.
The sale and purchase agreement provided GE the option torequire us to repurchase certain designated financial assetstransferred to GE upon the occurrence of certain events, butin any event no later than February 1, 2004. The fair value of GE’s right to require us to repurchase certain designatedassets was $ 11 million at December 31, 2003. On January26, 2004, we repurchased the financial assets for an amountof approximately $ 28 million. Additionally, as a result of the exercise of GE’s option, the cash collateralized letters ofcredit were reduced by $ 35 million. No further obligationexists for us to repurchase any assets under the sale andpurchase agreement with GE.
In January 2002, we disposed of our Air Handling businessfor cash proceeds of $ 113 million (the sales price of $ 147 million included a vendor note of $ 34 million issuedby the purchaser) to Global Air Movement (Luxembourg)SARL and recognized a gain in other income (expense), netof $ 74 million.
During 2003, 2002 and 2001, we sold several operatingunits and investments for total proceeds of $ 31 million, $ 209 million and $ 117 million, respectively, and recognizednet gains on disposal of $ 12 million, $ 24 million and $ 34 million, respectively, which are included in other income(expense), net. Net income from these businesses andinvestments was not significant in 2003, 2002 and 2001.
Other divestituresIn May 2003, we sold our interest in China NationalPetrochemical Corporation (Sinopec Corp.) for approximately$ 82 million and recorded a loss on disposal of $ 40 millionrecognized in interest and other finance expense, net.
In addition, throughout 2003, we engaged in a number ofsales and terminations of lease portfolios and individualfinancing receivables resulting in proceeds of approximately $ 400 million. The gains (losses) on such disposals werenot material.
Pending divestituresWe have previously announced our intention to sell a numberof other businesses, including all of our Oil, Gas andPetrochemicals businesses and our remaining BuildingSystems businesses.
In January 2004, we entered into an agreement to sell theupstream part of our Oil, Gas and Petrochemicals businesses to a private equity consortium consisting ofCandover Partners, JP Morgan Partners and 3i Group. Thesale includes our United States based Vetco Gray unit andour Norway based Offshore Systems business. The initialpurchase consideration for the business (including theconsideration for our separate agreement not to competewith the business for a period of three years) is $ 925 million.We may receive an additional consideration of up to $ 50million based on the financial performance of the business in2004. The sale is expected to close by mid-year 2004,pending receipt of customary regulatory approvals and satisfaction of closing conditions, including the satisfactorycompletion and disposition of compliance matters underreview. As part of the sale, we have agreed, among otherthings, to terminate certain securitization programs andoperational leases, to indemnify the purchasers againstcertain pre-existing environmental and tax liabilities, toreimburse the purchasers against financial losses that maybe incurred on certain ongoing projects of the business, toreimburse the purchasers for certain unfunded benefit liabilities and to indemnify the purchasers from liabilities thatmight arise out of matters revealed by the compliancereview.
16 ABB Group Financial review 2003
We do not expect a significant gain or loss to be recognizedon the sale of the upstream business.
The compliance investigation referred to above in connectionwith the description of the divestment of the upstream partof our Oil, Gas and Petrochemical businesses, was triggeredby our discovery of a limited number of improper paymentsin that business in Africa, Central Asia, and South America,which we have voluntarily disclosed to the U.S. Departmentof Justice and the U.S. Securities and ExchangeCommission. The payments violated our internal policies onbusiness ethics. We are cooperating fully with the U.S.Department of Justice and the U.S. Securities and ExchangeCommission. We have hired outside counsel and auditors(other than our auditors) to assist us in a compliance reviewto determine whether other instances of improper paymentsexist. The compliance review is being conducted jointly withthe purchasers of the business and with the purchasers’outside counsel and auditors.
We are actively seeking a buyer for the remaining activities ofour Oil, Gas and Petrochemicals businesses (remaining OGPbusinesses). The downstream activities of our Oil, Gas andPetrochemicals business is a full service engineeringcompany, which in addition to expertise in Engineering,Procurement and Construction (EPC) projects, also licensesprocess technologies in the refining, chemical, petrochemicaland polymer fields. An analysis of the operations of the Oil,Gas and Petrochemicals businesses is included in the“Business divisions” section below.
We have also agreed to sell, or are negotiating to sell, anumber of other businesses. These include our Reinsurancebusiness, which, we agreed to sell in December 2003, toWhite Mountains Insurance Group Limited of Bermuda for approximately $ 425 million. This business providesinternational reinsurance and insurance underwriting, as wellas specialized primary insurance in the United States.
We agreed to sell our MDCV cable business, located inGermany to the Wilms Group of Menden, Germany. The salewas completed in January 2004.
Impairment charges recorded on these yet to be completeddivestments of $154 million and $10 million for Reinsuranceand the MDCV cable business, respectively, have beenrecorded in loss from discontinued operations, net of tax, in2003. An analysis of the operations of these businesses isincluded in the “Business divisions” section below.
In February 2004, we agreed to sell our Swiss BuildingSystems business to CapVis Equity Partners AG, a Swissprivate equity company for approximately $ 39 million, butretained a 10 percent ownership interest. The completion ofthis sale is subject to customary regulatory approvals.

ABB Group Financial review 2003 17
Factors affecting comparability
Exchange ratesWe report our financial results in U.S. dollars. A significantamount of our revenues, expenses, assets and liabilities aredenominated in other currencies due to our globaloperations. As a consequence, movements in exchangerates affect:
■ our profitability,
■ the comparability of our results between periods, and
■ the carrying value of our assets and liabilities.
When we incur expenses that are not denominated in thesame currency as the related revenues, foreign exchangerate fluctuations could adversely affect our profitability.
We must translate non-U.S. dollar denominated results ofoperations, assets and liabilities to U.S. dollars in ourConsolidated Financial Statements. Balance sheet items aretranslated to U.S. dollars using year-end foreign currencyexchange rates and income statement and cash flow itemsare translated using average foreign currency exchange ratesduring the relevant period. As a consequence, increases anddecreases in the value of the U.S. dollar against othercurrencies will affect our reported results of operations andthe value of our assets and liabilities in our ConsolidatedBalance Sheet, even if our results of operations or the valueof those assets and liabilities has not changed in their originalcurrency. Consequently, because of the impact foreignexchange rates have on our reported results of operationsand the reported value of our assets and liabilities, changesin foreign exchange rates could significantly impact thecomparability of our reported results of operations betweenfinancial periods and/or result in significant changes to thereported value of our assets and liabilities.
Summary financial dataThe following table shows the amount and percentage of our revenues derived from each of our business divisions (see also Note 26 to our Consolidated Financial Statements):
Revenues Percentage of revenuesYear ended December 31, Year ended December 31,
2003 2002 2001 2003 2002 2001
($ in millions) (in %)
Power Technologies 7,680 6,963 6,776 37 35 32Automation Technologies 9,897 8,464 8,496 47 43 40Non-Core Activities
Equity Ventures 26 19 34 – – –Remaining Structured Finance 48 66 97 – – –Building Systems 1,829 2,375 2,613 – – –New Ventures 53 50 97 – – –Other Non-Core Activities 581 937 1,278 – – –
Non-Core Activities Subtotal 2,537 3,447 4,119 12 18 20Corporate/Other 822 860 1,596 4 4 8Subtotal 20,936 19,734 20,987 100 100 100Consolidation effect and eliminations (2,141) (2,268) (2,653)Consolidated revenues 18,795 17,466 18,334
We conduct business in approximately 100 countries around the world. The following table shows the amount and percentage of our consolidated revenues derived from each geographic region (based on the location of the customer) in which we operate:
Revenues Percentage of revenuesYear ended December 31, Year ended December 31,
2003 2002 2001 2003 2002 2001
($ in millions) (in %)
Europe 10,332 9,739 10,368 55 56 57The Americas 3,572 3,834 4,346 19 22 24Asia 3,346 2,587 2,420 18 15 13Middle East and Africa 1,545 1,306 1,200 8 7 6Total 18,795 17,466 18,334 100 100 100

18 ABB Group Financial review 2003
Because fluctuations in exchange rates affect thecomparability of our results of operations between periods,the discussion of our results of operations below provides,where relevant, information with respect to orders, revenuesand earnings before interest and taxes as reported in localcurrencies.
While we operate globally and report our financial results inU.S. dollars, because of the location of our more significantmarkets and because our headquarters are in Switzerland,foreign exchange rate movements between the U.S. dollarand both the euro (EUR) and the Swiss franc (CHF) are ofparticular importance to us.
In 2003, the euro strengthened against the dollar from a rateof $ 1.05 to EUR 1.00 at the end of 2002 to a rate of $ 1.26to EUR 1.00. In 2002, the euro also strengthened againstthe dollar, increasing from a rate of $ 0.88 to EUR 1.00 at the end of 2001 to a rate of $ 1.05 to EUR 1.00 at the end of 2002. Similarly, the average U.S. dollar to euro foreignexchange rate was $ 1.13, $ 0.94 and $ 0.89 to EUR 1.00during 2003, 2002 and 2001, respectively.
In 2003, the Swiss franc strengthened against the dollar froma rate of $ 0.72 to CHF 1.00 at the end of 2002 to a rate of $ 0.81 to CHF 1.00. In 2002, the CHF also strengthenedagainst the dollar, increasing from a rate of $ 0.59 to CHF1.00 at the end of 2001 to a rate of $ 0.72 to CHF 1.00 atthe end of 2002. Similarly, the average U.S. dollar to CHFforeign exchange rate was $ 0.75, $ 0.64 and $ 0.59 to CHF1.00 during 2003, 2002 and 2001, respectively.
OrdersWe book an order when a binding contractual agreementhas been concluded with the customer covering, at aminimum, the price and the scope of products or services tobe supplied. Approximately 8 percent of our total ordersbooked in 2003 were “large orders”, which we define asorders from third parties involving at least $ 15 million worthof products or systems. Portions of our business involveorders related to long-term projects, which can take manymonths or even years to complete. Revenues related tothese large orders are typically recognized on a percentageof completion basis over the period of time taken tocomplete the project. Of the total orders in the PowerTechnologies and Automation Technologies divisions in2003, approximately 11 percent and 7 percent respectively,represented large orders.
The level of orders can fluctuate from year to year.Arrangements included in particular orders can be complexand non-recurring. Although large orders are more likely toresult in revenues in future periods, the level of large orders,and orders generally, cannot be used to accurately predictfuture revenues or operating performance. Orders that are placed can be cancelled, delayed or modified by the
customer. These actions can have the effect of reducing oreliminating the level of expected revenues or delaying the realization of revenues.
Percentage of completion method of accountingWhen we undertake a long-term project, we recognizecosts, revenues and profit margin from that project in eachperiod, based on the estimated percentage of the projectcompleted. Profit margin is based on our estimate of theamount by which total contract revenues will exceed totalcontract costs at completion. Accordingly, as workprogresses or as change orders are approved and estimatesare revised, contract margins may be increased or reduced.Expected losses on loss contracts are recognized in fullwhen known.
In an effort to reduce the amount of risk associated withlong-term fixed price contracts we have shifted our focus tolong-term reimbursable contracts, when possible, in which we charge our customers the sum of our materials,production, logistics, administrative and financial costs,together with a negotiated operating profit margin. While noteliminating the risk of loss completely, the nature of long-term reimbursable contracts generally means that costsresulting from contract delays or cost increases may berecovered from the customer more easily than in the casewith fixed price contracts, where, we generally mustdemonstrate that the delays and increased costs were adirect result of the customer’s action or impact.
Performance measuresWe evaluate the performance of our divisions based uponearnings before interest and taxes (EBIT), or operating profit,which excludes interest and dividend income, interest andother finance expense, provision for taxes, minority interestand loss from discontinued operations, net of tax. We alsoevaluate the performance of our divisions in terms of theirrevenues, including interdivisional revenues. Approximately,95 percent of our core divisions’ revenues are third-partycustomer sales.
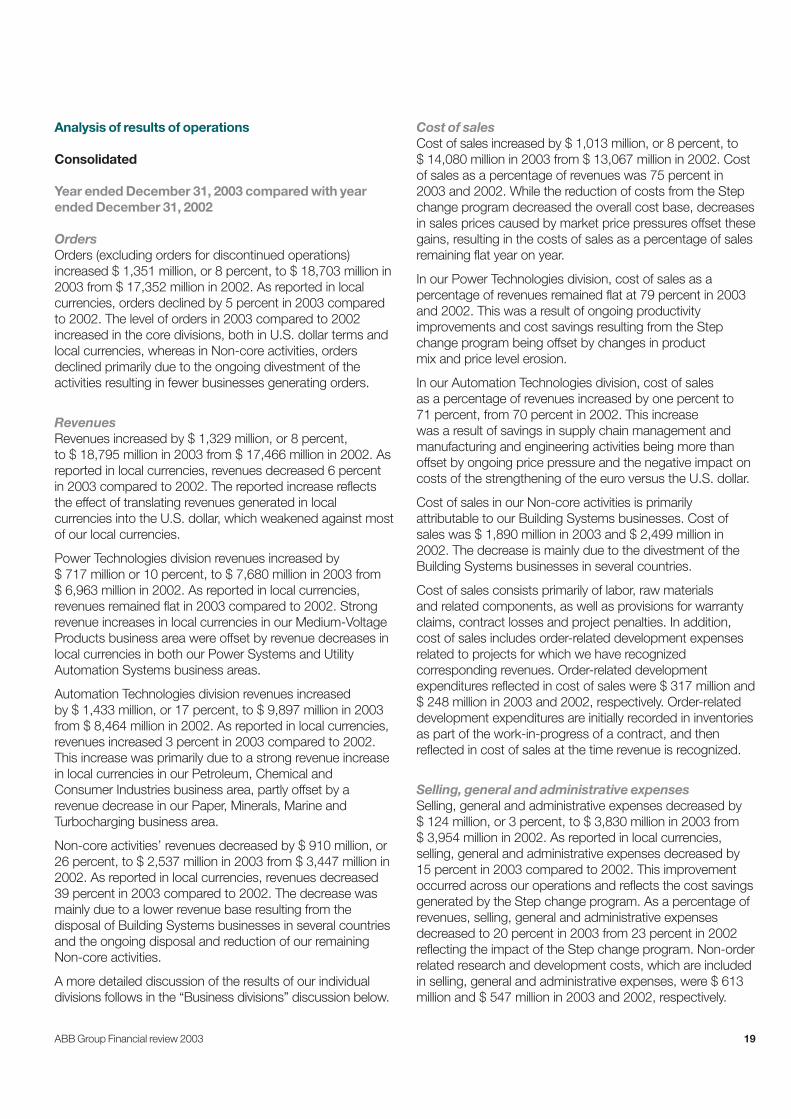
ABB Group Financial review 2003 19
Analysis of results of operations
Consolidated
Year ended December 31, 2003 compared with yearended December 31, 2002
OrdersOrders (excluding orders for discontinued operations)increased $ 1,351 million, or 8 percent, to $ 18,703 million in2003 from $ 17,352 million in 2002. As reported in localcurrencies, orders declined by 5 percent in 2003 comparedto 2002. The level of orders in 2003 compared to 2002increased in the core divisions, both in U.S. dollar terms andlocal currencies, whereas in Non-core activities, ordersdeclined primarily due to the ongoing divestment of theactivities resulting in fewer businesses generating orders.
RevenuesRevenues increased by $ 1,329 million, or 8 percent, to $ 18,795 million in 2003 from $ 17,466 million in 2002. Asreported in local currencies, revenues decreased 6 percentin 2003 compared to 2002. The reported increase reflectsthe effect of translating revenues generated in localcurrencies into the U.S. dollar, which weakened against mostof our local currencies.
Power Technologies division revenues increased by $ 717 million or 10 percent, to $ 7,680 million in 2003 from $ 6,963 million in 2002. As reported in local currencies,revenues remained flat in 2003 compared to 2002. Strongrevenue increases in local currencies in our Medium-VoltageProducts business area were offset by revenue decreases inlocal currencies in both our Power Systems and UtilityAutomation Systems business areas.
Automation Technologies division revenues increased by $ 1,433 million, or 17 percent, to $ 9,897 million in 2003from $ 8,464 million in 2002. As reported in local currencies,revenues increased 3 percent in 2003 compared to 2002.This increase was primarily due to a strong revenue increasein local currencies in our Petroleum, Chemical andConsumer Industries business area, partly offset by arevenue decrease in our Paper, Minerals, Marine andTurbocharging business area.
Non-core activities’ revenues decreased by $ 910 million, or26 percent, to $ 2,537 million in 2003 from $ 3,447 million in2002. As reported in local currencies, revenues decreased39 percent in 2003 compared to 2002. The decrease wasmainly due to a lower revenue base resulting from thedisposal of Building Systems businesses in several countriesand the ongoing disposal and reduction of our remainingNon-core activities.
A more detailed discussion of the results of our individualdivisions follows in the “Business divisions” discussion below.
Cost of salesCost of sales increased by $ 1,013 million, or 8 percent, to $ 14,080 million in 2003 from $ 13,067 million in 2002. Costof sales as a percentage of revenues was 75 percent in2003 and 2002. While the reduction of costs from the Stepchange program decreased the overall cost base, decreasesin sales prices caused by market price pressures offset thesegains, resulting in the costs of sales as a percentage of salesremaining flat year on year.
In our Power Technologies division, cost of sales as apercentage of revenues remained flat at 79 percent in 2003and 2002. This was a result of ongoing productivityimprovements and cost savings resulting from the Stepchange program being offset by changes in productmix and price level erosion.
In our Automation Technologies division, cost of sales as a percentage of revenues increased by one percent to 71 percent, from 70 percent in 2002. This increase was a result of savings in supply chain management andmanufacturing and engineering activities being more thanoffset by ongoing price pressure and the negative impact oncosts of the strengthening of the euro versus the U.S. dollar.
Cost of sales in our Non-core activities is primarilyattributable to our Building Systems businesses. Cost ofsales was $ 1,890 million in 2003 and $ 2,499 million in2002. The decrease is mainly due to the divestment of theBuilding Systems businesses in several countries.
Cost of sales consists primarily of labor, raw materials and related components, as well as provisions for warrantyclaims, contract losses and project penalties. In addition,cost of sales includes order-related development expensesrelated to projects for which we have recognizedcorresponding revenues. Order-related developmentexpenditures reflected in cost of sales were $ 317 million and$ 248 million in 2003 and 2002, respectively. Order-relateddevelopment expenditures are initially recorded in inventoriesas part of the work-in-progress of a contract, and thenreflected in cost of sales at the time revenue is recognized.
Selling, general and administrative expensesSelling, general and administrative expenses decreased by $ 124 million, or 3 percent, to $ 3,830 million in 2003 from $ 3,954 million in 2002. As reported in local currencies,selling, general and administrative expenses decreased by15 percent in 2003 compared to 2002. This improvementoccurred across our operations and reflects the cost savingsgenerated by the Step change program. As a percentage ofrevenues, selling, general and administrative expensesdecreased to 20 percent in 2003 from 23 percent in 2002reflecting the impact of the Step change program. Non-orderrelated research and development costs, which are includedin selling, general and administrative expenses, were $ 613million and $ 547 million in 2003 and 2002, respectively.

20 ABB Group Financial review 2003
Amortization expense Amortization expense was $ 40 million in 2003 compared to $ 41 million in 2002. The expense in 2003 and 2002primarily reflects the amortization of intellectual propertyrelated to the 1999 acquisition of Elsag Bailey ProcessAutomation N.V.
Other income (expense), netOther income (expense), net, principally consists of:restructuring charges; our share of income or loss oninvestments, principally from our Equity Ventures businessarea; gains or losses from sales of businesses which are not accounted for as discontinued operations; gains orlosses from sales of investments and property, plant andequipment; license income and write-downs of tangible andintangible assets.
Other income (expense), net, increased to an expense of $ 189 million in 2003 from an expense of $ 58 million in2002. The increased expense was principally a result of anincrease in restructuring charges in 2003 to $ 325 millioncompared to $ 259 million in 2002; a decrease in our shareof income from investments in 2003 to $ 101 millioncompared to $ 182 million in 2002; a decrease in gains fromthe sales of businesses in 2003 to $ 69 million versus $ 113 million in 2002 and a decrease in asset write-downsand other items in 2003 to $ 34 million compared to $ 94 million in 2002.
The increase in restructuring charges in 2003 was primarily a result of costs incurred in 2003 from the streamlining of the Building Systems business in Germany and from lease cancellation costs associated with the closing anddivestment of businesses in the U.K. and Germany, whichwere not present in 2002. The decrease in our share ofincome from investments in 2003 compared to 2002 wasprimarily due to a decrease in income from our stake inSwedish Export Credit Corporation, which we divested in thesecond quarter of 2003. The decrease in gains from thesales of businesses in 2003 was primarily caused by the loss recorded in 2003 on the sale of Swedish Export CreditCorporation of approximately $ 80 million, which partly offsetthe $ 83 million net gain recorded from the sale of ourBuilding Systems businesses in several countries and a $ 28million gain recorded from the sale of our interest in Electranet Pty Ltd. and in ABB Redbank Project Pty Ltd. In2002, we recorded a gain of approximately $ 74 million fromthe sale of our Air Handling business. Asset write-downs andother items decreased primarily because of the non-recurrence of write-downs in our Non-core activities andCorporate/Other, which decreased to $ 9 million and $ 10million in 2003 from $ 47 million and $ 37 million in 2002respectively, mainly due to software write-downs.
Earnings before interest and taxesEarnings before interest and taxes, or operating income,increased by $ 310 million, or 90 percent, to $ 656 million in2003 from $ 346 million in 2002. As reported in localcurrencies, earnings before interest and taxes improved by70 percent in 2003 when compared to 2002. The effects ofour Step change cost reduction program significantlycontributed to the increase in earnings before interest andtaxes. As a percentage of revenues, earnings before interestand taxes increased to 3 percent in 2003 from 2 percent in2002.
Net interest and other finance expenseNet interest and other finance expense refers to theaggregate of the Consolidated Income Statement line itemsinterest and dividend income and interest and other financeexpense. Interest and other finance expense includesimpacts associated with the change in fair value ofthe embedded derivative contained in our $ 968 millionconvertible bonds; amortization of financing costsassociated with the issuance of our debt securities; losseson marketable securities and investments accounted for atcost; and interest expense on our borrowings. Net interestand other finance expense increased by $ 284 million, or 225 percent, to an expense of $ 410 million in 2003compared with an expense of $ 126 million in 2002.
Interest and dividend income decreased by $ 45 million, or24 percent, to $ 144 million in 2003 from $ 189 million in2002 primarily due to lower market interest rates.
Interest and other finance expense increased to $ 554 millionin 2003 from $ 315 million in 2002, an increase of $ 239 million or 76 percent. Included in interest and financeexpense in 2003 is an expense of $ 84 million associatedwith the change in fair value of the embedded derivativecontained in our $ 968 million convertible bonds, comparedto a net gain of $ 215 million in 2002 for the same item. Theunrealized gain (loss) resulted from the application ofStatement of Financial Accounting Standards No.133 (SFAS133), Accounting for Derivative Instruments and HedgingActivities, whereby a portion of the issuance proceeds isdeemed to relate to the value of the derivative on issuance,creating a discount upon the issuance of the bonds. Subsequent changes in the value of the derivative and thecontinued amortization of the discount upon issuance areincluded in interest and other finance expense. Thisaccounting treatment is more fully described in Note 15 toour Consolidated Financial Statements. Amortization offinancing costs associated with the issuance of our debtsecurities was flat between 2003 and 2002. Also included ininterest and finance expense in 2003 is a $ 40 millionexpense relating to the loss on disposal of Sinopec Corp.and a $ 36 million expense relating to the loss on sale ofmarketable securities, which were not present in 2002.

ABB Group Financial review 2003 21
Provision for taxesProvision for taxes increased by $ 4 million to $ 78 million in2003 compared to $ 74 million in 2002. The effective tax ratecalculated as the provision for taxes, divided by income fromcontinuing operations before taxes and minority interest was31.7 percent in 2003 and 33.6 percent in 2002.
The decrease in the effective tax rate is primarily attributableto $ 56 million of adjustments, relating to the favorableresolution of certain prior year tax matters, includingthe release of $ 38 million tax provision related to a tax caseruled in our favor. This is partially offset by the $ 84 millionloss on the change in fair value of the embedded derivativecontained in our $ 968 million convertible bonds, whichis taxed at a rate that is lower than our effective tax rate.
The effective tax rate in 2002 of 33.6 percent was alsoimpacted by the change in fair value of the embeddedderivative contained in our $ 968 million convertible bonds, as the $ 215 million gain partially offset by additionalfinancing related costs, restructuring costs and costs relatedto Non-core activities that are taxed at rates lower than oureffective tax rate.
Income from continuing operationsIncome from continuing operations increased by $ 11 millionto $ 86 million in 2003 compared to $ 75 million in 2002. Theincrease reflects the impact of the items discussed above.
Loss from discontinued operations, net of taxLoss from discontinued operations, net of tax, decreased by$ 5 million to $ 853 million in 2003 from $ 858 million in2002. Tax expense in discontinued operations increased by $ 168 million to $ 218 million in 2003 compared to $ 50 million in 2002.
A detailed discussion of the results of the significantbusinesses classified as discontinued operations follows inthe “Business divisions” section.
Net Loss Net loss decreased by $ 16 million, or 2 percent, to $ 767million in 2003 from $ 783 million in 2002.
Earnings per share
Basic and Diluted earnings (loss) per shareYear ended December 31, (in $) 2003 2002
Income from continuing operationsBasic 0.07 0.07Diluted 0.07 (0.10)
Loss from discontinued operations, net of tax
Basic (0.70) (0.77)Diluted (0.70) (0.73)
Net LossBasic (0.63) (0.70)Diluted (0.63) (0.83)
Basic earnings per share is calculated by dividing income bythe weighted-average number of shares outstanding duringthe year. Diluted earnings per share is calculated by dividingincome by the weighted-average number of sharesoutstanding during the year, assuming that all potentiallydilutive securities were exercised and that any proceeds fromsuch exercises were used to acquire shares of our stock atthe average market price during the year or the period thesecurities were outstanding, if shorter. Potentially dilutivesecurities comprise: outstanding written call options, ifdilutive; the securities issued under our managementincentive plan, to the extent the average market price of ourstock exceeded the exercise prices of such instruments;shares issuable in relation to the convertible bonds, if dilutive;and outstanding written put options, for which net sharesettlement at average market price of our stock wasassumed, if dilutive.
The shares issuable in relation to the warrants and optionsoutstanding in connection with our management incentiveplan were excluded from the computation of diluted earningsper share in all periods presented as their inclusion wouldhave been antidilutive. In 2002, the shares issuable in relationto the convertible bonds were included in the computation of diluted earnings per share for the period they wereoutstanding.
Basic loss per share was $ 0.63 in 2003 compared to a lossper share of $ 0.70 in 2002. The difference was largely theresult of the factors mentioned above which impactedearnings.

22 ABB Group Financial review 2003
decrease was primarily the result of operationalimprovements within the Automation Technologies divisionand the non-recurrence of a number of costs from 2001within the Non-core activities. Cost of sales for Non-coreactivities during 2001 included $ 329 million for the AirHandling business area which we sold in January 2002. In2001, within Non-core activities costs and provisions were recorded in relation to alternative energy projects of $ 55 million in the New Ventures business area. The non-recurrence of these costs in 2002 in the Non-core activitieshas been partly offset by project write-downs, closure andrestructuring costs within the Building Systems businessarea. Order-related development expenditures amounted to$ 248 million and $ 404 million, in 2002 and 2001,respectively.
Selling, general and administrative expensesOur selling, general and administrative expenses increasedby $ 25 million, or 1 percent, to $ 3,954 million in 2002 from$ 3,929 million in 2001. As reported in local currencies,selling, general and administrative expenses decreased by 3 percent in 2002 compared to 2001. This improvement ona local currency basis was the result of the continuing group-wide cost reduction and efficiency improvement initiativesfrom 2001 and the recovery of payments from a former chiefexecutive officer. This improvement was slightly offset by thegroup-wide integration costs of group processes. As apercentage of revenues, selling, general and administrativeexpenses increased by 2 percent to 23 percent in 2002,from 21 percent in 2001. Non-order related research anddevelopments costs, which are included in selling, generaland administrative expenses, were $ 547 million in 2002and $ 590 million in 2001. In 2002, the core-divisionsincurred non-order related research and development costsof $ 441 million compared to $ 449 million in 2001.
Amortization expenseAmortization expense decreased by $ 147 million, or 78percent, to $ 41 million in 2002 from $ 188 million in 2001.This decrease reflects the implementation of SFAS 142,pursuant to which we ceased amortizing goodwill effectiveJanuary 1, 2002. The expense in 2002 primarily reflects theamortization of intellectual property related to the 1999acquisition of Elsag Bailey Process Automation N.V.
Other income (expense), netOther income (expense), net, decreased by $ 103 million, or 64 percent, to an expense of $ 58 million in 2002 from anexpense of $ 161 million in 2001. The increase in capitalgains to $ 113 million in 2002 from $ 56 million in 2001primarily reflected the gain on the sale of our Air Handlingbusiness in January 2002. In addition income from equityaccounted companies, license income and other increased
Year ended December 31, 2002 compared with yearended December 31, 2001
OrdersOrders (excluding orders for discontinued operations)decreased $ 1,299 million, or 7 percent, to $ 17,352 millionin 2002 from $ 18,651 million in 2001. As reported in localcurrencies, orders declined by 10 percent in 2002 comparedto 2001. The level of orders in 2002 compared to 2001increased in the Automation Technologies division butdecreased in the Power Technologies and Non-coredivisions.
RevenuesRevenues decreased by $ 868 million, or 5 percent, to $ 17,466 million in 2002 from $ 18,334 million in 2001. Asreported in local currencies, revenues decreased 8 percentin 2002 compared to 2001. The underlying decrease inrevenues on a local currency basis was primarily within ourNon-core activities.
Power Technologies division revenues increased by $ 187 million, or 3 percent to $ 6,963 million in 2002 from $ 6,776 million in 2001. As reported in local currencies,revenues increased 1 percent in 2002 compared to 2001.Revenues showed a modest increase in most businessareas, partially offset by a decrease in our DistributionTransforms business area.
Automation Technologies division revenues decreased by $ 32 million, to $ 8,464 million in 2002 from $ 8,496 million in2001. As reported in local currencies, revenues decreased 3 percent in 2002 compared to 2001. Revenue growth inour Petroleum, Chemical and Consumer business area wasoffset by a reduction in revenues in most of the otherbusiness areas due to weaker demand.
Non-Core activities revenues decreased by $ 672 million, or16 percent to $ 3,447 million in 2002 from $ 4,119 million in2001. As reported in local currencies, revenues decreasedby 22 percent in 2002 compared to 2001. This decreaseresulted from the sale of the Air Handling business in January2002, market downturns in the Building Systems businessarea and the strategic reduction of our presence in some ofthe markets of the Logistics Systems and CustomerSystems business areas.
A more detailed discussion of the individual divisions followsin the “Business divisions” section.
Cost of salesCost of sales decreased by $ 472 million, or 3 percent, to $ 13,067 million in 2002 from $ 13,539 million in 2001. Cost of sales as a percentage of revenues increased by one percent to 75 percent, from 74 percent in 2001. The

ABB Group Financial review 2003 23
to $ 182 million in 2002 from $ 93 million in 2001 (primarilyrelated to our investment in the Swedish Export CreditCorporation). These increases were partly offset by thecombined effects of the increase in restructuring expenses to$ 259 million in 2002 from $ 221 million in 2001 and theincrease in asset write-downs of both tangible and intangibleassets to $ 94 million in 2002 from $ 89 million in 2001.
Earnings before interest and taxesEarnings before interest and taxes, or operating income,decreased by $ 171 million, or 33 percent, to $ 346 million in2002 from $ 517 million in 2001. As reported in localcurrencies, earnings before interest and taxes decreased by 42 percent in 2002 compared to 2001. This decrease isprimarily attributable to the decreased revenue base in 2002compared to 2001.
Net interest and other finance expenseNet interest and other finance expense refers to theaggregate of the Consolidated Income Statement line itemsinterest and dividend income and interest and other financeexpense. Net interest and other finance expense decreasedby $ 97 million, or 43 percent, to $ 126 million in 2002compared to $ 223 million in 2001. In 2002, net interest andother finance expense includes the change in fair value of theembedded derivative contained in our $ 968 millionconvertible bonds and lower market interest rates that werepartially offset by costs of $ 99 million associated with ourdebt refinancing. Total borrowings decreased in November2002 due to the sale of our Structured Finance business,whereas average borrowings were flat for the year 2002.
Interest and dividend income decreased by $ 159 million, or46 percent, to $ 189 million in 2002 from $ 348 million in2001, among other things due to the sale of trading securitiesfollowing the cessation of proprietary trading in formerTreasury Centers and the reduction in market interest rates.
Interest and other finance expense improved by $ 256 million,or 45 percent, to $ 315 million in 2002 from $ 571 million in 2001, primarily due to a reduction in total borrowings andas a result of the change in fair value of the embeddedderivative contained in our $ 968 million convertible bondsresulting in a net gain of $ 215 million in 2002. These gainswere partly offset by costs of $ 99 million associated with our debt refinancing.
Provision for taxesProvision for taxes decreased $ 13 million to $ 74 million in 2002 from $ 87 million in 2001. The effective tax ratecalculated as the provision for taxes, divided by income fromcontinuing operations before taxes and minority interest was33.6 percent in 2002 and 29.6 percent in 2001.
Income from continuing operationsIncome from continuing operations decreased by $ 96 millionto $ 75 million in 2002 from $ 171 million in 2001. Thedecrease reflects the impact of the items discussed above.
Loss from discontinued operations, net of taxLoss from discontinued operations, net of tax, was $ 858 million in 2002, compared to $ 837 million in 2001.Tax expense in discontinued operations increased by $ 35million to $ 50 million in 2002 compared to $ 15 million in2001.
A detailed discussion of the results of the significant discon-tinued businesses follows in the “Business divisions” section.
Net lossAs a result of the factors discussed above, net lossincreased by $ 54 million, or 7 percent, to a loss of $ 783 million in 2002 from a loss of $ 729 million in 2001.
Earnings (loss) per share
Basic and Diluted earnings (loss) per shareYear ended December 31, (in $) 2002 2001
Income from continuing operationsBasic 0.07 0.15Diluted (0.10) 0.15
Loss from discontinued operations, net of tax
Basic (0.77) (0.73)Diluted (0.73) (0.73)
Net LossBasic (0.70) (0.64)Diluted (0.83) (0.64)
Basic loss per share was $ 0.70 and $ 0.64 in 2002 and2001, respectively, resulting from the factors mentionedabove.
In 2002, the potential common shares from the convertiblebonds were included in the computation of diluted loss pershare. The diluted loss per share was $ 0.83 and $ 0.64 in2002 and 2001, respectively, resulting from the factorsmentioned above.

24 ABB Group Financial review 2003
Business divisions
OverviewIn order to streamline our structure and improve operational performance we have, as of January 1, 2003, put into placetwo new divisions: Power Technologies, which combines the former Power Technology Products and Utilities divisions; andAutomation Technologies, which combines the Automation Technology Products and Industries divisions. We presentsegment data below to reflect this change and we have restated data with respect to prior years.
The tables below present revenues, earnings before interest and taxes (or operating income) and operating margins fromcontinuing operations by division for the years 2003, 2002 and 2001 and net operating assets by division at December 31,2003, 2002 and 2001 (see also Note 26 to the Consolidated Financial Statements):
Revenues Net operating assetsYear ended December 31, December 31,
2003 2002 2001 2003 2002 2001
($ in millions) ($ in millions)
Power Technologies 7,680 6,963 6,776 2,624 2,335 2,054Automation Technologies 9,897 8,464 8,496 3,787 3,483 3,173Non-Core Activities
Equity Ventures 26 19 34 1,151 1,062 1,069Structured Finance 48 66 97 643 1,165 1,513Building Systems 1,829 2,375 2,613 9 68 (35)New Ventures 53 50 97 313 262 269Other Non-Core Activities 581 937 1,278 (237) (159) (527)
Total Non-Core Activities 2,537 3,447 4,119 1,879 2,398 2,289Corporate/Other 822 860 1,596 2,524 2,346 2,732Inter-division elimination (2,141) (2,268) (2,653) (1,128) (736) (770)Consolidated 18,795 17,466 18,334 9,686 9,826 9,478
Earnings before interest and taxes Operating marginsYear ended December 31, Year ended December 31,
2003 2002 2001 2003 2002 2001
($ in millions) (in %)
Power Technologies 563 433 405 7.3 6.2 6.0Automation Technologies 773 517 514 7.8 6.1 6.0Non-Core Activities
Equity Ventures 76 43 75 n/a n/a n/aStructured Finance (65) 96 1 n/a n/a n/aBuilding Systems (104) (113) 18 n/a n/a n/aNew Ventures (21) (37) (143) n/a n/a n/aOther Non-Core Activities (67) (170) (64) n/a n/a n/a
Total Non-Core Activities (181) (181) (113) (7.1) (5.3) (2.7)Corporate/Other (475) (350) (157) n/a n/a n/aInter-division elimination (24) (73) (132) n/a n/a n/aConsolidated 656 346 517 3.5 2.0 2.8

ABB Group Financial review 2003 25
Division costsCost of sales and selling, general and administrativeexpenses comprise substantially all of the operatingexpenses for all divisions. Cost of sales includes, amongother things, personnel costs, the cost of raw materials,components, order-related research and development andprocurement costs related to the sale of our products andservices. Selling, general and administrative expensesinclude the overhead related to the sales force and all costsrelated to general management, human resources, financialcontrol, corporate finance and non-order related researchand development.
Further details of the divisional performances follow.
Power TechnologiesPower Technologies serves electric, gas and water utilities as well as industrial and commercial customers, with a broad range of products, systems and services. Ongoingderegulation and privatization in these markets are drivingdemand by increasing competition in the market. This hasled to industry consolidation and pressures on the utilities tomake existing plants more competitive by modernizingequipment and outsourcing activities such as service andmaintenance. The trend is advanced but continuing in theUnited States, Western Europe, and parts of Latin America.This trend is beginning to take hold in most other markets as well.
The demand in China, India and the Middle East remainedstrong in 2003. The Eastern European market showed goodgrowth, whereas growth in Western Europe was modest. In North America demand was weak due to the flateconomic groth in the major industrial countries. Political andfinancial uncertainties continued to depress energy marketsin Latin America.
In 2004, we expect order growth in Eastern Europe tocontinue and the mixed economic environment in WesternEurope to remain. Demand in Latin America is expected tostay modest, whereas the low demand in the United Statesis expected to improve in the second half of 2004. Weexpect the strong growth in Asia and the Middle East tocontinue. On a global basis, we expect the market toimprove in 2004. We expect higher investments in the utilityindustry, strong recovery from original equipmentmanufacturers and mixed levels of demand in the otherindustries we serve, depending on segment and market.
Year ended December 31, 2003 compared with yearended December 31, 2002Orders increased by $ 955 million, or 14 percent, to $ 7,708million in 2003 from $ 6,753 million in 2002. As reported inlocal currencies, orders increased by 4 percent in 2003compared to 2002. Orders increased in all business areas on
a reported basis, whereas in local currencies orders in ourHigh-Voltage Products business area remained flat andshowed a slight decrease in the Power Transformers andDistribution Transformers business areas. The strongestorder increase, both nominal and in local currencies, wasexperienced in our Medium-Voltage Products and UtilityAutomation Systems business areas, following a goodgrowth in our base orders. In the Utility Automation Systemsbusiness area, the order increase was further enhanced by ahigher level of large project awards. Regionally, the increasewas driven by double-digit growth in the Middle East, Asia and Eastern Europe. Orders from other divisions were $ 420 million in 2003 (representing 5 percent of divisionorders) compared to $ 408 million in 2002 (representing 6 percent of division orders).
Revenues increased by $ 717 million, or 10 percent, to $ 7,680 million in 2003 from $ 6,963 million in 2002. Asreported in local currencies, revenues remained flat in 2003compared to 2002. Our Medium-Voltage Products businessarea showed a strong increase in revenues based on goodgrowth in China and Eastern Europe. Our Power Systemsand Utility Automation Systems business areas both showeda decrease in revenues in local currencies due to a low orderintake in the second half of 2002. The revenue performancealso reflected the loss of revenues from three businessesthat were divested in the United States, Poland and Italy.Adjusted for change in scope of business due to thesedivestments, revenues in local currencies increased by 3 percent in 2003 compared to 2002. Revenues fromother divisions were $ 410 million in 2003 (representing 5 percent of division revenues) compared to $ 195 million in2002 (representing 3 percent of division revenues).
Cost of sales was $ 6,078 million representing 79 percent ofrevenues in 2003 compared to $ 5,516 million representing79 percent of revenues in 2002. Despite difficult markets in 2003 characterized by a less favorable product mix andprice level erosion, most noticeably in our PowerTransformers business area with smaller declines in ourHigh-Voltage Products and Medium-Voltage Productsbusiness areas, cost of sales as percentage of revenuesremained flat mainly due to ongoing productivityimprovements and cost savings.
Selling, general and administration expenses increased inU.S. dollar terms by $ 28 million or 3 percent to $ 980 millionin 2003 from $ 952 million in 2002. As reported in localcurrencies, selling, general and administration expensesdecreased by 9 percent in 2003 compared to 2002.Expressed as a percentage of revenues, selling, general andadministration expenses decreased to 13 percent in 2003compared to 14 percent in 2002 reflecting the impact of thevarious restructuring and efficiency improvement programs.

26 ABB Group Financial review 2003
Cost of sales was $ 5,516 million representing 79 percent of revenues in 2002 compared to $ 5,324 millionrepresenting 79 percent of revenues in 2001. Cost of salesas a percentage of revenues remained flat.
Selling, general and administration expenses decreased inU.S. dollar terms by $ 8 million to $ 952 million in 2002compared to $ 960 million in 2001. As reported in localcurrencies, selling, general and administration expensesdecreased by 3 percent in 2002 compared to 2001.Expressed as a percentage of revenues, selling, general andadministration expenses decreased to 14 percent in 2002compared to 15 percent in 2001 primarily due to theongoing restructuring programs.
Earnings before interest and taxes, or operating income,increased by $ 28 million, or 7 percent, to $ 433 million in2002 compared to $ 405 million in 2001. As reported in localcurrencies, earnings before interest and taxes increased by 7 percent in 2002 compared to 2001. Operating income in the Power Systems business area decreased mainly dueto the execution of low-margin projects taken before 2001.This decrease was more than offset by higher earnings in the High-Voltage Products and Medium-Voltage Productsbusiness areas as a result of reductions in overlappingproduct lines, production lines and the size of the workforcein many countries. The restructuring and related asset write-downs decreased from $ 76 million in 2001 to $ 62 in 2002and the operating margin remained at 6 percent in both2002 and 2001.
Automation TechnologiesThe Automation Technologies division’s customers span abroad range of industry sectors and geographic regions.Consequently, demand is influenced by many factors andcan vary significantly among customer groups within a giventime period. Our customers use automation technologiesprimarily to improve productivity, quality, and consistency inindustrial and manufacturing applications.
During 2003, market demand was mixed in Western Europe,with significant growth in the Eastern European countries.North American markets remained weak for much of theyear, with signs of an upturn in the fourth quarter, particularlyin the United States industrial sector. Latin America remainedflat, with low levels of capital investment by our customers.Continued strong growth was seen in Asia, highlighted bycontinued double-digit improvements in China and India.
From an industry perspective, the automotive sectorremained weak, characterized by price pressure. Petroleum,Chemicals, Paper, Marine and Turbocharging remained flat.Investment by the minerals and mining industry was downas a result of price pressure. Consumer industries and lifesciences showed modest growth, with continued strength inoil and gas due to continued demand for automation
Earnings before interest and taxes, or operating income,increased by $ 130 million, or 30 percent, to $ 563 million in2003 from $ 433 million in 2002. As reported in localcurrencies, earnings before interest and taxes increased by22 percent in 2003. The increase in operating income wasprimarily due to the elimination of overlapping product linesand production sites, as well as productivity improvements.All business areas, with significant improvements from the Medium-Voltage Products and Power Systems businessareas, contributed to this increase except the Power Transformers business area. Earnings in Power Transformersdecreased due to low volumes in Canada and the UnitedStates following the weak market demand. The restructuringand related asset write-downs was $ 64 million in 2003 and$ 62 million in 2002 and the operating margin increased from6.2 percent in 2002 to 7.3 percent in 2003.
Year ended December 31, 2002 compared with yearended December 31, 2001Orders decreased by $ 614 million, or 8 percent, to $ 6,753 million in 2002 compared to $ 7,368 million in 2001.As reported in local currencies, orders decreased 9 percentin 2002 compared to 2001. This decrease was primarilyrelated to the Power Systems business area, which experienced a significant reduction in large orders comparedto 2001, when we won two large orders in China and Brazilwith a combined value of more than $ 500 million. Inaddition, our adoption in 2002 of a selective biddingapproach aimed at reducing project risks and securingbetter margins, reduced the number of bids and conse-quently, the order intake. Orders decreased in all businessareas except the Medium-Voltage Products business area,which increased orders from improving demand in Asia.Orders from other divisions were $ 408 million in 2002(representing 6 percent of division orders) compared to $ 927 million in 2001 (representing 13 percent of divisionorders).
Revenues increased by $ 187 million, or 3 percent, to $ 6,963 million in 2002 from $ 6,776 million in 2001. Asreported in local currencies, revenues increased by 1 percentin 2002 compared to 2001. The business area High-VoltageProducts showed a strong growth in revenues, whereas theMedium-Voltage Products and Power Transformers businessareas showed moderate growth partly offset by a moderatedecrease in our Distribution Transformers business area.Revenues were sustained by a high order backlog at the endof 2001 and a strong demand in Asia Pacific markets during2002. Revenues from other divisions were $ 195 million in2002 (representing 3 percent of division revenues) comparedto $ 612 million in 2001 (representing 9 percent of divisionrevenues).

ABB Group Financial review 2003 27
systems in connection with production projects. The serviceactivities within process industries continued to be indemand in this environment of cautious capital investment,with revenue growth for 2003.
In 2004, we expect to see signs of a recovery in Europe and North America, a flat market in Latin America, continuedstrong growth in Asia, and somewhat improved marketconditions in the Middle East and Africa. We anticipate ahealthy growth in the chemicals and life sciences sectors, a gradual recovery in the marine, minerals, and paperindustries, and increased demand in the automotive andgeneral industries.
Year ended December 31, 2003 compared with yearended December 31, 2002Orders increased by $ 1,281 million, or 15 percent, to $ 9,961 million in 2003 compared to $ 8,680 million in 2002.As reported in local currencies, orders increased 2 percent in2003 compared to 2002. A strong increase in orders in local currencies came from our Petroleum, Chemical andConsumer industries business area, supported by thereceipt of a $ 173 million order for turnkey gas compressorsfor a pipeline project in Poland. Our Paper, Minerals, Marineand Turbocharging business area experienced weak marketsin paper and minerals industries and our Robotics,Automotive and Manufacturing business area experiencedweakness in the automotive industry in North America. Allother business areas increased orders both in product andservice businesses. Orders from other divisions were $ 474 million in 2003 compared to $ 429 million in 2002,representing 5 percent of division orders in both the periods.
Revenues increased by $ 1,433 million or 17 percent, to $ 9,897 million in 2003 compared to $ 8,464 million in 2002.As reported in local currencies, revenues increased 3percent in 2003 compared to 2002. Higher backlog from thelarge projects won during 2002, helped to increase revenuessignificantly in our Petroleum, Chemical and ConsumerIndustries business area. The Paper, Minerals, Marine andTurbocharging business area’s revenues decreased due tolower order backlog and weak markets in the paper industry.Most other business areas showed moderate revenueincreases reflecting volume improvements in products andservice sales. Regionally, Asia and Europe had double-digitgrowth rates, whereas revenues in the Americas remainedflat in local currencies. Revenues from other divisions were $ 455 million in 2003 compared to $ 409 million in 2002,representing 5 percent of division revenues in both periods.
Cost of sales was $ 6,991 million representing 71 percent of revenues in 2003 compared to $ 5,933 millionrepresenting 70 percent of revenues in 2002. Cost of salesas a percentage of revenues showed a moderate increase due to ongoing price pressure and the negative impact ofthe strengthening of the euro offsetting savings in supplymanagement, manufacturing and engineering activities.
Selling, general and administration expenses increased inU.S. dollar terms by $ 115 million or 6 percent to $ 1,966million in 2003 compared to $ 1,851 million in 2002. As reported in local currencies, selling, general and administration expenses decreased by 8 percent in 2003compared to 2002. Expressed as a percentage of revenues,selling, general and administration expenses decreased to 20 percent in 2003 compared to 22 percent in 2002reflecting the impact of the various restructuring and efficiency improvement programs.
Earnings before interest and taxes, or operating income,increased by $ 256 million or 50 percent, to $ 773 million in 2003 compared to $ 517 million in 2002. As reported inlocal currencies, earnings before interest and taxesincreased 33 percent in 2003 compared to 2002. Thesignificant improvement in operating income was mainly dueto productivity improvements and successful cost savingsprograms combined with ongoing growth in the servicebusiness resulting in increased operating income in allbusiness areas in 2003. Restructuring and related assetwrite-downs were higher at $ 140 million during 2003 ascompared to $ 137 million during 2002 and the operatingmargin increased to 7.8 percent in 2003 compared to 6.1percent in 2002.
Year ended December 31, 2002 compared with yearended December 31, 2001Orders increased by $ 381 million, or 5 percent, to $ 8,680million in 2002 compared to $ 8,299 million in 2001. Asreported in local currencies, orders increased 1 percent in2002 compared to 2001. Strong demand in India and Chinaled to increased order intake in our Petroleum, Chemical andConsumer Industries business area. Our Control Platformand Enterprise Products business area experienced amoderate decline in orders due to generally weak capitalspending by participants in the process industries. Higherdemand for robotics products in several industries led tohigher orders in the Robotics, Automotive and Manufacturingbusiness area. Low-Voltage Products and Instrumentationand Drives and Motors business areas experienced a flatdevelopment with the increased demand from industrialcustomers in China for products and systems, being offsetby decreased orders from Europe and North America.Orders from other divisions were $ 429 million in 2002(representing 5 percent of division orders) compared to$ 482 million in 2001 (representing 6 percent of divisionorders).

28 ABB Group Financial review 2003
Revenues decreased $ 32 million to $ 8,464 million in 2002compared to $ 8,496 million in 2001. As reported in localcurrencies, revenues decreased by 3 percent in 2002compared to 2001. Revenues mainly increased, in thePetroleum, Chemical and Consumer Industries businessarea due to strong order backlog at the end of 2001 andimproved market conditions in the Middle East, Africa andAsia. This increase was more than offset by a reduction inrevenues in all the other business areas due to generallyweaker market conditions. Revenues from other divisionswere $ 409 million in 2002 (representing 5 percent of divisionrevenues) compared to $ 610 million in 2001 (representing 7 percent of division revenues).
Cost of sales was $ 5,933 million representing 70 percent ofrevenues in 2002 compared to $ 6,005 million representing71 percent of revenues in 2001 reflecting the impact ofproductivity improvement programs.
Selling, general and administration expenses increasedin U.S. dollar terms by $ 62 million or 3 percent to $ 1,851 million in 2002 compared to $ 1,789 million in 2001.As reported in local currencies, selling, general andadministration expenses remained flat. Expressed as apercentage of revenues, selling, general and administrationexpenses increased to 22 percent in 2002 compared to21 percent in 2001, primarily due to increased research anddevelopment costs.
Earnings before interest and taxes, or operating income,increased modestly by $ 3 million to $ 517 million in 2002compared to $ 514 million in 2001. As reported in localcurrencies, earnings before interest and taxes decreased 4 percent in 2002 compared to 2001. This reduction wasmainly due to increased restructuring and asset write-downsof $ 137 million in 2002 as compared to $ 81 million during2001. Earnings decreased in all business areas, except inthe Drives and Motors business area, which remained flat.The operating margin increased to 6.1 percent in 2002compared to 6.0 percent in 2001.
Non-Core ActivitiesBusiness activities that are not directly linked to our coredivisions and which we intend in the majority to divest ordiscontinue are grouped together and their results arereported under the heading of Non-core activities. Thesecomprise primarily the remaining parts of the Equity Venturesbusiness area, the remaining parts of the Structured Financebusiness area, the remaining parts of the Building Systemsbusiness area, the remaining parts of the New Venturesbusiness area and a number of other remaining activities,including Customer Service Workshop, Logistic Systemsand the Group Processes business areas. The Insurancebusiness area, which was previously included in Non-coreactivities, is now included as part of discontinued operations
following our agreement in December 2003 to sell thisbusiness to White Mountains Insurance Group Limited ofBermuda.
In April 2002, we decided to dispose of our Building Systemsbusinesses. The gradual disposal process was envisagedto extend over a non-defined period of time preceded byrestructuring in several locations. The disposal of ourBuilding Systems businesses contemplated that we wouldretain an involvement in the disposed operations through acombination of technology license agreements, supplierrelationships, retention of certain orders and participation onthe Board of Directors of some of the disposed companies.As a result of these factors, we concluded that classificationof the Building systems businesses as discontinuedoperations according to SFAS 144 was not appropriate. Theresults of operations of these businesses and the resultsfrom the disposal of each disposed business are reported inour Consolidated Income Statement within continuingoperations, through the date of disposition.
Year ended December 31, 2003 compared with yearended December 31, 2002Orders decreased by $ 1,164 million, or 33 percent, to $ 2,313 million in 2003 compared to $ 3,477 million in 2002.As reported in local currencies, orders decreased by 45percent in 2003 compared to 2002. The reduction in ordersis primarily due to the ongoing divestment processcombined with difficult market conditions in the BuildingSystems business area, and the discontinuation andreduction of activities in the Group Processes business area.Orders from other divisions amounted to $ 524 million in2003 (representing 23 percent of the division orders in 2003)and $ 871 million in 2002 (representing 25 percent of thedivision orders in 2002).
Revenues decreased by $ 910 million, or 26 percent, to $ 2,537 million in 2003 compared to $ 3,447 million in 2002.As reported in local currencies, revenues declined 39percent in 2003 compared to 2002. Revenues from otherdivisions amounted to $ 553 million in 2003 (representing 22 percent of the division revenues in 2003) and $ 875million in 2002 (representing 25 percent of division revenuesin 2002).
The major components of the Non-core activities revenues iscomprised in the following:
Building Systems revenues decreased by $ 546 million, or 23 percent, to $ 1,829 million in 2003 compared to $ 2,375million in 2002. As reported in local currencies, revenuesdecreased 34 percent in 2003 compared to 2002. Thedecrease in revenues was due to the lower revenue baseresulting from our divestment of the majority of thebusinesses in this business area and continued difficultmarket conditions in the remaining units. Other Non-core

ABB Group Financial review 2003 29
activities include Group Processes revenues that decreasedby $ 241 million, or 32 percent, to $ 517 million in 2003 from$ 758 million in 2002. As reported in local currencies,revenues decreased by 40 percent in 2003 compared to2002. This decrease was mainly due to the reduction of ouractivities in this area. Of the remaining businesses, revenuesdecreased by $ 115 million, or 64 percent, to $ 64 millionin 2003 from $ 179 million in 2002. The decrease was mainlydue to the ongoing divestment and closing process inour Customer Service Workshop and Logistic Systemsbusiness areas.
Earnings before interest and taxes, or operating loss,remained flat at a loss of $ 181 million in 2003 and 2002.As reported in local currencies, operating loss decreased by 6 percent in 2003 compared to 2002. This result wasprimarily attributable to the following:
Equity Ventures operating income increased by $ 33 millionto $ 76 million in 2003 compared to $ 43 million in 2002. Asreported in local currencies, operating income increased by38 percent in 2003 compared to 2002. The increaseprimarily resulted from the gain realized from the divestmentsof ABB Redbank Project Pty Ltd. and ElectraNet Pty Ltd. inAustralia.
Structured Finance operating loss increased by $ 161 millionto a loss of $ 65 million in 2003 compared to an income of $ 96 million in 2002. This increase primarily resulted from aloss on disposal of approximately $ 80 million in 2003following the divestment of our stake in the Swedish ExportCredit Corporation in early 2003, compared to an incomefrom equity accounted companies of $ 125 millionrecognized in 2002.
Building Systems operating loss decreased by $ 9 million to$ 104 million in 2003 compared to $ 113 million in 2002. As reported in local currencies, operating loss decreased by20 percent in 2003 compared to 2002. The operating lossfor 2003 included the gain on sale of the businesses locatedin the Nordic Region for approximately $ 124 million being partially offset by the loss on sale of the businesseslocated in several other countries, principally Belgium, theNetherlands, Austria and the UK for approximately $ 41million. Excluding these non-recurring items, the operatingloss was $ 187 million in 2003 compared to $ 113 million in2002. The increase in the loss from the prior year is the resultof additional restructuring costs and the weak underlyingmarket conditions with the remaining businesses.
New Ventures operating loss decreased by $ 16 million to $ 21 million in 2003 compared to $ 37 million in 2002. Asreported in local currencies, the operating loss decreased by51 percent in 2003 compared to 2002. The decrease waslargely due to the benefits of restructuring activitiesthroughout all businesses leading to a significant reductionin selling, general and administrative expenses andconsiderably lower asset write-downs than in earlier years.
Other Non-core activities operating loss decreased by $ 103 million to $ 67 million in 2003 compared to $ 170million in 2002. Group Processes represented approximately$ 52 million and $ 105 million of this loss in 2003 and 2002,respectively. The improvement in Group Processes was dueto the non-recurrence of costs for software write-downs in2002 and reduced general and administrative expenses as aresult of the ongoing dissolution of the Group Processesbusiness area.
Year ended December 31, 2002 compared with yearended December 31, 2001Orders decreased by $ 583 million, or 14 percent, to $ 3,477 million in 2002 compared to $ 4,060 million in 2001.As reported in local currencies, orders decreased by 20percent in 2002 compared to 2001. The reduction in orderswas primarily due to the sale of our Air Handling business,decreased orders in our Building Systems business arearesulting from market downturns across Europe and theplanned reduction of our presence in some of the markets ofthe Logistic Systems and Customer Service Workshopbusiness areas. Orders from other divisions amounted to $ 871 million in 2002 (representing 25 percent of the division orders in 2002) and $ 870 million in 2001(representing 21 percent of the division orders in 2001).
Revenues decreased by $ 672 million, or 16 percent, to $ 3,447 million in 2002 compared to $ 4,119 million in 2001. As reported in local currencies, revenues decreased 22 percent in 2002 compared to 2001. Revenues from otherdivisions amounted to $ 875 million in 2002 (representing 25 percent of the division revenues in 2002) and $ 821million in 2001 (representing 20 percent of the divisionrevenues in 2001).
The major components of the Non-core activities revenues iscomprised of the following:
Building Systems revenues decreased by $ 238 million, or 9 percent, to $ 2,375 million in 2002 compared to $ 2,613million in 2001 due to market downturns across Europe,particularly Germany and selective order taking. As reportedin local currencies, revenues decreased by 14 percent in2002 compared to 2001. Other Non-core activities includedGroup Processes revenues that increased by $ 20 million, or3 percent, to $ 758 million in 2002 from $ 738 million in2001. As reported in local currencies, revenues decreasedby 3 percent in 2002 compared to 2001. Of the remainingbusinesses within Other Non-core activities, revenuesdecreased by $ 361 million, or 67 percent, to $ 179 million in2002 from $ 540 million in 2001, mainly due to the sale ofthe Air Handling business.

30 ABB Group Financial review 2003
Earnings before interest and taxes, or operating loss,increased by $ 68 million to $ 181 million in 2002 comparedto $ 113 million in 2001. As reported in local currencies,operating loss increased by 65 percent in 2002 compared to2001. The reasons for the increase in operating loss areoutlined below.
Equity Ventures operating income decreased by $ 32 millionto $ 43 million in 2002 compared to $ 75 million in 2001. Asreported in local currencies, operating income decreased by 44 percent in 2002 compared to 2001. The decrease wasthe result of reduced returns from investments and theeffects of closing down development and office activities.
Structured Finance operating income increased by $ 95 million to $ 96 million in 2002 compared to $ 1 million in2001. The increase primarily resulted from our 35 percentstake in Swedish Export Credit Corporation in Sweden,which in 2002 reported income from equity accountedcompanies of $ 125 million in 2002 compared to a loss of $ 16 million in 2001.
Building Systems operating income decreased by $ 131 million to a loss of $ 113 million in 2002 compared toan income of $ 18 million in 2001. The decrease was due to:project write-downs in Germany, Sweden, United Kingdomand Denmark; closure costs in Italy and Poland; andrestructuring costs in Germany.
New Ventures operating loss decreased by $ 106 million to $ 37 million in 2002 compared to $ 143 million in 2001. Asreported in local currencies, operating loss decreased by 74 percent in 2002 compared to 2001. The decrease wasdue to the non-recurrence of costs and provisions foralternative energy projects and asset write-downs in 2001.
Other Non-core activities operating loss increased by $ 106million to $ 170 million in 2002 compared to $ 64 million in 2001. Group Processes represented approximately $ 105 million and $ 54 million of the losses in 2002 and2001, respectively. The increase in Group Processes wasmainly due to the write-down of software and increasedgeneral and administrative expenses.
CorporateOur corporate/other activities comprise headquarters andstewardship, research and development and other activities.
Year ended December 31, 2003 compared with yearended December 31, 2002Total operating costs increased by $ 76 million, or 18percent, to $ 499 million in 2003 compared to $ 423 millionin 2002. In local currencies, operating costs increased 5 percent in 2003 compared to 2002.
Headquarters and stewardship operating costs increased by $ 153 million, or 81 percent, to $ 342 million in 2003compared to $ 189 million in 2002. In local currencies,operating costs were 87 percent higher in 2003 comparedto 2002. The increase in operating costs was mainly due tothe non-recurrence of one-time events in 2002 such as therecovery of payments from a former chief executive officer.
Corporate research and development costs were $ 92 million in 2003 compared to $ 93 million in 2002. Inlocal currencies, operating costs improved by 14 percent in 2003 compared to 2002. The improvement in operatingcosts was mainly due to a continuous attention to reducingunnecessery costs and a strong focus on the reduction of administrative overhead.
Other operating costs (including Real Estate, Group TreasuryOperations and consolidation) decreased by $ 76 million, or 54 percent, to $ 65 million in 2003 compared to $ 141million in 2002, mainly due to lower costs following thecessation of proprietary trading and the consequentreduction in number of employees in Group Treasury Operations in 2002 and a reduction in earnings from certainintra-Group transactions when compared to 2002. In local currencies, operating costs improved by 83 percent in 2003 compared to 2002.
Year ended December 31, 2002 compared with yearended December 31, 2001Total operating costs increased by $ 134 million, or 46percent, to $ 423 million in 2002 compared to $ 289 millionin 2001. As reported in local currencies, operating costsincreased by 91 percent in 2002 compared to 2001.
Headquarters and stewardship operating costs decreased by $ 5 million, or 3 percent, to $ 189 million in 2002compared to $ 194 million in 2001.
Corporate research and development costs decreased by $ 10 million, or 10 percent, to $ 93 million in 2002 comparedto $ 103 million in 2001 as a result of the reorganization in our global research and development centers and therelated headcount reductions. As reported in localcurrencies, research and development costs decreased 13percent in 2002 compared to 2001.
Other operating costs (including Group Treasury Operations,Real Estate and consolidation) increased by $ 149 million to$ 141 million in 2002 compared to an income of $ 8 millionin 2001, mainly due to a reduction in rental income as a result of asset sales, increased lease obligations in RealEstate, the reduced trading result of Group Treasury Operations following the cessation of proprietary trading in2002 and a higher elimination of earnings from certain intra-Group transactions when compared to 2001.

ABB Group Financial review 2003 31
■ A number of other businesses sold in 2003 and those we are planning to sell in 2004 including: Austevoll andØlen, operations of Marine Austevoll, a marine switchgearbusiness in Norway, that were sold to ScandinavianElectric Austevoll AS and Vassnes Elektro AS,respectively, both in Norway; our Repair Workshopbusiness in Portugal which we intend to sell; and ourRetail software business in the United States that we have agreed to sell to PIM-Newco Incorporated.
In 2002, the other divested businesses included: TheComponents business of ABB Trasmissione eDistribuzione S.p.A (Italy), which was sold to EB RebosioS.r.l.; Energy Information Systems Ltd of the UnitedKingdom, which was sold to Alstom SA; and the ABBDrying Business (a division of ABB Inc. comprising anumber of legal entities), which was sold to Andritz ABand Andritz Ltd.
■ Various businesses that were abandoned in 2003 and2002 for strategic reasons or for which a buyer could notbe found.
■ Legal and professional fees related to the abovedisposals.
Loss from discontinued operations, net of tax, was $ 853million, $ 858 million and $ 837 million in 2003, 2002 and2001, respectively. The loss from discontinued operations,net of tax, for the above items is detailed below.
Discontinued operations 2003 2002 2001
Year ended December 31, ($ in millions)
Oil, Gas and Petrochemicals (496) (127) 9Combustion Engineering (Asbestos) (145) (420) (470)Reinsurance (97) 22 (336)Wind Energy (42) (1) –Structured Finance (29) (183) 8MDCV Cables (24) (1) (5)ABB Export Bank (9) 10 6Metering (3) (54) 14Other abandoned or sold businesses/Other (8) (104) (63)Loss from discontinuedoperations, net of tax (853) (858) (837)
The above includes the businesses’ operational results,accumulated foreign currency translation adjustments,allocation of interest in accordance with EITF 87-24, capitalgains and losses on sale, impairment charges, goodwillwrite-offs and other costs.
Discontinued operationsLoss from discontinued operations, net of tax, in ourConsolidated Income Statement includes the followingitems:
■ All of our Oil, Gas and Petrochemicals businesses, ofwhich we agreed to sell our upstream businesses to aconsortium consisting of Candover Partners, JP MorganPartners and 3i Group in January 2004. The Upstreambusiness is a global producer of equipment and servicesfor oil and gas exploration and production. The remainingpart of the Oil, Gas and Petrochemicals businessesprimarily consists of a full service engineering companywhich in addition to having expertise in EPC projects alsolicenses process technologies in the refining, chemical,petrochemical and polymer fields.
■ Costs related to the potential asbestos obligation of our U.S. subsidiary, Combustion Engineering Inc. The status of our potential asbestos obligation is contained in“Contingencies and retained liabilities” below, as well as inNote 18 to the Consolidated Financial Statements.
■ Our Reinsurance business, which we agreed in December2003 to sell to White Mountains Insurance Group Limited,a Bermuda-based insurance holding company. Thecompletion of this sale is subject to regulatory approvalsand other customary closing conditions and is expectedto take place in the second quarter of 2004.
■ Our Wind Energy business in Germany, of which we sold a portion to GI Ventures AG of Munich, Germany, in December 2003. This business focused on thedevelopment and engineering, procurement andconstruction of wind parks in Europe.
■ Most of our Structured Finance business, which we soldto General Electric Capital Corporation (GE) in November2002. This business provided debt capital for projects andequipment, and asset-based financing (such as leasing).
■ Our MDVC Cable business located in Germany, which weagreed in December 2003 to sell to Wilms Group ofMenden, Germany (this sale was completed in January2004). This business manufactures medium-voltagecables for the domestic German market.
■ ABB Export Bank, which we sold to a financial investor inDecember 2003 as a continuation of the divestment ofour Structured Finance business. ABB Export Bankarranged international export, trade and project financing.
■ Our Metering business, which we sold to RuhrgasIndustries GmbH of Essen, Germany, in December 2002.This business produced electricity, water, energy and gasmeters, metering systems and load control systems.

32 ABB Group Financial review 2003
We expect to continue to identify non-core businesses fordisposal. If a business meets the criteria of SFAS 144, wewill reflect the results of operations from the business asdiscontinued operations in our Consolidated IncomeStatement and as assets and liabilities held for sale and indiscontinued operations in our Consolidated Balance Sheet.We will reclassify the prior years’ presentation to reflect thedisposals on a comparable basis.
Oil, Gas and PetrochemicalsCapital expenditures by customers of the Oil, Gas andPetrochemicals businesses are influenced by oil companyexpectations about the oil price, which is determined bysupply and demand for crude oil and natural gas products,the energy price environment that results from supply anddemand imbalances and consolidation of the oil and gasmarkets. Key factors that may influence the worldwide oiland gas market include production restraint of OPEC nationsand other oil-producing countries, global economic growth,technological progress in oil exploration and production andthe maturity of the resource base. The downstream marketsare in the short term influenced by capacity utilization and in the longer term by factors such as economic growth,substitution of products and demand for moreenvironmentally friendly products.
While there are signals of an improving outlook for 2004 asthe global economy stabilizes, spending for upstream anddownstream projects remained modest throughout 2003.The oil price remained within the OPEC target band of $ 22 to $ 28 per barrel during most of 2003 and movedtowards the high end of this band towards the end of 2003due to recovery in underlying consumption, reflecting thefaster pace of global economic recovery. Investment growthin exploration and production in the upstream market (from the well or bore hole to the refinery) was soft andpredominantly outside North America. Competition in thedownstream markets remained intense throughout 2003.Refining expenditures continued to be driven by clean fuelregulations, with some increase in demand in Asia as thoseeconomies continue to grow. The petrochemical cycle isemerging from an extended downturn during which therewas lower investment in new capacity. The increased use ofplastics and textiles, particularly in growing economies, isresulting in increased investment in both low material costregions such as the Middle East and in major petrochemicalconsuming markets such as India and China.
In January 2004, we announced the sale of our upstreambusinesses to a consortium consisting of Candover Partners,JP Morgan Partners and 3i Group. For further information onthe sale of our upstream businesses, see “Operating andfinancial review and prospects – Acquisitions, investmentsand divestitures – Pending divestitures.”
The remaining OGP businesses are available for immediatesale and continue to be actively marketed. It is unlikely thatsignificant change to the divestment strategy will be made orthat the plan to divest the remaining OGP businesses will bewithdrawn in the future. Management anticipates divestingthis business in 2004.
In 2002, we initiated a strategic shift to narrower-scope,lower risk projects based on a more selective biddingprocess in the downstream oil and gas business (typicallyfrom the refinery to industrial manufacturers or distributors)and a shift from fixed price contracts towards lower-riskreimbursable contracts, which allow a more balancedsharing of risks and opportunities between customer andcontractor. To prepare the remaining OGP businesses fordisposal, we streamlined the management structure of thebusinesses and in October 2003, announced that the chieffinancial officer, would have direct management responsibilityfor our entire Oil, Gas and Petrochemicals businesses untilthey are divested.
Year ended December 31, 2003 compared with yearended December 31, 2002Orders decreased by $ 942 million, or 26 percent, to $ 2,683 million in 2003 compared to $ 3,625 million in 2002.As reported in local currencies, orders decreased by 31 percent in 2003. Orders in 2003 included $ 20 millionreceived from our other divisions, compared to $ 23 million in2002. The overall decrease is primarily due to a 40 percentdecrease in large orders, mainly attributable to our strategicdecision to de-emphasize fixed priced EPC contracts infavour of lower-risk reimbursable contracts, to limitconstruction in the scope of work in our downstreambusiness and to more selectively tender for project work. Inaddition, both upstream and downstream experienced adecline in orders due to an overall relatively soft market.
Revenues decreased by $ 467 million, or 12 percent, to $ 3,402 million in 2003 compared to $ 3,869 million in 2002.As reported in local currencies, revenues decreased by 17percent. In 2003, revenues included $ 28 million of sales toour other divisions, compared to $ 15 million in 2002. Theupstream business recorded revenues of approximately $ 1,524 million and $ 1,538 million in 2003 and 2002,respectively. The remaining OGP businesses recordedrevenues of approximately $ 1,878 million and $ 2,331million in 2003 and 2002, respectively. The overall decreasein revenues was the result of a lower backlog going into2003 and a relatively low order intake in 2003, reflecting theshift in our market strategy pertaining to fixed priced EPCcontracts in the downstream business.

ABB Group Financial review 2003 33
approximately $ 1,538 million and $ 1,470 million in 2002 and2001, respectively. The remaining OGP businesses recordedrevenues of approximately $ 2,331 million and $ 2,019million in 2002 and 2001, respectively. The overall increasescame from improvements in the upstream and downstreambusinesses, reflecting a high order backlog going into 2002and a relatively high level of order intake in 2002.
We recorded a net loss of $ 127 million in 2002 compared tonet income of $ 9 million in 2001 that represents a decreaseof $ 136 million. The upstream business recorded netincome of approximately $ 98 million and $ 93 million in2002 and 2001, respectively. The increase in net income of $ 5 million was attributable to the increase in revenues forthe same period. The remaining OGP businesses had netlosses of $ 225 million and $ 84 million in 2002 and 2001,respectively. The remaining OGP businesses were adverselyaffected by cost overruns and project delays, which resultedin a charge of $ 224 million in 2002, primarily in four, long-term, large downstream fixed price projects booked prior tothe implementation of current bidding strategy for suchcontracts. The loss was partially offset by an increase inrevenues for the same period.
AsbestosLoss from discontinued operations, net of tax, also includescosts related to the potential asbestos obligation of our U.S. subsidiary, Combustion Engineering Inc., of approximately $ 145 million, $ 420 million and $ 470 millionin 2003, 2002 and 2001, respectively.
An overview on Asbestos is given separately in theContingencies & Retained Liabilities section of this report.
Reinsurance businessIn December 2003, we agreed to sell our Reinsurancebusiness to White Mountains Insurance Group Limited ofBermuda for approximately $ 425 million.
Our Reinsurance business provides international reinsuranceand insurance underwriting and specialized primaryinsurance in the United States. In reinsurance, the reinsurer,in return for a premium payment, provides coverage to aprimary insurance company for all or a specific portion of theprimary insurer’s obligation to its customer.
Year ended December 31, 2003 compared with yearended December 31, 2002Revenues increased by $ 145 million, or 22 percent, to $ 816 million in 2003 compared to $ 671 million in 2002.Included in revenues are revenues from other business areas of $ 34 million and $ 27 million in 2003 and 2002,respectively. The increase in revenues was primarily due tohigher premium income from increased volumes and higherinsurance premium rates compared to the rates for comparable products and risks in 2002.
The net loss increased by $ 369 million to $ 496 million in2003 compared to $ 127 million in 2002. The upstreambusiness recorded net income of approximately $ 4 millionand $ 98 million in 2003 and 2002, respectively. Thedecrease in net income of $ 94 million was attributable tocosts associated with the future sale of the upstreambusiness of approximately $ 44 million and $ 13 million ofallocated interest expense in accordance with EITF 87-24.The remaining OGP businesses had net losses of $ 500million and $ 225 million in 2003 and 2002, respectively. Theremaining OGP businesses were adversely affected bycharges of $ 399 million, primarily in four large, long-term,downstream fixed price projects booked prior to theimplementation of our current bidding strategy for suchcontracts. The customers and the countries in which theproject execution took place were in each case unrelated.These charges are related to delays, project cost overrunsand write-down of assets that we, for various reasons,consider no longer to be recoverable. Fixed priced EPCcontracts are inherently risky and we have experienced lossesfrom such contracts due to, among other things, our inabilityto make proper estimates during the tendering process andweaknesses in project execution. In any event, we maycontinue to experience losses on the contracts we enteredinto prior to adopting our new approach until they expire orare terminated, but the number of such contracts and theremaining risks, both inherent and specific, associated withthem has been significantly reduced as a result of themeasures we have taken to address these problems. Wealso recorded a valuation allowance on deferred tax assetsof approximately $ 120 million related to the remaining OGPbusinesses as we determined it was more likely than not thatsuch deferred tax assets would not be realized.
Year ended December 31, 2002 compared with yearended December 31, 2001Orders increased by $ 222 million, or 7 percent, to $ 3,625million in 2002 compared to $ 3,403 million in 2001. Asreported in local currencies, orders increased by 3 percent in2002. Orders in 2002 included $ 23 million received from our other divisions, compared to $ 15 million in 2001. A 22percent increase in large orders was attributable to theaward of the ExxonMobil Sakhalin order within ourdownstream business, offset by a reduction resulting from ashift in strategy from fixed price contracts towards lower-riskreimbursable contracts. The increase in the downstreambusiness offset a general reduction in the upstreambusiness.
Revenues increased by $ 380 million, or 11 percent, to $ 3,869 million in 2002 compared to $ 3,489 million in 2001.As reported in local currencies, revenues increased by 7 percent in 2002. In 2002, revenues included $ 15 millionof sales to our other divisions, compared to $ 11 million in2001. The upstream business recorded revenues of

34 ABB Group Financial review 2003
We recorded a net loss of $ 97 million in 2003 compared tonet income of $ 22 million in 2002 that represents adecrease of $ 119 million. The decrease was the result of a $ 154 million impairment charge and an allocation of interestof $ 15 million in accordance with EITF 87-24 being partiallyoffset from income from operations of approximately $ 72 million due to higher technical insurance results andimproved investment income in the major operating units.The impairment charge recorded from the anticipateddisposal of the Reinsurance business of $ 154 million wasprincipally comprised of an asset write-down of $ 48 million,goodwill and other intangible write-offs of $ 89 million,expected selling costs of $ 25 million, deferred tax write-offsof approximately $ 16 million and an accumulated foreigncurrency translation gain of $ 24 million.
Year ended December 31, 2002 compared with yearended December 31, 2001Reinsurance revenues decreased by $ 267 million, or 28percent, to $ 671 million in 2002 compared to $ 938 millionin 2001. Included in revenues are revenues from otherbusiness areas of $ 27 million and $ 5 million in 2002 and2001, respectively. The decrease in revenues was primarilydue to the cessation of new reinsurance activity inScandinavian Reinsurance Company Limited, Bermuda.
We recorded net income of $ 22 million in 2002 comparedto a net loss of $ 336 million in 2001 that represents anincrease of $ 358 million. The increase was the result of thenon-recurrence of a number of costs from 2001. Prior to2001, we presented a portion of our insurance reserves on adiscounted basis, which estimated the present value offunds required to pay losses at future dates. During 2001,the timing and amount of claims payments being ceded tous in respect of prior years’ finite risk reinsurance contractschanged and could not be reliably determined at December31, 2001. Therefore, we were no longer able to continue to discount our loss reserves and were required to record acharge to losses and loss adjustment expenses in 2001 of $ 295 million. In addition, the Reinsurance business areaalso recorded provisions for $ 138 million in underwritinglosses, including provisions totalling $ 48 million relating to the events of September 11, 2001, leading to thesignificantly negative insurance results. The benefit of thenon-recurrence of these costs was partially offset by lowerrevenues.
Wind EnergyOur Wind Energy business in Germany was primarilyfocused on the development of Wind Parks mainly inEurope. In December 2003, we sold part of our Wind Energybusiness in Germany to GI Ventures AG of Munich,Germany, with the remaining portion set to be sold in 2004.
Year ended December 31, 2003 compared with yearended December 31, 2002Revenues decreased by $ 32 million, or 67 percent, to $ 16 million in 2003 compared to $ 48 million in 2002. Thedecrease in revenues was primarily due to a large orderprogressing through the execution phase with no othersignificant replacement orders.
The net loss increased by $ 41 million to $ 42 million in 2003from $ 1 million in 2002. The 2003 net loss of $ 42 millionwas comprised principally of a $ 25 million loss from disposal(net of a tax benefit of $ 10 million), asset write-downs of $ 9 million and loss from operations of $ 8 million.
This unit did not exist in this form in 2001 and therefore nocomparison between 2002 and 2001 is provided.
Structured FinanceIn November 2002, we completed the sale of most of ourStructured Finance business to GE.
Period from January 1 to November 30, 2002 comparedwith year ended December 31, 2001Revenues increased by $ 42 million, or 19 percent, to $ 262 million in 2002 from $ 220 million in 2001. Therevenue increase reflects the acquisition of a portfolio ofsmall, mainly standardized leases as well as growth in the businesses existing portfolio of such small leases.
We recorded a net loss of $ 183 million in 2002 compared tonet income of $ 8 million in 2001 that represents a decreaseof $ 191 million. The 2002 net loss of $ 183 million includeda $ 146 million loss on disposal, loss from operations of $ 22 million and the allocation of interest expense of $ 15million in accordance with EITF 87-24. The loss on disposalof $ 146 million for the sold business was principallycomprised of an asset write-down of $ 15 million, goodwilland other intangible write-offs of $ 2 million, transactioncosts of $ 27 million, the fair value for GE’s right to requirethe Company to repurchase certain designated assets of $ 38 million, capital tax expense associated with the disposalof $ 10 million and an accumulated foreign currencytranslation loss of $ 54 million. The lower operating income ingeneral reflected the change in strategy to refrain from newlease and financing transactions, leading to a correspondingreduction in business activity during 2002.

ABB Group Financial review 2003 35
We recorded a net loss of $ 9 million in 2003 compared tonet income of $ 10 million in 2002 that represents adecrease of $ 19 million. The 2003 net loss of $ 9 millionincludes a $ 12 million loss on disposal, income fromoperations of $ 6 million and the allocation of interest expenseof $ 3 million in accordance with EITF 87-24. The loss ondisposal of $ 12 million for the sold business was principallycomprised of an asset write-down of $ 20 million, transactioncosts of $ 1 million, capital tax expense associated with thedisposal of $ 4 million and an accumulated foreign currencytranslation gain of approximately $ 13 million.
Year ended December 31, 2002 compared with yearended December 31, 2001Revenues decreased by $ 10 million, or 27 percent, to $ 27 million in 2002 compared to $ 37 million in 2001 due tolower business volumes, the sale of assets following ourdecision to divest the business and lower interest rates.Included in revenues are revenues from other business areasof $ 10 million and $ 8 million in 2002 and 2001, respectively.
Net income increased by $ 4 million, or 67 percent to $ 10 million in 2002 compared to $ 6 million in 2002.
MeteringIn December 2002, we sold our Metering business toRuhrgas Industries GmbH of Germany. This businessproduced electricity, water, energy and gas meters, meteringsystems and load control systems.
Period from January 1 to December 4, 2002 comparedwith year ended December 31, 2001Revenues decreased by $ 76 million, or 17 percent, to $ 372 million in 2002 compared to $ 448 million in 2001. The2002 figure is for eleven months trading as the business was sold to Ruhrgas Industries GmbH at the beginning ofDecember 2002. The 2002 annualized revenues decreasedas a result of the weak market conditions in North America,Latin America and Germany.
We recorded a net loss of $ 54 million in 2002 compared tonet income of $ 14 million in 2001 that represents adecrease of $ 68 million. The 2002 net loss of $ 54 millionincluded a $ 48 million loss on disposal, loss from operationsof $ 3 million and the allocation of interest expense of $ 3 million in accordance with EITF 87-24. The loss ondisposal of $ 48 million for the sold business was principallycomprised of goodwill and other intangible write-offs of $ 65 million, transaction costs and other provisioning of $ 46 million, capital tax expense associated with the disposalof $ 21 million and an accumulated currency translation loss of $ 35 million offset in part by a gain of $ 119 million,being the difference between the proceeds received and net assets of the business.
MDCV Cable businessIn December 2003, we agreed to sell our MDCV cablebusiness, located in Germany, to the Wilms Group ofMenden, Germany. This business manufactures medium andhigh-voltage cables, cable-systems and accessories forpower suppliers and network operators.
Year ended December 31, 2003 compared with yearended December 31, 2002Revenues decreased by $ 3 million, or 4 percent, to $ 79 million in 2003 compared to $ 82 million in 2002 mainlydue to the loss of important projects. Included in revenuesare revenues from other business areas of $ 5 million and $ 4 million in 2003 and 2002, respectively.
The net loss increased by $ 23 million to $ 24 million in 2003compared to $ 1 million in 2002. The 2003 net loss of $ 24 million was comprised principally of asset write-downsof $ 10 million and a loss from operations of $ 14 million.
Year ended December 31, 2002 compared with yearended December 31, 2001Revenues increased by $ 20 million, or 32 percent, to $ 82million in 2002 compared to $ 62 million in 2001 primarilydue to extension of the product mix. Included in revenuesare revenues from other business areas of $ 4 million and $ 2 million in 2002 and 2001, respectively.
The net loss decreased by $ 4 million, or 80 percent to $ 1 million in 2001 compared to $ 5 million in 2001, reflectinga more favorable product mix.
ABB Export BankIn December 2003 we completed the sale of ABB ExportBank to an investor in Sweden. ABB Export Bank was partof our Structured Finance business area and arrangedexport, trade and project financing. Backed by nationalexport credit agencies or bilateral and multilateral institutionssuch as the World Bank, ABB Export Bank lent money toour customers in various countries, in all currenciesaccepted by the agency involved.
Period from January 1 to December 16, 2003 comparedwith year ended December 31, 2002Revenues decreased by $ 15 million, or 56 percent, to $ 12 million in 2003 compared to $ 27 million in 2002 due tolower business volumes, the sale of assets following ourdecision to divest the business and lower interest rates.Included in revenues are revenues from other business areasof $ 3 million and $ 10 million in 2003 and 2002, respectively.

36 ABB Group Financial review 2003
Liquidity and capital resources
Principal sources of fundingIn 2003, as in 2002 and 2001, we met our liquidity needsusing cash from operations, bank borrowings, the proceedsfrom the issuance of debt securities, divestment proceeds,as well as the sales of receivables under our securitizationprograms. The reductions in our credit rating during 2002,described below, restricted our access to the capitalmarkets during 2002 and the first half of 2003. As a result,we relied increasingly on proceeds from divestments, bankborrowings, cash from operations and, additionally in 2003from our capital strengthening program described below.Also, in the first quarter of 2003, we raised approximately $ 156 million from the sale of 80 million treasury shares intwo transactions.
During the second half of 2003, we completed a number of steps to strengthen our Consolidated Balance Sheet andto improve our liquidity. In September 2003, we issuedconvertible unsubordinated bonds of an aggregate principalamount of 1,000 million Swiss francs, due 2010. See“Convertible bonds and notes.” In October 2003, weannounced a three-component capital strengtheningprogram, consisting of a rights issue providing net proceedsof approximately $ 2.5 billion, a new $ 1 billion unsecuredrevolving credit facility to replace our $ 1.5 billion creditfacility and a bond offering of 650 million euro (equivalent toapproximately $ 769 million, at the date of issuance). Thisprogram has provided a stronger financial base for the future growth of our core operations, has deleveraged ourbalance sheet by reducing our gearing from 86 percent at December 31, 2002 to 70 percent at December 31, 2003(see “Financial Position” below) and has given us more flexibility, particularly with regard to the timing of ourdivestment program.
We believe that our ability to obtain funding from the sourcesdescribed above will continue to provide the cash flowsnecessary to satisfy our working capital requirements andcapital expenditure requirements, as well as meet our debtrepayments and other financial commitments for the next 12 months. Due to the nature of our operations, our cashflow from operations generally tends to be weaker in the firsthalf of the year than in the second half of the year.
Rights issueOn November 20, 2003, our shareholders approved theissuance of 840,006,602 new shares pursuant to a fullyunderwritten rights issue. For each share that they owned,holders of existing shares were allocated one right topurchase the offered shares. For every 10 rights, holders ofexisting shares were entitled to purchase seven offeredshares. The banks agreed to underwrite 840,006,602 sharesat an issue price of 4.00 Swiss francs per share representing
an approximate 50% discount on the share price at the timeand providing for net proceeds of $ 2,487 million. The rightsissue was completed on December 12, 2003 when the cash was received together with the net proceeds of the bonds of 650 million euro aggregate principal amount (see “Convertible bonds and notes”). Of these funds,approximately $ 1.2 billion was used to repay debt maturingin December 2003 and repurchase bonds with a face valueof $ 94 million, while the remainder was placed on depositwith banks to be used to repay debt maturing in 2004.
Interest ratesWe have obtained financing in a range of currencies andmaturities and on various interest rate terms. We usederivatives to reduce the interest rate and/or foreignexchange exposures arising on our debt. For example, toreduce our exposure to interest rates, we use interest rateswaps to effectively convert fixed rate borrowings intofloating rate liabilities and we use cross currency swaps toeffectively convert foreign currency denominated bonds intoU.S. dollar liabilities. At December 31, 2003, after consideringthe effects of interest rate swaps, the effective averageinterest rate on our floating rate long-term borrowings(including current maturities) of $ 4,241 million and our fixedrate long-term borrowings (including current maturities) of $ 1,754 million was 3.2 percent and 5.8 percent, respectively. This compares with an effective rate of 3.0percent for floating rate long-term borrowings and 5.0percent for fixed-rate long-term borrowings as of December31, 2002. A discussion of our use of derivatives to modifythe characteristics of our long-term borrowings is containedin Note 15 to our Consolidated Financial Statements.
Convertible bonds and notesIn 2003, we completed two note issuances, including theissuance of bonds convertible into our shares, as sources offunding.
In September 2003, we issued 1,000 million Swiss francsaggregate principal amount of convertible unsubordinatedbonds due 2010 (approximately $ 722 million at the date ofissuance). This transaction lengthened the maturity profile ofour debt, thereby reducing our dependence on short-termfunding. We used the proceeds, net of expenses and fees,to reduce our drawing under our $ 1.5 billion credit facility(see “Credit facilities”). The convertible bonds pay interestannually in arrears at a fixed annual rate of 3.5 percent. Onissuance, each 5,000 Swiss francs principal amount ofbonds was convertible into 418.41004 fully paid ABBordinary shares at an initial conversion price of 11.95 Swissfrancs. The conversion price is subject to adjustmentprovisions to protect against dilution or change in control. As a result of the rights issue discussed above, theconversion price and conversion ratio of the bonds were

ABB Group Financial review 2003 37
in aggregate principal amount of bonds originally issuedhave been exchanged, redeemed or purchased andcancelled. We have the option to redeem the bonds whendue, in cash, ordinary shares or any combination thereof.
Also in May 2002, we issued 200 million pounds sterling(approximately $ 292 million) aggregate principal amount ofbonds due 2009 (sterling-denominated bonds), which payinterest semi-annually in arrears at 10 percent per annum.We also issued in May 2002, 500 million euro (approximately $ 466 million) aggregate principal amount of bonds, due2008 (euro-denominated bonds), which pay interest annuallyin arrears at 9.5 percent per annum.
The sterling-denominated bonds and the euro-denominatedbonds contain certain clauses linking the interest paid on the bonds to the credit rating assigned to the bonds. If therating assigned to these bonds by both Moody’s andStandard & Poor’s remains at or above Baa3 and BBB–,respectively, then the interest rate on the bonds remains atthe level at issuance, that is 10 percent and 9.5 percent, forthe sterling-denominated and euro-denominated bonds,respectively. If the rating assigned by either Moody’s orStandard & Poor’s decreases below Baa3 or BBB–, respectively, then the annual interest rate on the bondsincreases by 1.5 percent per annum to 11.5 percent and 11percent, for the sterling-denominated and euro-denominatedbonds, respectively. If after such a rating decrease, the ratingassigned by both Moody’s and Standard & Poor’s returns to a level at or above Baa3 and BBB–, respectively, then theinterest rates on the bonds return to their original levels. As a result of the downgrade of our long-term credit rating byMoody’s to Ba2 on October 31, 2002, this step-up clause in interest was triggered on both bonds. The increase ininterest costs is effective for interest periods beginning afterthe payment of the coupon accruing at the date of thedowngrade. This increase in interest rates had no significantimpact on 2002 interest expense. The total impact on 2003was an increase in interest expense of approximately $ 13million and future years will be affected if our credit ratings donot return to at least both Baa3 and BBB– from Moody’sand Standard & Poor’s, respectively.
A cross-currency swap has been used to modify thecharacteristics of the sterling-denominated bonds and aninterest rate swap to modify the euro-denominated bonds.After considering the impact of the cross-currency andinterest rate swaps, the sterling-denominated bondseffectively became a floating rate U.S. dollar obligation, whilethe euro-denominated bonds became a floating rate euroobligation. In both cases, the floating rate resets every threemonths. See Note 15 to our Consolidated FinancialStatements.
adjusted to 9.53 Swiss francs and 524.65897 shares,respectively. Consequently, the bonds are now convertibleinto 104,931,794 fully paid ordinary ABB shares.
The bonds are convertible at the option of the bondholder atany time from October 21, 2003 up to and including thetenth business day prior to September 10, 2010. We may atany time on or after September 10, 2007 redeem theoutstanding bonds at par plus accrued interest if, for acertain number of days during a specified period of time, theofficial closing price of our ordinary shares on the relevantexchange has been at least 150 percent of the conversionprice. In addition, at any time prior to maturity, we canredeem the outstanding bonds at par plus accrued interest,if at least 85 percent in aggregate of the principal amount ofbonds originally issued have been redeemed, converted orpurchased and cancelled. We have the option to redeem thebonds when due in cash, ordinary shares or any combi-nation thereof.
In November 2003, as part of our three-component capitalstrengthening program, we issued bonds of an aggregateprincipal amount of 650 million euro (approximately $ 769 million at the time of issuance), due 2011. Thesebonds pay interest semi-annually in arrears at a fixed annualrate of 6.5 percent. In the event of a change of control ofABB Ltd, the terms of the bonds require us to offer to repurchase the bonds at 101 percent of the principal amountthereof, plus any accrued interest. The net proceeds fromthe issue of these bonds were placed in escrow and werereleased to us upon successful completion of the rightsissue in December 2003.
In May 2002, we issued $ 968 million aggregate principalamount of convertible unsubordinated bonds due 2007. Thebonds pay interest semi-annually in arrears at a fixed annualrate of 4.625 percent. On issuance each $ 1,000 principalamount of bonds was convertible into 87.7489 fully paidABB ordinary shares at an initial conversion price of 18.48 Swiss francs (converted into U.S. dollars at a fixedconversion rate of 1.6216 Swiss francs per U.S. dollar). Theconversion price is subject to adjustment provisions toprotect against dilution or change in control. As a result ofthe rights issue discussed above, the conversion price of thebonds was adjusted to 14.64 Swiss francs (converted intoU.S. dollars at the fixed exchange rate of 1.6216 Swissfrancs per U.S. dollar), representing a total of 107,220,546shares if the bonds were fully converted.
The bonds are convertible at the option of the bondholder atany time from June 26, 2002 up to and including May 2,2007. We may, at any time on or after May 16, 2005,redeem the outstanding bonds at par plus accrued interest if(1) for a certain number of days during a specified period oftime, the official closing price of our shares on virt-x exceeds130 percent of the conversion price or (2) at least 85 percent

38 ABB Group Financial review 2003
Almost all of our publicly traded bonds contain cross-defaultclauses which would allow the bondholders to demandrepayment if we were to default on certain borrowings at orabove a specified threshold amount.
Credit facilitiesOn November 17, 2003, as part of our three-componentcapital strengthening program, we entered into a newunsecured syndicated $ 1 billion three-year revolving creditfacility (new credit facility) which became available inDecember 2003 after the fulfillment of certain conditionsincluding the repayment and cancellation of the existing $ 1.5 billion facility and the raising of specified minimumlevels of gross proceeds from the rights issue (see “Rightsissue”) and from the bonds denominated in euros whichwere issued in November 2003 (see “Convertible bonds andnotes”). This new credit facility is for general corporatepurposes. At December 31, 2003 and February 29, 2004,nothing was outstanding under the new facility and althoughwe currently do not intend to draw on it, it provides us withadditional financial flexibility.
The new credit facility contains certain financial covenants inrespect of minimum interest coverage, maximum netleverage and a minimum level of consolidated net worth. Weare required to meet these covenants on a quarterly basisbeginning with the period ending December 31, 2003.Should our unsecured long-term debt ratings reach certaindefined levels (basically investment grade), these covenantswill only have to be calculated as of June and December ofeach year. The new facility also contains provisions for themandatory prepayment and cancellation of the facility upon achange of control of ABB Ltd.
The new credit facility imposes restrictions on the amount ofthird party indebtedness in subsidiaries other than in theobligors under the facility, subject to certain exceptions. Thefacility also contains certain other undertakings includingcertain limitations on disposals of assets, certain restrictionson mergers and acquisitions, negative pledges andrestrictions on the early redemption of capital marketinstruments, such as bonds having a maturity date beyondthat of the facility. However, the facility permits thelengthening of the maturity profile of our debt through the early redemption of any bonds or other capital marketinstruments out of the net cash proceeds of any capitalmarket instrument issued after November 17, 2003 andhaving a maturity date not earlier than the capital marketinstruments being repaid.
The new credit facility contains cross-default clauseswhereby an event of default would occur if we were todefault on indebtedness, as defined in the facility, at or abovea specified threshold. As long as there is no drawing underthe facility, a failure to comply with the financial covenantsand other obligations in the facility will not cause a crossdefault to other indebtedness.
The new credit facility replaced a secured $ 1.5 billion 364-day revolving credit facility entered into in December 2002.The $ 1.5 billion facility was secured by a package of assetswith a net carrying value of $ 3.5 billion at December 31,2002 and by certain intra-group loans. As of December 31,2002, no amounts had been drawn under the $ 1.5 billionfacility. Beginning January 2003, amounts were drawn underthe facility within the facility’s specified monthly drawing limitsuntil September when the amount drawn was reduced suchthat at September 30, 2003 an amount of $ 753 million was outstanding under the facility. The maximum amountavailable under the facility reduced from $ 1,500 million to $ 1,250 million, $ 1,200 million and $ 1,000 million at thebeginning of October, November and December 2003,respectively. In December 2003, the remaining amountoutstanding was repaid, the facility cancelled and the relatedsecurity released.
The $ 1.5 billion facility contained certain stringent financialcovenants in respect of minimum interest coverage, totalgross debt, a maximum level of debt in subsidiaries otherthan those specified as borrowers under the facility, aminimum level of consolidated net worth, as well as specificnegative pledges. We were required to meet these financialcovenants at each quarter-end commencing December 31,2002. In addition, in order to ensure the continued availabilityof the credit facility until its cancellation in December 2003,we were required to obtain minimum levels of proceeds fromthe disposal of specified assets and businesses and/orequity issuances during 2003.
The $ 1.5 billion facility prohibited the voluntary prepaymentof any banking facility, the prepayment or early redemption ofany bonds or capital market instruments, the repurchase of any of our shares, as well as the declaration or payment ofdividends as long as the facility was outstanding.
Securitization programsIn addition to the aforementioned primary sources of liquidityand capital resources, we also sell certain trade receivablesto Qualifying Special Purpose Entities (“QSPEs”), unrelatedto us, primarily through two revolving-period securitizationprograms. Under the two securitization programs, neitherQSPE commits to purchase our trade receivables, and theQSPEs may at any time refuse to continue purchasing ourtrade receivables. If both QSPEs simultaneously refuse topurchase additional receivables, then we would experience atemporary loss of cash flow from the sale of trade

ABB Group Financial review 2003 39
receivables over a period of several weeks until new tradereceivables generated by us began to convert to cash in the normal course of our business.
Solely for the purpose of credit enhancement from theperspective of the QSPEs, we retain an interest in the soldreceivables. Pursuant to the requirements of the revolving-period securitizations, we effectively bear the risk of potentialdelinquency or default associated with trade receivables soldor interests retained. The fair value of the retained interests atDecember 31, 2003 and 2002 was approximately $ 367million and $ 497 million, respectively.
We retain servicing responsibility relating to the soldreceivables. Cash settlement with the QSPEs in 2001 andthrough the third quarter of 2002 took place monthly on anet basis which gave us daily access to the cash movingthrough the securitization programs.
During the fourth quarter of 2002, a number of changeswere made to the two securitization programs as aconsequence of our credit rating falling below BBB(Standard & Poor’s) and Baa2 (Moody’s). These changesincluded, in the case of the first program, twice monthlysettlements (instead of monthly), the sale of additionalreceivables as security, changes in eligibility criteria forreceivables to be sold and the establishment of certainbanking and collection procedures in respect of soldreceivables. Changes in the second program included theintroduction of net cash settlements twice per month(instead of monthly), the daily transfer of collections of soldreceivables, as well as a fixed percentage of retained intereston the sale of new receivables. In 2003, further amendmentshave been made to the second program, including the return to a dynamic calculation of the retained interest on thereceivables sold rather than a fixed percentage. Under theamended terms of the second program, if our rating fallsbelow BB+ (Standard & Poor’s) or Ba3 (Moody’s) then wemay be required to relinquish the right to collect the soldreceivables on behalf of the QSPE, and instead the cashcollection of such sold receivables would be made directly tothe accounts of the QSPE rather than via our company.
As discussed above, we retain an interest in the soldreceivables. Retained interests at December 31, 2003 and2002 amounted to $ 390 million and $ 514 million,respectively. The decrease in the retained interest during2003 was primarily related to businesses that were classifiedas discontinued operations or held for sale being phasedout of the securitization programs during the year.
Pursuant to the terms of the securitization programs,receivables more than 90 days overdue are considereddelinquent. An increase in delinquency rates compared tohistoric levels will cause an increase in retained interests,while a decrease in delinquency rates compared to historiclevels will cause a corresponding decrease in retainedinterests. Ultimately, if the customer defaults, we will beresponsible for the uncollected amount.
The net cash paid to QSPEs during 2003 and 2002 was $ 119 million and $ 384 million, respectively, comprising thecash flows in the table below:
December 31, ($ in millions) 2003 2002
Gross trade receivables sold to QSPEs ($ 482 and $ 800)* 5,661 5,972Collections made on behalf of and paid to QSPEs (($ 663) and ($ 735))* (5,883) (6,074)Purchaser’s, liquidity and program fees (($ 2) and ($ 5))* (21) (37)Decrease (increase) in retained interests ($ 119 and ($ 91))* 124 (245)Net cash paid to QSPEs during the year (($ 64) and ($ 31))* (119) (384)
* Related to assets held for sale and in discontinued operations for 2003 and 2002,respectively
The decrease in gross receivables sold in 2003 compared to2002 is due primarily to the fact that businesses which wereeither classified as discontinued operations or which weresold by us were phased out of the securitization programsduring the year.
We pay purchaser’s, liquidity and program fees on our secu-ritization programs. Purchaser’s and program fees are basedon the amount of funding that we receive, while liquidity fees are based on the programs’ size. The reduction in gross receivables sold, a lower average funded volume, areduction in default and delinquency rates, as well as the factthat 2002 contained costs related to restructuring theprograms, all contributed to lower purchaser’s, liquidity andprogram fees in 2003 compared to 2002. The total cost of $ 21 million and $ 37 million in 2003 and 2002, respectively,related to the securitization of trade receivables, is includedin the determination of current earnings.
At December 31, 2003 and 2002, of the gross tradereceivables sold, the total trade receivables for which cashhas not been collected at those dates amounted to $ 898million and $ 1,026 million, respectively.
In addition, we transfer receivables outside of the abovedescribed securitization programs. These transfers weresales, made without recourse, directly to banks and/or salespursuant to factoring or similar type arrangements. Total soldreceivables included in these transactions during 2003 and2002 were approximately $ 1,400 million (of which $ 581million related to assets held for sale and in discontinued

40 ABB Group Financial review 2003
operations) and $ 534 million (of which $ 22 million related to assets held for sale and in discontinued operations),respectively. The related costs, including the associatedgains and losses, were $ 12 million (of which $ 3 millionrelated to assets held for sale and in discontinued operations) in 2003 and were not significant in 2002. Theincrease in the amount of receivables transferred outside ofthe securitization programs related to an increase in thesales and transfers of receivables meeting the requirementsof SFAS 140.
For a further discussion of our securitization programs, seeNotes 2 and 7 to our Consolidated Financial Statements.
Credit ratingsDebt ratings are an assessment by the rating agencies of thecredit risk associated with our company and are based oninformation provided by us or other sources that the ratingagencies consider reliable. Lower ratings generally result inhigher borrowing costs and reduced access to capitalmarkets.
At December 31, 2002, after a series of rating downgradesduring 2002, our long-term company ratings were Ba3 andBBB– (our long-term unsecured debt was rated B1 andBB+) from Moody’s and Standard & Poor’s, respectively(compared to long-term ratings of A2 and AA– from Moody’sand Standard & Poor’s, respectively, at December 31, 2001).On January 13, 2003, Standard & Poor’s further lowered ourlong-term company rating to BB+ and our long-termunsecured debt to BB–. The ratings from both Moody’s andStandard & Poor’s have remained unchanged during theremainder of 2003, such that at December 31, 2003, ourlong-term company ratings were Ba3 and BB+ (our long-term unsecured debt was rated B1 and BB–) from Moody’sand Standard & Poor’s, respectively. In late October 2003,both rating agencies changed the outlook on these ratingsto positive from negative. Our ratings are currently below“investment grade” that would be represented by Baa3 (orabove) and BBB– (or above) from Moody’s and Standard &Poor’s, respectively. A rating below investment grade isreflected in higher interest costs on borrowings. Although ourcredit ratings are below investment grade, we expect thatwe will continue to be able to access the bond markets aswe did in 2003 (see “Convertible bonds and notes”). Untilour credit rating has returned to investment grade, we donot anticipate having the ability to access the commercialpaper markets.
Restrictions on transfers of fundsWe face restrictions on the transfer of funds in variouscountries due to local regulations and foreign exchangerestrictions. Funds, other than regular dividends, fees or loanrepayments, cannot be transferred offshore from thesecountries and are therefore deposited locally. As aconsequence, these funds are not available within our GroupTreasury Operations to meet short-term cash obligations.These funds are reported as cash on our ConsolidatedBalance Sheet, but we do not consider these funds asavailable for the repayment of debt outside the respectivecountries where the cash is situated, including thosedescribed below.
Currency and other local regulatory restrictions exist in anumber of countries where we operate, including: Brazil,China, Egypt, India, Korea, Malaysia, Norway, Russia, SaudiArabia, South Africa, Taiwan, Thailand, Turkey andVenezuela.
Furthermore, restricted cash amounting to $ 394 millionand $ 377 million is not included in cash and equivalents onour Consolidated Balance Sheet at December 31, 2003and 2002, respectively.
Financial Position
Balance sheetDuring 2003 and 2002, the divestments and discontinuationsof certain businesses were treated as discontinuedoperations pursuant to SFAS 144, as discussed in detailunder “Application of Critical Accounting Policies –Accounting for discontinued operations” above. Accordingly,the balance sheet data for all periods presented have beenrestated to present the financial position and results ofoperations of the businesses meeting the criteria of SFAS144 as assets and liabilities in discontinued operations. Inthe Consolidated Statements of Cash Flows, the effects ofthe discontinued operations are not segregated, aspermitted by Statement of Financial Accounting StandardsNo.95 (SFAS 95), Statement of Cash Flows.
Our operating assets which include marketable securities,receivables, inventories and prepaid expenses decreased by$ 195 million to $ 10,417 million at December 31, 2003,from $ 10,612 million at December 31, 2002. Operatingassets exclude cash and equivalents and assets held for saleand in discontinued operations.
Primarily as a result of the sale of shares in the ChinaNational Petrochemical Corporation (Sinopec Corp.),marketable securities decreased by $ 116 million from $ 589million at December 31, 2002 to $ 473 million at December31, 2003. Receivables increased by $ 203 million from $ 5,134 million at December 31, 2002 to $ 5,337 million atDecember 31, 2003. Inventories increased by $ 344 million

ABB Group Financial review 2003 41
project and a power transmission project – both in Australia.As a consequence, investments and other assets decreasedby $ 109 million to $ 1,326 million at December 31, 2003from $ 1,435 million at December 31, 2002.
Property, plant and equipment increased by $ 139 million to$ 2,840 million at December 31, 2003 from $ 2,701 millionat December 31, 2002, reflecting the impact of translatingbalance sheet amounts from local currencies to U.S. dollarsfor reporting purposes. Expressed in local currency terms,property, plant and equipment decreased by 7 percentprimarily as a result of the sale of real estate properties andnormal levels of depreciation. The core divisions haveinvested $ 277 million in tangible fixed assets during 2003compared to $ 247 million during 2002. Total intangibleassets, including goodwill and other increased by $ 72million, a 5 percent decrease in local currency terms, to $ 2,880 million at December 31, 2003 from $ 2,808 million atDecember 31, 2002, mainly due to the write down ofcapitalized software in Group Processes. In accordance withSFAS 142, goodwill is no longer amortized as of January 1,2002.
Our gearing ratio (defined as total borrowings divided by thesum of total borrowings and the stockholders equityincluding minority interest), excluding the assets and liabilitiesin the discontinued operations, was 70 percent at December31, 2003, compared to 86 percent at December 31, 2002.This change reflected the increase in equity through ourrights issue completed in December 2003. Total borrowingsdecreased by $ 41 million to $ 7,887 million at December31, 2003 from $ 7,928 million at December 31, 2002. Short-term borrowings, including current maturities of long-termborrowings, decreased by $ 973 million, or 38 percent, to $ 1,597 million outstanding at December 31, 2003 from $ 2,570 million outstanding at December 31, 2002. Long-term borrowings increased by $ 932 million, or 17 percent,mainly as a result of the two bond issuances completedduring 2003, to $ 6,290 million at December 31, 2003 from $ 5,358 million at December 31, 2002. For a description ofthe bonds issued during 2003, see “Liquidity and capitalresources” above. A component of the $ 968 millionconvertible bonds issued in May 2002 must be accountedfor as an embedded derivative in accordance with SFAS133, as our shares are denominated in Swiss francs whilethese bonds are denominated in U.S. dollars. A portion ofthe issuance proceeds is deemed to relate to the value ofthe derivative on issuance and subsequent changes in valueof the derivative are recorded through earnings and as anadjustment to the carrying value of the bonds. The allocationof a portion of the proceeds to the derivative creates adiscount on issuance, which is amortized to earnings overthe life of the bonds. The value of the derivative movesinversely to movements in our share price. The change invalue of the embedded derivative, primarily due to the
from $ 2,261 million at December 31, 2002 to $ 2,605million at December 31, 2003. These increases reflect theimpact of translating balance sheet amounts from localcurrencies to U.S. dollars for reporting purposes as a result of a decline in 2003 in the U.S. dollar as compared tocurrencies of other countries in which we operate.Expressed in local currency terms, receivables decreased inthe Building Systems business area, which is being divested,primarily as a result of reduced business volumes andclosing of old contracts, while in the core divisions thedecrease was due to our continued focus on reducing theworking capital level.
Prepaid expenses and other decreased by $ 626 million,from $ 2,628 million at December 31, 2002 to $ 2,002million at December 31, 2003. This decrease primarilyreflects a $ 565 million decrease in the fair value of derivativeassets.
Operating liabilities, excluding liabilities held for sale and indiscontinued operations, include accounts payable, short-term borrowings including current maturities of long-termborrowings and accrued liabilities and other. Operatingliabilities decreased by $ 1,712 million to $ 11,112 million atDecember 31, 2003 from $ 12,824 million at December 31,2002. Total accounts payable increased by $ 256 millionmainly due to translating balance sheet amounts from localcurrencies to U.S. dollars for reporting purposes. Expressedin local currency terms, accounts payable decreased by 9 percent, primarily as a result of the reduced operations inour Building Systems business area, which is being divested.
Short-term borrowings and current maturities of long-termborrowings decreased by $ 973 million, reflecting ourstrategy to reduce our overall debt position and lengthen ourmaturity profile. See “Liquidity and capital resources” above.In addition, accrued liabilities and other decreased by $ 995 million, primarily reflecting a reduction of $ 882 millionin the fair value of derivative liabilities and a reduction in theprovision for asbestos-related issues by $ 278 million (see“Contingencies and retained liabilities – Asbestos claims”)which were partly offset by increased provisions for warrantyand other obligations.
Financing receivables, which include receivables from leasesand loans receivable, decreased by $ 275 million to $ 1,330 million at December 31, 2003 from $ 1,605 millionat December 31, 2002. This is primarily due to the sale ofvarious leasing assets within the remaining portion of ourStructured Finance business, in line with our focus on corebusiness and improving the liquidity levels.
We sold many of our investments and joint ventureparticipations as part of our divestment program during2003. Major divestitures included the sale of our 35 percentstake in the Swedish Export Credit Corporation, and, twoprojects in our Equity Ventures portfolio – a power plant

42 ABB Group Financial review 2003
changes in our share price, combined with the amortizationof discount on issuance, increased total borrowings by $ 84 million in 2003 and decreased total borrowings by $ 215 million in 2002. Long-term debt at December 31,2003 as a percentage of total debt was 80 percentcompared to 68 percent at December 31, 2002 as a resultof our strategy to lengthen the debt maturity profile.
Cash flowThe effects of the discontinued operations are notsegregated in the Consolidated Statements of Cash Flows,as permitted by SFAS 95. The Consolidated Statements ofCash Flows can be summarized into main activities asfollows:
2003 2002 2001
Year ended December 31, ($ in millions)
Net income (loss), net of adjustmentsfor non-cash items (414) (399) 1,228Changes in operating assets and liabilities 253 418 755Sub-total: Cash flows providedby (used in) operations (161) 19 1,983Acquisitions, investments,divestitures, net 488 2,365 (295)Asset purchases, net of disposals (392) (126) (609)Other investing activities 658 412 (314)Sub-total: Cash flows providedby (used in) investing activities 754 2,651 (1,218)Change in borrowings,net of repayments (1,028) (2,815) 2,639Treasury and capital stock transactions 2,675 – (1,393)Dividends paid – – (502)Other financing activities (56) 3 (67)Sub-total: Cash flows provided by (used in) financing activities 1,591 (2,812) 677Effects of exchange rate changes 150 141 (72)Adjustment for the net change in cashand equivalents in assets held for saleand in discontinued operations (1) 26 (244)Net change in cash and equivalents– continuing operations 2,333 25 1,126
Cash flows provided by (used in) operating activitiesCash provided by operating activities of the PowerTechnologies division of $ 616 million and of the AutomationTechnologies division of $ 848 million during 2003, resultingfrom higher earnings and working capital improvementswere more than offset by $ 239 million cash used in Non-core activities, $ 526 million cash used in Oil, Gas andPetrochemicals division, $ 388 million payments towards thesettlement of asbestos related issues and $ 472 milliontowards corporate overhead and interest payments resultingin $ 161 million net cash used in operations during 2003.This represents a decrease of $ 180 million from 2002.
Operating assets and liabilities include marketable securitiesheld for trading purposes, trade receivables, inventories,payables and other assets and liabilities. Debt and equitysecurities that are bought and held principally for thepurpose of sale in the near term are classified as tradingsecurities. Marketable securities classified as available-for-sale are treated as part of investing activities. A reductionin business volumes in the Oil, Gas and Petrochemical businesses as a result of a shift from executing lump sumprojects to reimbursable contracts resulted in a substantialreduction in accounts payable and consequently increasedcash outflow from changes in operating assets and liabilities.This partly offset the increase in cash flow from the reductionin net operating assets in the core divisions. Non-core activities also generated cash through changes in operatingassets and liabilities due to reduced volume of businessactivities, primarily from the Building Systems business.
During 2002, net cash provided by operating activities of thePower Technologies division was $ 335 million and of theAutomation Technologies division was $ 524 million primarilyresulting from improved earnings and reduced net workingcapital levels. Net cash provided by Non-core activities was$ 224 million mainly due to the net cash proceeds from thesale of marketable securities (trading) of $ 498 million. Oil,Gas and Petrochemicals businesses used cash of $ 251million due to increased project losses and higher workingcapital levels while the cash payments related to asbestoswere $ 333 million. Corporate cash outflows were $ 480million, influenced by the increased costs in respect of thecredit facility and other financing arrangements, resulting inoverall net cash provided by operating activities of $ 19million. This represented a decrease of $ 1,964 million from2001.
During 2001, improved earnings and collections ofreceivables resulted in net cash provided by operatingactivities of the Power Technologies division of $ 675 millionand of the Automation Technologies division of $ 1,056million. In addition, net cash provided by the Oil, Gas andPetrochemicals businesses was $ 476 million primarily dueto a substantial increase in accounts payable. These werepartly offset by net cash used in Non-core activities of $ 77million and in Corporate of $ 147 million resulting in a overallnet cash provided by operating activities in 2001 of $ 1,983million. Net income, net of adjustments for non-cash itemswas $ 1,228 million, primarily due to improved profitability inPower Technologies and Automation Technologies division.This was further influenced by the decrease in net operatingassets of $ 755 million in 2001 resulting largely from theincrease in accounts payable.

ABB Group Financial review 2003 43
Cash flows provided by (used in) investing activitiesInvesting activities include: acquisitions of, investments inand divestitures of businesses; purchases of property, plantand equipment, net of disposals; net investments inmarketable securities that are not held for trading purposes;and accounts receivable from leases and third-party loans(financing receivables). Net investments in available-for-salemarketable securities and financing receivables aresummarized in the table above as “other investing activities.”Net cash provided by investing activities was $ 754 millionduring 2003, a decrease of $ 1,897 million from $ 2,651million during 2002.
We continued our program of divesting non-core businessesand other assets during 2003. We received cash proceedsof approximately $ 149 million from the sale of our 35 percent stake in Swedish Export Credit Corporation andapproximately $ 90 million from the sale of our investmentsin two projects in Equity Ventures – a power plant projectand a power transmission project, both in Australia.Approximately $ 213 million was received through the sale ofour Building Systems businesses in Sweden, Norway,Denmark, Finland and Russia. In addition, the sale of theABB Export Bank for about $ 50 million and the sale of ourWind Energy business, part of the New Ventures business inNon-core activities, were completed during the fourthquarter of 2003. As a result of these significant divestituresand net cash outflows of $ 24 million for certain smallerinvestments and disposals, net cash flow from purchases of,investments in, and divestitures of businesses was $ 488million during 2003. The cash flows from investing activitiesduring 2002 was largely influenced by the sale of the major part of our Structured Finance business to GE forapproximately $ 2 billion. We also received cash proceeds ofapproximately $ 113 million from the sale of the Air Handlingbusiness and approximately $ 223 million from the sale ofour Metering business during 2002. In addition, we receivednet cash proceeds of approximately $ 55 million from thedivestments of and investments in certain smaller businessesduring 2002 resulting in net cash flow from purchases of, investments in and divestitures of businesses of 2,365million. In 2001, cash used for acquisitions of new businesses totaled $ 578 million (including $ 284 million,related to the acquisition of Entrelec). These cash outflowswere only partially offset by cash proceeds from disposals ofbusinesses for an amount of $ 283 million resulting in netcash flow from purchases of, investments in, and divestituresof businesses to $ 295 million.
Cash used for purchases of property, plant and equipment,net of disposals, was $ 392 million during 2003, an increaseof $ 266 million, compared to $ 126 million during 2002.While the level of investment in property plant and equipmentremained at nearly the same level in both years, proceeds ofapproximately $ 300 million from the sale of our real estateproperties in Sweden, substantially offset the outflows of
investment in property, plant and equipment during 2002.Cash used for purchases of property, plant and equipment,net of disposals during 2001 was $ 609 million reflectinglower proceeds from the disposals of fixed assets in 2001.
Cash provided by other investing activities increased to $ 658 million in 2003 from $ 412 million in 2002 and $ 314million of cash used in 2001. The cash provided by otherinvesting activities largely resulted from the cash inflows fromfinancing receivables of $ 390 million through the sale andclosure of many leasing assets related to the remaining partsof our Structured Finance business and net cash proceedsof $ 268 million from the sale of marketable securities that were not held for trading purposes, primarily relating to theInsurance business which we agreed to sell during the fourthquarter of 2003 and the sale of our shares in the ChinaNational Petrochemical Corporation (Sinopec Corp.) forapproximately $ 82 million. The increase in cash provided byother activities in 2002 was primarily due to a reduction ininvestments in financing receivables.
Cash flows provided by (used in) financing activitiesOur financing activities primarily include borrowings, bothfrom the issuance of debt securities and directly from banks,treasury and capital stock transactions and payment ofdividends. Net cash provided by financing activities was $ 1,591 million during 2003. As part of our strategy tolengthen our debt maturity profile, we replaced maturingshort-term borrowings with long-term borrowings. See“Liquidity and capital resources” for a detailed discussion onthe nature of borrowings. Cash outflows in connection withborrowings amounted to $ 1,028 million, reflecting therepayment of short-term (including current portion of long-term) borrowings as they fell due, partially offset by the cashinflows from the proceeds of the 1 billion Swiss francsconvertible bonds and 650 million euro aggregate principalof bonds issued in September and November 2003,respectively.
During 2002, net cash outflows from borrowings were $ 2,815 million reflecting our strategy to reduce our overalllevel of borrowings, including net cash outflows of $ 1,677million in respect of borrowings with maturities of 90 days orless (including current portion of long-term borrowings) andnet cash outflows of $ 1,138 million in respect of otherborrowings.
During 2001, cash provided by borrowings, net ofrepayments amounted to $ 2,639 million. Our level ofborrowings increased significantly during the first ninemonths of 2001 mainly due to the financing of therepurchase of our own shares, as well as a higher level ofactivity in project financing. Toward year-end 2001, wedecreased our borrowings significantly through a strongincrease in our cash flow from operations.

44 ABB Group Financial review 2003
The net proceeds of the rights issuance of $ 2.5 billion,completed in December 2003 and the proceeds from thesale of treasury shares during the first quarter of 2003 for $ 156 million, contributed to the overall net cash inflow of $ 2,675 million during 2003. There were no treasury andcapital stock transactions or dividends paid in 2002. In 2001,there was $ 1,393 million net cash used in treasury andcapital stock transactions and $ 502 million in dividendpayments.
Contractual obligationsThe following table summarizes certain of our contractualobligations and principal payments under our debtinstruments and leases at December 31, 2003:
Lessthan 2–3 4–5 After
Total 1 year years years 5 years
Payments due by period
($ in millions)
Long-term debt obligations 7,641 1,351 1,841 1,777 2,672Other short-termdebt obligations 246 246 – – –Operating lease obligations 1,880 363 533 361 623
Commercial commitmentsCertain guarantees issued or modified after December 31,2002 are accounted for in accordance with FIN 45. Uponissuance of certain guarantees, a liability, equal to the fairvalue of the guarantee, is recorded. For further discussion ofFIN 45, see “New accounting pronouncements” above.
FIN 45 requires that we disclose the “maximum potentialexposure” of certain guarantees, as well as possiblerecourse provisions that may allow us to recover from thirdparties amounts paid out under such guarantees. The“maximum potential exposure” as defined by FIN 45 doesnot allow any discounting of our assessment of actualexposure under the guarantees. The information belowreflects our maximum potential exposure under theguarantees, which is higher than our assessment of theexpected exposure.
Performance guarantees represent obligations where weguarantee the performance of a third party’s product orservice according to the terms of a contract. Suchguarantees may include guarantees that a project will becompleted within a specified time. If the third party does notfulfill the obligation, we will compensate the guaranteed partyin cash or in kind. Performance guarantees include suretybonds, advance payment guarantees and performancestandby letters of credit.
Financial guarantees represent irrevocable assurances thatwe will make payment to the beneficiary in the event that athird party fails to fulfill its financial obligations and thebeneficiary under the guarantee incurs a loss due to thatfailure.
Commitments relating to disposed businessesWe retained obligations for guarantees related to the powergeneration business contributed to the former ABB ALSTOMPOWER NV joint venture. The guarantees primarily consist ofperformance guarantees, advance payment guarantees,product warranty guarantees and other miscellaneousguarantees under certain contracts such as indemnificationfor personal and property injuries, taxes and compliance withlabor laws, environmental laws and patents. The guaranteeshave maturity dates ranging from one to ten years and insome cases have no definite expiry. In May 2000, we soldour interest in the ABB ALSTOM POWER NV joint venture toALSTOM SA (ALSTOM). As a result, ALSTOM and itssubsidiaries have primary responsibility for performing theobligations that are the subject of the guarantees. Further,ALSTOM, the parent company, and ALSTOM POWER NV,formerly ABB ALSTOM POWER NV, have undertaken jointlyand severally to fully indemnify us and hold us harmlessagainst any claims arising under such guarantees. Due tothe nature of product warranty guarantees and themiscellaneous guarantees, we are unable to develop anestimate of the maximum potential amount of futurepayments for these guarantees issued on behalf of theformer power generation business. Our best estimate of thetotal maximum potential exposure of all quantifiableguarantees we issued on behalf of our former powergeneration business was approximately $ 1,200 million and$ 2,200 million at December 31, 2003 and 2002,respectively. The maximum potential exposure is based onthe original guarantee or contract amount and does notreflect the completion status of the project. At December 31,2003, no losses have been recognized relating toguarantees issued on behalf of the former power generationbusiness. We believe that it is not probable that we will incura loss under these guarantees and therefore, in accordancewith SFAS 5, a provision has not been recorded atDecember 31, 2003 and 2002.
In November 2002, we completed the sale of most of ourStructured Finance business to General Electric CapitalCorporation (GE). Pursuant to the sale and purchaseagreement, we provided GE with cash collateralized lettersof credit aggregating $ 202 million, of which approximately $ 128 million was outstanding at December 31, 2003 assecurity for certain performance-related obligations retainedby us in connection with the sale. The sale and purchaseagreement provides GE the option to require us torepurchase certain designated financial assets transferred toGE upon the occurrence of certain events, but in any event

ABB Group Financial review 2003 45
no later than February 1, 2004. The fair value of GE’s right torequire us to repurchase certain designated assets was $ 11 million at December 31, 2003. On January 30, 2004,we repurchased the financial assets discussed above for anamount of approximately $ 28 million. Additionally, the $ 128million in cash collateralized letters of credit at December 31,2003 was further reduced by $ 35 million as a result of theexpiration of the option on February 1, 2004. No further obli-gation exists for us to repurchase any assets under the salesand purchase agreement with GE.
Other commitmentsAt December 31, 2003 and 2002, we had $ 207 million and$ 223 million, respectively, of financial guaranteesoutstanding. Of that amount, $ 189 million and $ 206 million,respectively, were issued on behalf of companies in whichwe currently have or formerly had an equity interest. Theguarantees have maturity dates ranging from one to thirteenyears. We believe that it is not probable that we will incur aloss under these guarantees and therefore, in accordancewith SFAS 5, no provision has been recorded at December31, 2003 and 2002.
We have granted lines of credit and have committed toprovide additional capital for certain equity accountedcompanies. At December 31, 2003 and 2002, the totalunused lines of credit amounted to $ 11 million and $ 22 million, respectively, and the capital commitmentsamounted to $ 88 million and $ 84 million, respectively.Included in the $ 88 million and $ 84 million are capitalcommitments of $ 24 million and $ 20 million, respectively,related to b-business partners B.V.
Guarantees relating to our performanceIn accordance with industry practice we also issue letters ofcredit, surety bonds and other performance guarantees onmajor projects, including long-term operation andmaintenance contracts, which guarantee our ownperformance. Such guarantees may include guarantees thata project will be completed or that a project or particularequipment will achieve defined performance criteria. If we failto attain the defined criteria, we must make payments incash or in kind. We record provisions in the ConsolidatedFinancial Statements at the time it becomes probable thatwe will incur losses pursuant to a performance guarantee.We do not expect to incur significant losses under theseguarantees in excess of our provisions. However, suchlosses, if incurred, could have a material impact on ourConsolidated Financial Statements.
When we guarantee our own performance, some customerswill require that the guarantee be issued by a financialinstitution. If we cannot obtain the guarantee from a financialinstitution, we could be prevented from bidding on orobtaining the contract. Financial institutions will consider our
credit ratings in the guarantee approval process. Our currentcredit rating does not prevent us from obtaining guaranteesfrom financial institutions, but can make the process moredifficult or expensive. If we cannot obtain guarantees fromfinancial institutions in the future, there could be a materialimpact on our Consolidated Financial Statements.
Pension and Other Postretirement ObligationsAt December 31, 2003, our pension and other postre-tirement plan liabilities exceeded the plan assets by $ 1,636million and $ 367 million, respectively. This underfunding isnot a short term obligation for us. Of the $ 1,636 millionpension underfunding, $ 1,449 million relates to pensionplans which are not required to be funded pursuant to localgovernment and tax requirements and contains liabilities thatwill not be paid until a current employee retires.
We expect to contribute $ 248 million to our pension plansand $ 27 million to our other postretirement benefit plans in2004.
Related and Certain Other PartiesIn the normal course of our industrial activities, we sellproducts and derive certain other revenues from companiesin which we hold an equity interest. The revenues derivedfrom these transactions are not material for us. In addition, inthe normal course of our industrial activities, we purchaseproducts from companies in which we hold an equityinterest. The amounts involved in these transactions are notmaterial for us. Also, in the normal course of our industrialactivities, we engage in transactions with businesses that wehave divested. We believe that the terms of the transactionswe conduct with these companies are negotiated on anarm’s length basis.
We have participations in joint ventures and affiliatedcompanies, which are accounted for using the equitymethod. Many of these entities have been established toperform specific functions, such as constructing, operatingand maintaining a power plant. In addition to our investment,we may provide products to the project, may act ascontractor of the project and may operate the finishedproduct. We may also grant lines of credit to these entitiesand guarantee their obligations, as discussed above under“Commercial commitments”. The entity created wouldgenerally receive revenues either from the sale of the finalproduct or from selling the output generated by the product.The revenue usually is defined by a long-term contract with the end user of the output.
Our risk with respect to these entities is substantially limitedto the carrying value of the companies on our ConsolidatedBalance Sheet. The carrying value for the equity accountedcompanies at December 31, 2003 and 2002 was $ 562million and $ 730 million, respectively.

46 ABB Group Financial review 2003
Our Consolidated Financial Statements include the followingaggregate amounts related to transactions with related andcertain other parties:
($ in millions) 2003 2002
Revenues 123 93Receivables 98 75Other current assets 17 27Financing receivables (non-current) 22 76Payables 6 30Short-term borrowings 32 39Long-term borrowings 48 1Other current liabilities 4 21
Business relationshipsIn December 2002, we entered into a $ 1.5 billion, 364-dayrevolving credit facility. Skandinaviska Enskilda Banken (SEB)was a lender under this credit facility, with an $ 89 millioncommitment, representing approximately 7.4 percent of thetotal commitment available to us. Jacob Wallenberg is thechairman of SEB and a member of our board of directors. Inaddition, Dresdner Bank Luxembourg S.A. was a lenderunder the credit facility, with a $ 57 million commitment,representing approximately 4.8 percent of the totalcommitment available to us. We paid back and cancelledthe previous $ 1.5 billion secured bank facility. Bernd Voss isa member of the supervisory board of Dresdner Bank AG(Dresdner Bank) and one of our board members. OnNovember 17, 2003, we entered into a new $ 1 billionunsecured credit facility. Each of SEB and Dresdner Bankhas committed to $ 83.3 million out of the $ 1 billion total.
In June 2003, we entered into a 10-year global frameworkagreement with International Business Machines Corporation(IBM) to outsource our information systems infrastructureservices to IBM. This global framework agreement forms thebasis for country agreements entered into with IBM in 13 countries in Europe, North America and our headquartersrepresenting a significant portion of our information systemsinfrastructure. The agreement involves the transfer to IBM of 780 of our employees, in addition to the 380 employeestransferred under pilot programs prior to 2003. Totalexpenditure in respect of the agreement will amount toapproximately $ 1.7 billion over 10 years, based on thecurrent level of usage of the services.
While the above agreement was negotiated and transactedat arms-length between us and IBM, it should be noted thatJürgen Dormann, our Chairman and CEO, was a member ofthe Board of Directors of IBM until April 29, 2003, and Hans-Ulrich Märki, a director on our Board of Directors, isGeneral Manager of IBM Europe/Middle East/Africa.
During 2003, we were party to several contracts withCompanhia Vale do Rio Doce (CVRD) and its subsidiaries.The largest contracts are for (i) engineering services andsupply of equipment of the palletizing plants located at theport of Tubarao complex (Brazil), with a value ofapproximately $ 6.3 million, and (ii) supply of equipment for the expansion of ALUNORTE (Brazil), with a value ofapproximately $ 6.2 million. There are also various purchaseorders for spare parts and machinery in general, amountingto approximately $ 1.2 million. Roger Agnelli is president and CEO of CVRD and one of our board members.
In June 2000, we entered into a share subscriptionagreement to acquire a 42 percent interest in b-businesspartners B.V., a venture capital fund formed to invest in anddevelop business-to-business e-commerce companiesacross Europe. Pursuant to the terms of the agreement, wecommitted to invest a total of $ 278 million, of which $ 69 million was paid in 2000 and $ 134 million was paidduring the first half of 2001. In December 2001, Investor AB,another founding shareholder of the fund, acquired 90 percent of our investment and capital commitments forapproximately book value, or $ 166 million in cash. Afterthese transactions, b-business partners B.V. repurchased 50percent of its outstanding shares, which resulted in a returnof capital to us of $ 10 million. After these transactions, weretain a 4 percent investment in b-business partners B.V.and we are committed to provide additional capital to b-business partners B.V. of approximately $ 5 million (a euro-denominated commitment that may fluctuate with exchangerates). Further, b-business partners B.V. retains a put right to compel us to repurchase 150,000 shares of b-businesspartners B.V. at a cost of approximately $ 19 million (a eurodenominated commitment that may fluctuate with exchangerates). At the time of these transactions, Percy Barnevik, ourformer chairman of the board of directors, was the chairmanof Investor AB and Jacob Wallenberg, a member of ourboard of directors, was the vice-chairman of Investor AB.

ABB Group Financial review 2003 47
Contingencies and retained liabilities
EnvironmentalAll of our operations, but particularly our manufacturingoperations, are subject to comprehensive environmentallaws and regulations. Violations of these laws could result infines, injunctions (including orders to cease the violatingoperations and to improve the condition of the environmentin the affected area or to pay for such improvements) orother penalties. In addition, environmental permits arerequired for our manufacturing facilities (for example, withrespect to air emissions and wastewater discharges). Inmost countries in which we operate, environmental permitsmust be renewed on a regular basis and we must submitreports to environmental authorities. These permits may berevoked, renewed or modified by the issuing authorities attheir discretion and in compliance with applicable laws. Wehave implemented formal environmental managementsystems at nearly all four manufacturing sites in accordancewith the international environmental management standardISO 14001, and we believe that we are in substantialcompliance with environmental laws, regulations and permitsin the various jurisdictions in which we operate, except forsuch instances of non-compliance that, in the aggregate, arenot reasonably likely to be material. For detailed informationplease refer to our Annual Report 2003, SustainabilityReview.
In a number of jurisdictions, including the United States, wemay be liable for environmental contamination at our presentor former facilities, or at other sites where wastes generatedfrom our present or former facilities were disposed of. In the United States, the Environmental Protection Agencyand various state agencies are responsible for regulatingenvironmental matters. These agencies have identifiedcertain of our current and former U.S. based companies aspotentially responsible parties in respect to a number of suchsites under the Comprehensive Environmental Response,Compensation, and Liability Act, the Resource Conservationand Recovery Act and other federal and state environmentallaws. As a potentially responsible party, we may be liable for a share of the costs associated with cleaning up thesesites. As of December 31, 2003, there were approximately 25 sites, at which, our companies have, or may bepotentially responsible for, environmental clean up costs.These 25 sites include several of our current or formerfacilities where we have undertaken voluntary correctiveactions. The clean up of these sites involves primarily soiland groundwater contamination. We do not believe that our aggregate liability in connection with these sites will bematerial.
Generally, our liability with regard to any specific site willdepend on the number of potentially responsible parties,their relative contributions of hazardous substances orwastes to the site and their financial viability, as well as onthe nature and extent of the contamination. Nevertheless,such laws commonly impose liability that is strict, joint andseveral, so that any one party may be liable for the entirecost of cleaning up a contaminated site.
In addition, we retained liability for certain specific environ-mental remediation costs at two sites in the United Statesthat were operated by our Nuclear technology business,which has been sold to British Nuclear Fuels PLC (BNFL) inApril 2000. Pursuant to the purchase agreement with BNFL,we have retained all of the environmental liabilities associatedwith our subsidiary Combustion Engineering Inc.’s(Combustion Engineering) Windsor, Connecticut facility anda portion of the environmental liabilities associated with ourABB C-E Nuclear Power Inc. subsidiary’s Hematite, Missourifacility. The primary environmental liabilities associated withthese sites relate to the costs of remediating radiological andchemical contamination at these facilities. Such costs are notpayable until a facility is taken out of use and generally areincurred over a number of years. Although it is difficult topredict with accuracy the amount of time it may take toremediate radiological contamination upon decommis-sioning, based on information that BNFL has made publiclyavailable, we believe that it may take until 2013 to remediatethe Hematite site. With respect to the Windsor site, webelieve the remediation may take until 2008. At the Windsorsite, a significant portion of the contamination is related toactivities that were formerly conducted by or for the UnitedStates government. We believe that a significant portion ofthe remediation costs will be covered by the United Statesgovernment under the government’s Formerly Utilized SitesRemedial Action Program. As a result of the sale of theNuclear Technology business, during 2000, we establishedin other liabilities a reserve of $ 300 million in connection withour estimated remediation costs related to these facilities.Expenditures charged to the remediation reserve were $ 6million, $ 12 million and $ 6 million during 2003, 2002 and2001, respectively. In connection with the pre-packagedChapter 11 filing by Combustion Engineering discussedbelow, we will assume any and retain all remaining environ-mental liabilities of Combustion Engineering in respect to theWindsor and Hematite sites.

48 ABB Group Financial review 2003
Estimates of the future costs of environmental complianceand liabilities are imprecise due to numerous uncertainties.Such costs are affected by the enactment of new laws andregulations, the development and application of newtechnologies, the identification of new sites for which wemay have remediation responsibility and the apportionmentof remediation costs among, and the financial viability of,responsible parties. In particular, the exact amount of theresponsibility of the United States government for theWindsor site cannot reasonably be estimated. It is possiblethat final resolution of environmental matters may require usto make expenditures in excess of our expectations, over anextended period of time and in a range of amounts thatcannot be reasonably estimated. Although final resolution ofsuch matters could have a material effect on ourConsolidated Income Statement in a particular reportingperiod in which the expenditure is incurred, we believe thatthese expenditures will not have a material adverse effect on our Consolidated Financial Statements.
Product and order related contingenciesIn 1998, we entered into an engineering, procurement andproject management contract with a customer for an oil andpetrochemical refinery in India with a contract value ofapproximately $ 860 million. The project, which is subject toa reimbursable cost agreement, is approximately 60 percentcomplete and has been stalled for the past few years due tocomplications encountered by the customer in obtainingnecessary additional financing. Given the uncertainty as towhether the project will be restarted, we recorded a loss of $ 108 million in 2003 to write down its remaining net assetsassociated with this project. If the project is not restarted, wewill be subject to certain contingent liabilities to third parties.
Asbestos Liability
OverviewWhen we sold our 50 percent interest in the former ABBALSTOM POWER NV joint venture to ALSTOM in May 2000,we retained ownership of Combustion Engineering, asubsidiary that had conducted part of our former powergeneration business and that now owns commercial realestate that it leases to third parties. Combustion Engineeringis a co-defendant, together with other third parties, innumerous lawsuits in the United States in which the plaintiffsclaim damages for personal injury arising from exposure toasbestos in equipment or materials that Combustion Engineering allegedly supplied or was responsible for,primarily during the early 1970s and before. Other ABBGroup entities have sometimes been named as defendantsin asbestos claims. These entities include ABB LummusGlobal Inc. (Lummus) (which is part of our Oil, Gas andPetrochemicals business and was formerly a subsidiary ofCombustion Engineering) and Basic Incorporated (Basic)
(which is currently a subsidiary of Asea Brown Boveri Inc.and was formerly a subsidiary of Combustion Engineering).These claims, however, have been less significant than theCombustion Engineering claims and have not had a materialimpact on our financial position, results of operations or cashflows.
From 1989 through February 17, 2003 (the date thatCombustion Engineering filed for Chapter 11 as describedbelow) approximately 438,000 asbestos-related claims havebeen filed against Combustion Engineering. On February 17,2003 there were approximately 164,000 asbestos relatedpersonal injury claims pending against Combustion Engi-neering. There were approximately 138,000 such claimspending against Combustion Engineering on December 31,2002 and approximately 94,000 such claims were pendingon December 31, 2001. Of the approximately 164,000claims that were pending on February 17, 2003,approximately 111,000 are claims that we have treated assettled (including those settled under the Master SettlementAgreement described below) but under which there arecontinuing payments. Approximately 29,000 new claimswere made in the period from January 1, 2003 to February17, 2003; 79,000 in 2002 and 55,000 in 2001.Approximately 30,000 claims were resolved in the periodfrom January 1, 2003 to February 17, 2003 (all but 111 ofwhich were resolved under the Master settlementAgreement); approximately 34,500 claims were resolved in2002 and approximately 27,000 claims were resolved in2001 At December 31, 2003, there were approximately14,800 claims pending against Basic and Lummus.Additionally, at December 31, 2003, there were 287 casesdescribed below (involving approximately 8,700 claims)against ABB entities other than Combustion Engineering,Lummus and Basic.
At December 31, 2003 and 2002, provisions of $ 813 millionand $ 1,091 million, respectively, were recorded on aconsolidated basis in respect of the asbestos claims andrelated defense costs. These provisions were based on our obligations under Combustion Engineering’s Chapter 11plan of reorganization, as described below, and assumed the confirmation and effectiveness of the pre-packaged plan. These provisions do not reflect probable insurancerecoveries on those claims. We recorded receivables ofapproximately $ 232 million and $ 241 million at December31, 2003 and 2002, respectively, for probable insurancerecoveries, which were established with respect to asbestosclaims. During 2002 and 2001, Combustion Engineeringexperienced a significant increase in the level of new claimsand higher total and per-claim settlement costs as comparedto prior years. Cash payments, before insurance recoveries,to resolve Combustion Engineering’s asbestos claims were $ 391 million (including $ 369 million contributed to the CESettlement Trust, described below), $ 236 million (including $ 30 million contributed into the CE Settlement Trust), and

ABB Group Financial review 2003 49
$ 136 million in 2003, 2002 and 2001, respectively.Administration and defense costs were $ 36 million, $ 32million and $ 13 million in 2003, 2002 and 2001, respectively.
Cash payments to resolve claims against entities other thanCombustion Engineering, Lummus and Basic have beenimmaterial to date, totalling less than $ 0.3 million in theaggregate. We have not maintained a reserve for the claimspending against such entities. Of the claims outstanding atDecember 31, 2003, approximately 2,250 claims werebrought in Mississippi in 2002 in a single case that nameshundreds of co-defendants and makes no specificallegations of any relationship between any ABB entity andthe plaintiffs. Approximately 3,900 claims have been broughtin Ohio by claimants represented by a single law firm incases that typically name 50 to 60 co-defendants and donot allege any specific linkage between the plaintiffs and anyABB entity. The remaining claims are pending in variousjurisdictions. We generally seek dismissals from claims wherethere is no apparent linkage between the plaintiffs and anyABB entity. As these claims are unrelated to CombustionEngineering, Lummus or Basic, they will not be resolvedpursuant to the pre-packaged bankruptcy plan ofCombustion Engineering described below. Our experienceresolving these claims to date indicates that they have nothad a material impact on our consolidated financial position,results of operations or cash flows.
Negotiations with Representatives of AsbestosClaimants and Pre-Packaged Chapter 11 FilingIn October 2002, we and Combustion Engineeringdetermined that it was likely that the expected asbestos-related costs of Combustion Engineering would exceed thevalue of its assets ($ 812 million at September 30, 2002 and$ 828 million at December 31, 2002) if its historicalsettlement patterns continued into the future. At that time,we and Combustion Engineering were actively consideringvarious options for resolving Combustion Engineering’sasbestos liabilities, including the possible reorganization ofCombustion Engineering under Chapter 11 of the U.S.Bankruptcy Code. In that context, we believed thatestimating Combustion Engineering’s asbestos liabilitiesbased on historical settlement patterns was no longerappropriate. Subsequently, we and Combustion Engineeringdetermined to resolve the asbestos liability of CombustionEngineering and its affiliates by reorganizing CombustionEngineering under Chapter 11, the principal businessreorganization chapter of the U.S. Bankruptcy Code. We and Combustion Engineering determined to structure theChapter 11 reorganization as a “pre-packaged plan,’’ inwhich acceptances of the plan would be solicited prior to thefiling of the Chapter 11 case, thus reducing the duration andexpense of the bankruptcy proceedings.
Beginning in October 2002, we and Combustion Engineeringconducted extensive negotiations with representatives ofcertain asbestos claimants with respect to a pre-packagedplan. On November 22, 2002, Combustion Engineering and the asbestos claimants’ representatives entered into aMaster Settlement Agreement for settling open asbestos-related personal injury claims that had been filed againstCombustion Engineering prior to November 15, 2002.Combustion Engineering also agreed, pursuant to theMaster Settlement Agreement, to form and fund the CESettlement Trust to fund and administer the payment ofasbestos-related personal injury claims settled under theMaster Settlement Agreement. Under the terms of theMaster Settlement Agreement, eligible claimants who met allcriteria to qualify for payment were entitled to receive apercentage of the value of their claim from the CE SettlementTrust and retain a claim against Combustion Engineering for the unpaid balance. The Master Settlement Agreementdivides claims into three categories based on the status of the claim at November 14, 2002, the status of thedocumentation relating to the claim, and whether or not thedocumentation establishes a valid claim eligible forsettlement and payment by Combustion Engineering. TheMaster Settlement Agreement was supplemented in January2003 to clarify the rights of certain claimants whose right to participate in a particular payment category was disputed.The Master Settlement Agreement, as supplemented, settlesthe amount of and provides for the partial payment onapproximately 110,000 open asbestos-related personalinjury claims that had been lodged against CombustionEngineering.
Pursuant to the Master Settlement Agreement, the CESettlement Trust was funded by:
■ cash contributions from Combustion Engineering in theamount of $ 5 million;
■ cash contributions from ABB Inc., a subsidiary of ABBLtd, in the amount of $ 30 million by December 31, 2003;
■ a promissory note from Combustion Engineering in theprincipal amount of approximately $ 101 million(guaranteed by Asea Brown Boveri Inc., a subsidiary ofABB Ltd); and an assignment by Combustion Engineeringof the $ 311 million unpaid balance of principal andinterest due to Combustion Engineering from Asea BrownBoveri Inc. under a loan agreement dated May 12, 2000(guaranteed by ABB Ltd).

50 ABB Group Financial review 2003
Pre-Packaged Plan of ReorganizationOn January 17, 2003, we announced that we andCombustion Engineering had reached an agreement on aproposed Pre-Packaged Plan of Reorganization forCombustion Engineering under Chapter 11 of the U.S.Bankruptcy Code (the “Plan’’). The agreement was reachedwith certain representatives of asbestos claimants withexisting asbestos-related personal injury claims againstCombustion Engineering (encompassing claimants who hadlodged claims prior to November 15, 2002 and claimantswho had filed claims after that date and were not eligible toparticipate in the Master Settlement Agreement) and with theproposed representative of persons who may be entitled tobring asbestos-related personal injury claims in the future.
The Plan provides for the creation of the Asbestos PI Trust,an independent trust which is separate and distinct from theCE Settlement Trust and addresses Asbestos PI TrustClaims, which consist of present and future asbestos-relatedpersonal injury claims (including the claims previously settledpursuant to the Master Settlement Agreement only to theextent of any unpaid portions thereof) that arise directly orindirectly from any act, omission, products or operations ofCombustion Engineering, Lummus or Basic. If the Planultimately becomes effective, a channelling injunction wouldbe issued under the U.S. Bankruptcy Code pursuant towhich the Asbestos PI Trust Claims against ABB Ltd and itsaffiliates (including Combustion Engineering, Lummus andBasic) would be channelled to the Asbestos PI Trust. Thiswould mean that the sole recourse of a holder of anAsbestos PI Trust Claim would be to the Asbestos PI Trustand such holder would be barred from asserting such aclaim against ABB Ltd and its affiliates (includingCombustion Engineering, Lummus and Basic). A preliminaryinjunction is currently in force. The Asbestos PI Trust would be funded with cash and other assets, includingapproximately 30 million common shares of ABB Ltd. Thetotal package is valued at approximately $ 800 million.
The Plan sets forth distribution procedures for the allocationof funds to the claimants. The Plan provides that the unpaidportion of claims that were settled pursuant to the MasterSettlement Agreement will also be entitled to distributionsfrom the Asbestos PI Trust.
On the effective date of the Plan, the Asbestos PI Trust willbe funded as follows:
■ a $ 20 million 5 percent term note with a maximum termof ten years from the effective date of the Plan, issued byCombusting Engineering and secured by its Windsor,Connecticut real estate and real estate leases (undercertain specified contingencies, the Asbestos PI Trust mayhave the right to convert the term note into ownership of80 percent of the voting securities of the reorganizedCombustion Engineering);
■ excess cash held by Combustion Engineering on theeffective date of the Plan;
■ a promissory note issued by ABB Inc. and ABB Ltd andguaranteed by certain ABB Ltd subsidiaries, in anaggregate amount of up to $ 350 million payable ininstallments commencing in 2004, with $ 50 million to bepaid during 2004, $ 100 million to be paid during 2005and $ 100 million to be paid during 2006, and furtherproviding for payments amounting to $ 50 million to bepaid no later than 2010 ($ 25 million of which may bepayable as early as 2006) and contingent payments of anadditional aggregate amount of $ 50 million (in equal $ 25 million installments) in 2008 and 2009 if ABB Ltdmeets certain financial performance standards (an EBITmargin of 12 percent in 2007 and 2008);
■ a non-interest bearing promissory note on behalf ofLummus in the amount of $ 28 million payable in relativelyequal annual installments over 12 years;
■ a non-interest bearing promissory note on behalf of Basicin the aggregate amount of $ 10 million payable inrelatively equal annual installments over 12 years;
■ 30,298,913 shares of ABB Ltd (the “CE SettlementShares”), which had a fair value at December 31, 2003 of$ 154 million and $ 86 million at December 31, 2002. Ourobligation to deliver these CE Settlement Shares willcontinue to be marked to market, with changes in the fairvalue of the CE Settlement Shares reflected in earningsuntil such CE Settlement Shares are contributed to theAsbestos PI Trust;

ABB Group Financial review 2003 51
■ we will execute and deliver a nuclear and environmentalindemnity with regard to obligations arising out ofCombustion Engineering’s Windsor, Connecticut site forthe benefit of Combustion Engineering;
■ Combustion Engineering, Lummus and Basic will assignto the Asbestos PI Trust any proceeds under certaininsurance policies and insurance settlement agreements.Aggregate unexhausted product liability limits areapproximately $ 200 million for Combustion Engineering,approximately $ 43 million for Lummus and approximately$ 28 million for Basic, although amounts ultimatelyrecovered by the Asbestos PI Trust under these policiesmay be substantially less than the policy limits. In addition,Combustion Engineering will assign to the Asbestos PITrust scheduled payments under certain of its insurancesettlement agreements ($ 86 million at December 31,2003); and
■ if Lummus is sold within 18 months after the effectivedate of the Plan, ABB Inc. will contribute $ 5 million to theCE Settlement Trust and $ 5 million to the Asbestos PITrust. If the CE Settlement Trust has ceased to exist atthat time, both $ 5 million payments will be made to theAsbestos PI Trust, but in no event will this contributionexceed the net proceeds from the sale of Lummus.
Next Steps in the Chapter 11 ProcessThe Plan, including the channelling injunction, will becomeeffective when the U.S. Bankruptcy Court recommends theissuance of a confirmation order (which occurred on July 10,2003), the confirmation order is entered by the U.S. DistrictCourt (which occurred on August 8, 2003) and has becomea final order that is not subject to appeal, and certain otherconditions to the effectiveness of the Plan have beensatisfied.
The solicitation of votes to approve the Plan began onJanuary 19, 2003, and Combustion Engineering filed forChapter 11 in the U.S. Bankruptcy Court in Delaware onFebruary 17, 2003 based on the previously negotiated Plan. The voting period closed on February 19, 2003, andapproximately 97 percent of qualified ballots voted toapprove the Plan. A confirmation hearing and relatedhearings commenced on April 7, 2003 and continued fromtime to time through early June 2003. On June 23, 2003, theU.S. Bankruptcy Court issued its Order Approving theDisclosure Statement but Recommending Withholding ofConfirmation of the Plan of Reorganization for CombustionEngineering for Ten Days (the “Ruling”) and related findingsof fact. The Ruling approved the disclosure statement thatwas the document used as the basis for soliciting approvalof the Plan from asbestos claimants and verified the votingresults that approved the Plan. Although the Ruling did not
confirm the Plan, it indicated that the U.S. Bankruptcy Courtwould recommend that the Plan be confirmed if we andCombustion Engineering could establish to the court’ssatisfaction certain specified information. We then submittedthe additional information for the court’s consideration.
On July 10, 2003, the U.S. Bankruptcy Court issued aSupplemental and Amendatory Order Making AdditionalFindings and Recommending Confirmation of Plan ofReorganization (the “Supplemental Ruling”). TheSupplemental Ruling recommended to the U.S. DistrictCourt, among other things, that the Plan be confirmed.
Following the issuance of the Supplemental Ruling,interested parties had a period during which they couldappeal the Ruling and the Supplemental Ruling. This appealperiod expired on July 24, 2003. A number of interestedparties, including a small number of asbestos claimants andcertain insurance companies which historically have providedinsurance coverage to Combustion Engineering, Basic andLummus, filed appeals based on various objections to thePlan, including the following:
■ arguments that Combustion Engineering is not permittedto obtain a channelling injunction that protectsCombustion Engineering’s affiliates with respect to claimsagainst Combustion Engineering;
■ arguments that asbestos claims against Lummus andBasic cannot be made subject to a channelling injunction;
■ arguments that the disclosure provided in connection withthe solicitation of acceptances of the Plan did not satisfythe required standards;
■ arguments that claimants covered by the Plan would farebetter outside the Plan;
■ arguments that the Plan and the Bankruptcy Court’srulings improperly affect the rights and obligations ofinsurance carriers who have continuing obligations toprovide insurance coverage with respect to CombustionEngineering’s asbestos liabilities;
■ arguments that the Plan and the Bankruptcy Court’srulings fail to address properly the indemnification rights ofcertain insurers; and
■ arguments that the Bankruptcy Court was in error in notpermitting the release of the trust created under theMaster Settlement Agreement and certain other entities,under the Plan.

52 ABB Group Financial review 2003
The U.S. District Court held a hearing on July 31, 2003, withrespect to the appeals and entered its confirmation order onAugust 8, 2003. The U.S. Federal Third Circuit Court ofAppeals granted a motion for expedition of appeals andordered that all briefs were to be filed by October 7, 2003.Although the Circuit Court has set, and then moved, thedate for the hearing for December 16, 2003, January 12,2004 and February 4, 2004, there is not now a scheduledhearing date. Rather the Circuit Court has ordered that oral argument is postponed pending resolution of certainrecusal motions against the U.S. District Court Judge in anunrelated case. We cannot be certain of when a hearing will be scheduled or the duration or outcome of the appealprocess. Regardless of whether or not the Plan becomeseffective, the Master Settlement Agreement remainseffective.
Effect of the Plan on our Financial PositionWe recorded expenses related to asbestos of $ 145 million,$ 420 million and $ 470 million in loss from discontinuedoperations, net of tax, for 2003, 2002 and 2001,respectively. Loss from discontinued operations, net of taxfor 2003 includes a charge of $ 68 million, net of tax,resulting from the mark-to-market adjustment relating to theCE Settlement Shares, a provision of $ 41 million,representing the present value of the first two $ 25 millionpayments previously considered contingent, as well as $ 36 million of other costs. The 2002 amount reflected ourestimate of incremental total costs to be incurred basedupon the terms of the Plan. In 2001, loss from discontinuedoperations, net of tax, reflected a charge to earnings basedon Combustion Engineering’s forecasts of the expected cost of future claim settlements over a period of severalyears and estimates of the amounts recoverable frominsurance when the claims were settled.
Based upon expected implementation of the Plan, we haverecorded provisions of $ 813 million at December 31, 2003,in accrued liabilities and other. If the Plan becomes effective,certain amounts will be reclassified as of the effective date to other long-term liabilities based on the timing of the futurecash payments to the Asbestos PI Trust. Future earnings will be affected by mark-to-market adjustments relating tothe CE Settlement Shares through the effective date of the Plan, as well as contingent payments when they becomeprobable of payment. In the event the Plan does not become effective, the ultimate cost for the resolution ofasbestos-related personal injury claims against CombustionEngineering, Lummus and Basic may be significantly higher and could have a material adverse impact on ourconsolidated financial position, results of operations andcash flows.

ABB Group Financial review 2003 53
Consolidated Income Statements
Year ended December 31 (in millions, except per share data) 2003 2002 2001
Revenues $ 18,795 $ 17,466 $ 18,334Cost of sales (14,080) (13,067) (13,539)Gross profit 4,715 4,399 4,795
Selling, general and administrative expenses (3,830) (3,954) (3,929)Amortization expense (40) (41) (188)Other income (expense), net (189) (58) (161)Earnings before interest and taxes 656 346 517
Interest and dividend income 144 189 348Interest and other finance expense (554) (315) (571)Income from continuing operations before taxes and minority interest 246 220 294
Provision for taxes (78) (74) (87)Minority interest (82) (71) (36)Income from continuing operations 86 75 171
Loss from discontinued operations, net of tax (853) (858) (837)Cumulative effect of change in accounting principles (SFAS133), net of tax – – (63)Net loss $ (767) $ (783) $ (729)
Basic earnings (loss) per share:Income from continuing operations $ 0.07 $ 0.07 $ 0.15Net loss $ (0.63) $ (0.70) $ (0.64)
Diluted earnings (loss) per share:Income from continuing operations $ 0.07 $ (0.10) $ 0.15Net loss $ (0.63) $ (0.83) $ (0.64)
See accompanying Notes to the Consolidated Financial Statements.
Consolidated Financial Statements

54 ABB Group Financial review 2003
Consolidated Balance Sheets
December 31(in millions, except share data) 2003 2002
Cash and equivalents $ 4,669 $ 2,336Marketable securities 473 589Receivables, net 5,337 5,134Inventories, net 2,605 2,261Prepaid expenses and other 2,002 2,628Assets held for sale and in discontinued operations 6,427 7,499Total current assets 21,513 20,447
Financing receivables, non-current 1,330 1,605Property, plant and equipment, net 2,840 2,701Goodwill 2,331 2,221Other intangible assets, net 549 587Prepaid pension and other employee benefits 524 537Investments and other 1,326 1,435Total assets $ 30,413 $ 29,533
Accounts payable, trade $ 2,981 $ 2,729Accounts payable, other 1,394 1,390Short-term borrowings and current maturities of long-term borrowings 1,597 2,570Accrued liabilities and other 5,140 6,135Liabilities held for sale and in discontinued operations 5,100 5,966Total current liabilities 16,212 18,790
Long-term borrowings 6,290 5,358Pension and other employee benefits 1,794 1,619Deferred taxes 969 911Other liabilities 1,837 1,584Total liabilities 27,102 28,262
Minority interest 285 258Stockholders’ equity:
Capital stock and additional paid-in capital 3,067 2,027Retained earnings 1,847 2,614Accumulated other comprehensive loss (1,750) (1,878)Less:Treasury stock, at cost (11,611,529 and 86,830,312 shares at December 31, 2003 and 2002, respectively) (138) (1,750)
Total stockholders’ equity 3,026 1,013Total liabilities and stockholders’ equity $ 30,413 $ 29,533
See accompanying Notes to the Consolidated Financial Statements.

ABB Group Financial review 2003 55
Consolidated Statements of Cash Flows
Year ended December 31 (in millions) 2003 2002 2001
Operating activitiesNet loss $ (767) $ (783) $ (729)Adjustments to reconcile net loss to net cash provided by (used in) operating activities:
Depreciation and amortization 585 611 787Provisions (726) (131) 1,146Pension and post-retirement benefits 21 37 1Deferred taxes 50 (140) (89)Net gain from sale of property, plant and equipment (26) (23) (23)Loss on sale of discontinued operations 38 194 –Other 411 (164) 135Changes in operating assets and liabilities:
Marketable securities (trading) 13 498 72Trade receivables 78 627 65Inventories 241 367 (106)Trade payables (370) 79 736Other assets and liabilities, net 291 (1,153) (12)
Net cash provided by (used in) operating activities (161) 19 1,983
Investing activitiesChanges in financing receivables 390 264 (907)Purchases of marketable securities (other than trading) (2,781) (4,377) (3,280)Purchases of property, plant and equipment (547) (602) (761)Acquisitions of businesses (net of cash acquired) (55) (144) (578)Proceeds from sales of marketable securities (other than trading) 3,049 4,525 3,873Proceeds from sales of property, plant and equipment 155 476 152Proceeds from sales of businesses (net of cash disposed) 543 2,509 283Net cash provided by (used in) investing activities 754 2,651 (1,218)
Financing activitiesNet changes in borrowings with maturities of 90 days or less (99) (1,677) (69)Increases in other borrowings 1,964 9,050 9,357Repayment of other borrowings (2,893) (10,188) (6,649)Treasury and capital stock transactions 2,675 – (1,393)Dividends paid – – (502)Other (56) 3 (67)Net cash provided by (used in) financing activities 1,591 (2,812) 677
Effects of exchange rate changes on cash and equivalents 150 141 (72)Adjustment for the net change in cash and equivalents in assets held for sale and in discontinued operations (1) 26 (244)Net change in cash and equivalents – continuing operations 2,333 25 1,126Cash and equivalents beginning of year 2,336 2,311 1,185Cash and equivalents end of year $ 4,669 $ 2,336 $ 2,311
Interest paid $ 438 $ 482 $ 702Taxes paid $ 238 $ 298 $ 273
See accompanying Notes to the Consolidated Financial Statements.

ABB Ltd Consolidated Statements of Changes in Stockholders’ Equity
For the years ended December 31, 2003,2002 and 2001 Accumulated other comprehensive loss
Capital Unrealized Unrealized Totalstock and Foreign gain (loss) Minimum gain (loss) accumulatedadditional currency on available- pension of cash other Total
paid-in Retained translation for-sale liability flow hedge comprehensive Treasury stockholders’(in millions) capital earnings adjustment securities adjustment derivatives loss stock equity
Balance at January 1, 2001 $ 2,082 $ 4,628 $ (1,157) $ 87 $ (52) $ – $ (1,122) $ (417) $ 5,171Comprehensive loss:Net loss (729) (729)Foreign currency translationadjustments (366) (366) (366)Effect of change in fair value ofavailable-for-sale securities,net of tax of $16 (128) (128) (128)Minimum pension liabilityadjustments, net of tax of $1 3 3 3Cumulative effect of changein accounting principles(SFAS 133), net of tax of $17 (41) (41) (41)Change in derivatives qualifyingas cash flow hedges,net of tax of $18 (46) (46) (46)Total comprehensive loss (1,307)
Dividends paid (502) (502)Purchase of treasury stock (1,615) (1,615)Sale of treasury stock (101) 282 181Call options 47 47Balance at December 31, 2001 2,028 3,397 (1,523) (41) (49) (87) (1,700) (1,750) 1,975Comprehensive loss:Net loss (783) (783)Foreign currency translationadjustments (295) (295) (295)Accumulated foreign currency translation adjustments allocatedto divestments of businesses 90 90 90Effect of change in fair value ofavailable-for-sale securities,net of tax of $1 3 3 3Minimum pension liabilityadjustments, net of tax of $30 (107) (107) (107)Change in derivatives qualifyingas cash flow hedges,net of tax of $52 131 131 131Total comprehensive loss (961)
Other (1) (1)Balance at December 31, 2002 2,027 2,614 (1,728) (38) (156) 44 (1,878) (1,750) 1,013Comprehensive loss:Net loss (767) (767)Foreign currency translationadjustments 40 40 40Accumulated foreign currencytranslation adjustments allocatedto divestments of businesses (37) (37) (37)Effect of change in fair value ofavailable-for-sale securities,net of tax of $18 65 65 65Minimum pension liabilityadjustments, net of tax of $5 19 19 19Change in derivatives qualifyingas cash flow hedges,net of tax of $13 41 41 41Total comprehensive loss (639)
Sale of treasury stock (1,456) 1,612 156Capital stock issued in connectionwith rights offering, net 2,487 2,487Call options 9 9Balance at December 31, 2003 $ 3,067 $ 1,847 $ (1,725) $ 27 $ (137) $ 85 $ (1,750) $ (138) $ 3,026
See accompanying Notes to the Consolidated Financial Statements.

ABB Group Financial review 2003 57
ABB Ltd Notes to the Consolidated Financial Statements(U.S. dollar amounts in millions, except per share amounts)
Note 1 The companyABB Ltd is a leading global company in power and automation technologies that enable utility and industry customers to improve performance whilelowering environmental impact. ABB Ltd works with customers to engineer and install networks, facilities and plants with particular emphasis onenhancing efficiency and productivity for customers that source, transform, transmit and distribute energy.
Note 2 Significant accounting policiesThe following is a summary of significant accounting policies followed in the preparation of these Consolidated Financial Statements.
Basis of presentationThe Consolidated Financial Statements are prepared on the basis of generally accepted accounting principles (GAAP) in the United States (U.S.) andare presented in U.S. dollars ($) unless otherwise stated. Par value of capital stock is denominated in Swiss francs (CHF).
The number of shares and earnings per share data in the Consolidated Financial Statements have been presented as if the four-for-one split of ABB Ltdshares in May 2001 had occurred as of the earliest period presented.
Scope of consolidationThe Consolidated Financial Statements include 100 percent of the assets, liabilities, revenues, expenses, income, loss and cash flows of ABB Ltd andcompanies in which ABB Ltd has a controlling interest (subsidiaries), as if ABB Ltd and its subsidiaries (collectively, the “Company”) were a singlecompany. Significant intercompany accounts and transactions have been eliminated. Minority interest is calculated for entities fully consolidated but notwholly owned. The components of net income and equity attributable to the minority shareholders are presented in the minority interest line itemsincluded in the Consolidated Income Statement and Consolidated Balance Sheet.
In January 2003, the Financial Accounting Standards Board issued Interpretation No. 46 (FIN 46), Consolidation of Variable Interest Entities – anInterpretation of ARB No.51. FIN 46 requires variable interest entities (VIEs) to be consolidated by their primary beneficiaries. Accordingly, pursuant to FIN 46, VIEs entered into after January 31, 2003, are consolidated when the Company is considered the primary beneficiary. Also, after January 31,2003, previously consolidated VIEs would be deconsolidated when a triggering event, as defined by FIN 46, indicates the Company is no longer theprimary beneficiary. For those VIEs where the Company is not the primary beneficiary, existing consolidation policies in accordance with U.S. GAAP areapplied.
Investments in joint ventures and affiliated companies in which the Company has significant influence, but not a controlling interest, are accounted forusing the equity method. This is generally presumed to exist when the Company owns between 20 percent and 50 percent of the investee. In certaincircumstances, the Company’s ownership of an investee exceeds 50 percent but it accounts for the investment using the equity method because itdoes not have a controlling interest due to certain rights of minority shareholders which allow them to participate in significant operating and financialdecisions of the investee.
Under the equity method, the Company’s investment in and amounts due to and from an equity investee are included in the Consolidated BalanceSheet; the Company’s share of an investee’s earnings is included in the Consolidated Income Statement; and the dividends, cash distributions, loans orother cash received from the investee, additional cash investments, loan repayments or other cash paid to the investee, are included in the ConsolidatedBalance Sheet and the Consolidated Statement of Cash Flows. Additionally, the carrying values of investments accounted for using the equity methodof accounting are adjusted downward to reflect any other-than-temporary declines in value.
Investments in non-public companies in which the Company does not have a controlling interest or significant influence are accounted for at cost. This isgenerally presumed to exist when the Company owns less than 20 percent of the investee. Dividends and other distributions of earnings from theseinvestments are included in income when received. The carrying value of investments accounted for using the cost method of accounting are adjusteddownward to reflect any other-than-temporary declines in value.
Use of estimatesThe preparation of the Consolidated Financial Statements in conformity with U.S. GAAP requires management to make estimates and assumptionsthat affect reported amounts and related disclosures. Actual results could differ from those estimates.
ReclassificationsAmounts reported for prior years in these Consolidated Financial Statements and Notes have been reclassified to conform to the current year’spresentation, primarily as a result of the treatment of certain businesses as assets and liabilities held for sale and in discontinued operations.
Concentrations of credit riskThe Company sells a broad range of products, systems and services to a wide range of industrial and commercial customers throughout the world.Concentrations of credit risk with respect to trade receivables are limited, due to the Company’s customer base being comprised of a large number ofindividual customers. Ongoing credit evaluations of customers’ financial positions are performed and, generally, no collateral is required.
Subsequent to the sale of a significant portion of the Company’s Structured Finance business during 2002, the Financial Services activities of theCompany were substantially reduced. As a consequence of this divestment, the credit risk of the Company’s remaining Financial Services activities isprimarily concentrated in the remaining lease and loan portfolio. Policies and procedures to control the remaining credit risks include measurements to develop and ensure the maintenance of a diversified portfolio through the active monitoring of counterparty, country and industry exposure.
The Company maintains reserves for potential credit losses and such losses, in the aggregate, are in line with management’s expectations.

58 ABB Group Financial review 2003
It is Company policy to invest cash in deposits with banks throughout the world with certain minimum credit ratings and in high quality, low risk, liquidinvestments. The Company actively manages its credit risk by routinely reviewing the creditworthiness of the banks and the investments held, as well asmaintaining such investments in deposits or liquid securities. The Company has not incurred significant credit losses related to such investments.
The Company’s exposure to credit risk on derivative financial instruments is the risk that a counterparty will fail to meet its obligations. To reduce this risk,the Company has credit policies that require the establishment and review of credit limits for individual counterparties. In addition, close-out nettingagreements have been entered into with most counterparties. Close-out netting agreements provide for the termination, valuation and net settlement ofsome or all outstanding transactions between two counterparties on the occurrence of one or more pre-defined trigger events.
Cash and equivalentsCash and equivalents include highly liquid investments with original maturities of three months or less. Not included in cash and equivalents is restrictedcash of $ 394 million and $ 377 million at December 31, 2003 and 2002, respectively.
Marketable securitiesDebt and equity securities are classified as either trading or available-for-sale at the time of purchase and are carried at fair value. Debt and equitysecurities that are bought and held principally for the purpose of sale in the near term are classified as trading securities and unrealized gains and lossesthereon are included in the determination of earnings. Unrealized gains and losses on available-for-sale securities are excluded from the determination of earnings and are instead recognized in the accumulated other comprehensive loss component of stockholders’ equity, net of tax (accumulated othercomprehensive loss) until realized. Realized gains and losses on available-for-sale securities are computed based upon the historical cost of these secu-rities applied using the specific identification method. Declines in fair values of available-for-sale investments that are other-than-temporary are includedin the determination of earnings.
The Company analyzes its available-for-sale securities for impairment when the fair values of individual securities have been below their cost basis for aperiod exceeding nine consecutive months or when other events indicate the need for assessment. The Company records an impairment charge throughcurrent period earnings and adjusts the cost basis for such other-than-temporary declines in fair value when the fair value is not anticipated to recoverabove cost within a three-month period after the measurement date unless there are mitigating factors that indicate an impairment charge throughearnings may not be required. If an impairment charge is recorded, subsequent recoveries in fair value are not reflected in earnings until sale of the security.
Revenue recognitionThe Company recognizes revenues from the sale of manufactured products when persuasive evidence of an arrangement exists, the price is fixed anddeterminable, collectibility is reasonably assured and upon transfer of title including the risks and rewards of ownership to the customer. If contracts forsale of manufactured products require installation, which can only be performed by the Company, revenues are deferred until installation of the productsis complete. In accordance with Emerging Issues Task Force No. 00-21, Revenue Arrangements with Multiple Deliverables, when multiple elementssuch as products and services are contained in a single arrangement or in related arrangements with the same customer, the Company allocatesrevenues to each element based on its relative fair value, provided that such element meets the criteria for treatment as a separate unit of accounting.Revenues from short-term contracts to deliver services are recognized upon completion of required services to the customer. Revenues from contractsthat contain customer acceptance provisions are deferred until customer acceptance occurs or the contractual acceptance period has lapsed.
Revenues under long-term contracts are recognized using the percentage-of-completion method of accounting. The Company principally uses thecost-to-cost or delivery events methods to measure progress towards completion on contracts. Management determines the method to be used bytype of contract based on its judgment as to which method best measures actual progress towards completion.
Anticipated costs for warranties are accrued when revenues are recognized. Losses on contracts are recognized in the period when they are identifiedand are based upon the anticipated excess of contract costs over the related contract revenues.
Revenues under cost-reimbursement contracts are recognized as costs are incurred. Shipping and handling costs are recorded as a component ofcost of sales.
ReceivablesThe Company accounts for the securitization of trade receivables in accordance with Statement of Financial Accounting Standards No. 140 (SFAS140), Accounting for Transfers and Servicing of Financial Assets and Extinguishments of Liabilities. SFAS 140 requires an entity to recognize the financialand servicing assets it controls and the liabilities it has incurred and to derecognize financial assets when control has been surrendered, as evaluated inaccordance with the criteria provided in SFAS 140.
The Company accounts for the transfer of its receivables to Qualifying Special Purpose Entities (QSPEs) as a sale of those receivables to the extent thatconsideration other than beneficial interests in the transferred accounts receivable is received. The Company does not recognize the transfer as a saleunless the receivables have been put presumptively beyond the reach of the Company and its creditors, even in bankruptcy or other receivership. Inaddition, the QSPEs must obtain the right to pledge or exchange the transferred receivables, and the Company cannot retain the ability or obligation torepurchase or redeem the transferred receivables.
At the time the receivables are sold, the balances are removed from trade receivables and a retained interest or deferred purchase price component isrecorded in other receivables. The retained interest is recorded at its estimated fair value. Costs associated with the sale of receivables are included inthe determination of earnings.
The Company, in its normal course of business, sells receivables outside its securitization programs without recourse (see Note 7). Sales or transfersthat do not meet the requirements of SFAS 140 are accounted for as secured borrowings.
(U.S. dollar amounts in millions, except per share amounts)
Note 2 Significant accounting policies, continued

ABB Group Financial review 2003 59
InventoriesInventories are stated at the lower of cost (determined using either the first-in, first-out or the weighted average cost method) or market. Inventoriedcosts relating to percentage-of-completion contracts are stated at actual production costs, including overhead incurred to date, reduced by amountsrecognized in cost of sales.
Impairment of long-lived assets and accounting for discontinued operationsEffective January 1, 2002, the Company adopted Statement of Financial Accounting Standards No. 144 (SFAS 144), Accounting for the Impairment orDisposal of Long-Lived Assets, which superseded Statement of Financial Accounting Standards No. 121 (SFAS 121), Accounting for the Impairment ofLong-Lived Assets and for Long-Lived Assets to Be Disposed Of, yet retained the fundamental provisions of SFAS 121 related to the recognition andmeasurement of the impairment of long-lived assets (i.e., property, plant, and equipment and identifiable intangibles) to be “held and used”. A long-livedasset is assessed for impairment when events or circumstances indicate the carrying amount of the asset may not be recoverable. If the asset’s netcarrying value exceeds the asset’s net undiscounted cash flows expected to be generated over its remaining useful life, the carrying amount of the assetis reduced to its estimated fair value, pursuant to the measurement criteria of SFAS 144.
In accordance with SFAS 144, the Company includes in assets and liabilities held for sale and in discontinued operations the assets and liabilities thatmeet certain criteria with respect to the Company’s plans for their sale or abandonment. Depreciation and amortization cease when the asset meets thecriteria to be classified as held for sale. If (1) a planned or completed disposal involves a component of the Company whose operations and cash flows can be distinguished operationally and for financial reporting purposes; (2) such operations and cash flows will be (or have been) eliminated fromthe Company’s ongoing operations; and (3) the Company will not have any significant continuing involvement in the component, then the component’sresults of operations are presented as discontinued operations for all periods. Operating losses from discontinued operations are recognized in theperiod in which they occur. Long-lived assets (or groups of assets and related liabilities) classified as held for sale, are measured at the lower of carryingamount or fair value less cost to sell.
In connection with the adoption of SFAS 144, the Company elected to cease presenting cash flows from discontinued operations as a single line andinstead presents the relevant amounts within cash flows from operating, investing and financing activities.
Prior to adoption of SFAS 144, the Company accounted for discontinued operations in accordance with APB Opinion No. 30, Reporting the Results of Operations – Reporting the Effects of Disposal of a Segment of a Business, and Extraordinary, Unusual and Infrequently Occurring Events and Transactions, in which only the results of operations of a segment or major line of business that had been sold, abandoned, otherwise disposed of, orwas the subject of a formal plan for disposal, could be classified as discontinued operations.
In addition to the interest expense contained within businesses classified as discontinued operations, a portion of the Company’s interest expense isreclassified from interest and other finance expense to loss from discontinued operations, net of tax, in accordance with Emerging Issues Task ForceNo. 87-24 (EITF 87-24), Allocation of Interest to Discontinued Operations. Such amounts were $ 42 million, $ 50 million and $ 66 million in 2003, 2002and 2001, respectively. These amounts were calculated based upon the ratio of net assets of the discontinued business less debt that is required to be paid as a result of the disposal, divided by the sum of total net assets and total debt (other than the portion of debt directly attributable to otheroperations of the Company, debt of the discontinued operation that will be assumed by the buyer and debt that is required to be paid as a result of the disposal transaction). This ratio was multiplied by the portion of total interest expense not directly attributable to other operations of the Company to arrive at allocable interest attributable to businesses reflected as discontinued operations.
Goodwill and other intangible assetsThe excess of cost over the fair value of net assets of acquired businesses is recorded as goodwill. The Company accounts for its goodwill inaccordance with Statement of Financial Accounting Standards No. 142 (SFAS 142), Goodwill and Other Intangible Assets. Under SFAS 142, goodwillfrom acquisitions completed after June 30, 2001, has not been amortized. Beginning from January 1, 2002, goodwill has not been amortized. For yearsprior to January 1, 2002, the goodwill had been amortized on a straight-line basis over periods ranging from 3 to 20 years. In accordance with SFAS142, goodwill is tested for impairment annually, and also upon the occurrence of a triggering event requiring the re-assessment of a business’ carryingvalue of its goodwill. The Company’s annual assessment is performed effective October 1 each year. A fair value approach is used to identify potentialgoodwill impairment and, when necessary, measure the amount of impairment. The Company uses a discounted cash flow model to determine thefair value of reporting units, unless there is a readily determinable fair market value.
The cost of acquired intangible assets is amortized on a straight-line basis over their estimated useful lives, typically ranging from 3 to 10 years.Intangible assets are tested for impairment upon the occurrence of certain triggering events.
Capitalized software costsCapitalized costs of software for internal use are accounted for in accordance with Statement of Position 98-1, Accounting for the Costs of ComputerSoftware Developed or Obtained for Internal Use, and are amortized on a straight-line basis over the estimated useful life of the software, typicallyranging from 3 to 5 years. Capitalized costs of a software product to be sold are accounted for in accordance with Statement of Financial AccountingStandards No. 86, Accounting for the Costs of Computer Software to Be Sold, Leased, or Otherwise Marketed, and are carried at the lower ofunamortized cost or net realizable value until the product is available for general release to customers, at which time capitalization ceases and costs areamortized on a straight-line basis over the estimated life of the product. The Company expenses costs incurred prior to technological feasibility, andthereafter capitalizes costs incurred in developing or obtaining software for internal use and for software products to be sold.
Property, plant and equipmentProperty, plant and equipment is stated at cost, less accumulated depreciation, and is depreciated using the straight-line method over the estimateduseful lives of the assets as follows: 10 to 50 years for buildings and leasehold improvements and 3 to 15 years for machinery and equipment.
(U.S. dollar amounts in millions, except per share amounts)
Note 2 Significant accounting policies, continued

60 ABB Group Financial review 2003
Derivative financial instrumentsThe Company uses derivative financial instruments to manage interest rate and currency exposures, and to a lesser extent commodity exposures,arising from its global operating, financing and investing activities. The Company’s policies require that the industrial entities hedge exposure from firmcommitments denominated in foreign currencies, as well as at least fifty percent of the anticipated foreign currency denominated sales volume ofstandard products over the next twelve months. In addition, derivative financial instruments were also used for proprietary trading purposes within theCompany’s former Financial Services division and within limits determined by the Company’s Board of Directors until June 2002, when the Companyceased entering into new positions.
On January 1, 2001, the Company adopted Statement of Financial Accounting Standards No. 133, Accounting for Derivative Instruments and HedgingActivities, as subsequently amended (SFAS 133). SFAS 133 requires the Company to recognize all derivatives, other than certain derivatives indexed tothe Company’s own stock, on the Consolidated Balance Sheet at fair value. Derivatives that are not designated as hedges must be adjusted to fair valuethrough earnings. If the derivatives are designated as a hedge, depending on the nature of the hedge, changes in the fair value of the derivatives willeither be offset against the change in fair value of the hedged item through earnings or recognized in accumulated other comprehensive loss until thehedged item is recognized in earnings. The ineffective portion of a derivative’s change in fair value is immediately recognized in earnings.
The Company accounted for the adoption of SFAS 133 as a change in accounting principle. Based on the Company’s outstanding derivatives at January 1, 2001, the Company recognized the cumulative effect of the accounting change as a loss in the Consolidated Income Statement ofapproximately $ 63 million, net of tax (basic and diluted loss per share of $ 0.06), and a reduction to equity of $ 41 million, in accumulated othercomprehensive loss.
Forward foreign exchange contracts are the primary instrument used to manage foreign exchange risk. Where forward foreign exchange contracts aredesignated as cash flow hedges under SFAS 133, changes in their fair value are recorded in accumulated other comprehensive loss until the hedgeditem is recognized in earnings. The Company also enters into forward foreign exchange contracts that serve as economic hedges of existing assets andliabilities. These are not designated as accounting hedges under SFAS 133 and, consequently, changes in their fair value are reported in earnings wherethey offset the translation gain or loss on the foreign currency denominated asset or liability.
To reduce its interest rate and currency exposure arising from its funding activities and to hedge specific assets, the Company uses interest rate andcurrency swaps. Where interest rate swaps are designated as fair value hedges, the changes in fair value of the swaps are recognized in earnings, asare the changes in the fair value of the underlying assets or liabilities. Where such interest rate swaps do not qualify for the short cut method as definedunder SFAS 133, any ineffectiveness is included in earnings. Where interest rate swaps are designated as cash flow hedges, their change in value isrecognized in accumulated other comprehensive loss until the hedged item is recognized in earnings.
All other swaps, futures, options and forwards that are designated as effective hedges of specific assets, liabilities or committed or forecastedtransactions are recognized in earnings consistent with the effects of the hedged transactions.
If an underlying hedged transaction is terminated early, the hedging derivative financial instrument is treated as if terminated simultaneously, with anygain or loss on termination of the derivative immediately recognized in earnings. Where derivative financial instruments have been designated as hedgesof forecasted transactions, and such forecasted transactions become probable of not occurring, hedge accounting ceases and any derivative gain orloss previously included in accumulated other comprehensive loss is reclassified into earnings.
Certain commercial contracts may grant rights to the Company or other counterparties, or contain other provisions considered to be derivatives underSFAS 133. Such embedded derivatives are assessed at inception of the contract and depending on their characteristics accounted for as separatederivative instruments pursuant to SFAS 133.
Sale-leasebacksThe Company periodically enters into transactions accounted for as sale-leasebacks, in which fixed assets, generally real estate and/or equipment, are sold to a third party and then leased for use by the Company. Under certain circumstances, the necessary criteria to recognize a sale of the assets may not occur, and the transaction is reflected as a financing transaction, with the proceeds received from the transaction reflected as a borrowing or as a deposit liability. When the necessary criteria have been met to recognize a sale, gains or losses on the sale of the assets are generally deferredand amortized over the term of the transaction, except in certain limited instances when a portion of the gain or loss may be recognized. The lease of the assets is accounted for as either an operating lease or a capital lease depending upon its specific terms, as required by Statement of FinancialAccounting Standards No.13, Accounting for Leases. By their nature, sale-leaseback transactions are generally highly structured and complextransactions, which therefore require detailed analyses to be made by the Company in determining the appropriate accounting treatment.
Insurance The following accounting policies apply specifically to the Insurance business. In December 2003, the Company has contracted to sell this business andconsequently has reflected the results of operations in loss from discontinued operations, net of tax, and the assets and liabilities in assets and liabilitiesheld for sale and in discontinued operations.
Premiums and acquisition costsPremiums are generally earned pro rata over the period coverage is provided. Premiums earned include estimates of certain premiums due, includingadjustments on retrospectively rated contracts. Premium receivables include premiums relating to retrospectively rated contracts that represent theestimate of the difference between provisional premiums received and the ultimate premiums due. Unearned premiums represent the portion ofpremiums written that is applicable to the unexpired terms of reinsurance contracts or certificates in force. These unearned premiums are calculated bythe monthly pro rata method or are based on reports from ceding companies. Acquisition costs are costs related to the acquisition of new business and renewals. These costs are deferred and charged against earnings ratably over the terms of the related policy.
(U.S. dollar amounts in millions, except per share amounts)
Note 2 Significant accounting policies, continued

ABB Group Financial review 2003 61
Profit commissionCertain contracts carry terms and conditions that result in the payment of profit commissions. Estimates of profit commissions are reviewed based onunderwriting experience to date and, as adjustments become necessary, such adjustments are reflected in discontinued operations.
Loss and loss adjustment expensesLoss and loss adjustment expenses are charged to operations as incurred. The liabilities for unpaid loss and loss adjustment expenses are determinedon the basis of reports from ceding companies and underwriting associations, as well as estimates by management and in-house actuaries, includingthose for incurred but not reported losses, salvage and subrogation recoveries. Inherent in the estimates of losses are expected trends of frequency,severity and other factors that could vary significantly as claims are settled. The Company estimates expected trends using actuarial methods widelyused in the insurance industry, such as the Bornhuetter-Ferguson method, utilizing the Company’s historically paid and incurred losses. Accordingly,ultimate losses could vary from the amounts provided for in these Consolidated Financial Statements.
FeesContracts that neither result in the transfer of insurance risk nor the reasonable possibility of significant loss to the reinsurer are accounted for asfinancing arrangements rather than reinsurance. Consideration received for such contracts is reflected as accounts payable, other, and is amortized ona pro rata basis over the life of the contract.
Funds withheldUnder the terms of certain reinsurance agreements, the ceding reinsurer retains a portion of the premium to provide security for expected losspayments. The funds withheld are generally invested by the ceding reinsurer and earn an investment return that becomes additional funds withheld.
ReinsuranceThe Company seeks to reduce the loss that may arise from catastrophes and other events that may cause unfavorable underwriting results byreinsuring certain levels of risks with other insurance enterprises or reinsurers. Reinsurance contracts are accounted for by reducing premiums earnedby amounts paid to the reinsurers. Recoverable amounts are established for paid and unpaid losses and loss adjustment expense ceded to thereinsurer. Amounts recoverable from the reinsurer are estimated in a manner consistent with the claim liability associated with the reinsurance policy.Contracts where it is not reasonably possible that the reinsurer may realize a significant loss from the insurance risk generally do not meet the conditionsfor reinsurance accounting and are recorded as deposits. The Company assesses probability of risks transferred in significant loss realization based on the terms in the reinsurance contract that impact the timing and amount of reimbursement under the contract and the present value of all cash flowswithout regard to how cash flows are characterized, in accordance with Statement of Financial Accounting Standards No.113, Accounting andReporting for Reinsurance of Short Duration and Long Duration Contracts.
Translation of foreign currencies and foreign exchange transactionsThe functional currency for most of the Company’s operations is the applicable local currency. The translation from the applicable functional currenciesinto the Company’s reporting currency is performed for balance sheet accounts using exchange rates in effect at the balance sheet date, and forincome statement accounts using average rates of exchange prevailing during the year. The resulting translation adjustments are excluded from thedetermination of earnings and are recognized in accumulated other comprehensive loss until the entity is sold, substantially liquidated or beingevaluated for impairment in anticipation of disposal.
Foreign currency exchange gains and losses, such as those resulting from foreign currency denominated receivables or payables, are included in thedetermination of earnings, except as they relate to intra-Company loans that are equity-like in nature with no reasonable expectation of repayment,which are recognized in accumulated other comprehensive loss.
In highly inflationary countries, monetary balance sheet positions in local currencies are converted into U.S. dollars at the year-end rate. Fixed assets arekept at historical U.S. dollar values from acquisition dates. Sales and expenses are converted at the exchange rates prevailing upon the date of thetransaction. All translation gains and losses from restatement of balance sheet positions are included in the determination of earnings.
TaxesThe Company uses the asset and liability method to account for deferred taxes. Under this method, deferred tax assets and liabilities are determinedbased on temporary differences between the financial reporting and the tax bases of assets and liabilities. Deferred tax assets and liabilities aremeasured using enacted tax rates and laws that will be in effect when the differences are expected to reverse. The deferred tax assets are reduced by avaluation allowance to reflect the amount that is more likely than not to be realized.
Generally, deferred taxes are not provided on the unremitted earnings of subsidiaries as it is expected that these earnings are permanently reinvested.Such earnings may become taxable upon the sale or liquidation of these subsidiaries or upon the remittance of dividends. Deferred taxes are provided insituations where the Company’s subsidiaries plan to make future dividend distributions.
Research and developmentResearch and development expense was $ 613 million, $ 547 million and $ 590 million in 2003, 2002 and 2001, respectively. These costs are includedin selling, general and administrative expenses.
(U.S. dollar amounts in millions, except per share amounts)
Note 2 Significant accounting policies, continued

62 ABB Group Financial review 2003
Earnings per shareBasic earnings (loss) per share is calculated by dividing income (loss) by the weighted-average number of shares outstanding during the year. Dilutedearnings per share is calculated by dividing income by the weighted-average number of shares outstanding during the year, assuming that all potentiallydilutive securities were exercised and that any proceeds from such exercises were used to acquire shares of the Company’s stock at the averagemarket price during the year or the period the securities were outstanding, if shorter. Potentially dilutive securities comprise: outstanding written calloptions, if dilutive; the securities issued under the Company’s management incentive plan, to the extent the average market price of the Company’sstock exceeded the exercise prices of such instruments; shares issuable in relation to outstanding convertible bonds, if dilutive; and outstanding writtenput options, for which net share settlement at average market price of the Company’s stock was assumed, if dilutive (see Notes 22 and 24).
Stock-based compensationThe Company has a management incentive plan under which it offers stock warrants to key employees for no consideration. The plan is described morefully in Note 22. The Company accounts for the warrants using the intrinsic value method of APB Opinion No. 25 (APB 25), Accounting for Stock Issuedto Employees, as permitted by Statement of Financial Accounting Standards No. 123 (SFAS 123), Accounting for Stock Based Compensation. Allwarrants were issued with exercise prices greater than the market prices of the stock on the dates of grant. Accordingly, the Company has recorded nocompensation expense related to the warrants, except in circumstances when a participant ceases to be employed by a consolidated subsidiary, suchas after a divestment by the Company. The following table illustrates the effect on net income and earnings per share (see Note 24) if the Company hadapplied the fair value recognition provisions of SFAS 123 to stock-based employee compensation. Fair value of the warrants was determined on thedate of grant by using the Binomial option model (see Note 22).
Year ended December 31, 2003 2002 2001
Net loss, as reported $ (767) $ (783) $ (729)Less: Total stock-based employee compensation expense determined under fair value based method for all awards, net of related tax effects (11) (22) (22)Pro forma net loss $ (778) $ (805) $ (751)
Earnings per share:Basic – as reported $ (0.63) $ (0.70) $ (0.64)Basic – pro forma $ (0.64) $ (0.72) $ (0.66)
Diluted – as reported $ (0.63) $ (0.83) $ (0.64)Diluted – pro forma $ (0.64) $ (0.85) $ (0.66)
New accounting pronouncementsIn June 2001, the Financial Accounting Standards Board issued Statement of Financial Accounting Standards No. 141, Business Combinations, andSFAS142 which modified the accounting for business combinations, goodwill and identifiable intangible assets. All business combinations initiated afterJune 30, 2001, must be accounted for by the purchase method. Goodwill from acquisitions completed after that date is not amortized, but charged to operations when specified tests indicate that the goodwill is impaired, that is, when the goodwill’s fair value is lower than its carrying value. Certainintangible assets are recognized separately from goodwill, and are amortized over their useful lives. During 2002, all goodwill was required to be tested for impairment as of January 1, 2002, with a transition adjustment recognized for any impairment identified. The Company determined that noimpairment of goodwill existed at January 1, 2002. All goodwill amortization also ceased at that date. The Company recognized goodwill amortizationexpense in continuing operations of $ 148 million in 2001, and goodwill amortization expense in discontinued operations of $ 43 million in 2001.Accordingly, income from continuing operations in 2001 would have been $ 319 million ($ 0.28 per share), loss from discontinued operations in 2001would have been $ 794 million ($ 0.70 per share) and net loss in 2001 would have been $ 538 million ($ 0.48 per share) if the Company had notrecognized amortization expense for goodwill that is no longer being amortized in accordance with SFAS 142.
In June 2001, the Financial Accounting Standards Board issued Statement of Financial Accounting Standards No.143 (SFAS 143), Accounting forAsset Retirement Obligations, which is effective for fiscal years beginning after June 15, 2002, and requires that the fair value of a legal obligationassociated with the retirement of tangible long-lived assets be recognized in the period in which it is incurred. The associated asset retirement costs arecapitalized as part of the carrying amount of the asset and allocated to expense over its useful life. The Company adopted SFAS 143 effective January 1,2003. The adoption of SFAS 143 did not have a material impact on the Company’s results of operations.
In August 2001, the Financial Accounting Standards Board issued SFAS 144. This Statement supersedes SFAS 121, while retaining many of itsrequirements regarding impairment loss recognition and measurement. In addition, the new Statement broadens the presentation of discontinuedoperations to include more sold and abandoned businesses. The Company adopted this statement effective January 1, 2002, and, as a result, reflectedthe assets, liabilities and results of operations of several businesses and groups of assets as discontinued operations for all periods presented to theextent these businesses and groups of assets met the new criteria during 2003 and 2002. Disposals and abandonments in previous years were not re-evaluated or reclassified.
In April 2002, the Financial Accounting Standards Board issued Statement of Financial Accounting Standards No. 145, Rescission of FASB StatementsNo. 4, 44 and 64, Amendment of FASB Statement No. 13, and Technical Corrections, which rescinds previous requirements to reflect all gains andlosses from debt extinguishment as extraordinary. The Company elected to early adopt the new standard effective April 1, 2002, and, as a result, thegains from extinguishment of debt of $ 12 million recorded as extraordinary items in 2001, are no longer reflected as extraordinary items.
(U.S. dollar amounts in millions, except per share amounts)
Note 2 Significant accounting policies, continued

ABB Group Financial review 2003 63
In June 2002, the Financial Accounting Standards Board issued Statement of Financial Accounting Standards No. 146 (SFAS 146), Accounting forCosts Associated with Exit or Disposal Activities, which requires that a liability for a cost associated with an exit or disposal activity be recognized whenthe liability is incurred. The standard became effective January 1, 2003 and was applied to restructuring activities initiated after that date. Prior toJanuary 1, 2003, the Company accounted for restructuring activities in accordance with Emerging Issues Task Force No. 94-3, Liability Recognition forCertain Employee Termination Benefits and Other Costs to Exit an Activity (Including Certain Costs Incurred in a Restructuring). The adoption of SFAS146 did not have a material impact on the Company’s financial position or results of operations.
In November 2002, the Financial Accounting Standards Board issued Interpretation No. 45 (FIN 45), Guarantor’s Accounting and DisclosureRequirements for Guarantees, Including Indirect Guarantees of Indebtedness of Others. FIN 45 requires the guarantor to recognize a liability for thenon-contingent component of a guarantee; that is, the obligation to stand ready to perform in the event that specified triggering events or conditionsoccur. The initial measurement of this liability is the fair value of the guarantee at its inception. The recognition of the liability is required even if it is notprobable that payments will occur under the guarantee or if the guarantee was issued with a premium payment or as part of a transaction with multipleelements. FIN 45 also requires additional disclosures related to guarantees. The Company adopted the disclosure requirements of FIN 45 onDecember 31, 2002. The recognition and measurement provisions of FIN 45 are effective for all guarantees entered into or modified after December31, 2002. The Company adopted the recognition and measurement requirements of FIN 45 on January 1, 2003. The adoption of the recognition andmeasurement requirements of FIN 45 did not have a material impact on the Company’s financial position or results of operations.
In November 2002, the Emerging Issues Task Force of the Financial Accounting Standards Board issued Emerging Issues Task Force No. 00-21 (EITF00-21), Accounting for Revenue Arrangements with Multiple Deliverables, which was amended in January 2003 and requires that (a) revenue shouldbe recognized separately for separate units of accounting in multiple deliverables arrangements, (b) revenue for a separate unit of accounting should berecognized only when the arrangement consideration is reliably measurable and the earnings process is substantially complete, and (c) considerationshould be allocated among the separate units of accounting based on their relative fair value. EITF 00-21 is applicable to transactions entered into afterJune 30, 2003. The adoption of EITF 00-21 did not have a material impact on the Company’s financial position, or results of operations.
In December 2002, the Financial Accounting Standards Board issued Statement of Financial Accounting Standards No. 148 (SFAS 148), Accountingfor Stock-Based Compensation – Transition and Disclosure. An Amendment of FASB Statement No.123. The Company has elected to continue withits current practice of applying the recognition and measurement principles of APB No. 25, Accounting for Stock Issued to Employees, as permitted bySFAS 148. The Company has adopted the disclosure requirements of SFAS 148 effective December 31, 2002.
In January 2003, the Financial Accounting Standards Board issued Interpretation No. 46 (FIN 46), Consolidation of Variable Interest Entities – anInterpretation of ARB No. 51. FIN 46 requires variable interest entities (VIEs) to be consolidated by their primary beneficiaries. During 2003, theCompany adopted the requirements of FIN 46 and applied the guidance to VIEs in which the Company has an interest. See Note 8 for informationrelating to the impact of adopting FIN 46. FIN 46 was revised in December 2003. The Company will adopt the December revision (FIN 46R) by March2004. The Company continues to evaluate the effects of the adoption of FIN 46R and does not expect such effects to be material to the Company’sfinancial position or results of operations.
In May 2003, the Financial Accounting Standards Board issued Statement of Financial Accounting Standards No. 150 (SFAS 150), Accounting forCertain Financial Instruments with Characteristics of both Liabilities and Equity. SFAS 150 establishes how an issuer classifies and measures certainfinancial instruments with characteristics of both liabilities and equity. This statement requires that an issuer classify a financial instrument that is withinthe scope of the statement as a liability. SFAS 150 applies to all financial instruments entered into after May 31, 2003, and otherwise became effectivefor the Company after June 15, 2003. In November 2003, SFAS 150 was amended to indefinitely defer the measurement and recognition guidance for non-controlling interests that are classified as equity in a subsidiary of the Company, but that would be classified as a liability in the parent’s financialstatements under SFAS 150. However, SFAS 150, as amended, provides guidance on classification and disclosure of mandatorily redeemable non-controlling interests. The Company has adopted the measurement, classification and disclosure criteria of SFAS 150, as amended. The adoption of SFAS 150 did not have a material impact on the Company’s financial position, or results of operations.
In May 2003, the Emerging Issues Task Force of the Financial Accounting Standards Board reached a consensus on Emerging Issues Task Force No. 03-4 (EITF 03-4), Determining the Classification and Benefit Attribution Method for a “Cash Balance” Plan. EITF 03-4 clarifies that a cash balanceplan, as defined by the guidance, should be accounted for as a defined benefit plan using the traditional unit credit attribution method. The Companyadopted EITF 03-4 in May 2003. As a result, the Company accounts for certain of its pension plans in Switzerland as cash balance plans in accordancewith EITF 03-4. The adoption of EITF 03-4 reduced the unfunded amounts of the Company’s Swiss pension plans by approximately $ 406 million butdid not have a material impact on the Company’s financial position at December 31, 2003, or on its results of operations for the year then ended.
Note 3 Discontinued operationsIn November 2002, the Company completed the sale of most of its Structured Finance business to General Electric Capital Corporation (GE) andreceived cash proceeds of approximately $ 2.0 billion, including a contingent payment of $ 20 million to be released to the Company should amountsultimately collected by GE, from a portfolio transferred by the Company to GE, reach specified targets. The $ 20 million contingent payment remainsunpaid at December 31, 2003 as the amounts collected by GE to date have not met such specified targets. The Company’s Structured Financebusiness had revenues of $ 262 million and $ 220 million in 2002 and 2001, respectively, and a net loss of $ 183 million in 2002 and net income of $ 8 million in 2001. The 2002 net loss of $183 million recorded in loss from discontinued operations, net of tax, included a $ 146 million loss ondisposal, loss from operations of $ 22 million and the allocation of interest expense of $ 15 million in accordance with EITF 87-24. The loss on disposalof $ 146 million was principally comprised of asset write-downs of $ 15 million, goodwill and other intangible write-offs of $ 2 million, transaction costsof $ 27 million, the fair value for GE’s right to require the Company to repurchase certain designated assets of $ 38 million, capital tax expenseassociated with the disposal of $ 10 million and an accumulated foreign currency translation loss of $ 54 million.
Pursuant to the sale and purchase agreement, the Company provided GE with cash collateralized letters of credit aggregating $ 202 million as securityfor certain performance-related obligations retained by the Company, of which approximately $ 128 million were outstanding at December 31, 2003.The remaining cash collateralized letters of credit will further be reduced as the performance-related obligations by the Company expire.
(U.S. dollar amounts in millions, except per share amounts)
Note 2 Significant accounting policies, continued

64 ABB Group Financial review 2003
The sale and purchase agreement provided GE the option to require the Company to repurchase certain designated financial assets transferred to GEupon the occurrence of certain events, but in any event no later than February 1, 2004. The fair value of GE’s right to require the Company to repurchasethese designated assets was $ 11 million at December 31, 2003. On January 26, 2004, the Company repurchased the financial assets for an amount of approximately $ 28 million. Additionally, as a result of the exercise of GE’s option, the cash collateralized letters of credit were reduced by $ 35 million.No further obligation exists for the Company to repurchase any assets under the sale and purchase agreement with GE.
As a continuation of the Company’s divestment of its Structured Finance business, the Company completed the sale of ABB Export Bank in December2003 for approximately $ 50 million. ABB Export Bank had revenues of $ 9 million, $ 17 million and $ 29 million in 2003, 2002 and 2001, respectively,and a net loss of $ 9 million in 2003 and net income of $ 10 million and $ 6 million in 2002 and 2001, respectively. The 2003 net loss of $ 9 million in lossfrom discontinued operations, net of tax, includes a $ 12 million loss on disposal, income from operations of $ 6 million and the allocation of interestexpense of $ 3 million in accordance with EITF 87-24. The loss on disposal of $ 12 million was principally comprised of an asset write-down of $ 20 million, transaction costs of $ 1 million, capital tax expense associated with the disposal of $ 4 million offset by an accumulated foreign currencytranslation gain of approximately $ 13 million.
In December 2002, in connection with the Company’s divestment strategy to focus on its core power and automation technology businesses, theCompany completed the sale of its Metering business to Ruhrgas Industries GmbH of Essen, Germany, for $ 223 million, including $ 15 million heldin escrow until certain disputed items were resolved. The cash held in escrow was released after the resolution of these items in 2003. The Meteringbusiness sold to Ruhrgas Industries GmbH had revenues of $ 372 million and $ 448 million in 2002 and 2001, respectively, and a net loss of $ 54 millionin 2002 and net income of $ 14 million in 2001. The 2002 net loss of $ 54 million recorded in loss from discontinued operations, net of tax, included a $ 48 million loss on disposal, loss from operations of $ 3 million and the allocation of interest expense of $ 3 million in accordance with EITF 87-24. Theloss on disposal of $ 48 million for the sold business was principally comprised of goodwill and other intangible write-offs of $ 65 million, transactioncosts and other provisions of $ 46 million, capital tax expense associated with the disposal of $ 21 million and an accumulated foreign currencytranslation loss of $ 35 million, offset in part by a gain of $ 119 million, being the difference between the proceeds received and net assets of thebusiness.
In December 2002, the Company’s Board of Directors approved management’s plans to sell the Company’s Oil, Gas and Petrochemicals businesses. The disposal is in line with the Company’s strategy to focus on its core power and automation technology businesses. In January 2004, the Companyagreed to sell most of the upstream part of the Oil, Gas and Petrochemicals businesses (Upstream business) to a consortium consisting of CandoverPartners Limited, JP Morgan Partners LLC and 3i Group PLC (collectively, the Purchasers) for an initial purchase price of $ 925 million plus a potentialdeferred consideration of up to $ 50 million. The initial purchase price of $ 925 million is subject to adjustments based on, among other things, the netassets of the Upstream business at closing and further potential adjustments that will be calculated at closing. Additionally, the initial purchase price will bereduced by $ 85 million to reflect the unfunded benefit liabilities of pension plan obligations assumed by the Purchasers. The $ 85 million reduction of thepurchase price may increase or decrease based on the actual unfunded benefit liability calculated at closing, in accordance with the terms of the purchaseagreement. Furthermore, the initial purchase price will be increased or decreased based on the net intercompany balance between the Company and theUpstream business at closing. The potential deferred consideration of up to $ 50 million can be realized by the Company if the Upstream business meetsspecified earnings targets in 2004. The Company does not expect a significant gain or loss to be recognized on the sale of the Upstream business.
The remaining part of the Oil, Gas and Petrochemicals businesses (remaining OGP businesses) is available for immediate sale and continues to beactively marketed. It is unlikely that significant changes to the divestment strategy will be made or that the plan to divest the remaining OGP businesseswill be withdrawn in the future. Management anticipates divesting this business in 2004.
Accordingly, the results of the Oil, Gas and Petrochemical businesses are presented as discontinued operations for all periods presented. The Oil, Gasand Petrochemical businesses had revenues of $ 3,374 million, $ 3,854 million and $ 3,478 million in 2003, 2002 and 2001, respectively and net lossesof $ 496 million and $ 127 million in 2003 and 2002, respectively, and net income of $ 9 million in 2001. The Upstream business recorded revenues ofapproximately $ 1,499 million, $ 1,535 million and $ 1,468 million in 2003, 2002 and 2001, respectively, and had a net income of $ 4 million, $ 98 millionand $ 93 million in 2003, 2002 and 2001, respectively. The 2003 net income of $ 4 million included $ 44 million of costs associated with the future sale of the Upstream business and $ 13 million of allocated interest expense in accordance with EITF 87-24. The remaining OGP businesses had revenuesof $ 1,875 million, $ 2,319 million and $ 2,010 million in 2003, 2002 and 2001, respectively, and had net losses of $ 500 million, $ 225 million and $ 84million in 2003, 2002 and 2001, respectively. During 2003, the Company recorded a valuation allowance on deferred tax assets of approximately $ 120 million related to the remaining OGP businesses, as the Company determined it was more likely than not that such deferred tax assets would notbe realized.
In December 2003, the Company agreed to sell its Reinsurance business to White Mountains Insurance Group Limited, a Bermuda-based insuranceholding company, for a cash price of 3,220 million Swedish krona, (approximately $ 425 million). The disposal is in line with the Company’s strategy tofocus on its core power and automation technology businesses. The Reinsurance business had revenues of $ 782 million, $ 644 million and $ 933million in 2003, 2002 and 2001, respectively. The Reinsurance business had a net loss of $ 97 million in 2003, net income of $ 22 million in 2002, and anet loss of $ 336 million in 2001. The 2003 net loss of $ 97 million recorded in loss from discontinued operations, net of tax, includes a $ 154 millionimpairment charge, income from operations of approximately $ 72 million and an allocation of interest of $ 15 million in accordance with EITF 87-24. Theimpairment charge recorded from the anticipated disposal of the Reinsurance business of $ 154 million was principally comprised of an asset write-down of $ 48 million, goodwill and other intangible write-offs of $ 89 million, expected selling costs of $ 25 million, deferred tax write-offs of approxi-mately $ 16 million, offset in part by an accumulated foreign currency translation gain of $ 24 million.
As a consequence of the planned sale of the Reinsurance business, insurance reserves of $ 1,871 million and $ 2,014 million at December 31, 2003and 2002, respectively, were included in liabilities held for sale and in discontinued operations. Through December 2001, the Company recorded theseinsurance reserves on a discounted basis. As the amount and timing of the ceded claims payments could not be reliably determined at December 31,2001, the Company could no longer discount its loss reserves. Accordingly, at December 31, 2003 and 2002, the insurance reserves were notpresented on a discounted basis. In 2001, a charge of $ 295 million was recorded due to the elimination of the effect of discounting.
(U.S. dollar amounts in millions, except per share amounts)
Note 3 Discontinued operations, continued

ABB Group Financial review 2003 65
In December 2003, the Company sold a portion of its Wind Energy business in Germany to GI Ventures AG of Munich, Germany, for proceeds ofapproximately $ 35 million including a vendor note of approximately $ 10 million. The Wind Energy business was no longer a core business and itsdivestment was part of the Company’s ongoing divestment strategy. The Wind Energy business, which began operations in 2002, had revenues of $ 16 million and $ 48 million and net losses of $ 42 million and $ 1 million in 2003 and 2002, respectively. The 2003 net loss of $ 42 million recorded inloss from discontinued operations, net of tax, was comprised principally of a $ 25 million loss from disposal (net of a tax benefit of $ 10 million), assetwrite-downs of $ 9 million and a loss from operations of $ 8 million.
In December 2003, the Company agreed to sell its MDCV cable business based in Germany to the Wilms Group of Menden, Germany. This business,no longer pursued for strategic reasons, was part of the Power Technologies division. It had revenues of $ 74 million, $ 78 million and $ 60 million andhad net losses of $ 24 million, $ 1 million and $ 5 million in 2003, 2002 and 2001, respectively. The 2003 net loss of $ 24 million recorded in loss fromdiscontinued operations, net of tax, was comprised principally of asset write-downs of $ 10 million and a loss from operations of $ 14 million.
Loss from discontinued operations, net of tax, also includes costs related to the Company’s potential asbestos obligation of the Company’s U.S.subsidiary, Combustion Engineering Inc., of approximately $ 145 million, $ 420 million and $ 470 million in 2003, 2002 and 2001, respectively (see Note 18).
Loss from discontinued operations, net of tax, also includes other abandoned and/or sold assets, resulting in net losses of $ 8 million, $ 104 million, and$ 63 million in 2003, 2002 and 2001, respectively.
Operating results of the discontinued businesses are summarized as follows:
Year ended December 31, 2003 2002 2001
Revenues $ 4,284 $ 5,390 $ 5,393Costs and expenses, finance loss (4,896) (5,963) (6,181)Loss before taxes and minority interest (612) (573) (788)Tax expense (218) (50) (15)Minority interest 14 (41) (34)Net loss from discontinued operations (816) (664) (837)Loss from dispositions, net of a tax benefit of $ 6 million andtax expense of $ 31 million in 2003 and 2002, respectively (37) (194) –Loss from discontinued operations, net of tax $ (853) $ (858) $ (837)
The components of assets and liabilities held for sale and in discontinued operations are summarized as follows:
December 31, 2003 2002
Cash and equivalents $ 431 $ 435Marketable securities 1,625 1,554Receivables, net 2,626 3,326Inventories, net 337 513Prepaid expenses and other 224 219Financing receivables, non-current 52 238Goodwill and Other intangible assets 609 664Property, plant and equipment, net 241 212Other assets 282 338Assets held for sale and in discontinued operations $ 6,427 $ 7,499Accounts payable $ 2,095 $ 2,693Short-term borrowings and current maturities of long-term borrowings 23 50Accrued liabilities and other 2,324 2,588Long-term borrowings 47 18Other liabilities 611 617Liabilities held for sale and in discontinued operations $ 5,100 $ 5,966
Included above are the assets and the liabilities held for sale from the Building Systems businesses of approximately $ 81 million and $ 42 million,respectively, at December 31, 2003 and $ 440 million and $ 455 million, respectively, at December 31, 2002. In accordance with SFAS 144, certainBuilding Systems businesses met the criteria for the classification of assets as held for sale, but did not meet the additional criteria for its results ofoperations to be classified as discontinued operations (see Note 4).
At December 31, 2003 and 2002, the Consolidated Balance Sheets included $ 79 million and $ 60 million of pledged cash balances, respectively.Approximately $ 44 million and $ 60 million related to the Company’s insurance operations and $ 8 million and $ 0 million related to the Oil, Gas andPetrochemicals business and, as such, were included in assets held for sale and in discontinued operations in 2003 and 2002, respectively.
(U.S. dollar amounts in millions, except per share amounts)
Note 3 Discontinued operations, continued

66 ABB Group Financial review 2003
Entrelec GroupIn June 2001, the Company completed the acquisition, through an open-market tender, of Entrelec Group, a France-based supplier of industrialautomation and control products operating in 17 countries. The Company’s Consolidated Financial Statements include Entrelec’s result of operationssince June 20, 2001, the transaction closing date.
The cash purchase price of the acquisition was approximately $ 284 million. The excess of the purchase price over the fair value of the assets acquiredtotaled $ 294 million and has been recorded as goodwill. The transaction has been accounted for as a purchase. Included in the purchase priceallocation was an amount of $ 21 million for a restructuring of the business.
b-business partners B.V.In June 2000, the Company entered into a share subscription agreement to acquire an interest in b-business partners B.V., which at December 31,2003 remains at a four percent interest. The Company is committed to provide additional capital to b-business partners B.V. of $ 5 million. Further, b-business partners B.V. retains a put right to compel the Company to purchase 150,000 shares of b-business partners B.V. at a cost of approximately$ 19 million.
Other acquisitions and investmentsDuring 2003, 2002, and 2001, the Company invested $ 55 million, $ 154 million and $ 179 million, respectively, in 24, 32 and 60 new businesses, jointventures or affiliated companies. Of these transactions, 1, 6 and 10, respectively, represented acquisitions accounted for as purchases and accordingly,the results of operations of the acquired businesses have been included in the Company’s Consolidated Financial Statements from the respectiveacquisition dates. The aggregate purchase price of these acquisitions during 2003, 2002 and 2001 was $ 1 million, $ 55 million and $ 45 million,respectively. The aggregate excess of the purchase price over the fair value of the net assets acquired totaled $ 2 million, $ 93 million and $ 29 million, in 2003, 2002 and 2001, respectively, and has been recorded as goodwill. Assuming these acquisitions had occurred on the first day of the year prior to their purchase, the pro forma Consolidated Income Statement for those years would not have materially differed from reported amounts either on an individual or an aggregate basis.
Other divestituresIn addition to the sold businesses described under discontinued operations, the Company periodically divests businesses and investments notconsidered by management to be aligned with its focus on power and automation technologies. The results of operations of these divested businessesare included in the Company’s Consolidated Income Statement in the respective line items of income from continuing operations, through the date ofdisposition.
Divestment of Building Systems businessesIn April 2002, the Company decided to dispose of its Building Systems businesses. The gradual disposal process was envisaged to extend over a non-defined period of time preceded by restructurings in several locations. The disposal of the Building Systems businesses contemplated that theCompany would retain an involvement in the disposed operations through a combination of technology license agreements, supplier relationships,retention of certain orders and participation in the Board of Directors of some of the disposed of companies. As a result of these factors, the Companyconcluded that classification of the Building Systems businesses as discontinued operations according to SFAS 144 was not appropriate. The results of operations of these businesses and the results from the disposal of each disposed of business are reported in the Company’s Consolidated IncomeStatement within continuing operations, through the date of disposition.
In August 2003, the Company completed the sale of its Building Systems businesses located in Sweden, Norway, Denmark, Finland, Russia and theBaltics to YIT Corporation of Helsinki, Finland, for consideration of approximately $ 213 million. The Company recognized a net gain on disposal of $ 124 million, which is included in other income (expense), net.
In 2003, the Company completed the sale of its Building Systems businesses located in several other countries, principally Belgium, the Netherlands,Austria, and the UK for aggregate proceeds of approximately $ 21 million. The Company recognized a net loss on disposal of $ 41 million, which isincluded in other income (expense), net.
In February 2004, the Company signed an agreement to sell its Building Systems business located in Switzerland to CapVis Equity Partners AG, aSwiss private equity company, for a purchase price of approximately $ 39 million. During 2003, the Company recorded no impairment charge on thisbusiness, based on the estimated sales price of the business. The Company has retained a 10 percent ownership interest and anticipates a net gain ondisposal of approximately $ 3 million.
Divestment of Air Handling businessIn January 2002, the Company sold its Air Handling business to Global Air Movement (Luxembourg) SARL for proceeds of $ 147 million, including avendor note of $ 34 million issued by the purchaser. The Company recognized a net gain on disposal of $ 74 million, which is included in other income(expense), net.
Other divestituresIn June 2003, the Company sold its interests in certain equity investees in Australia for approximately $ 90 million, resulting in a gain on disposal of $ 28 million recorded in other income (expense), net.
In June 2003, the Company sold its entire 35 percent interest in Swedish Export Credit Corporation to the Government of Sweden for 1,240 millionSwedish krona, resulting in net proceeds of approximately $ 149 million and a loss on disposal of $ 80 million recorded in other income (expense), net.
(U.S. dollar amounts in millions, except per share amounts)
Note 4 Business combinations and other divestments

ABB Group Financial review 2003 67
During 2003, 2002 and 2001, the Company sold several operating units and investments for total proceeds of $ 31 million, $ 209 million and $ 117 million, respectively, and recognized net gains on disposal of $ 12 million, $ 24 million and $ 34 million, respectively, which are included in otherincome (expense), net. Net income from these businesses and investments was not significant in 2003, 2002 and 2001.
Note 5 Marketable securitiesMarketable securities consist of the following:
December 31, 2003 2002
Trading $ 1 $ 48Available-for-sale 455 532Securities serving as hedges of the Company’s management incentive plan (see Note 22) 17 9Total $ 473 $ 589
To hedge its exposure to fluctuations in fair value of certain of the Company’s warrant appreciation rights (WARs) issued under the Company’smanagement incentive plan, the Company purchases cash-settled call options, which entitle the Company to receive amounts equivalent to itsobligations under the outstanding WARs. In accordance with Emerging Issues Task Force No.00-19 (EITF 00-19), Accounting for Derivative FinancialInstruments Indexed to, and Potentially Settled in, a Company’s Own Stock, the cash-settled call options have been recorded as assets measured at fair value, with subsequent changes in fair value recorded through earnings as an offset to the compensation expense recorded in connection withthe WARs.
Available-for-sale securities classified as marketable securities consist of the following:
Unrealized Unrealized FairCost gains losses value
At December 31, 2003:
Equity securities $ 76 $ 25 $ (1) $ 100Debt securities:
U.S. government obligations 71 2 (1) 72European government obligations 29 1 (1) 29Corporate 5 – – 5Other 228 21 – 249
Total debt securities 333 24 (2) 355Total $ 409 $ 49 $ (3) $ 455
At December 31, 2002:
Equity securities $ 96 $ 2 $ (26) $ 72Debt securities:
U.S. government obligations 61 3 – 64European government obligations 23 1 (1) 23Corporate 28 1 – 29Other 326 18 – 344
Total debt securities 438 23 (1) 460Total $ 534 $ 25 $ (27) $ 532
At December 31, 2003, contractual maturities of the above available-for-sale debt securities consist of the following:
FairCost value
Less than one year $ 181 $ 181One to five years 19 19Six to ten years 30 31Due after ten years 103 124Total $ 333 $ 355
Gross realized gains on available-for-sale securities were $ 8 million, $ 11 million and $ 22 million in 2003, 2002 and 2001, respectively. Gross realizedlosses on available-for-sale securities were $ 2 million, $ 9 million and $ 9 million in 2003, 2002 and 2001, respectively. Additionally, in 2003 and 2002,the Company recorded charges of $ 36 million and $ 6 million, respectively, related to the impairment of available-for-sale securities. These charges areincluded in interest and other finance expense and other income (expense), net, respectively.
(U.S. dollar amounts in millions, except per share amounts)
Note 4 Business combinations and other divestments, continued

68 ABB Group Financial review 2003
The following table reflects gross unrealized losses and the fair value of those available-for-sale securities, aggregated by investment category, that atDecember 31, 2003, have been in a continuous unrealized loss position. These securities have been in a continuous unrealized loss position for lessthan 12 months. The Company has no available-for-sale securities that have been in a continuous unrealized loss position for 12 months or more.
UnrealizedDescription of securities Fair value losses
Equity securities $ 3 $ (1)US government obligations 56 (1)European government obligations 24 (1)
$ 83 $ (3)
Unrealized losses on equity and debt securities held and classified as available-for-sale are judged to be only temporary based on the creditworthinessof the obligors as it relates to debt securities and as it relates to all securities held, the financial position of the underlying companies, the significance ofthe unrealized losses relative to the asset cost and the duration that the securities have been in an unrealized loss position.
At December 31, 2002, investments and other included $ 77 million of available-for-sale securities, which were strategic investments. In 2002, netunrealized losses of $ 42 million on these investments were included in accumulated other comprehensive loss. In 2003, these investments were soldresulting in realized losses of $ 40 million, which is recorded in interest and other finance expense.
At December 31, 2002, the Company contributed a portfolio of available-for-sale securities to a pension trust in Sweden at its then fair value of $ 260million. In connection with this transfer, the Company recognized the related cumulative net loss of $ 27 million in interest and other finance expense.
The net change in unrealized gains and losses in fair values of trading securities was not significant in 2003, 2002 or 2001.
At December 31, 2003 and 2002, the Company pledged $ 41 million and $ 15 million, respectively, of marketable securities as collateral for issuedletters of credit, insurance contracts or other security arrangements.
Note 6 Financial instruments
Cash flow hedgesThe Company enters into forward foreign exchange contracts to manage the foreign exchange risk of its operations. To a lesser extent the Companyalso uses commodity contracts to manage its commodity risks. Where such instruments are designated and qualify as cash flow hedges, the changesin their fair value are recorded in accumulated other comprehensive loss, until the hedged item is recognized in earnings. At such time, the respectiveamount in accumulated other comprehensive loss is released to earnings and is shown in either revenues or cost of sales consistent with theclassification of the earnings impact of the underlying transaction being hedged. Any hedge ineffectiveness is included in revenues and cost of sales butis not significant for 2003 and 2002.
During 2003 and 2002, the amount of derivative financial instrument net gains or losses reclassified from accumulated other comprehensive loss to earnings were net gains of $ 58 million for 2003 and net losses of $ 4 million for 2002. It is anticipated that during 2004, $ 75 million of the amountincluded in accumulated other comprehensive loss at December 31, 2003, which represents gains on derivative financial instruments, will bereclassified to earnings when the underlying hedged transaction impacts earnings. Derivative financial instrument gains and losses reclassified toearnings offset the losses and gains on the items being hedged.
While the Company’s cash flow hedges are primarily hedges of exposures over the next twelve months, the amount included in accumulated othercomprehensive loss at December 31, 2003 includes hedges of certain exposures maturing up to 2007.
Fair value hedgesTo reduce its interest rate and forreign currency exposure arising primarily from its funding activities, the Company uses interest rate and cross-currencyswaps. Where such instruments are designated as fair value hedges, the changes in fair value of these instruments, as well as the changes in fair valueof the underlying liabilities, are recorded as offsetting gains and losses in the determination of earnings. The amount of hedge ineffectiveness was $ 11 million in 2003 and was not significant in 2002.
Disclosure about fair values of financial instrumentsThe Company uses the following methods and assumptions in estimating fair values for financial instruments:
Cash and equivalents, receivables, accounts payable, short-term borrowings and current maturities of long-term borrowings: The carrying amountsreported in the Consolidated Balance Sheet approximate the fair values.
Marketable securities: Fair values are based on quoted market prices, where available. If quoted market prices are not available, fair values are based on quoted market prices of comparable instruments.
Financing receivables and loans (non-current portion): Fair values are determined using a discounted cash flow methodology based upon loan rates of similar instruments. The carrying values and estimated fair values of long-term loans granted at December 31, 2003 were $ 434 million and $ 421 million, respectively, and at December 31, 2002 were $ 629 million and $ 517 million, respectively.
Long-term borrowings (non-current portion): Fair values are based on the present value of future cash flows discounted at estimated borrowing rates forsimilar debt instruments or in the case of bond or note issuances, using the relevant borrowing rates derived from interest rate swap curves. Such swapcurves are interest rates quoted by market participants for the relevant maturities, excluding any component associated with credit risk of counterparties.
(U.S. dollar amounts in millions, except per share amounts)
Note 5 Marketable securities, continued

ABB Group Financial review 2003 69
As these bonds or note issuances reflect liabilities of the Company, if the Company’s credit rating was reflected in these discount rates, the present valuecalculation would result in a lower fair value liability. The carrying values and estimated fair values of long-term borrowings at December 31, 2003 were $ 6,290 million and $ 6,936 million, respectively, and at December 31, 2002 were $ 5,358 million and $ 5,763 million, respectively.
Derivative financial instruments: Fair values are the amounts by which the contracts could be settled. These fair values are estimated by using adiscounted cash flow methodology based on available market data, option pricing models or by obtaining quotes from brokers. At December 31, 2003and 2002, the carrying values equal fair values. The fair values are disclosed in Notes 10 and 16.
Note 7 ReceivablesReceivables consist of the following:
December 31, 2003 2002
Trade receivables $ 3,481 $ 3,164Other receivables 1,229 1,286Allowance (250) (210)
4,460 4,240Unbilled receivables, net:
Costs and estimated profits in excess of billings 1,706 1,594Advance payments received (829) (700)
877 894Total $ 5,337 $ 5,134
Trade receivables include contractual retention amounts billed to customers of $ 85 million and $ 129 million at December 31, 2003 and 2002,respectively. Management expects the majority of related contracts will be completed and substantially all of the billed amounts retained by thecustomer will be collected within one year of the respective balance sheet date. Other receivables consist of V.A.T., claims, employee and customerrelated advances, the current portion of direct finance and sales-type leases and other non-trade receivables, including the retained interests on soldreceivables under the Company’s securitization programs.
Costs and estimated profits in excess of billings represent sales earned and recognized under the percentage-of-completion method. Amounts areexpected to be collected within one year of the respective balance sheet date.
During 2003 and 2002, the Company sold trade receivables to two separate QSPEs, unrelated to the Company, in revolving-period securitizations. The Company retains servicing responsibility relating to the sold receivables. Solely for the purpose of credit enhancement from the perspective of the QSPEs, the Company retains an interest in the sold receivables (retained interests). These retained interests are initially measured at estimated fairvalues, which the Company believes approximate historical carrying values, and are subsequently measured based on a periodic evaluation ofcollections and delinquencies.
Given the short-term, lower-risk nature of the assets securitized, market movements in interest rates would not significantly impact the carrying value ofthe Company’s retained interests. An adverse movement in foreign currency rates could have an impact on the carrying value of these retained interestsas the retained interests are denominated in the original currencies underlying the sold receivables. While such remeasurements are recognized inearnings, the impact has historically not been significant due to the short-term nature of the receivables and economic hedges in place relating to foreigncurrency movement risk.
The Company routinely evaluates its portfolio of trade receivables for risk of non-collection and records an allowance for doubtful debts to reflect thecarrying value of its trade receivables at estimated net realizable value. Pursuant to the requirements of the revolving-period securitizations throughwhich the Company securitizes certain of its trade receivables, the Company effectively bears the risk of potential delinquency or default associated withtrade receivables sold or interests retained. Accordingly, in the normal course of servicing the assets sold, the Company evaluates potential collectionlosses and delinquencies and updates the estimated fair value of the Company’s retained interests. An increase in delinquency rates compared to historic levels would cause an increase in the retained interest. Ultimately, if the customer defaults, the Company will be responsible for absorbing theamount. The fair value of the retained interests at December 31, 2003 and 2002, was approximately $ 367 million and $ 497 million, respectively.
In accordance with SFAS 140, the Company has not recorded a servicing asset or liability as management believes it is not practicable to estimate thisvalue given that verifiable data as to the fair value of the compensation and/or cost related to servicing the types of the assets sold is not readilyobtainable nor reliably estimable for the multiple geographic markets in which the entities selling receivables operate.
During 2003 and 2002, the following cash flows were received from and paid to QSPEs:
December 31, 2003 2002
Gross trade receivables sold to QSPEs ($ 482 and $ 800)* $ 5,661 $ 5,972Collections made on behalf of and paid to QSPEs (($ 663) and ($ 735))* (5,883) (6,074)Purchaser’s, liquidity and program fees (($ 2) and ($ 5))* (21) (37)Decrease (increase) in retained interests ($ 119 and ($ 91))* 124 (245)Net cash paid to QSPEs during the year (($ 64) and ($ 31))* $ (119) $ (384)* Related to assets held for sale and in discontinued operations for 2003 and 2002, respectively
(U.S. dollar amounts in millions, except per share amounts)
Note 6 Financial instruments, continued

70 ABB Group Financial review 2003
During the fourth quarter of 2002, a number of changes were made to the two securitization programs as a consequence of the Company’s credit ratingfalling below BBB (Standard & Poor’s) and Baa2 (Moody’s). These changes included, in the case of the first program, twice monthly settlements (insteadof monthly), the sale of additional receivables as security, changes in the eligibility criteria for receivables to be sold and the establishment of certainbanking and collection procedures in respect of the sold receivables. Changes in the second program included the introduction of net cash settlementstwice per month (instead of monthly), the daily transfer of collections of sold receivables, as well as a fixed percentage of retained interest on the sale ofnew receivables. In 2003, further amendments have been made to the second program, including the return to a dynamic calculation of the retainedinterest on the receivables sold rather than a fixed percentage. Under the amended terms of the second program, if the Company’s rating falls belowBB+ (Standard & Poor’s) or Ba3 (Moody’s) then the Company may be required to relinquish its right to collect the sold receivables on behalf of the QSPE,and instead the cash collection of such sold receivables would be made directly to the account of the QSPE.
The Company records a loss on sale and the purchaser’s, liquidity and program fees at the point of sale of the receivables to the QSPEs. The total costof $ 21 million and $ 37 million in 2003 and 2002, respectively, related to the securitization of trade receivables, is included in interest and other financeexpense.
The decrease in gross receivables sold in 2003 compared to 2002 is due primarily to the fact that businesses which were either classified asdiscontinued operations or which were sold by the Company were phased out of the securitization programs during the year.
The reduction in gross receivables sold, a lower average funded volume, a reduction in default and delinquency rates, as well as the fact that 2002contained costs related to restructuring the programs, all contributed to lower purchaser’s, liquidity and program fees in 2003 compared to 2002. Thedecrease in retained interests in 2003 of $ 124 million was mainly due to businesses classified as discontinued operations or held for sale being phasedout of the programs. The increased retained interests in 2002 of $ 245 million were caused by the additional credit enhancement measures taken by the QSPEs in 2002 as described above.
The following table reconciles total gross receivables to the amounts in the Consolidated Balance Sheet after the effects of securitization at December 31,2003 and 2002:
December 31, 2003 2002
Total trade receivables $ 4,794 $ 4,667Portion derecognized (508) (512)Retained interests included in other receivables (390) (514)Trade receivables 3,896 3,641Less: Trade receivables included in assets held for sale and in discontinued operations (415) (477)Trade receivables – continuing operations $ 3,481 $ 3,164
At December 31, 2003 and 2002, of the gross trade receivables sold, the total trade receivables for which cash has not been collected at those datesamounted to $ 898 million and $ 1,026 million, respectively ($ 0 million and $ 183 million related to assets held for sale and in discontinued operations in2003 and 2002, respectively). At December 31, 2003 and 2002 an amount of $ 34 million and $ 96 million, respectively ($ 0 million and $ 19 million relatedto assets held for sale and in discontinued operations in 2003 and 2002, respectively), was more than 90 days past due which is considered delinquentpursuant to the terms of the programs.
In addition, the Company transfers receivables outside of the above described securitization programs. These transfers were sales, made withoutrecourse, directly to banks and/or sales pursuant to factoring or similar type arrangements. Total sold receivables included in these transactions during 2003 and 2002 were approximately $ 1,400 million (of which $ 581 million related to assets held for sale and in discontinued operations) and $ 534 million (of which $ 22 million related to assets held for sale and in discontinued operations), respectively. The related costs, including theassociated gains and losses, were $ 12 million ($ 3 million related to assets held for sale and in discontinued operations) in 2003. In 2002 the relatedcosts were not significant.
Note 8 Variable interest entities
The following VIEs are consolidated, as the Company is the primary beneficiary as defined by FIN 46.In March 2003, the Company sold its aircraft-leasing portfolio in Sweden to a third party. Subsequent to divestment, the Company continued itsinvolvement in this business by providing significant financial support in the form of mezzanine and subordinated financing of approximately $ 90 millionto the VIE formed by the buyer upon acquisition, exclusively for the purpose of servicing the aircraft leasing portfolio. As the primary beneficiary of theVIE, the Company retained approximately $ 182 million of assets and acquired approximately $ 76 million of third party long-term borrowings providedto the VIE at December 31, 2003. All of the VIE’s assets serve as collateral for the senior debt provided by third parties. The Company has no ownershipinterest and there is no recourse to the general credit of the Company.
The Company maintains an immaterial equity interest and provides approximately $ 1.2 million of financing to a VIE that was established to developsoftware tools for the process automation industry. The VIE recognized revenues of $ 0.5 million and a loss before interest and taxes of approximately $ 0.2 million. The Company has a minority ownership interest and there is no recourse to the general credit of the Company.
The Company consolidates a VIE that provides energy services through rental and maintenance contracts with third parties. The VIE recognizedrevenues of approximately $ 0.5 million and an immaterial loss before interest and taxes. The Company has a minority ownership interest and there is norecourse to the general credit of the Company.
(U.S. dollar amounts in millions, except per share amounts)
Note 7 Receivables, continued

ABB Group Financial review 2003 71
(U.S. dollar amounts in millions, except per share amounts)
The following VIEs are not consolidated, as the Company is not the primary beneficiary as defined by FIN 46.The Company maintains a combined equity and financing interest of approximately $ 603 million in six VIEs that were established as joint ventures todevelop power plants in various countries. The Company’s involvement with these VIEs began between 1995 and 2000 at the dates of inception of theVIEs. The purpose of the VIEs is to contract the engineering, procurement, commissioning and financing of the power plants. These VIEs havecombined total assets of approximately $ 2,900 million and reported combined total revenues and earnings before interest and taxes of $ 589 millionand $ 94 million, respectively. The exposure to loss as a result of involvement with the VIEs is limited to the Company’s equity and financing interests.
In January 2002, the Company sold its Air Handling business for proceeds of $ 147 million including a vendor note of $ 34 million issued by thepurchaser. The purchaser established a VIE upon acquisition for this business. The Company’s exposure to loss as a result of involvement with the VIE islimited to the outstanding vendor note at December 31, 2003.
The Company maintains a 50 percent equity interest in two VIEs that were established to build four transmission power lines and 22 substations inMexico. The equity interests are not significant in value. The Company’s involvement with these VIEs began in September and November 1997,respectively, when the VIEs were formed. The purpose of the VIEs is to contract the engineering, procurement, commissioning and Company’s financingof these projects. These VIEs have total assets of approximately $ 89 million, and reported combined total revenues and earnings before interest andtaxes of $ 8 million and $ 0.2 million, respectively. The exposure to loss as a result of involvement in the VIEs is limited to the Company’s equity interest.
The Company maintains a minority equity interest, that is insignificant in value, in a VIE that was established with another contractor for executing aproject for the construction of two substations and four transmission lines in Mexico. The Company’s involvement began in February 2002 when the VIE was formed. The sole purpose of the VIE is to submit a bid to execute, to organize subcontracting and to arrange financing of the project. The entityhas assets of $ 128 million and reported revenues and earnings before interest and taxes of approximately $ 128 million and $ 0, respectively. TheCompany’s exposure to loss as a result of involvement with the VIE is limited to the Company’s equity interest in the VIE.
The Company maintains a combined equity and financing interest of $ 11 million in two VIEs that were established to execute a project in London,England. One VIE was established to serve as a consortium among two third parties and the Company. The purpose of this VIE is to operate, maintainand finance the power distribution project. The second VIE is the financing vehicle for the project. The Company’s involvement began at the inception ofthese VIEs in August 1998. These VIEs have total assets of approximately $ 412 million and reported combined total revenues and earnings beforeinterest and taxes of $ 106 million and $ 17 million, respectively. The Company’s exposure to loss as a result of involvement with the VIEs is limited to theCompany’s equity and financing interest in the VIEs.
The Company has an equity interest of approximately $ 0.3 million in two VIEs that were established for developing real estate in Germany. TheCompany’s involvement with these VIEs began at inception in 1995. The VIEs have total assets of approximately $ 61 million. The Company’s exposureto loss as a result of involvement with the VIEs is limited to the Company’s equity interest in the VIEs.
The Company maintains an equity interest of approximately $ 0.1 million in two VIEs that were established for holding and leasing real estate in Germany.The Company’s involvement began when the VIEs were established in 1993 and 1995, respectively. The purpose of the VIEs is to realize real estatesavings arising from specific project financing. The VIEs total assets are approximately $ 20 million and earnings before interest and taxes of the VIEs isapproximately break-even. The Company’s exposure to loss as a result of involvement with these VIEs is limited to the Company’s equity interest.
The Company maintains an equity and financing interest of approximately $ 0.2 million in a VIE established to expand and operate an airport in Oman.The Company’s involvement began in January 2002. The VIE has assets of $ 9 million and reported revenues of $ 18 million. The Company’s exposureto loss as a result of involvement with this VIE is limited to the Company’s equity and financing interests.
Note 9 InventoriesInventories, including inventories related to long-term contracts, consist of the following:
December 31, 2003 2002
Commercial inventories, net:Raw materials $ 1,084 $ 1,014Work in process 1,143 958Finished goods 372 318
2,599 2,290Contract inventories, net:
Inventoried costs 352 371Contract costs subject to future negotiation 20 23Advance payments received related to contracts (366) (423)
6 (29)Total $ 2,605 $ 2,261
Contract costs subject to future negotiation are deemed probable of recovery through changes in the contract price and are deferred until the partieshave agreed on these changes.
Note 8 Variable interest entities, continued

72 ABB Group Financial review 2003
Prepaid expenses and other current assets consist of the following:
December 31, 2003 2002
Prepaid expenses $ 419 $ 448Deferred taxes 553 556Advances to suppliers and contractors 194 207Derivatives 682 1,247Other 154 170Total $ 2,002 $ 2,628
Note 11 Financing receivablesFinancing receivables consist of the following:
December 31, 2003 2002
Loans receivable $ 434 $ 629Finance leases (see Note 17) 425 550Other 471 426Total $ 1,330 $ 1,605
Loans receivable primarily represent financing arrangements provided to customers under long-term construction contracts and other activities. Loansreceivable include notes receivable from unconsolidated affiliates of $ 22 million and $ 76 million at December 31, 2003 and 2002, respectively.
Included in finance leases at December 31, 2003 and 2002 are $ 8 million and $ 7 million, respectively, of assets pledged as security for other liabilities.Additionally, $ 246 million and $ 212 million of finance lease receivables were pledged as security for long-term borrowings at December 31, 2003 and2002, respectively.
Other financing receivables at December 31, 2003 and 2002 include $ 312 million and $ 349 million, respectively, of assets pledged as security for otherliabilities. Of these amounts, $ 54 million and $ 58 million, respectively, are marketable securities.
During 2003 and 2002, the Company sold or transferred to financial institutions various portfolios and individual financing receivables (see Note 17).These transfers included sales of finance lease receivables and loan receivables. Financing receivables sold or transferred and derecognized from theConsolidated Balance Sheet in accordance with SFAS 140 totaled $ 338 million and $ 295 million in 2003 and 2002, respectively. Related costs of thesetransactions, including the associated gains and losses, were approximately $ 3 million and $ 13 million in 2003 and 2002, respectively.
Note 12 Property, plant and equipmentProperty, plant and equipment consist of the following:
December 31, 2003 2002
Land and buildings $ 2,517 $ 2,193Machinery and equipment 4,600 4,176Construction in progress 104 241
7,221 6,610Accumulated depreciation (4,381) (3,909)Total $ 2,840 $ 2,701
Note 13 Goodwill and other intangible assets The changes in the carrying amount of goodwill for the year ended December 31, 2003, are as follows:
Automation Power Non-core Corporate/Technologies Technologies activities Other Total
Balance at January 1, 2003 $ 1,602 $ 427 $ 134 $ 58 $ 2,221Goodwill acquired during the year 1 1 – – 2Impairment losses – – – (2) (2)Goodwill written off related to saleof businesses – – (2) (1) (3)Other (4) – – – (4)Internal reorganization 1 – (10) 9 –Foreign currency translation 98 11 – 8 117Balance at December 31, 2003 $ 1,698 $ 439 $ 122 $ 72 $ 2,331
(U.S. dollar amounts in millions, except per share amounts)
Note 10 Prepaid expenses and other
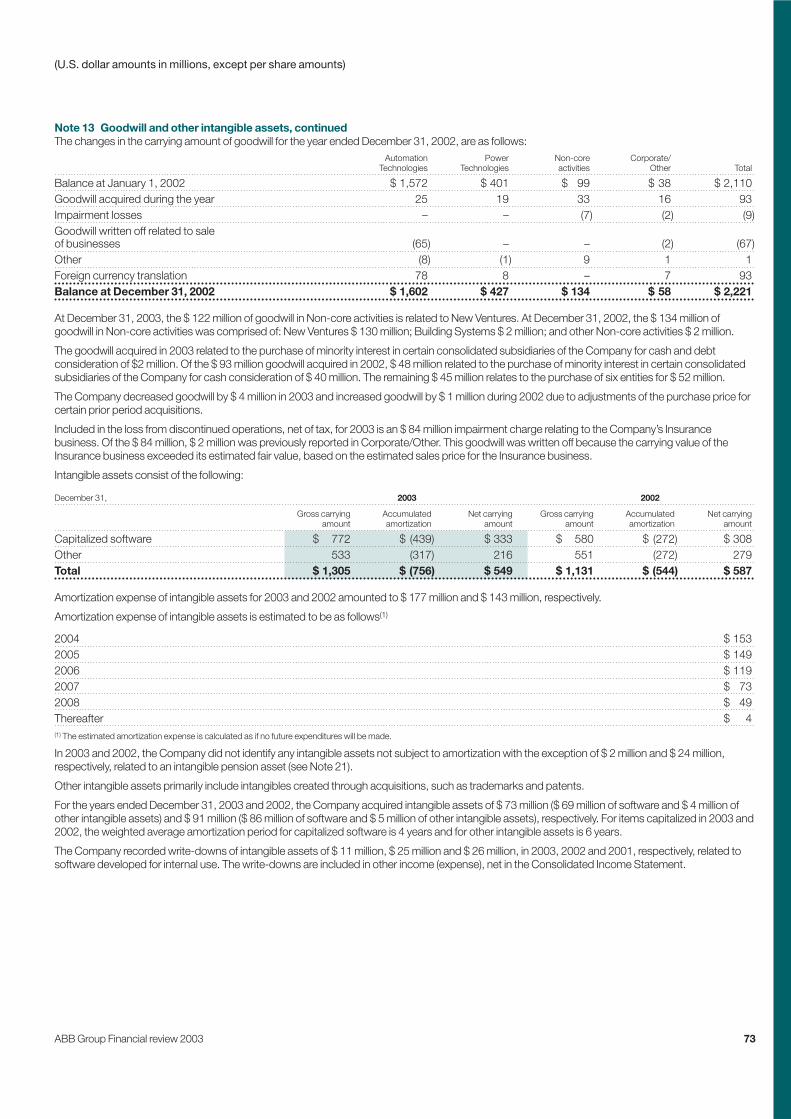
ABB Group Financial review 2003 73
The changes in the carrying amount of goodwill for the year ended December 31, 2002, are as follows:Automation Power Non-core Corporate/
Technologies Technologies activities Other Total
Balance at January 1, 2002 $ 1,572 $ 401 $ 99 $ 38 $ 2,110Goodwill acquired during the year 25 19 33 16 93Impairment losses – – (7) (2) (9)Goodwill written off related to saleof businesses (65) – – (2) (67)Other (8) (1) 9 1 1Foreign currency translation 78 8 – 7 93Balance at December 31, 2002 $ 1,602 $ 427 $ 134 $ 58 $ 2,221
At December 31, 2003, the $ 122 million of goodwill in Non-core activities is related to New Ventures. At December 31, 2002, the $ 134 million ofgoodwill in Non-core activities was comprised of: New Ventures $ 130 million; Building Systems $ 2 million; and other Non-core activities $ 2 million.
The goodwill acquired in 2003 related to the purchase of minority interest in certain consolidated subsidiaries of the Company for cash and debtconsideration of $2 million. Of the $ 93 million goodwill acquired in 2002, $ 48 million related to the purchase of minority interest in certain consolidatedsubsidiaries of the Company for cash consideration of $ 40 million. The remaining $ 45 million relates to the purchase of six entities for $ 52 million.
The Company decreased goodwill by $ 4 million in 2003 and increased goodwill by $ 1 million during 2002 due to adjustments of the purchase price forcertain prior period acquisitions.
Included in the loss from discontinued operations, net of tax, for 2003 is an $ 84 million impairment charge relating to the Company’s Insurancebusiness. Of the $ 84 million, $ 2 million was previously reported in Corporate/Other. This goodwill was written off because the carrying value of theInsurance business exceeded its estimated fair value, based on the estimated sales price for the Insurance business.
Intangible assets consist of the following:
December 31, 2003 2002
Gross carrying Accumulated Net carrying Gross carrying Accumulated Net carryingamount amortization amount amount amortization amount
Capitalized software $ 772 $ (439) $ 333 $ 580 $ (272) $ 308Other 533 (317) 216 551 (272) 279Total $ 1,305 $ (756) $ 549 $ 1,131 $ (544) $ 587
Amortization expense of intangible assets for 2003 and 2002 amounted to $ 177 million and $ 143 million, respectively.
Amortization expense of intangible assets is estimated to be as follows(1)
2004 $ 1532005 $ 1492006 $ 1192007 $ 732008 $ 49Thereafter $ 4(1) The estimated amortization expense is calculated as if no future expenditures will be made.
In 2003 and 2002, the Company did not identify any intangible assets not subject to amortization with the exception of $ 2 million and $ 24 million,respectively, related to an intangible pension asset (see Note 21).
Other intangible assets primarily include intangibles created through acquisitions, such as trademarks and patents.
For the years ended December 31, 2003 and 2002, the Company acquired intangible assets of $ 73 million ($ 69 million of software and $ 4 million ofother intangible assets) and $ 91 million ($ 86 million of software and $ 5 million of other intangible assets), respectively. For items capitalized in 2003 and2002, the weighted average amortization period for capitalized software is 4 years and for other intangible assets is 6 years.
The Company recorded write-downs of intangible assets of $ 11 million, $ 25 million and $ 26 million, in 2003, 2002 and 2001, respectively, related tosoftware developed for internal use. The write-downs are included in other income (expense), net in the Consolidated Income Statement.
(U.S. dollar amounts in millions, except per share amounts)
Note 13 Goodwill and other intangible assets, continued

74 ABB Group Financial review 2003
(U.S. dollar amounts in millions, except per share amounts)
The Company recorded earnings of $ 80 million, $ 211 million and $ 79 million in 2003, 2002 and 2001, respectively, in other income (expense), net,representing the Company’s share of the pre-tax earnings (losses) of investees accounted for under the equity method of accounting. The Company hasrecorded, at December 31, 2003, and 2002, $ 562 million and $ 730 million, respectively, in investments and other, representing the Company’sinvestment in these equity investees. Significant companies accounted for using the equity method of accounting included: Jorf Lasfar Energy CompanyS.C.A. (JLEC), Morocco (the Company owns 50 percent) and Swedish Export Credit Corporation (SECC), Sweden (the Company owned 35.4 percent).In June 2003, the Company sold its entire interest in SECC to the Government of Sweden. As reflected in its audited financial statements, SECC’s total netincome (loss) for the year ended December 31, 2002 and 2001 was $ 254 million and $ (32) million, respectively and SECC’s shareholders’ equity was $ 441 million and $ 526 million at December 31, 2002 and 2001, respectively.
The Company’s share of the pre-tax earnings (losses)Investment Investment of equity-accounted investees
balance 2003 balance 2002 2003 2002 2001
JLEC $ 372 $ 336 $ 62 $ 73 $ 85SECC – 206 13 125 (16)Other(1) 190 188 5 13 10Total $ 562 $ 730 $ 80 $ 211 $ 79Less: Current income tax expense (7) (49) (7)The Company’s share of earnings of equity-accounted investees $ 73 $ 162 $ 72(1) encompasses additional investments, none of which are individually significant
The following table represents selected financial information for JLEC and not the Company’s share in this equity accounted company.2003 2002 2001
Total current assets $ 277 $ 225 $ 267Total non-current assets $ 1,162 $ 1,124 $ 1,073Total current liabilities $ 314 $ 249 $ 188Total non-current liabilities $ 612 $ 621 $ 588Total shareholders’ equity $ 513 $ 479 $ 564Revenues $ 369 $ 364 $ 357Income before taxes $ 122 $ 143 $ 168Net income $ 120 $ 132 $ 161
As security for repayment by JLEC of certain of its loans, the Company, JLEC and the other 50 percent shareholder in JLEC have entered into variouspledge agreements with several banks and other secured parties. The Company has pledged all of its shares, claims, rights and interest in JLEC inaccordance with the pledge agreements. Such security shall continue in effect until the repayment in full of all outstanding principal and interest andother fees, which is scheduled to occur in February 2013.
The Company has entered into other similar pledge agreements for certain other equity accounted for companies. The Company has also granted linesof credit and has committed to provide additional capital for certain equity accounted companies. At December 31, 2003, the total unused lines of creditamounted to $ 11 million and the capital commitments amounted to $ 64 million.
The Company’s 2003 Consolidated Financial Statements include the following aggregate amounts related to transactions with equity accountedinvestees and other related parties:
2003 2002
Revenues $ 123 $ 93Receivables $ 98 $ 75Other current assets $ 17 $ 27Financing receivables, non-current $ 22 $ 76Payables $ 6 $ 30Short-term borrowings $ 32 $ 39Long-term borrowings $ 48 $ 1Other current liabilities $ 4 $ 21
Note 14 Equity accounted companies

ABB Group Financial review 2003 75
The Company’s total borrowings at December 31, 2003 and 2002 were $ 7,887 million and $ 7,928 million, respectively.
Short-term borrowingsThe Company’s short-term borrowings consist of the following:
December 31, 2003 2002
Commercial paper(weighted-average interest rate of 4.8%) $ – $ 478Other short-term borrowings(weighted-average interest rate of 3.8% and 5.3%) 246 428Current portion of long-term borrowings(weighted-average interest rate of 4.9% and 3.7%) 1,351 1,664Total $ 1,597 $ 2,570
Other short-term borrowings primarily represent short-term loans from various banks. Commercial paper outstanding at December 31, 2002 hadmaturities of less than 3 months.
On November 17, 2003, the Company entered into a new unsecured syndicated $ 1.0 billion three-year revolving credit facility, which became availablein December 2003 after the fulfillment of certain conditions, including the repayment and cancellation of the existing $ 1.5 billion 364-day facility entered into in December 2002 and the raising of a specified minimum level of gross proceeds from the rights issue (see Note 23) and from the eurodenominated bonds issued in November 2003.
No amount was drawn under the new facility at December 31, 2003. The interest costs of borrowings under the facility are LIBOR (or EURIBOR in thecase of drawings in euro) plus 0.8 percent to 2.25 percent, depending on the Company’s senior unsecured long-term debt rating. Commitment fees arepaid on the unused portion of the facility and a utilization fee is payable when borrowings are equal to or greater than 33 percent of the facility; the levelof these fees is linked to the ratings of the Company’s senior unsecured long-term debt.
The new credit facility contains certain financial covenants in respect of minimum interest coverage, maximum net leverage and a minimum level ofconsolidated net worth. The Company is required to meet these covenants on a quarterly basis beginning with the period ended December 31, 2003.Should the Company’s senior unsecured long-term debt ratings reach certain defined levels, these covenants will only have to be calculated atJune and December of each year. The new facility also contains provisions for the mandatory prepayment and cancellation of the facility upon a changeof control of the Company.
The new credit facility imposes restrictions on the amount of third party indebtedness in subsidiaries other than in the obligors under the facility, subjectto certain exceptions. The facility also contains certain other undertakings including limitations on disposals of assets, restrictions on mergers andacquisitions, negative pledges and restrictions on the early redemption of capital market instruments, such as bonds having a maturity date beyond thatof the facility. However, the facility permits the lengthening of the maturity profile of the Company’s debt through the early redemption of any bonds orother capital market instruments out of the net cash proceeds of any capital market instrument issued after November 17, 2003, and having a maturitydate not earlier than the capital market instruments being repaid.
The new facility contains cross-default clauses whereby an event of default would occur if the Company was to default on indebtedness, as defined inthe facility, at or above a specified threshold.
At December 31, 2002, nothing had been drawn under the $ 1.5 billion facility which was secured by a package of assets with a net carrying value of$ 3.5 billion at December 31, 2002, and by certain intra-group loans. Beginning January 2003, amounts were drawn under the facility in line with thefacility’s specified monthly borrowing limits. Commitment fees were paid on the unused portion of the facility. The interest costs on borrowings wereLIBOR plus 3.5 percent, or, for any borrowing in euro, EURIBOR plus 3.5 percent. In December 2003, the amount outstanding was repaid, the facilitycancelled and the related security released.
Long-term borrowingsThe Company utilizes a variety of derivative products to modify the characteristics of its long-term borrowings. The Company uses interest rate swapsto effectively convert certain fixed-rate long-term borrowings into floating rate obligations. For certain non-U.S. dollar denominated borrowings, theCompany utilizes cross-currency swaps to effectively convert the borrowings into U.S. dollar obligations. As required by SFAS 133, borrowings, whichhave been designated as being hedged by fair value hedges are stated at their fair values.
The following table summarizes the Company’s long-term borrowings considering the effect of interest rate and currency swaps:
December 31, 2003 December 31, 2002
Nominal Effective Nominal EffectiveBalance rate rate Balance rate rate
Floating rate $ 4,241 5.9% 3.2% $ 5,242 5.1% 3.0%Fixed rate 1,754 5.8% 5.8% 1,027 5.0% 5.0%Convertible bonds 1,646 4.1% 4.1% 753 4.6% 4.6%
7,641 7,022Current portion of long-term borrowings (1,351) 4.9% 1.8% (1,664) 3.7% 1.9%Total $ 6,290 $ 5,358
(U.S. dollar amounts in millions, except per share amounts)
Note 15 Borrowings

76 ABB Group Financial review 2003
(U.S. dollar amounts in millions, except per share amounts)
At December 31, 2003, maturities of long-term borrowings were as follows:
Due in 2004 $ 1,351Due in 2005 1,195Due in 2006 646Due in 2007 898Due in 2008 879Thereafter 2,672Total $ 7,641
In November 2003, the Company issued bonds of an aggregate principal amount of 650 million euro, or approximately $ 769 million at issuance, due2011. These bonds pay interest semi-annually in arrears at a fixed annual rate of 6.5 percent. In the event of a change of control of the Company, theterms of the bonds require the Company to offer to repurchase the bonds at 101 percent of the principal amount thereof, plus any accrued interest.
In September 2003, the Company issued convertible unsubordinated bonds of an aggregate principal amount of 1,000 million Swiss francs, orapproximately $722 million at issuance, due 2010. The bonds pay interest annually in arrears at a fixed annual rate of 3.5 percent. On issuance, each5,000 Swiss francs of principal amount of bonds was convertible into 418.41004 fully paid ordinary shares of the Company at an initial conversion priceof 11.95 Swiss francs. The conversion price is subject to adjustment provisions to protect against dilution or change in control. As a result of thedecision at the extraordinary general meeting of shareholders on November 20, 2003, to increase the share capital of the Company by issuing a further840,006,602 shares, the conversion price and conversion ratio of the bonds were adjusted to 9.53 Swiss francs and 524.65897 shares respectively,effective December 12, 2003, representing a total of 104,931,794 shares if the bonds were fully converted.
The bonds are convertible at the option of the bondholder at any time from October 21, 2003 up to and including the tenth business day prior toSeptember 10, 2010. The Company may at any time on or after September 10, 2007 redeem the outstanding bonds at par plus accrued interest if, for acertain number of days during a specified period of time, the official closing price of the Company’s ordinary shares on the relevant exchange has beenat least 150 percent of the conversion price. In addition, at any time prior to maturity, the Company can redeem the outstanding bonds at par plusaccrued interest, if at least 85 percent in aggregate of the principal amount of bonds originally issued have been redeemed, converted or purchased andcancelled. The Company has the option to redeem the bonds when due in cash, ordinary shares or any combination thereof.
In May 2002, the Company issued $ 968 million aggregate principal amount of convertible unsubordinated bonds due 2007.The bonds pay interestsemi-annually in arrears at a fixed annual rate of 4.625 percent. The bonds were initially convertible into 84,940,935 fully paid ordinary shares of theCompany at an initial conversion price of 18.48 Swiss francs (converted into U.S. dollars at a fixed conversion rate of 1.6216 Swiss francs perU.S. dollar). The conversion price is subject to adjustment provisions to protect against dilution or change in control. As a result of the rights issue andresulting increase in the share capital of the Company, the conversion price of the bonds was adjusted, effective November 21, 2003, to 14.64 Swissfrancs (converted into U.S. dollars at the fixed exchange rate of 1.6216 Swiss francs per U.S. dollar), representing a total of 107,220,546 shares if the bonds were fully converted.
The $ 968 million bonds are convertible at the option of the bondholder at any time from June 26, 2002 up to and including May 2, 2007. The Companymay, at any time on or after May 16, 2005, redeem the outstanding bonds at par plus accrued interest if, (1) for a certain number of days during aspecified period of time, the official closing price of the Company’s ordinary shares on the virt-x exceeds 130 percent of the conversion price, or (2) if atleast 85 percent in aggregate principal amount of bonds originally issued have been exchanged, redeemed or purchased and cancelled. The Companyhas the option to redeem the bonds when due in cash, ordinary shares or any combination thereof.
The Company’s shares are denominated in Swiss francs, while the bonds are denominated in U.S. dollars. Consequently, in accordance with SFAS 133, as clarified in discussions between the Company and the Securities and Exchange Commission, a component of the $ 968 millionconvertible bonds must be accounted for as an embedded derivative. A portion of the issuance proceeds is deemed to relate to the value of thederivative on issuance and subsequent changes in value of the derivative are recorded through earnings and as an adjustment to the carrying value ofthe bonds. The allocation of a portion of the proceeds to the derivative creates a discount on issuance, which is amortized to earnings over the life of the bonds. Through December 31, 2002, primarily as a result of the decline in the Company’s share price since issuance of the bonds, the Companyrecorded a gain from the change in fair value of the derivative, partially offset by amortization of the effective discount, resulting in a net decrease tointerest and other finance expense of $ 215 million, with a corresponding reduction in long-term borrowings. At December 31, 2003, as a result of anincrease in value of the derivative (related among other factors, to the increase in the Company’s share price since December 31, 2002), combined with the continued amortization of the discount on issuance, there was a charge to interest and other finance expense of $ 84 million in 2003, and acorresponding increase in long-term borrowings, when compared to December 31, 2002.
In May 2002, the Company issued bonds due in 2009 with an aggregate principal amount of 200 million pounds sterling, or approximately $ 292 millionat the time of issuance, which pay interest semi-annually in arrears at 10 percent per annum. The Company also issued in May 2002 bonds due in 2008with an aggregate principal amount of 500 million euro, or approximately $ 466 million at the time of issuance, which pay interest annually in arrears at9.5 percent per annum.
The 200 million pounds sterling bonds and the 500 million euro bonds contain certain clauses linking the interest paid on the bonds to the credit ratingassigned to the bonds. If the rating assigned to these bonds by both Moody’s and Standard & Poor’s remains at or above Baa3 and BBB–, respectively,then the interest rate on the bonds remains at the level at issuance, that is 10 percent and 9.5 percent for the sterling and euro bonds, respectively. If the rating assigned by either Moody’s or Standard & Poor’s decreases below Baa3 or BBB–, respectively, then the annual interest rate on the bondsincreases by 1.5 percent per annum to 11.5 percent and 11 percent for the sterling and euro bonds, respectively. If after such a rating decrease, therating assigned by both Moody’s and Standard & Poor’s returns to a level at or above Baa3 and BBB–, respectively, then the interest rates on the bondsreturn to the interest level at issuance. As a result of the downgrade of the Company’s long-term credit rating by Moody’s to Ba2 on October 31, 2002,
Note 15 Borrowings, continued

ABB Group Financial review 2003 77
this step-up clause in interest was triggered on both bonds. The increase in interest costs is effective for interest periods beginning after the payment ofthe coupon accruing at the date of the downgrade.
In line with the Company’s policy of reducing its interest and currency exposure, a cross-currency swap has been used to modify the characteristics ofthe 200 million pounds sterling bonds and an interest rate swap to modify the 500 million euro bonds. After considering the impact of the cross-currencyand interest rate swaps, the 200 million pounds sterling bonds effectively became a floating rate U.S. dollar obligation, while the 500 million euro bondsbecame a floating rate euro obligation. In both cases, the floating rate resets every three months. Accordingly, both the 200 million pounds sterlingbonds and the 500 million euro bonds are included as “floating rate” in the table of long-term borrowings above.
In 2003 and 2002, the Company repurchased outstanding bonds with a face value of $ 94 million and $ 109 million, respectively. In connection withthese repurchases the Company recorded an insignificant gain on extinguishments of debt. In 2002, the Company cancelled repurchased bonds with aface value of $ 31 million and subsequently re-issued repurchased bonds totaling a face value of $ 19 million. The re-issue price became the new costbasis of the bonds.
Almost all of the Company’s publicly traded bonds contain cross-default clauses which would allow the bondholders to demand repayment if theCompany was to default on any borrowing at or above a specified threshold.
Note 16 Accrued liabilities and otherAccrued liabilities and other consists of the following:
December 31, 2003 2002
Asbestos and related costs (see Note 18) $ 813 $ 1,091Accrued personnel costs 650 643Provisions for warranties and contract penalties 566 434Contract related reserves 532 505Taxes payables 425 412Interest 303 277Provisions for restructuring 269 232Derivatives 220 1,102Deferred taxes 200 236Pension and other employee benefits 110 101Other 1,052 1,102Total $ 5,140 $ 6,135
The amount in “Other” represents provisions for project disputes, other legal related matters and other accrued expenses and deferred income.
Note 17 Leases
Lease obligationsThe Company's lease obligations primarily relate to real estate and office equipment. In the normal course of business, management expects mostleases to be renewed or replaced by other leases. During 2002 the Company entered into a sale-leaseback transaction relating to substantially all of theCompany’s properties in Sweden. This resulted in an increase in minimum rent payments to third parties, as compared to the previous years. Minimumrent expense under operating leases included in the income from continuing operations was $ 403 million, $ 323 million and $ 200 million in 2003, 2002and 2001, respectively.
At December 31, 2003, future net minimum lease payments for operating leases having initial or remaining non-cancelable lease terms in excess of oneyear consist of the following:
2004 $ 3632005 2922006 2412007 1872008 174Thereafter 623
1,880Sublease income (82)Total $ 1,798
(U.S. dollar amounts in millions, except per share amounts)
Note 15 Borrowings, continued

78 ABB Group Financial review 2003
Investments in leasesThe Company’s former Financial Services division provided sales support to the Company’s industrial entities’ customers by means of lease financingand credit arrangements, as well as other direct third-party lease financing. In November 2002, the Company completed the sale of most of itsStructured Finance business, part of the former Financial Services division, to GE (see Note 3). The Structured Finance portfolio divested included globalinfrastructure financing, equipment leasing and financing businesses. During 2003, the Company sold various lease portfolios in Germany, Finland andSwitzerland. These transactions are in line with the Company’s ongoing strategy to divest non-core businesses to focus on power and automationtechnologies. The Company retained some leasing assets including investments in sales-type leases, leveraged leases and direct financing leases thatare included in financing receivables (see Note 11).
The Company’s non-current investments in direct financing, sales-type and leveraged leases, including $ 54 million of net investments in an aircraftleasing portfolio, reported by a VIE in Sweden (see Note 8), consist of the following:
December 31, 2003 2002
Minimum lease payments receivable $ 415 $ 653Residual values 42 48Unearned income (57) (145)
400 556Leveraged leases 61 35
461 591Current portion (36) (41)Total $ 425 $ 550
At December 31, 2003, minimum lease payments under direct financing and sales-type leases are scheduled to be received as follows:
2004 $ 502005 472006 372007 242008 21Thereafter 236Total $ 415
Note 18 Commitments and contingencies
IBM Outsourcing AgreementIn 2003, the Company entered into a 10-year global framework agreement with International Business Machines Corporation (IBM) to outsource theCompany’s information systems infrastructure services to IBM. This global framework agreement forms the basis for country agreements entered intobetween the Company and IBM in 13 countries in which the Company operates as well as Company headquarters. Pursuant to these agreements, theCompany’s information technology (IT) personnel were transferred and certain IT equipment was sold to IBM. Costs associated with the transfer ofemployees have been recognized in 2003 and were not significant. The IT equipment was sold to IBM at its net book value resulting in no gain or loss on disposal.
Pursuant to the global framework agreement, the Company is permitted to terminate an individual country agreement, on providing to IBM threemonths notice. On termination, termination charges, which are within standard commercial terms, are payable to IBM. Such termination chargesdecline over the term of the global framework agreement and are based on the preceding 12-month period’s costs and the number of years remainingon the agreement.
The global framework agreement also includes an obligation for IBM to lease new personal computers and other IT equipment to the Company as olderequipment is retired. The Company accounts for these items as capital leases or operating leases based on the terms of the leases.
Further, pursuant to the global framework agreement, IBM will receive monthly payments from the Company’s subsidiaries in the respective countriesrelated to information systems infrastructure services. Expected total annual costs during the 10-year term of the global framework agreementapproximate $170 million based on the current level of usage of the services.
While the above agreement was negotiated and transacted at arms-length between IBM and the Company, it should be noted that Jürgen Dormann,the Company’s Chairman and CEO, was a member of the Board of Directors of IBM until April 29, 2003, and Hans-Ulrich Märki, a director on theCompany’s Board of Directors, is general manager of IBM Europe/Middle East/Africa.
Contingencies – GeneralThe Company is subject to various legal proceedings and claims that have arisen in the ordinary course of business that have not been finally adjudicated.It is not possible at this time for the Company to predict with any certainty the outcome of such litigation. However, except as stated below, managementis of the opinion, based upon information presently available and on advice of external counsel, that it is unlikely that any such liability, to the extent not provided for through insurance or otherwise, would have a material adverse effect on the Company’s consolidated financial position, results of operations or cash flows.
(U.S. dollar amounts in millions, except per share amounts)
Note 17 Leases, continued

ABB Group Financial review 2003 79
In response to information provided by the Company’s employees, during 2003 and 2002 the Company undertook an investigation of potentiallyimproper business conduct within the Company’s Oil, Gas and Petrochemical business. In such internal investigations, the Company uncovered alimited number of improper payments in the Upstream business in Africa, Central Asia and South America, which the Company has voluntarily disclosedto the U.S. Department of Justice and the U.S. Securities and Exchange Commission. The payments violated the Company’s internal policies onbusiness ethics. The Company is cooperating fully with the U.S. Department of Justice and the U.S. Securities and Exchange Commission. TheCompany has hired outside counsel and auditors (other than its auditors) to assist in a compliance review to determine whether other instances ofimproper payments exist. The compliance review is being conducted jointly with the purchaser of the Upstream business and with the purchaser’soutside counsel and auditors.
If the U.S. Department of Justice and the U.S. Securities and Exchange Commission determine that violations of the law have occurred, they could seekcivil or, in the case of the U.S. Department of Justice, criminal sanctions, including monetary penalties against the Company. The Company is currentlynot able to predict the final outcome of the compliance review but expects that any civil or criminal sanctions or proceedings arising from disclosures tothe U.S. Department of Justice and the U.S. Securities and Exchange Commission will be disposed of voluntarily. The Company has also taken thefollowing remedial actions: terminated the improper payments; terminated contracts with an individual and companies believed to have been involved inthe improper payments; replaced senior management at the relevant subsidiary; disciplined the responsible employees with a range of sanctionsincluding severance of employment; loss of compensation and title, formal reprimands and ethics counseling and training; hired outside experts toassist in the correction of books and records to properly record the payments; and has provided and will be providing additional ethics and compliancetraining.
Contingencies – EnvironmentalThe Company is a participant in several legal and regulatory actions, which result from various U.S. and other federal, state and local environmentalprotection legislation as well as agreements with third parties. While the Company cannot estimate the impact of future regulations affecting theseactions, management believes that the ultimate resolution of these matters will not have a material impact on the Company’s financial position, results ofoperations or cash flows.
Provisions are recorded when it is probable that losses will result from these actions and the amounts of losses can be reasonably estimated. Estimatedlosses for environmental remediation obligations are not discounted to their present value. In respect to these matters, the Company may be able torecover a portion of the costs from insurers or other third parties. Receivables are recorded when it is probable that recoveries will be collected.
Guarantees-generalCertain guarantees issued or modified after December 31, 2002 are accounted for in accordance with FASB Interpretation No. 45 (FIN 45), Guarantor’sAccounting and Disclosure Requirements for Guarantees; Including Indirect Guarantees of Indebtedness of Others. Upon issuance of certainguarantees, a liability, equal to the fair value of the guarantee, is recorded.
Guarantees-performancePerformance guarantees represent obligations where the Company guarantees the performance of a third party’s product or service according to theterms of a contract. Such guarantees may include guarantees that a project will be completed within a specified time. If the third party does not fulfill theobligation, the Company will compensate the guaranteed party in cash or in kind. Performance guarantees include surety bonds, advance paymentguarantees, and performance standby letters of credit.
FIN 45 requires that the Company disclose the “maximum potential exposure” of certain guarantees as well as possible recourse provisions that mayallow the Company to recover from third parties amounts paid out under such guarantees. The “maximum potential exposure” as defined by FIN 45does not allow any discounting of the Company’s assessment of actual exposure under the guarantees. The information below reflects the Company’smaximum potential exposure under the guarantees, which is higher than management’s assessment of the expected exposures.
The Company retained obligations for guarantees related to the power generation business contributed in mid-1999 to the former ABB ALSTOMPOWER NV joint venture. The guarantees primarily consist of performance guarantees, advance payment guarantees, product warranty guarantees,and other miscellaneous guarantees under certain contracts such as indemnification for personal injuries and property damages, taxes, andcompliance with labor laws, environmental laws and patents. The guarantees have maturity dates ranging from one to ten years and in some caseshave no definite expiry. In May 2000, the Company sold its interest in the ABB ALSTOM POWER NV joint venture to ALSTOM SA (ALSTOM). As a result,ALSTOM and its subsidiaries have primary responsibility for performing the obligations that are the subject of the guarantees. Further, ALSTOM, theparent company, and ALSTOM POWER NV, formerly ABB ALSTOM POWER NV, have undertaken jointly and severally to fully indemnify and holdharmless the Company against any claims arising under such guarantees. Due to the nature of product warranty guarantees and the miscellaneousguarantees, the Company is unable to develop an estimate of the maximum potential amount of future payments for these guarantees issued on behalfof the former power generation business. Management’s best estimate of the total “maximum potential exposure” of quantifiable guarantees issued bythe Company on behalf of its former power generation business was approximately $ 1,200 million and $ 2,200 million at December 31, 2003 and2002, respectively. The maximum potential exposure is based on the original guarantee or contract amount and does not reflect the completion statusof the project. At December 31, 2003, no losses have been recognized relating to guarantees issued on behalf of the former power generation business.Management believes that it is not probable that the Company will incur a loss under these guarantees and therefore, in accordance with SFAS 5, aprovision has not been recorded at December 31, 2003 and 2002.
During 2003, the Company was released from the obligations of surety bonds retained related to the sale of its nuclear business to British Nuclear FuelsPLC. As a result, the Company’s maximum potential exposure under these bonds has been reduced from $ 640 million at December 31, 2002 to zeroat December 31, 2003.
(U.S. dollar amounts in millions, except per share amounts)
Note 18 Commitments and contingencies, continued

80 ABB Group Financial review 2003
Guarantees-financialFinancial guarantees represent irrevocable assurances that the Company will make payment to the beneficiary in the event that a third party fails to fulfillits financial obligations and the beneficiary under the guarantee incurs a loss due to that failure.
At December 31, 2003 and 2002, the Company had $ 207 million and $ 223 million, respectively, of financial guarantees outstanding. Of that amount, $ 189 million and $ 206 million, respectively, were issued on behalf of companies in which the Company currently has or formerly had an equity interest.The guarantees have maturity dates ranging from one to thirteen years. Management believes that it is not probable that the Company will incur a lossunder these guarantees and therefore, in accordance with SFAS 5, no provision has been recorded at December 31, 2003 and 2002.
Product and order related contingenciesThe Company calculates its provision for product warranties based on historical claims experience and specific review of certain contracts. Theprovision for warranties and contract penalties in Note 16 includes penalties resulting from delays in contract fulfillment, which is not included in theamounts below.
Reconciliation of the provision for warranties, including guarantees of product performance is as follows:
December 31, 2003 2002
Balance at the beginning of year $ 343 $ 331Claims paid in cash or in kind (37) (46)Net increase to provision for changes in estimates,warranties issued, and warranties expired 191 58Balance at the end of year $ 497 $ 343
In 1998, the Company entered into an engineering, procurement and project management contract with a customer for an oil and petrochemical refineryin India with a contract value of approximately $ 860 million. The project, which is subject to a reimbursable cost agreement, is approximately 60 percentcomplete and has been stalled for the past few years due to complications encountered by the customer in obtaining necessary additional financing.Given the uncertainty as to whether the project will be restarted, the Company recorded a loss of $ 108 million in 2003 to write down its remaining netassets associated with this project. If the project is not restarted, the Company will be subject to certain contingent liabilities to third parties.
Asbestos Liability
OverviewWhen the Company sold its 50 percent interest in the former ABB ALSTOM POWER NV joint venture to ALSTOM in May 2000, it retained ownership of Combustion Engineering Inc. (Combustion Engineering), a subsidiary that had conducted part of the Company’s former power generation businessand that now owns commercial real estate that it leases to third parties. Combustion Engineering is a co-defendant, together with other third parties,in numerous lawsuits in the United States in which the plaintiffs claim damages for personal injury arising from exposure to asbestos in equipment ormaterials that Combustion Engineering allegedly supplied or was responsible for, primarily during the early 1970s and before. Asbestos claims havebeen brought against other of the Company’s entities, including ABB Lummus Global Inc. (Lummus) (which is part of the Company’s Oil, Gas andPetrochemicals business and was formerly a subsidiary of Combustion Engineering) and Basic Incorporated (Basic) (which is currently a subsidiary of Asea Brown Boveri Inc. and was formerly a subsidiary of Combustion Engineering). These claims, however, have been less significant than theCombustion Engineering claims and have not had a material impact on the Company’s financial position, results of operations or cash flows.
From 1989 through February 17, 2003 (the date that Combustion Engineering filed for Chapter 11 as described below) approximately 438,000asbestos-related claims have been filed against Combustion Engineering. On February 17, 2003 there were approximately 164,000 asbestos relatedpersonal injury claims pending against Combustion Engineering. There were approximately 138,000 such claims pending against CombustionEngineering on December 31, 2002 and approximately 94,000 such claims were pending on December 31, 2001. Of the approximately 164,000claims that were pending on February 17, 2003, approximately 111,000 are claims that the Company has treated as settled (including those settledunder the Master Settlement Agreement described below) but under which there are continuing payments. Approximately 29,000 new claims weremade in the period from January 1, 2003 to February 17, 2003; 79,000 in 2002 and 55,000 in 2001. Approximately 30,000 claims were resolved in the period from January 1, 2003 to February 17, 2003 (all but 111 of which were resolved under the Master Settlement Agreement); approximately34,500 claims were resolved in 2002 and approximately 27,000 claims were resolved in 2001. At December 31, 2003, there were approximately 14,800 claims pending against Basic and Lummus. Additionally, at December 31, 2003, there were 287 cases described below (involving approximately8,700 claims) against entities of the Company other than Combustion Engineering, Lummus and Basic.
As of December 31, 2003 and 2002, provisions of $ 813 million and $ 1,091 million, respectively, were recorded on a consolidated basis in respect ofthe asbestos claims and related defense costs. These provisions were based on the Company’s obligations under Combustion Engineering’s Chapter11 plan of reorganization, as described below, and assumed the confirmation and effectiveness of the pre-packaged plan. These provisions do not reflect probable insurance recoveries on those claims. The Company recorded receivables of approximately $ 232 million and $ 241 million atDecember 31, 2003 and 2002, respectively, for probable insurance recoveries, which were established with respect to asbestos claims. During 2002and 2001, Combustion Engineering experienced a significant increase in the level of new claims and higher total and per-claim settlement costs ascompared to prior years. Cash payments, before insurance recoveries, to resolve Combustion Engineering’s asbestos claims were $ 391 million(including $ 369 million contributed to the CE Settlement Trust, described below), $ 236 million (including $ 30 million contributed into the CE SettlementTrust), and $ 136 million in 2003, 2002 and 2001, respectively. Administration and defense costs were $ 36 million, $ 32 million and $ 13 million in 2003,2002 and 2001, respectively.
(U.S. dollar amounts in millions, except per share amounts)
Note 18 Commitments and contingencies, continued

ABB Group Financial review 2003 81
Cash payments to resolve claims against entities other than Combustion Engineering, Lummus and Basic have been immaterial to date, totalling lessthan $ 0.3 million in the aggregate. The Company has not maintained a reserve for the claims pending against such entities. Of the claims outstanding at December 31, 2003, approximately 2,250 claims were brought in Mississippi in 2002 in a single case that names hundreds of co-defendants andmakes no specific allegations of any relationship between any of the Company’s entities and the plaintiffs. Approximately 3,900 claims have beenbrought in Ohio by claimants represented by a single law firm in cases that typically name 50 to 60 co-defendants and do not allege any specific linkagebetween the plaintiffs and any of the Company’s entities. The remaining claims are pending in various jurisdictions. The Company generally seeksdismissals from claims where there is no apparent linkage between the plaintiffs and any of the Company’s entities. As these claims are unrelated toCombustion Engineering, Lummus or Basic, they will not be resolved pursuant to the pre-packaged bankruptcy plan of Combustion Engineeringdescribed below. The Company’s experience resolving these claims to date indicates that they have not had a material impact on the Company’sconsolidated financial position, results of operations or cash flows.
Negotiations with Representatives of Asbestos Claimants and Pre-Packaged Chapter 11 FilingIn October 2002, the Company and Combustion Engineering determined that it was likely that the expected asbestos-related costs of CombustionEngineering would exceed the value of its assets ($ 812 million at September 30, 2002 and $ 828 million at December 31, 2002) if its historicalsettlement patterns continued into the future. At that time, the Company and Combustion Engineering were actively considering various options forresolving Combustion Engineering’s asbestos liabilities, including the possible reorganization of Combustion Engineering under Chapter 11 of the U.S.Bankruptcy Code. In that context, the Company believed that estimating Combustion Engineering’s asbestos liabilities based on historical settlementpatterns was no longer appropriate. Subsequently, the Company and Combustion Engineering determined to resolve the asbestos liability of CombustionEngineering and its affiliates by reorganizing Combustion Engineering under Chapter 11, the principal business reorganization chapter of the U.S.Bankruptcy Code. The Company and Combustion Engineering determined to structure the Chapter 11 reorganization as a “pre-packaged plan,” inwhich acceptances of the plan would be solicited prior to the filing of the Chapter 11 case, thus reducing the duration and expense of the bankruptcyproceedings.
Beginning in October 2002, the Company and Combustion Engineering conducted extensive negotiations with representatives of certain asbestosclaimants with respect to a pre-packaged plan. On November 22, 2002, Combustion Engineering and the asbestos claimants’ representatives enteredinto a Master Settlement Agreement for settling open asbestos-related personal injury claims that had been filed against Combustion Engineering priorto November 15, 2002. Combustion Engineering also agreed, pursuant to the Master Settlement Agreement, to form and fund the CE Settlement Trustto fund and administer the payment of asbestos-related personal injury claims settled under the Master Settlement Agreement. Under the terms of the Master Settlement Agreement, eligible claimants who met all criteria to qualify for payment were entitled to receive a percentage of the value of theirclaim from the CE Settlement Trust and retain a claim against Combustion Engineering for the unpaid balance. The Master Settlement Agreementdivides claims into three categories based on the status of the claim at November 14, 2002, the status of the documentation relating to the claim, andwhether or not the documentation establishes a valid claim eligible for settlement and payment by Combustion Engineering. The Master SettlementAgreement was supplemented in January 2003 to clarify the rights of certain claimants whose right to participate in a particular payment category wasdisputed. The Master Settlement Agreement, as supplemented, settles the amount of and provides for the partial payment on approximately 110,000open asbestos-related personal injury claims that had been lodged against Combustion Engineering.
Pursuant to the Master Settlement Agreement, the CE Settlement Trust was funded by:
■ cash contributions from Combustion Engineering in the amount of $ 5 million;
■ cash contributions from ABB Inc., a subsidiary of ABB Ltd, in the amount of $ 30 million by December 31, 2003;
■ a promissory note from Combustion Engineering in the principal amount of approximately $ 101 million (guaranteed by Asea Brown Boveri Inc., a subsidiary of ABB Ltd); and an assignment by Combustion Engineering of the $ 311 million unpaid balance of principal and interest due toCombustion Engineering from Asea Brown Boveri Inc. under a loan agreement dated May 12, 2000 (guaranteed by ABB Ltd).
Pre-Packaged Plan of ReorganizationOn January 17, 2003, the Company announced that the Company and Combustion Engineering had reached an agreement on a proposed Pre-Packaged Plan of Reorganization for Combustion Engineering under Chapter 11 of the U.S. Bankruptcy Code (the “Plan”). The agreement wasreached with certain representatives of asbestos claimants with existing asbestos-related personal injury claims against Combustion Engineering(encompassing claimants who had lodged claims prior to November 15, 2002 and claimants who had filed claims after that date and were not eligible to participate in the Master Settlement Agreement) and with the proposed representative of persons who may be entitled to bring asbestos-relatedpersonal injury claims in the future.
The Plan provides for the creation of the Asbestos PI Trust, an independent trust which is separate and distinct from the CE Settlement Trust andaddresses Asbestos PI Trust Claims, which consist of present and future asbestos-related personal injury claims (including the claims previously settledpursuant to the Master Settlement Agreement only to the extent of any unpaid portions thereof) that arise directly or indirectly from any act, omission,products or operations of Combustion Engineering, Lummus or Basic. If the Plan ultimately becomes effective, a channelling injunction would be issuedunder the U.S. Bankruptcy Code pursuant to which the Asbestos PI Trust Claims against ABB Ltd and its affiliates (including Combustion Engineering,Lummus and Basic) would be channelled to the Asbestos PI Trust. This would mean that the sole recourse of a holder of an Asbestos PI Trust Claimwould be to the Asbestos PI Trust and such holder would be barred from asserting such a claim against ABB Ltd and its affiliates (including CombustionEngineering, Lummus and Basic). A preliminary injunction is currently in force. The Asbestos PI Trust would be funded with cash and other assets,including approximately 30 million common shares of ABB Ltd. The total package is valued at approximately $ 800 million.
The Plan sets forth distribution procedures for the allocation of funds to the claimants. The Plan provides that the unpaid portion of claims that weresettled pursuant to the Master Settlement Agreement will also be entitled to distributions from the Asbestos PI Trust.
(U.S. dollar amounts in millions, except per share amounts)
Note 18 Commitments and contingencies, continued

82 ABB Group Financial review 2003
On the effective date of the Plan, the Asbestos PI Trust will be funded as follows:
■ a $ 20 million 5 percent term note with a maximum term of ten years from the effective date of the Plan, issued by Combustion Engineering andsecured by its Windsor, Connecticut real estate and real estate leases (under certain specified contingencies, the Asbestos PI Trust may have theright to convert the term note into ownership of 80 percent of the voting securities of the reorganized Combustion Engineering);
■ excess cash held by Combustion Engineering on the effective date of the Plan;
■ a promissory note issued by ABB Inc. and ABB Ltd and guaranteed by certain ABB Ltd subsidiaries, in an aggregate amount of up to $ 350 million, payable in installments commencing in 2004, with $ 50 million to be paid during 2004, $ 100 million to be paid during 2005 and $100 million to bepaid during 2006, and further providing for payments amounting to $ 50 million to be paid no later than 2010 ($ 25 million of which may be payable asearly as 2006) and contingent payments of an additional aggregate amount of $ 50 million (in equal $ 25 million installments) in 2008 and 2009 if ABB Ltd meets certain financial performance standards (an EBIT margin of 12 percent in 2007 and 2008);
■ a non-interest bearing promissory note on behalf of Lummus in the amount of $ 28 million payable in relatively equal annual installments over 12 years;
■ a non-interest bearing promissory note on behalf of Basic in the aggregate amount of $ 10 million payable in relatively equal annual installments over12 years;
■ 30,298,913 shares of ABB Ltd (the “CE Settlement Shares”), which had a fair value at December 31, 2003 of $ 154 million and $ 86 million atDecember 31, 2002. The obligation to deliver these CE Settlement Shares will continue to be marked to market, with changes in the fair value ofthe CE Settlement Shares reflected in earnings of the Company until such CE Settlement Shares are contributed to the Asbestos PI Trust;
■ the Company will execute and deliver a nuclear and environmental indemnity with regard to obligations arising out of Combustion Engineering’sWindsor, Connecticut site for the benefit of Combustion Engineering;
■ Combustion Engineering, Lummus and Basic will assign to the Asbestos PI Trust any proceeds under certain insurance policies and insurancesettlement agreements. Aggregate unexhausted product liability limits are approximately $ 200 million for Combustion Engineering, approximately $ 43 million for Lummus and approximately $ 28 million for Basic, although amounts ultimately recovered by the Asbestos PI Trust under thesepolicies may be substantially less than the policy limits. In addition, Combustion Engineering will assign to the Asbestos PI Trust scheduled paymentsunder certain of its insurance settlement agreements ($ 86 million at December 31, 2003); and
■ if Lummus is sold within 18 months after the effective date of the Plan, ABB Inc. will contribute $ 5 million to the CE Settlement Trust and $ 5 million tothe Asbestos PI Trust. If the CE Settlement Trust has ceased to exist at that time, both $ 5 million payments will be made to the Asbestos PI Trust, butin no event will this contribution exceed the net proceeds from the sale of Lummus.
Next Steps in the Chapter 11 ProcessThe Plan, including the channelling injunction, will become effective when the U.S. Bankruptcy Court recommends the issuance of a confirmation order(which occurred on July 10, 2003), the confirmation order is entered by the U.S. District Court (which occurred on August 8, 2003) and has become afinal order that is not subject to appeal, and certain other conditions to the effectiveness of the Plan have been satisfied.
The solicitation of votes to approve the Plan began on January 19, 2003, and Combustion Engineering filed for Chapter 11 in the U.S. Bankruptcy Court in Delaware on February 17, 2003 based on the previously negotiated Plan. The voting period closed on February 19, 2003, and approximately97 percent of qualified ballots voted to approve the Plan. A confirmation hearing and related hearings commenced on April 7, 2003 and continued from time to time through early June 2003. On June 23, 2003, the U.S. Bankruptcy Court issued its Order Approving the Disclosure Statement butRecommending Withholding of Confirmation of the Plan of Reorganization for Combustion Engineering for Ten Days (the “Ruling”) and related findingsof fact. The Ruling approved the disclosure statement that was the document used as the basis for soliciting approval of the Plan from asbestosclaimants and verified the voting results that approved the Plan. Although the Ruling did not confirm the Plan, it indicated that the U.S. Bankruptcy Courtwould recommend that the Plan be confirmed if the Company and Combustion Engineering could establish to the court’s satisfaction certain specifiedinformation. The Company then submitted the additional information for the court’s consideration.
On July 10, 2003, the U.S. Bankruptcy Court issued a Supplemental and Amendatory Order Making Additional Findings and RecommendingConfirmation of Plan of Reorganization (the “Supplemental Ruling”). The Supplemental Ruling recommended to the U.S. District Court, among otherthings, that the Plan be confirmed.
Following the issuance of the Supplemental Ruling, interested parties had a period during which they could appeal the Ruling and the SupplementalRuling. This appeal period expired on July 24, 2003. A number of interested parties, including a small number of asbestos claimants and certaininsurance companies which historically have provided insurance coverage to Combustion Engineering, Basic and Lummus, filed appeals based onvarious objections to the Plan, including the following:
■ arguments that Combustion Engineering is not permitted to obtain a channelling injunction that protects Combustion Engineering’s affiliates withrespect to claims against Combustion Engineering;
■ arguments that asbestos claims against Lummus and Basic cannot be made subject to a channelling injunction;
■ arguments that the disclosure provided in connection with the solicitation of acceptances of the Plan did not satisfy the required standards;
■ arguments that claimants covered by the Plan would fare better outside the Plan;
(U.S. dollar amounts in millions, except per share amounts)
Note 18 Commitments and contingencies, continued

ABB Group Financial review 2003 83
■ arguments that the Plan and the Bankruptcy Court’s rulings improperly affect the rights and obligations of insurance carriers who have continuingobligations to provide insurance coverage with respect to Combustion Engineering’s asbestos liabilities;
■ arguments that the Plan and the Bankruptcy Court’s rulings fail to address properly the indemnification rights of certain insurers; and
■ arguments that the Bankruptcy Court was in error in not permitting the release of the trust created under the Master Settlement Agreement andcertain other entities, under the Plan.
The U.S. District Court held a hearing on July 31, 2003, with respect to the appeals and entered its confirmation order on August 8, 2003. The U.S.Federal Third Circuit Court of Appeals granted a motion for expedition of appeals and ordered that all briefs were to be filed by October 7, 2003.Although the Circuit Court has set, and then moved, the date for the hearing for December 16, 2003, January 12, 2004 and February 4, 2004, there isnot now a scheduled hearing date. Rather the Circuit Court has ordered that oral argument is postponed pending resolution of certain recusal motionsagainst the U.S. District Court Judge in an unrelated case. The Company cannot be certain of when a hearing will be scheduled or the duration or outcome of the appeal process. Regardless of whether or not the Plan becomes effective, the Master Settlement Agreement remains effective.
Effect of the Plan on the Company’s Financial PositionThe Company recorded expenses related to asbestos of $ 145 million, $ 420 million and $ 470 million in loss from discontinued operations, net of tax,for 2003, 2002 and 2001, respectively. Loss from discontinued operations, net of tax for 2003 includes a charge of $ 68 million, net of tax, resulting from the mark-to-market adjustment relating to the CE Settlement Shares, a provision of $ 41 million, representing the present value of the first two $ 25 million payments previously considered contingent, as well as $ 36 million of other costs. The 2002 amount reflected the Company’s estimate ofincremental total costs to be incurred based upon the terms of the Plan. In 2001, loss from discontinued operations, net of tax, reflected a charge toearnings based on Combustion Engineering’s forecasts of the expected cost of future claim settlements over a period of several years and estimates ofthe amounts recoverable from insurance when the claims were settled.
Based upon management’s expectation that the Plan will be implemented, the Company has recorded provisions of $ 813 million at December 31,2003, in accrued liabilities and other. If the Plan becomes effective, certain amounts will be reclassified as of the effective date to other long-termliabilities based on the timing of the future cash payments to the Asbestos PI Trust. Future earnings will be affected by mark-to-market adjustmentsrelating to the CE Settlement Shares through the effective date of the Plan, as well as contingent payments when they become probable of payment. In the event the Plan does not become effective, the ultimate cost for the resolution of asbestos-related personal injury claims against CombustionEngineering, Lummus and Basic may be significantly higher and could have a material adverse impact on the Company’s consolidated financialposition, results of operations and cash flows.
Contingencies related to former Nuclear Technology businessThe Company retained liability for certain specific environmental remediation costs at two sites in the U.S. that were operated by its Nuclear Technologybusiness, which was sold to British Nuclear Fuels PLC (BNFL) in April 2000. Pursuant to the purchase agreement with BNFL, the Company has retainedall of the environmental liabilities associated with its Combustion Engineering subsidiary’s Windsor, Connecticut facility and a portion of the environ-mental liabilities associated with its ABB C-E Nuclear Power Inc. subsidiary’s Hematite, Missouri facility. The primary environmental liabilities associatedwith these sites relate to the costs of remediating radiological and chemical contamination at these facilities. Such costs are not payable until a facility istaken out of use and generally are incurred over a number of years. Although it is difficult to predict with accuracy the amount of time it may take toremediate radiological contamination upon decommissioning, based on information that BNFL has made publicly available, the Company believes thatit may take until 2013 to remediate the Hematite site. With respect to the Windsor site, the Company believes the remediation may take until 2008. Atthe Windsor site, a significant portion of the contamination is related to activities that were formerly conducted by or for the U.S. government. TheCompany believes that a significant portion of the remediation costs will be covered by the U.S. government under the government’s Formerly UtilizedSites Remedial Action Program. As a result of the sale of the Nuclear Technology business, during 2000, the Company established in other liabilities areserve of $ 300 million in connection with its estimated remediation costs related to these facilities. Expenditures charged to the remediation reservewere $ 6 million, $ 12 million and $ 6 million during 2003, 2002 and 2001, respectively. In connection with the pre-packaged Chapter 11 filing byCombustion Engineering discussed above, the Company will assume any and all remaining environmental liabilities of Combustion Engineering inrespect to the Windsor and Hematite sites.
(U.S. dollar amounts in millions, except per share amounts)
Note 18 Commitments and contingencies, continued

84 ABB Group Financial review 2003
(U.S. dollar amounts in millions, except per share amounts)
Provision for taxes consists of the following:Year ended December 31, 2003 2002 2001
Current taxes on income $ 191 $ 250 $ 149Deferred taxes (113) (176) (62)Tax expense from continuing operations 78 74 87Tax expense from discontinued operations 212 81 15
The weighted average tax rate is the tax rate that would result applying each subsidiary’s statutory income tax rate to the income from continuing opera-tions before taxes and minority interest. The Company operates in countries that have differing tax laws and rates. Consequently, the consolidatedweighted-average effective rate will vary from year to year according to the source of earnings or losses by country.
Year ended December 31, 2003 2002 2001
Reconciliation of taxes:Income from continuing operations before taxes and minority interest $ 246 $ 220 $ 294Weighted-average tax rate 42.7% 41.4% 37.8%Taxes at weighted-average tax rate 105 91 111Items taxed at rates other than the weighted-average tax rate 14 (127) (1)Non-deductible goodwill amortization – – 49Changes in valuation allowance 9 106 (30)Changes in enacted tax rates 3 1 6Other, net (53) 3 (48)Tax expense from continuing operations $ 78 $ 74 $ 87Effective tax rate for the year 31.7% 33.6% 29.6%
Items taxed at rates other than the weighted-average tax rate in 2003 include $ 84 million loss comprising the change in fair value of the embeddedderivative contained in the Company’s $ 968 million convertible bonds combined with the continued amortization of the discount on issuance of thesebonds (see Note 15), partially offset by earnings recognized in relation to certain of the Company’s equity accounted investments. In 2002, items taxedat rates other than the weighted-average tax rate include $ 215 million gain, reflecting the change in fair value of the embedded derivative containedin the Company’s $ 968 million convertible bonds, partially offset by amortization of the discount on issuance of these bonds, as well as earningsrecognized in relation to certain of the Company’s equity accounted investments.
Non-deductible goodwill amortization did not impact the reconciliation of taxes in 2003 and 2002, as the Company ceased amortizing goodwill onJanuary 1, 2002, pursuant to the adoption of SFAS 142.
The reconciliation of taxes for 2002 includes changes in valuation allowance recorded in certain jurisdictions in respect of deferred tax assets that wererecognized for net operating losses incurred in those jurisdictions. The change in the valuation allowance was required as the Company determined itwas more likely than not that such deferred tax assets would no longer be realized. In 2001, the reconciliation of taxes includes changes in valuationallowance recorded in certain jurisdictions in respect of deferred tax assets that were recognized for net operating losses incurred in those jurisdictions.The change in the valuation allowance was required as the Company determined it was more likely than not certain deferred tax assets would berealized.
In 2003 and 2001, the reconciling item other, net of $ (53) million and $ (48) million includes an amount of $ 56 million and $ 50 million, respectively,relating to adjustments with respect to the favorable resolution of certain prior year tax matters.
In 2003, the income from continuing operations before taxes and minority interest of $ 246 million includes an $ 84 million loss comprising the change in fair value of the embedded derivative contained in the Company’s $ 968 million convertible bonds combined with the continued amortization of thediscount on issuance of these bonds. Furthermore, the tax expense from continuing operations includes the release of a $ 38 million tax provisionrelated to a tax case ruled in favor of the Company. The effective tax rate applicable to income from continuing operations excluding the tax effect ofthese items would be 35.2 percent.
Note 19 Taxes

Deferred income tax assets and liabilities consist of the following:
Year ended December 31, 2003 2002
Deferred tax liabilities:Financing receivables $ (244) $ (226)Property, plant and equipment (461) (407)Pension and other accrued liabilities (333) (345)Other (131) (169)
Total deferred tax liability (1,169) (1,147)Deferred tax assets:
Investments and other 20 2Property, plant and equipment 172 58Pension and other accrued liabilities 680 849Unused tax losses and credits 1,419 1,059Other 429 331
Total deferred tax asset 2,720 2,299Valuation allowance (1,610) (1,227)Deferred tax asset, net of valuation allowance 1,110 1,072Net deferred tax liability $ (59) $ (75)
Deferred tax assets and deferred tax liabilities can be allocated between current and non-current as follows:
Year ended December 31, 2003 2002
Current Non-current Current Non-current
Deferred tax liability $ (200) $ (969) $ (236) $ (911)Deferred tax asset, net 553 557 556 516Net deferred tax asset (liability) $ 353 $ (412) $ 320 $ (395)
The non-current deferred tax asset, net, is included in investments and other.
Certain entities have deferred tax assets related to net operating loss carry-forwards and other items. Because recognition of these assets is uncertain,valuation allowances of $ 1,610 million and $ 1,227 million have been established at December 31, 2003 and 2002, respectively.
At December 31, 2003, net operating loss carry-forwards of $ 3,566 million and tax credits of $ 110 million are available to reduce future taxes of certainsubsidiaries, of which $ 2,210 million loss carry-forwards and $ 75 million tax credits expire in varying amounts through 2023 and the remainder do notexpire. These carry-forwards are predominately related to the Company’s U.S. and German operations.
Note 20 Other liabilities The Company’s other liabilities amount to $ 1,837 million and $ 1,584 million at December 31, 2003 and 2002, respectively.
Other liabilities include non-current provisions of $ 446 million and $ 447 million, advances from customers relating to long-term construction contractsof $ 807 million and $ 564 million and non-current deferred income of $ 158 million and $ 149 million at December 31, 2003 and 2002, respectively.Other liabilities also includes the provision relating to the Company’s estimated environmental remediation costs related to its former Nuclear Technologybusiness (see Note 18) of $ 276 million and $ 282 million at December 31, 2003 and 2002, respectively.
The Company entered into tax advantaged leasing transactions with U.S. investors prior to 1999. Prepaid rents that have been received on thesetransactions are $ 312 million and $ 349 million at December 31, 2003 and 2002, respectively, and have been recorded as deposit liabilities. Net gainson these transactions are being recognized over the lease terms.
Note 21 Employee benefitsThe Company operates several pension plans, including defined benefit, defined contribution and termination indemnity plans, in accordance with localregulations and practices. These plans cover the majority of the Company’s employees and provide benefits to employees in the event of death,disability, retirement or termination of employment. Certain of these plans are multi-employer plans. The Company also operates postretirement healthbenefit plans in certain countries.
Some of these plans require employees to make contributions and enable employees to earn matching or other contributions from the Company. Thefunding policies of the Company’s plans are consistent with the local government and tax requirements. The Company has several pension plans thatare not required to be funded pursuant to local government and tax requirements.
The Company uses a December 31 measurement date for its plans.
ABB Group Financial review 2003 85
(U.S. dollar amounts in millions, except per share amounts)
Note 19 Taxes, continued

Obligations and Funded StatusThe following tables set forth the change in benefit obligations, the change in plan assets and the funded status recognized in the Consolidated FinancialStatements at December 31, 2003 and 2002, for the Company’s benefit plans:
Pension benefits Other benefits
2003 2002 2003 2002
Benefit obligation at the beginning of year $ 7,024 $ 6,005 $ 414 $ 389Service cost 195 186 3 6Interest cost 355 318 24 28Contributions from plan participants 47 43 6 4Benefit payments (521) (437) (34) (34)Benefit obligations of businesses acquired – 46 – –Benefit obligations of businesses disposed (131) (14) – –Actuarial (gain) loss (367) (60) 41 26Plan amendments and other (14) (56) (88) (5)Exchange rate differences 847 993 1 –
Benefit obligation at the end of year 7,435 7,024 367 414Fair value of plan assets at the beginning of the year 5,145 4,226 – –
Actual return on plan assets 384 (84) – –Contributions from employer 298 717 28 30Contributions from plan participants 47 43 6 4Benefit payments (521) (437) (34) (34)Plan assets of businesses acquired – 44 – –Plan assets of businesses disposed (127) (3) – –Other – (50) – –Exchange rate differences 573 689 – –
Fair value of plan assets at the end of year 5,799 5,145 – –Unfunded amount(1) 1,636 1,879 367 414Unrecognized transition liability – (1) (6) (60)Unrecognized actuarial loss (737) (1,168) (160) (150)Unrecognized prior service cost (33) (57) 15 –Net amount recognized $ 866 $ 653 $ 216 $ 204(1) These amounts include $ 1,449 million and $ 1,181 million at December 31, 2003 and 2002, respectively for pension plans which are not required to be funded pursuant to local government
and tax requirements.
In May 2003, the Emerging Issues Task Force of the Financial Accounting Standards Board reached a consensus on Emerging Issues Task ForceNo. 03-4 (EITF 03-4), Determining the Classification and Benefit Attribution Method for a “Cash Balance” Pension Plan. EITF 03-4 clarifies that a cashbalance plan, as defined by the guidance, should be accounted for as a defined benefit plan using the traditional unit credit attribution method. The Company adopted EITF 03-4 in May 2003. As a result, the Company accounts for certain of its plans in Switzerland as cash balance plans inaccordance with EITF 03-4. The adoption of EITF 03-4 resulted in an actuarial gain of $ 406 million during 2003.
The following amounts have been recognized in the Company’s Consolidated Balance Sheet at December 31, 2003 and 2002:
Pension benefits Other benefits
2003 2002 2003 2002
Prepaid pension cost $ (530) $ (572) $ – $ –Accrued pension cost 1,579 1,428 216 204Intangible assets (2) (24) – –Accumulated other comprehensive loss (181) (179) – –Net amount recognized $ 866 $ 653 $ 216 $ 204
The total pension and other employee benefits liability of $ 1,904 million and $ 1,720 million, as reflected in pension and other employee benefits and inaccrued liabilities and other (see Note 16), contains an accrual of $ 109 million and $ 88 million at December 31, 2003 and 2002, respectively, foremployee benefits that do not meet the criteria of Statement of Financial Accounting Standards No. 87, Employers’ Accounting for Pensions orStatement of Financial Accounting Standards No.106, Employers’ Accounting for Postretirement Benefits Other Than Pensions. Approximately $ 6 million and $ 35 million of prepaid pension cost is included as a component of assets held for sale and in discontinued operations at December 31,2003 and 2002, respectively.
86 ABB Group Financial review 2003
(U.S. dollar amounts in millions, except per share amounts)
Note 21 Employee benefits, continued

The pension and other employee benefits liability reported in the Consolidated Balance Sheet includes $ 183 million and $ 203 million at December 31,2003 and 2002, respectively, to record a minimum pension liability. The minimum liability included in other comprehensive loss decreased $ 19 million in2003 and increased $107 million in 2002.
The accumulated benefit obligation for all defined benefit pension plans was $ 7,156 million and $ 6,435 million at December 31, 2003 and 2002,respectively.
The projected benefit obligation (PBO) and fair value of plan assets for pension plans with benefit obligations in excess of plan assets were:
2003 2002
December 31, PBO Assets Difference PBO Assets Difference
PBO exceeds assets $ 4,146 $ 2,382 $ 1,764 $ 6,956 $ 5,068 $ 1,888Assets exceed PBO 3,289 3,417 (128) 68 77 (9)Total $ 7,435 $ 5,799 $ 1,636 $ 7,024 $ 5,145 $ 1,879
The accumulated benefit obligation (ABO) and fair value of plan assets for pension plans with accumulated benefit obligations in excess of plan assets were:
2003 2002
December 31, ABO Assets Difference ABO Assets Difference
ABO exceeds assets $ 2,199 $ 667 $ 1,532 $ 5,524 $ 4,206 $ 1,318Assets exceed ABO 4,957 5,132 (175) 911 939 (28)Total $ 7,156 $ 5,799 $ 1,357 $ 6,435 $ 5,145 $ 1,290
Components of Net Periodic Benefit CostFor the years ended December 31, 2003, 2002 and 2001, net periodic benefit cost consists of the following:
Pension benefits Other benefits
2003 2002 2001 2003 2002 2001
Service costs $ 195 $ 186 $ 177 $ 3 $ 6 $ 5Interest cost 355 318 311 24 28 26Expected return on plan assets (312) (281) (291) – – –Amortization transition liability 1 13 9 6 6 6Amortization prior service cost 8 15 14 (1) – –Amortization of net actuarial (gain) loss 43 22 4 8 6 3Other 6 9 (19) (1) – –Net periodic benefit cost $ 296 $ 282 $ 205 $ 39 $ 46 $ 40
AssumptionsThe following weighted-average assumptions were used to determine benefit obligations at December 31, 2003 and 2002:
Pension benefits Other benefits
2003 2002 2003 2002
Discount rate 4.96% 5.05% 6.25% 6.74%Rate of compensation increase 2.25% 3.05% – –
The following weighted-average assumptions were used to determine net periodic benefit cost for years ended December 31, 2003, 2002 and 2001:
Pension benefits Other benefits
2003 2002 2001 2003 2002 2001
Discount rate 5.05% 5.32% 5.43% 6.74% 7.24% 7.72%Expected long-term return on plan assets 6.01% 6.15% 6.81% – – –Rate of compensation increase 3.05% 3.07% 3.19% – – –
ABB Group Financial review 2003 87
(U.S. dollar amounts in millions, except per share amounts)
Note 21 Employee benefits, continued

The expected long-term rate of return on assets assumption is derived from the current and projected asset allocation, the current and projected typesof investments in each asset category and the long-term historical returns for each investment type.
The Company has multiple non-pension postretirement benefit plans. The Company’s health care plans are generally contributory with participants’contributions adjusted annually.
2003 2002
Health care cost trend rate assumed for next year 11.81% 12.92%Rate to which the cost trend rate is assumed to decline (the ultimate trend rate) 5.96% 6.46%Year that the rate reaches the ultimate trend rate 2013 2012
Assumed health care cost trends have a significant effect on the amounts reported for the health care plans. A one-percentage-point change inassumed health care cost trend rates would have the following effects at December 31, 2003:
1-percentage- 1-percentage-point increase point decrease
Effect on total of service and interest cost $ 2 $ (2)Effect on postretirement benefit obligation $ 23 $ (20)
On December 8, 2003, the Medicare Prescription Drug, Improvement and Modernization Act of 2003 (the Act) was signed into law in the U.S. In accor-dance with FASB Staff Position No. FAS 106-1, Accounting and Disclosure Requirements Related to the Medicare Prescription Drug, Improvement andModernization Act of 2003, the Company has elected to defer recognition of the potential effect of the Act on the accumulated postretirement benefitobligation and the measurement of expense related to its U.S. plans at and for the year ended December 31, 2003. Authoritative guidance specific tothe accounting treatment for the federal subsidy component of the Act is pending and that guidance, when issued by the FASB, may require theCompany to change previously reported information.
Plan AssetsThe Company’s pension plan weighted-average asset allocations at December 31, 2003 and 2002, by asset category are as follows:
Plan assets at December 31,
Asset category 2003 2002
Equity securities 37% 33%Debt securities 48% 51%Real estate 11% 11%Other 4% 5%Total 100% 100%
The pension plan assets are invested in accordance with statutory regulations, pension plan rules, and recommendations of the pension fund trustees.The investment allocation strategy is expected to remain consistent with historical averages.
At December 31, 2003 and 2002, plan assets included approximately $ 5 million (approximately 1 million shares) and $ 3 million (approximately 1 millionshares), respectively, of the Company’s capital stock.
ContributionsThe Company expects to contribute $ 248 million to its pension plans and $ 27 million to its other postretirement benefit plans in 2004.
The Company has a defined benefit pension plan that covers substantially all employees in Sweden. Effective December 31, 2002, the assets whichhad previously been pledged to the plan were contributed and have been reflected as a component of “Fair value of plan assets” at December 31, 2003and 2002, respectively (see Note 5).
During 2002, the Company contributed $ 188 million of available-for-sale debt securities to certain of the Company’s pension plans in the United Statesand the United Kingdom.
The Company also maintains several defined contribution plans. The expense for these plans was $ 23 million, $ 23 million and $ 26 million in 2003,2002 and 2001, respectively. The Company also contributed $ 143 million, $ 141 million and $ 135 million to multi-employer plans in 2003, 2002 and2001, respectively.
88 ABB Group Financial review 2003
(U.S. dollar amounts in millions, except per share amounts)
Note 21 Employee benefits, continued

ABB Group Financial review 2003 89
The Company maintains a management incentive plan under which it offers stock warrants and warrant appreciation rights (WARs) to key employeesfor no consideration.
Warrants granted under this plan allow participants to purchase shares of the Company at predetermined prices. Participants may sell the warrantsrather than exercise the right to purchase shares. Equivalent warrants are listed on the SWX Swiss Exchange (virt-x), which facilitates valuation andtransferability of warrants granted under this plan.
Each WAR gives the participant the right to receive, in cash, the market price of a warrant on the date of exercise of the WAR. The WARs are non-transferable.
Participants may exercise or sell warrants and exercise WARs after the vesting period, which is three years from the date of grant. Vesting restrictionscan be waived in certain circumstances such as death or disability. All warrants and WARs expire six years from the date of grant. As the primary tradingmarket for shares of ABB Ltd is the SWX Swiss Exchange (virt-x), the exercise prices of warrants and the trading prices of equivalent warrants listed on the SWX Swiss Exchange (virt-x) are denominated in Swiss francs . Accordingly, exercise prices are presented below in Swiss francs. Fair valueshave been presented in U.S. dollars based upon exchange rates in effect as of the applicable period.
In November 2003, an extraordinary shareholders’ meeting resolved to increase the Company’s share capital by approximately 840 million sharesthrough a rights issue. In December 2003, the Company completed the 7-for-10 rights offering for the 840 million new registered shares at an offer priceof 4 Swiss francs per share resulting in a net increase of capital stock and additional paid-in capital of approximately $ 2.5 billion. As a result of the rightsoffering, the exercise price and conversion ratio of the warrants were adjusted so as to ensure that the intrinsic value of the warrants and WARs immedi-ately after the rights offering was not in excess of the intrinsic value prior to the rights offering, and that the ratio of the exercise price per share to themarket value per share was not reduced.
WarrantsThe Company accounts for the warrants using the intrinsic value method of APB Opinion No. 25 (APB 25), Accounting for Stock Issued to Employees,as permitted by Statement of Financial Accounting Standards No. 123 (SFAS 123), Accounting for Stock Based Compensation, as amended. Allwarrants were issued with exercise prices greater than the market prices of the stock on the dates of grant. Accordingly, the Company records nocompensation expense related to the warrants, except in circumstances when a participant ceased to be employed by a consolidated subsidiary, suchas after a divestment by the Company. In accordance with FASB Interpretation No. 44, Accounting for Certain Transactions Involving StockCompensation, the Company records compensation expense based on the fair value of warrants retained by participants on the date their employmentceased, with an offset to additional paid in capital. The impact of such expense is not material.
Presented below is a summary of warrant activity for the years shown:
Weighted-average
Number of Number of exercise pricewarrants shares (1) (5) (Swiss francs)(2) (5)
Outstanding at January 1, 2001 55,442,400 19,949,848 30.74Granted (3) 23,293,750 5,872,266 13.49Forfeited (2,240,000) (581,651) 38.50Outstanding at December 31, 2001 76,496,150 25,240,463 26.55Forfeited (8,105,090) (2,043,264) 24.03Outstanding at December 31, 2002 68,391,060 23,197,199 26.77Granted (4) 27,254,250 5,450,850 7.00Forfeited (1,435,000) (361,758) 19.66Outstanding at December 31, 2003 94,210,310 28,286,291 23.05
Exercisable at December 31, 2001 10,538,000 8,612,664 22.17Exercisable at December 31, 2002 29,751,060 13,456,203 25.71Exercisable at December 31, 2003 49,381,060 18,404,851 30.11(1) All warrants granted prior to 1999 require the exercise of 100 warrants for 81.73 registered shares of ABB Ltd. Warrants granted in 1999, 2000 and 2001 require the exercise of 100 warrants
for 25.21 registered shares of ABB Ltd. No warrants were granted in 2002. Warrants granted in 2003 require the exercise of five warrants for one registered share of ABB Ltd. Informationpresented reflects the number of registered shares of ABB Ltd that warrant holders can receive upon exercise.
(2) Information presented reflects the exercise price per registered share of ABB Ltd. (3) The aggregate fair value at date of grant of warrants issued in 2001 was $ 16 million, assuming a dividend yield of 1.25 percent, expected volatility of 47 percent, risk-free interest rate of
3.5 percent, and an expected life of six years. (4) The aggregate fair value at date of grant of warrants issued in 2003 was $ 12 million, assuming a zero percent dividend yield, expected volatility of 44 percent, risk-free interest rate of
2.41 percent, and an expected life of six years. (5) The exercise price of the warrants and number of shares underlying the warrants have been restated to reflect the adjustments made to the terms of the warrants in 2003 as a result of the
rights offering
(U.S. dollar amounts in millions, except per share amounts)
Note 22 Management incentive plan

90 ABB Group Financial review 2003
Presented below is a summary of warrants outstanding at December 31, 2003:Weighted-
Exercise price Number of Number of average(presented in Swiss francs) (1) (3) warrants shares (2) (3) remaining life
24.51 4,743,000 3,876,435 2 weeks20.26 5,795,000 4,736,229 0.9 years29.75 4,648,060 1,171,758 1.4 years32.73 14,565,000 3,671,781 1.9 years42.05 19,630,000 4,948,648 2.5 years13.49 17,575,000 4,430,590 3.9 years7.00 27,254,250 5,450,850 5.9 years
(1) Information presented reflects the exercise price per registered share of ABB Ltd.(2) Information presented reflects the number of registered shares of ABB Ltd that warrant holders can receive upon exercise of warrants.(3) The exercise price of the warrants and number of shares underlying the warrants have been restated to reflect the adjustments made to the terms of the warrants in 2003 as a result of the
rights offering.
WARsAs each WAR gives the holder the right to receive cash equal to the market price of a warrant on date of exercise, the Company is required by APB 25 to record a liability based upon the fair value of outstanding WARs at each period end, amortized on a straight-line basis over the three-year vestingperiod. In selling, general and administrative expenses, the Company recorded expense of $ 1 million for 2003 and income of $ 14 million and $ 58million for 2002 and 2001, respectively, excluding amounts charged to loss from discontinued operations, net of tax, as a result of changes in the fairvalue of the outstanding WARs and the vested portion. To hedge its exposure to fluctuations in fair value of outstanding WARs, the Company purchasescash-settled call options, which entitle the Company to receive amounts equivalent to its obligations under the outstanding WARs. In accordance withEmerging Issues Task Force No. 00-19 (EITF 00-19), Accounting for Derivative Financial Instruments Indexed to, and Potentially Settled in, a Company’sOwn Stock, the cash-settled call options have been recorded as assets measured at fair value (see Note 5), with subsequent changes in fair valuerecorded through earnings as an offset to the compensation expense recorded in connection with the WARs. During 2003, 2002 and 2001, excludingamounts charged to loss from discontinued operations, net of tax, the Company recognized expense of $ 9 million, $ 26 million and $ 54 million,respectively, in interest and other finance expense, related to the cash-settled call options.
The aggregate fair value of outstanding WARs was $ 17 million and $ 9 million at December 31, 2003 and 2002, respectively. Fair value of WARs wasdetermined based upon the trading price of equivalent warrants listed on the SWX Swiss Exchange (virt-x).
Presented below is a summary of WAR activity for the years shown:
Number ofWARs
outstanding
Outstanding at January 1, 2001 65,361,040Granted 39,978,750Exercised (548,000)Forfeited (1,238,720)Outstanding at December 31, 2001 103,553,070Exercised (1,455,080)Forfeited (3,803,750)Outstanding at December 31, 2002 98,294,240Granted 21,287,000Exercised (2,052,500)Forfeited (1,850,000)Outstanding at December 31, 2003 115,678,740
At December 31, 2003 and 2002, 57,619,240 and 26,974,240 of the WARs were exercisable, respectively. The aggregate fair value at date of grant ofWARs issued in 2003 and 2001 was $ 9 million and $ 28 million, respectively. No WARs were granted in 2002.
Note 23 Stockholders’ equityIn March 2003, the Company sold 80 million treasury shares in two transactions for approximately $ 156 million.
At the Company’s annual general meeting held on May 16, 2003, the Company’s shareholders approved amendments to its articles of incorporationproviding for an increase in authorized share capital and an increase in contingent share capital. The amendments include the creation of 250 millionSwiss francs in authorized share capital, replacing 100 million Swiss francs that expired in June 2001. This entitled the Company’s Board of Directors toissue up to 100 million new ABB shares, including approximately 30 million CE Settlement Shares (see Note 18). The amendments also include anincrease of contingent capital from 200 million Swiss francs to 750 million Swiss francs, allowing the issue of up to a further 300 million new ABB Ltdshares which may be used primarily for the exercise of conversion rights granted in connection with issuance of bonds and other financial market instru-ments and for the issuance of new shares to employees.
(U.S. dollar amounts in millions, except per share amounts)
Note 22 Management incentive plan, continued

ABB Group Financial review 2003 91
In October 2003, the Company announced a three-component capital-strengthening program, comprising of a share capital increase, a credit facilityagreement and a bond issuance. As part of this program, in November 2003, an extraordinary shareholders’ meeting resolved to increase theCompany’s share capital by approximately 840 million shares through a rights issue. In December 2003, the Company completed the 7-for-10 rightsoffering for the 840 million new registered shares at an offer price of 4 Swiss francs per share resulting in a net increase of capital stock and additionalpaid in capital of approximately $ 2.5 billion.
At December 31, 2003, the Company had 2,440,016,034 authorized shares. Of these, 2,070,314,947 shares are registered and issued, including30,298,913 CE Settlement Shares that are reserved for use with the pre-packaged plan of reorganization of Combustion Engineering. The CESettlement Shares will only become outstanding and carry participation rights once the Plan becomes effective, and the shares are contributed to theAsbestos PI Trust. Should the Plan ultimately not become effective, the CE Settlement Shares reserved for such use would be cancelled by theCompany. As these shares are presently held by one of the Company’s subsidiaries and carry no participation rights, these shares are not treated asoutstanding for the purposes of the Company’s Consolidated Financial Statements.
At December 31, 2003, including the warrants issued under the management incentive plan and call options sold to a bank at fair value during 2001 and2003, the Company had outstanding obligations to deliver 59 million shares at exercise prices ranging from 7.00 to 42.05 Swiss francs. The call optionsexpire in periods ranging from 2004 to 2009 and were recorded as equity instruments in accordance with EITF 00-19. Also, at December 31, 2003, theCompany had obligations to deliver approximately 107 million shares at a conversion price of 14.64 Swiss francs (converted into U.S. dollars at the fixedexchange rate of 1.6216 Swiss francs per U.S. dollar) as a result of the issuance of convertible debt in May 2002 and to deliver approximately 105 millionshares at a conversion price of 9.53 Swiss francs as a result of the issuance of convertible debt in September 2003. In addition, pursuant to the Plandescribed above and in Note 18, the Company will contribute the CE Settlement Shares to the Asbestos PI Trust after the Plan is declared effective.
Dividends are payable to the Company’s stockholders based on the requirements of Swiss law, ABB Ltd’s Articles of Incorporation, and stockholders’equity as reflected in the unconsolidated financial statements of ABB Ltd prepared in compliance with Swiss law. At December 31, 2003, of the 8,942 million Swiss francs stockholders’ equity reflected in such unconsolidated financial statements, 5,176 million Swiss francs is share capital, 2,192 million Swiss francs is restricted, 1,533 million Swiss francs is unrestricted and 41 million Swiss francs is available for distribution.
Note 24 Earnings per shareBasic earnings per share is calculated by dividing income by the weighted-average number of shares outstanding during the year. Diluted earnings pershare is calculated by dividing income by the weighted-average number of shares outstanding during the year, assuming that all potentially dilutivesecurities were exercised and that any proceeds from such exercises were used to acquire shares of the Company’s stock at the average market priceduring the year or the period the securities were outstanding, if shorter. Potentially dilutive securities comprise: outstanding written call options, if dilutive;the securities issued under the Company’s management incentive plan, to the extent the average market price of the Company’s stock exceeded theexercise prices of such instruments; shares issuable in relation to the convertible bonds, if dilutive; and outstanding written put options, for which netshare settlement at average market price of the Company’s stock was assumed, if dilutive.
The shares issuable in relation to the warrants and options outstanding in connection with the Company’s management incentive plan were excludedfrom the computation of diluted earnings per share in all periods presented as their inclusion would have been antidilutive. In 2002, the shares issuable inrelation to the convertible bonds were included in the computation of diluted earnings per share for the period they were outstanding. In 2003, theshares issuable in relation to the convertible bonds were excluded from the calculation of diluted earnings per share as their inclusion would have beenantidilutive.
Basic earnings per share:
Year ended December 31, 2003 2002 2001
Income from continuing operations $ 86 $ 75 $ 171Loss from discontinued operations, net of tax (853) (858) (837)Cumulative effect of change in accounting principles (SFAS 133), net of tax – – (63)Net loss $ (767) $ (783) $ (729)
Weighted average number of shares outstanding (in millions) 1,220 1,113 1,132
Earnings per share:Income from continuing operations $ 0.07 $ 0.07 $ 0.15Loss from discontinued operations, net of tax (0.70) (0.77) (0.73)Cumulative effect of change in accounting principles (SFAS 133), net of tax – – (0.06)Net loss $ (0.63) $ (0.70) $ (0.64)
(U.S. dollar amounts in millions, except per share amounts)
Note 23 Stockholders’ equity, continued

Diluted earnings per share:
Year ended December 31, 2003 2002 2001
Income from continuing operations $ 86 $ 75 $ 171Effect of dilution:
Convertible bonds, net of tax – (187) –Income (loss) from continuing operations, adjusted 86 (112) 171Loss from discontinued operations, net of tax (853) (858) (837)Cumulative effect of change in accounting principles (SFAS 133), net of tax – – (63)Net loss, adjusted $ (767) $ (970) $ (729)
Weighted average number of shares outstanding (in millions) 1,220 1,113 1,132Dilutive potential shares:
Convertible bonds – 53 –Diluted weighted average number of shares outstanding (in millions) 1,220 1,166 1,132
Earnings per share:Income (loss) from continuing operations, adjusted $ 0.07 $ (0.10) $ 0.15Loss from discontinued operations, net of tax (0.70) (0.73) (0.73)Cumulative effect of change in accounting principles (SFAS 133), net of tax – – (0.06)Net loss, adjusted $ (0.63) $ (0.83) $ (0.64)
Note 25 Restructuring charges
2001 ProgramIn July 2001, the Company announced and initiated a restructuring program (2001 Program) in an effort to improve productivity, reduce cost base,simplify product lines, reduce multiple location activities and perform other downsizing in response to weakening markets and consolidation of majorcustomers in certain industries.
Restructuring charges relating to workforce reductions, lease terminations and other exit costs associated with the 2001 Program are included in other income (expense), net. Termination benefits of $ 99 million, $ 149 million and $ 32 million were paid to approximately 2,270, 4,000 and 2,150 employees in 2003, 2002 and 2001, respectively. Approximately $ 12 million, $ 29 million and $ 31 million were paid to cover costs associatedwith lease terminations and other exit costs in 2003, 2002 and 2001, respectively. Workforce reductions include production, managerial andadministrative employees. Based on changes in management’s original estimate a $ 22 million and $ 21 million reduction in the amounts accrued forworkforce reductions, lease terminations and other exit costs have been included in other income (expense), net in 2003 and 2002, respectively.Currency fluctuations resulted in a $ 23 million and $ 25 million increase in the liabilities accrued for workforce reductions, lease terminations and otherexit costs in 2003 and 2002, respectively. Accrued liabilities included $ 9 million and $ 94 million for termination benefits and $ 27 million and $ 52 millionfor lease terminations and other exit costs as of December 31, 2003 and 2002, respectively.
As a result of the 2001 Program, certain assets, inventories and property, plant and equipment have been identified as impaired or will no longer be usedin continuing operations. The Company recorded $ 18 million and $ 41 million in 2002 and 2001, respectively, to write down these assets to fair value.These costs are included in cost of sales and other income (expense), net.
Step change programIn October 2002, the Company announced the Step change program. The Company estimates that restructuring costs under the Step changeprogram will be approximately $ 200 million in 2004. The goals of the Step change program are to increase competitiveness of the Company’s corebusinesses (see Note 26), reduce overhead costs and streamline operations by approximately $ 900 million on an annual basis by 2005. The Stepchange program is expected to be completed by mid-2004.
Restructuring charges relating to workforce reductions, lease terminations and other exit costs associated with the Step change program are includedin other income (expense), net. Termination benefits of $ 145 million and $ 13 million were paid to approximately 1,500 and 200 employees in 2003 and2002, respectively. Approximately $ 48 million and $ 1 million were paid to cover costs associated with lease terminations and other exit costs in 2003and 2002, respectively. Workforce reductions include production, managerial and administrative employees. Based on changes in management’soriginal estimate, a $ 4 million reduction in the amounts accrued for workforce reductions, lease terminations and other exit costs has been includedin other income (expense), net in 2003. Currency fluctuations resulted in a $ 27 million increase in the liabilities accrued for workforce reductions,lease terminations and other exit costs in 2003. Accrued liabilities included $ 94 million and $ 38 million for termination benefits and $ 37 million and$ 25 million for lease terminations and other exit costs at December 31, 2003 and 2002, respectively.
As a result of the Step change program, certain assets, inventories and property, plant and equipment have been identified as impaired or will no longerbe used in continuing operations. The Company recorded $ 3 million and $ 2 million in 2003 and 2002, respectively, to write down these assets to theirfair value. These costs are included in cost of sales and other income (expense), net.
92 ABB Group Financial review 2003
(U.S. dollar amounts in millions, except per share amounts)
Note 24 Earnings per share, continued

ABB Group Financial review 2003 93
OtherCertain restructuring programs were initiated during 2003 at specified locations not included in the Step change program. The goals of these programsare to increase efficiencies by reducing headcount and streamlining operations. These programs are expected to increase productivity of the non-corebusinesses (see Note 26). Anticipated savings will be recognized through the strategic divestments of these operations.
In 2003, the Company recognized restructuring charges of $ 83 million related to workforce reductions and $25 million related to lease terminations andother exit costs. These costs are included in other income (expense), net. Termination benefits of $ 34 million were paid to approximately 1,300employees and $ 10 million were paid to cover costs associated with lease terminations and other exit costs. Workforce reductions include production,managerial and administrative employees. Based on changes in management’s original estimate, a $ 6 million decrease in the amounts accrued forworkforce reductions, lease terminations and other exit costs have been included in other income (expense), net. Currency fluctuations resulted in a$ 10 million increase in the liabilities accrued for workforce reductions, lease terminations and other exit costs. At December 31, 2003, accrued liabilitiesincluded $ 67 million for termination benefits and $ 35 million for lease terminations and other exit costs.
As a result of other restructuring programs, certain assets, inventories and property, plant and equipment have been identified as impaired or will nolonger be used in continuing operations. The Company recorded $ 11 million in 2003, to write down these assets to fair value. These costs are includedin cost of sales and other income (expense), net.
Restructuring charges consist of the following:
Year ended December 31, 2003 2001 program Step change Other Total
Restructuring charge for workforce reduction $ – $ 181 $ 83 $ 264Restructuring charge for lease terminations and other – 54 25 79Write-down cost – 3 11 14Change in estimate (22) (4) (6) (32)Total restructuring charges and related asset write-downs $ (22) $ 234 $ 113 $ 325
Year ended December 31, 2002
Restructuring charge for workforce reduction $ 165 $ 51 $ – $ 216Restructuring charge for lease terminations and other 38 26 – 64Write-down cost 18 2 – 20Change in estimate (21) – (9) (30)Total restructuring charges and related asset write-downs $ 200 $ 79 $ (9) $ 270
Year ended December 31, 2001
Restructuring charge for workforce reduction $ 109 $ – $ – $ 109Restructuring charge for lease terminations and other 71 – – 71Write-down cost 41 – – 41Change in estimate – – – –Total restructuring charges and related asset write-downs $ 221 $ – $ – $ 221
CumulativeThe cumulative amounts at December 31, 2003, for each plan are given below:
2001 program Step change Other Total
Restructuring charge for workforce reduction $ 274 $ 232 $ 83 $ 589Restructuring charge for lease terminations and other 109 80 25 214Write-down cost 59 5 11 75Change in estimate (43) (4) (15) (62)Total restructuring charges and related asset write-downs $ 399 $ 313 $ 104 $ 816
Note 25 Restructuring charges, continued

94 ABB Group Financial review 2003
Segment informationRestructuring charges and related asset write-downs by segment consist of the following:
Year ended December 31, 2003 2002 2001
Power Technologies $ 64 $ 62 $ 76Automation Technologies 140 137 81Non-core activities:
Equity Ventures – – –Structured Finance – – –Building Systems 43 22 2New Ventures 1 2 6Other Non-core activities 49 15 13
Total Non-core activities 93 39 21Corporate/Other 28 32 43Total restructuring charges and related asset write-downs $ 325 $ 270 $ 221
Note 26 Segment and geographic dataEffective January 1, 2003, in order to streamline the Company’s structure and improve operational performance, the Company put into place twodivisions: Power Technologies, which combines the former Power Technology Products and Utilities divisions and employed approximately38,700 people at December 31, 2003, and Automation Technologies, which combined the former Automation Technology Products and Industriesdivision and employed approximately 55,300 people at December 31, 2003. The remaining operations of the Company are grouped in Non-coreactivities. All periods presented have been restated to reflect the new organizational structure of the Company.
The Power Technologies division serves electric, gas, and water utilities as well as industrial and commercial customers, with a broad range of products,systems and services for power transmission, distribution and power plant automation. The division’s principal customers are electric, gas and waterutilities, owners and operators of power transmission systems, utilities that own or operate networks and owners and operators of power generatingplants. Other customers include gas transmission companies, local distribution companies and multi-utilities, which are involved in the transmission ordistribution of more than one commodity. The division also serves industrial and commercial customers, such as operators of large commercialbuildings and heavy industrial plants.
The Automation Technologies division provides products, systems, software and services for the automation and optimization of industrial andcommercial processes. Key technologies include measurement and control, instrumentation, process analysis, drives and motors, power electronics,robots, and low voltage products. These technologies are sold to customers of the automotive, cement, chemical, distribution, electronics, food andbeverage, life sciences, marine, metals, mining, paper, petroleum, printing and telecommunications industries with application-specific power andautomation technology.
Non-core activities includes the following:
■ The Company’s remaining Equity Ventures business;
■ the Company’s remaining Structured Finance business;
■ the Company’s remaining Building Systems business;
■ the Company’s New Ventures business area;
■ the Company’s Customer Service, Group Processes, Logistic Systems, and Semiconductors business areas.
Corporate/Other includes Headquarters, Central Research and Development, Real Estate, Group Treasury Operations and the Financial Advisorybusiness.
The Company evaluates performance of its segments based on earnings before interest and taxes, which excludes interest and dividend income,interest expense, provision for taxes, minority interest, and loss from discontinued operations, net of tax. In accordance with Statement of FinancialAccounting Standards No. 131, Disclosures about Segments of an Enterprise and Related Information, the Company presents division revenues,depreciation and amortization, earnings before interest and taxes, net operating assets and capital expenditures, all of which have been restated toreflect the changes to the Company’s internal structure, including the effect of inter-division transactions.
Note 25 Restructuring charges, continued

ABB Group Financial review 2003 95
The following tables summarize information for each segment:Depreciation Earnings Net
and before interest operating Capital2003 Revenues amortization and taxes assets (1) expenditures (2)
Power Technologies $ 7,680 $ 180 $ 563 $ 2,624 $ 120Automation Technologyies 9,897 255 773 3,787 157Non-core activities:
Equity Ventures(3) 26 5 76 1,151 46Structured Finance 48 1 (65) 643 –Building Systems 1,829 9 (104) 9 3New Ventures 53 5 (21) 313 11Other Non-core activities 581 57 (67) (237) 9
Total Non-core activities 2,537 77 (181) 1,879 69Corporate/Other 822 65 (475) 2,524 53Inter-division elimination (2,141) – (24) (1,128) –Consolidated $ 18,795 $ 577 $ 656 $ 9,686 $ 399
Depreciation Earnings Netand before interest operating Capital
2002 Revenues amortization and taxes assets (1) expenditures (2)
Power Technologies $ 6,963 $ 166 $ 433 $ 2,335 $ 114Automation Technologies 8,464 202 517 3,483 133Non-core activities:
Equity Ventures(3) 19 – 43 1,062 –Structured Finance 66 1 96 1,165 2Building Systems 2,375 11 (113) 68 9New Ventures 50 11 (37) 262 14Other Non-core activities 937 75 (170) (159) 20
Total Non-core activities 3,447 98 (181) 2,398 45Corporate/Other 860 78 (350) 2,346 144Inter-division elimination (2,268) – (73) (736) –Consolidated $ 17,466 $ 544 $ 346 $ 9,826 $ 436
Depreciation Earnings Netand before interest operating Capital
2001 Revenues amortization and taxes assets (1) expenditures (2)
Power Technologies $ 6,776 $ 189 $ 405 $ 2,054 $ 128Automation Technologies 8,496 296 514 3,173 144Non-core activities:
Equity Ventures (3) 34 – 75 1,069 –Structured Finance 97 4 1 1,513 8Building Systems 2,613 17 18 (35) 11New Ventures 97 15 (143) 269 32Other Non-core activities 1,278 65 (64) (527) 61
Total Non-core activities 4,119 101 (113) 2,289 112Corporate/Other 1,596 86 (157) 2,732 167Inter-division elimination (2,653) – (132) (770) –Consolidated $ 18,334 $ 672 $ 517 $ 9,478 $ 551(1) Net operating assets is calculated based upon total assets (excluding cash and equivalents, marketable securities, current loans receivable, taxes and deferred charges)
less total liabilities (excluding borrowings, taxes, provisions and pension-related liabilities).(2) Capital expenditures reflect purchases of tangible fixed assets.(3) Includes the Company’s investment in Jorf Lasfar Energy Company S.C.A.
Note 26 Segment and geographic data, continued
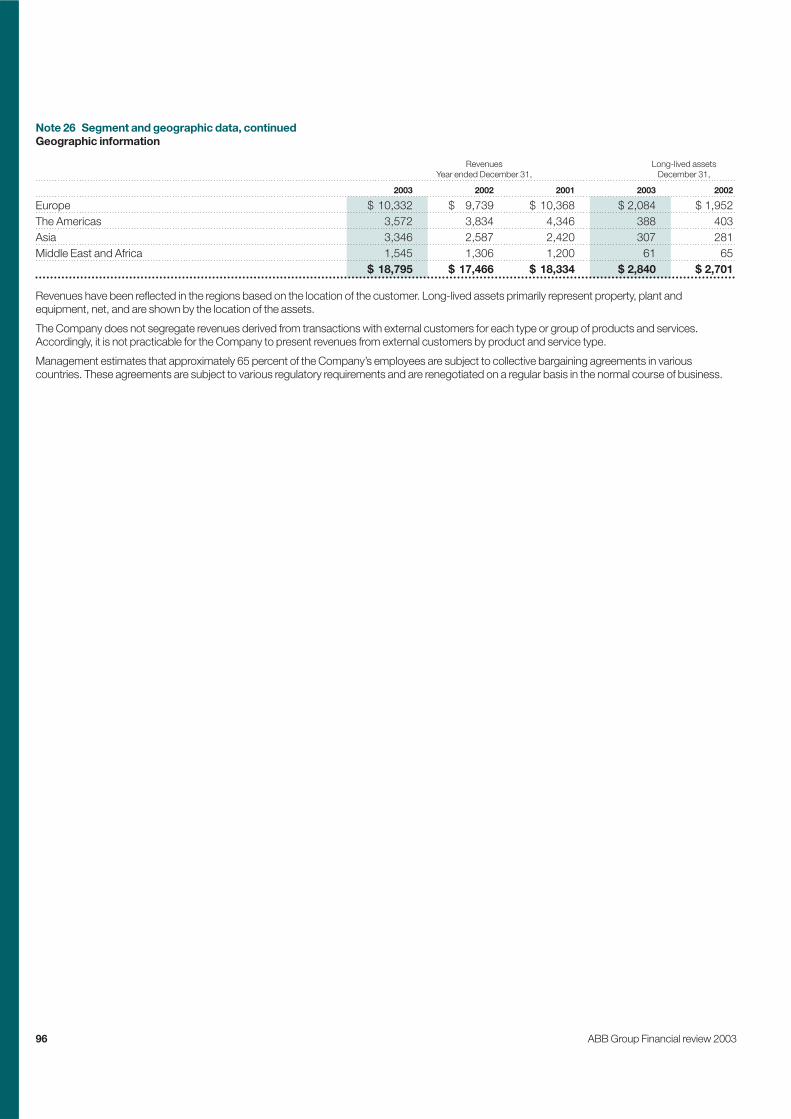
96 ABB Group Financial review 2003
Geographic information
Revenues Long-lived assetsYear ended December 31, December 31,
2003 2002 2001 2003 2002
Europe $ 10,332 $ 9,739 $ 10,368 $ 2,084 $ 1,952The Americas 3,572 3,834 4,346 388 403Asia 3,346 2,587 2,420 307 281Middle East and Africa 1,545 1,306 1,200 61 65
$ 18,795 $ 17,466 $ 18,334 $ 2,840 $ 2,701
Revenues have been reflected in the regions based on the location of the customer. Long-lived assets primarily represent property, plant andequipment, net, and are shown by the location of the assets.
The Company does not segregate revenues derived from transactions with external customers for each type or group of products and services.Accordingly, it is not practicable for the Company to present revenues from external customers by product and service type.
Management estimates that approximately 65 percent of the Company’s employees are subject to collective bargaining agreements in variouscountries. These agreements are subject to various regulatory requirements and are renegotiated on a regular basis in the normal course of business.
Note 26 Segment and geographic data, continued
ABB Group Financial review 2003 97
The Stockholders of ABB Ltd:
As auditors of the group, we have audited the accompanying consolidated balance sheets of ABB Ltd as of December 31, 2003 and 2002, and therelated consolidated income statements, statements of cash flows, statements of changes in stockholders’ equity and notes for each of the three yearsin the period ended December 31, 2003. These financial statements are the responsibility of the Board of Directors. Our responsibility is to express an opinion on these financial statements based on our audits. We confirm that we meet the legal requirements concerning professional qualification andindependence.
We did not audit the financial statements of Jorf Lasfar Energy Company, a corporation in which the Company has a 50% interest, (the Company’sequity in Jorf Lasfar Energy Company’s net income is stated at $ 60 million in 2003, $ 66 million in 2002 and $ 81 million in 2001); we did not audit the2002 and 2001 consolidated financial statements of ABB Holdings Inc., a wholly-owned subsidiary, which statements reflect total assets constituting15% in 2002 and total revenues constituting 14% in 2002 and 11% in 2001 of the related consolidated totals; we did not audit the 2002 and 2001consolidated financial statements of Swedish Export Credit Corporation, a corporation in which the Company had a 35% interest, (the Company’sequity in Swedish Export Credit Corporation’s consolidated net income (loss) is stated at $ 89 million in 2002 and $ (11) million in 2001); and we did notaudit the 2001 financial statements of Scandinavian Reinsurance Company Limited, a wholly-owned subsidiary, which statements reflect total losses of $ (346) million reflected as a component of the Company’s 2001 loss from discontinued operations. Those statements were audited by other auditorswhose reports have been furnished to us. Our opinion, insofar as it relates to amounts included for those companies and their subsidiaries, is basedsolely on the reports of the other auditors.
We conducted our audits in accordance with auditing standards generally accepted in the United States and in accordance with auditing standardspromulgated by the Swiss profession. Those standards require that we plan and perform the audit to obtain reasonable assurance about whether thefinancial statements are free of material misstatement. An audit includes examining, on a test basis, evidence supporting the amounts and disclosures inthe financial statements. An audit also includes assessing the accounting principles used and significant estimates made by management, as well asevaluating the overall financial statement presentation. We believe that our audits and the reports of other auditors provide a reasonable basis for ouropinion.
In our opinion, based on our audits and the reports of other auditors, the financial statements referred to above present fairly, in all material respects, theconsolidated financial position of ABB Ltd at December 31, 2003 and 2002, and the consolidated results of its operations and its cash flows for each ofthe three years in the period ended December 31, 2003, in conformity with accounting principles generally accepted in the United States and complywith Swiss law.
We recommend that the consolidated financial statements submitted to you be approved.
As discussed in Note 2 to the consolidated financial statements, in 2003 the Company changed its method of consolidation relating to variable interestentities. As also discussed in Note 2, in 2002 the Company changed its method of accounting for goodwill acquired in business combinations and italso adopted new criteria for classification of items accounted for as discontinued operations, resulting in reclassifications in all periods presented ofitems meeting the discontinued operations criteria after January 1, 2002. Additionally, as also discussed in Note 2, in 2001 the Company changed itsmethod of accounting for derivative financial instruments.
Ernst & Young Ltd
C. Barone S.A. Reid
Auditors in charge
Zurich, February 18, 2004
ABB Ltd Group Auditors’ Report

98 ABB Group Financial review 2003
Financial Statements of ABB Ltd, Zurich
Income StatementYear ended December 31 (CHF in thousands) 2003 2002
Revenues 22 7Personnel expenses (32,555) (33,609)Other expenses (22,828) (34,432)Dividend income – 26,655Interest income 90,632 103,688Interest expense (26,061) (27,608)Gain from sale of participations – 307Loss on sale of own shares (19,976) –Write-down of participations (1,050,000) (4,898,780)Write-down of own shares – (289,680)Net loss (1,060,766) (5,153,452)
Balance SheetDecember 31 (CHF in thousands) 2003 2002
Cash and equivalents 57,020 152Receivables 13,738 28,054Total current assets 70,758 28,206
Long-term loans to subsidiary 4,470,000 3,570,000Participations 5,300,910 3,750,910Own shares 45,968 94,320Total fixed assets 9,816,878 7,415,230Total assets 9,887,636 7,443,436
Current liabilities 82,239 24,101Short-term loan from subsidiary – 72,228Long-term loan from subsidiary 25,000 –Provisions 238,628 –Bonds 600,000 700,000Total liabilities 945,867 796,329
Share capital 5,175,787 3,000,023Legal reserve 1,779,669 600,005Reserve for treasury shares 411,814 2,944,904Other reserves 2,533,090 302,968Retained earnings 102,175 4,952,659Net loss (1,060,766) (5,153,452)Total stockholders’ equity 8,941,769 6,647,107Total liabilities and stockholders’ equity 9,887,636 7,443,436

ABB Group Financial review 2003 99
Notes to Financial Statements
Note 1 GeneralABB Ltd, Zurich (the Company) is the parent company of the ABB Group whose Consolidated Financial Statements include 100% of the assets, liabilities, revenues, expenses, income, loss and cash flows of ABB Ltd and companies in which the Company has a controlling interest, as if the Company and its subsidiaries were a single company. The Consolidated Financial Statements are of overriding importance for the purpose of the economic and financial assessment of the Company. The unconsolidated financial statements of the Company are prepared in accordance with Swiss law and serve as complementary information to the Consolidated Financial Statements.
Note 2 Cash and equivalents(CHF in thousands) 2003 2002
Cash and bank 521 152Cash with subsidiary 56,499 –Total 57,020 152
Note 3 Receivables(CHF in thousands) 2003 2002
Non-trade receivables 8,592 9,897Prepaid expenses – 4Accrued income from subsidiary 5,146 18,153Total 13,738 28,054
Note 4 Long-term loans to subsidiary(CHF in thousands) 2003 2002
Long-term loans to subsidiary 4,470,000 3,570,000
In 2002, the Company entered into an interest bearing credit agreement with ABB Asea Brown Boveri Ltd, Zurich. The loans are valued at cost. AtDecember 31, 2002 these loans were pledged in connection with an US$ 1.5 billion credit facility. In December 2003, such facility was cancelled and thesecurity released.
Note 5 Participations Ownership interestCompany name Purpose Domicile Share capital 2003 2002
ABB Asea Brown Boveri Ltd Holding CH-Zurich CHF 2,768,000,000 100% –BBC Brown Boveri Ltd Holding CH-Zurich CHF 570,580 100% 100%ABB Holding Ltd Holding CH-Zurich CHF 1,200,009,432 – 100%
ABB Holding Ltd was merged into ABB Asea Brown Boveri Ltd as per December 1, 2003. The increase in participations in 2003 consists of a contri-bution to an indirectly held subsidiary.
The investments in subsidiaries are valued at the lower of cost or fair value. Fair values are determined using the discounted cash flow method (DCF), based upon management’s expectations as to the future cash flows and earnings of the subsidiaries for the years 2004 through 2008.
Note 6 Current liabilities(CHF in thousands) 2003 2002
Non-trade payables 45,783 2,527Non-trade payables to subsidiaries 4,479 3,202Accrued expenses 28,688 18,310Accrued expenses from subsidiaries 3,289 62Total 82,239 24,101
Note 7 ProvisionsIn 2003, in conjunction with the issuance by a subsidiary of the Company of bonds convertible into ABB Ltd shares, the Company granted options to thesubsidiary issuing the bonds to enable the subsidiary to meet its obligations to deliver shares when the bonds are converted. Provisions of CHF 238,628thousand were recorded to reflect the value of the options in exchange for the receipt of cash. When the bonds are converted, or expire without conversion, the provisions will be released to other reserves in stockholders’ equity.

100 ABB Group Financial review 2003
Note 8 Bonds(CHF in thousands) 2003 2002
Bond 1999–2009 3.75% 500,000 500,000Note 2001–2008 3.75% 100,000 100,000Note 2001–2003 3.25% – 100,000Total 600,000 700,000
Note 9 Stockholders’ equity Share Legal Reserve for Other Retained(CHF in thousands) capital reserve treasury shares reserves earnings Net loss Total
Opening balance 3,000,023 600,005 2,944,904 302,968 4,952,659 (5,153,452) 6,647,107Release of other reserves (302,968) 302,968 –Allocation to retained earnings (5,153,452) 5,153,452 –Share capital increase 2,175,764 1,179,664 3,355,428Net release of reserve for treasury shares (2,533,090) 2,533,090 –Net loss for the year (1,060,766) (1,060,766)Closing balance sheet 5,175,787 1,779,669 411,814 2,533,090 102,175 (1,060,766) 8,941,769
Number of TotalShare capital as per December 31, 2003 registered shares Par value (CHF in thousands)
Issued shares 2,070,314,947 CHF 2.50 5,175,787Contingent shares 300,000,000 CHF 2.50 750,000Authorized shares 69,701,087 CHF 2.50 174,253
At the Company’s Annual General Meeting held on May 16, 2003, the Company’s shareholders approved amendments to its articles of incorporationproviding for authorized share capital and an increase in contingent share capital.
The amendments included the creation of CHF 250 million in authorized share capital. This entitled the Company’s Board of Directors to issue up to 100 million new shares of which approximately 30 million were allocated for use with the pre-packaged plan of reorganization of the Company’s U.S. subsidiary, Combustion Engineering Inc. The amendments also included an increase of contingent capital from CHF 200 million to CHF 750 million,allowing the issue of up to 300 million new shares.
On November 20, 2003, at an Extraordinary General Meeting of the shareholders, it was resolved to increase the Company’s share capital byapproximately 840 million shares through a rights issue which the Company completed in December issuing 840,006,602 new shares at an offer price of CHF 4 per share.
Treasury shares 2003 2002
Number of Avg. price per Number Avg. price pershares share /CHF of shares share /CHF
Opening balance 86,830,312 33.92 86,830,312 33.92Sales (80,000,000) – –Subtotal 6,830,312 29.46 86,830,312 33.92Purchase(1) 4,781,217 4.00 – –Purchase 30,298,913 6.32 – –Closing balance 41,910,442 9.83 86,830,312 33.92
(1) Rights exercised
In March 2003, the Company and its subsidiary, ABB Equity Limited sold 80,000,000 treasury shares for total gross proceeds of approximately CHF 217 million.
In connection with the 7-for-10 rights offering, the Company exercised, in December 2003, its rights in respect of the remaining 6,830,312 treasury sharesand received 4,781,217 shares at the offer price of CHF 4 per share.
In December 2003, the Company issued to ABB Asea Brown Boveri Ltd 30,298,913 shares for use with the pre-packaged plan of reorganization of theCompany’s U.S. subsidiary, Combustion Engineering Inc. These shares will be held as treasury shares until used in connection with the pre-packaged plan.
The net equity value of the Company as reflected in these unconsolidated financial statements is approximately CHF 8.9 billion compared to a net equityvalue of approximately CHF 3.7 billion (approximately US$ 3 billion) disclosed in the Consolidated Financial Statements of ABB Ltd. The difference derivesfrom the separate accounting bases applied to the unconsolidated and consolidated financial statements. In the unconsolidated financial statements, the net equity value reflects the use of the lower of cost or fair value to value ABB Ltd’s shares and participations in subsidiaries. Such fair values are deter-mined using the discounted cash flow method (DCF), based upon management’s expectations as to the future cash flows and earnings of the subsidiariesfor the years 2004 through 2008. The net equity value disclosed in the Consolidated Financial Statements reflects the aggregation of the equity of ABBLtd’s subsidiaries.

ABB Group Financial review 2003 101
Note 10 Contingent liabilities(CHF in thousands) 2003 2002
Liability to pension fund 532 1,034Financial guarantee to subsidiary(1) 333,762 333,275Total 334,294 334,309(1) Relates to an intra-group financing.
The Company has entered into Keep-well agreements with certain indirect subsidiaries. A Keep-well agreement is a shareholder agreement betweenthe Company and a subsidiary. These agreements provide for maintenance of a minimum net worth in the subsidiary and the maintenance of 100%direct or indirect ownership by the Company.
For those subsidiaries acting on the capital markets, the agreements additionally provide that if at any time the subsidiary has insufficient liquid assets tomeet any payment obligation on its debt (as defined in the agreements) and has insufficient unused commitments under its credit facilities with its lenders,the Company will make available to the subsidiary sufficient funds to enable it to fulfill such payment obligation as it falls due.
A Keep-well agreement is not a guarantee by the Company for payment of the indebtedness, or any other obligation, of a subsidiary. No party external tothe ABB Group is a party to any of these Keep-well agreements.
Combustion Engineering Inc, an indirect wholly owned subsidiary of the Company is defendant in numerous asbestos-related claims in the United States.Some claimants have named the Company and certain of its subsidiaries in connection with claims against Combustion Engineering Inc, but there has been no adjudication that any such entity has liability for such claims. There are also a lesser number of asbestos-related claims against certain othersubsidiaries of the Company, which are not related to Combustion Engineering Inc. Please refer to Note 18 of the Consolidated Financial Statements ofABB Ltd for more detailed information.
As further described in Note 18 of the Consolidated Financial Statements of ABB Ltd, it is contemplated that the Company and certain of its subsidiarieswill be liable for payments ranging from US$ 300 – 350 million. These payments will be set out in a promissory note to be issued on the effective date of theplan of reorganization of Combustion Engineering Inc under Chapter 11 of the U.S. Bankruptcy Code.
The Company is part of a value added tax group and therefore jointly liable to the federal tax department for the value added tax liabilities of the othermembers.
Note 11 Credit facility agreementOn November 17, 2003, the Company and certain of its subsidiaries entered into a new unsecured syndicated US$ 1 billion 3 year revolving credit facilitywhich became available in December 2003 after the fulfillment of certain conditions including the repayment and cancellation of the existing US$ 1.5 billioncredit facility. The Company is a guarantor of the new US$ 1 billion facility, but nothing was drawn under this facility at December 31, 2003.

102 ABB Group Financial review 2003
Proposed appropriation of available earnings
(CHF in thousands) 2003 2002
Net loss for the year (1,060,766) (5,153,452)Carried forward from previous year 102,175 4,952,659Release of other reserves 1,000,000 302,968Profit available to the Annual General Meeting 41,409 102,175Dividend – –Balance to be carried forward 41,409 102,175
The Board of Directors proposes to release CHF 1,000,000,000 of the other reserves to retained earnings, to not declare the distribution of a dividendand to carry forward the profit available to the Annual General Meeting in the amount of CHF 41,409,139.

ABB Group Financial review 2003 103
As statutory auditors, we have audited the accounting records and the financial statements (balance sheet, income statement and notes; pages 98 to 101) of ABB Ltd, Zurich, for the year ended December 31, 2003.
These financial statements are the responsibility of the Board of Directors. Our responsibility is to express an opinion on these financial statementsbased on our audit. We confirm that we meet the legal requirements concerning professional qualification and independence.
Our audit was conducted in accordance with auditing standards promulgated by the Swiss profession, which require that an audit be planned andperformed to obtain reasonable assurance about whether the financial statements are free from material misstatement. We have examined, on a testbasis, evidence supporting the amounts and disclosures in the financial statements. We have also assessed the accounting principles used, significant estimates made and the overall financial statement presentation. We believe that our audit provides a reasonable basis for our opinion.
In our opinion, the accounting records and financial statements and the proposed appropriation of available earnings comply with Swiss law and thecompany’s articles of incorporation.
We recommend that the financial statements submitted to you be approved.
Ernst &Young Ltd
C.Barone Y.VontobelCertified Public Accountant Certified Accountant
Auditors in charge
Zurich, February 18, 2004
Report of the Statutory Auditors

104 ABB Group Financial review 2003
ABB Ltd share price trend during 2003During 2003, the price of ABB Ltd shares traded on the SWX Swiss Exchange (virt-x) increased 101%, while the Swiss Performance Index increased 22%. The price of ABB Ltd shares on Stockholmsbörsen increased 80%, outperforming the SAX Index, which increased by 30%.
Source: Bloomberg, SWX Swiss Exchange (virt-x), Stockholmsbörsen
Share price (data based on closing prices)SWX Swiss Stockholmsbörsen
Exchange (virt-x/CHF) (SEK)
High 6.66 39.88
Low 2.02 12.81
Year-end 6.27 36.10
Average daily traded number of shares 15,055,000 6,211,000
Market capitalizationOn December 31, 2003, ABB Ltd’s market capitalization based on outstanding shares (total number of outstanding shares : 2,028,404,505) wasapproximately $ 10.3 billion (CHF 12.7 billion, SEK 74.2 billion, EUR 8.1 billion)
Shareholder structureAs of December 31, 2003, the total number of shareholders directly registered with ABB Ltd was approximately 174,000. In addition, another 100,000 shareholders hold shares indirectly through nominees. In total, ABB has approximately 274,000 shareholders.
Major shareholdersAs of December 31, 2003, Investor AB, Stockholm, Sweden, owned 204,115,142 shares of ABB Ltd, corresponding to 9.9% of total capital and votes.
On March 17, 2003, ABB Group announced that since March 14, 2003, it holds less than 1% of total capital and votes of ABB Ltd.
The Capital Group International, Inc., Los Angeles, CA, USA, informed ABB that as per December 31, 2003 it holds for its clients 133,888,830 sharesof ABB Ltd, corresponding to 6.5% of total capital and votes.
To the best of the company’s knowledge, no other shareholder holds 5% or more of the total voting rights.
Dividend recommendationTaking into consideration the net loss reported, the board of directors proposes that no dividend be paid for 2003.
Investor information

ABB Group Financial review 2003 105
Per-share data2003 2002
Dividend (CHF) n.a.(1) 0Par value (CHF) 2.50 2.50Vote per share 1 1Weighted average number of shares outstanding (in millions) 2 1,220 1,113Dilution from convertible bonds (in millions) – 53Diluted weighted average number of shares outstanding (in millions) 1,220 1,166(1) It will be proposed to the Annual General Meeting that no dividend be paid for 2003.(2) Following the rights issue completed in December 2003, there were 2,028,404,505 shares outstanding at December 31, 2003.
Key ratios(US$) 2003 2002
EBITDA per share 1 1.02 0.86Basic (loss) per share (0.63) (0.70)Diluted (loss) per share 1 (0.63) (0.83)Stockholders’ equity per share 2 1.49 0.91Cash flow per share 1 n.a. 0.02Dividend pay-out-ratio (%) n.a. n.a.Direct yield (%) n.a. n.a.Market-to-book (%) 340.4 310.6Basic P / E ratio n.a. n.a.Diluted P / E ratio n.a. n.a.(1) Calculation based on diluted weighted average number of shares outstanding(2) Calculation based on the number of shares outstanding as of December 31
ABB Ltd annual general meetingThe 2004 Annual General Meeting of ABB Ltd will be held at 10:00 a.m. on Tuesday, May 18, 2004 at the Messe Zurich hall in Zurich-Oerlikon,Switzerland. The General Meeting will be held principally in German and will be simultaneously translated into Swedish, English and French.Shareholders entered in the share register, with the right to vote, by May 7, 2004, are entitled to participate in the General Meeting.
Admission cardsHolders of registered shares of ABB Ltd will receive their admission cards on request using the reply form enclosed with the invitation. The reply form or a corresponding notification must reach the company not later than May 11, 2004. For technical reasons, notifications arriving after that datecan no longer be taken into consideration. The full text of the invitation in accordance with Article 700 of the Swiss Code of Obligations will be published in Schweizerisches Handelsamtsblatt on April 23, 2004.
For shareholders in Sweden an Information Meeting will be held in Västerås, Sweden, on May 24, 2004 at 4:00 p.m.
ABB shareholders’ calendar 2004Three months results 2004 April 29ABB Ltd Annual General Meeting, Zurich May 18ABB Ltd Information Meeting, Västerås May 24Six-month results 2004 July 29Nine-month results 2004 October 28

106 ABB Group Financial review 2003
Source: Bloomberg
Stock Exchange listingsABB Ltd is listed on the SWX Swiss Exchange (virt-x), Stockholmsbörsen, Frankfurt Stock Exchange, London Stock Exchange and New York Stock Exchange.
Ticker symbols for ABB LtdSWX Swiss Exchange (virt-x) ABBNStockholmsbörsen ABBFrankfurt Stock Exchange ABJLondon Stock Exchange ANNNew York Stock Exchange (NYSE) ABB
Ticker symbols for ABB Ltd at BloombergSWX Swiss Exchange (virt-x) ABBN VXStockholmsbörsen ABB SSFrankfurt Stock Exchange ABJ GRLondon Stock Exchange ANN LNNew York Stock Exchange (NYSE) ABB US
Ticker symbols for ABB Ltd at ReutersSWX Swiss Exchange (virt-x) ABBN.VXStockholmsbörsen ABB.STFrankfurt Stock Exchange ABBN.FLondon Stock Exchange ABBNq.LNew York Stock Exchange (NYSE) ABB.N
The global ISIN code for the ABB share is: CH 001 222 171 6.
Price trend for ABB Ltd shares
SEK
05
1015202530354045
1/03 2/03 3/03 4/03 5/03 6/03 7/03 8/03 9/03 10/03 11/03 12/03
CHF
01/03 2/03 3/03 4/03 5/03 6/03 7/03 8/03 9/03 10/03 11/03 12/03
1
2
3
4
5
6
7Price trend for ABB Ltd shares, ZurichSwiss Performance Index rebased, Zurich
Price trend for ABB Ltd shares, StockholmSAX Index rebased, Stockholm

ABB Group Financial review 2003 107
Credit rating for ABB Ltd as of December 31, 2003
Standard & Poor’sLong-term Corporate Credit Rating: BB+Long-term Senior Unsecured debt: BB–Short-term Corporate Credit Rating: BPositive Outlook
Moody’sLong-term Senior Implied Rating: Ba3Long-term Senior Unsecured Rating: B1Short-term Debt rating: Not PrimePositive Outlook
The credit rating can be subject to revision at any time.
Bondholder informationOutstanding public bonds as of February 29, 2004.
Issuer Original issued principal amount Coupon Due Bloomberg ticker Reuters ticker
ABB International Finance Ltd EUR 500 million 5.25% 2004 ABB 5.25 03/08/04 CH010817129=ABB International Finance Ltd ITL 200 billion 8.125% 2004 ABB 8.125 03/10/04 CH004909615=ABB Finance Inc. USD 250 million 6.75% 2004 ABB 6.75 06/03/04 CH007637454=ABB International Finance Ltd CHF 400 million 3% 2004 ABB 3 08/19/04 CH830110=ABB International Finance Ltd EUR 300 million 5.375% 2005 ABB 5.375 06/30/05 CH011319629=ABB International Finance Ltd JPY 50 billion 0.5% 2005 ABB 0.5 09/20/05 CH013519668=ABB International Finance Ltd EUR 475 million 5.125% 2006 ABB 5.125 01/11/06 CH012214901=ABB International Finance Ltd USD 968 million Convertible 4.625% 2007 ABB 4.625 05/16/07 CH014749721=ABB International Finance Ltd EUR 500 million 9.5%* 2008 ABB 9.5 01/15/08 CH014855653=ABB International Finance Ltd GBP 200 million 10%* 2009 ABB 10 05/29/09 CH014855661=ABB Ltd CHF 500 million 3.75% 2009 ABB 3.75 09/30/09 CH896367=SABB International Finance Ltd CHF 1,000 million Convertible 3.5% 2010 ABB 3.5 09/10/10 CH1653740=SABB International Finance Ltd EUR 650 million 6.5% 2011 ABB 6.5 11/30/11 CH018119617=
* Excl. step-up

108 ABB Group Financial review 2003
(US$ millions, other than ratios, employees and percentages) 2003 2002 2001
Consolidated Income StatementsRevenues 18,795 17,466 18,334Earnings before interest and taxes (EBIT) 656 346 517Income from continuing operations before taxes and minority interest 246 220 294Income from continuing operations 86 75 171Net income (767) (783) (729)
Consolidated Balance SheetsCash and equivalents 4,669 2,336 2,311Marketable securities 473 589 1,229Other current assets 16,371 17,522 19,603Non-current assets 8,900 9,086 9,162Total assets 30,413 29,533 32,305
Short-term borrowings and current maturities of long-term borrowings 1,597 2,570 4,701Other current liabilities 14,615 16,220 15,820Long-term borrowings 6,290 5,358 4,999Other long-term liabilities 4,600 4,114 4,595Stockholders’ equity including minority interest 3,311 1,271 2,190Total liabilities and stockholders’ equity 30,413 29,533 32,305
Consolidated Statements of Cash FlowsNet cash provided by (used in) operating activities (161) 19 1,983Net cash provided by (used in) investing activities 754 2,651 (1,218)Net cash provided by (used in) financing activities 1,591 (2,812) 677Effects of exchange rate changes on cash and equivalents – continuing operations 150 141 (72)Net change in cash and equivalents 2,333 25 1,126
Other dataOrders received 18,703 17,352 18,651EBITDA (1) 1,233 890 1,157Capital expenditures, excluding purchased intangible assets 399 436 551Research and development expense 613 547 590Order-related development expenditures 317 248 404Dividends declared pertaining to fiscal year (Swiss francs in millions) – – –Total debt 7,887 7,928 9,700Gearing 70% 86% 82%Net debt position (2,745) (5,003) (6,160)Net operating assets 9,686 9,826 9,478Number of employees 116,464 139,051 156,865
RatiosEarnings before interest and taxes/Revenues 3.5% 2.0% 2.8%Return on equity (38.0%) (52.4%) (20.4%)Current assets/Current liabilities 1.33 1.09 1.13Liquidity ratio 21.5% 18.5% 19.3%Net operating assets/Revenues 51.5% 56.3% 51.7%Net working capital/Revenues 10.7% 10.5% 8.6%
ABB Group statistical data

ABB Group Financial review 2003 109
Main exchange rates used in the translation of the Financial Statements
Average Year-end Average Year-endCurrency ISO Codes 2003/$ 2003/$ 2002/$ 2002/$
Australian dollar AUD 1.54 1.33 1.84 1.77Brazilian real BRL 3.10 2.90 2.94 3.54Canadian dollar CAD 1.41 1.29 1.57 1.58Chinese yuan renminbi CNY 8.28 8.28 8.28 8.28Danish krone DKK 6.56 5.91 7.90 7.08EURO EUR 0.88 0.79 1.06 0.95Indian rupee INR 46.61 45.60 48.55 47.97Japanese yen JPY 115.89 106.94 125.17 118.71Norwegian krone NOK 7.04 6.67 8.00 6.93Polish zloty PLN 3.90 3.74 4.07 3.83Pound sterling GBP 0.61 0.56 0.67 0.62Swedish krona SEK 8.08 7.20 9.71 8.74Swiss franc CHF 1.34 1.24 1.56 1.39
Exchange rates

The complete ABB Group Annual Report 2003 consists of anOperational review, a Financial review and a Sustainability review. For an additional copy of this or any other of the reviews, please use the contact information on the back of this document, or download copies from www.abb.com. The complete report is published in English, German, Swedish and French. The English-language version is binding.
Caution concerning forward-looking statementsThe ABB Group Annual Report 2003 includes forward-lookingstatements. In the Operational review, such statements areincluded in “Letter to shareholders,” “Chief financial officer’s report,”“Power Technologies,” “Automation Technologies” and “HumanResources” and in the Financial review, such statements areincluded in “Management discussion and analysis.” Additionally,the words “believe,” “may,” “will,” “estimate,” “continue,”“anticipate,” “intend,” “expect,” and similar words are intended toidentify forward-looking statements. We have based these forward-looking statements largely on current expectations and projectionsabout future events, financial trends and economic conditionsaffecting our business. These forward-looking statements aresubject to risks, uncertainties and assumptions, including amongother things, the following: (i) the difficulty of forecasting futuremarket and economic conditions; (ii) the effects of, and changesin, laws, regulations, governmental policies, taxation, or accountingstandards and practices; (iii) our ability to dispose of certain of ournon-core businesses on terms and conditions acceptable to us; (iv) our ability to manage our liquidity and further reduce ourindebtedness as planned; (v) the resolution of asbestos claimson terms and conditions satisfactory to us; (vi) the effects ofcompetition in the product markets and geographic areas inwhich we operate; (vii) our ability to anticipate and react to
technological change and evolving industry standards in themarkets we operate; (viii) the timely development of new products,technologies, and services that are useful for our customers; (ix)unanticipated cyclical downturns in some of the industries that weserve; (x) the risks inherent in large, long-term projects served byparts of our business; (xi) the difficulties encountered in operating inemerging markets; and (xii) other factors described in documentsthat we may furnish from time to time with the U.S. Securities andExchange Commission, including our Annual Reports on Form20-F. Although we believe that the expectations reflected in anysuch forward-looking statements are based on reasonableassumptions, we can give no assurance that they will be achieved.
We undertake no obligation to update publicly or revise anyforward-looking statements because of new information, futureevents or otherwise. In light of these risks and uncertainties, theforward-looking information, events and circumstances might notoccur. Our actual results and performance could differ substantially from those anticipated in our forward-looking statements.

ABB Group Annual Report 2003Financial review
AB
B G
roup A
nnual Rep
ort 2003 Financial review
ABB LtdCorporate CommunicationsP.O. Box 8131CH-8050 ZurichSwitzerlandTel: +41 (0)43 317 7111Fax: +41 (0)43 317 7958
www.abb.com
ABB LtdInvestor RelationsP.O. Box 8131CH-8050 ZurichSwitzerlandTel: +41 (0)43 317 7111Fax: +41 (0)43 317 9817
ABB Inc.Investor RelationsP.O. Box 5308Norwalk CT 06856-5308USATel: +1 203 750 7743Fax: +1 203 750 2262
ABB LtdInvestor RelationsSE-721 83 VästeråsSwedenTel: +46 (0)21 32 50 00Fax: +46 (0)21 32 54 48
© C
opyright 2004 AB
B. A
ll rights reserved.©
Designed by w
illiams &
phoa.


![[11] ABB Review 3_2008](https://static.fdocuments.us/doc/165x107/5527a726550346c3358b4854/11-abb-review-32008.jpg)