
A/B Testing at Scale
27
A/B Testing at Scale Slides at http://www.exp-platform.com/Documents/2016-12PavelUPittNR.pdf Pavel Dmitriev, Principal Data Scientist Analysis and Experimentation, Microsoft Joint work with members of the A&E/ExP team Some slides borrowed from talks by Ron Kohavi
-
Upload
pavel-dmitriev -
Category
Data & Analytics
-
view
269 -
download
0
Transcript of A/B Testing at Scale

A/B Testing at ScaleSlides at http://www.exp-platform.com/Documents/2016-12PavelUPittNR.pdf
Pavel Dmitriev, Principal Data ScientistAnalysis and Experimentation, MicrosoftJoint work with members of the A&E/ExP teamSome slides borrowed from talks by Ron Kohavi

2
AgendaIntroduction to controlled experimentsFour real examples: you’re the decision maker!Five Challenges
Pavel Dmitriev

3Pavel Dmitriev
A/B/n Tests aka Controlled ExperimentsA/B test is the simplest controlled
experimentA/B/n refers to multiple treatments MVT refers to multivariable designs (rarely
used at Microsoft)
Must run statistical tests to confirm differences are not due to chance
Best scientific way to prove causality, i.e., the changes in metrics are caused by changes introduced in the treatment
100%Users
50%Users
50%Users
Control:Existing System
Treatment:Existing System with Feature X
Users interactions instrumented, analyzed & compared
Analyze at the end of the experiment
4
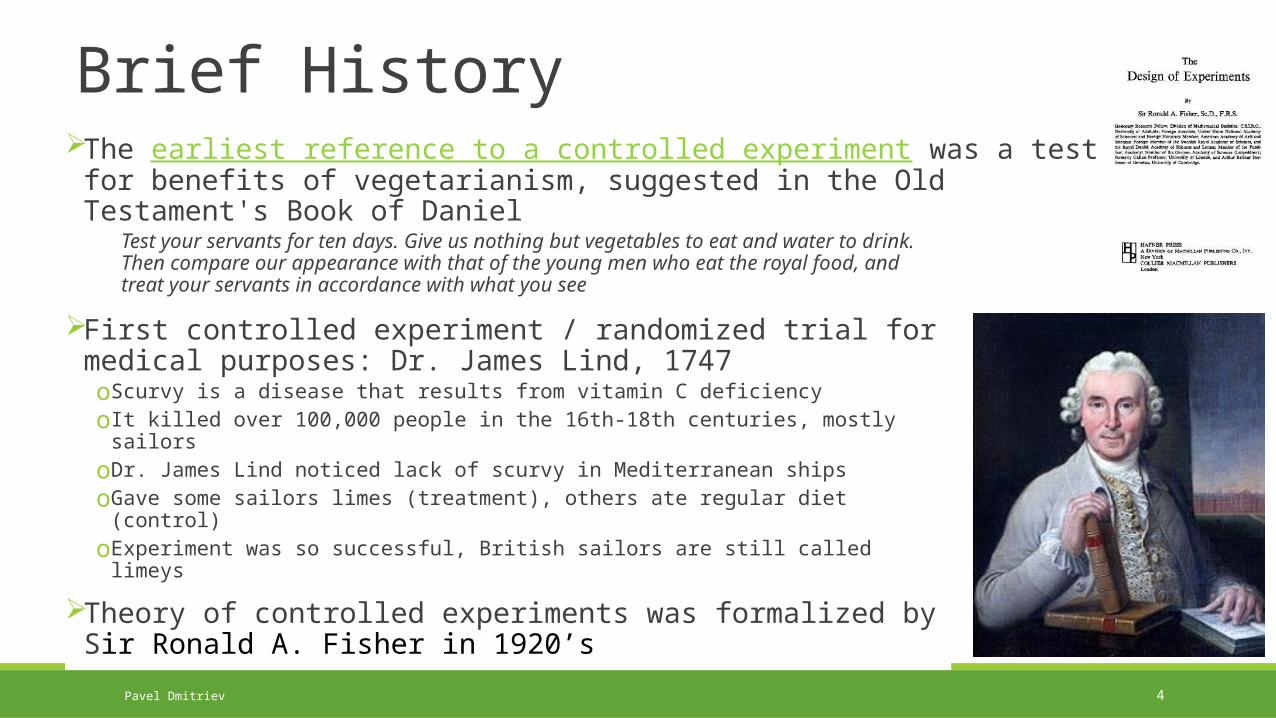
Brief HistoryThe earliest reference to a controlled experiment was a test for benefits
of vegetarianism, suggested in the Old Testament's Book of DanielTest your servants for ten days. Give us nothing but vegetables to eat and water to drink. Then compare our appearance with that of the young men who eat the royal food, and treat your servants in accordance with what you see
Pavel Dmitriev
First controlled experiment / randomized trial for medical purposes: Dr. James Lind, 1747oScurvy is a disease that results from vitamin C deficiencyoIt killed over 100,000 people in the 16th-18th centuries, mostly sailorsoDr. James Lind noticed lack of scurvy in Mediterranean shipsoGave some sailors limes (treatment), others ate regular diet (control)oExperiment was so successful, British sailors are still called limeys
Theory of controlled experiments was formalized by Sir Ronald A. Fisher in 1920’s

6
Motivation for A/B testing: Evolving Product Development Process
Classical software development: Spec->Dev->Test->ReleaseCustomer-driven development: Build->Measure->Learn (continuous
deployment cycles). Build MVP and iterate.oDescribed in Steve Blank’s The Four Steps to the Epiphany (2005)oPopularized by Eric Ries’ The Lean Startup (2011)oMeasure and Learn parts is where A/B testing comes in!
Why use Customer-driven Development?Because we are poor at assessing the value of our ideas
Pavel Dmitriev

7
Experimentation at Microsoft
Pavel Dmitriev

Play Time! Four real experiments that ran at MicrosoftAll had enough users for statistical validityFor each experiment, I tell you the OEC (Overall Evaluation Criterion) This is the criterion to determine which variant is the winner
Game: see how many you get right Everyone please stand upThree choices are:oA wins (the difference is statistically significant)oA and B are approximately the same (no stat sig difference)oB wins
Since there are 3 choices for each question, random guessing implies100%/3^4 = 1.2% will get all four questions right. Let’s see how much better than random we can get in this room!
9
Pavel Dmitriev
10
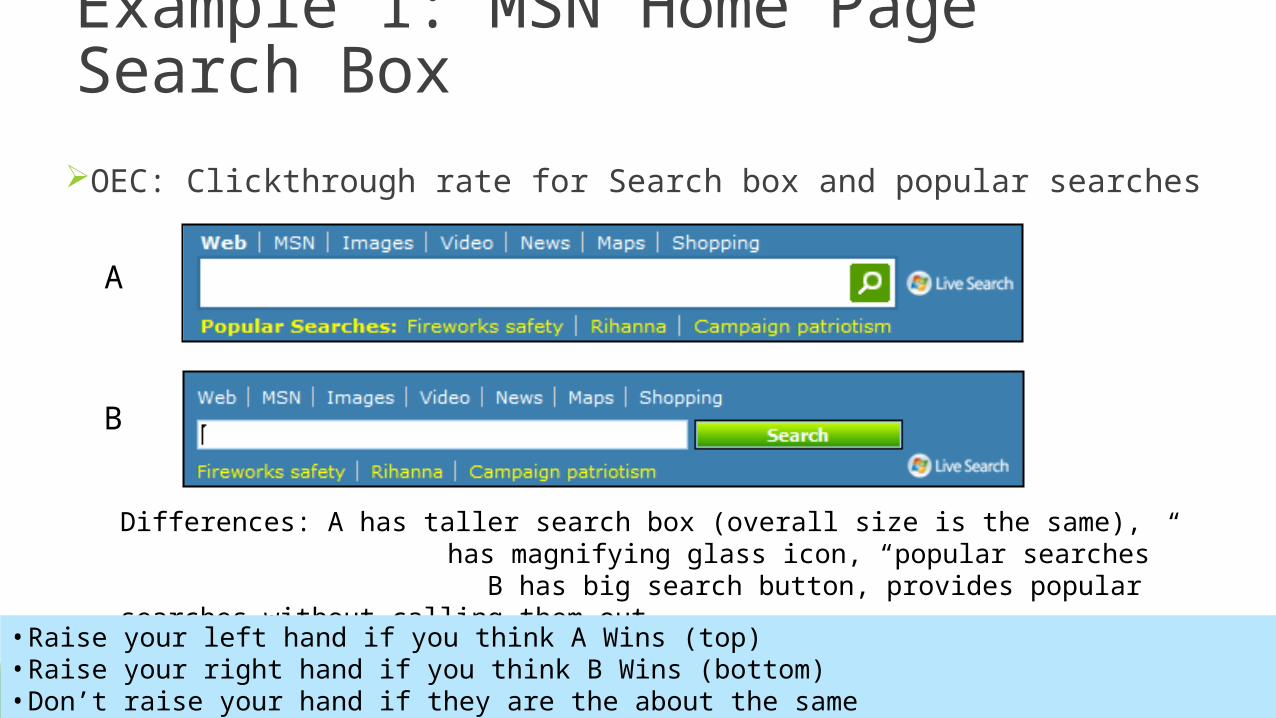
Example 1: MSN Home Page Search BoxOEC: Clickthrough rate for Search box and popular searches
Ronny Kohavi
A
Differences: A has taller search box (overall size is the same), has magnifying glass icon, “popular searches”
B has big search button, provides popular searches without calling them out
• Raise your left hand if you think A Wins (top)• Raise your right hand if you think B Wins (bottom)• Don’t raise your hand if they are the about the same
B
11
MSN Home Page Search BoxIf you raised any hand, please sit down
About 1/3 of the experiments don’t move the OEC stat. sig., yet (as in this room) most people are strongly opinionated towards one variant being better
Pavel Dmitriev

12
Example 2: Bing Ads with Site LinksShould Bing add “site links” to ads, which allow advertisers to offer several destinations
on ads?OEC: Revenue, ads constraint to same vertical pixels on avg
Pro adding: richer ads, users better informed where they landCons: Constraint means on average 4 “A” ads vs. 3 “B” ads
Variant B is 5msc slower (compute + higher page weight)
Ronny Kohavi
A B
• Raise your left hand if you think A Wins (left)• Raise your right hand if you think B Wins (right)• Don’t raise your hand if they are the about the same

13
Bing Ads with Site LinksIf you raised you left hand, please sit downIf you did not raise any hand, please sit down
Site links generate incremental revenue of tens of millions of dollars annually for Bing
Pavel Dmitriev

14
Example 3:SERP Truncation
SERP is a Search Engine Result Page(shown on the right for the query KDD 2015)
OEC: Clickthrough Rate on 1st SERP per query(ignore issues with click/back, page 2, etc.)
Version A: show 10 algorithmic resultsVersion B: show 8 algorithmic results by removing
the last two resultsAll else same: task pane, ads, related searches, etc.
Ronny Kohavi
• Raise your left hand if you think A Wins (10 results)• Raise your right hand if you think B Wins (8 results)• Don’t raise your hand if they are the about the same

15
SERP TruncationIf you raised you right hand, please sit downIf you raised your left hand, please sit down
Shifting clicks is easy, reducing abandonment is hard. See KDD 2014 paper (http://bit.ly/expRulesOfThumb).
Pavel Dmitriev

16
Example 4: Underlining LinksDoes underlining increase or decrease clickthrough-rate?
Ronny Kohavi

17
Example 4: Underlining LinksDoes underlining increase or decrease clickthrough-rate?OEC: Clickthrough Rate on 1st SERP per query
Ronny Kohavi
A B
• Raise your left hand if you think A Wins (left, with underlines)• Raise your right hand if you think B Wins (right, without underlines)• Don’t raise your hand if they are the about the same
18
Underlining LinksIf you raised you right hand, please sit downIf you did not raise any hand, please sit down
Modern web designs do not use underlines, and most sites adopted this design. This is despite data showing that users click less and take longer to click without underlines.
Pavel Dmitriev

19
Key Lesson: Hard to Assess the Value of Ideas Data Trumps Intuition
Features are built because teams believe they are useful. But most experiments show that features fail to move the metrics they were designed to improve
Based on experiments at Microsoft (paper)1/3 of ideas were positive ideas and statistically significant1/3 of ideas were flat: no statistically significant difference1/3 of ideas were negative and statistically significant
At Bing, the success rate is lowerThe low success rate has been documented many times across multiple
companies
Pavel Dmitriev

20
AgendaIntroduction to controlled experimentsFour real examples: you’re the decision makerFive Challenges
The difference between theory and practice is larger in practice than thedifference between theory and practice in theory
Pavel Dmitriev

21
Challenge 1: Trustworthiness
Two very good books on A/B testing get the stats wrong (see Amazon reviews). As new experiment designs and statistical techniques get deployed, in real
production system, making sure they work correctly is challengingo It took us ~2 years to get implementation of the CUPED variance reduction technique right
Metrics are added and modified ~daily, instrumentation changes ~weeklyBots may cause significant skews (over 50% of Bing traffic are bots) Great technique to find issues: run A/A tests
o Like an A/B test, but both variants are exactly the sameoAre users split according to the planned percentages? Is the data collected matching the system of
record? Are the results showing non-significant results 95% of the time?
Twyman’s Law: any figure that looks interesting or different is usually wrong
Getting numbers is easy.Getting numbers you can trust is hard. -- Ronny Kohavi
Pavel Dmitriev

22
Challenge 2: Protecting the User
As more and more ideas get tested, possibility of user harm increasesoBuggy feature or a bad idea making it to real usersoLess manual monitoring of experimentso Interactions are possible between concurrently running experiments
Need to minimize harm to users!Requires a combination of approaches
oAutomatically detect and shut down bad experiments, fast!oStart small and then ramp upoRun with partial exposure (e.g. only on 1 out of 10 queries)oRun non-overlapping experiments when suspect interactionsoAutomatically detect interactions (we run all-pairs test nightly)
If you have to kiss a lot of frogs to find a prince, find more frogs and kiss them faster and faster -- Mike Moran, Do it Wrong Quickly
Pavel Dmitriev

23
Challenge 3: The OEC
OEC = Overall Evaluation CriterionoLean Analytics call it OMTM: One Metric That Matters
A single metric or a few KEY metrics. Beware of the Otis Redding problem:“I can’t do what ten people tell me to do, so I guess I’ll remain the same.”
Two key properties (paper):oAlignment with long-term company goalsoAbility to impact (Sensitivity)
Designing a good OEC is hardoExample: OEC for a search engine
It’s not enough to do your best; You must know what to do, and then do your best. -- W. Edwards Deming
Pavel Dmitriev

24
Challenge 3: The OEC (Metric Sensitivity)OEC for a search engine:
Problem: almost never moves in our experimentsoStatistical power does not increase as experiment runs longer
◦ Width of the confidence interval is proportional to CV/, where CV = coefficient of variation = .◦ For many metrics CV is stable as experiment goes on, so confidence interval shrinks ~ 1/.◦ Not the case for Sessions/User
𝑄𝑢𝑒𝑟𝑖𝑒𝑠h𝑀𝑜𝑛𝑡 =
𝑄𝑢𝑒𝑟𝑖𝑒𝑠𝑆𝑒𝑠𝑠𝑖𝑜𝑛 ×
𝑆𝑒𝑠𝑠𝑖𝑜𝑛𝑠𝑈𝑠𝑒𝑟 × 𝑈𝑠𝑒𝑟𝑠
h𝑀𝑜𝑛𝑡
Solutions:oRun larger experiments (e.g. 50/50)oTriggering: analyze only users who were
exposed to the changeoVariance Reduction: CUPED technique uses
delta from pre-experiment period
oModify the metric, e.g. truncate at a threshold or change to a boolean form
oUse a more sensitive surrogate metric. E.g. Session Success Rate correlates well with Sessions/User move and is more sensitive◦ Optimization problem: maximize metric sensitivity given constraint of alignment
Pavel Dmitriev

25
Challenge 4: Violations of classical assumptions of a controlled experiment
Unstable user identifiers due to e.g. cookie churn and multiple device usage. Leads to the same real user potentially exposed to both treatment and controloMUID backup/restore (paper) helps but does not completely solve the problem
Leaks due to shared resourcesoCache is a shared resource. If control and treatment are of different size (e.g., control is 90%, treatment is 10%),
then control has a big advantage because its elements are cached more, leading to performance improvementso If treatment leaks memory on the server that servers requests for both control and treatment, performance slows
down equally for both variants and degradation is not reflected in the scorecard
Network interactions resulting in spill-over effectsoFacebook’s emotional contagion experiment (paper) suppressed positive posts for users. As a results users started
posting fewer positive posts themselves. This impacted their friends from both control and treatment in the same way.
While some partial mitigations exist, these are largely open problems
Every theory is correct in its own world, but the problem is that the theory may not make contact with this world. -- W. Edwards Deming
Pavel Dmitriev

26
Challenge 5: Analysis of Results (NHST)NHST = Null Hypothesis Testing, p-value <= 0.05 is the
common threshold for rejecting the null hypothesisP-value is often misinterpreted. Here are some incorrect
statements (from Steve Goodman’s A Dirty Dozen):1. If P = .05, the null hypothesis has only a 5% chance of being true2. A non-significant difference (e.g., P >.05) means there is no difference
between groups3. P = .05 means that if you reject the null hypothesis, the probability of a type I
error (false positive) is only 5%
NHST is asymmetric: can only reject the nullOther problems: multiple testing, early stoppingThe problem is that (loosely speaking) p-value is P(Data|H0), but we want P(H0|Data)One approach: Bayesian framework to estimate pos, neg, and flat, using a prior learned from past
experiments (paper)Pavel Dmitriev
Everything should be made as simple as possible, but not simpler. -- Albert Einstein

27
Challenge 5: Analysis of Results (Heterogeneous Treatment Effect)We know treatment effect differs from person to person:
oFeature is not popular in one country but good in othersoThe feature does not render correctly in a certain browser
There could be many sub-populations (segments) where treatment effect varies or even flips sign: browser, location, age, gender, etc.
Problem: thousands of metrics and hundreds of segments are impossible to examine manually; multiple testing issues
Machine Learning framework: o = treatment effect for a user, the difference between potential effects in treatment and control, X = segments. The
goal is to learn , and then use it to identify “interesting”/”different” segments. Note: is not observed.oActive research area, see e.g. paper
Visualization?
Pavel Dmitriev

29
SummaryWe are poor at assessing the value of ideas. Run experiment and get the data!While the theory of experimentation is well established, scaling
experimentation to millions of users, devices, platforms, websites, apps, social networks, etc. presents new challenges. Trustworthiness Protecting the users The OEC Violations of classical assumptions Analysis of results
Pavel Dmitriev
Exciting research area! Would love to have more academic involvement. No need for access to industry data; easy to setup and run experiments on your own web site, e-mail, social network, etc.
It doesn't matter how beautiful your theory is, it doesn't matter how smart you are. If it doesn't agree with experiment[s], it's wrong -- Richard Feynman
![Trustworthy analyses of online A/B testshqxu/dae2017/presentations/Lu_Jiannan.pdf · A/B Testing at Scale: Accelerating Software Innovation. SIGIR'17. Experimentation pipeline[3]](https://static.fdocuments.us/doc/165x107/600869353adb86487616ee5c/trustworthy-analyses-of-online-ab-hqxudae2017presentationslujiannanpdf-ab.jpg)