AASHTOWare Pavement ME User Manual - Virginia ... Pavement ME User Manual Virginia Department of...
55
AASHTOWare Pavement ME User Manual Virginia Department of Transportation Pavement Design and Evaluation Section Central Office, Materials Division September, 2017 Questions or comments should be directed to Affan Habib, P.E., Pavement Program Manager Central Office, Materials Division, Central Office 1401 E. Broad Street, Richmond, VA 23219 Ph: (804) 328-3129, email: [email protected]
Transcript of AASHTOWare Pavement ME User Manual - Virginia ... Pavement ME User Manual Virginia Department of...

AASHTOWare Pavement ME User
Manual
Virginia Department of Transportation Pavement Design and Evaluation Section
Central Office, Materials Division September, 2017
Questions or comments should be directed to Affan Habib, P.E., Pavement Program Manager
Central Office, Materials Division, Central Office 1401 E. Broad Street, Richmond, VA 23219
Ph: (804) 328-3129, email: [email protected]

THE CURRENT VERSION OF THE USER MANUAL IS SUBJECT TO CHANGE. USERS ARE ADVISED TO VERIFY THE LATEST VERSION OF THE USER MANUAL BEFORE USE.
Contents
1 Introduction ....................................................................................................................................... 7
2 Mechanistic-Empirical Pavement Design .......................................................................................... 8
3 Pavement ME Introduction ............................................................................................................... 9
3.1 Input Levels ............................................................................................................................. 10
3.2 Saving Designs in Pavement ME ............................................................................................. 11
4 Project Inputs .................................................................................................................................. 12
4.1 General Information ............................................................................................................... 12
4.2 Traffic Inputs ........................................................................................................................... 13
4.2.1 Site-Specific Traffic Inputs ............................................................................................... 14 4.2.2 Statewide Average Traffic Inputs .................................................................................... 15
4.3 Climate Input ........................................................................................................................... 15
4.3.1 Single Weather Station ................................................................................................... 16 4.3.2 Virtual Weather Station .................................................................................................. 17 4.3.3 Depth of Water Table...................................................................................................... 17
5 Pavement Layer Inputs .................................................................................................................... 18
5.1 Asphalt Material Inputs ........................................................................................................... 18
5.1.1 Asphalt Open Graded Drainage Layer (OGDL) ................................................................ 19 5.2 Concrete Material Inputs ........................................................................................................ 20
5.3 Chemically Stabilized Base Inputs ........................................................................................... 22
5.3.1 Modelling of chemically stabilized layers under flexible pavement ............................... 22 5.3.2 Modelling of chemically stabilized layers under rigid pavement ................................... 22
5.4 Aggregate Base Inputs ............................................................................................................ 23
5.5 Subgrade Inputs ...................................................................................................................... 24
6 Calibration Factors .......................................................................................................................... 26
6.1 Changing Calibration Factors .................................................................................................. 26
7 Performing Analysis ......................................................................................................................... 29
8 Reporting ......................................................................................................................................... 34
9 References ....................................................................................................................................... 35
Appendix A Traffic Inputs ............................................................................................................... 36
Appendix B Asphalt Material Inputs .............................................................................................. 38
Appendix C Concrete Material Inputs ............................................................................................ 40
Appendix D Chemically Stabilized Layers input as Non-Stabilized/Subgrade Layers ..................... 41
Appendix E Chemically Stabilized Layer Inputs under rigid layer .................................................. 44

Appendix F Aggregate Base Material Inputs .................................................................................. 45
Appendix G Subgrade Material Correlation and Inputs ................................................................. 46
Appendix H Pavement Design with Pavement ME Walkthrough ................................................... 47
List of Figures Figure 2-1: Pavement ME Design Process .............................................................................................. 8 Figure 3-1: Screenshot of Pavement ME with Labels Added ................................................................. 9 Figure 4-1: Weather Station Locations in Virginia ................................................................................ 17 Figure 5-1: Screenshot of Resilient Modulus Input .............................................................................. 25 Figure 6-1: Calibration Factors in Explorer Pane .................................................................................. 28 Figure 7-1: Analyzing Distress output graph at different time frame .................................................. 30 Figure 7-2: Analyzing Distress output using Excel Report .................................................................... 30 Figure H-1: Pavement ME Login Screen ............................................................................................... 47 Figure H-2: Main Project Window ....................................................................................................... 48 Figure H-3: Traffic Input Window ........................................................................................................ 49 Figure H-4: Axle Load Spectra Import from Database .......................................................................... 50 Figure H-5: Axle Load Spectra from XML file ........................................................................................ 50 Figure H-6: Single Weather Station Selection ...................................................................................... 51 Figure H-7: Virtual Weather Station Selection ..................................................................................... 51 Figure H-8: Add Layer Window ............................................................................................................. 52 Figure H-9: Importing Properties from Database ................................................................................. 52 Figure H-10: Progress Window ............................................................................................................. 53 Figure H-11: Pavement ME Analysis Output Summary ........................................................................ 54 Figure H-12: Sensitivity Analysis option ............................................................................................... 55
List of Tables
Table 4-1: Pavement ME Reliability Inputs* ........................................................................................ 12 Table 4-2: Flexible Pavement Performance Limits ............................................................................... 13 Table 4-3: CRCP Pavement Performance Limits ................................................................................... 13 Table 4-4: JPCP Pavement Performance Limits .................................................................................... 13 Table 4-5: Traffic Input Parameters ..................................................................................................... 14 Table 4-6: Lane Distribution Factors .................................................................................................... 14 Table 4-7: Climate Input Parameters ................................................................................................... 15 Table 4-8: Virginia weather stations included in Pavement ME .......................................................... 16 Table 5-1: Asphalt Material Input Parameters .................................................................................... 18 Table 5-2: Asphalt Concrete Layer Properties Input Parameters ........................................................ 19 Table 5-3: Asphalt Mix Catalog ............................................................................................................. 19 Table 5-4: Concrete Material Input Parameters .................................................................................. 20 Table 5-5. CRCP Design Parameters .................................................................................................... 21 Table 5-6. JPCP Design Parameters ..................................................................................................... 21 Table 5-7: Chemically Stabilized (as high quality aggregate) layers input file names .......................... 22 Table 5-8. Chemically Stabilized Layer Input Parameters under rigid pavement ................................ 23 Table 5-9. Aggregate Base Input Parameters ...................................................................................... 23 Table 5-10. Subgrade Input Parameters .............................................................................................. 24 Table 5-11. Resilient Modulus Inputs for Subgrade Fill Material ........................................................ 25 Table 6-1: VDOT Calibration factors ..................................................................................................... 26 Table 7-1: Guidance for Modifying HMA Trial Designs to Satisfy Performance Criteria (from AASHTO Mechanistic – Empirical Pavement Design Guide, Manual of Practice 2015) ...................................... 31 Table 7-2: Guidance on Modifying JPCP Designs to Satisfy Performance Criteria (from AASHTO Mechanistic – Empirical Pavement Design Guide, Manual of Practice 2015) ...................................... 32
Table 7-3: Guidance on Modifying CRCP Designs to Satisfy Performance Criteria (from AASHTO Mechanistic – Empirical Pavement Design Guide, Manual of Practice 2015) ...................................... 33 Table A-1: Vehicle Class Distribution Averages .................................................................................... 36 Table A-2: Example Calculating Vehicle Class Distribution from VDOT Traffic Data from data ........... 36 Table A-3: Statewide Axles Per Truck Inputs- ....................................................................................... 37 Table B-1: Average Asphalt Mix Properties for Level 1 Input .............................................................. 38 Table C-1: Typical Concrete Mix Properties for VDOT ......................................................................... 40 Table D-1: Estimated properties of CTA as non-stabilized layer .......................................................... 41 Table D-2: Estimated properties of VDOT Lime/ Cement stabilized soil as subgrade layer................. 42 Table D-3: Estimated properties of FDR as non-stabilized layer .......................................................... 43 Table E-1: Typical Cement Treated Aggregate (CTA) properties as chemically stabilized layer .......... 44 Table E-2: Cement Stabilized FDR estimated properties as chemically stabilized layer ...................... 44 Table F-1: Rock Group .......................................................................................................................... 45 Table F-2: Typical Input Parameters for VDOT 21A/21B Aggregate Base Materials ............................ 45 Table G-1: Correlation between Unconfined Compression Strength to Resilient Modulus for Fine-Grained Soils ......................................................................................................................................... 46 Table G-2: Typical Soil Properties for Virginia Fine-Grained Soils ........................................................ 46

7
1 Introduction
This document provides the information that is used by VDOT Staff, Consultants, and Contractors to design and analyze new, reconstruction, and lane widening projects in primary interstate roadways by using AASHTOWare Pavement ME version 2.2.6 software. High volume secondary roadways (Average Daily Traffic (ADT) > 10,000) maybe designed using AASHTOWare Pavement ME version 2.2.6 at the discretion of the District Materials Engineer. This document is also intended to help provide guidance for designers using the AASHTOWare Pavement ME software. However, this document does not replace the need for in-depth understanding and training on the mechanistic empirical pavement design process and Pavement ME software. More detailed information on Pavement ME is available through the AASHTO document titled ‘MEPDG: A Manual of Practice’ (1). The help document provided with the software provides more information on using the software and describing some inputs (2).
Pavement Designers outside VDOT can obtain the required information about AASHTOWare Pavement ME software from AASHTO website using the following link; http://www.aashtoware.org/Pavement/Pages/default.aspx
Virginia specific material, traffic, and climate input files can be downloaded by using the following link; http://www.virginiadot.org/business/materials-download-docs.asp under Pavement Design & Evaluation Documents. The downloaded files must be unzipped and saved in user’s computer. Consultants and Contractors who are designing VDOT projects must use AASHTOWare Pavement ME version 2.2.6 must use Virginia specific input values in their design as described in this user manual.
The respective District Materials Engineer has the ultimate authority of resolving any design related issue with MEPDG. Given the Department is still on the learning curve with MEPDG and some features of MEPDG are still being evaluated by AASHTO, the District Materials Engineer can adjust the design using MEPDG in consultation with CO Materials Pavement Design and Evaluation section.
8
2 Mechanistic-Empirical Pavement Design
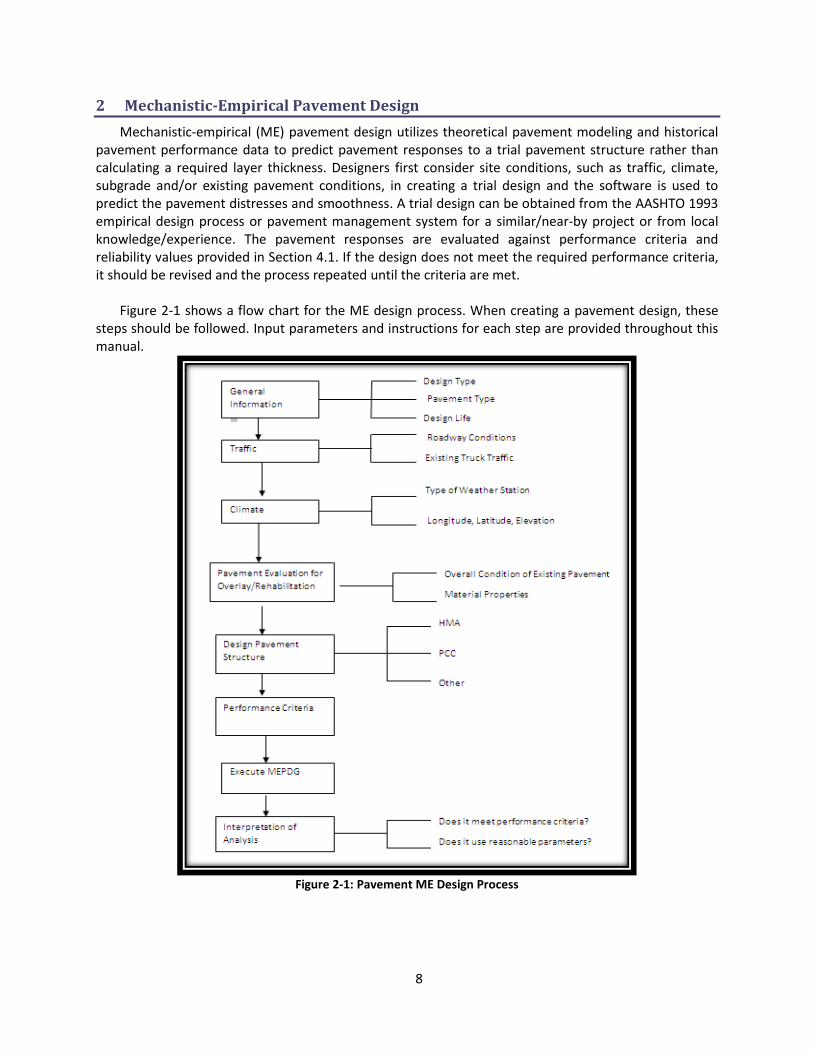
Mechanistic-empirical (ME) pavement design utilizes theoretical pavement modeling and historical pavement performance data to predict pavement responses to a trial pavement structure rather than calculating a required layer thickness. Designers first consider site conditions, such as traffic, climate, subgrade and/or existing pavement conditions, in creating a trial design and the software is used to predict the pavement distresses and smoothness. A trial design can be obtained from the AASHTO 1993 empirical design process or pavement management system for a similar/near-by project or from local knowledge/experience. The pavement responses are evaluated against performance criteria and reliability values provided in Section 4.1. If the design does not meet the required performance criteria, it should be revised and the process repeated until the criteria are met.
Figure 2-1 shows a flow chart for the ME design process. When creating a pavement design, these
steps should be followed. Input parameters and instructions for each step are provided throughout this manual.
Figure 2-1: Pavement ME Design Process
9
3 Pavement ME Introduction
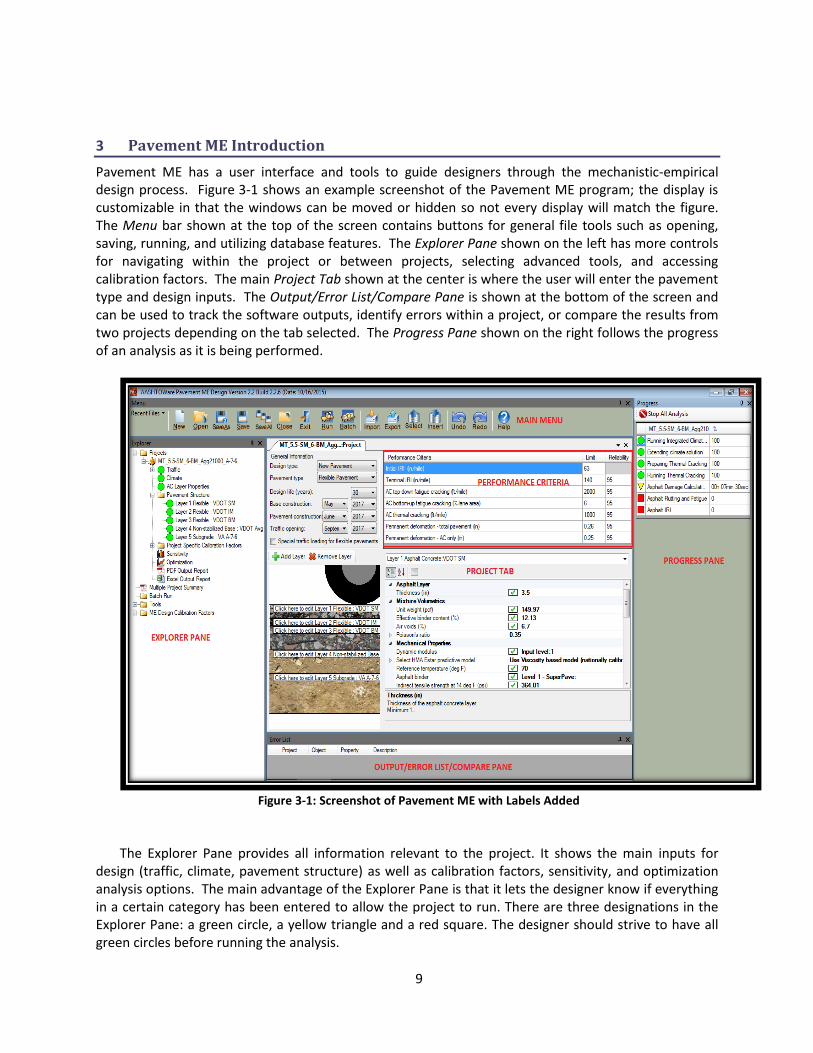
Pavement ME has a user interface and tools to guide designers through the mechanistic-empirical design process. Figure 3-1 shows an example screenshot of the Pavement ME program; the display is customizable in that the windows can be moved or hidden so not every display will match the figure. The Menu bar shown at the top of the screen contains buttons for general file tools such as opening, saving, running, and utilizing database features. The Explorer Pane shown on the left has more controls for navigating within the project or between projects, selecting advanced tools, and accessing calibration factors. The main Project Tab shown at the center is where the user will enter the pavement type and design inputs. The Output/Error List/Compare Pane is shown at the bottom of the screen and can be used to track the software outputs, identify errors within a project, or compare the results from two projects depending on the tab selected. The Progress Pane shown on the right follows the progress of an analysis as it is being performed.
Figure 3-1: Screenshot of Pavement ME with Labels Added
The Explorer Pane provides all information relevant to the project. It shows the main inputs for
design (traffic, climate, pavement structure) as well as calibration factors, sensitivity, and optimization analysis options. The main advantage of the Explorer Pane is that it lets the designer know if everything in a certain category has been entered to allow the project to run. There are three designations in the Explorer Pane: a green circle, a yellow triangle and a red square. The designer should strive to have all green circles before running the analysis.
10
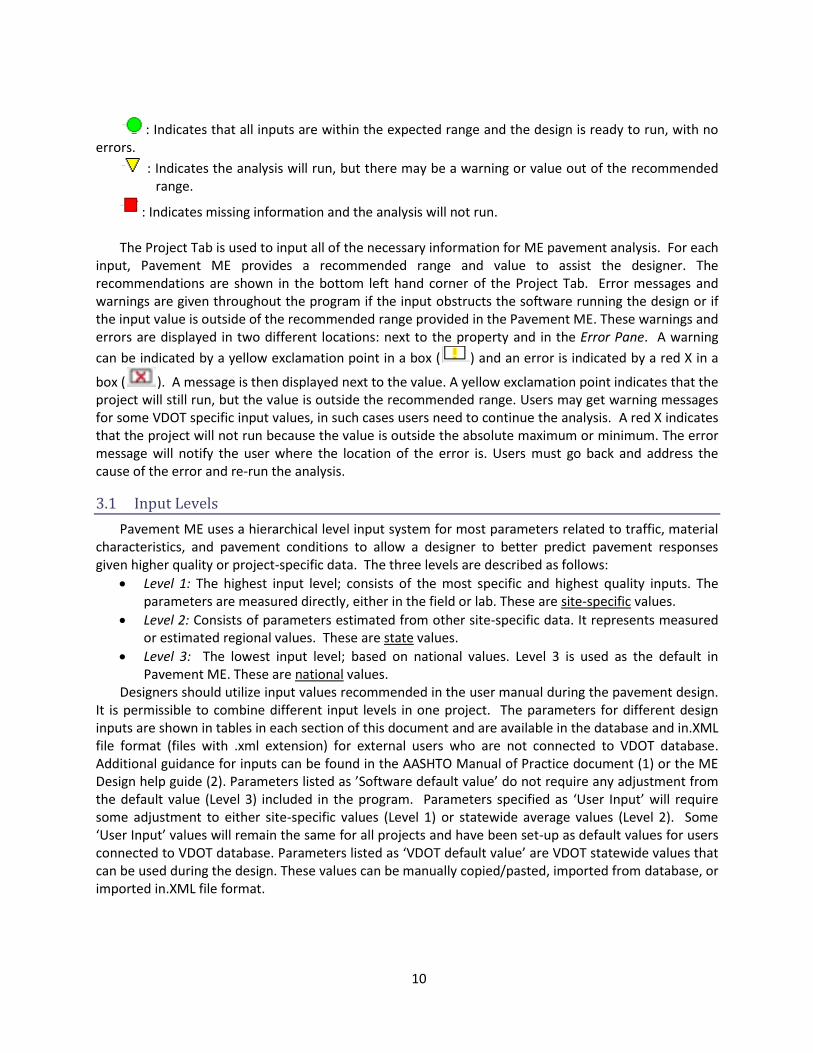
: Indicates that all inputs are within the expected range and the design is ready to run, with no errors.
: Indicates the analysis will run, but there may be a warning or value out of the recommended range.
: Indicates missing information and the analysis will not run. The Project Tab is used to input all of the necessary information for ME pavement analysis. For each
input, Pavement ME provides a recommended range and value to assist the designer. The recommendations are shown in the bottom left hand corner of the Project Tab. Error messages and warnings are given throughout the program if the input obstructs the software running the design or if the input value is outside of the recommended range provided in the Pavement ME. These warnings and errors are displayed in two different locations: next to the property and in the Error Pane. A warning
can be indicated by a yellow exclamation point in a box ( ) and an error is indicated by a red X in a
box ( ). A message is then displayed next to the value. A yellow exclamation point indicates that the project will still run, but the value is outside the recommended range. Users may get warning messages for some VDOT specific input values, in such cases users need to continue the analysis. A red X indicates that the project will not run because the value is outside the absolute maximum or minimum. The error message will notify the user where the location of the error is. Users must go back and address the cause of the error and re-run the analysis.
3.1 Input Levels
Pavement ME uses a hierarchical level input system for most parameters related to traffic, material characteristics, and pavement conditions to allow a designer to better predict pavement responses given higher quality or project-specific data. The three levels are described as follows:
Level 1: The highest input level; consists of the most specific and highest quality inputs. The parameters are measured directly, either in the field or lab. These are site-specific values.
Level 2: Consists of parameters estimated from other site-specific data. It represents measured or estimated regional values. These are state values.
Level 3: The lowest input level; based on national values. Level 3 is used as the default in Pavement ME. These are national values.
Designers should utilize input values recommended in the user manual during the pavement design. It is permissible to combine different input levels in one project. The parameters for different design inputs are shown in tables in each section of this document and are available in the database and in.XML file format (files with .xml extension) for external users who are not connected to VDOT database. Additional guidance for inputs can be found in the AASHTO Manual of Practice document (1) or the ME Design help guide (2). Parameters listed as ’Software default value’ do not require any adjustment from the default value (Level 3) included in the program. Parameters specified as ‘User Input’ will require some adjustment to either site-specific values (Level 1) or statewide average values (Level 2). Some ‘User Input’ values will remain the same for all projects and have been set-up as default values for users connected to VDOT database. Parameters listed as ‘VDOT default value’ are VDOT statewide values that can be used during the design. These values can be manually copied/pasted, imported from database, or imported in.XML file format.

11
3.2 Saving Designs in Pavement ME
Pavement ME saves project files in the .dgpx format. These files include all of the input values for each project, but the analysis results are saved into a file folder with the same project name in the same directory. While it may be convenient for users to keep a copy of the project files on a server location where they are backed-up and others can access them, all project files should be placed on the computer hard drive to be analyzed. This helps prevent some issues that have been reported when analyzing a project file saved in a network location for users connected to database.
12
4 Project Inputs
4.1 General Information
The first step in creating a new project is to select the general information on the project such as pavement type and analysis period. The design type and pavement type will depend on the project needs; some projects may involve separate designs with different pavement types. The types for new pavement design are flexible, jointed plain concrete pavements (JPCP), and continuously reinforced concrete pavements (CRCP). An analysis period of 30 years should be used for all designs. The General Information page within the Project Tab also requires an input for the month and year of construction. Because the exact opening month may not be known at the time of design, it is adequate to use the default months and the best estimate of the year of completion.
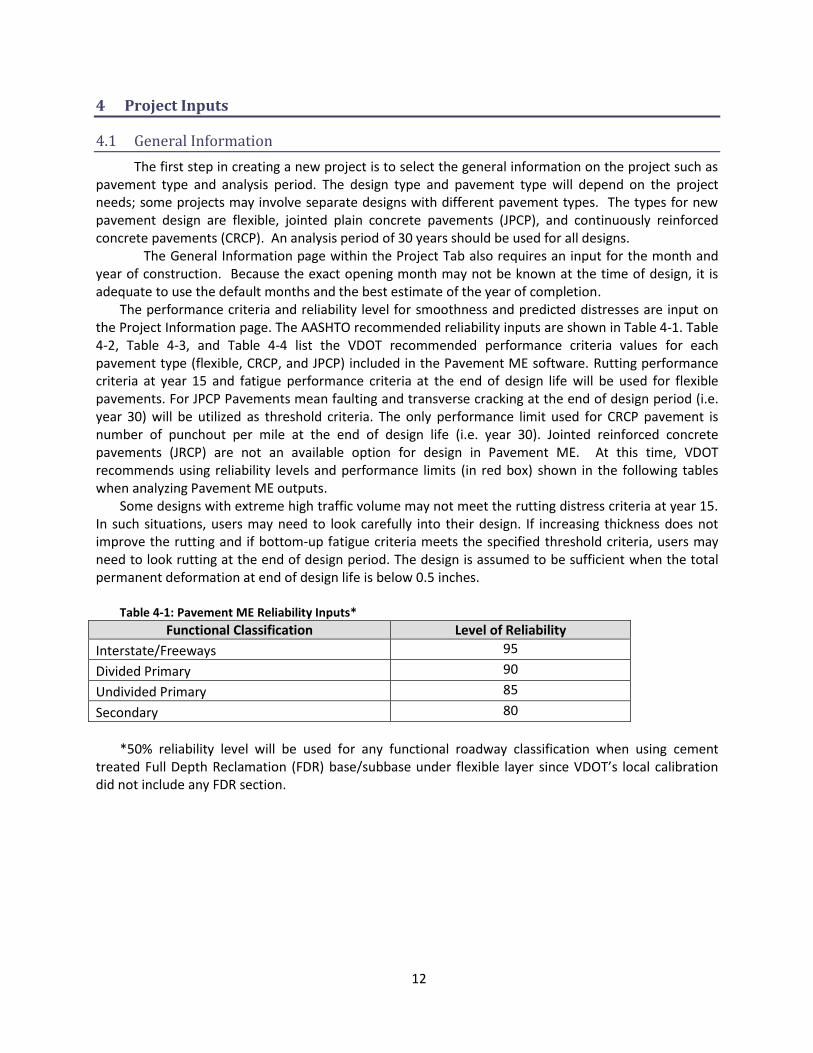
The performance criteria and reliability level for smoothness and predicted distresses are input on the Project Information page. The AASHTO recommended reliability inputs are shown in Table 4-1. Table
4-2, Table 4-3, and Table 4-4 list the VDOT recommended performance criteria values for each pavement type (flexible, CRCP, and JPCP) included in the Pavement ME software. Rutting performance criteria at year 15 and fatigue performance criteria at the end of design life will be used for flexible pavements. For JPCP Pavements mean faulting and transverse cracking at the end of design period (i.e. year 30) will be utilized as threshold criteria. The only performance limit used for CRCP pavement is number of punchout per mile at the end of design life (i.e. year 30). Jointed reinforced concrete pavements (JRCP) are not an available option for design in Pavement ME. At this time, VDOT recommends using reliability levels and performance limits (in red box) shown in the following tables when analyzing Pavement ME outputs.
Some designs with extreme high traffic volume may not meet the rutting distress criteria at year 15. In such situations, users may need to look carefully into their design. If increasing thickness does not improve the rutting and if bottom-up fatigue criteria meets the specified threshold criteria, users may need to look rutting at the end of design period. The design is assumed to be sufficient when the total permanent deformation at end of design life is below 0.5 inches.
Table 4-1: Pavement ME Reliability Inputs*
Functional Classification Level of Reliability
Interstate/Freeways 95
Divided Primary 90
Undivided Primary 85
Secondary 80
*50% reliability level will be used for any functional roadway classification when using cement
treated Full Depth Reclamation (FDR) base/subbase under flexible layer since VDOT’s local calibration did not include any FDR section.
13
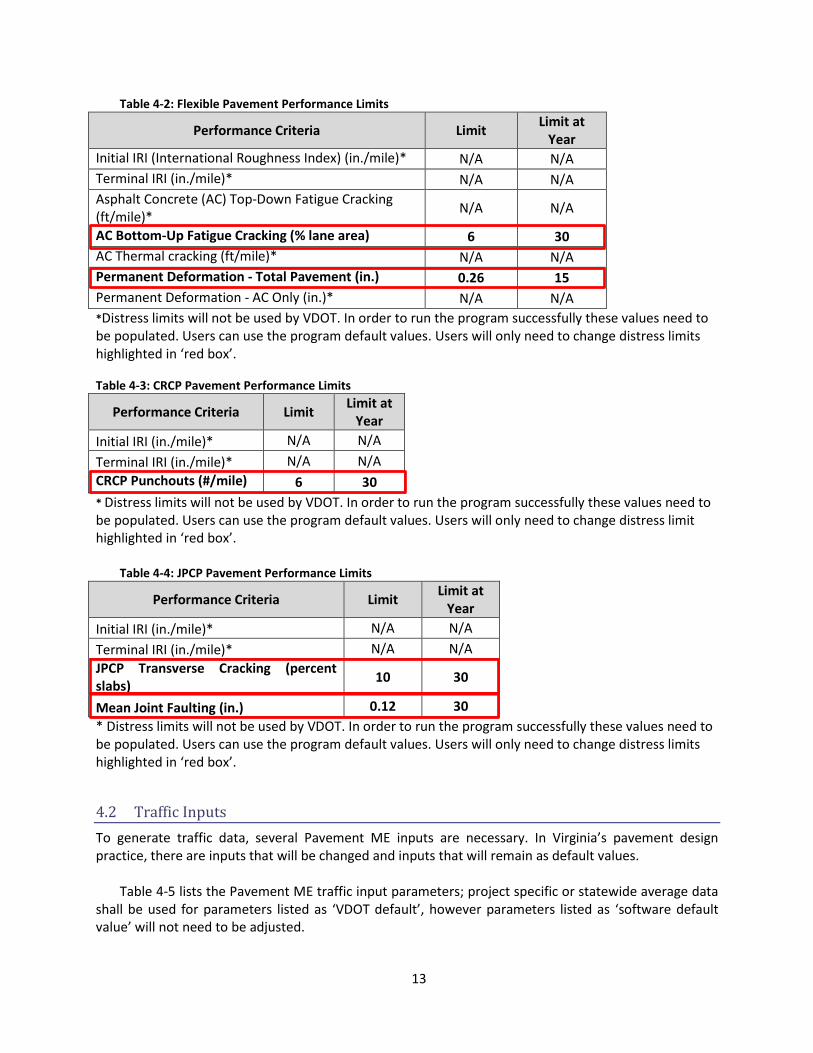
Table 4-2: Flexible Pavement Performance Limits
Performance Criteria Limit Limit at
Year
Initial IRI (International Roughness Index) (in./mile)* N/A N/A
Terminal IRI (in./mile)* N/A N/A
Asphalt Concrete (AC) Top-Down Fatigue Cracking (ft/mile)*
N/A N/A
AC Bottom-Up Fatigue Cracking (% lane area) 6 30
AC Thermal cracking (ft/mile)* N/A N/A
Permanent Deformation - Total Pavement (in.) 0.26 15
Permanent Deformation - AC Only (in.)* N/A N/A
*Distress limits will not be used by VDOT. In order to run the program successfully these values need to be populated. Users can use the program default values. Users will only need to change distress limits highlighted in ‘red box’.
Table 4-3: CRCP Pavement Performance Limits
Performance Criteria Limit Limit at
Year
Initial IRI (in./mile)* N/A N/A
Terminal IRI (in./mile)* N/A N/A
CRCP Punchouts (#/mile) 6 30
* Distress limits will not be used by VDOT. In order to run the program successfully these values need to be populated. Users can use the program default values. Users will only need to change distress limit highlighted in ‘red box’.
Table 4-4: JPCP Pavement Performance Limits
Performance Criteria Limit Limit at
Year
Initial IRI (in./mile)* N/A N/A
Terminal IRI (in./mile)* N/A N/A
JPCP Transverse Cracking (percent slabs)
10 30
Mean Joint Faulting (in.) 0.12 30
* Distress limits will not be used by VDOT. In order to run the program successfully these values need to be populated. Users can use the program default values. Users will only need to change distress limits highlighted in ‘red box’.
4.2 Traffic Inputs
To generate traffic data, several Pavement ME inputs are necessary. In Virginia’s pavement design practice, there are inputs that will be changed and inputs that will remain as default values.
Table 4-5 lists the Pavement ME traffic input parameters; project specific or statewide average data
shall be used for parameters listed as ‘VDOT default’, however parameters listed as ‘software default value’ will not need to be adjusted.
14
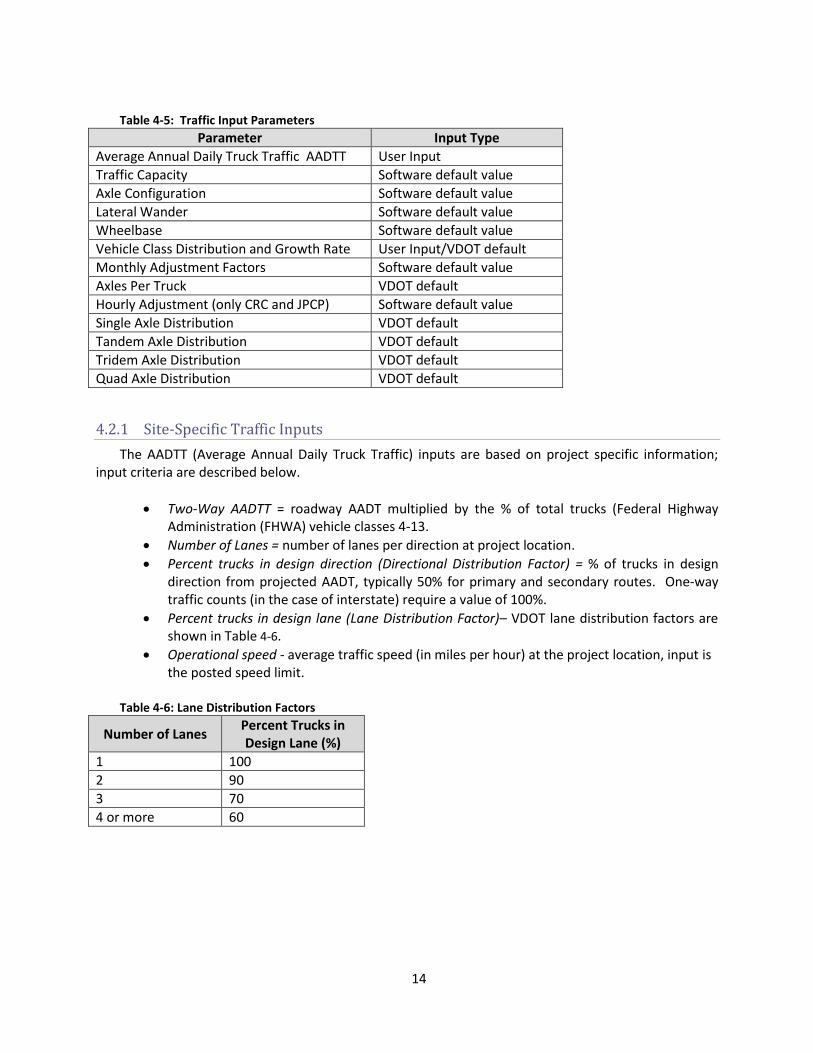
Table 4-5: Traffic Input Parameters
Parameter Input Type
Average Annual Daily Truck Traffic AADTT User Input
Traffic Capacity Software default value
Axle Configuration Software default value
Lateral Wander Software default value
Wheelbase Software default value
Vehicle Class Distribution and Growth Rate User Input/VDOT default
Monthly Adjustment Factors Software default value
Axles Per Truck VDOT default
Hourly Adjustment (only CRC and JPCP) Software default value
Single Axle Distribution VDOT default
Tandem Axle Distribution VDOT default
Tridem Axle Distribution VDOT default
Quad Axle Distribution VDOT default
4.2.1 Site-Specific Traffic Inputs
The AADTT (Average Annual Daily Truck Traffic) inputs are based on project specific information; input criteria are described below.
Two-Way AADTT = roadway AADT multiplied by the % of total trucks (Federal Highway Administration (FHWA) vehicle classes 4-13.
Number of Lanes = number of lanes per direction at project location.
Percent trucks in design direction (Directional Distribution Factor) = % of trucks in design direction from projected AADT, typically 50% for primary and secondary routes. One-way traffic counts (in the case of interstate) require a value of 100%.
Percent trucks in design lane (Lane Distribution Factor)– VDOT lane distribution factors are shown in Table 4-6.
Operational speed - average traffic speed (in miles per hour) at the project location, input is the posted speed limit.
Table 4-6: Lane Distribution Factors
Number of Lanes Percent Trucks in Design Lane (%)
1 100
2 90
3 70
4 or more 60
15
4.2.2 Statewide Average Traffic Inputs
The use of the provided statewide average data following traffic inputs is acceptable for the following inputs if project specific information is unavailable.
Vehicle Class Distribution factors are based on project specific classification data from traffic engineering when available (a conversion method to FHWA classes 4 – 13 is shown in Appendix A). Statewide average truck classifications are presented in Appendix A for use when site-specific information is unavailable. The growth rate is calculated from the overall AADT and input for each vehicle classification type as compound growth type.
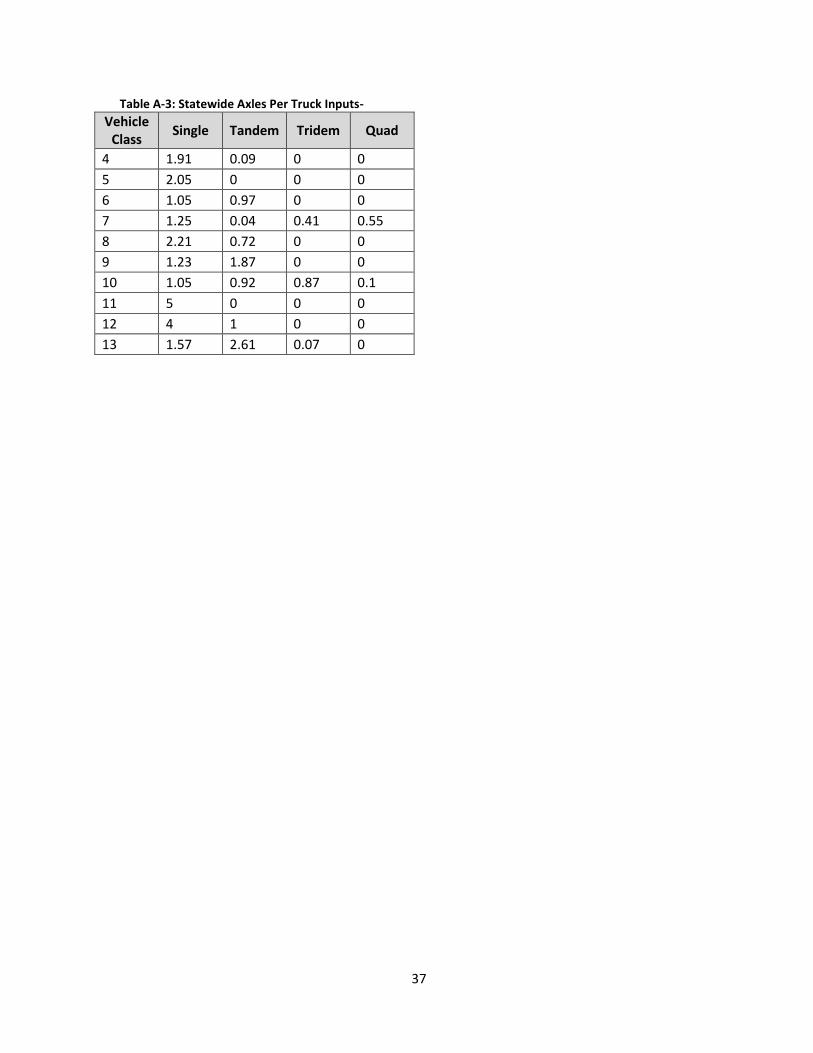
Axles per Truck inputs shall be from statewide average values, these values are shown in Appendix A. Users connected to VDOT database will have the Axle per Truck inputs as a default in their Pavement ME program. Users who are not connected to VDOT database can manually entered or copy/paste from the excel file included in VDOT input files.
Axle Load Distribution factors inputs are to be based on statewide average load spectra data. Users connected to VDOT database will have the statewide Axle Load Distribution factors as a default in their Pavement ME program. Users who are not connected to VDOT database can import ‘Axle Load Distribution Factors’ in .XML file format. These files are included in VDOT input files folder.
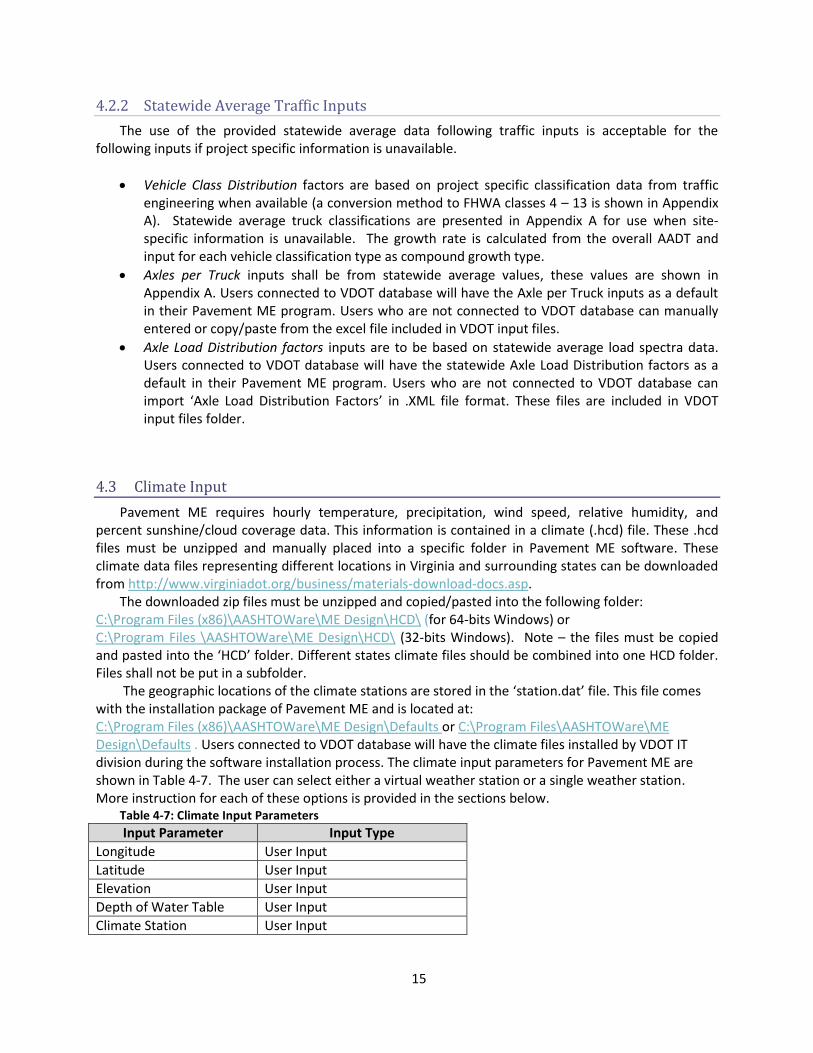
4.3 Climate Input
Pavement ME requires hourly temperature, precipitation, wind speed, relative humidity, and percent sunshine/cloud coverage data. This information is contained in a climate (.hcd) file. These .hcd files must be unzipped and manually placed into a specific folder in Pavement ME software. These climate data files representing different locations in Virginia and surrounding states can be downloaded from http://www.virginiadot.org/business/materials-download-docs.asp.
The downloaded zip files must be unzipped and copied/pasted into the following folder: C:\Program Files (x86)\AASHTOWare\ME Design\HCD\ (for 64-bits Windows) or C:\Program Files \AASHTOWare\ME Design\HCD\ (32-bits Windows). Note – the files must be copied and pasted into the ‘HCD’ folder. Different states climate files should be combined into one HCD folder. Files shall not be put in a subfolder.
The geographic locations of the climate stations are stored in the ‘station.dat’ file. This file comes with the installation package of Pavement ME and is located at: C:\Program Files (x86)\AASHTOWare\ME Design\Defaults or C:\Program Files\AASHTOWare\ME Design\Defaults . Users connected to VDOT database will have the climate files installed by VDOT IT division during the software installation process. The climate input parameters for Pavement ME are shown in Table 4-7. The user can select either a virtual weather station or a single weather station. More instruction for each of these options is provided in the sections below.
Table 4-7: Climate Input Parameters
Input Parameter Input Type
Longitude User Input
Latitude User Input
Elevation User Input
Depth of Water Table User Input
Climate Station User Input
16
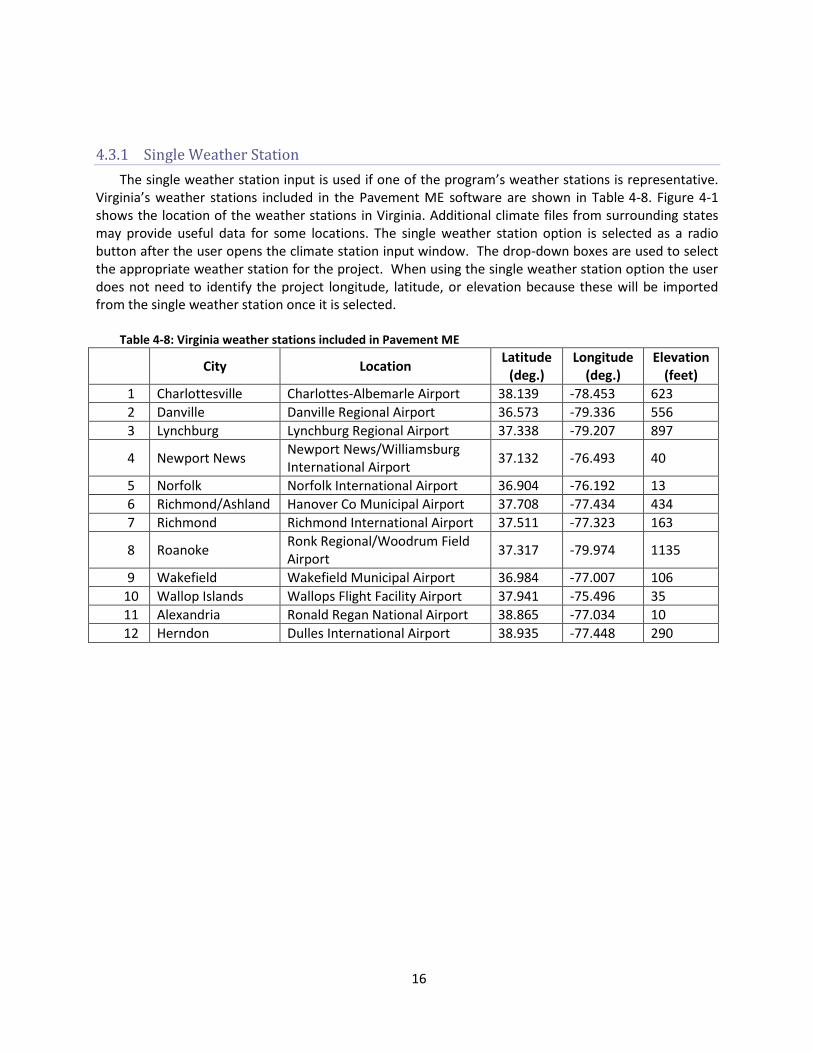
4.3.1 Single Weather Station
The single weather station input is used if one of the program’s weather stations is representative. Virginia’s weather stations included in the Pavement ME software are shown in Table 4-8. Figure 4-1 shows the location of the weather stations in Virginia. Additional climate files from surrounding states may provide useful data for some locations. The single weather station option is selected as a radio button after the user opens the climate station input window. The drop-down boxes are used to select the appropriate weather station for the project. When using the single weather station option the user does not need to identify the project longitude, latitude, or elevation because these will be imported from the single weather station once it is selected.
Table 4-8: Virginia weather stations included in Pavement ME
City Location
Latitude (deg.)
Longitude (deg.)
Elevation (feet)
1 Charlottesville Charlottes-Albemarle Airport 38.139 -78.453 623
2 Danville Danville Regional Airport 36.573 -79.336 556
3 Lynchburg Lynchburg Regional Airport 37.338 -79.207 897
4 Newport News Newport News/Williamsburg International Airport
37.132 -76.493 40
5 Norfolk Norfolk International Airport 36.904 -76.192 13
6 Richmond/Ashland Hanover Co Municipal Airport 37.708 -77.434 434
7 Richmond Richmond International Airport 37.511 -77.323 163
8 Roanoke Ronk Regional/Woodrum Field Airport
37.317 -79.974 1135
9 Wakefield Wakefield Municipal Airport 36.984 -77.007 106
10 Wallop Islands Wallops Flight Facility Airport 37.941 -75.496 35
11 Alexandria Ronald Regan National Airport 38.865 -77.034 10
12 Herndon Dulles International Airport 38.935 -77.448 290
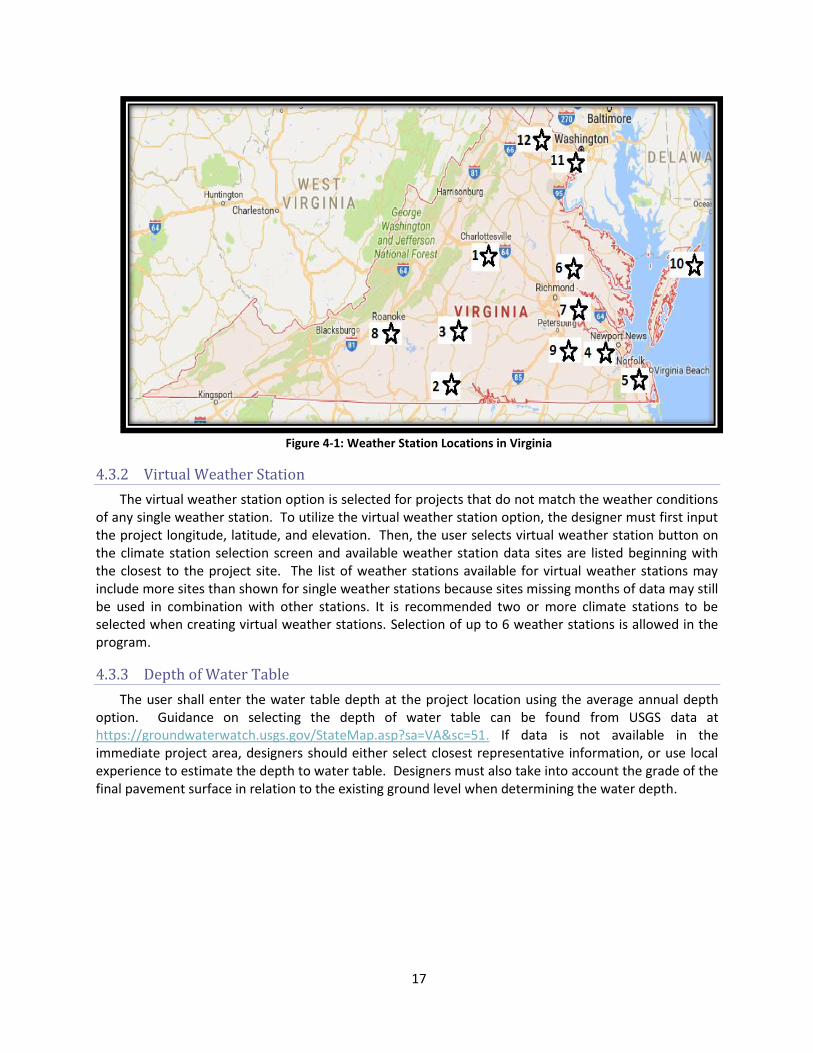
17
Figure 4-1: Weather Station Locations in Virginia
4.3.2 Virtual Weather Station
The virtual weather station option is selected for projects that do not match the weather conditions of any single weather station. To utilize the virtual weather station option, the designer must first input the project longitude, latitude, and elevation. Then, the user selects virtual weather station button on the climate station selection screen and available weather station data sites are listed beginning with the closest to the project site. The list of weather stations available for virtual weather stations may include more sites than shown for single weather stations because sites missing months of data may still be used in combination with other stations. It is recommended two or more climate stations to be selected when creating virtual weather stations. Selection of up to 6 weather stations is allowed in the program.
4.3.3 Depth of Water Table
The user shall enter the water table depth at the project location using the average annual depth option. Guidance on selecting the depth of water table can be found from USGS data at https://groundwaterwatch.usgs.gov/StateMap.asp?sa=VA&sc=51. If data is not available in the immediate project area, designers should either select closest representative information, or use local experience to estimate the depth to water table. Designers must also take into account the grade of the final pavement surface in relation to the existing ground level when determining the water depth.
18
5 Pavement Layer Inputs
To include a new layer, the user should select “add layer” to open a window and select the layer type. The user will select the existing layer in which the new layer will be placed beneath. Then the user will select the layer type; the seven main layer types are Portland Cement Concrete, Flexible, Chemically Stabilized, Sandwiched Granular, Non-stabilized Base, Subgrade, and Bedrock. The program has some constraints in modeling a pavement, a warning message will display if the pavement structure entered may not be properly analyzed.
The user can also select the material type from three lists: default list, database, or .XML file (files with .xml extension). The database option is available for users who are connected to VDOT database. Users who are not connected to VDOT database should import material input properties in .XML files format by downloading from VDOT input files folder. The select from file option can be used to import input properties from a material layer in another .dgpx project file. Even if material properties are imported from a file or another project, the user must select the desired layer thickness. The following sections provide the user more information on the input parameters to consider for each material input.
5.1 Asphalt Material Inputs
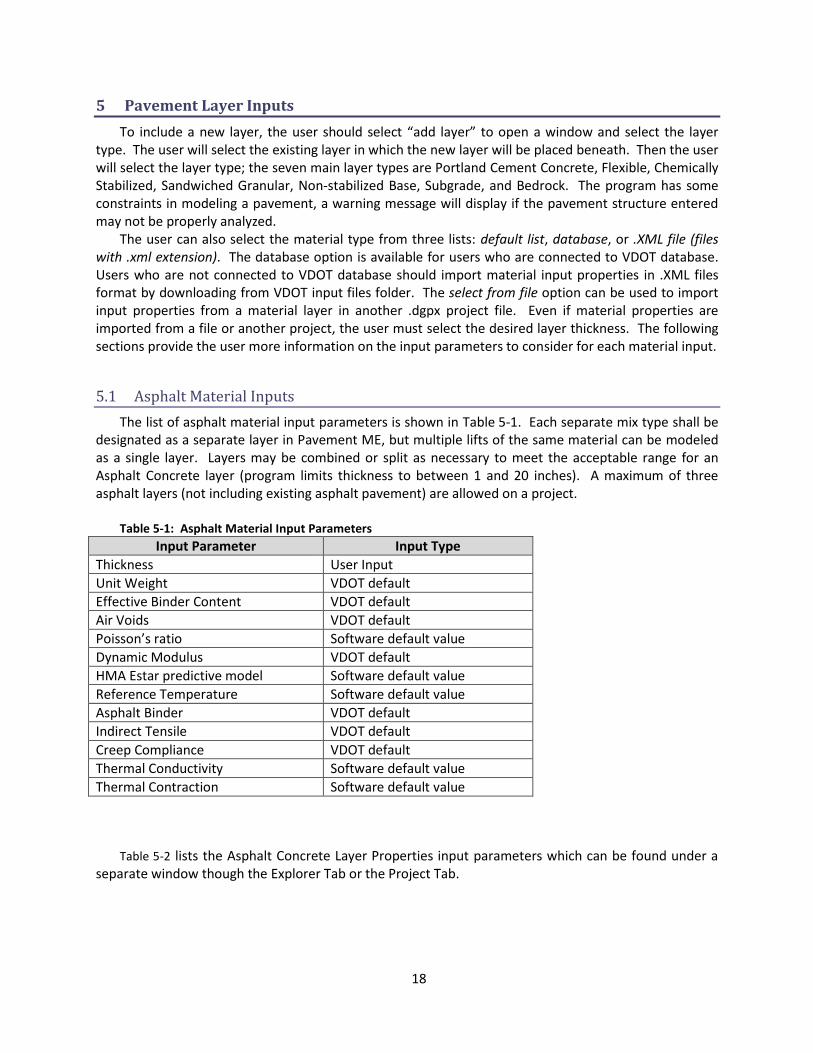
The list of asphalt material input parameters is shown in Table 5-1. Each separate mix type shall be designated as a separate layer in Pavement ME, but multiple lifts of the same material can be modeled as a single layer. Layers may be combined or split as necessary to meet the acceptable range for an Asphalt Concrete layer (program limits thickness to between 1 and 20 inches). A maximum of three asphalt layers (not including existing asphalt pavement) are allowed on a project.
Table 5-1: Asphalt Material Input Parameters
Input Parameter Input Type
Thickness User Input
Unit Weight VDOT default
Effective Binder Content VDOT default
Air Voids VDOT default
Poisson’s ratio Software default value
Dynamic Modulus VDOT default
HMA Estar predictive model Software default value
Reference Temperature Software default value
Asphalt Binder VDOT default
Indirect Tensile VDOT default
Creep Compliance VDOT default
Thermal Conductivity Software default value
Thermal Contraction Software default value
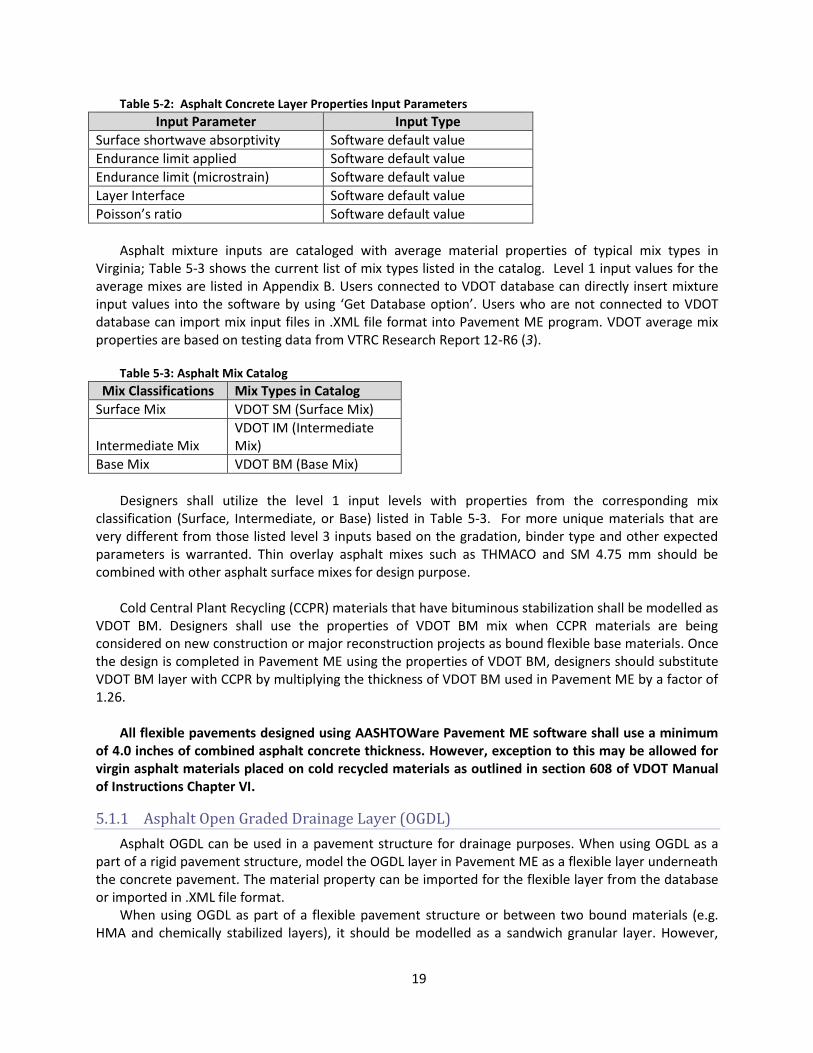
Table 5-2 lists the Asphalt Concrete Layer Properties input parameters which can be found under a
separate window though the Explorer Tab or the Project Tab.
19
Table 5-2: Asphalt Concrete Layer Properties Input Parameters
Input Parameter Input Type
Surface shortwave absorptivity Software default value
Endurance limit applied Software default value
Endurance limit (microstrain) Software default value
Layer Interface Software default value
Poisson’s ratio Software default value
Asphalt mixture inputs are cataloged with average material properties of typical mix types in
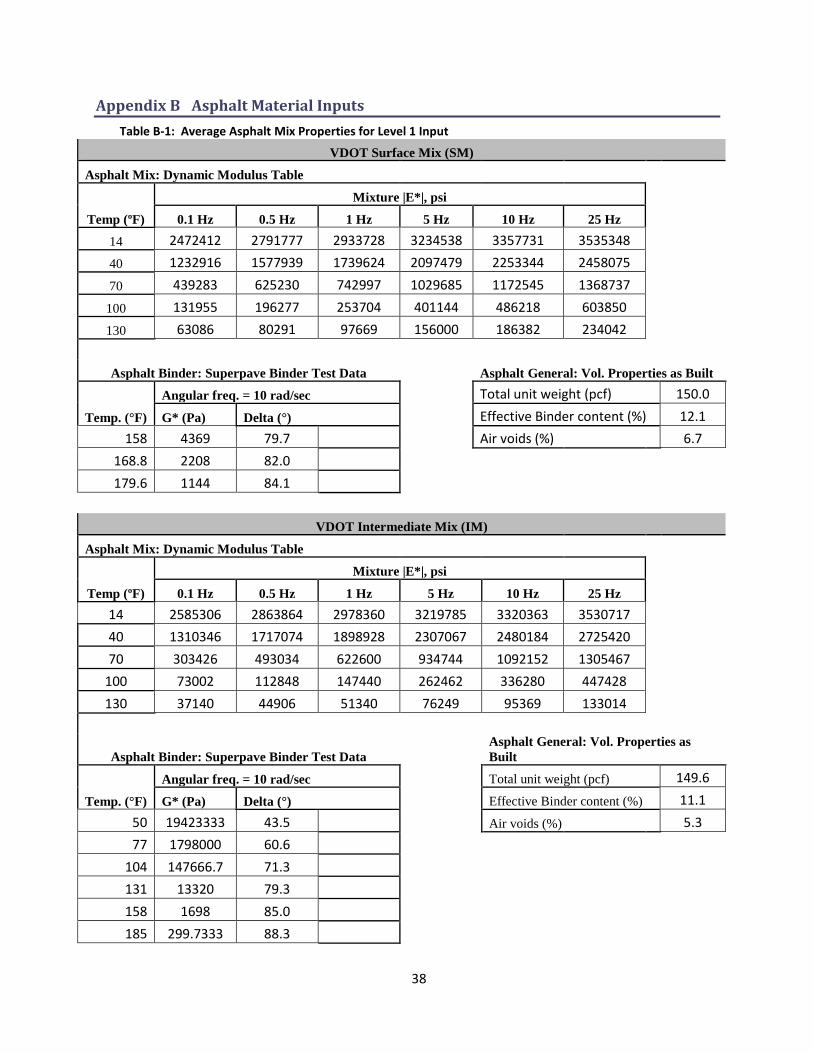
Virginia; Table 5-3 shows the current list of mix types listed in the catalog. Level 1 input values for the average mixes are listed in Appendix B. Users connected to VDOT database can directly insert mixture input values into the software by using ‘Get Database option’. Users who are not connected to VDOT database can import mix input files in .XML file format into Pavement ME program. VDOT average mix properties are based on testing data from VTRC Research Report 12-R6 (3).
Table 5-3: Asphalt Mix Catalog
Mix Classifications Mix Types in Catalog
Surface Mix VDOT SM (Surface Mix)
Intermediate Mix VDOT IM (Intermediate Mix)
Base Mix VDOT BM (Base Mix)
Designers shall utilize the level 1 input levels with properties from the corresponding mix
classification (Surface, Intermediate, or Base) listed in Table 5-3. For more unique materials that are very different from those listed level 3 inputs based on the gradation, binder type and other expected parameters is warranted. Thin overlay asphalt mixes such as THMACO and SM 4.75 mm should be combined with other asphalt surface mixes for design purpose.
Cold Central Plant Recycling (CCPR) materials that have bituminous stabilization shall be modelled as
VDOT BM. Designers shall use the properties of VDOT BM mix when CCPR materials are being considered on new construction or major reconstruction projects as bound flexible base materials. Once the design is completed in Pavement ME using the properties of VDOT BM, designers should substitute VDOT BM layer with CCPR by multiplying the thickness of VDOT BM used in Pavement ME by a factor of 1.26.
All flexible pavements designed using AASHTOWare Pavement ME software shall use a minimum
of 4.0 inches of combined asphalt concrete thickness. However, exception to this may be allowed for virgin asphalt materials placed on cold recycled materials as outlined in section 608 of VDOT Manual of Instructions Chapter VI.
5.1.1 Asphalt Open Graded Drainage Layer (OGDL)
Asphalt OGDL can be used in a pavement structure for drainage purposes. When using OGDL as a part of a rigid pavement structure, model the OGDL layer in Pavement ME as a flexible layer underneath the concrete pavement. The material property can be imported for the flexible layer from the database or imported in .XML file format.
When using OGDL as part of a flexible pavement structure or between two bound materials (e.g. HMA and chemically stabilized layers), it should be modelled as a sandwich granular layer. However,
20
AASHTOWare Pavement ME version 2.2.6 will not allow this when it generates the pdf file. Until this issue is fixed in future software versions, users should first model the pavement structure without the OGDL layer, and then after the analysis is completed in Pavement ME, manually include the required thickness of OGDL layer in the pavement design report.
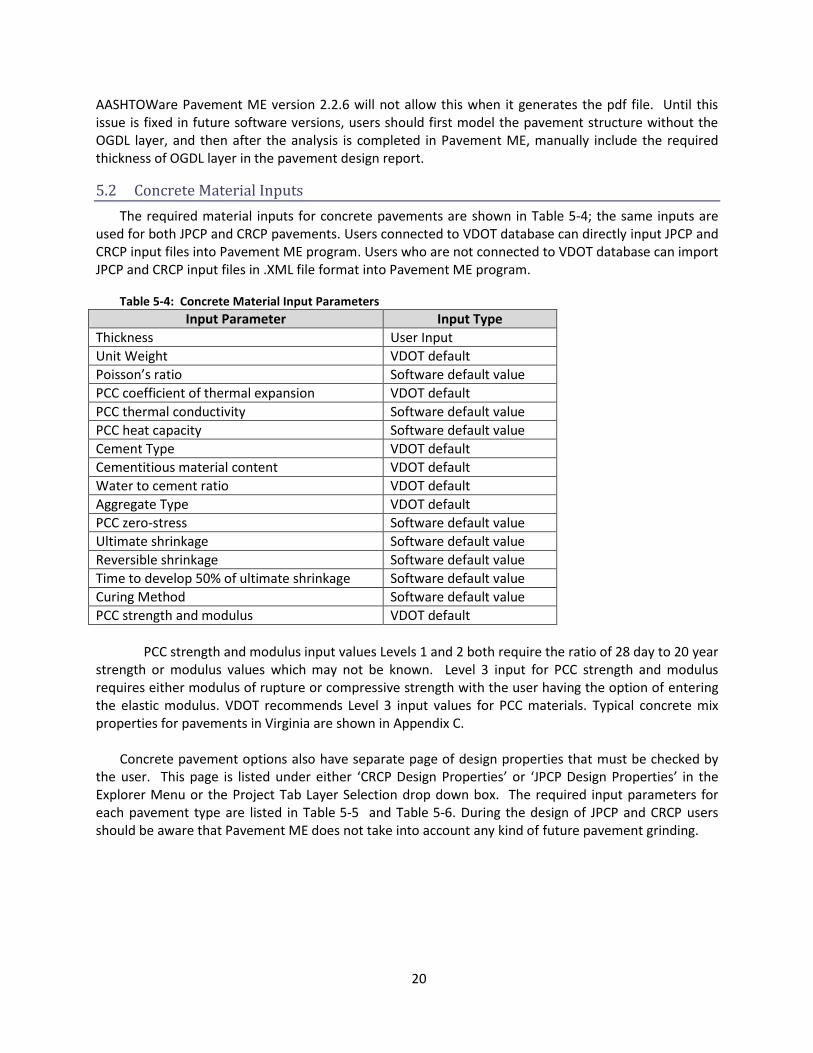
5.2 Concrete Material Inputs
The required material inputs for concrete pavements are shown in Table 5-4; the same inputs are used for both JPCP and CRCP pavements. Users connected to VDOT database can directly input JPCP and CRCP input files into Pavement ME program. Users who are not connected to VDOT database can import JPCP and CRCP input files in .XML file format into Pavement ME program.
Table 5-4: Concrete Material Input Parameters
Input Parameter Input Type
Thickness User Input
Unit Weight VDOT default
Poisson’s ratio Software default value
PCC coefficient of thermal expansion VDOT default
PCC thermal conductivity Software default value
PCC heat capacity Software default value
Cement Type VDOT default
Cementitious material content VDOT default
Water to cement ratio VDOT default
Aggregate Type VDOT default
PCC zero-stress Software default value
Ultimate shrinkage Software default value
Reversible shrinkage Software default value
Time to develop 50% of ultimate shrinkage Software default value
Curing Method Software default value
PCC strength and modulus VDOT default
PCC strength and modulus input values Levels 1 and 2 both require the ratio of 28 day to 20 year
strength or modulus values which may not be known. Level 3 input for PCC strength and modulus requires either modulus of rupture or compressive strength with the user having the option of entering the elastic modulus. VDOT recommends Level 3 input values for PCC materials. Typical concrete mix properties for pavements in Virginia are shown in Appendix C.
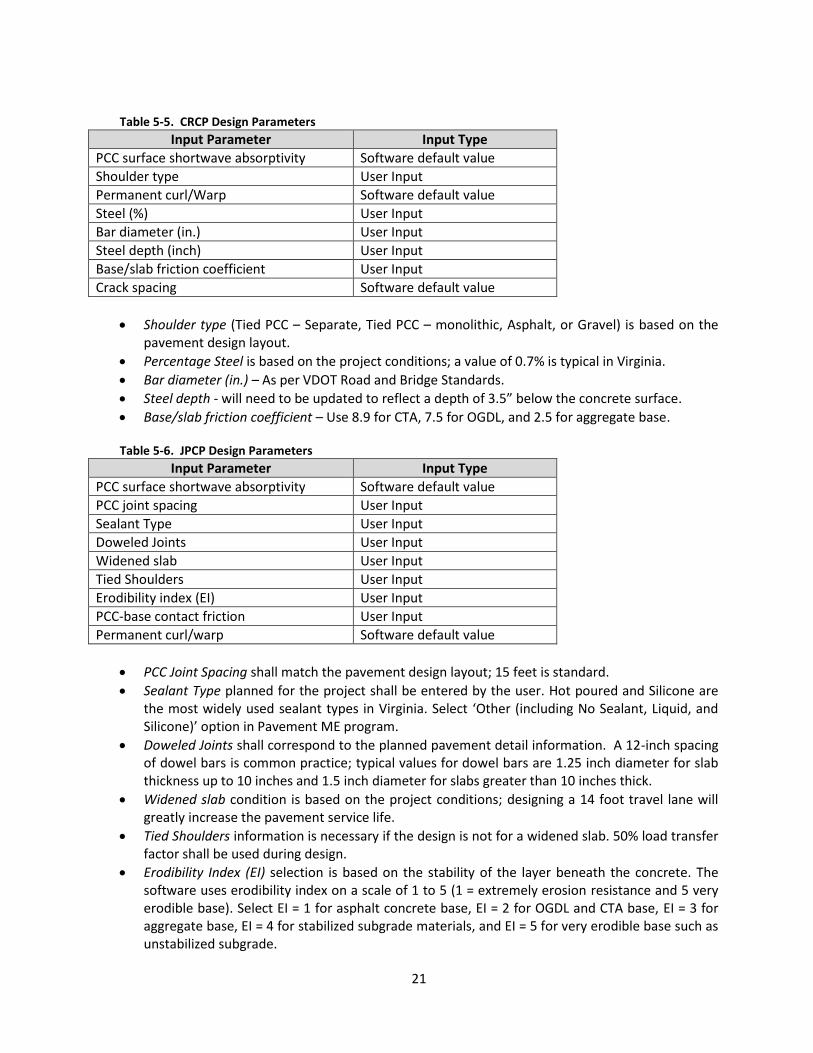
Concrete pavement options also have separate page of design properties that must be checked by the user. This page is listed under either ‘CRCP Design Properties’ or ‘JPCP Design Properties’ in the Explorer Menu or the Project Tab Layer Selection drop down box. The required input parameters for each pavement type are listed in Table 5-5 and Table 5-6. During the design of JPCP and CRCP users should be aware that Pavement ME does not take into account any kind of future pavement grinding.
21
Table 5-5. CRCP Design Parameters
Input Parameter Input Type
PCC surface shortwave absorptivity Software default value
Shoulder type User Input
Permanent curl/Warp Software default value
Steel (%) User Input
Bar diameter (in.) User Input
Steel depth (inch) User Input
Base/slab friction coefficient User Input
Crack spacing Software default value
Shoulder type (Tied PCC – Separate, Tied PCC – monolithic, Asphalt, or Gravel) is based on the pavement design layout.
Percentage Steel is based on the project conditions; a value of 0.7% is typical in Virginia.
Bar diameter (in.) – As per VDOT Road and Bridge Standards.
Steel depth - will need to be updated to reflect a depth of 3.5” below the concrete surface.
Base/slab friction coefficient – Use 8.9 for CTA, 7.5 for OGDL, and 2.5 for aggregate base.
Table 5-6. JPCP Design Parameters
Input Parameter Input Type
PCC surface shortwave absorptivity Software default value
PCC joint spacing User Input
Sealant Type User Input
Doweled Joints User Input
Widened slab User Input
Tied Shoulders User Input
Erodibility index (EI) User Input
PCC-base contact friction User Input
Permanent curl/warp Software default value
PCC Joint Spacing shall match the pavement design layout; 15 feet is standard.
Sealant Type planned for the project shall be entered by the user. Hot poured and Silicone are the most widely used sealant types in Virginia. Select ‘Other (including No Sealant, Liquid, and Silicone)’ option in Pavement ME program.
Doweled Joints shall correspond to the planned pavement detail information. A 12-inch spacing of dowel bars is common practice; typical values for dowel bars are 1.25 inch diameter for slab thickness up to 10 inches and 1.5 inch diameter for slabs greater than 10 inches thick.
Widened slab condition is based on the project conditions; designing a 14 foot travel lane will greatly increase the pavement service life.
Tied Shoulders information is necessary if the design is not for a widened slab. 50% load transfer factor shall be used during design.
Erodibility Index (EI) selection is based on the stability of the layer beneath the concrete. The software uses erodibility index on a scale of 1 to 5 (1 = extremely erosion resistance and 5 very erodible base). Select EI = 1 for asphalt concrete base, EI = 2 for OGDL and CTA base, EI = 3 for aggregate base, EI = 4 for stabilized subgrade materials, and EI = 5 for very erodible base such as unstabilized subgrade.
22
PCC-base contact friction – Select ‘True’ to imply there is full friction at the PCC slab/base interface after construction. Use 360 months.
5.3 Chemically Stabilized Base Inputs
5.3.1 Modelling of chemically stabilized layers under flexible pavement
Due to findings of some technical audit by AASHTO and to the fact that the existing semi-rigid model in AASHTOWare Pavement ME version 2.2.6 is not globally calibrated, VDOT will not use the semi-rigid option until AASHTO’s future release containing the fixes and calibration of the model. As an interim basis, VDOT will model these pavements (i.e. asphalt concrete over stabilized materials) as flexible pavements with chemically stabilized layers as base/subgrade materials with higher resilient modulus value.
Chemically stabilized layers like CTA and FDR shall be modelled as non-stabilized base layers and lime/cement stabilized soils shall be modelled as subgrade in a flexible pavement system. These layers are assumed to be insensitive to moisture and a constant high resilient modulus value will be assigned (this is already included in VDOT input files for external users and VDOT staffs). Users will import these layers into Pavement ME either from database, .XML file formats or by manual entry.
Users connected to the VDOT database can directly insert chemically stabilized layers into Pavement ME by using ‘Get Database’ option as Non-Stabilize Base Layer (i.e. CTA and FDR) and subgrade (i.e. lime/ cement stabilized soils). Users who are not connected to the VDOT database can import chemically stabilized base layers (i.e. CTA and FDR) input files as Non-Stabilize Base Layer and lime/cement stabilized soils as subgrade layer in .XML file format into Pavement ME program. These files can be downloaded from the link provided in section 1 of this document. Table 5-7 shows input files names to be used when modelling chemically stabilized materials as non-stabilize base and subgrade layers.
If manual entry is selected material inputs shown in Appendix D will be used. In this case the ‘Annual Representative Value’ option for Analysis Type shall be selected. Users need to click the drop-down arrow next to the resilient modulus value in the project tab and change the default ‘Modify input values by temperature/moisture’ to ‘Annual Representative Value’.
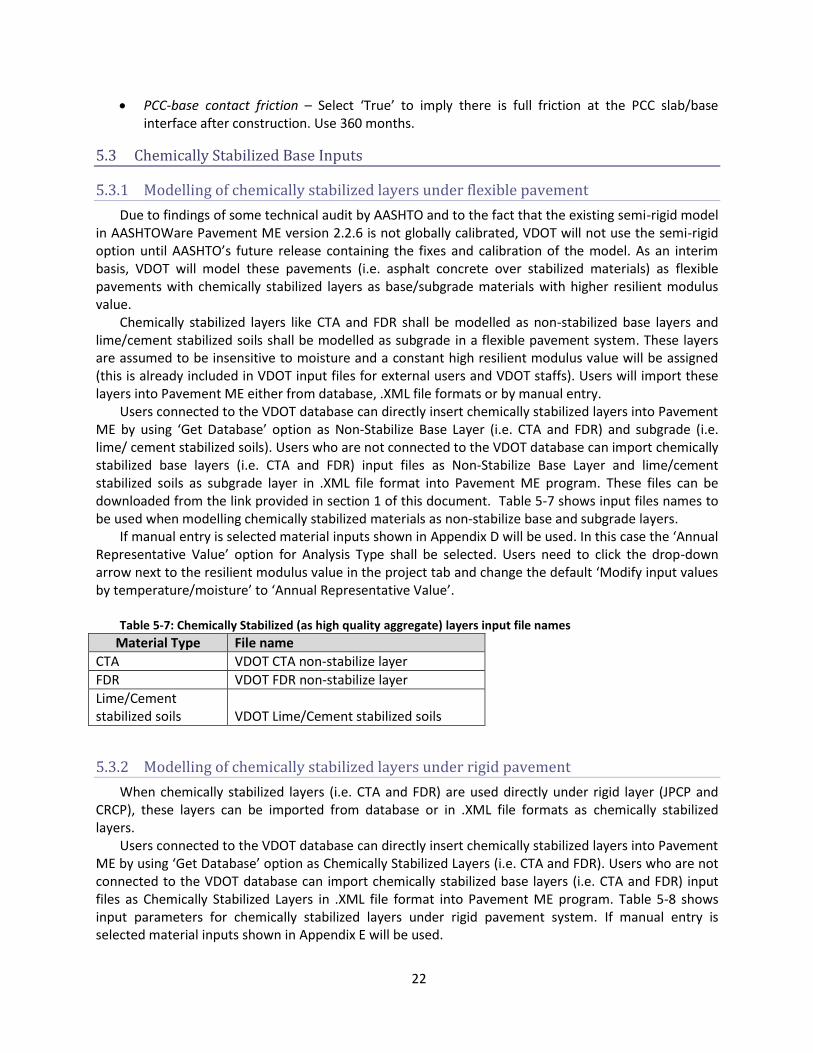
Table 5-7: Chemically Stabilized (as high quality aggregate) layers input file names
Material Type File name
CTA VDOT CTA non-stabilize layer
FDR VDOT FDR non-stabilize layer
Lime/Cement stabilized soils VDOT Lime/Cement stabilized soils
5.3.2 Modelling of chemically stabilized layers under rigid pavement
When chemically stabilized layers (i.e. CTA and FDR) are used directly under rigid layer (JPCP and CRCP), these layers can be imported from database or in .XML file formats as chemically stabilized layers.
Users connected to the VDOT database can directly insert chemically stabilized layers into Pavement ME by using ‘Get Database’ option as Chemically Stabilized Layers (i.e. CTA and FDR). Users who are not connected to the VDOT database can import chemically stabilized base layers (i.e. CTA and FDR) input files as Chemically Stabilized Layers in .XML file format into Pavement ME program. Table 5-8 shows input parameters for chemically stabilized layers under rigid pavement system. If manual entry is selected material inputs shown in Appendix E will be used.

23
Table 5-8. Chemically Stabilized Layer Input Parameters under rigid pavement
Input Parameter Input Type
Thickness User Input
Unit Weight Software default value
Poisson’s ratio Software default value
Elastic/Resilient Modulus VDOT default value
Thermal conductivity Software default value
Heat Capacity Software default value
Note: Users should be aware of the difference in material properties or input parameters required
for chemically stabilized layers when placed under flexible (Section 5.3.1) and rigid pavements (Section 5.3.2).
The use of Use of Cement Treated Aggregate (CTA) base material is strongly recommended for high traffic volume roadways (with ADT greater than 10,000).
5.4 Aggregate Base Inputs
The user must select Non-Stabilized Base option to add an aggregate base material. The input parameters for unbound aggregate base layers are listed in Table 5-9. Details of what values to use for Resilient Modulus, Gradation, and other engineering properties are listed in Appendix F. They are average values based on samples tested in VTRC research report 15-R13 (5). Users should select the properties from the group that corresponds to the aggregate type for the project (i.e. limestone, diabase, and granite); these values are applicable for either 21A or 21B materials. If the type of aggregate is unknown during the design, then the user can select the statewide average aggregate base properties.
Users connected to the VDOT database can directly insert aggregate layer properties into Pavement ME by using ‘Get Database’ option. Users who are not connected to the VDOT database can import aggregate base layer input files in .XML file format into Pavement ME program.
A minimum of 6 inches of aggregate base material (21 A or 21 B) mandated for all types of roadways designed using AASHTOWare Pavement ME software, unless CTA or other stabilized material is being used. Therefore, all pavements designed with AASHTOWare Pavement ME will have either aggregate base or some type of stabilized base materials within the pavement system.
Table 5-9. Aggregate Base Input Parameters
Input Parameter Recommended Input Type
Thickness User Input
Poisson’s ratio Software default value
Coefficient of lateral earth pressure (at-rest) Software default value
Resilient Modulus VDOT default value
Gradation and Other Engineering Properties VDOT default value
24
5.5 Subgrade Inputs
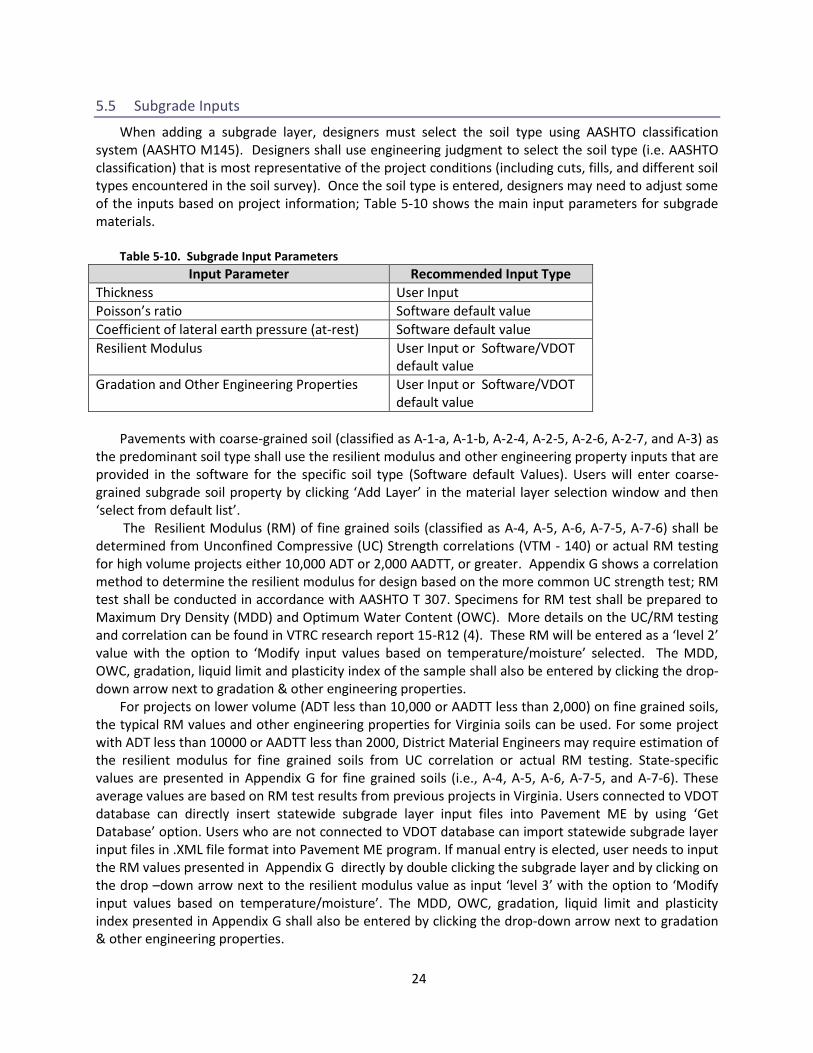
When adding a subgrade layer, designers must select the soil type using AASHTO classification system (AASHTO M145). Designers shall use engineering judgment to select the soil type (i.e. AASHTO classification) that is most representative of the project conditions (including cuts, fills, and different soil types encountered in the soil survey). Once the soil type is entered, designers may need to adjust some of the inputs based on project information; Table 5-10 shows the main input parameters for subgrade materials.
Table 5-10. Subgrade Input Parameters
Input Parameter Recommended Input Type
Thickness User Input
Poisson’s ratio Software default value
Coefficient of lateral earth pressure (at-rest) Software default value
Resilient Modulus User Input or Software/VDOT default value
Gradation and Other Engineering Properties User Input or Software/VDOT default value
Pavements with coarse-grained soil (classified as A-1-a, A-1-b, A-2-4, A-2-5, A-2-6, A-2-7, and A-3) as
the predominant soil type shall use the resilient modulus and other engineering property inputs that are provided in the software for the specific soil type (Software default Values). Users will enter coarse-grained subgrade soil property by clicking ‘Add Layer’ in the material layer selection window and then ‘select from default list’.
The Resilient Modulus (RM) of fine grained soils (classified as A-4, A-5, A-6, A-7-5, A-7-6) shall be determined from Unconfined Compressive (UC) Strength correlations (VTM - 140) or actual RM testing for high volume projects either 10,000 ADT or 2,000 AADTT, or greater. Appendix G shows a correlation method to determine the resilient modulus for design based on the more common UC strength test; RM test shall be conducted in accordance with AASHTO T 307. Specimens for RM test shall be prepared to Maximum Dry Density (MDD) and Optimum Water Content (OWC). More details on the UC/RM testing and correlation can be found in VTRC research report 15-R12 (4). These RM will be entered as a ‘level 2’ value with the option to ‘Modify input values based on temperature/moisture’ selected. The MDD, OWC, gradation, liquid limit and plasticity index of the sample shall also be entered by clicking the drop-down arrow next to gradation & other engineering properties.
For projects on lower volume (ADT less than 10,000 or AADTT less than 2,000) on fine grained soils, the typical RM values and other engineering properties for Virginia soils can be used. For some project with ADT less than 10000 or AADTT less than 2000, District Material Engineers may require estimation of the resilient modulus for fine grained soils from UC correlation or actual RM testing. State-specific values are presented in Appendix G for fine grained soils (i.e., A-4, A-5, A-6, A-7-5, and A-7-6). These average values are based on RM test results from previous projects in Virginia. Users connected to VDOT database can directly insert statewide subgrade layer input files into Pavement ME by using ‘Get Database’ option. Users who are not connected to VDOT database can import statewide subgrade layer input files in .XML file format into Pavement ME program. If manual entry is elected, user needs to input the RM values presented in Appendix G directly by double clicking the subgrade layer and by clicking on the drop –down arrow next to the resilient modulus value as input ‘level 3’ with the option to ‘Modify input values based on temperature/moisture’. The MDD, OWC, gradation, liquid limit and plasticity index presented in Appendix G shall also be entered by clicking the drop-down arrow next to gradation & other engineering properties.
25
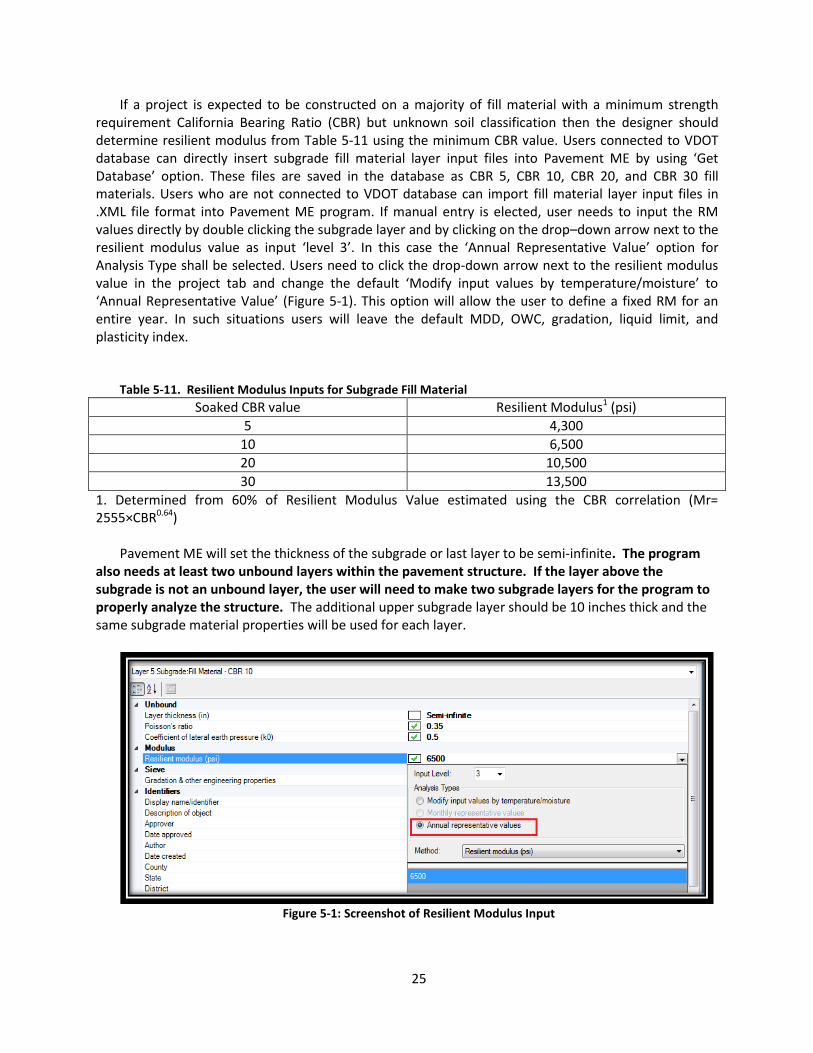
If a project is expected to be constructed on a majority of fill material with a minimum strength requirement California Bearing Ratio (CBR) but unknown soil classification then the designer should determine resilient modulus from Table 5-11 using the minimum CBR value. Users connected to VDOT database can directly insert subgrade fill material layer input files into Pavement ME by using ‘Get Database’ option. These files are saved in the database as CBR 5, CBR 10, CBR 20, and CBR 30 fill materials. Users who are not connected to VDOT database can import fill material layer input files in .XML file format into Pavement ME program. If manual entry is elected, user needs to input the RM values directly by double clicking the subgrade layer and by clicking on the drop–down arrow next to the resilient modulus value as input ‘level 3’. In this case the ‘Annual Representative Value’ option for Analysis Type shall be selected. Users need to click the drop-down arrow next to the resilient modulus value in the project tab and change the default ‘Modify input values by temperature/moisture’ to ‘Annual Representative Value’ (Figure 5-1). This option will allow the user to define a fixed RM for an entire year. In such situations users will leave the default MDD, OWC, gradation, liquid limit, and plasticity index.
Table 5-11. Resilient Modulus Inputs for Subgrade Fill Material
Soaked CBR value Resilient Modulus1 (psi)
5 4,300
10 6,500
20 10,500
30 13,500
1. Determined from 60% of Resilient Modulus Value estimated using the CBR correlation (Mr= 2555×CBR0.64)
Pavement ME will set the thickness of the subgrade or last layer to be semi-infinite. The program
also needs at least two unbound layers within the pavement structure. If the layer above the subgrade is not an unbound layer, the user will need to make two subgrade layers for the program to properly analyze the structure. The additional upper subgrade layer should be 10 inches thick and the same subgrade material properties will be used for each layer.
Figure 5-1: Screenshot of Resilient Modulus Input
26
6 Calibration Factors
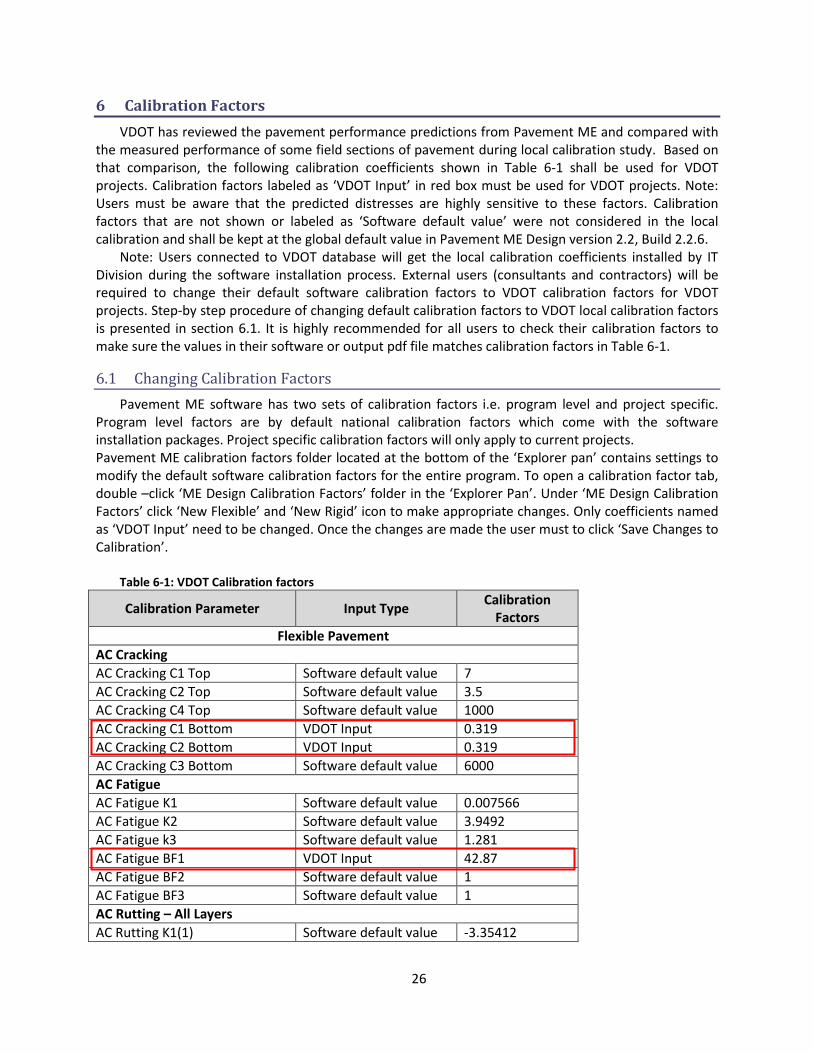
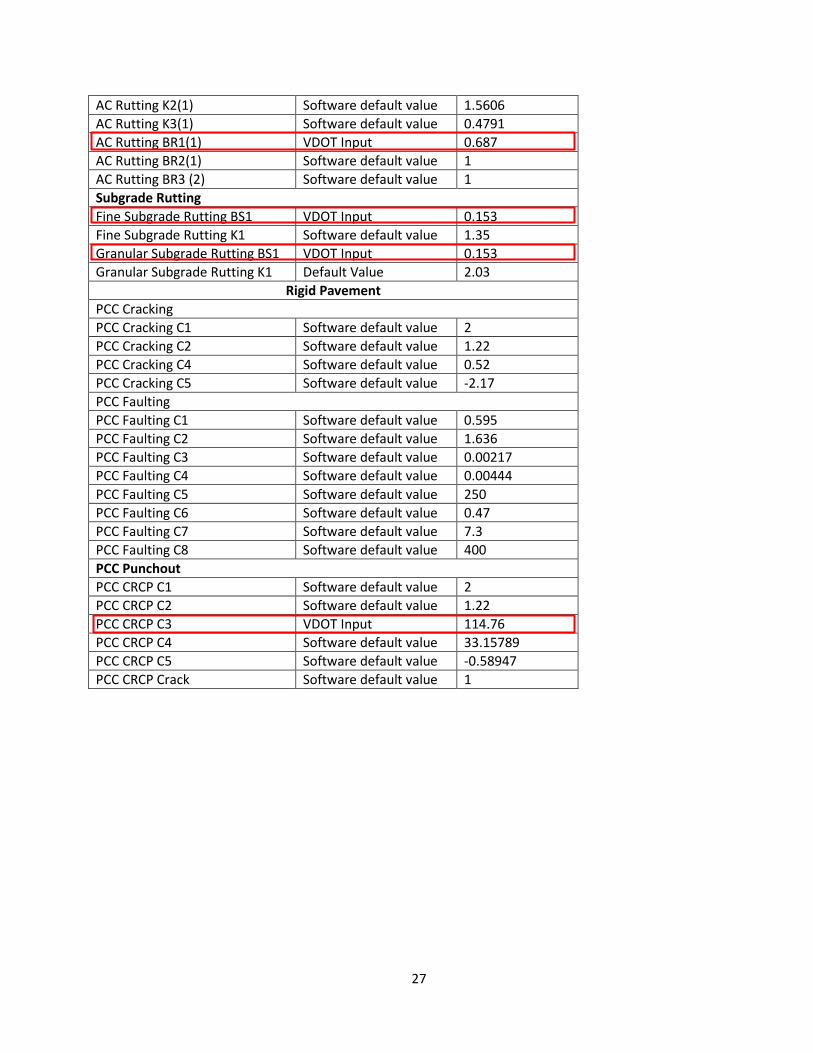
VDOT has reviewed the pavement performance predictions from Pavement ME and compared with the measured performance of some field sections of pavement during local calibration study. Based on that comparison, the following calibration coefficients shown in Table 6-1 shall be used for VDOT projects. Calibration factors labeled as ‘VDOT Input’ in red box must be used for VDOT projects. Note: Users must be aware that the predicted distresses are highly sensitive to these factors. Calibration factors that are not shown or labeled as ‘Software default value’ were not considered in the local calibration and shall be kept at the global default value in Pavement ME Design version 2.2, Build 2.2.6.
Note: Users connected to VDOT database will get the local calibration coefficients installed by IT Division during the software installation process. External users (consultants and contractors) will be required to change their default software calibration factors to VDOT calibration factors for VDOT projects. Step-by step procedure of changing default calibration factors to VDOT local calibration factors is presented in section 6.1. It is highly recommended for all users to check their calibration factors to make sure the values in their software or output pdf file matches calibration factors in Table 6-1.
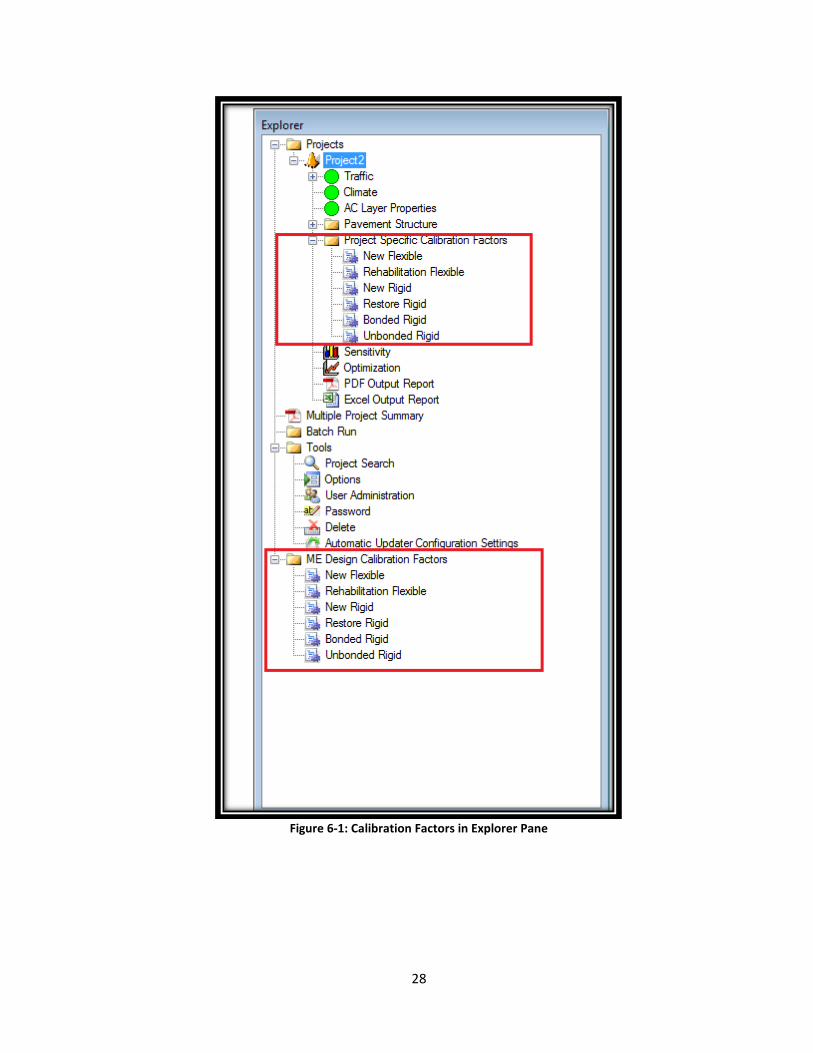
6.1 Changing Calibration Factors
Pavement ME software has two sets of calibration factors i.e. program level and project specific. Program level factors are by default national calibration factors which come with the software installation packages. Project specific calibration factors will only apply to current projects. Pavement ME calibration factors folder located at the bottom of the ‘Explorer pan’ contains settings to modify the default software calibration factors for the entire program. To open a calibration factor tab, double –click ‘ME Design Calibration Factors’ folder in the ‘Explorer Pan’. Under ‘ME Design Calibration Factors’ click ‘New Flexible’ and ‘New Rigid’ icon to make appropriate changes. Only coefficients named as ‘VDOT Input’ need to be changed. Once the changes are made the user must to click ‘Save Changes to Calibration’.
Table 6-1: VDOT Calibration factors
Calibration Parameter Input Type Calibration
Factors
Flexible Pavement
AC Cracking
AC Cracking C1 Top Software default value 7
AC Cracking C2 Top Software default value 3.5
AC Cracking C4 Top Software default value 1000
AC Cracking C1 Bottom VDOT Input 0.319
AC Cracking C2 Bottom VDOT Input 0.319
AC Cracking C3 Bottom Software default value 6000
AC Fatigue
AC Fatigue K1 Software default value 0.007566
AC Fatigue K2 Software default value 3.9492
AC Fatigue k3 Software default value 1.281
AC Fatigue BF1 VDOT Input 42.87
AC Fatigue BF2 Software default value 1
AC Fatigue BF3 Software default value 1
AC Rutting – All Layers
AC Rutting K1(1) Software default value -3.35412
27
AC Rutting K2(1) Software default value 1.5606
AC Rutting K3(1) Software default value 0.4791
AC Rutting BR1(1) VDOT Input 0.687
AC Rutting BR2(1) Software default value 1
AC Rutting BR3 (2) Software default value 1
Subgrade Rutting
Fine Subgrade Rutting BS1 VDOT Input 0.153
Fine Subgrade Rutting K1 Software default value 1.35
Granular Subgrade Rutting BS1 VDOT Input 0.153
Granular Subgrade Rutting K1 Default Value 2.03
Rigid Pavement
PCC Cracking
PCC Cracking C1 Software default value 2
PCC Cracking C2 Software default value 1.22
PCC Cracking C4 Software default value 0.52
PCC Cracking C5 Software default value -2.17
PCC Faulting
PCC Faulting C1 Software default value 0.595
PCC Faulting C2 Software default value 1.636
PCC Faulting C3 Software default value 0.00217
PCC Faulting C4 Software default value 0.00444
PCC Faulting C5 Software default value 250
PCC Faulting C6 Software default value 0.47
PCC Faulting C7 Software default value 7.3
PCC Faulting C8 Software default value 400
PCC Punchout
PCC CRCP C1 Software default value 2
PCC CRCP C2 Software default value 1.22
PCC CRCP C3 VDOT Input 114.76
PCC CRCP C4 Software default value 33.15789
PCC CRCP C5 Software default value -0.58947
PCC CRCP Crack Software default value 1
28
Figure 6-1: Calibration Factors in Explorer Pane
29
7 Performing Analysis
To analyze a project design, it must first be saved (to the computer hard drive) and all of the inputs must show green circles or yellow triangles (red squares indicates errors that will keep the analysis from starting) as described in Section 3. The user will select the run button in the program ribbon. The software will then track the progress of the analysis in the Progress Pane. Multiple projects can be run at one time by selecting run for additional projects. When the excel output option is set to ‘true’ in the options menu, a more detailed report of the analysis is provided; this also requires that all instances of Microsoft Excel be closed before the analysis is completed to allow the analysis results to be written to an excel file.
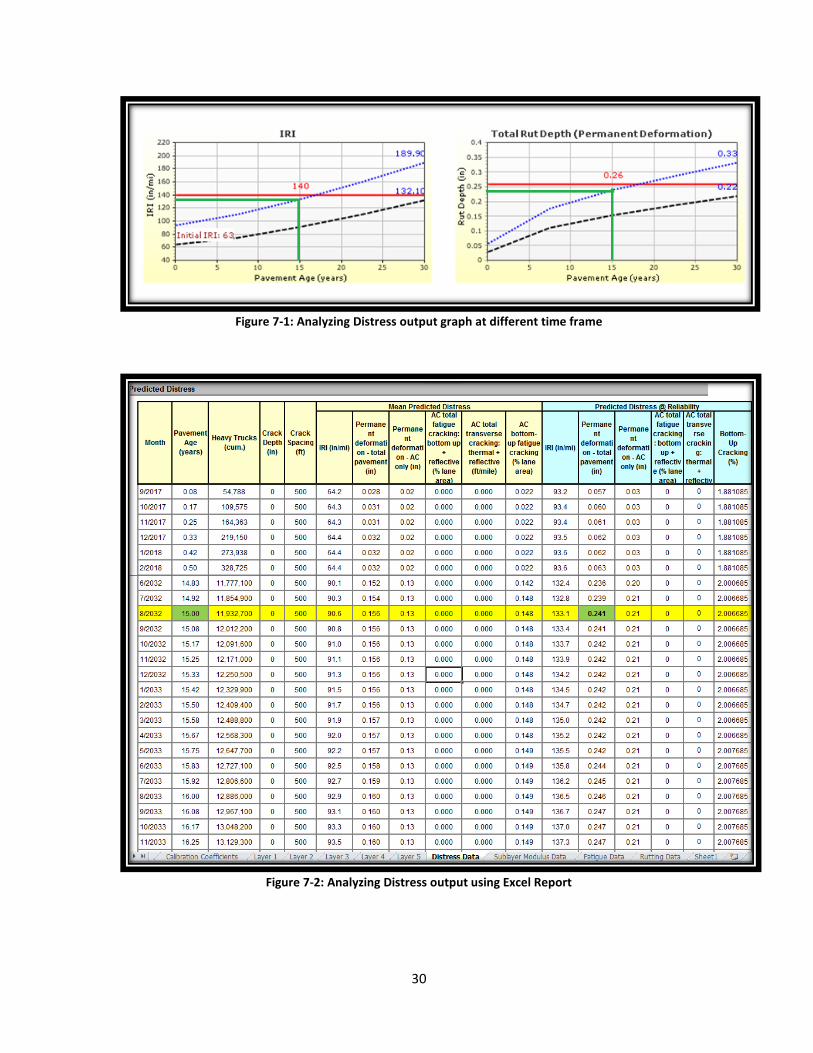
The analysis output will show a summary of the pavement section and the predicted pavement condition at the end of the analysis period. These values include the reliability specified for each value and are shown next to the analysis period the user selected. Note that some performance targets are considered at a different timeframe than the analysis period and would then need to be checked through graph/table as shown in Figure 7-1 and Figure 7-2 of predicted performance over time for user specified reliability level. It is highly recommended to use the Excel report generated in Pavement ME to review the predicted distresses that are going to be considered at different time frame. Users will need to review the ‘distress data’ sheet in the Excel report and select the predicted distress at specified reliability level corresponding to the time frame they are interested in as shown in Figure 7-2.
An acceptable pavement design will have predicted distress values at the specified level below the target values. As described in Section 4.1, VDOT only uses certain performance criteria, therefore users must review performance criteria that are applicable to VDOT projects. Performance criteria that are not applicable to VDOT will be ignored even if the predicted distresses don’t meet the threshold values.
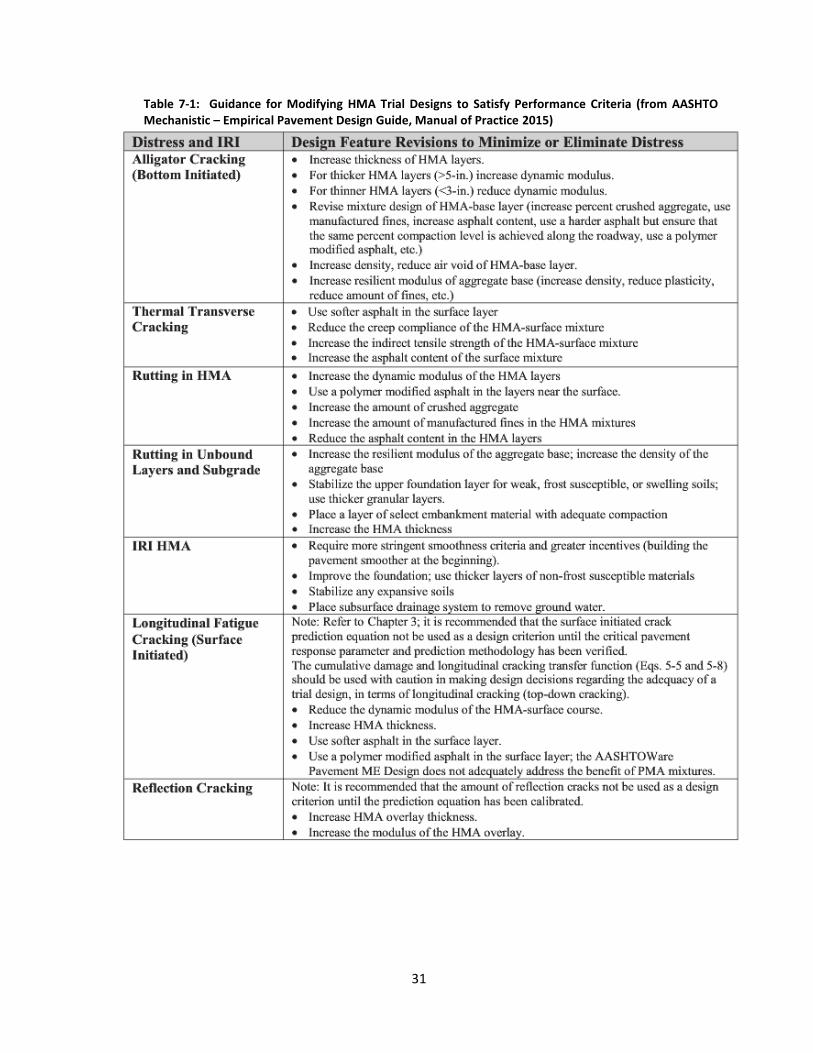
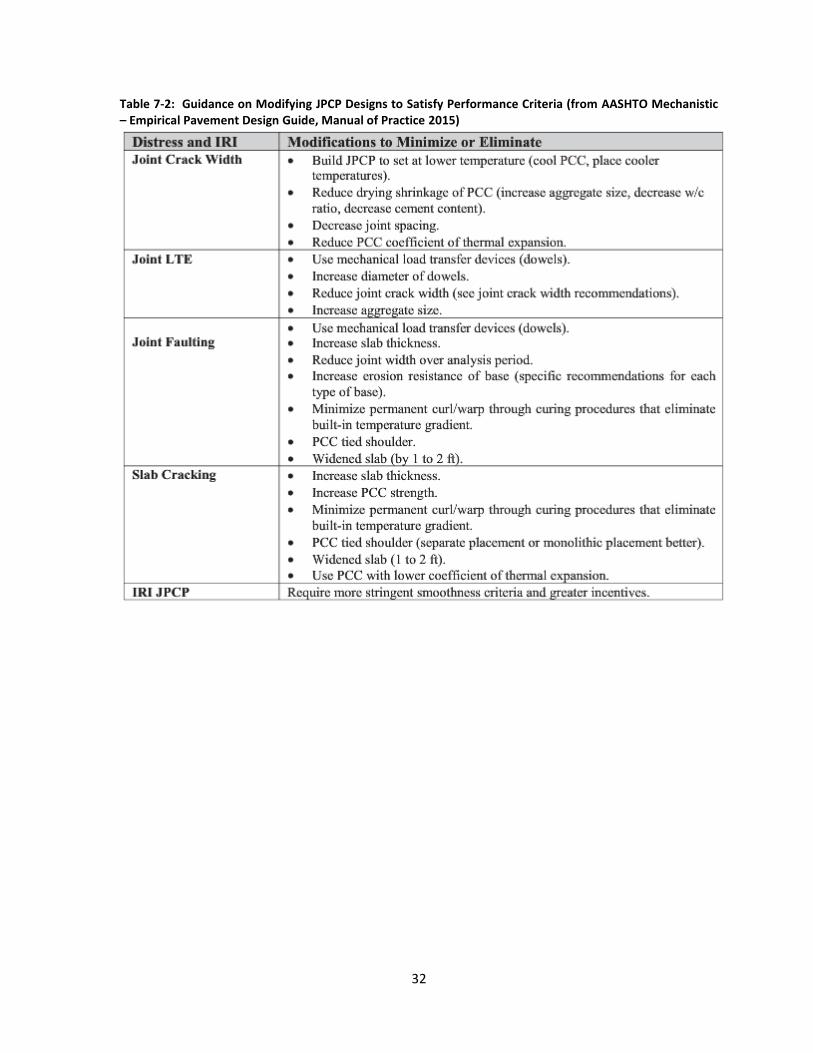
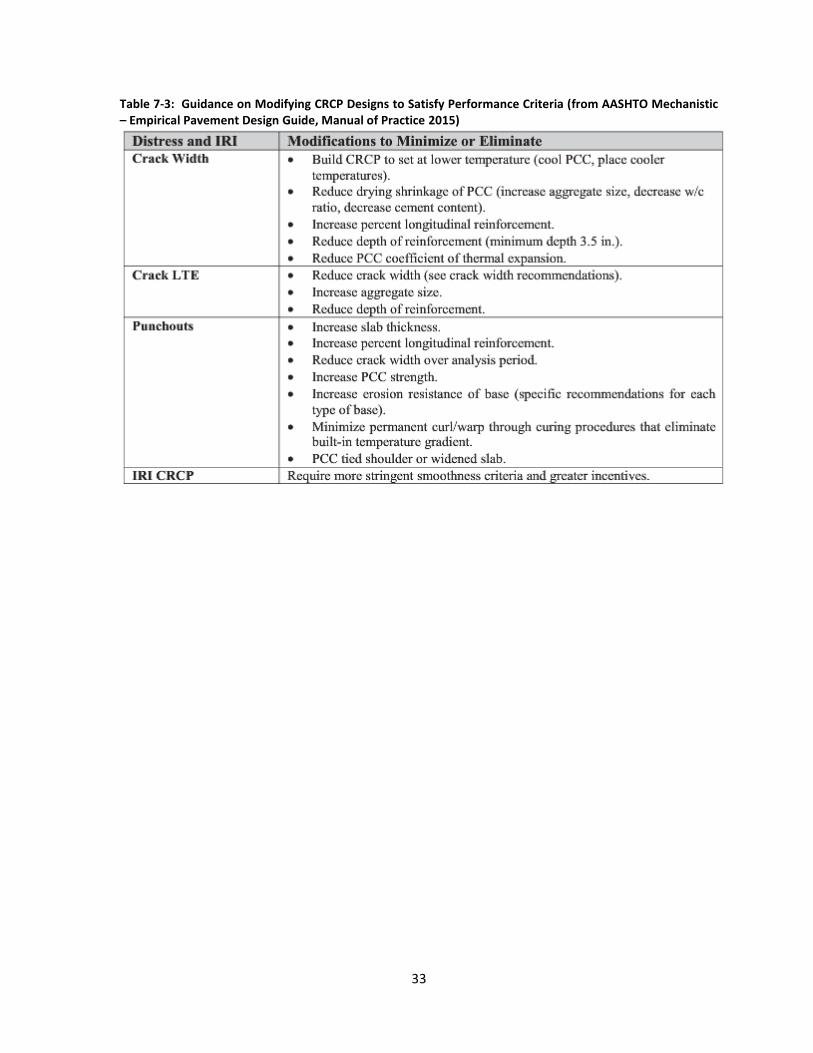
If the analysis results do not meet the required performance criteria at the specified reliability level the pavement structure or materials will need to be adjusted and reanalyzed. The primary criteria of interest when evaluating flexible pavement designs are the AC bottom-up fatigue cracking and total permanent deformation. When evaluating CRCP pavement, the number of punchouts per mile are the primary distress criteria need to be evaluated. For JPCP pavements transverse cracking and join faulting are the distresses need to be evaluated. Pavement layers, materials, or thicknesses may be considered for adjustment if the above criteria are not met. Some possible changes to the pavement design to improve various aspects are recommended in the MEPDG Manual of Practice (1).These recommendations are shown for HMA, JPCP, and CRCP pavement types (Table 7-1, Table 7-2, and Table 7-3) respectively. These recommendations shall be considered as general guidance, some of the recommendations are not applicable in VDOT designs. Users are not allowed to change VDOT specific material input properties when reanalyzing a trial design as indicated in Table 7-1, Table 7-2, and Table 7-3. To reanalyze a file, the previous output report must be closed or the software will display an error message.
30
Figure 7-1: Analyzing Distress output graph at different time frame
Figure 7-2: Analyzing Distress output using Excel Report
31
Table 7-1: Guidance for Modifying HMA Trial Designs to Satisfy Performance Criteria (from AASHTO Mechanistic – Empirical Pavement Design Guide, Manual of Practice 2015)
32
Table 7-2: Guidance on Modifying JPCP Designs to Satisfy Performance Criteria (from AASHTO Mechanistic – Empirical Pavement Design Guide, Manual of Practice 2015)
33
Table 7-3: Guidance on Modifying CRCP Designs to Satisfy Performance Criteria (from AASHTO Mechanistic – Empirical Pavement Design Guide, Manual of Practice 2015)
34
8 Reporting
After analysis/design has been completed, Pavement ME software will generate a PDF output file and Microsoft Excel report files containing input summary and output results of the trial design. The PDF report contains the result summary, traffic input summary, climate input summary, and material input summary, distress output, layer information for each layer, and calibration coefficients. Users must review each of these outputs to verify that the input/output values were correct and reasonable.
Once the design results are accepted as final design, the designer should submit the PDF output file, Excel report, final design file (.dgpx format), and any additional supporting document as part of final report. Supporting documents may include for example; traffic data; subgrade investigation (UC results/resilient modulus).
If the design is done by the consultant or Design Builder, the designer must submit PDF output file, Excel report, final design file (.dgpx format), and any additional supporting documents to VDOT for review as part of final report. Supporting documents may include for example; traffic data, subgrade investigation (UC results/resilient modulus).
35
9 References
1. American Association of State Highway and Transportation Officials. (2015).
Mechanistic-Empirical Pavement Design Guide: A Manual of Practice. Washington,
DC: American Association of State Highway and Transportation Officials.
2. American Association of State Highway and Transportation Officials. (2015).
AASHTOWare Pavement ME v 2.2, Build 2.2.6: Mechanistic-Empirical Pavement
Design Software, DC: American Association of State Highway and Transportation
Officials.
3. Appeagyei, A. K., and Diefenderfer, S. D. Asphalt Material Inputs for the Mechanistic
Empirical Pavement Design Guide. VCTIR 12-R6. Virginia Center for Transportation
Innovation and Research. Charlottesville, 2011.
4. Hossain, M. S., and Kim, W. S. Estimation of Subgrade Resilient Modulus Using the
Unconfined Compression Test. VCTIR 15-R12. Virginia Center for Transportation
Innovation and Research. Charlottesville, 2014.
5. Hossain, M. S., and Lane, D. S. Development of a Catalog of Resilient Modulus
Values for Aggregate Base for Use With the Mechanistic-Empirical Pavement Design
Guide(MEPDG). VCTIR 15-R13. Virginia Center for Transportation Innovation and
Research. Charlottesville, 2015.
36
Appendix A Traffic Inputs
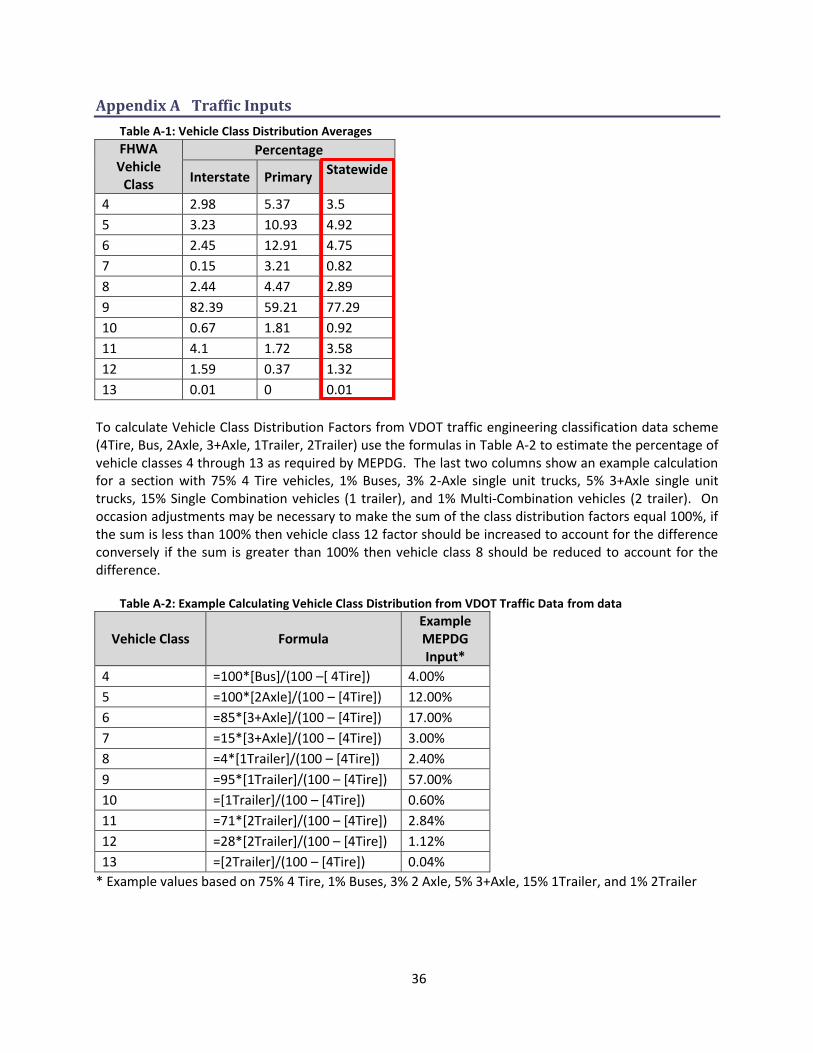
Table A-1: Vehicle Class Distribution Averages
FHWA Vehicle
Class
Percentage
Interstate Primary Statewide
4 2.98 5.37 3.5
5 3.23 10.93 4.92
6 2.45 12.91 4.75
7 0.15 3.21 0.82
8 2.44 4.47 2.89
9 82.39 59.21 77.29
10 0.67 1.81 0.92
11 4.1 1.72 3.58
12 1.59 0.37 1.32
13 0.01 0 0.01
To calculate Vehicle Class Distribution Factors from VDOT traffic engineering classification data scheme (4Tire, Bus, 2Axle, 3+Axle, 1Trailer, 2Trailer) use the formulas in Table A-2 to estimate the percentage of vehicle classes 4 through 13 as required by MEPDG. The last two columns show an example calculation for a section with 75% 4 Tire vehicles, 1% Buses, 3% 2-Axle single unit trucks, 5% 3+Axle single unit trucks, 15% Single Combination vehicles (1 trailer), and 1% Multi-Combination vehicles (2 trailer). On occasion adjustments may be necessary to make the sum of the class distribution factors equal 100%, if the sum is less than 100% then vehicle class 12 factor should be increased to account for the difference conversely if the sum is greater than 100% then vehicle class 8 should be reduced to account for the difference.
Table A-2: Example Calculating Vehicle Class Distribution from VDOT Traffic Data from data
Vehicle Class Formula Example MEPDG Input*
4 =100*[Bus]/(100 –[ 4Tire]) 4.00%
5 =100*[2Axle]/(100 – [4Tire]) 12.00%
6 =85*[3+Axle]/(100 – [4Tire]) 17.00%
7 =15*[3+Axle]/(100 – [4Tire]) 3.00%
8 =4*[1Trailer]/(100 – [4Tire]) 2.40%
9 =95*[1Trailer]/(100 – [4Tire]) 57.00%
10 =[1Trailer]/(100 – [4Tire]) 0.60%
11 =71*[2Trailer]/(100 – [4Tire]) 2.84%
12 =28*[2Trailer]/(100 – [4Tire]) 1.12%
13 =[2Trailer]/(100 – [4Tire]) 0.04%
* Example values based on 75% 4 Tire, 1% Buses, 3% 2 Axle, 5% 3+Axle, 15% 1Trailer, and 1% 2Trailer
37
Table A-3: Statewide Axles Per Truck Inputs-
Vehicle Class
Single Tandem Tridem Quad
4 1.91 0.09 0 0
5 2.05 0 0 0
6 1.05 0.97 0 0
7 1.25 0.04 0.41 0.55
8 2.21 0.72 0 0
9 1.23 1.87 0 0
10 1.05 0.92 0.87 0.1
11 5 0 0 0
12 4 1 0 0
13 1.57 2.61 0.07 0
38
Appendix B Asphalt Material Inputs
Table B-1: Average Asphalt Mix Properties for Level 1 Input
VDOT Surface Mix (SM)
Asphalt Mix: Dynamic Modulus Table
Temp (ºF)
Mixture |E*|, psi
0.1 Hz 0.5 Hz 1 Hz 5 Hz 10 Hz 25 Hz
14 2472412 2791777 2933728 3234538 3357731 3535348
40 1232916 1577939 1739624 2097479 2253344 2458075
70 439283 625230 742997 1029685 1172545 1368737
100 131955 196277 253704 401144 486218 603850
130 63086 80291 97669 156000 186382 234042
Asphalt Binder: Superpave Binder Test Data
Asphalt General: Vol. Properties as Built
Temp. (°F)
Angular freq. = 10 rad/sec
Total unit weight (pcf) 150.0
G* (Pa) Delta (°)
Effective Binder content (%) 12.1
158 4369 79.7
Air voids (%) 6.7
168.8 2208 82.0
179.6 1144 84.1
VDOT Intermediate Mix (IM)
Asphalt Mix: Dynamic Modulus Table
Temp (ºF)
Mixture |E*|, psi
0.1 Hz 0.5 Hz 1 Hz 5 Hz 10 Hz 25 Hz
14 2585306 2863864 2978360 3219785 3320363 3530717 40 1310346 1717074 1898928 2307067 2480184 2725420 70 303426 493034 622600 934744 1092152 1305467 100 73002 112848 147440 262462 336280 447428 130 37140 44906 51340 76249 95369 133014
Asphalt Binder: Superpave Binder Test Data
Asphalt General: Vol. Properties as
Built
Temp. (°F)
Angular freq. = 10 rad/sec
Total unit weight (pcf) 149.6
G* (Pa) Delta (°)
Effective Binder content (%) 11.1
50 19423333 43.5
Air voids (%) 5.3
77 1798000 60.6
104 147666.7 71.3
131 13320 79.3
158 1698 85.0
185 299.7333 88.3
39
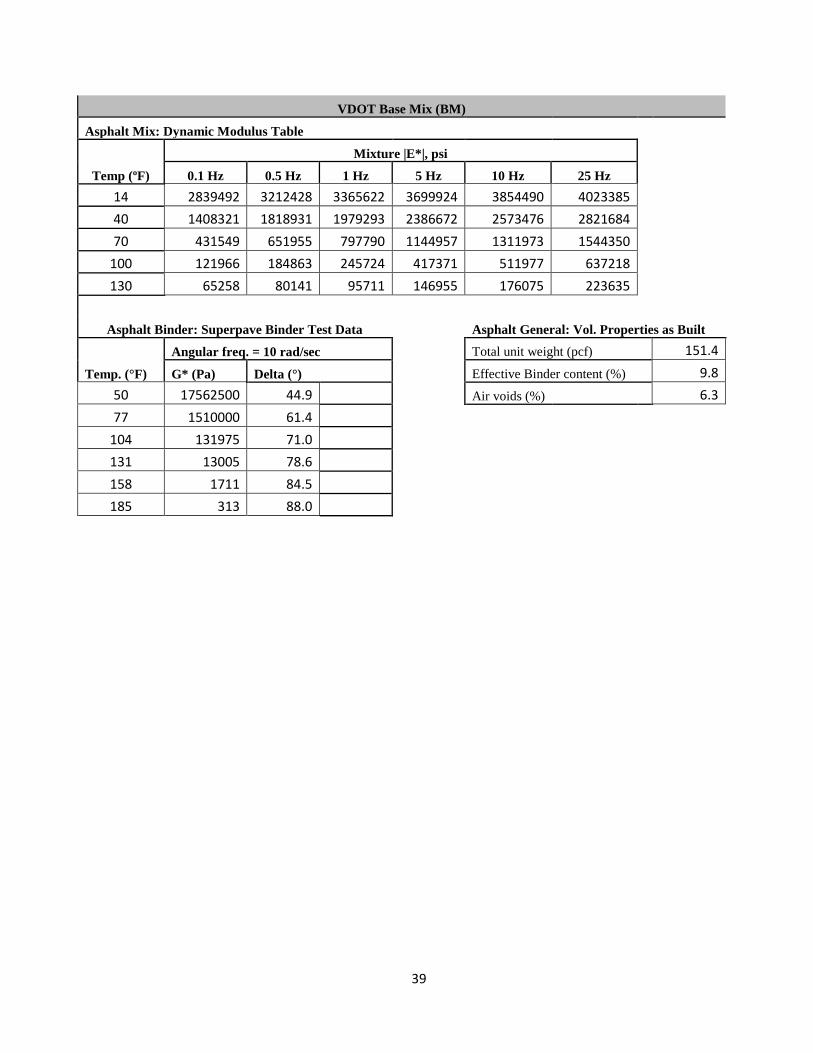
VDOT Base Mix (BM)
Asphalt Mix: Dynamic Modulus Table
Temp (ºF)
Mixture |E*|, psi
0.1 Hz 0.5 Hz 1 Hz 5 Hz 10 Hz 25 Hz
14 2839492 3212428 3365622 3699924 3854490 4023385 40 1408321 1818931 1979293 2386672 2573476 2821684 70 431549 651955 797790 1144957 1311973 1544350 100 121966 184863 245724 417371 511977 637218 130 65258 80141 95711 146955 176075 223635
Asphalt Binder: Superpave Binder Test Data
Asphalt General: Vol. Properties as Built
Temp. (°F)
Angular freq. = 10 rad/sec
Total unit weight (pcf) 151.4
G* (Pa) Delta (°)
Effective Binder content (%) 9.8
50 17562500 44.9
Air voids (%) 6.3
77 1510000 61.4
104 131975 71.0
131 13005 78.6
158 1711 84.5
185 313 88.0
40
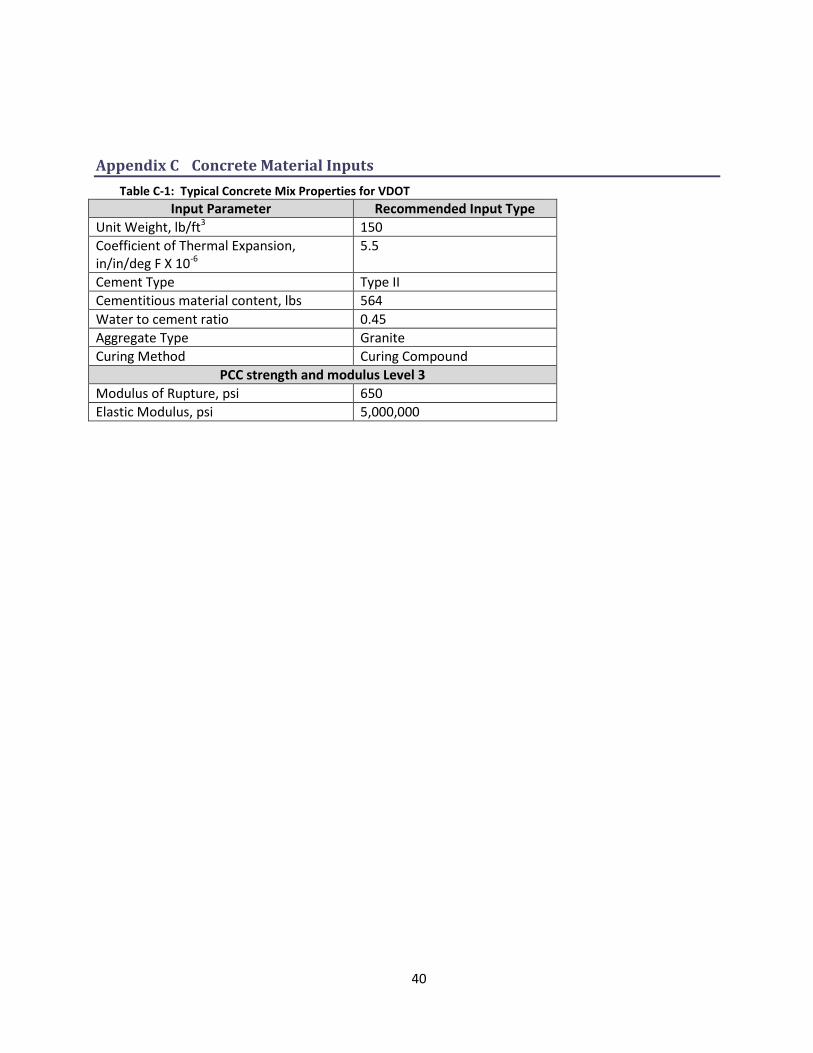
Appendix C Concrete Material Inputs
Table C-1: Typical Concrete Mix Properties for VDOT
Input Parameter Recommended Input Type
Unit Weight, lb/ft3 150
Coefficient of Thermal Expansion, in/in/deg F X 10-6
5.5
Cement Type Type II
Cementitious material content, lbs 564
Water to cement ratio 0.45
Aggregate Type Granite
Curing Method Curing Compound
PCC strength and modulus Level 3
Modulus of Rupture, psi 650
Elastic Modulus, psi 5,000,000
41
Appendix D Chemically Stabilized Layers input as Non-Stabilized/Subgrade Layers
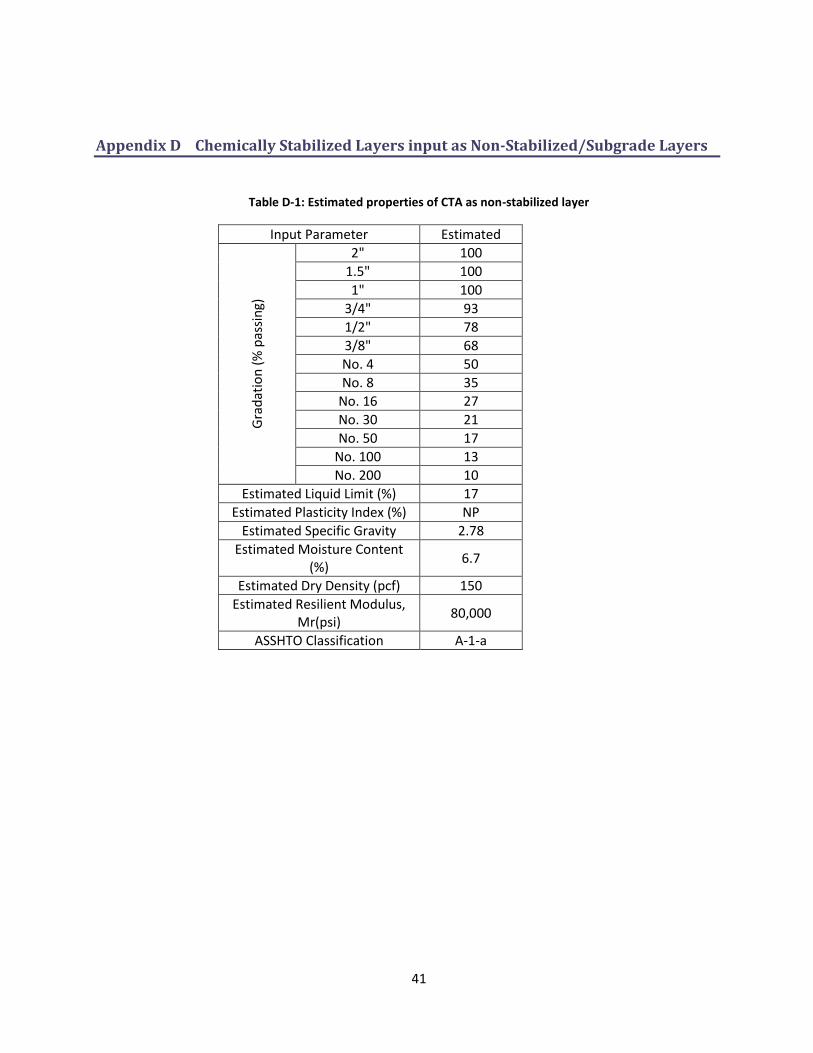
Table D-1: Estimated properties of CTA as non-stabilized layer
Input Parameter Estimated
Gra
dat
ion
(%
pas
sin
g)
2" 100
1.5" 100
1" 100
3/4" 93
1/2" 78
3/8" 68
No. 4 50
No. 8 35
No. 16 27
No. 30 21
No. 50 17
No. 100 13
No. 200 10
Estimated Liquid Limit (%) 17
Estimated Plasticity Index (%) NP
Estimated Specific Gravity 2.78
Estimated Moisture Content (%)
6.7
Estimated Dry Density (pcf) 150
Estimated Resilient Modulus, Mr(psi)
80,000
ASSHTO Classification A-1-a
42
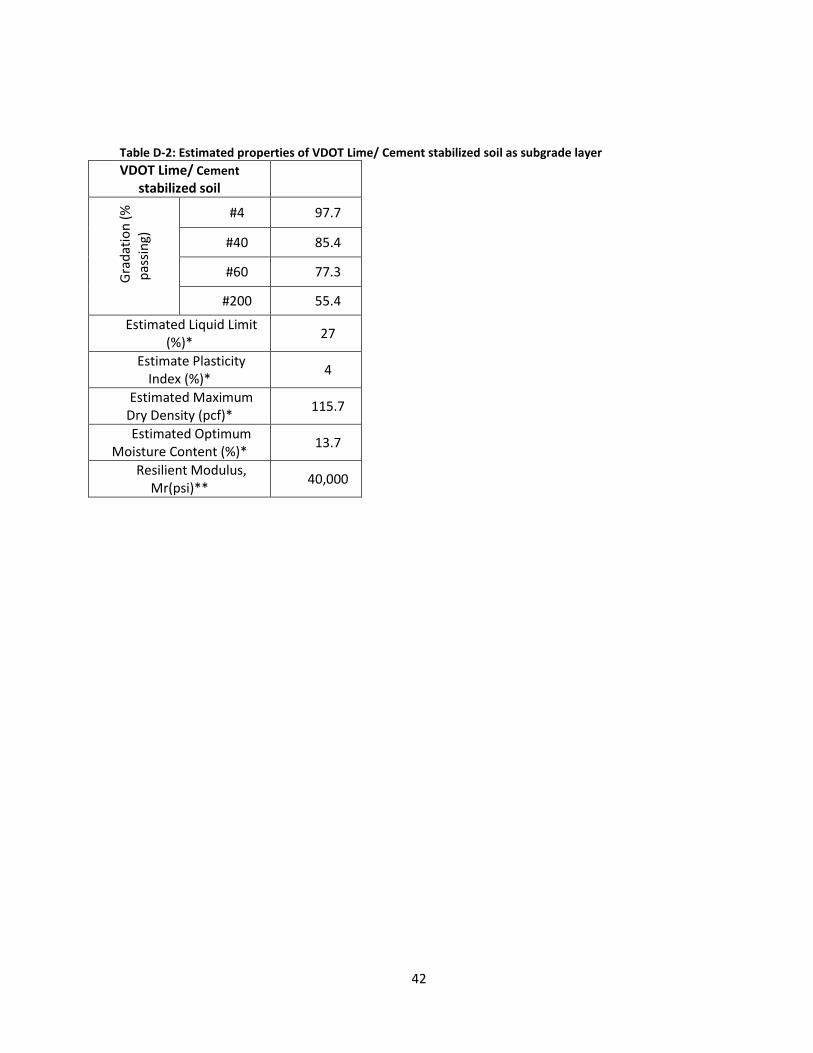
Table D-2: Estimated properties of VDOT Lime/ Cement stabilized soil as subgrade layer
VDOT Lime/ Cement stabilized soil
Gra
dat
ion
(%
p
assi
ng)
#4 97.7
#40 85.4
#60 77.3
#200 55.4
Estimated Liquid Limit (%)*
27
Estimate Plasticity Index (%)*
4
Estimated Maximum Dry Density (pcf)*
115.7
Estimated Optimum Moisture Content (%)*
13.7
Resilient Modulus, Mr(psi)**
40,000
43
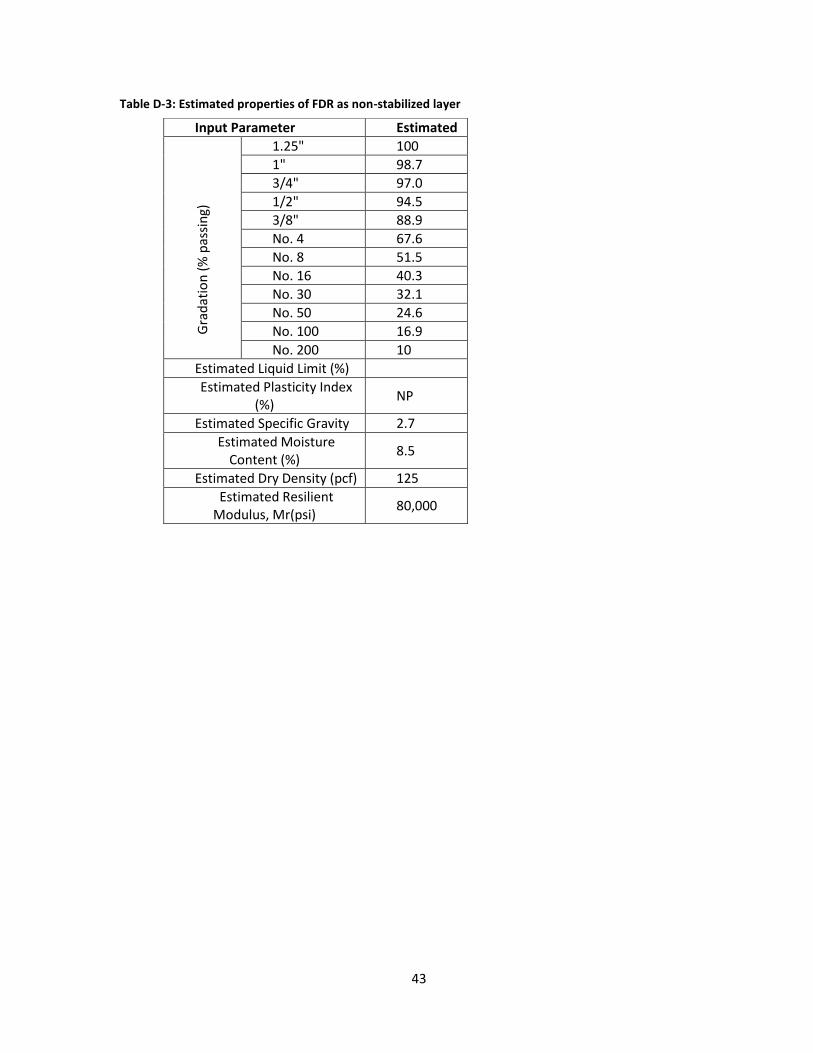
Table D-3: Estimated properties of FDR as non-stabilized layer
Input Parameter Estimated
Gra
dat
ion
(%
pas
sin
g)
1.25" 100
1" 98.7
3/4" 97.0
1/2" 94.5
3/8" 88.9
No. 4 67.6
No. 8 51.5
No. 16 40.3
No. 30 32.1
No. 50 24.6
No. 100 16.9
No. 200 10
Estimated Liquid Limit (%)
Estimated Plasticity Index (%)
NP
Estimated Specific Gravity 2.7
Estimated Moisture Content (%)
8.5
Estimated Dry Density (pcf) 125
Estimated Resilient Modulus, Mr(psi)
80,000
44
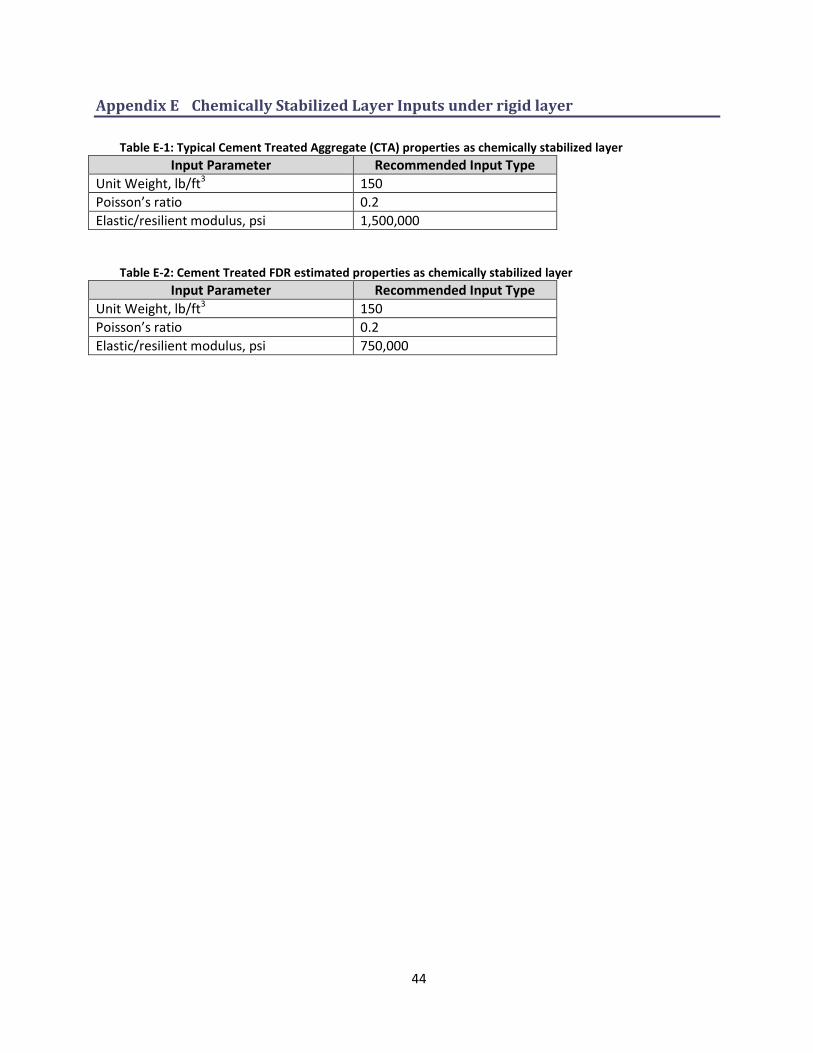
Appendix E Chemically Stabilized Layer Inputs under rigid layer
Table E-1: Typical Cement Treated Aggregate (CTA) properties as chemically stabilized layer
Input Parameter Recommended Input Type
Unit Weight, lb/ft3 150
Poisson’s ratio 0.2
Elastic/resilient modulus, psi 1,500,000
Table E-2: Cement Treated FDR estimated properties as chemically stabilized layer
Input Parameter Recommended Input Type
Unit Weight, lb/ft3 150
Poisson’s ratio 0.2
Elastic/resilient modulus, psi 750,000
45
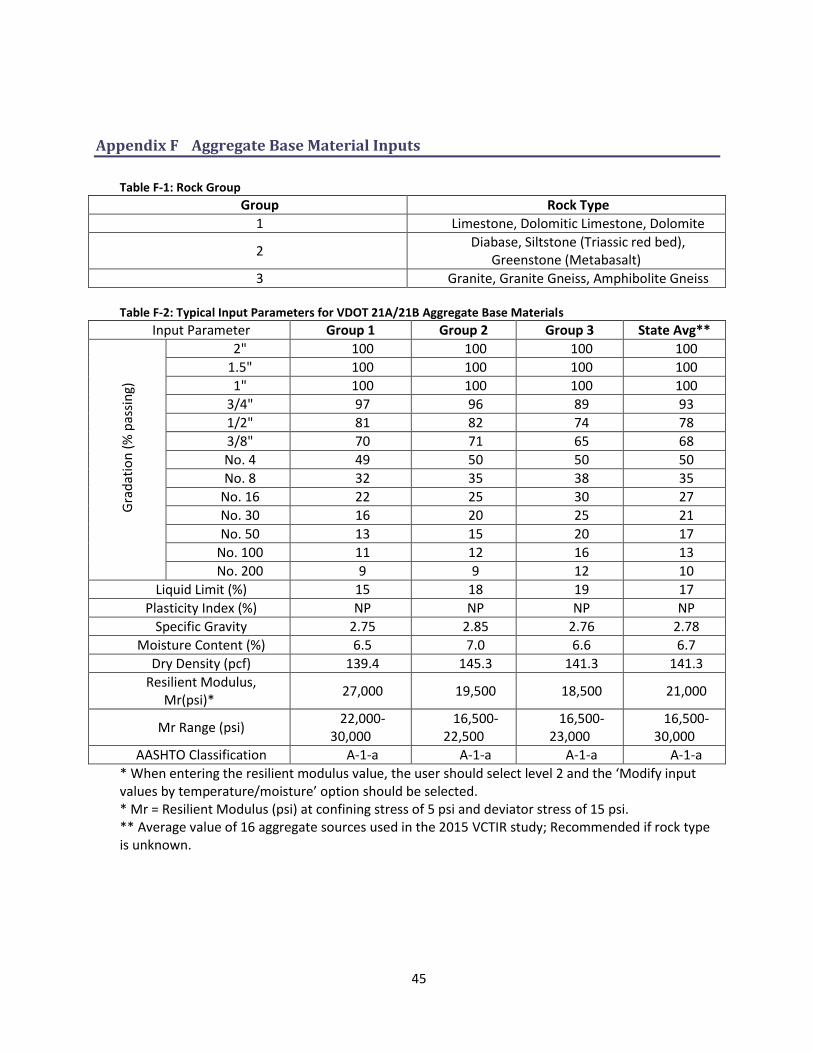
Appendix F Aggregate Base Material Inputs
Table F-1: Rock Group
Group Rock Type
1 Limestone, Dolomitic Limestone, Dolomite
2 Diabase, Siltstone (Triassic red bed),
Greenstone (Metabasalt)
3 Granite, Granite Gneiss, Amphibolite Gneiss Table F-2: Typical Input Parameters for VDOT 21A/21B Aggregate Base Materials
Input Parameter Group 1 Group 2 Group 3 State Avg**
Gra
dat
ion
(%
pas
sin
g)
2" 100 100 100 100
1.5" 100 100 100 100
1" 100 100 100 100
3/4" 97 96 89 93
1/2" 81 82 74 78
3/8" 70 71 65 68
No. 4 49 50 50 50
No. 8 32 35 38 35
No. 16 22 25 30 27
No. 30 16 20 25 21
No. 50 13 15 20 17
No. 100 11 12 16 13
No. 200 9 9 12 10
Liquid Limit (%) 15 18 19 17
Plasticity Index (%) NP NP NP NP
Specific Gravity 2.75 2.85 2.76 2.78
Moisture Content (%) 6.5 7.0 6.6 6.7
Dry Density (pcf) 139.4 145.3 141.3 141.3
Resilient Modulus, Mr(psi)*
27,000 19,500 18,500 21,000
Mr Range (psi) 22,000-
30,000 16,500-
22,500 16,500-
23,000 16,500-
30,000
AASHTO Classification A-1-a A-1-a A-1-a A-1-a
* When entering the resilient modulus value, the user should select level 2 and the ‘Modify input values by temperature/moisture’ option should be selected. * Mr = Resilient Modulus (psi) at confining stress of 5 psi and deviator stress of 15 psi. ** Average value of 16 aggregate sources used in the 2015 VCTIR study; Recommended if rock type is unknown.
46
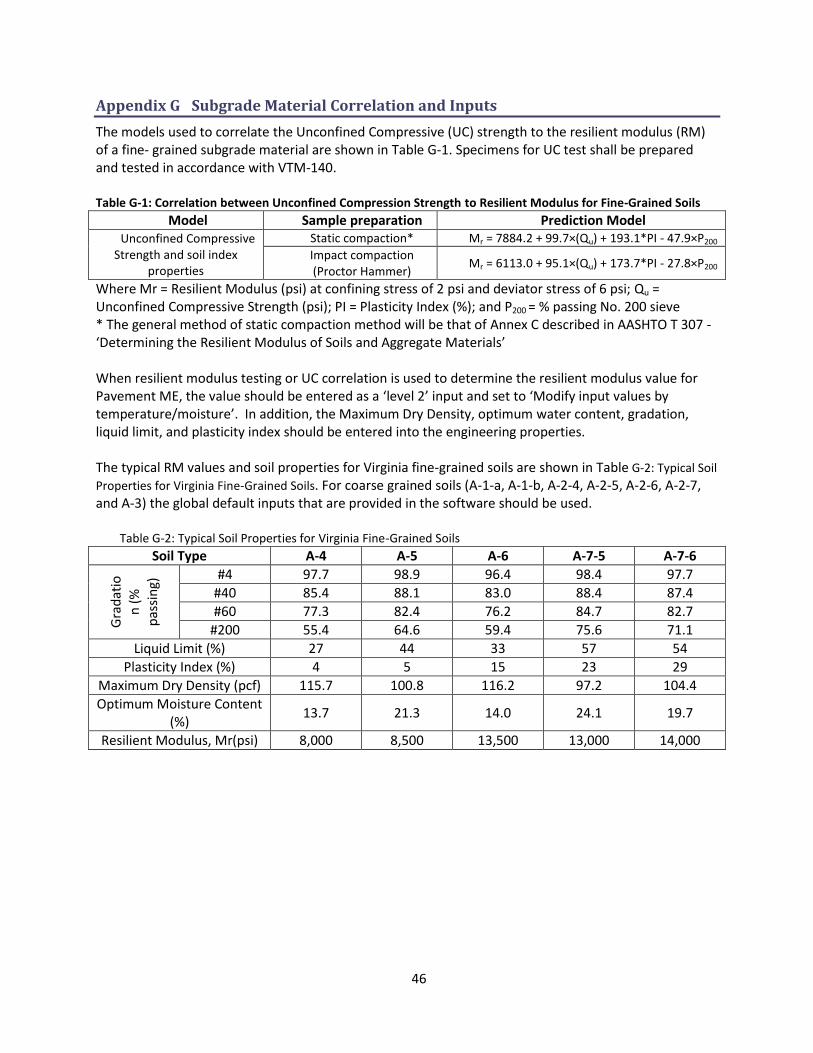
Appendix G Subgrade Material Correlation and Inputs
The models used to correlate the Unconfined Compressive (UC) strength to the resilient modulus (RM) of a fine- grained subgrade material are shown in Table G-1. Specimens for UC test shall be prepared and tested in accordance with VTM-140.
Table G-1: Correlation between Unconfined Compression Strength to Resilient Modulus for Fine-Grained Soils
Model Sample preparation Prediction Model Unconfined Compressive
Strength and soil index properties
Static compaction* Mr = 7884.2 + 99.7×(Qu) + 193.1*PI - 47.9×P200
Impact compaction (Proctor Hammer)
Mr = 6113.0 + 95.1×(Qu) + 173.7*PI - 27.8×P200
Where Mr = Resilient Modulus (psi) at confining stress of 2 psi and deviator stress of 6 psi; Qu = Unconfined Compressive Strength (psi); PI = Plasticity Index (%); and P200 = % passing No. 200 sieve * The general method of static compaction method will be that of Annex C described in AASHTO T 307 - ‘Determining the Resilient Modulus of Soils and Aggregate Materials’ When resilient modulus testing or UC correlation is used to determine the resilient modulus value for Pavement ME, the value should be entered as a ‘level 2’ input and set to ‘Modify input values by temperature/moisture’. In addition, the Maximum Dry Density, optimum water content, gradation, liquid limit, and plasticity index should be entered into the engineering properties.
The typical RM values and soil properties for Virginia fine-grained soils are shown in Table G-2: Typical Soil
Properties for Virginia Fine-Grained Soils. For coarse grained soils (A-1-a, A-1-b, A-2-4, A-2-5, A-2-6, A-2-7, and A-3) the global default inputs that are provided in the software should be used.
Table G-2: Typical Soil Properties for Virginia Fine-Grained Soils
Soil Type A-4 A-5 A-6 A-7-5 A-7-6
Gra
dat
ion
(%
p
assi
ng)
#4 97.7 98.9 96.4 98.4 97.7
#40 85.4 88.1 83.0 88.4 87.4
#60 77.3 82.4 76.2 84.7 82.7
#200 55.4 64.6 59.4 75.6 71.1
Liquid Limit (%) 27 44 33 57 54
Plasticity Index (%) 4 5 15 23 29
Maximum Dry Density (pcf) 115.7 100.8 116.2 97.2 104.4
Optimum Moisture Content (%)
13.7 21.3 14.0 24.1 19.7
Resilient Modulus, Mr(psi) 8,000 8,500 13,500 13,000 14,000
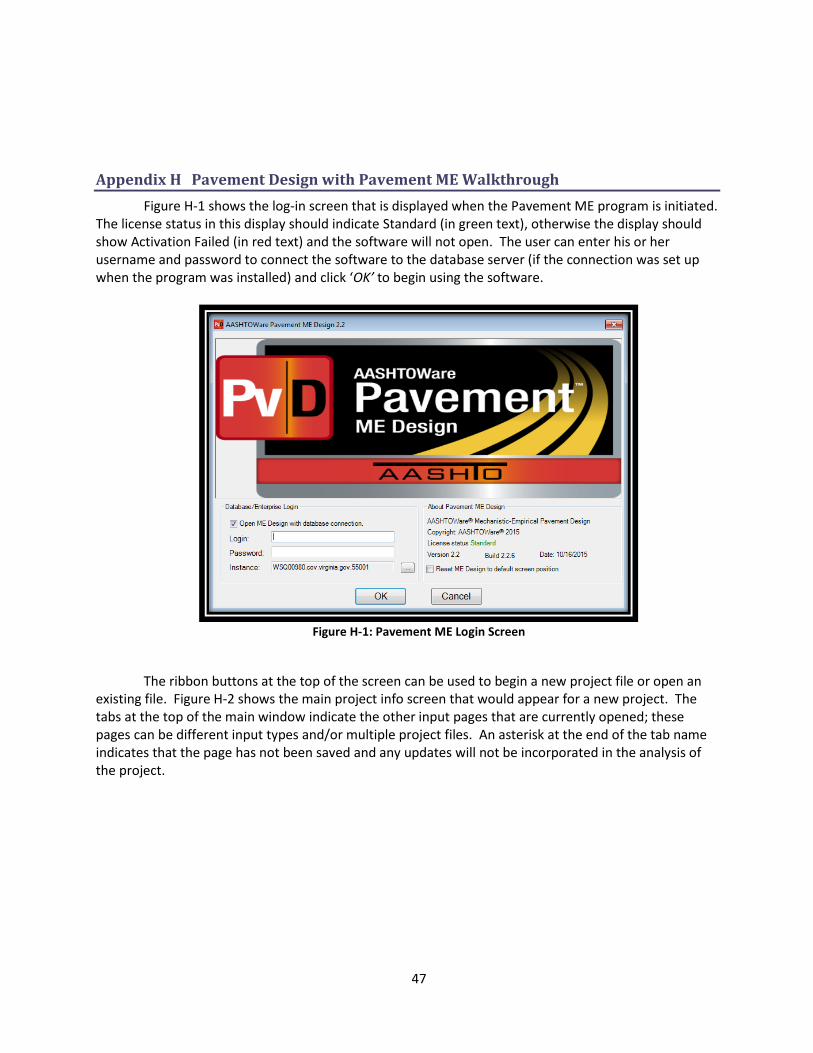
47
Appendix H Pavement Design with Pavement ME Walkthrough
Figure H-1 shows the log-in screen that is displayed when the Pavement ME program is initiated. The license status in this display should indicate Standard (in green text), otherwise the display should show Activation Failed (in red text) and the software will not open. The user can enter his or her username and password to connect the software to the database server (if the connection was set up when the program was installed) and click ‘OK’ to begin using the software.
Figure H-1: Pavement ME Login Screen
The ribbon buttons at the top of the screen can be used to begin a new project file or open an
existing file. Figure H-2 shows the main project info screen that would appear for a new project. The tabs at the top of the main window indicate the other input pages that are currently opened; these pages can be different input types and/or multiple project files. An asterisk at the end of the tab name indicates that the page has not been saved and any updates will not be incorporated in the analysis of the project.
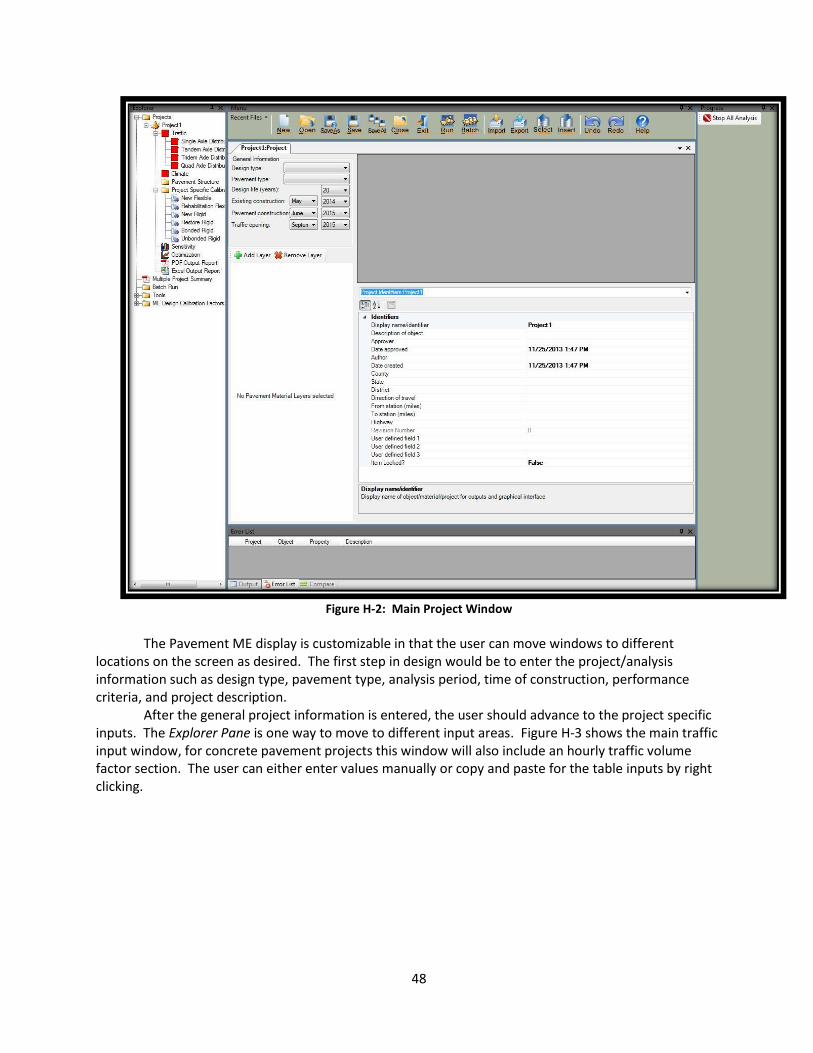
48
Figure H-2: Main Project Window
The Pavement ME display is customizable in that the user can move windows to different
locations on the screen as desired. The first step in design would be to enter the project/analysis information such as design type, pavement type, analysis period, time of construction, performance criteria, and project description.
After the general project information is entered, the user should advance to the project specific inputs. The Explorer Pane is one way to move to different input areas. Figure H-3 shows the main traffic input window, for concrete pavement projects this window will also include an hourly traffic volume factor section. The user can either enter values manually or copy and paste for the table inputs by right clicking.
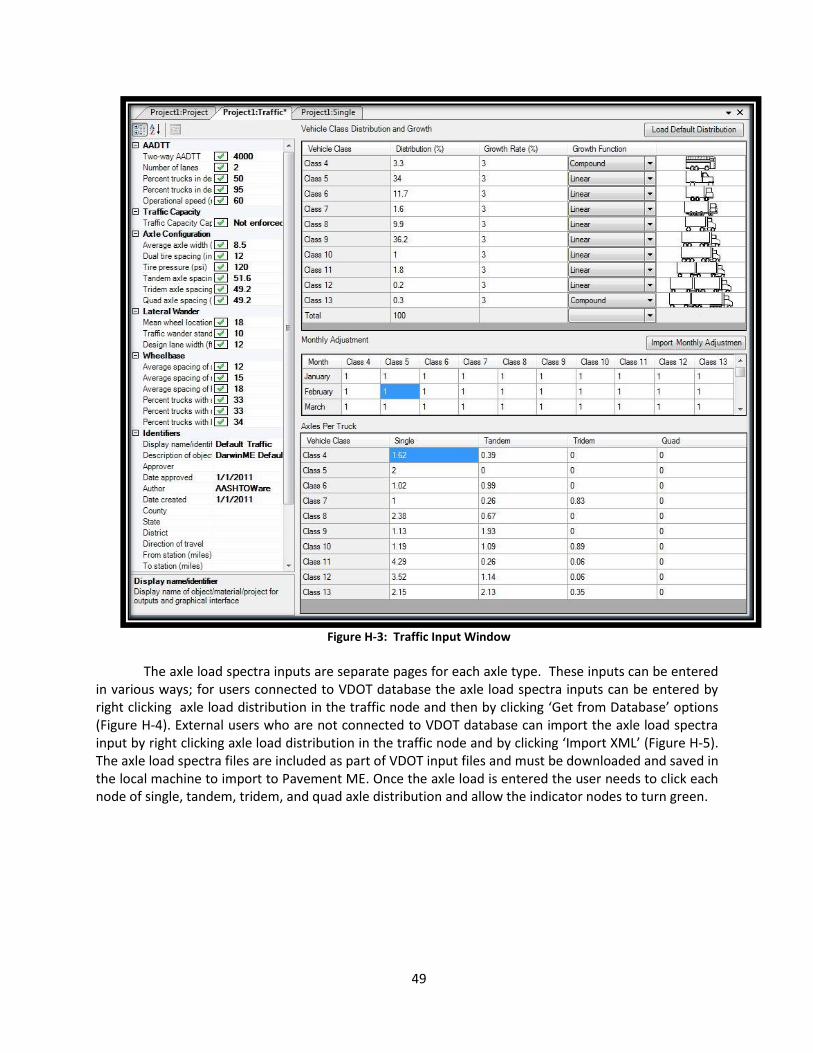
49
Figure H-3: Traffic Input Window
The axle load spectra inputs are separate pages for each axle type. These inputs can be entered
in various ways; for users connected to VDOT database the axle load spectra inputs can be entered by right clicking axle load distribution in the traffic node and then by clicking ‘Get from Database’ options (Figure H-4). External users who are not connected to VDOT database can import the axle load spectra input by right clicking axle load distribution in the traffic node and by clicking ‘Import XML’ (Figure H-5). The axle load spectra files are included as part of VDOT input files and must be downloaded and saved in the local machine to import to Pavement ME. Once the axle load is entered the user needs to click each node of single, tandem, tridem, and quad axle distribution and allow the indicator nodes to turn green.
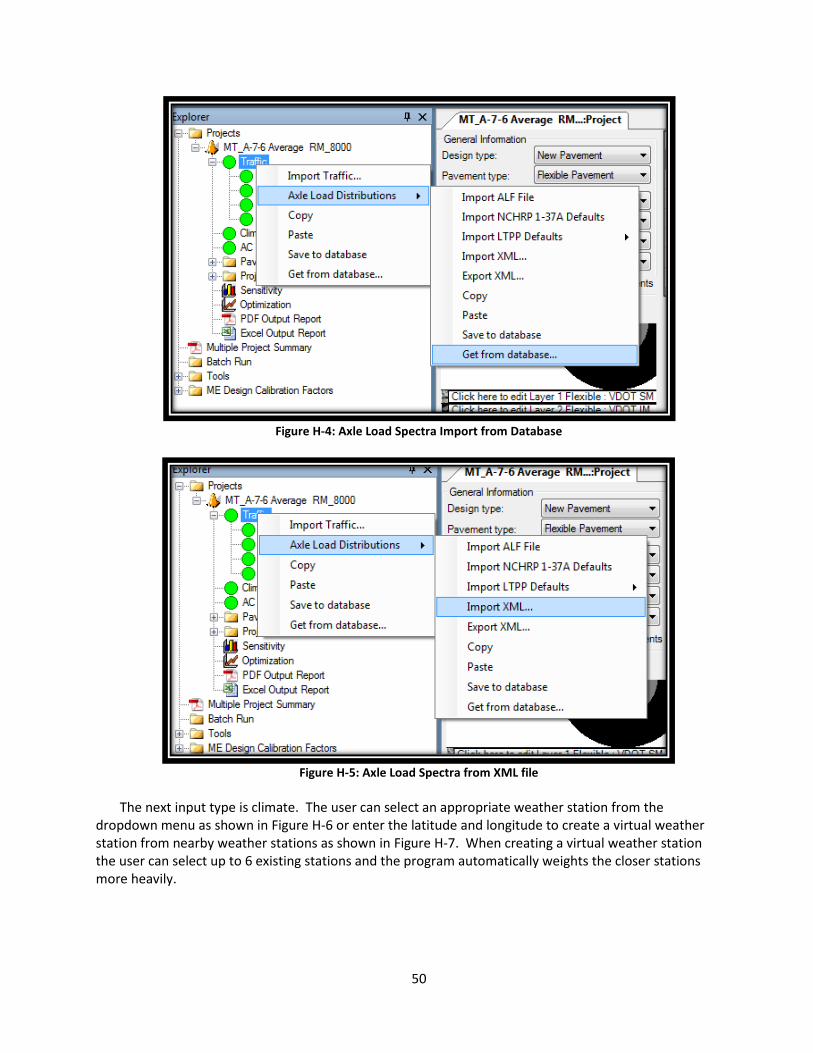
50
Figure H-4: Axle Load Spectra Import from Database
Figure H-5: Axle Load Spectra from XML file
The next input type is climate. The user can select an appropriate weather station from the
dropdown menu as shown in Figure H-6 or enter the latitude and longitude to create a virtual weather station from nearby weather stations as shown in Figure H-7. When creating a virtual weather station the user can select up to 6 existing stations and the program automatically weights the closer stations more heavily.
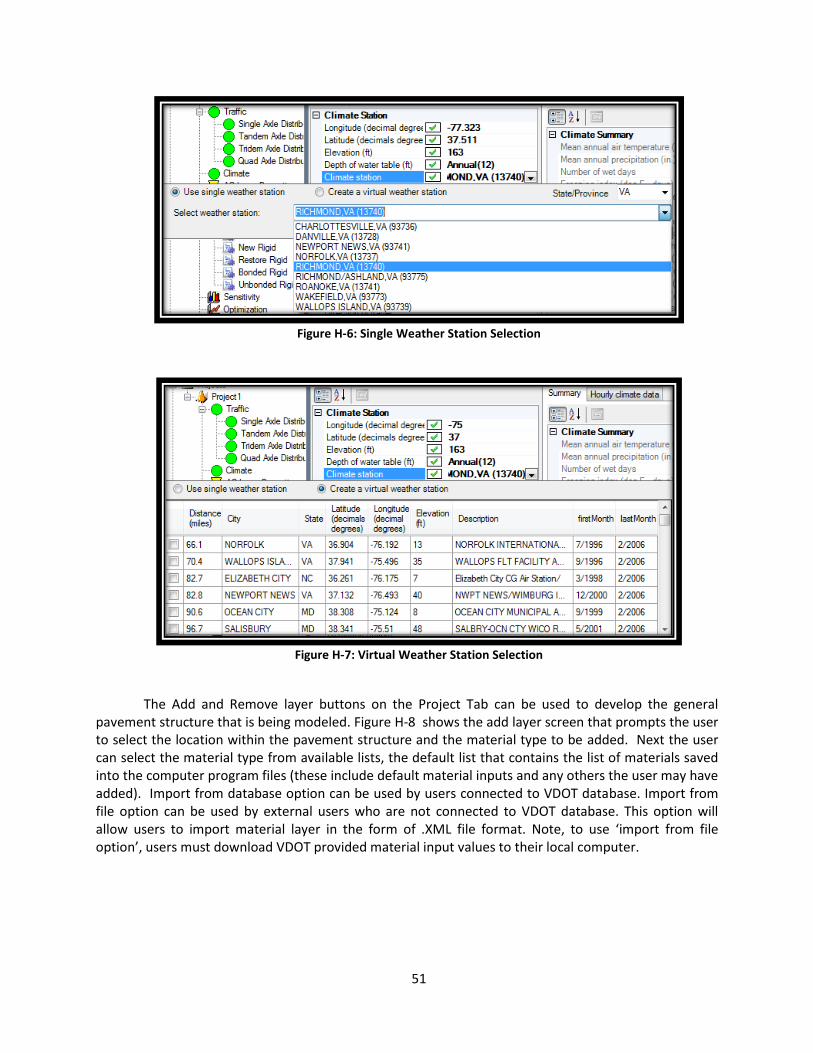
51
Figure H-6: Single Weather Station Selection
Figure H-7: Virtual Weather Station Selection
The Add and Remove layer buttons on the Project Tab can be used to develop the general
pavement structure that is being modeled. Figure H-8 shows the add layer screen that prompts the user to select the location within the pavement structure and the material type to be added. Next the user can select the material type from available lists, the default list that contains the list of materials saved into the computer program files (these include default material inputs and any others the user may have added). Import from database option can be used by users connected to VDOT database. Import from file option can be used by external users who are not connected to VDOT database. This option will allow users to import material layer in the form of .XML file format. Note, to use ‘import from file option’, users must download VDOT provided material input values to their local computer.
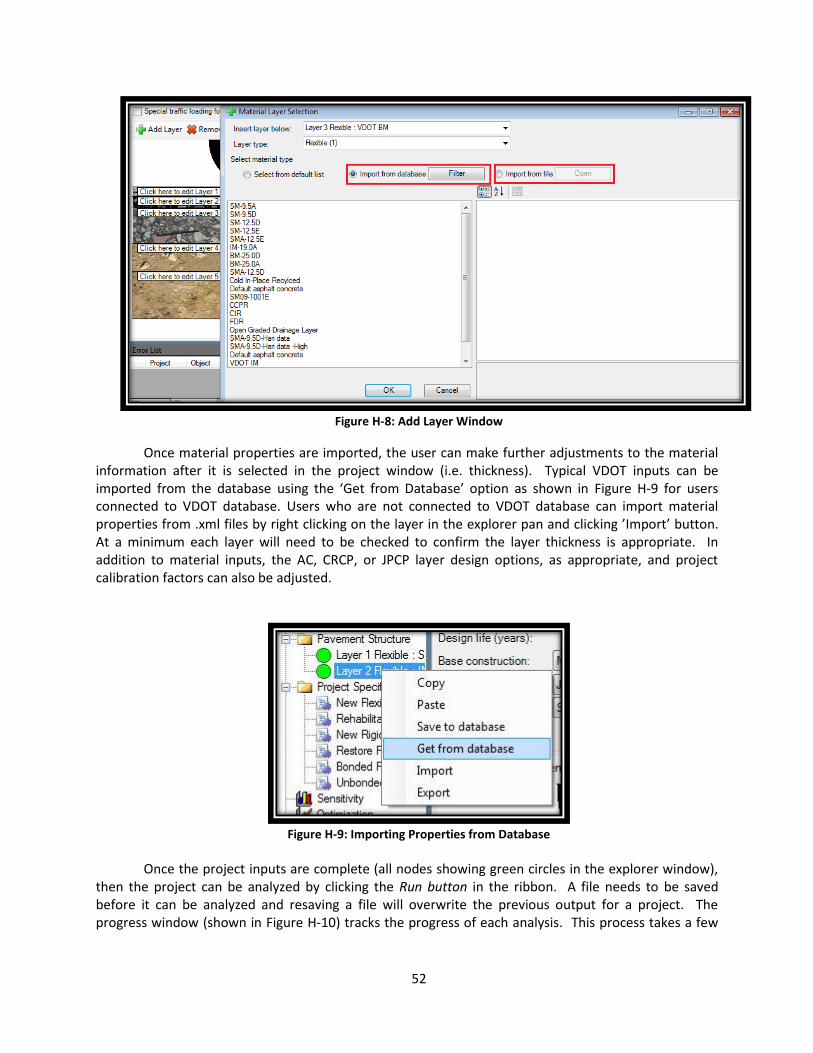
52
Figure H-8: Add Layer Window
Once material properties are imported, the user can make further adjustments to the material information after it is selected in the project window (i.e. thickness). Typical VDOT inputs can be imported from the database using the ‘Get from Database’ option as shown in Figure H-9 for users connected to VDOT database. Users who are not connected to VDOT database can import material properties from .xml files by right clicking on the layer in the explorer pan and clicking ’Import’ button. At a minimum each layer will need to be checked to confirm the layer thickness is appropriate. In addition to material inputs, the AC, CRCP, or JPCP layer design options, as appropriate, and project calibration factors can also be adjusted.
Figure H-9: Importing Properties from Database
Once the project inputs are complete (all nodes showing green circles in the explorer window),
then the project can be analyzed by clicking the Run button in the ribbon. A file needs to be saved before it can be analyzed and resaving a file will overwrite the previous output for a project. The progress window (shown in Figure H-10) tracks the progress of each analysis. This process takes a few
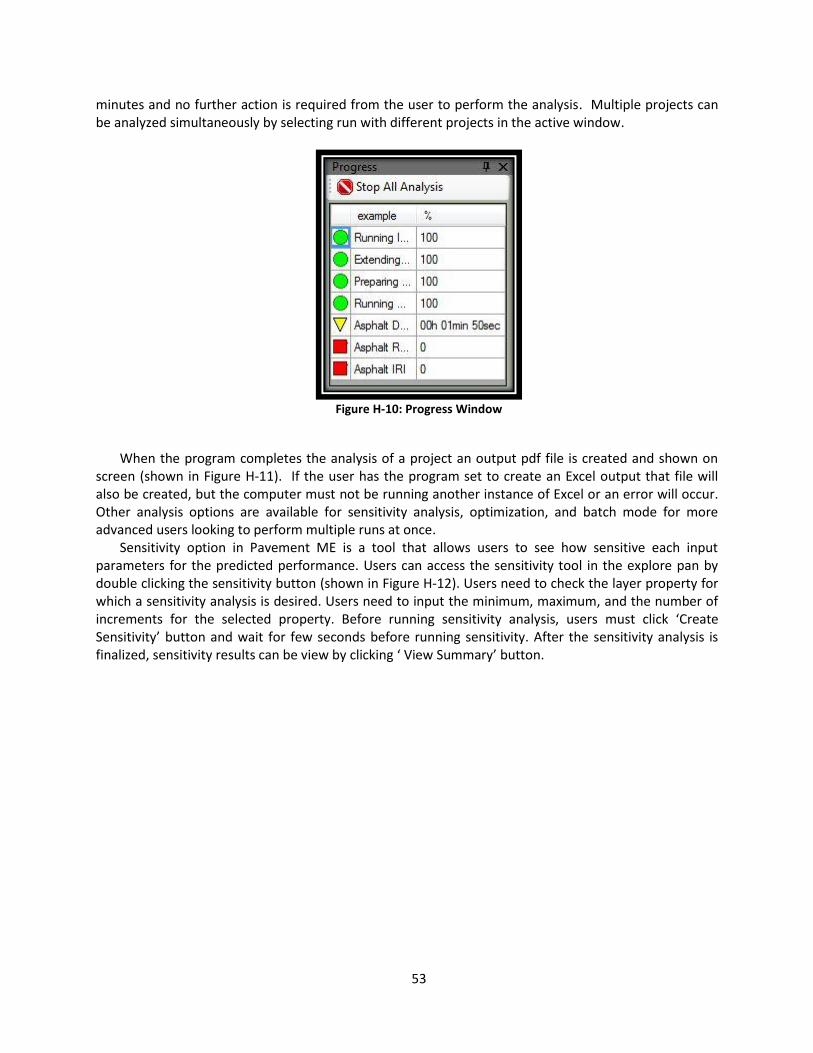
53
minutes and no further action is required from the user to perform the analysis. Multiple projects can be analyzed simultaneously by selecting run with different projects in the active window.
Figure H-10: Progress Window
When the program completes the analysis of a project an output pdf file is created and shown on
screen (shown in Figure H-11). If the user has the program set to create an Excel output that file will also be created, but the computer must not be running another instance of Excel or an error will occur. Other analysis options are available for sensitivity analysis, optimization, and batch mode for more advanced users looking to perform multiple runs at once.
Sensitivity option in Pavement ME is a tool that allows users to see how sensitive each input parameters for the predicted performance. Users can access the sensitivity tool in the explore pan by double clicking the sensitivity button (shown in Figure H-12). Users need to check the layer property for which a sensitivity analysis is desired. Users need to input the minimum, maximum, and the number of increments for the selected property. Before running sensitivity analysis, users must click ‘Create Sensitivity’ button and wait for few seconds before running sensitivity. After the sensitivity analysis is finalized, sensitivity results can be view by clicking ‘ View Summary’ button.
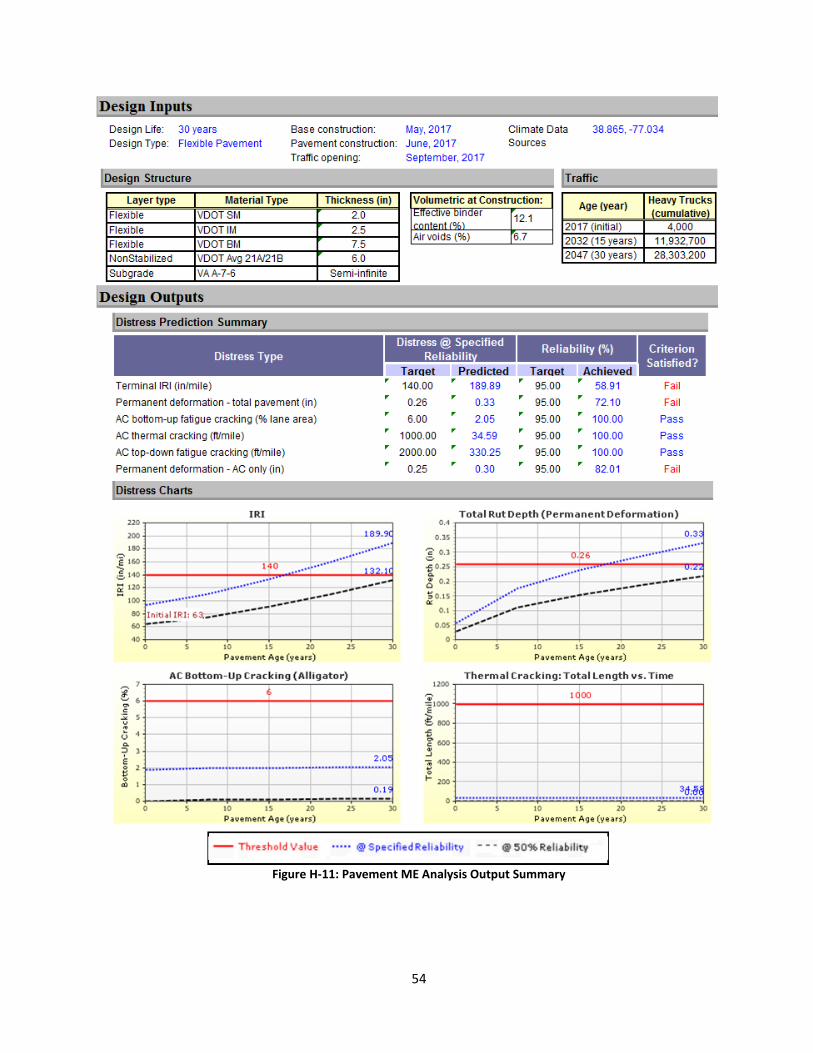
54
Figure H-11: Pavement ME Analysis Output Summary
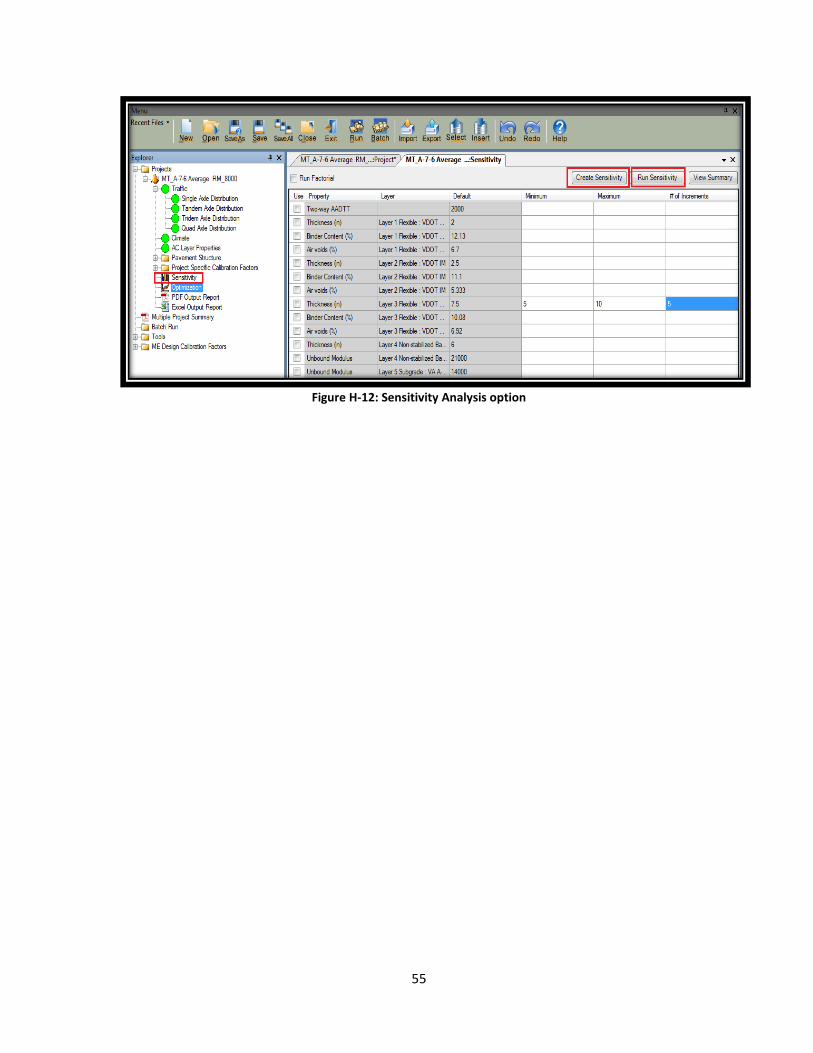
55
Figure H-12: Sensitivity Analysis option


![Composite Pavement Virginia Tech 09 Cr2[1]](https://static.fdocuments.us/doc/165x107/577d36c61a28ab3a6b93fd5c/composite-pavement-virginia-tech-09-cr21.jpg)