AARP EUROPEAN LEADERSHIP STUDY: European Experiences with
27
European Experiences with Prescription Drug Pricing France, Norway, and the United Kingdom October 2006 AARP EUROPEAN LEADERSHIP STUDY:
Transcript of AARP EUROPEAN LEADERSHIP STUDY: European Experiences with

EuropeanExperiences withPrescriptionDrug Pricing
France, Norway, and theUnited Kingdom
October 2006
A A R P E U RO P E A N L E A D E R S H I P S T U D Y:
The challenge to policymakers
here and abroad is to ensure
that residents have appropriate
access to drugs and that drug
manufacturers have adequate
incentive to continue developing
important products . . .
Special thanks to Cliff Binder of the Public Policy Institute and the
Global Aging Program for their time and dedication to this product.

With health care costs rising at unsustainable rates and the Baby Boom
Generation nearing retirement, the United States faces essential and
imminent debates on the reform of our health care and long-term care systems. As
the leading organization in America for positive social change, AARP is poised to
lead the discussion on how to achieve better and more affordable health care in the
United States and provide long-term care for older Americans. To further inform
the discussion, AARP’s Board of Directors and senior management traveled to
Europe in June 2006 on a fact-finding mission to examine the experiences, trends,
and best practices in global aging.
The European Leadership Study (The Study) concentrated on AARP’s priority
issues of health care and long-term care and examined how certain European coun-
tries are addressing challenges similar to those faced in the United States. In particu-
lar, The Study provided a deeper understanding of the European experience on
pharmaceutical pricing, health information technology, financing and delivery of
long-term care services and health care cost containment.
During The Study, the AARP delegation visited France, Norway, the United
Kingdom and the Netherlands. The Study provided an opportunity for direct con-
versations with government officials, representatives from key nongovernmental
organizations, consumers, and business leaders. The Study participants held discus-
sions with national health ministers, health care consumers and practitioners,
including sessions with the Chief Executive of the United Kingdom’s National
3
A A R P E U RO P E A N L E A D E R S H I P S T U D Y: P R E S C R I P T I O N D RU G P R I C I N G
Preface

Institute for Clinical Excellence (NICE), representatives from Sanofi-Aventis,
France’s leading pharmaceutical company, and political party officials in the
Norwegian Parliament from the Standing Committee on Health and Care Services.
The Study also included site visits to hospitals and long-term care facilities that
provided invaluable first-hand observation of care as it is practiced abroad.
With the publication of four Issue Papers prepared by the AARP Public Policy
Institute, AARP is presenting the background materials prepared in advance of
The Study and the lessons learned that were compiled afterwards. The four Issue
Papers address: long-term care; health information technology; pharmaceutical
pricing; and health care cost containment. The Issue Papers rely on published
materials, readily available data sources (such as reports and studies from the
Organization for Economic Cooperation and Development and the European
Commission, among others) and include, when possible, knowledge from
first-hand, in-country experiences.
Due to the nature of available information sources, it was difficult to systematically
draw direct comparisons among the four countries visited. Nevertheless, the papers
offer important lessons for the United States and teach us that, while we are
progressing in some areas of health and long-term care, there is much we can
learn from European countries as we address these critical issues.
ERIK OLSEN BILL NOVELLI
President CEO
4
A A R P E U RO P E A N L E A D E R S H I P S T U D Y: P R E S C R I P T I O N D RU G P R I C I N G

Do Americans spend more on prescription drugs than residents of other
countries and, if so, why? Over the years, this has been a topic of much
debate and study, particularly with regard to the price of individual drug products.
If the United States adopted policies from other advanced countries, would the pat-
tern of drug spending change? The following report describes key policies, market
forces, and trends that influence prescription drug spending in the United States
(U.S.) and three European countries—France, Norway, and the United Kingdom1
(UK). The report also identifies some lessons learned from the experiences of these
countries in attempting to control the cost of pharmaceuticals, especially through
the regulation of prescription drug prices.
The topic of prescription drugs is prominent in policy discussions because medi-
cines represent life-saving treatment for some patients and substantially improve the
quality of life for others. In addition, while prescription drugs contribute to health
care spending, some analysts and policymakers believe prescription drugs can reduce
overall health expenditures by reducing use of tertiary care, emergency rooms, and
inpatient hospital services. Therefore, the overarching prescription drug issues facing
the U.S. and other countries are affordability and access; also important is the issue
of drug development and its related industrial policy implications. The challenge to
policymakers here and abroad is to ensure that residents have appropriate access to
drugs and that drug manufacturers have adequate incentive to continue developing
important products, while prescription drug expenditures are controlled.
5
A A R P E U RO P E A N L E A D E R S H I P S T U D Y: P R E S C R I P T I O N D RU G P R I C I N G
Introduction toPrescription Drug Issues

Figure 1 places drug spending in perspective by showing that it is a minor compo-
nent of total health spending in the study countries, especially in the U.S., where it
accounts for 12 percent of total health spending. Still, pharmaceutical expenditures
exceed growth rates for most other components of health care spending within the
U.S. and the other countries. As shown in Figure 2, aggregate U.S. prescription
drug spending in 2003 grew by 10 percent annually, outpacing European countries.
Similarly, U.S. per capita prescription drug spending exceeds rates in the other
countries, as shown in Figure 3; this occurs despite the fact that one in seven
Americans are without health insurance coverage. Among the factors that account
for some of these international differences in prescription drug expenditures are
demographic composition, national wealth, drug coverage, cultural norms, and
medical practice patterns.
Public policies also drive some of the variation across countries in prescription drug
expenditures. One public policy consideration central to the topic of prescription
drugs is access. What weight should access be given relative to cost, and under what
circumstances are limitations on access appropriate? Attention is turning from the
issue of the cost of access alone to the issue of the value (i.e., outcomes) derived
from using health care products (e.g., drugs) and services. The value discussion has
arisen in large part from the realization that higher spending may be more accept-
able if desirable outcomes are achieved as a result. Policies relying on clinical guide-
lines and comparative effectiveness research are emerging to guide value purchasing
decisions.
6
A A R P E U RO P E A N L E A D E R S H I P S T U D Y: P R E S C R I P T I O N D RU G P R I C I N G
FIGURE 1: Pharmaceutical Expenditures as a Percentage of
Total Health Care Expenditures
Source: Organization for Economic Co-operation and Development (OECD) Health Data 2005. Note: Norway data displayed for 2003 are for 2002; UK, 1997.
France Netherlands Norway United Kingdom United States
0
5
10
15
20
25
1993 2003

7
A A R P E U RO P E A N L E A D E R S H I P S T U D Y: P R E S C R I P T I O N D RU G P R I C I N G
FIGURE 2: Annual Percentage Growth in Prescription Drug Expenditures
FIGURE 3: Per Capita Prescription Drug Expenditures
Source: Organization for Economic Co-operation and Development (OECD) Health Data 2005. Note: Norway data displayed for 2003 are for 2002; UK data unavailable.
Source: Organization for Economic Co-operation and Development (OECD) Health Data 2005. Note: Norway data displayed for 2003 are for 2002; UK data unavailable.2
France NetherlandsNorway United States
0
2
4
6
8
10
12
2003 Percentage Growth in Prescription Drug Expenditures
France NetherlandsNorway United States
0
100
200
300
400
500
600
700
800
2003 Drug Expenditures (PPPs)
Another key public policy consideration related to prescription drugs is pricing.
U.S. prescription drug prices are essentially unregulated;3 pharmaceutical manufac-
turers are free to set any price they want for their products. In principle, market
mechanisms such as competition, discounts, and rebates may help to moderate drug
prices, but the impact of the market can be subtle. Pharmaceutical manufacturers
segment the brand-name prescription drug market by charging different prices to
different clients, just as the airline industry charges different prices to different fare
classes.4 Drug manufacturers use differential pricing to compensate for income dif-
ferences across countries and to adjust for regulatory payment systems, with some
national system payment systems limiting the prices companies may charge. The
U.S. pays the highest prices and bears the greatest portion of the global burden of
R&D costs for developing new products. Although prescription drug price regula-
tions are national, prescription drug development and industry benefits are global.
Numerous studies have compared brand-name drug prices in the U.S. with prices
in other countries. More recently, as prescription drug prices have continued to
increase, more sophisticated analyses have confirmed that Americans, to varying
degrees, appear to pay higher drug prices than consumers in other countries.5
Therefore, important unanswered questions include, how much higher are U.S.
prescription drug prices than drug prices in other countries? and, what value does
the U.S. economy get for bearing these higher prices?
A third public policy consideration regarding prescription drugs is research and
development (R&D). Most economists agree that, if drug prices were too low,
research investments would decrease; by how much is a question for more discus-
sion. In addition, advanced industrial societies recognize that drug companies are
attractive partners that generate jobs and trade and make other valuable economic
contributions. Without the potential to recover their investment, drug and other
biomedical research companies might divert their investment into more profitable
activities. Thus, U.S. policymakers pay attention to the complex interaction
between prescription drug pricing and the nurturing of a productive biomedical
research industry.
What combination of policies will ensure a balance between access to medications,
containment of prescription drug spending, and the desire to continue fueling med-
ical advances? The remainder of this paper explores the role of public policy based
on the experiences of France, Norway, and the United Kingdom.
8
A A R P E U RO P E A N L E A D E R S H I P S T U D Y: P R E S C R I P T I O N D RU G P R I C I N G
F R A N C E
In comparison to most European countries, France has relatively high prescription
drug consumption with per capita drug expenditures at €380 per capita in 2000.
Prescription drug expenditures have been increasing rapidly in France, averaging 5.3
percent in growth annually since 1990 and considerably higher recently. Sixty-three
percent of prescription and non-prescription drug costs are paid for by public
funds. The remainder is paid for in equal measures by supplementary insurers
(18.5 percent) and consumers (18.5 percent).
Direct Price Control. Under direct cost control methods, governments can use
product price controls and negotiate directly with manufacturers to set individual
product reimbursement. France employs direct cost control methods. In general,
under direct cost controls, prices are established after drugs are approved but prior
to product launch. Government agencies review manufacturers’ price applications
and assess whether the price is justified. If prices are unacceptably high, government
regulators set lower prices, but there are usually provisions for manufacturers to
appeal these decisions. Regardless of how countries set initial drug prices, direct
drug price controls require government agency approval for price increases after
product launch.
Under price control systems, the process usually takes one of two forms: internal,
which primarily focuses on the manufacturer’s price justification, or external, which
examines the prices charged for the same or similar product in other countries.
When internally evaluating manufacturers’ price justifications, governments may
9
A A R P E U RO P E A N L E A D E R S H I P S T U D Y: P R E S C R I P T I O N D RU G P R I C I N G
Country Approaches

take into account factors such as the product’s expected therapeutic benefit, poten-
tial sales volume, and contributions to the country’s economy. The government may
consider that R&D expenses were incurred and recovered in another country (like
the U.S.) where selling prices are higher and, accordingly, set low prices for such
products. These inter-country price differences can thus create prescription drug
“parallel trade” incentives, where drugs from “low price” countries are imported and
resold in other countries at prices that are higher than in their country of origin but
lower than prices would be otherwise.
External price justifications for new drug products use different criteria. Where the
drugs under review are already on the market in other countries, these systems com-
pare prices directly based on dose, strength, and package size considerations. Where
the products are not widely marketed elsewhere, countries develop comparative
drug market baskets that have the same therapeutic indications. These market bas-
kets vary from system to system depending on which drugs are being compared and
whether generics are part of the package, so prices for any given drug can vary
across countries.
All prescription drugs sold in France must be approved by either the European
Union’s equivalent to the U.S.’s Food and Drug Administration (FDA), or the
French Health Products Safety Agency (AFSSAPS). AFSSAPS has three main mis-
sions: scientific and medico-economic evaluation of health products; laboratory and
advertising control; and inspection of industrial sites. The European Agency for the
Evaluation of Medicinal Products (so-called “European Medicines Agency” or
EMA) is a London-based, decentralized body of the European Union whose main
responsibility is protection and promotion of public and animal health, through
evaluation and supervision of human and veterinary medicines. It essentially func-
tions as Europe’s FDA, allowing pharmaceutical companies to submit a single mar-
keting application. A positive ruling from the agency is then sent to the European
Commission to be transformed into a single market authorization, valid for the
entire European Union. Cost-effectiveness decisions are made individually by mem-
ber states.6
To qualify for reimbursement by France’s Sécurité Sociale or national health insur-
ance plan (NHI), drugs must be included on a formulary (referred to in France as a
positive drug list). The list currently includes about 4,500 drugs, which account for
about 90 percent of sales in French pharmacies. To be listed, drugs must be recom-
mended by both the Commission on Transparency and the Economic Committee
on Medical Products (CEPS). The Transparency Commission plays a role in the
clinical assessment of medicines and makes recommendations on which drugs
should be included on the positive drug list and their level of reimbursement, but it
is purely a consultative body; ultimate decision-making authority resides with gov-
ernment agencies. CEPS negotiates directly with pharmaceutical companies, enters
into long-term agreements on product prices, and enforces these contracts. CEPS
also has responsibility for monitoring drug expenditures and their relationship to
annual budget targets.
10
A A R P E U RO P E A N L E A D E R S H I P S T U D Y: P R E S C R I P T I O N D RU G P R I C I N G
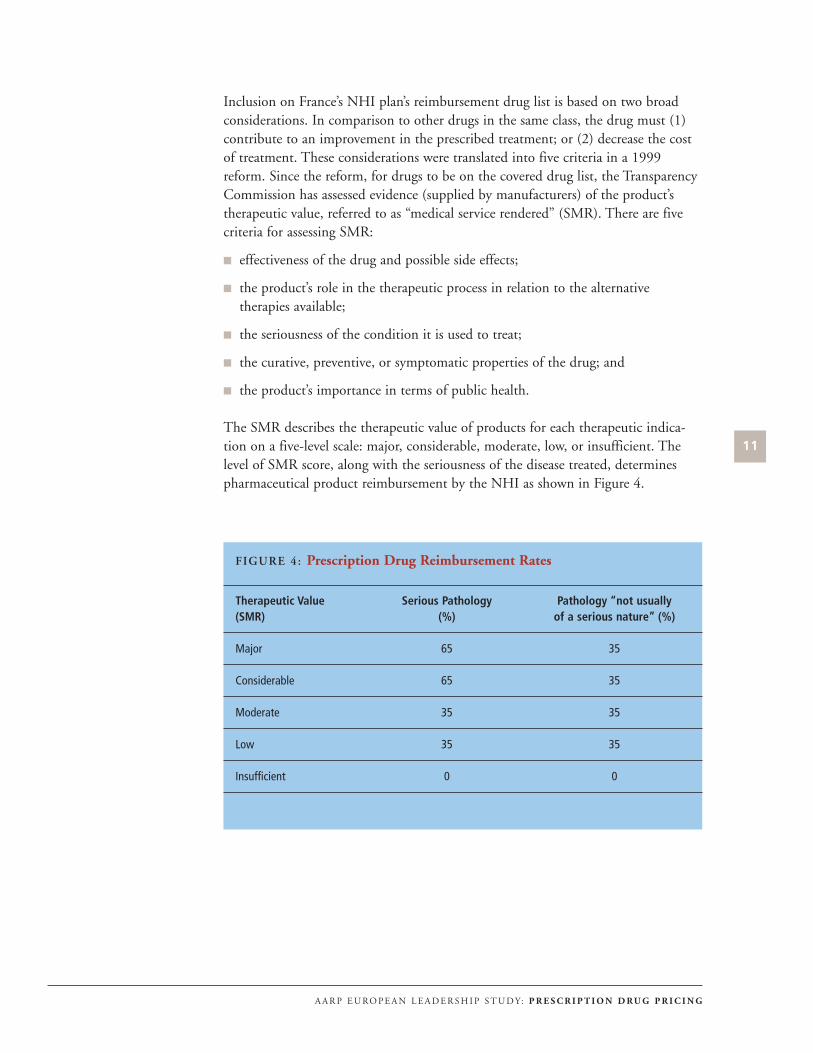
Inclusion on France’s NHI plan’s reimbursement drug list is based on two broad
considerations. In comparison to other drugs in the same class, the drug must (1)
contribute to an improvement in the prescribed treatment; or (2) decrease the cost
of treatment. These considerations were translated into five criteria in a 1999
reform. Since the reform, for drugs to be on the covered drug list, the Transparency
Commission has assessed evidence (supplied by manufacturers) of the product’s
therapeutic value, referred to as “medical service rendered” (SMR). There are five
criteria for assessing SMR:
effectiveness of the drug and possible side effects;
the product’s role in the therapeutic process in relation to the alternative
therapies available;
the seriousness of the condition it is used to treat;
the curative, preventive, or symptomatic properties of the drug; and
the product’s importance in terms of public health.
The SMR describes the therapeutic value of products for each therapeutic indica-
tion on a five-level scale: major, considerable, moderate, low, or insufficient. The
level of SMR score, along with the seriousness of the disease treated, determines
pharmaceutical product reimbursement by the NHI as shown in Figure 4.
11
A A R P E U RO P E A N L E A D E R S H I P S T U D Y: P R E S C R I P T I O N D RU G P R I C I N G
FIGURE 4: Prescription Drug Reimbursement Rates
Therapeutic Value Serious Pathology Pathology “not usually (SMR) (%) of a serious nature” (%)
Major 65 35
Considerable 65 35
Moderate 35 35
Low 35 35
Insufficient 0 0

The Transparency Commission was mandated to re-evaluate all drugs between 1999
and 2001 using these five SMR criteria; it determined that 835 drugs displayed
insufficient SMR (18 percent on formulary or positive drug list). The 1999
Transparency Commission decree required that these drugs be removed from the
reimbursement list, and 84 were removed in September 2003. Reimbursement was
reduced from 65 to 35 percent for another 200 of the drugs with insufficient SMR
evidence. NHI reimbursement was reduced for these products as they were reclassi-
fied as therapies for treating non-life threatening conditions.
For prescription drugs covered by the national insurance plan, the Sécurité Sociale,
CEPS negotiates with manufacturers to set prices for drugs sold through non-hospi-
tal channels. The Ministry of Health’s CEPS decides which drugs will be covered
and also sets the coverage level for drugs. Drug prices are based on therapeutic ben-
efit compared with other drugs on the formulary in the same therapeutic class;
drugs with high therapeutic value are likely to have high prices, especially if there
are no competing products with similar therapeutic benefits. Drugs with low thera-
peutic improvements are likely to be priced lower than more effective competitors.
Drug prices also are affected by other considerations, such as the expected sales vol-
ume or products’ daily dosage. Manufacturers enter into agreements with CEPS to
lower prices or issue rebates if sales volumes, daily dosages, or daily cost limits are
not met. In theory, sales volumes and therapeutic advantages are key negotiation
points for CEPS; however, in practice, inconsistencies have been identified that
illustrate that pricing rules may sometimes be circumvented. Since 2003, manufac-
turers may set their own price for highly innovative products without CEPS negoti-
ation, although the agency retains veto power. The manufacturer’s price for these
exceptionally innovative products must be consistent with prices in Germany,
Spain, the UK, and Italy. For drugs not covered by the NHI, pharmaceutical firms
may set prices.
Treatment Guidelines. France spends more on prescription drugs than most other
countries. Prescription drug spending in France as a percentage of total health care
spending was at 22 percent in 2003. To help rein in prescription drug spending,
France’s Ministry of Health recently implemented changes including (1) mandatory
physician treatment guidelines (best practices), called physicians’ Références
Médicales Opposables (RMOs); (2) an agreement with the pharmaceutical industry;
and (3) creation of regional spending targets. Note that the RMOs encompass a
range of therapies, not only prescription drugs. As part of the RMO development
process, France’s Ministry of Health negotiated a deal with the pharmaceutical
industry to exchange sales volume reductions for reimbursement increases.
Individual pharmaceutical companies negotiated separate deals that outlined price
increase conditions. In return, drug companies reduced promotional expenditures,
promoted appropriate drug use through public service announcements, and
increased reporting about their activities. France’s regional spending targets were
established between the Sécurité Sociale and physicians’ professional associations.
Separate spending targets were set for specialist and general practitioner fees as well
as prescriptions. If regional spending exceeded target levels, local physicians could
12
A A R P E U RO P E A N L E A D E R S H I P S T U D Y: P R E S C R I P T I O N D RU G P R I C I N G

need to compensate the Sécurité Sociale. Despite these and other reforms, France
still has some of the highest prescription drug spending. Nonetheless, these reforms
are credited with slightly shifting utilization toward lower cost drug products for
conditions where RMOs were established.
Generic Drug Substitution. With low out-of-pocket costs due to relatively good
insurance coverage, there is little incentive to shop for lower-priced drugs. In 1999,
generics represented about two percent of prescription drug sales in France. In fact,
the concept of generic drugs was not officially defined until 2000 when a guide to
therapeutic equivalents was distributed to doctors and publicized in public outreach
campaigns. Pharmacists have the right to make generic substitutions and are guar-
anteed the same profit margin as if they had used equivalent branded products; and,
although through recent changes, consumers must pay more if they elect a branded
product, with high penetration rates for supplemental insurance, the effect of the
copayment may not be great. There is a target substitution rate in the pharmacists’
union contract that can be the basis for the next contract renewals payment rate. To
further encourage generic use, physicians were given the right in 2002 to prescribe
drugs by their generic names.
In 2000, there were approximately 23,000 pharmacies in France, most of which are
privately owned. Creation of new pharmacies, unless there are special circumstances,
is regulated and ownership is dispersed since there are prohibitions on pharmacists
operating more than one location. Approval to open a new pharmacy takes into
account both the size of the population to be served and travel distances. As a result
of the reforms passed in 1999, pharmacists are paid both a prescribing fee (€0.53
per item, with an additional €0.30 for some positive list drugs) and sliding scale
profit margin. Until recently, consumers paid in full at the retail level for drugs and
then submitted invoices for reimbursement to the NHI fund. Now, third-party
payers reimburse pharmacists directly for their prescription drug purchases, so
consumers have no upfront costs for many prescription drug transactions. Still, not
all pharmacies participate with third-party payers, so about one-third of pharmacy
transactions are paid for directly by consumers and then reimbursed by NHI funds
and supplemental insurers.
N O RWAY
The variety and availability of drug products is more limited in Norway than in
other OECD countries, and it takes longer for pharmaceutical companies to obtain
clearance to market new products. Norway’s Medicines Agency (NoMa) authorizes
new drugs. Unlike in the U.S., where the FDA assesses new products for safety and
efficacy, cost effectiveness plays an important role in NoMa’s consideration of new
products. In theory, if future reimbursement of new pharmaceutical products is
believed to result in substantial cost increases, NoMa will refer pending approval
decisions to Norway’s Ministry of Health and Parliament. In practice, however,
some expensive new drugs were approved for reimbursement at the request of mem-
bers of Parliament, as a result of voter pressure. When the process works according
13
A A R P E U RO P E A N L E A D E R S H I P S T U D Y: P R E S C R I P T I O N D RU G P R I C I N G

to plan, the Ministry of Health and Parliament decides whether to cover more cost-
ly new products as part of the yearly budget-setting process. Thus, the waiting peri-
od for listing new drugs for reimbursement can stretch to two or three years.
In historic terms, pharmaceutical expenditures as a percentage of GDP have been
lower in Norway than other OECD countries, but more recently public drug
expenditures have increased at the rapid rate of approximately eight percent annual-
ly. Norway implemented new pharmaceutical regulations in 2001 under the
Pharmaceutical Act (PA 2001), which may have played a role in this spending
growth. PA 2001 attempted to increase patient access to prescription drugs by
expanding the number of pharmacies that could fill prescriptions. PA 2001
removed terminal degree requirements for pharmacy owners (pharmacy owners were
required to hold pharmacy or other related discipline doctoral degree), but the Act
may have hastened rapid retail pharmacy consolidation, as three national chains and
their wholesaler partners acquired most independents. Subsequently, the ceiling on
pharmacy locations was removed, and by 2005 the number of pharmacy locations
had increased by about one-third. Norway’s pharmacy market remains concentrated
and dominated by the three retail/wholesale partnerships. These integrated organi-
zations use preferential relationships to help create entry barriers for independents.
Recently, there have been proposals to further increase drug availability and reduce
market concentration by expanding the range of retail outlets that can sell prescrip-
tion medications to include gas/convenience stores and other retailers that sell non-
prescription products and have extended hours of operation.
Reference Pricing. Norway heavily regulates the prices of sole source branded
products (i.e., products without competition from other brands of the same prod-
uct). To constrain costs, branded drug prices cannot exceed the average of the three
lowest prices for a market basket of drugs for nine EU countries. One objective of
Norway’s price setting prescription drug regulation is to minimize patients’ cost
sharing obligations so that patients can afford any drugs.
In March 2003, the government introduced a type of reference price methodology
to the national health system that is referred to as an index-pricing system.
Reference prices can be defined as reimbursement ceilings (reference price) set by
insurers for specific drugs. The reference price can be based on drugs that have the
same drug chemical, are in the same drug class, or are therapeutically equivalent
drugs with different active ingredients. If drugs cost more than their reference price,
patients or supplementary private insurers pay the difference. Reference prices differ
from direct price controls in that pharmaceutical manufacturers are free to sell their
products at any price; patients may or may not be willing to pay a premium for the
product. Although reference-pricing systems differ in implementation, countries
using reference pricing share four common objectives:
to encourage physicians to prescribe less expensive drugs;
to influence patients to accept less expensive drugs or higher copayments;
14
A A R P E U RO P E A N L E A D E R S H I P S T U D Y: P R E S C R I P T I O N D RU G P R I C I N G
to pressure pharmaceutical manufacturers to reduce prices to remain
competitive; and
to manage payers’ drug budget expenditures.
Reference pricing has been used throughout the world, including the U.S., where it
has become more popular among private payers and Medicaid programs. Maximum
allowable cost (MAC) pricing approaches for chemically identical drugs are refer-
ence pricing schemes that are used by many private insurers and state Medicaid pro-
grams. There is general consensus that reference pricing can be effective in restrain-
ing prescription drug cost increases, but financial savings are short-term and
decrease over time, as prescription consumption shifts towards greater use of the ref-
erence-priced product.
Incentives for Generic Drug Use. Under Norway’s index-pricing approach, phar-
macies could share with the government the savings when a generic is dispensed
instead of a branded product. (Note: Although generics are relatively expensive in
Norway, they are still less costly than branded drugs.) The index pricing was intend-
ed, in part, to exert downward pressure on branded drug prices. However, given the
smaller price differentials between generics and branded drugs in Norway, the
index-pricing measure has not reduced prescription drug expenditures much.
Therefore, a voluntary step-price model was introduced in 2005 to encourage use of
lower-cost generic products. Under step-pricing, maximum NHS reimbursement
for off-patent drugs is a fixed percentage of the price of the original product when it
was under patent. Government payment for prescription drugs is set on a sliding
scale based on the monetary value of a drug’s sales and the length of time since the
patent expired. For instance, for generic versions of branded drugs with aggregate
sales greater than NOK 100 million annually (around €12 million), maximum
reimbursement (the “step price”) in the first six months after the patent expiration
is 70 percent of the originally patented product’s price; 50 percent after the sixth
month and before one year; and 30 percent thereafter. For drugs with sales less than
NOK 100 million, maximum reimbursement in the first six months after the
patent expiration is 70 percent of the originally patented product’s price; 60 percent
after the sixth month and before one year; and 50 percent thereafter.
If consumers refuse the generic version, the difference between the actual price and
the step price is paid by the consumer and is not counted in their out-of-pocket
maximum. Pharmacies are obliged to offer at least one product in each pharmaceu-
tical category at the step price. At the same time, pharmacists that are selling prod-
ucts less expensive than the step price can keep the difference as profit. This model
was expected to produce saving of NOK 450 million (around €55 million) for the
state and NOK 70 million (around €8.5 million) for households in 2005.
A by-product of Norway’s price regulations, however, might be a reduced incentive
to use generic drugs because branded product prices are lower than they would
otherwise be. This situation occurs for several reasons. Weak competition in the
15
A A R P E U RO P E A N L E A D E R S H I P S T U D Y: P R E S C R I P T I O N D RU G P R I C I N G

wholesale and retail segments of the pharmaceutical distribution chain prevents
generics from being sold more widely and at a lower price. Finally, the government
provides nearly comprehensive coverage for prescription drugs so consumers do not
search hard for lower prices. As a result, in terms of volume, generics drugs account
for about 28 percent of total prescription drug sales in Norway.
Technology Assessment. In 2004, the Norwegian Ministry of Health established
the Norwegian Knowledge Centre for the Health Services. The Centre is responsi-
ble for health technology assessments, early warning (adverse event) reports, system-
atic (Cochrane) reviews, monitoring quality via performance and clinical indicators,
and health services research.
U N I T E D K I N G D O M
Utilization of prescription drugs in the UK trails most other advanced countries. In
1996/1997, just under 500 million prescriptions were dispensed through England’s
National Health Service (NHS), a rate that amounted to approximately ten pre-
scriptions per person in England annually. This utilization rate is between 30 to 80
percent lower than rates for other western European countries such as France,
Germany, and Italy. UK prescription drug utilization has increased in recent years,
but still is well below other European countries and the U.S. Between 1999 and
2004, spending for medicines increased 41 percent in real terms, averaging about
six percent annually at the community level (non-hospital), with most of the
increase resulting from volume (one percent due to cost increases for new drugs).
Regulation of Industry Profits. The United Kingdom employs several drug cost
control methods, although the primary method is regulation of manufacturer prof-
its, rather than the prices pharmaceutical companies may charge for products.
Under the general category of profit regulation, profit can be defined differently,
including as the rate of return on capital attributable to sales in that country or as
negotiated profit margins for each company. At regular intervals, a target profit rate
is negotiated between each pharmaceutical company and the government. Profit
regulation permits companies to initially price products at their discretion.
However, if manufacturers’ profits exceed the negotiated profit rate, the excess
returns are either returned to the government or prices are reduced.
The UK has a strong research-based pharmaceutical industry that makes a signifi-
cant contribution to export performance. Industry profits for the pharmaceutical
industry have been regulated voluntarily since 1957 with the goal of balancing the
needs of the NHS to provide universal health care at affordable prices against the
needs of a research-based industry for adequate returns to compete internationally
and fund continued drug discovery research. The Health Act 1999 gave the
Pharmaceutical Price Regulation Scheme (PPRS) the authority to impose statutory
prices and profit controls on pharmaceutical companies that elected to not accept
PPRS voluntarily prices and profit limits.
16
A A R P E U RO P E A N L E A D E R S H I P S T U D Y: P R E S C R I P T I O N D RU G P R I C I N G

PPRS sets the rate of return (ROI) on capital attributable to pharmaceutical sales in
Britain, which is used by British government agencies in negotiations with the
Association of the British Pharmaceutical Industry to establish each company’s ROI
based on branded drug sales to the NHS. Under the PPRS, pharmaceutical firms
are free to set their own prices for the first five years a drug is on the market, subject
only to the profit margin limitation. After the five-year period, any price increases
must be approved by the Department of Health.
To reach target ROIs of between 17 and 21 percent, research and development
spending (including promotional expenditures) is set at about 9 percent of sales. If
manufacturers’ profits surpass their target ROIs, they are permitted a 25 percent
cushion above the target rate, called the “gray area.” If pharmaceutical company
profits exceed these gray area limits, they must reimburse NHS or reduce product
prices. PPRS excludes generic drugs.
Drug Formulary. Most prescription drugs available in Britain are eligible for NHS
reimbursement, although a few are “black listed” as excluded drugs, and some oth-
ers are listed in “gray areas”7 which means they may only be reimbursed by NHS
under certain narrow circumstances. The black list was implemented in 1984 not
only to reduce costs but also to improve the quality of prescribing in some areas.
For instance, the black list greatly reduced the range of benzodiazepine sedatives
and hypnotics available. The black list has not been modified much since it was first
developed. The gray list includes what are sometimes described as lifestyle drugs,
such as sildenafil for erectile dysfunction, which might be covered only for certain
organic diseases. The black listed drugs that are not reimbursed by NHS also
includes 16 categories of drugs such as analgesics, cold medicines, and vitamins
used to treat minor conditions, most of which are available over the counter. (Note:
Some OTC drugs are covered by the NHS.) Most NHS-covered drugs are free or
nearly free to patients. Even though certain population groups have copayments,
more than half of all citizens are exempt. Patients pay copayments for about only 12
percent of prescriptions filled in the UK; thus cost sharing reduces NHS’ drug
expenditures very little.
Generic Drug Prescribing. In 2003, approximately 53 percent of all UK prescrip-
tions dispensed were for generics, although as high as 76 percent of all prescriptions
are written generically by doctors regardless of whether a generic product exists. In
2003, generic drugs accounted for about 19 percent of total drug costs. NHS
encourages generic drug prescribing through budget incentives and a drug tariff.
Drug tariff prices are determined by major generic drug manufacturers and pub-
lished and distributed to physicians on a monthly basis. A drug tariff establishes
generic drug reimbursement. The NHS allows for reallocation of prescription funds
when the physician saves money by prescribing generic drugs.
Physician Profiling. Another UK policy to control drug spending also is aimed at
doctors’ drug prescribing habits. To help educate physicians about prescribing pat-
terns and alternatives, NHS created a Prescribing Analysis and Cost Information
17
A A R P E U RO P E A N L E A D E R S H I P S T U D Y: P R E S C R I P T I O N D RU G P R I C I N G

System (PACI). This highly accurate system provides data on what drugs are pre-
scribed by general practitioners (GPs) and the drugs’ cost (inpatient, hospital drugs
are not captured by this system). PACI provides physicians with monthly reports
that compare their prescribing patterns and associated costs with that for theoretical
groups of demographically similar patients. PACI data have evolved to include
generic drug price information to encourage more generic use. The NHS proscribes
a budget for services that each group of physicians provides per patient enrolled
with the physician’s group. In addition, prescribing budgets were developed as part
of local GP budgets and thereby gave fundholders incentives to manage efficiently
their prescribing. In 1999, a primary care group approach also was implemented
that merged prescribing budgets for GPs with hospital and community health serv-
ice budgets. These merged budget initiatives were aimed at improving local finan-
cial incentives for physicians and systems to independently manage prescription
drug utilization.
Technology Assessment. NICE presents a model for perhaps the most sophisticat-
ed comparative clinical and economic prescription drug review process. NICE is a
component of the NHS and is charged with identifying good clinical and public
health practices based on the best available evidence. NICE appraisals rely heavily
on the cost-effectiveness tool Quality Adjusted Life Year (QALY), as well as the
principles of equity, fairness, and freedom of choice among health professionals and
patients/caregivers. NICE’s clinical guidelines are evidence-based, consultative,
transparent and inclusive. The guideline development process includes seven
National Collaborating Centers, as well as a Patient Involvement Unit to facilitate
patient participation.
NICE includes stakeholder representatives in its assessment process: the pharmaceu-
tical and medical device industries, academia, health care professionals, Hospital
Trusts, and the public (the latter are involved via its Citizens Council). When phar-
maceutical evaluations are undertaken, stakeholder groups are invited to submit rel-
evant data to be considered as part of the assessment. NICE’s final guidance “always
draws upon the value judgments inherent to each stakeholder group.”8 The first full
technology (and drug) appraisals were published in April 2000. Through April
2005, 87 appraisals on the use of over 200 individual products were completed.
Recommendations for routine use within the NHS were made for nearly 40 percent
of the assessed products; selective use, which restricts use for some indications, was
recommended for over 50 percent. Guidance issued in 2006 has focused on pre-
scription drug treatments for attention deficit hyperactivity disorder; smoking cessa-
tion and physical activity; use of beta blocker therapy for hypertension; and laser
eye surgery.
18
A A R P E U RO P E A N L E A D E R S H I P S T U D Y: P R E S C R I P T I O N D RU G P R I C I N G
Compliance with NICE’s guidance is not always mandatory for NHS. However,
within three months of technology/pharmaceutical appraisals, every local NHS
health care entity is required to provide funding from its overall government alloca-
tion to support care for patients who meet NICE’s approved indications for treat-
ment.9 Thus, NICE’s rulings can indirectly affect drug costs (i.e., if a drug that fails
to receive a positive NICE judgment is usually not stocked in hospitals and obtain-
ing it becomes difficult). Pharmaceutical and device manufacturers have a mixed
view of NICE. Some are eager for product appraisal because it can facilitate rapid
entry into the UK market. Others, however, claim that economic modeling based
on QALYs is unreliable and inappropriate to use as the standard for early evalua-
tions of many new products.
19
A A R P E U RO P E A N L E A D E R S H I P S T U D Y: P R E S C R I P T I O N D RU G P R I C I N G

20
A A R P E U RO P E A N L E A D E R S H I P S T U D Y: P R E S C R I P T I O N D RU G P R I C I N G
Lessons for theUnited States
What policies from France, Norway, and the U.K. are best practices and
might be successfully incorporated into the U.S. health system? Policies
to control prescription drug expenditures are intrinsically enmeshed in the larger
health care system infrastructure of which they are a part. In addition, application
of prescription drug cost control strategies is as much a political decision as an eco-
nomic one. The success of policies can hinge as heavily on the cultural norms and
support of the medical community and society as a whole as they do on the wis-
dom, vision, or potential payoff from a policy. Furthermore, the vision of a key
leader might be a significant force in bringing revolutionary or even incremental
change. Thus, it may or may not be realistic to suggest that measures that are effec-
tive in one country could be adopted and applied to the health care system in
another country. Nonetheless, it is useful to review the proposals and approaches
promulgated by other societies to address common problems.
F R A N C E
France, the largest European producer of prescription drugs since 1995, is home to
more than 300 pharmaceutical manufacturers that employ 90,000 people and
account for €24 billion in prescription drug sales. The pharmaceutical industry
claims that pricing regulations, similar to those in France, can stifle industry invest-
ment in new drug development. The drug industry claims that innovative products
generate less revenue and profit in countries with price restrictions, and fewer
resources result in less investment in new product research. Drug industry critics of

France’s prescription drug expenditure controls believe that the system inhibits drug
innovation (R&D) because the system’s price regulation does not take pharmaceuti-
cal R&D costs into consideration. However, it is difficult to assess the validity of
this charge.
In recent years, biomedical research investment has migrated to the U.S., presum-
ably because of unregulated prescription drug prices, but there may be other expla-
nations for the trend (Turner, WSJ, 2005; U.S. Dept. Commerce, 2004). First,
operating costs in Europe are high comparatively. The pharmaceutical industry has
consolidated so that there are fewer companies making R&D investments, and
many more are contracting those activities elsewhere, including Asia and India.
Second, U.S. scientific education and research is considered the best in the world.
The U.S. government allocates considerable financial support to primary research,
which helps to nurture commercial investigations for new drugs. Finally, globaliza-
tion makes the decision about the location of R&D investment difficult to isolate.
France and other European countries are concerned that biomedical research invest-
ment and all of the trade, employment, and other economic advantages that accom-
pany a high-value-added industry could have abandoned the continent in favor of
the U.S. and other less regulated areas. Europeans are exploring cooperative and
independent industrial policies to nurture biomedical R&D and, potentially, to
leapfrog into other related pharmacological research areas.
Recent funding reforms have created the opportunity for taxes to play a bigger role
in funding France’s national health system, such that approximately 50 percent of
NHI funding derives from taxes. This change moves some decision-making power
away from local control and physicians and strengthens the legitimacy of leaders
committed to national health care reform aimed at controlling utilization of all
services, including prescription drugs. A reform commission’s findings seem to have
built consensus for policies that strive to tie reimbursement to treatment value (cost
and outcome). Prescription drugs are a part of the value equation through the use
of lower cost generics and off-patent brand name drugs. These processes, discus-
sions, and policy initiatives seem nearly parallel to conversations in the U.S. about
the value proposition and greater reliance on evidence-based medicine to guide clin-
ical practice toward more cost-effective patterns of care.
French officials are seeking partnerships and collaborative ventures with prescription
drug manufacturers to participate in solving public health and industrial policy
issues. For instance, French officials have at least tacitly accepted industry com-
plaints that prescription drug regulation may have helped to stifle drug develop-
ment, by implementing a fast-track approval process for innovative products.
Prescription drug manufacturers can get drugs on the market in France more quick-
ly under the fast-track process, and price products at higher levels; at or near medi-
an European price levels. Although this change might seem cosmetic, it might con-
tain policy lessons for the U.S. France’s development of a fast-track approval and a
pricing mechanism for new drugs suggests recognition that international prescrip-
tion drug pricing dynamics are evolving rapidly and may be too complex to be
21
A A R P E U RO P E A N L E A D E R S H I P S T U D Y: P R E S C R I P T I O N D RU G P R I C I N G

viewed at one dimension. Prescription drug pricing policies are evolving to encom-
pass not only national health system goals of access and cost but also their interac-
tion with other countries’ policies, public health concerns, and, most importantly,
national industrial policy.
The role of competition in France’s prescription drug marketplace also is worth
consideration. Unlike the U.S. where brand name drugs are priced very high rela-
tive to other countries, prices for drugs in France were low, and with little or no
cost sharing, generic drugs were not important. Now, with drug and other health
care spending at unsustainable levels, France is moving aggressively to implement
policies to encourage generic drug use. France is adopting components of the U.S.
prescription drug marketplace to help reduce spending. French officials are encour-
aging generic manufacturers to compete with brand manufacturers after patents
expire. France believes that this competition can play a role in reducing drug expen-
ditures. In the U.S., generic competition is already important, but perhaps policies
are needed to protect and encourage further competition between generic and
brand manufacturers.
France’s experiences with government negotiation of prescription drug prices also
are a policy approach worth further analysis. France has been relatively successful in
negotiating agreements with prescription drug manufacturers to set favorable prices
and to enforce market discipline by imposing volume limits on approved drugs.
Under Part D, the Medicare program is forbidden from negotiating directly with
manufacturers for low prices. Medicare, as the largest single customer, could negoti-
ate the most favorable rates. With calls for Part D reforms or technical amend-
ments, critics of Part D’s competitive approach would like to see the Department of
Health and Human Services’ Secretary required to use Medicare’s purchasing power
leverage to negotiate the lowest prices from prescription drug manufacturers.
France’s experience might be cited as evidence that government negotiation can
work and that manufacturers can sustain investment in research and development
under these terms.
N O RWAY
Norway’s health care system is considerably different from that in the U.S. Norway
also has a less diverse economy and culture. As a smaller economy with substantial
coverage and reliance on reference prices, Norway can provide insight into the com-
plexity of interactions between drug use and pricing decisions. (These discussions
are more complicated among European Union member states because parallel trade
agreements make importation of cheaper, branded products relatively easy and legal
for wholesalers.)
Data on the success of Norway’s step-price pharmaceutical reimbursement reform
in lowering prices of generic products are not available yet. Norway’s health care
system features incentives for consumers to seek lower-priced generic drugs rather
than relying on pharmacies to substitute voluntarily. However, the way in which
22
A A R P E U RO P E A N L E A D E R S H I P S T U D Y: P R E S C R I P T I O N D RU G P R I C I N G

reference pricing has been used, as well as the insulation of consumers from costs by
generous coverage, could limit the effectiveness of policies intended to encourage
appropriate utilization and limit growth in prescription drug expenditures. Patients
have a cap on total out-of-pocket payments, so consumers’ financial incentives to
seek lower-priced alternatives are weaker than if they had to bear most of the cost of
more expensive alternative drug products. Moreover, primary care physicians have
no incentives to prescribe lower-priced products or write prescriptions under their
generic names. Norway’s struggle with aligning financial incentives for prescription
drugs reflects a common theme among these European health systems and the
American system, as well: it can be difficult for countries to identify measures that
will reduce drug expenditures.
U N I T E D K I N G D O M
The UK’s drug pricing schemes attempt to blunt the impact of regulation on R&D
spending by pharmaceutical manufacturers. However, pharmaceutical industry crit-
ics argue that the UK approach is a poor compromise that still stifles R&D invest-
ments. However, if industry is dissatisfied with regulated price levels that guarantee
them a basic level of R&D funding, they may not be happy with anything short of
unregulated prices. Nevertheless, Britain remains a popular location for among
nations preferred by pharmaceutical companies for future R&D facilities along with
the United States and Germany.
Although data evaluating the UK’s drug cost control reforms are limited, there is
general consensus among policy experts that the UK’s combination of control
mechanisms contributes to lower per capita levels of pharmaceutical expenditures. A
distinguishing feature of the UK’s approach to regulating prescription drug profits is
the government’s direct negotiation with pharmaceutical manufacturers. Direct
negotiation with the pharmaceutical industry by major purchasers helps to level
bargaining power between drug purchasers and manufacturers; more level bargain-
ing can help leverage reduced prices in comparison to the prices manufacturers
might otherwise offer to smaller drug purchasers. In a market-based system like that
in the U.S., direct bargaining by the biggest purchasers might offer opportunities to
lower overall prescription drug expenditures.
Another feature of UK policy to improve prescription drug affordability is the
accountability mechanism that gives prescribing physicians an economic incentive
to monitor and control drug utilization. In addition, through NICE, GPs have
information that can be useful in determining appropriate, efficacious, and cost-
effective treatments, including the role of prescription drugs. These evidence- and
performance-based approaches are useful examples of how processes can help
address inappropriate and excessive drug utilization.
23
A A R P E U RO P E A N L E A D E R S H I P S T U D Y: P R E S C R I P T I O N D RU G P R I C I N G

End Notes
1 The United Kingdom includes the countries England, Northern Ireland, Scotland, and Wales.
2 Data are expressed in purchasing power parities (PPPs), which provide a means of comparing spendingbetween countries. PPPs are the rates of currency conversion that equalise the cost of a given basket ofgoods and services in different countries.
3 Some could argue that the U.S. regulates prescription drug prices through provisions of the SocialSecurity Act, which require that Medicaid and other public health entities receive manufacturers’ bestprices. These provisions could be interpreted as weak regulation, because they do not prevent manufac-turers from setting any price the market will bear for a product; rather, they merely have to ensureMedicaid gets its best price for the product. The Veterans Administration has its own prescription drugprocurement process that could also be considered a regulated market.
4 Although airline customers actually receive higher value services when paying higher fares and one couldargue that countries, such as the U.S. that pay higher drug prices receive the same products as countriesthat pay less.
5 In a 2004 study, on reimportation, the U.S. Congressional Budget Office found U.S. prices for brand-name products to be 35-55 percent higher than in other industrialized nations.
6 A European Network for Health Technology Assessment was established recently, but it is too new towarrant a review of its programmatic success. The objective of this “EUNetHT” would be to connectpublic national health technology assessment agencies, research institutions, and health ministries, toenable: (1) effective exchange of information, and (2) support of policy decisions by member states.
7 The term “gray area” as used in the listing of prescription drugs on formularies has a different meaningfrom that when used by the PPRS to describe the relationship between prescription drug manufacturerprofits and ROI targets.
8 P. Littlejohns, Clinical and Public Health Director, National Institute for Health and Clinical Excellence,presentation at Commonwealth Fund/Alliance for Health Reform symposium in Washington, DC, April22, 2005
9 Pearson, SD, Rawlins, MD, “Quality, Innovation, and Value for Money, NICE and the British NationalHealth Service,” JAMA, Vol. 294, No. 20 (Nov. 23/30, 2005), 2618-2622
24
A A R P E U RO P E A N L E A D E R S H I P S T U D Y: P R E S C R I P T I O N D RU G P R I C I N G

Selected References
Reinhardt, Uwe E., Hussey, Peter S., Anderson, Gerald F., “U.S. Health Care Spending In an InternationalContext: why is U.S. spending so high, and can we afford it?” Health Affairs, May/June 2004.
Reinhardt, Uwe E., Hussey, Peter S., Anderson, Gerald F. “Cross-National Comparisons of Heath SystemsUsing OECD Data, 1999.” Health Affairs, May/June 2002.
U.S. General Accounting Office, “Prescription Drug Prices in France,” GAO/HEHS-94-200R, August1994.
Dickson, Michael, Hurst, Jermey, Jacobzone, Stephane, “Survey of Pharmacoeconomic Assessment Activityin Eleven Countries.” OECD Health Working Papers No. 4, May 2003.
U.S. Department of Commerce and U.S. International Trade Administration, “Pharmaceutical PriceControls in OECD Countries: Implications for U.S. Consumers, Pricing, Research and Development,and Innovation.” December 2004.
European Observatory on Health Care Systems, “Health care systems in eight countries: trends and chal-lenges,” April 2002.
Organization for Economic Cooperation and Development, the OECD Health Project, “Health Technologyand Decision Making,” 2005.
World Health Organization, Drugs and Money: Prices, Affordability and Cost Containment, Seventh Edition,2003.
Ess, Silvia M. Schneeweiss, Sebastian, and Szucs, Thomas D., “European Healthcare Policies for ControllingDrug Expenditure,” Pharmoceconomics 2003; (2).
Verheugen, Peter, (Speech) Vice-President of the European Commission Responsible for Enterprise andIndustry. “Future Strategy, Post-G-10/Pharmaceutical,” June 2005.
Hunt, Michele, “Changing Patterns of Pharmaceutical Innovation,” The National Institute for Health CareManagement Research and Education Foundation, May 2003.
Calfee, John E., “Playing Catch-up: FDA, Science, and Drug Regulation,” in Health Policy Outlook, No. 5,American Enterprise Institute; 2006.
Danzon, Patricia, “Making Sense of Drug Prices,” Regulation, Volume 23, No. 1, May 2000.
Danzon, Patricia and Chao, Li-Wei, “Cross-national price differences for pharmaceuticals: how large, andwhy?” Journal of Health Economics 19 (2000).
Huskamp, Arnold, Epstein, Arnold M., and Blumenthal, David, “The Impact of a National Formulary onPrices, Market Share, and Spending: Lessons for Medicare?” Health Affairs, Volume 22, Number 3, 2003.
Pearson, Steven D. and Rawlins, Michael D., “Quality, Innovation, and Value for Money: NICE and theBritish Health Service,” Journal of the American Medical Association, November 23/30, 2005–Vol. 294,No. 20.
Porter, Michael E. and Teisberg, Elizabeth Olmsted, Redefining Health Care; Creating Value-BasedCompetition on Results, Harvard Business School Press, 2006.
Families USA, “The Choice: Health Care for People or Drug Industry Profits,” September 2005.
Department of Health and the Association of the British Pharmaceutical Industry, “The PharmaceuticalPrice Regulation Scheme,” November 2004.
Ioannides-Demos, Lisa L., Ibrahim, and Joseph E., and McNeil, John J., “Reference-Based Pricing Schemes;Effect on Pharmaceutical Expenditure, Resource Utilisation, and Health Outcomes,” Pharmacoeconomics2002; 20(9).
AARP, Prescription Drugs and Technologies: How Countries Balance Costs and Access, February 2004.
Maynard, Alan and Bloor, Karen, “Dilemmas In Regulation of the Market for Pharmaceuticals,” HealthAffairs, Volume 22, Number 3, May/June 2003.
Mossialos, Elias, Mrazek, Monique, and Walley, Tom, “Regulating Pharmaceuticals in Europe: striving forefficiency, equity, and quality,” World Health Organization for European Observatory on Health CareSystems, Open University Press, 2004.
Le Grand, Julian, “Methods of Cost Containment: Some Lessons from Europe,” Paper for IHEA FourthWorld Congress, San Francisco, California, June 2003.
Public Citizen, “Rx R&D Myths: The Case against the Drug Industry’s R&D Scare Card,” Congress Watch,July 2001.
25
A A R P E U RO P E A N L E A D E R S H I P S T U D Y: P R E S C R I P T I O N D RU G P R I C I N G

Redwood, Heinz, “Advantages and Risks of Differential Pricing for Prescription Drugs,” presentation toWorld Health Organization/World Trade Organization Workshop, Norway, April 9, 2001.
Dunn, Stephen P., “Reforming the English NHS,” Department of Health Presentation, 2004.
Fuchs, Victor R., “What’s Ahead for the Health Insurance in the United States?” New England Journal ofMedicine, Vol. 346, No. 23, June 6, 2002.
Mossialos, Elias and Oliver, Adam, “An Overview of Pharmaceutical Policy in Four Countries: France,Germany, the Netherlands, and the United Kingdom,” International Journal of Health Plan Management,2005.
Anderson, Gerald F., Reinhardt, Uwe E., Hussey, Peter S., and Petrosyan, Varduhi, “It’s the Prices, Stupid:Why the United States Is so Different from Other Countries,” Health Affairs, Volume 22, Number 3,May/June 2003.
Henke, Klaus-Dirk and Schregogg, Toward Sustainable Health Care Systems, International Social SecurityAssociation, May 2004.
Rodwin, Victor G., “The Health Care System Under French National Health Insurance: Lessons for HealthReform in the United States,” American Journal of Public Health, January 2003.
Rodwin, Victor G., and Le Pen, Claude, “Health Care Reform in France—The Birth of State-Led ManagedCare,” New England Journal of Medicine, November 25, 2004.
Guillen, Ana M. and Cabiedes, Laura, “Reforming Pharmaceutical Policies in the European Union: APenguin Effect?” International Journal of Health Services, 2003.
Shah, Sonia, “Globalization of Clinical Research by the Pharmaceutical Industry,” International Journal ofHealth Services, 2005
U.S. Congressional Budget Office, “Would prescription drug reimportation reduce U.S. drug spending?”Economic and Budget Issue Brief, April 29, 2004.
Sandler, Simone, Paris, Valerie, and Polton, Dominque, “Health Care Systems in Transition,” France, TheEuropean Observatory on Health Systems and Policies/World Health Organization, 2004.
European Observatory on Health Systems and Policies, “Health Care Systems in Transition,” HiT Summary,France, 2004.
Paris, Valerie, “Pharmaceutical Regulation in France,” Institut de Recherche et Documentation en Economiede la Sante, (IRDES) Presentation, July 2005.
Paris, Valerie, “Pharmaceutical Regulation in France,” International Journal of Health Planning andManagement, 2005.
Paris, Valerie, “Pharmaceutical Regulation in France 1980-2003,” International Journal of Health Planningand Management, 2005.
European Observatory on Health Systems and Policies/World Health Organization, “Health Care Systems inTransition,” United Kingdom, 1999.
Jemiai, Nadia, “Snapshots of health systems, The United Kingdom of Great Britain, Northern Ireland, andWales,” European Observatory on Health Systems and Policies/World Health Organization, 2005.
National Institute for Clinical Excellence, “The Guideline Development Process, An Overview forStakeholders, the Public and the NHS,” February 2004.
Bevan, Gwyn and Robinson, Ray, “The Interplay between Economic and Political Logics: Path Dependencyin Health Care in England,” Journal of Health Politics, Policy and Law, Vol. 30, Nos. 1-2, February-April,2005.
Smith, Peter C., “Performance Management in British Health Care: Will It Deliver?” Health Affairs,May/June 2002.
26
A A R P E U RO P E A N L E A D E R S H I P S T U D Y: P R E S C R I P T I O N D RU G P R I C I N G