Aalto- Fission product transport in DD the primary circuit ... · Monografia...
69
Departme nt of applied physics F issio n pro duct t ranspo rt in t he primary c irc uit and in t he co nt ainme nt in se ve re nucle ar acc ide nt s J armo Kalilai ne n DOCTORAL DISSERTATIONS
Transcript of Aalto- Fission product transport in DD the primary circuit ... · Monografia...

9HSTFMG*agcbdg+
ISBN 978-952-60-6213-6 (printed) ISBN 978-952-60-6214-3 (pdf) ISSN-L 1799-4934 ISSN 1799-4934 (printed) ISSN 1799-4942 (pdf) Aalto University School of Science Department of applied physics www.aalto.fi
BUSINESS + ECONOMY ART + DESIGN + ARCHITECTURE SCIENCE + TECHNOLOGY CROSSOVER DOCTORAL DISSERTATIONS
Aalto-D
D 71
/2015
Fission product transport in the primary circuit and in the containment was investigated in severe nuclear accident conditions, where the reactor core is damaged and core materials are released from the reactor pressure vessel. The re-vaporization of deposited core materials from the circuit surfaces was studied with special emphasis on iodine speciation and transport. The results indicated the possibility of gaseous iodine release in conditions of the experiments. The use of precursors with different additives like Mo, B and Ag mixed with CsI further increased the fraction of gaseous iodine in the release. Aerosol transport in the containment was studied in specific turbulent natural convective flow conditions and the results were compared to particle tracking simulations data, obtained from a validated CFD simulation of the cavity. The results indicated that the depletion of 1 micrometer silica particles was not accurately depicted by the stirred settling model due to specific nature of the turbulent flow conditions in the cavity.
Jarmo K
alilainen F
ission product transport in the primary circuit and in the containm
ent in severe nuclear accidents A
alto U
nive
rsity
Department of applied physics
Fission product transport in the primary circuit and in the containment in severe nuclear accidents
Jarmo Kalilainen
DOCTORAL DISSERTATIONS

Aalto University publication series DOCTORAL DISSERTATIONS 71/2015
Fission product transport in the primary circuit and in the containment in severe nuclear accidents
Jarmo Kalilainen
A doctoral dissertation completed for the degree of Doctor of Science (Technology) to be defended, with the permission of the Aalto University School of Science, at a public examination held at the lecture hall K216 of the school on 18th of June 2015 at 12 noon.
Aalto University School of Science Department of applied physics

Supervising professor Prof. Filip Tuomisto Thesis advisor D.Sc. (Tech.) Terttaliisa Lind Preliminary examiners Ph.D. Luis E. Herranz, CIEMAT, Spain Prof. Kari Lehtinen, University of Eastern Finland, Finland Opponent Prof. Juhani Hyvärinen, Lappeenranta University of Technology, Finland
Aalto University publication series DOCTORAL DISSERTATIONS 71/2015 © Jarmo Kalilainen ISBN 978-952-60-6213-6 (printed) ISBN 978-952-60-6214-3 (pdf) ISSN-L 1799-4934 ISSN 1799-4934 (printed) ISSN 1799-4942 (pdf) http://urn.fi/URN:ISBN:978-952-60-6214-3 Unigrafia Oy Helsinki 2015 Finland

Abstract Aalto University, P.O. Box 11000, FI-00076 Aalto www.aalto.fi
Author Jarmo Kalilainen Name of the doctoral dissertation Fission product transport in the primary circuit and in the containment in severe nuclear accidents Publisher School of Science Unit Department of applied physics
Series Aalto University publication series DOCTORAL DISSERTATIONS 71/2015
Field of research Engineering physics
Manuscript submitted 9 March 2015 Date of the defence 18 June 2015
Permission to publish granted (date) 27 April 2015 Language English
Monograph Article dissertation (summary + original articles)
Abstract The fission product transport in the primary circuit and in the containment was investigated
in nuclear reactor severe accident conditions, where the reactor core is damaged and core materials are released from the reactor pressure vessel. The re-vaporization of fission products and core materials from the circuit surfaces was investigated with special emphasis on the effects of re-volatilization on iodine speciation and transport. Secondly, aerosol transport in the containment was studied in specific turbulent natural convective flow conditions.
The reaction on primary circuit surfaces was studied in an experimental facility where the precursor was heated and the concentrations of aerosol and gaseous reaction products were analysed. In the experiments temperature, precursor and reaction crucible materials and the composition of the gas atmosphere were altered. The results indicated that with pure CsI in 650 °C temperature, significant fraction of released iodine was transported in gaseous form. The increase of H2 in gas atmosphere caused the release of gaseous I and CsI particles to decrease and increase, respectively. When different additives like Mo, B and Ag were mixed with CsI, the fraction of gaseous iodine in the release was collectively increased compared to the pure CsI case. The reduction of temperature from 650 °C reduced the aerosol release with all precursors, but especially with MoO3 + CsI precursor, significant release of iodine in gaseous form was detected. Overall, the results indicated the possibility of gaseous iodine release at the re-vaporization from the circuit in conditions present in the experiments. To investigate the aerosol particle transport in the containment, a cubical differentially heated cavity was used to experimentally investigate the deposition of spherical monodisperse SiO2 particles with diameters 1 and 2.5 micron from the enclosure atmosphere. The turbulent natural convective flow was induced by the temperature difference between two vertical isothermal walls. The measurement results of the particle depletion were compared to particle tracking simulation data, obtained using a validated CFD simulation of the experimental cavity. The results indicated that the smaller particles deposited faster from the cavity than what the theoretical "stirred settling" model predicted. Simulations using a cavity with ideal adiabatic boundary conditions suggested that the faster deposition was due to specific nature of the turbulent flow conditions in the cavity, not depicted by the stirred settling model.
The results presented in this thesis can be utilized in the development of the severe accident computational tools. The composition and concentration of fission products transported and deposited in the containment are important for the accurate estimation of the source term in accident conditions.
Keywords Severe accident, fission product, primary circuit, containment
ISBN (printed) 978-952-60-6213-6 ISBN (pdf) 978-952-60-6214-3
ISSN-L 1799-4934 ISSN (printed) 1799-4934 ISSN (pdf) 1799-4942
Location of publisher Helsinki Location of printing Helsinki Year 2015
Pages 172 urn http://urn.fi/URN:ISBN:978-952-60-6214-3


Tiivistelmä Aalto-yliopisto, PL 11000, 00076 Aalto www.aalto.fi
Tekijä Jarmo Kalilainen Väitöskirjan nimi Fissiotuotteiden kulkeutuminen primääripiirissä ja suojarakennuksessa vakavissa ydinonnettomuuksissa Julkaisija Perustieteiden korkeakoulu Yksikkö Teknillisen fysiikan laitos
Sarja Aalto University publication series DOCTORAL DISSERTATIONS 71/2015
Tutkimusala Teknillinen fysiikka
Käsikirjoituksen pvm 09.03.2015 Väitöspäivä 18.06.2015
Julkaisuluvan myöntämispäivä 27.04.2015 Kieli Englanti
Monografia Yhdistelmäväitöskirja (yhteenveto-osa + erillisartikkelit)
Tiivistelmä Tässä väitöskirjassa tutkittiin fissiotuotteiden kulkeutumista primääripiirissä sekä
suojarakennuksessa vakavassa ydinonnettomuudessa, missä ydinmateriaaleja on vapautunut reaktorin paineastiasta sydämen vaurioitumisen seurauksena. Fissiotuotteiden uudelleen höyrystymistä primääripiirin pinnalta tutkittaessa erityishuomiota kiinnitettiin jodin eri yhdisteiden vapautumiseen. Suojarakennustutkimuksessa keskityttiin hiukkasten depositioon turbulentista luonnonkiertovirtauksesta.
Primääripiirin pinnalla tapahtuvien reaktioiden kokeellisessa tutkimuksessa koelaitteisto lämmitettiin kohdelämpötilaan ja määritettiin kaasumaisten sekä aerosolireaktiotuotteiden pitoisuus. Tulokset osoittivat, että CsI lähtöaineena tuotti 650 °C lämpötilassa merkittäviä määriä kaasumaisessa jodia. Vedyn suurempi pitoisuus kantokaasussa aiheutti kaasumaisen jodin määrän pienenemisen sekä CsI aerosolin määrän kasvun. Eri aineiden kuten Mo, B ja Ag lisääminen lähtöaineeseen kasvatti kaasun osuutta vapautuneessa jodissa. Kun lämpötilaa laskettiin 650 °C:stä, aerosolin vapautuminen väheni merkittävästi. Etenkin MoO3 + CsI lähtöainetta käytettäessä kaasumaista jodia vapautui silti huomattavasti. Kaiken kaikkiaan tulokset osoittivat kaasumaisen jodin vapautumisen olevan mahdollista kokeissa käytetyissä olosuhteissa. Aerosolien kulkeutumista suojarakennuksessa tutkittiin yksinkertaistetuissa koeolosuhteissa. Pallomaisten, halkaisijaltaan 1 ja 2.5 mikrometriä olevien monodispersiivisten SiO2 hiukkasten depositiota tutkittiin kuution mallisessa laatikossa, missä kaksi vastakkaista eri lämpötiloihin lämmitettyä pystyseinää saivat aikaan turbulentin luonnonkierron. Mittaustuloksia verrattiin hiukkasratasimulaatioihin, joiden laskemisessa käytetty virtausmekaniikkalaskentamalli validoitiin mitattujen virtauskenttien avulla. Tulokset sekä mittauksista että hiukkasratalaskuista osoittavat, että 1 mikrometrin hiukkasten depositio on kammiossa nopeampaa kuin mitä teoreettinen "sekoittuneen laskeutumisen" malli olettaa. Hiukkasratasimuloinnit toistettiin kammiomallilla missä käytettiin ideaalisia adiabaattisia reunaehtoja ja tulokset osoittivat pienempien hiukkasten oletettua nopeamman deposition aiheutuvan kammiossa vallitsevien olosuhteiden aikaan saaman turbulentin virtauksen vaikutuksesta hiukkasliikkeeseen, mitä yksinkertainen sekoittuneen laskeutumisen malli ei kykene kuvaamaan.
Tässä väitöskirjassa esitettyjä tuloksia voidaan hyödyntää vakavia ydinonnettomuuksia mallintavien työkalujen kehityksessä. Fissiotuotteiden koostumuksen, kulkeutumisen ja suojarakennusdeposition tarkka tuntemus on erityisen tärkeää arvioitaessa mahdollista lähdetermiä vakavissa reaktorionnettomuuksissa.
Avainsanat ydinonnettomuus, fissiotuotteet, primääripiiri, suojarakennus
ISBN (painettu) 978-952-60-6213-6 ISBN (pdf) 978-952-60-6214-3
ISSN-L 1799-4934 ISSN (painettu) 1799-4934 ISSN (pdf) 1799-4942
Julkaisupaikka Helsinki Painopaikka Helsinki Vuosi 2015
Sivumäärä 172 urn http://urn.fi/URN:ISBN:978-952-60-6214-3


Acknowledgements
The research work for this thesis was carried out as collaboration between Technological Research Centre of Finland VTT and Paul Scherer Institut, PSI. I would like to express my gratitude to my thesis advisor Dr. Terttaliisa Lind who guided and supported me during the whole thesis work. I would like to thank Mr. Ari Auvinen for mentoring and supervision of the experimental work performed at VTT and Dr. Abdel Dehbi for his guidance and oversight of the computational work of this thesis. I would like to thank my supervising professor Filip Tuomisto for his supervision and advises on the thesis work as well as professor Rainer Salomaa for the guidance at the beginning of the the-sis work. I would like to acknowledge my pre-examiners professor Kari Lehtinen and Dr. Luis E. Herranz.
I would like to express my thanks to all my co-authors and people involved in the research presented in this thesis. Especially, I would like to thank Mr. Teemu Kärkelä for the guidance and mentoring at the beginning of my workand Mr. Pekka Rantanen for his crucial help with the design and construction of the experimental facility and with the operation of the laser measurement equipment. I would like to thank all my colleagues in both VTT Fine particlesgroup and in PSI Severe accidents research group who were always ready to aid me in my lab and analysis work. In addition, I wish to acknowledge my long time office mate Dr. Jouni Pyykönen for patiently answering my endless questions about computational fluid mechanics and aerosol dynamics.
The funding for this work has come from The Finnish Research Programmes on Nuclear Power Plant Safety SAFIR2010 and SAFIR2014 and from Paul Scherrer Institut, which are gratefully acknowledged.
Finally I would like to thank my family for the constant support they have given me during the years.
Villigen, 30 April 2015Jarmo Kalilainen
1


Contents
Acknowledgements...................................................................................1
List of Abbreviations and Symbols.......................................................... 5
List of Publications .................................................................................. 9
Author’s Contribution............................................................................ 10
1. Introduction.................................................................................12
2. Fission product behaviour in severe nuclear accidents...............15
2.1 Deposition and reactions on reactor primary circuit ..............15
2.1.1 Effects of re-vaporization on iodine transport.........................16
2.2 FP aerosol transport in the containment.................................17
3. Methods .......................................................................................19
3.1 Primary circuit study – EXSI facility.......................................19
3.2 Experimental particle depletion study – DIANA facility........ 22
3.2.1 Flow and temperature measurements ................................ 23
3.2.2 Particle concentration measurements ................................ 24
3.2.3 Particle charge measurements ............................................ 27
3.3 Numerical methods in the particle depletion study ............... 28
4. Reaction of FP deposits on the reactor primary circuit...............31
4.1 CsI precursor at T = 650°C ..................................................... 32
4.2 The effects of molybdenum and boron additives.................... 34
4.3 The effects of reduced temperature ........................................ 36
5. FP aerosol transport in the containment ................................... 38
5.1 Flow field and temperature distribution ................................ 38
5.2 Particle deposition experiments ............................................. 43
5.3 Particle charge measurement results...................................... 45
5.4 Particle tracking simulations .................................................. 46
6. Summary .................................................................................... 53
References...............................................................................................57
Publication 1……………………………………………………………………………….. 63
3

Publication 2……………………………………………………………………………….. 72
Publication 3……………………………………………………………………………….. 86
Publication 4……………………………………………………………………………….. 103
Publication 5……………………………………………………………………………….. 128
4

List of Abbreviations and Symbols
AIC Silver-Indium-Cadmium
AMMD Aerodynamic Mass Median Diameter
BC Boundary Condition
CC Slip correction factor
CD Drag coefficient
CCD Charge-Coupled Device
CFD Computational Fluid Dynamics
CPC Condensation Particle Counter
CRW Continuous Random Walk
da Aerodynamic diameter
dp Particle diameter
DHC Differentially Heated Cavity
DMA Differential Mobility Analyzer
DNS Direct Numerical Simulation
e Elementary charge
EDS Energy Dispersive X-ray Spectroscopy
ELPI Electrical Low Pressure Impactor
FD Drag force
Fx External force
FTH Thermophoretic force
FP Fission Product
g Gravitational acceleration
Gr Grashof number
GSD Geometric Standard Deviation
5

H Height of the cavity
I Intensity
I0 Intensity of un-scattered light
Ibg Background intensity
Isca Intensity of scattered light
It Turbulence intensity
i Current
IDEAL Ideal boundary condition
ICP-MS Inductively Coupled Plasma Mass Spectrometer
kf Fluid thermal conductivity
kp Particle thermal conductivity
Kn Knudsen number
L Side length of the cavity
LDV Laser Doppler Velocimetry
LES Large Eddy Simulation
LPT Lagrangian Particle Tracking
mp Particle mass
N Number concentration
n Number of particles
NPT Normal Pressure and Temperature
p Pressure
PIV Particle Image Velocimetry
Pr Prandtl number
Q Flow rate
R(s) Cross-correlation
Ra Rayleigh number
RANS Reynolds-Averaged Navier-Stokes
RCS Reactor Coolant System
rms Root mean square
Re Reynolds number
Rep Particle Reynolds number
6

Introduction
rd Distance between the detector and particle
s Image displacement
SA Severe Accident
SEM Scanning Electron Microscope
SMPS Scanning Mobility Particle Sizer
T Temperature
Tc Cold wall temperature
Th Hot wall temperature
Tr Reference temperature ( )/2t Time
tp Thermophoresis
TEOM Tapered Element Oscillating Microbalance
u Velocity component (x-direction)
u Velocity vector
Mean velocity
Fluctuating velocity
v Velocity component (y-direction)
vTS Terminal settling velocity
VTT Technical Research Centre of Finland
WT Wall temperature boundary condition
x,y,z Spatial coordinates
x Position vector
Z depth of the cavity
Thermal diffusivity
Thermal expansion coefficient
Decay constant
0 Reference density
g Gas density
p Particle density
Molecular viscosity
Time constant of deposition
7

Kinematic viscosity
T Temperature difference
t Interframe delay
dCsca Differential scattering cross section
8

List of Publications
This doctoral dissertation consists of a summary and of the following publica-tions which are referred to in the text by their numerals
1. Kalilainen, J., Kärkelä, T., Zilliacus, R., Tapper, U., Auvinen, A., Jokiniemi, J., 2014. Chemical reactions of fission product deposits and iodine transport in primary circuit conditions. Nucl. Eng. Des. 267, 140-147.
2. Gregoire, A.C., Kalilainen, J., Cousin, F., Mutelle, H., Cantrel, L., Auvinen, A., Haste, T., Sobanska, S., 2015. The role of molybdenum on iodine transport in the RCS in nuclear severe accident conditions. Ann. Nucl. Energy. 78, 117-129.
3. Bottomley, P.D.W., Knebel, K., Van Winckel, S., Haste, T., Souvi, S.M.O., Auvinen, A., Kalilainen, J., Kärkelä, T., 2014. Revaporisation of fission product deposits in the primary circuit and its impact on accident source term. Ann. Nucl. Energy 74, 208-223.
4. Kalilainen, J., Rantanen, P., Lind, T., Auvinen, A., Dehbi, A.. Investigation of a turbulent particle-laden flow inside a cubical differentially heated cavity –Part 1: Experimental study. Submitted to Aerosol science and technology.
5. Dehbi, A, Kalilainen, J., Lind, T., Auvinen, A.. Investigation of a turbulent particle-laden flow inside a cubical differentially heated cavity – Part 2: Large eddy simulation. Submitted to Aerosol science and technology.
9
Author’s Contribution
Publication 1: Chemical reactions of fission product deposits and iodine transport in primary circuit conditions.
The experimental work presented in the paper as well as the chemical equilib-rium calculation were mainly conducted by the author. The analysis of the re-sults was mainly done by the author except for the elemental analysis of the filter and gas scrubber samples and the SEM and EDS imaging and analysis, which were provided by the co-authors Riitta Zilliacus and Dr. Unto Tapper, respectively. The paper was mainly written by the author.
Publication 2: The role of molybdenum on iodine transport in the RCS in nuclear severe accident conditions.
The author took part in design and construction of the improved experimental facility used in the Technical Research Centre of Finland (VTT) part of the publication and was mainly responsible for the experimental work and the analysis of the results, except for the elemental analysis work by ICP-MS. The VTTs contribution to the publication was mainly written by the author.
Publication 3: Revaporisation of fission product deposits in the primary cir-cuit and its impact on accident source term.
The author participated in the experimental work presented in the VTTs part of the publications. The author is mainly responsible of analysis of the results, except for the elemental analysis done with ICP-MS and took part in writing the VTTs part in the publication.
Publication 4: Investigation of a turbulent particle-laden flow inside a cubi-cal differentially heated cavity – Part 1: Experimental study.
The author took part in the design and construction of the experimental facili-ty and on the flow field and temperature measurement work. The analysis of the PIV measurement data was performed by the co-author Pekka Rantanen. The particle concentration measurements and analysis of the results were conducted by the author. The publication was written by the author.
Publication 5: Investigation of a turbulent particle-laden flow inside a cubi-cal differentially heated cavity – Part 2: Large eddy simulation.
The author took part in the flow field and particle tracking simulations. The
10

Introduction
experimental results were provided by the author. The author participated in the analysis of the particle tracking results and in writing the paper.
11

1. Introduction
A severe nuclear accident in a light water reactor refers to the scenario wherethe reactor core is damaged and fuel, fission products and other core materials are released to the reactor coolant system. Severe accident can result when the reactor cooling has failed (NUREG-1465, 1995), for example, in large break loss of coolant accident where the largest pipe in primary coolant system is severed by a two-sided guillotine break leading to fast uncovering of the reac-tor core (Sehgal, 2012). The consequent rise of core temperature can lead to fuel degradation and fission product release.
Reactor containment building acts as a barrier between the damaged reactor and the nuclear power plant surroundings with a function to prevent the re-lease of radioactive material to the environment. Specific group of accident scenarios called containment by-pass accidents refer to situations where ac-tivity can be released through pathways which the containment is unable to secure. For example, radioactive materials can be released to the secondary side of the boiling water reactor cooling system due to a rupture in steam gen-erator tube (Lind et al., 2011; Auvinen et al., 2005). The goal of the severe ac-cidents study as a part of the nuclear safety research is to find more effective ways to reduce and prevent the release of activity from nuclear power plants in accident conditions, also known as the source term to the environment. This can be achieved by comprehensive analysis of the phenomena taking place in severe accident conditions through a vast variety of experimental programmes and computer simulations.
Prior to 1979, most thorough assessment on the public risk of nuclear light water reactor accidents was presented in the WASH-1400 report, sponsored by the United States Nuclear Regulatory Commission (Sehgal, 2012; NUREG/CR-6193, 1994). After the core melt accident of Three Mile Island – 2, the need for the study of so called beyond design basis accidents was widely accepted in the nuclear community, bringing forth the larger scale light water reactor severe accident research. The studies consisted of assessments of severe accident risk in operating plants (NUREG-1150, 1987) and the analysis of the source term (NUREG-1465, 1995).
Up until today, various experimental and numerical investigations have been conducted related to severe accident research. The experiments contain nu-merous separate effects tests, focusing only on specific accident phenomenon or integral tests where many parts of the accident sequence are investigated simultaneously, such as Phébus FP programme (Clement and Zeyer, 2013) and
12

Introduction
LOFT-FP project (Sehgal, 2012, NUREG/CR-0247, 1978). Separate effects tests can focus for example on fission product release from the damaged reac-tor core, their transport in the reactor coolant system or in the containment building or on the chemistry of specific fission products like iodine in different phases of the accident scenario. In addition, a number of severe accidents ex-periments study many phenomena simultaneously without modelling the en-tire accident progression. For example, MARVIKEN-V tests studied aerosol deposition in both primary circuit and containment building(NEA/CSNI/R(2009)5, 2009). Also pool scrubbing experimental programmes, such as POSEIDON-II (Dehbi et al., 2001) investigated the effects of several parameters like particle diameter and submergence on aerosol retention in a liquid pool.
Severe accident computer codes can be divided into integral codes such as MAAP, MELCOR and ASTEC, which are used to simulate the whole severe accident scenario through user defined parameters, and to mechanistic codes using the best estimate phenomenological models for the simulation of only apart of the nuclear power plant (Sehgal, 2012). Also specific computational tools, such as computational fluid dynamics codes, are applied for the simula-tion of specific phenomena like flow in the reactor coolant system in the severe accident conditions.
One of the latest major experimental severe accident studies has been the Phébus FP programme. The accident modelled in the experiments was a low pressure cold leg break where primary circuit piping was cut after the steam generator and core materials are released in the containment atmosphere (March and Simondi-Teisseire, 2013). It contained five integral experiments where many phenomena, such as core degradation, fission product release and transport, iodine chemistry and aerosol behaviour in the containment were investigated. In the Phébus FP facility, 1 meter high fuel bundle containing 21 fuel rods was placed in the Phébus reactor where it was heated up to the point of degradation(Clement and Zeyer, 2013). Released materials were transport-ed from the reactor through a primary circuit hot line containing a single U-tube modelling a steam generator. The scaling ration for the fuel mass, fission product inventory, number of U-tubes and the volume of containment atmos-phere was 1/5000 compared to a French 900 MWe reactor. The circuit ledfrom the U-tube through the cold leg to the Phébus FP containment which included painted condensing surfaces and a sump, modelling a reactor con-tainment building. The parameters varied in the Phébus FPT0-3 tests were the composition of the fuel (burn-up, fresh fuel), control rod material (boron car-bide, silver-indium-cadmium), atmospheric conditions (steam rich/poor) and pH of the containment sump. In the FPT-4 test, low volatility fission productsand actinide release were investigated using a debris bed made from the irra-diated fuel. The information from the Phébus FP experiments is being utilized for the improvement and validation of severe accident simulation tools. Also, findings from Phébus FP experiments have acted as an important motivatorfor the research questions investigated in this thesis.
13

Introduction
In this thesis, the fission product transport in the reactor coolant system and in the containment was studied both experimentally and numerically. Two separate effects test facilities were used in the experimental work to investigatethe re-vaporization and transport of fission products and different structural materials from the primary circuit surface in publications 1-3 and the phe-nomenon of particle transport in containment by studying aerosol deposition in natural convective flow in publication 4. In publication 5, particle deposi-tion in turbulent natural convection was investigated numerically using com-putational fluid dynamics simulations.
14

2. Fission product behaviour in severe nuclear accidents
2.1 Deposition and reactions on reactor primary circuit
Fission products (FPs) are transported through the reactor coolant system (RCS) mainly as aerosol particles. The release of fission products and transu-ranic elements from the fuel rods was investigated in the VERCORS pro-gramme (Pontillon et al., 2010) and the investigation of fission product release and transport is continued in the currently on-going VERDON tests (Gallais-During et al., 2012). First primary particles in the core are most probably cre-ated when volatilized material from the core like silver nucleate at the upper plenum region of the pressure vessel (NEA/CSNI/R(2009)5, 2009). As the aerosol particles are carried to cooler regions they grow as vapour condenseson their surfaces or through agglomeration where colliding particles coalesce to form a larger single particle. Owing to these processes, a multicomponent polydisperse distribution of aerosol particles is formed in the primary circuit, consisting of particles with varying shapes (but still with relatively compact geometry) and compositions with aerodynamic mass median diameter (AMMD) of approximately 1-2 μm and geometric standard deviation (GSD) approximately 2 (Kissane, 2008). At the cold leg of the circuit in Phébus FPtests 0-2, particle AMMD was between 1-3 μm and GSD 2 (Haste et al., 2013).
As the particles are transported through the RCS, a fraction of them deposit on the coolant system surfaces. In the reactor pressure vessel, where the first and smallest aerosol particles have formed, the deposition is mainly caused by Brownian diffusion. Diffusion can be significant also in other parts of the RCS if the particles remain small. The fission products that remain in vapour form are removed from the RCS mainly by condensation to the pressure vessel and the coolant system surfaces. Important deposition mechanisms for larger par-ticles in the primary circuit are thermophoresis and inertial impaction (NEA/CSNI/R(2009)5, 2009). A thermophoretic force is imposed to a particle by the temperature difference between the gas atmosphere and the coolant system boundary. Inertial deposition occurs when the particle impacts to the surface due to rapid change of flow geometry. Also, if the flow velocity in the circuit is low and par , gravitational settling will play a role in the deposition process.
15

Fission product behaviour in severe nuclear accidents
Publications 1-3 consider the re-volatilization of deposited particles on the primary circuit surfaces. Re-vaporization of deposit can occur if the gas at-mosphere is varied or the materials are heated by the decay heat from the FPsin areas of large deposition or through convective heating (NUREG/CR-6193, 1994). The re-vaporization of caesium in the primary circuit has been exten-sively investigated in previous studies (Auvinen et al., 2000; Knebel et al., 2014) and it has also been directly seen in Phébus FPT1 and FPT2 experiments (Haste et al., 2013). Experiments using deposits from the FPT3 test in Publ. 3showed that Cs, as well as other fission product materials such as Mo, can re-vaporize in the temperature range 500-1000 °C. Re-vaporization from the primary circuit surface can alter the amount and composition of the FPs transported to the reactor containment and thus has an effect on the source term.
2.1.1 Effects of re-vaporization on iodine transport
Special emphasis in Publs. 1-3 was placed on the possible effects of re-vaporization on iodine speciation and transport. Iodine is considered an im-portant FP from nuclear safety perspective because of its high volatility andthe possibility of it causing a high radiation dose on the public in severe acci-dent conditions. Many important findings considering the iodine transport on the RCS were reported in the Phébus FP experimental programme. In the first Phébus FP experiment (FPT0), at least 2 % of iodine was observed in a gaseous form in the part of primary circuit at 423 K temperature (cold leg). This indi-cated that a fraction of iodine from the Phébus FP fuel bundle was transported through the RCS facility as some chemical species that did not condense at 423 K (Clement et al., 2003). In the FTP1 test, only a negligible amount of gaseous iodine was measured in the cold leg and yet the concentration of gaseous io-dine in the containment after first oxidation phase was significant (approxi-mately 5 % maximum) (Girault et al., 2006). Based on these observations, the question if the gaseous iodine was formed in the circuit was left open. The FTP3 test differed from the other Phébus FP experiments mostly because of the boron carbide (B4C) control rods used in the fuel bundle instead of the sil-ver-indium-cadmium (AIC) rods. Also, the iodine transport in FTP3 was sig-nificantly different compared to the previous tests. Almost all of the iodine released in the containment was in gaseous form and only a small fraction was transported in the reactor coolant system as aerosol (Haste et al., 2010).
In addition to Phébus FP, the CHIP programme investigates the release of iodine by the gas phase reactions taking place in the primary circuit conditions (Gregoire and Mutelle, 2012; Gouello et al., 2013). In the CHIP experiments,the effects of additives such as molybdenum on iodine release and transport have been investigated.
16

Fission product behaviour in severe nuclear accidents
2.2 FP aerosol transport in the containment
The FPs released to the containment from the RCS consist mainly of aerosol particles and noble gases with some fraction of iodine and ruthenium in gase-ous form (Sehgal, 2012). Aerosol particles in the containment atmosphere are transported by natural convective flow, induced by local heat sources. Differ-ing thermal hydraulic conditions between the various parts of the containment can lead to the division of the containment to a number of compartments with unique flow behaviour which further introduces varying aerosol deposition behaviour (NEA/CSNI(2009)5, 2009). The particles deposit from the con-tainment atmosphere primarily through sedimentation or through the use of a spray system. Also diffusiophoresis, where the force on a particle is induced by steam condensing on a cold surface, is an important aerosol removal mecha-nism when the concentration of water vapour in the containment atmosphere is high.
Numerous of prior experiments on aerosol depletion in containment havebeen conducted. The early experimental work with CSE (Containment System Experiment) in Battelle Memorial Institute between 1968 and 1970 investigat-ed the depletion of particulate caesium and uranium oxide in supersaturated atmospheres. The CSE tests showed that particle growth was affected by the steam condensation and the main deposition was due to gravitational settling (Fynbo et al., 1990; Hillard and Coleman, 1970). Nuclear aerosol behaviour in large scale 630 m3 model containment was studied from 1983 to 1986 in theDEMONA programme. DEMONA data were compared with computational results from the NAUA aerosol code and the computational and experimental methods agreed on dry aerosol results but some discrepancies were observed in wet aerosol cases. The LACE experiments investigated aerosol behaviour in severe accident conditions both in high velocity pipe flow and in a large model containment (Fynbo et al., 1990; NEA/CSNI(2009)5, 2009). The VANAM tests contained experiments on the effects of different thermal hydraulic con-ditions on the deposition of insoluble and hygroscopic aerosol in a multi-compartment model containment. Similar parameters were also investigated in complementary KAEVER experiments using horizontal cylindrical test facil-ity. A number of tests from both VANAM and KAEVAR programmes were cho-sen as International Standard Problems dealing with the thermal hydraulics and aerosol behaviour in a light water reactor containment in severe accidentconditions. Both experiments showed that the hygroscopic effect and the amount of steam influenced the aerosol depletion from the containment at-mosphere (NEA/CSNI(2009)5, 2009). In addition, the effect of relative hu-midity and hygroscopic aerosol behaviour on the containment deposition was further investigated with the AHMED facility, using NaOH, CsOH, CsI and Ag particles (Mäkynen et al., 1997). The VICTORIA facility is a model of Loviisa nuclear power plant ice condenser containment. The data form the VICTORIA experiments was used in testing if computational codes were able reproduce the behaviour of radiative hygroscopic and non-hygroscopic aerosol in a multi-compartment containment (Mäkynen et al., 1996; NEA/CSNI(2009)5, 2009)
17

Fission product behaviour in severe nuclear accidents
In the Phébus FP experiments, FPs were mostly released to the containment as aerosol (Laurie et al., 2013; Simondi-Teisseire et al., 2013). The aerosol par-ticles deposited on the containment in the Phébus tests were predominantly spherical, composing of FP, control rod and structural materials. The meas-ured AMMD in the experiments was between 3-4 μm (Laurie et al., 2013) and the size distribution remained almost constant during the whole containment transient (NEA/CSNI(2009)5, 2009). The deposition in the containment was mainly caused by sedimentation (58-74 % of the containment inventory in FPT0-3,). Also, deposition to the wet condenser due to diffusiophoresis was significant (12-26% of the containment inventory) in FTP0-3. In addition es-pecially in FTP2-3 tests, substantial deposition (8-11 %) was observed on con-tainment vertical walls and its formation was attributed to the turbulent damping in the boundary layer (Laurie et al., 2013).
In addition to SA containment studies, particle transport and fluid flow in-side enclosures with different sizes and shapes has been a subject of numerous studies in different fields and applications, such as indoor particle depositions (Nazaroff, 2004), clean rooms (Li et al., 1998), room heating (Lankhorst, 1991) and solar collectors (Linthorst, 1985). In publications 4 and 5 of this thesis, the deposition of aerosol particles from turbulent natural convective flow inside anenclosure is investigated. The results can be used to estimate what is the effectof the turbulent natural convection, present also in reactor containment dur-ing SA conditions, has on the depletion of FP particles and other nuclear aero-sols. The information of the particle concentration in containment atmosphere at different periods of the accident is vital since it can be used to estimate the source term in possible leak-out situations.
18

3. Methods
The methods used in this thesis for the experimental and numerical work are introduced in this chapter. The experimental setup for the primary circuit chemistry studies is described in Section 3.1. Sections 3.2 and 3.3 focus on the experimental and numerical tools used in the study of particle depletion in an enclosure with turbulent natural convection, respectively.
3.1 Primary circuit study – EXSI facility
The experimental work on the primary circuit study, presented in Publs. 1-3,was performed using the EXSI–PC (EXperimental Studies on Iodine chemistry – Primary Circuit) facility. In EXSI-PC, the deposited FPs and other investi-gated materials are re-volatilized due to increase in temperature or change in atmospheric gas composition inside the circuit. Thus the reactions at the evap-oration crucible, modelling the primary circuit surface, and in the gas phase inside the reaction furnace tube have an effect on the release and compositionof reaction products. The concentration of the gaseous and particulate materi-als transported in EXSI was measured as well as the size distribution of the particles formed in the gas phase. In addition, the effects of different tempera-tures and the atmospheric conditions on iodine transport were investigated.
The previous work by Bowsher (1987) indicated that if no other materials are present, iodine will mainly be released to the primary circuit as caesium iodide (CsI). Prior experimental work has shown that CsOH was released from the deposited CsI aerosol in steam atmosphere (Auvinen et al., 2005). However, iodine release or transport was not observed in this study. Other metallic com-pounds like AgI or CdI2 could also be formed if materials from the AIC control rods were present in the reactor core (NUREG/CR-6193, 1994; Cantrel et al., 2013). CsI was selected as a precursor for the experimental work on EXSI-PC in Publs. 1-3 to provide the base case for future experiments. In most of the experiments, boron, molybdenum or silver was mixed with CsI in the precur-sor and the effects were observed. Previous research has shown the im-portance of these materials in SA conditions. In the work of Bowsher and Dick-inson (1986), it was seen that volatile hydrogen iodide was formed in vapour phase reaction of CsI and boric acid and in reaction between boric acid vapour and condensed CsI. In Phébus FTP3 using a B4C control rods, iodine in aerosol
19
Methods
particles consisted only a small fraction of transported iodine in the circuit and approximately 85% of the iodine was released as gas in the containment (Haste et al., 2010). Also, a large deposit of boron containing material caused partial blockage in the circuit in FTP3 (Haste et al., 2013). Several studies such as the VERCORS and Phébus FP experiments have shown that a significant fraction of molybdenum is released from the fuel under severe accident condi-tions (Pontillon and Ducros, 2010; Clement and Zeyen, 2013) and transported to the primary circuit (Haste et al., 2013). Released silver in SA conditions originates mostly from the AIC control rods and for example in the Phébus FPT0-2 tests, significant deposition of silver was observed in the primary cir-cuit (Clement et al., 2003, Haste et al., 2013).
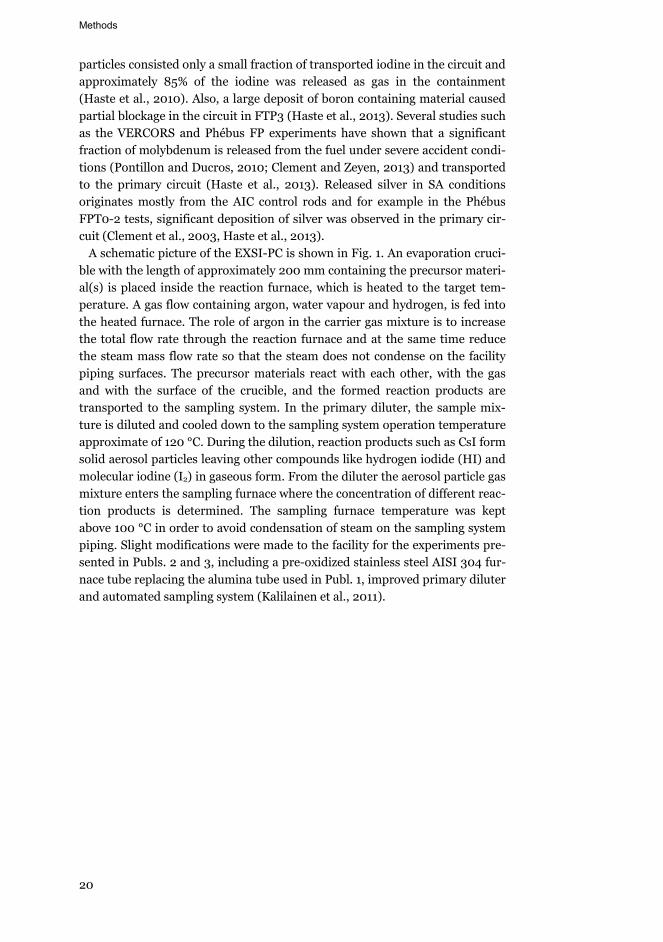
A schematic picture of the EXSI-PC is shown in Fig. 1. An evaporation cruci-ble with the length of approximately 200 mm containing the precursor materi-al(s) is placed inside the reaction furnace, which is heated to the target tem-perature. A gas flow containing argon, water vapour and hydrogen, is fed into the heated furnace. The role of argon in the carrier gas mixture is to increase the total flow rate through the reaction furnace and at the same time reduce the steam mass flow rate so that the steam does not condense on the facility piping surfaces. The precursor materials react with each other, with the gas and with the surface of the crucible, and the formed reaction products are transported to the sampling system. In the primary diluter, the sample mix-ture is diluted and cooled down to the sampling system operation temperature approximate of 120 °C. During the dilution, reaction products such as CsI form solid aerosol particles leaving other compounds like hydrogen iodide (HI) and molecular iodine (I2) in gaseous form. From the diluter the aerosol particle gas mixture enters the sampling furnace where the concentration of different reac-tion products is determined. The sampling furnace temperature was kept above 100 °C in order to avoid condensation of steam on the sampling systempiping. Slight modifications were made to the facility for the experiments pre-sented in Publs. 2 and 3, including a pre-oxidized stainless steel AISI 304 fur-nace tube replacing the alumina tube used in Publ. 1, improved primary diluterand automated sampling system (Kalilainen et al., 2011).
20

Methods
Figure 1. Schematic figure of the EXSI-PC facility for studying the chemical reaction on primary circuit surfaces Publ. 1.
The sampling furnace contained three analytical sampling lines. In each sam-pling line, aerosol particle samples were collected on polytetrafluoroethylenemembrane discs filters with 5 μm pore size. Downstream from the aerosol fil-ters, gaseous compounds were trapped in gas scrubbers with 0.2M NaOH and 0.02M Na2S2O3 water solution, designed for efficient trapping of gaseous io-dine compounds. For each experiment, at least 2 or 3 bubblers were used in all separate sampling lines to ensure the efficient trapping of the gasses. The aer-osol filters and the facility were rinsed after each experiment using the scrub-ber solution. The elemental composition of the samples was analysed with Thermo Fisher Scientific Element2 high resolution inductively coupled plasma mass spectrometer (HR-ICP-MS).
The TSI scanning mobility particle sizer (SMPS) was used in the experiments to monitor the aerosol number size distribution. The SMPS consists of a differ-ential mobility analyzer (DMA) where the particles are sampled according to their electrical mobility. The particles with a certain electrical mobility enter from DMA to the condensation particle counter (CPC) that is used to optically determine the particle number. By repeating the process with number of dif-ferent particle size groups the SMPS produces the particle size distribution of the measured aerosol particles.
In part of the experiments, the reaction crucible surface was analysed after the experiments using LEO (Zeiss) DSM 982 Gemini scanning electron micro-scope (SEM) and Noran Pioneer Pulstar Si(Li) X-ray detector for energy dis-persive X-ray spectroscopy (EDS). Further information of the EXSI-PC facilitycan be found from Publs. 1-3 and (Kalilainen et al., 2011).
21

Methods
3.2 Experimental particle depletion study – DIANA facility
The particle depletion inside an enclosure was investigated experimentally in publication 4 using a rectangular enclosure where the natural convective flow is induced by two isothermal vertical walls applied with temperature difference
T. An enclosure with such boundary conditions (BCs) is referred as a differ-entially heated cavity (DHC). Theoretical background on internal natural con-vection was presented for example by Bejan (2013) and review of the previouswork done concerning the heat and mass transfer aspect in enclosures with natural convective flows have been presented by Ostrach (1988) and Baïri et al. (2014).
In natural convection, the Rayleigh number (Ra) represents the ratio of con-vective and conductive heat transfer:
Ra = = Gr × Pr. (1)
, , , and g are kinematic viscosity, thermal diffusivity, thermal expansion coefficient, and gravitational acceleration, respectively and Pr is the Prandtl number. For buoyant flow, the Grashof number Gr = Re (White, 1991), indi-cating that the increase of Ra in DHC concurrently increases the Reynolds number (Re) and results in the flow eventually turning into turbulent. For cu-bic DHC with perfect adiabatic boundary conditions on the horizontal and lateral walls, laminar flow becomes unstable when Ra reaches approximately 3.3×10⁷ (Puragliesi, 2010).
The numerical DHC studies began with the flow simulations of two dimen-sional cavities with laminar (e.g. De Vahl Davis, 1983) and turbulent (Le Quéré, 1991) natural convection. Later simulations have mainly focused on three dimensional cubical cavities (e.g. by Fusegi et al. (1991), Tric et al. (2000), Wakashima and Saitoh (2004), Beth et al. (2006)) for laminar and Puragliesi (2010) for fully turbulent flow with Ra = 109. Experimental investi-gations on flow properties in air filled DHC consists of e.g. Tian and Karayian-nis (2000a, 2000b) and Ampofo and Karayiannis (2003), who measured two dimensional flow field and temperature quantities from the centre plane of a cavity with a depth to height ratio Z/H = 2 and Ra approximately 109. Mamun et al. (2008) measured two velocity components at the mid plane of a cubical differentially heated cavity with Ra = 106 and 6×10⁶.
Most of the DHC simulations have considered cavities with two isothermal side walls and adiabatic horizontal (and in three dimensional cases also two adiabatic lateral) walls. Since obtaining the adiabatic conditions in the experi-mental work has not been successful, new DHC simulations have started to move towards more physically realizable boundary (Leong at al., 1998). For example, thermal conduction and radiation heat transfer have been shown to have significant effects on the non-isothermal wall temperatures in DHCs by Lankhorst (1991), Colomer et al. (2004), Ibrahim et al. (2013) and recent ex-
22

Methods
tensive work by Sergent et al. (2013a, 2013b) and Xin et al. (2013) who ad-dressed numerically the effects of conduction and surface radiation on the flow and temperature inside the cavity by comparing the experimental results to simulations using varying boundary conditions.
For the experimental work presented in this thesis considering particle de-pletion in DHC, the DIfferentially heated cavity with Aerosol in turbulent NAt-ural convection (DIANA) facility was constructed. DIANA is an air filled cubi-cal DHC with two opposing vertical walls held at different isothermal tempera-tures and all other walls kept at close to adiabatic boundary conditions. The side length L of the DIANA cavity is 0.7 m. The isothermal walls are made of aluminium and are kept at a constant temperature using a continuous water circulation through the walls. Front and top walls consist of two glass plates to allow optical access for the flow field and aerosol particle concentration meas-urements. In order to reduce light reflections, the isothermal and back walls were painted black.
3.2.1 Flow and temperature measurements
In this work, the flow inside the DIANA facility was investigated using particle image velocimetry (PIV). PIV is a laser based, non-intrusive method where the measurement setup does not interfere with the flow as is the case for example with hot wire anemometers. Compared to laser Doppler velocimetry (LDV) where flow velocity measurement is conducted non-intrusively in one point of the flow field at a time, the advantage in PIV is the capability of measuring a flow field in multiple measurement points simultaneously (Arts et al., 1994). With the use of proper optics, PIV allowed fast and accurate measurement ofthe flow field in an entire 2D plane of the DIANA cavity in Publ. 4. In previous experimental work on DHCs, PIV has been used for flow measurements for example in laminar cubic cavity by Mamun et al. (2008) and by Belleoud et al. (2012) for rectangular DHC with Rayleigh number of up to 1.2 × 10¹¹.
In PIV, the flow field is determined from the movement of large number offlow following and light reflecting particles or droplets. Two successive images are taken from the particles at a desired section of the flow referred to as the imaging area, illuminated by a thin light sheet. Both images are divided into anumber of interrogation spots, containing a specific number of pixels. If the pixel placement inside an interrogation spot is x=(x,y) and the intensities in the pixel at the interrogation spot in images 1 and 2 are I1(x) and I2(x), respec-tively, the flow velocity vector u at the interrogation spot can be determined using the cross-correlation (Adrian and Westerweel, 2011):( ) = ( ) ( + ) . (2)
The maximum value of correlation Rmax(s) results in the displacement between the two images s which can be used to determine the flow velocity at the inter-rogation spot:= . (3)
23

Methods
The interframe delay t used in Eq. (3) is the time difference between the two images. By repeating the cross-correlation with every interrogation spot in the imaging area gives the flow vector field for one PIV measurement.
In DIANA, approximately 0.5 μm diameter Bis(2-ethylhexyl) sebacate (DEHS) droplets were used as tracer particles for the PIV. A Litron Lasers LPY 600/700 series double-pulse Nd:YAG laser was used as a light source and LaVision Imager Pro X CCD camera with a 2048 × 2048 pixel sensor for imag-ing the flow. The vector field calculation was done using a multi-pass methodwhere one calculation using 64 × 64 and two successive calculations using16x16 interrogation spots were performed. In this method, the image dis-placement data from the previous calculation is used to offset the interrogation spots between images at the succeeding calculations allowing an accurate cal-culation of the resulting flow field with improved spatial resolution (16×16 pixels). After the cross-correlation, two post-processing tools were used to re-move invalid vectors from the calculated flow field. First, highest correlation peak R(s1) was compared to the second highest correlation peak R(s2). The vector is discarded if:
( )( ) < 1.2. (4)
The second post-processing method is called the median-filter, which com-pares the length of each vector to the median length of its neighbouring vec-tors and removes it if the user defined conditions are not met. Both post-processing tools are implemented in the DaVis 7.2 software.
The gas temperature measurements were conducted using a K–type thermo-couple with wire diameter of 25 μm, calibrated in a hot water bath with a ref-erence sensor. The front glass walls of the cavity were replaced with two polyu-rethane sheets with a slit at desired measurement height. The thermocouple was inserted to the cavity through the slit and the mean temperature was ob-tained using approximately 100 s measurement time. The measurement was repeated at several points for each of the measurement profiles to assess thelong-term variations in the gas temperature. By adding the variation of tem-perature to the thermocouple uncertainty obtained from the calibration, an estimate for the uncertainty of gas temperature measurement was obtained for all measurement points. The estimate was conservative especially for the tem-peratures near the walls where the flow is vigorous compared to the stagnant cavity centre undergoing slower fluctuations.
3.2.2 Particle concentration measurements
An extensive review of previous work done on particle deposition to enclosure surfaces has been given by Liu (2009). Most of the enclosure flows in the pre-vious studies focus on either forced convection where the flow in the cavity is produced using for example a fan or an external flow, or natural convection where temperature differences between different cavity boundaries induce the
24
Methods
flow. Most of the experimental studies of particle depletion in an enclosure with natural convection have been conducted with cavities where the boundary or the flow conditions inside the cavity were not accurately defined. In Publ. 4,the experiments on particle deposition were performed using the DIANA cavi-ty with specifically determined BCs and flow conditions.
The deposition from DIANA cavity atmosphere was investigated using mon-odisperse amorphous silica (SiO2) particles with two diameters: dp = 1 μm and dp = 2.5 μm. A LaVision atomizer was used to seed the particles in de-ionized water dispersion to the cavity from five inlets at the bottom wall to produce uniform distribution of particles at the start of the measurement. The atomizer was selected for particle seeding in order to reach high enough initial concen-tration in DIANA where the measurement of light reflected form the particles is feasible throughout the experiment. Also, atomizer seeding ensured low charging of the SiO2 particles compared for example to fluidized bed seeding. Particle charging is discussed in section 3.2.3. During the preliminary testing of the facility, the disturbance of the particle seeding flow on the natural con-vective flow was studied by measuring the change in gas temperature during and after 20 minute seeding. Temperature at the measurement points re-mained unaltered, suggesting that the temperature and thus the flow field were not greatly influenced by the seeding.
Particle depletion was investigated using two measurement techniques to guarantee a reliable determination of the particle decay rate in the DHC at-mosphere. The change in the particle number concentration was investigated by measuring the intensity of light reflected by the particles suspended in the DHC atmosphere. Simultaneously, particle mass concentration was monitored using Tapered Element Oscillating Microbalance (TEOM).
In TEOM, the online aerosol mass concentration is determined by measuring the change in the frequency of the oscillating tapered element, caused by parti-cles settling on its surface. Five or six TEOM measurements, lasting approxi-mately 4-5 minutes, were conducted per experiment to determine the change in the mass concentration of the airborne particles. Limited measurement time with TEOM was used to minimize the effect of the sampling flow to the natural convection in DIANA.
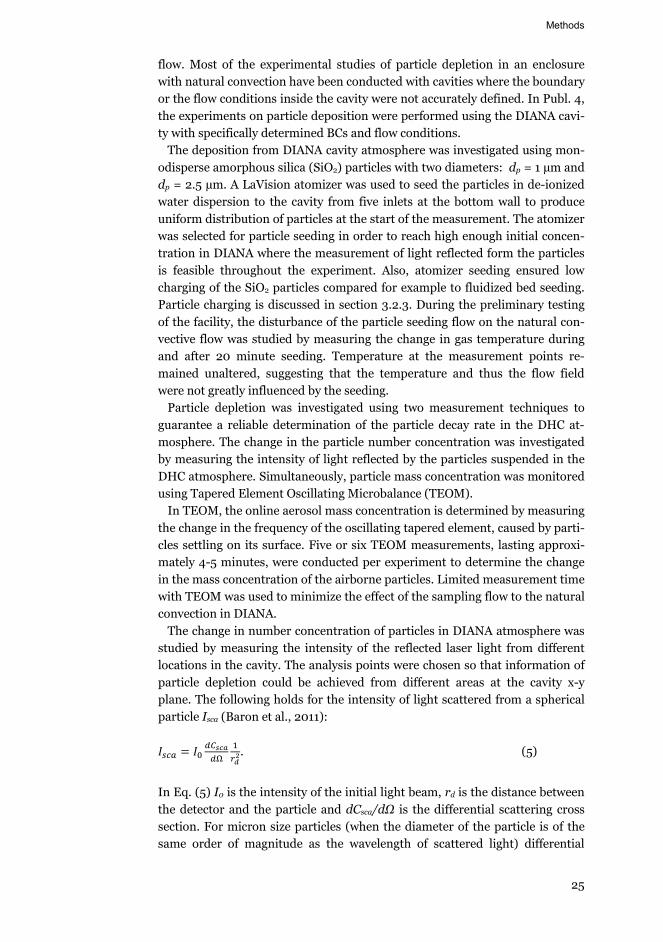
The change in number concentration of particles in DIANA atmosphere was studied by measuring the intensity of the reflected laser light from differentlocations in the cavity. The analysis points were chosen so that information of particle depletion could be achieved from different areas at the cavity x-yplane. The following holds for the intensity of light scattered from a spherical particle Isca (Baron et al., 2011):
= . (5)
In Eq. (5) I0 is the intensity of the initial light beam, rd is the distance betweenthe detector and the particle and dCsca is the differential scattering cross section. For micron size particles (when the diameter of the particle is of the same order of magnitude as the wavelength of scattered light) differential
25

Methods
cross sections can be determined using the Mie scattering theory. Scattered intensity to a specific solid angle is influenced by the size and relative refrac-tive index of the particles as well as the wavelength and polarity of the scat-tered light. In the experiments, Litron Nd:YAG laser with the wavelength of 532 nm was used with a sheet optics to produce an approximately 100 mmwide and 1 mm thick laser sheet illuminating a specific part of the DIANA cavi-ty, depicted in Fig. 2. The intensity of the light reflected by the SiO2 particleswas measured with a stationary CCD camera. By using monodisperse particles and coherent laser light with parallel polarization, the change in particle num-ber concentration can be investigated through measurement of scattered light intensity. At the image plane in the CCD camera sensor at a fixed solid angle and distance, the intensity I(x,t) at pixel imaging the location x=(x,y) resultsfrom the background intensity Ibg and the reflection from n number of parti-cles, situated inside the pixel area in the laser sheet with similar Isca. I(x,t) and corresponding number concentration N(x,t) are:( , ) = + and ( , )~ ( , ) . (6)
To ensure uniform distribution of particles in the cavity and to allow the dis-turbance from the seeding to DIANA flow field to die out, the intensity meas-urement was started 2700 s and 450 s after the seeding was stopped with dp =1 μm and dp = 2.5 μm particles, respectively. The interframe delay between consecutive images of the CCD camera was approximately 1.5 s. In the prelim-inary testing of the facility, water droplets induced in the seeding were found to evaporate rapidly from the cavity atmosphere thus having little or no effect on the laser measurement. Approximately 10-20 pictures were taken from each imaging plane before the seeding started for the calculation of average background intensity Ibg, which was subtracted from the rest of the CCD cam-era images in post processing of the data (Eq. (6)). The change in light intensi-ty at the analysis points was determined by calculating the average pixel inten-sity at the neighbouring 50 × 50 pixel (approximately 18 × 18 mm2) area from each image.
26

Methods
Figure 2. Schematic of the DIANA cavity indicating the laser intensity measurement planes and the TEOM sampler location (Publ. 4).
For the measurement data to accurately represent the deposition of monodis-perse aerosol, the number of agglomerated particles in the cavity atmosphere during the measurement needs to be small. The fraction of single and agglom-erated particles in each experiment was investigated by placing transparent plastic sheet with approximate area of 23 × 35 mm2 at the cavity near the cen-tre of the bottom floor. A Leica DM LS microscope with a Leica DFC 420 C camera was used in taking 3 pictures from quasi-random locations on each slide. From the microscope images, the fraction of single particles to agglom-erates was manually calculated.
3.2.3 Particle charge measurements
The electric charge obtained by the particles during seeding could have an ef-fect on the deposition rate through an electrical force induced by the image charging between the particles and the cavity walls (Guha, 2008). In the ex-perimental work, the particle charge during and after seeding was investigatedusing Electrical Low Pressure Impactor (ELPI). In ELPI, the particles are clas-sified based on their aerodynamic diameter given by Hinds (1999):
= (7)
where reference density 0 = 1000 kg/m3. For the dp = 1 μm and dp = 2.5 μm SiO2 particles with density p = 2000 kg/m3 the aerodynamic diameters are d and d (2.5μ) , respectively. ELPI was used alternately to measure the particle concentration in its normal operation mode and by switching off the corona charger, the current induced by the charged particles.
27

Methods
The data for particles collected to different ELPI impactor stages with cut-off diameters d50 and d50 were used to determine the approxi-mate number of elementary charges of dp = 1 μm and dp = 2.5 μm particles, respectively. The number of elementary charges n per particle can be estimat-ed from:
= , (8)
where N, i, e and Q are particle number concentration, current, the elementary charge and flow rate through the impactor, respectively.
3.3 Numerical methods in the particle depletion study
Numerous computational investigations on particle depletion in differentially heated cavities have been conducted previously. Akbar et al. (2009) and Bagheri et al. (2012) studied deposition in laminar 2D DHCs with particle di-ameters ranging from nano- to micrometre scales. Akbar et al. (2009) con-cluded that with low Ra numbers, a short time after the beginning of the com-putation a near-equilibrium state, where remaining particle stayed suspended in the circulating flow field, was reached. This phenomenon was not observed as the Rayleigh number reached Ra = 8×10⁶ and the particles stayed dispersed in the atmosphere. Direct numerical simulation (DNS) and large eddy simula-tion (LES) of a DHC with turbulent flow were conducted by Puragliesi et al. (2011) and Bosshard et al. (2014), respectively. Puragliesi et al. (2011) investi-gated turbulent 2D cavity with Ra = 109 and 1010 with dp = 10-35 μm particles dispersed in the atmosphere and found that almost all particles (more than 99%) were depositing due to sedimentation to the cavity floor. Bosshard et al. (2014) used a 3D cavity with Ra = 109 and concluded that the particle statistics were almost identical to the ones obtained from the DNS work by Puragliesi et al. (2011).
In the computational work in Publ. 5, large eddy simulation was used to cal-culate the flow field and temperature distribution in the DHC. In LES, the tur-bulent flow is resolved in the computational grid with the exception of the smallest eddies which are modelled using a filter function (Bosshard, 2012). The LES was chosen for the flow field simulations since different Reynolds-averaged Navier-Stokes (RANS) models for the turbulence calculation have been shown to produce inaccurate results for two dimensional DHCs (Dehbi et al., 2013), and an accurate direct numerical simulation of the DHC would not be feasible with the available computing resources.
The LES was conducted using the Boussinesq approximation for buoyant flow. If the temperature difference is small, the approximation of fluid (gas) density g gives (Schlichting and Gersten, 2000):
( ) = + | ( ) + , = |28

Methods
( ) 1 ( ) . (9)
The subscript r represents the value in the reference temperature. In the Bous-sinesq approximation, fluid properties such as density, thermal expansion co-efficient and viscosity are evaluated at the reference temperature and the Na-vier-Stokes equations read:
= 0+ = + + [1 ( )] (10)+ = .
The numerical particle depletion study was conducted using the Lagrangianparticle tracking (LPT) method. In LPT, the movement of each individual par-ticle is computed separately using the continuous phase (fluid) information obtained from LES. Thus, compared to Eulerian methods where particle con-centration in volume of fluid is considered, LPT requires more computational work in obtaining large enough sample of particle traces for representative statistics but also describes the particle movement very accurately. Since the particle concentration in the DHC will be sparse, one-way coupling, assumingno particle interaction can be applied (Crowe, 2006).
In LPT, the particle velocity up follows from the equation:
= + 1 + . (11)
Here, FD is the drag force per unit mass, defined as:
= . (12)
In Eq. (12), g, CD and Rep are dynamic viscosity of gas, the drag coefficient and particle Reynolds number, respectively. In Eq. (11), Fx refers to an external force per unit mass, affecting the particle. In this work thermophoresis was considered in simulations with = defined as (Talbot et al., 1980):
= ( / )( )( / ) . (13)
Here Kn is the Knudsen number, mp is the particle mass, kf and kp are the thermal conductivities of fluid and particle, respectively and Cs, Ct and Cm are dimensionless constants. Thermal conductivity of the particle, used in Eq. (13) was kp = 1.38 W/(mK). The specific heat of SiO2, used in the calculation of the particle temperature, was cp = 1680 J/(KgK). After the velocity of the particle has been obtained from Eq. (11), the trajectory of the particle x is calculated by integrating:
= . (14)
29

Methods
For obtaining the flow velocity for the particle tracking calculations, two dif-ferent methods were used in this study. In the first LPT method, u was ob-tained directly from the unsteady LES for every time step. Secondly, LPT was carried out using a continuous random walk (CRW) model, where the fluctuat-ing fluid velocity is modelled using a Markov chain based on the normalized Langevin equation which takes into account the inhomogeneities of the turbu-lence (Dehbi, 2008). The mean flow and temperature fields, along with the average Reynolds stresses were extracted from LES and used to calculate the fluctuating velocity component. With the mean velocity from the LES, the overall fluid velocity is obtained:
= + . (15)
The LES as well as the particle tracking work were performed using Ansys Flu-ent software. The particle is assumed trapped if it hits the cavity boundary and its placement and the trapping time are reported. With sufficient simulation time and number of tracked particles, statistics of particle deposition to differ-ent boundaries and the time constant of decay from the cavity atmosphere can be obtained.
30
4. Reaction of FP deposits on the reac-tor primary circuit
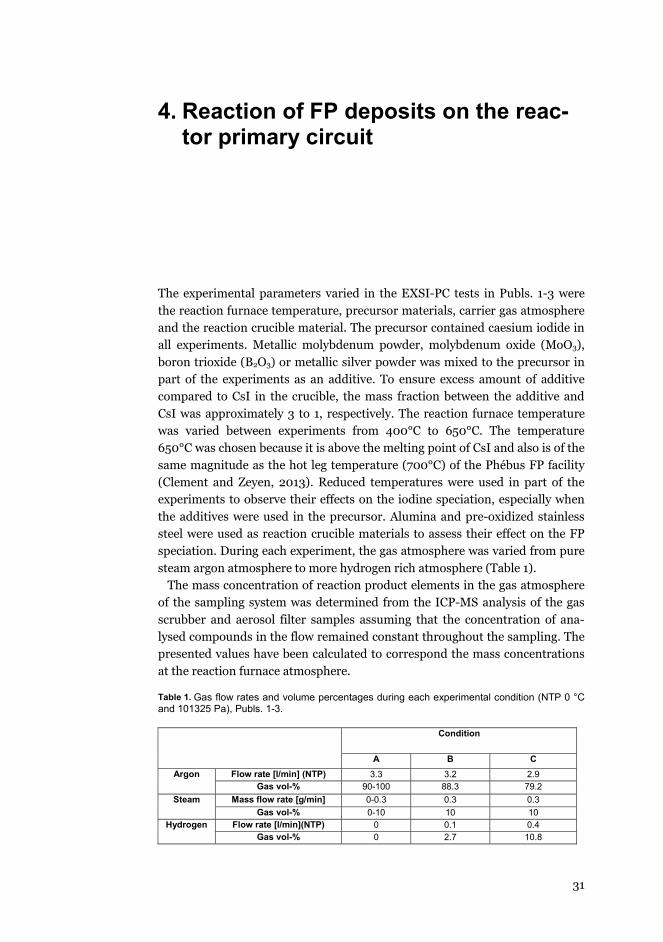
The experimental parameters varied in the EXSI-PC tests in Publs. 1-3 werethe reaction furnace temperature, precursor materials, carrier gas atmosphere and the reaction crucible material. The precursor contained caesium iodide in all experiments. Metallic molybdenum powder, molybdenum oxide (MoO3), boron trioxide (B2O3) or metallic silver powder was mixed to the precursor in part of the experiments as an additive. To ensure excess amount of additive compared to CsI in the crucible, the mass fraction between the additive and CsI was approximately 3 to 1, respectively. The reaction furnace temperature was varied between experiments from 400°C to 650°C. The temperature 650°C was chosen because it is above the melting point of CsI and also is of the same magnitude as the hot leg temperature (700°C) of the Phébus FP facility (Clement and Zeyen, 2013). Reduced temperatures were used in part of the experiments to observe their effects on the iodine speciation, especially when the additives were used in the precursor. Alumina and pre-oxidized stainless steel were used as reaction crucible materials to assess their effect on the FP speciation. During each experiment, the gas atmosphere was varied from pure steam argon atmosphere to more hydrogen rich atmosphere (Table 1).
The mass concentration of reaction product elements in the gas atmosphere of the sampling system was determined from the ICP-MS analysis of the gas scrubber and aerosol filter samples assuming that the concentration of ana-lysed compounds in the flow remained constant throughout the sampling. The presented values have been calculated to correspond the mass concentrations at the reaction furnace atmosphere.
Table 1. Gas flow rates and volume percentages during each experimental condition (NTP 0 °C and 101325 Pa), Publs. 1-3.
Condition
A B CArgon Flow rate [l/min] (NTP) 3.3 3.2 2.9
Gas vol-% 90-100 88.3 79.2Steam Mass flow rate [g/min] 0-0.3 0.3 0.3
Gas vol-% 0-10 10 10Hydrogen Flow rate [l/min](NTP) 0 0.1 0.4
Gas vol-% 0 2.7 10.8
31
Reaction of FP deposits on the reactor primary circuit
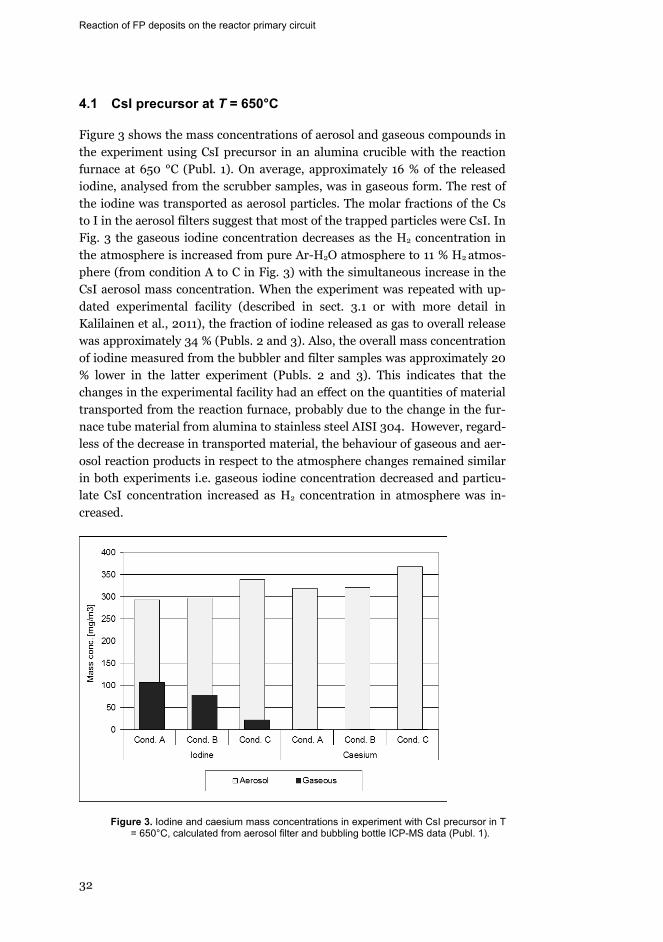
4.1 CsI precursor at T = 650°C
Figure 3 shows the mass concentrations of aerosol and gaseous compounds inthe experiment using CsI precursor in an alumina crucible with the reaction furnace at 650 °C (Publ. 1). On average, approximately 16 % of the released iodine, analysed from the scrubber samples, was in gaseous form. The rest of the iodine was transported as aerosol particles. The molar fractions of the Cs to I in the aerosol filters suggest that most of the trapped particles were CsI. In Fig. 3 the gaseous iodine concentration decreases as the H2 concentration in the atmosphere is increased from pure Ar-H2O atmosphere to 11 % H2 atmos-phere (from condition A to C in Fig. 3) with the simultaneous increase in the CsI aerosol mass concentration. When the experiment was repeated with up-dated experimental facility (described in sect. 3.1 or with more detail in Kalilainen et al., 2011), the fraction of iodine released as gas to overall release was approximately 34 % (Publs. 2 and 3). Also, the overall mass concentration of iodine measured from the bubbler and filter samples was approximately 20 % lower in the latter experiment (Publs. 2 and 3). This indicates that the changes in the experimental facility had an effect on the quantities of material transported from the reaction furnace, probably due to the change in the fur-nace tube material from alumina to stainless steel AISI 304. However, regard-less of the decrease in transported material, the behaviour of gaseous and aer-osol reaction products in respect to the atmosphere changes remained similar in both experiments i.e. gaseous iodine concentration decreased and particu-late CsI concentration increased as H2 concentration in atmosphere was in-creased.
Figure 3. Iodine and caesium mass concentrations in experiment with CsI precursor in T = 650°C, calculated from aerosol filter and bubbling bottle ICP-MS data (Publ. 1).
32

Reaction of FP deposits on the reactor primary circuit
Besides molecular iodine (I2), gaseous iodine can transport through the RCS in different hydrogen and iodine compounds. The equilibrium in the gas phase:
CsI + H O CsOH + HI (16)
suggests that gaseous hydrogen iodide could be formed in the reaction be-tween CsI and water vapour. If the CsOH is deposited on the surface of the circuit, HI compound can transport through the RCS in gaseous form (NU-REG/CR-6193, 1994). It is assumed that part of the gaseous iodine transported in the EXSI-PC experiments was also in the form of HI. The experimental re-sults indicate that the increase of H2 concentration in the furnace atmosphere decreased the reaction rate of CsI and water vapour to form gaseous iodine compounds (molecular or hydrogen iodide or both).
Particle size distributions from the SMPS measurement from experiment with pure CsI precursor are shown in Fig. 4. Since the flow is rapidly diluted after the reaction furnace, the particles are mostly formed before the dilution and remain small, with geometric mean diameters between 41-43 nm and ge-ometric standard deviation between 1.56-1.57. The particle size data was well represented by log-normal distribution and the gas atmosphere had no clear effect on the resulting particle size. The particle size distribution observed in the EXSI-PC experiments could coincide with a late phase of a severe accident where the main source of aerosol particles is from the re-vaporization of de-posited fission products from the coolant system surfaces.
The cross cut samples, made from the used stainless steel reaction crucibles,were investigated using EDS in Publ. 1. The analysis revealed that after exper-iments, the iron oxide layer of the pre-oxidized reaction crucibles contained iodine, likely originated from the CsI precursor. The layer was found to be wa-ter soluble and it likely contained also a large amount of caesium, which is however very difficult to distinguish from iodine in X-ray spectrum. The chromium oxide layer, located directly below the upper iron layer, seemed almost intact after the experiments. No clear effect of different reaction cruci-ble materials to reaction product release could be determined from the ICP-MS analysis or online aerosol device data.
33

Reaction of FP deposits on the reactor primary circuit
Figure 4. Average particle size distributions during the samplings in experiment with CsI precursor (Publ. 2).
4.2 The effects of molybdenum and boron additives
Figure 5 shows the mass concentration data from the gas scrubber and filter samples when CsI was mixed with B2O3 at T = 650°C (Publ. 1). Most of the reaction products were in gaseous form and the gas scrubbers consisted mostly of iodine and boron. Approximately 98 % of released iodine was gaseous. Large part of the boron shown in Fig. 5 was most likely extracted from the bo-rosilicate scrubber bottles by the bubbler NaOH solution (Green et al., 1976) leaving the amount of boron transported from the reaction furnace undeter-mined. Based on the online SMPS in the filter and gas scrubber measure-ments, particle concentrations stayed very low during the experiment. Even though almost all iodine was released in gaseous form, the overall amount of released gaseous iodine was smaller than in the pure CsI precursor experiment (Fig. 3). During the experiment, a glassy surface was formed on the surface of the stainless steel evaporation crucible and EDS analysis of the surface indi-cated it to be caesium borate glass. The formation of the surface during the experiment likely trapped most of the caesium but also part of iodine, causing the released part to transport almost completely as gas. The formation of cae-sium borate and gaseous iodine was also seen in previous experimental work by Benson (2003) with CsI vapour and B2O3 aerosol at 1000 °C temperature and in dry atmosphere, the chemical reactions between the compounds pro-duced caesium borate (CsBO2) and gaseous iodine (HI and/or I2).
34

Reaction of FP deposits on the reactor primary circuit
Figure 5. Iodine, caesium and boron mass concentrations in experiment with CsI and B2O3 precursor, calculated from aerosol filter and bubbling bottle ICP-MS data (Publ. 1).
With mixed CsI and metallic Mo precursor, the fraction of gaseous iodine of all released iodine was approximately 47 % and 88 %, in experiments with alumi-na and AISI 304 crucibles, respectively (Publ. 1). Exceptionally high gaseous iodine concentration in the gas scrubbers on the latter experiment was partly due to reaction between the precursor and Mo deposits, insufficiently removed from the facility after the first Mo experiment. In Publ. 2 using the updated facility and MoO3 + CsI precursor, the fraction of gaseous iodine of all released iodine was approximately 65 %. The increase in the fraction of gaseous iodine compared to the pure CsI precursor is likely due to oxidized molybdenum and caesium reacting in the crucible to form caesium molybdate, thus allowing more iodine to be released as gas. The production of caesium molybdate from reactions between CsI and Mo with different oxygen potentials has also been shown in severe accident conditions at the reactor core (Götzmann, 1982) or in primary circuit conditions (Gouello et al., 2013).
The behaviour of gaseous iodine concentration regarding the H2 atmospherein experiments with the boron, Mo (Publ. 1) and MoO3 (Publ. 2) at T = 650°Cwas similar to what was already seen with pure CsI precursor. As the amount of H2 in the atmosphere is increased, the gaseous iodine concentration in the scrubbers decreases. In Publ. 1, chemical equilibrium calculations were per-formed using Mo, Cs and I in atmospheric conditions similar to the ones used in the experiments (Fig. 6). The computations showed that the fraction of gas-eous I, I2 and HI decrease in more H2 rich atmosphere, which is what the ex-perimental results also indicated.
In the experiments with both metallic Mo and molybdenum oxide (Publ. 1 and 2), also small number of Mo was found from the filter samples. Based on I to Cs ratios in the filters, most of the Mo had probably transported as molyb-denum oxide rather than as caesium molybdate. Similar behaviour was also
35

Reaction of FP deposits on the reactor primary circuit
indicated by the equilibrium calculation shown in Fig. 6. However, large disa-greement between the concentrations from simulations and experimental data indicates that the equilibrium calculations are too simplified to represent the conditions inside the reaction furnace. More complex numerical tools like ki-netics models would need to be used for the accurate simulation of the results.
Figure 6. Mole fractions of different compounds formed at 650 °C with Mo and CsI (with mass fractions 3 to 1, respectively) as precursor materials in different gas atmos-pheres (Publ. 1).
4.3 The effects of reduced temperature
When the temperature of the pure CsI precursor was reduced to T = 550°C, the overall release of iodine dropped to 5 % of the level observed at T = 650°C (Publ. 3). However, when the CsI + MoO3 precursor at T = 400°C was used (Fig. 7), a substantial amount of gaseous iodine was observed even though the aerosol release remained low (Publ. 2). With CsI and silver precursor at tem-perature 650 °C, the fraction of the gaseous to overall released iodine was 15 % but as the temperature was reduced 400 °C (Publ. 3), over 99% of the released iodine was in gaseous form demonstrating similar behavior as the MoO3 + CsI precursor. The experiments conducted at 400 °C indicated that even thoughthe amount of CsI release from the precursor is greatly reduced in lower tem-peratures, the reactions between the additives and CsI can still result in anincrease of gaseous I release compared to the experiments with pure CsI pre-cursor at lowered temperature.
36
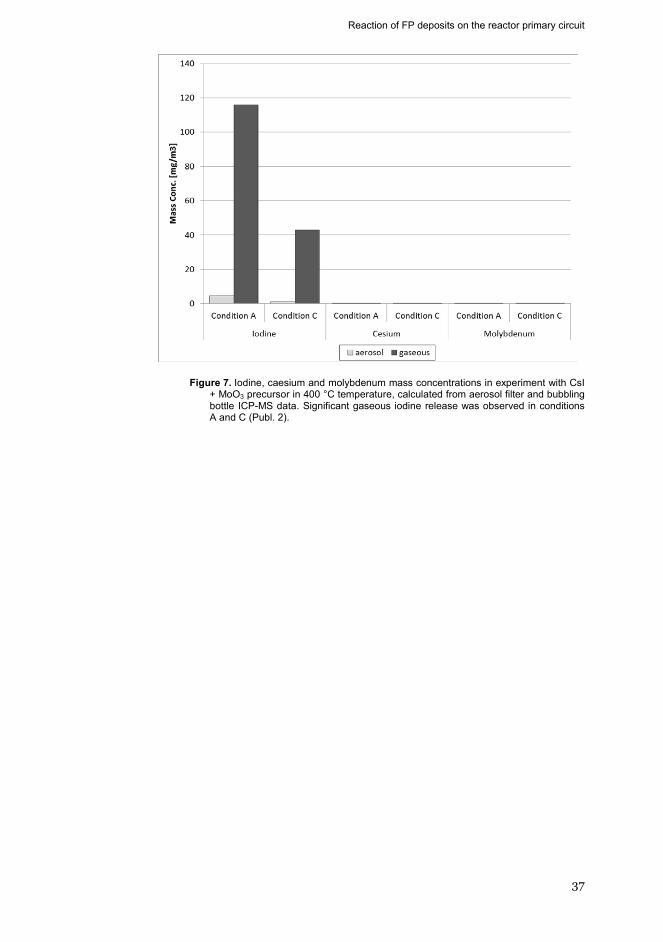
Reaction of FP deposits on the reactor primary circuit
Figure 7. Iodine, caesium and molybdenum mass concentrations in experiment with CsI + MoO3 precursor in 400 °C temperature, calculated from aerosol filter and bubbling bottle ICP-MS data. Significant gaseous iodine release was observed in conditions A and C (Publ. 2).
37

5. FP aerosol transport in the contain-ment
This chapter describes the results of the DIANA experiments and the LES and particle tracking simulations. In the presentation of results, origin was placed at the hot-bottom corner of the cavity with x-axis pointing to the horizontal, y-axis to the vertical and z-axis to the lateral direction (shown in Fig. 2). A coor-dinate system used has 0 m x,y,z m indicating that i.e. hot and cold walls are located at x = 0 m and x = 0.7 m, bottom and top walls at y = 0 m and y = 0.7 m and front and back walls at z = 0 m and z = 0.7 m, respectively.
5.1 Flow field and temperature distribution
The wall temperatures in DIANA cavity were measured at the lateral centre (z= 0.35 m) at 11 different locations at horizontal and isothermal walls. The temperature profiles from the horizontal walls were used later as boundary conditions in the computational work. The average hot and cold wall tempera-tures in the DIANA cavity were Th = 330.6 ± 0.4 K and Tc = 291.3 ± 0.4 K giv-ing a temperature difference T = Th – Tc = 39.3 ± 0.8 K. The Rayleigh num-ber of the flow in DIANA, calculated using Eq. (1) and the values shown in Ta-ble 2, was approximately Ra = 109.
Table 2. Reference fluid and cavity properties at approximately T = Tr used in Ra number calcu-lation and in the numerical simulations. Tr is the reference temperature obtained from the aver-age isothermal wall temperatures (Th + Tc)/2 (Publ. 4).
symbol valueg 9.81 m/s2
r 3.21E-3 1/KT 39.3 K
L 0.7 mr 1.659E-5 m2/sr 2.36E-5 m2/sr 1.138 kg/m3
In the LES simulations, the computational grid consisted of approximately four million hexagonal cells, with mesh clustering in the wall regions to properly resolve the boundary layer. The Dynamic Kinetic Energy subgrid scale model (Kim and Menon, 1997), embedded in the software, was used as a closure. The measured temperatures at the isothermal walls were used as
38
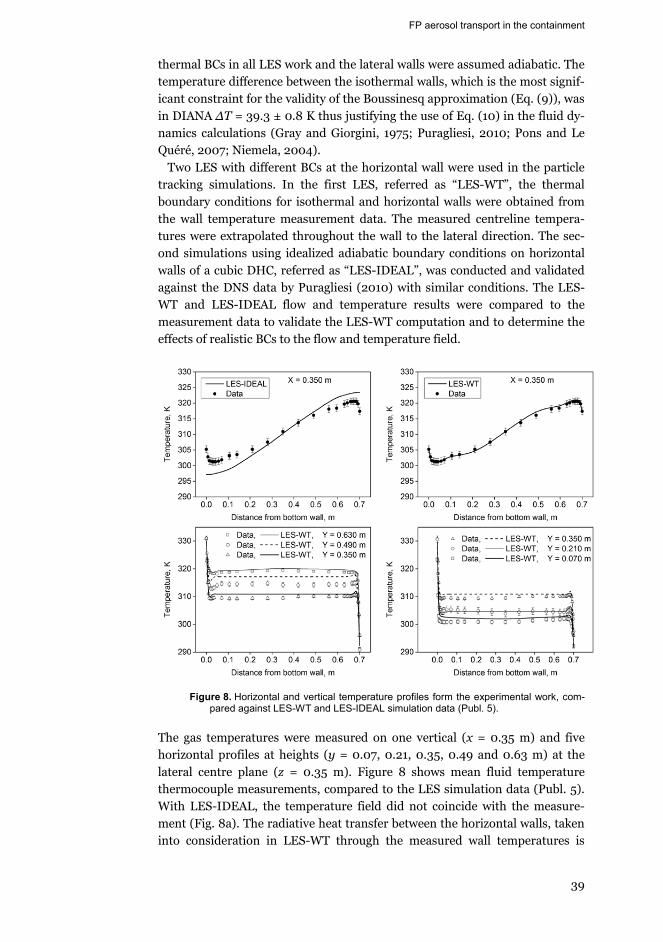
FP aerosol transport in the containment
thermal BCs in all LES work and the lateral walls were assumed adiabatic. The temperature difference between the isothermal walls, which is the most signif-icant constraint for the validity of the Boussinesq approximation (Eq. (9)), was in DIANA T = 39.3 ± 0.8 K thus justifying the use of Eq. (10) in the fluid dy-namics calculations (Gray and Giorgini, 1975; Puragliesi, 2010; Pons and Le Quéré, 2007; Niemela, 2004).
Two LES with different BCs at the horizontal wall were used in the particle tracking simulations. In the first LES, referred as “LES-WT”, the thermal boundary conditions for isothermal and horizontal walls were obtained from the wall temperature measurement data. The measured centreline tempera-tures were extrapolated throughout the wall to the lateral direction. The sec-ond simulations using idealized adiabatic boundary conditions on horizontal walls of a cubic DHC, referred as “LES-IDEAL”, was conducted and validated against the DNS data by Puragliesi (2010) with similar conditions. The LES-WT and LES-IDEAL flow and temperature results were compared to the measurement data to validate the LES-WT computation and to determine the effects of realistic BCs to the flow and temperature field.
Figure 8. Horizontal and vertical temperature profiles form the experimental work, com-pared against LES-WT and LES-IDEAL simulation data (Publ. 5).
The gas temperatures were measured on one vertical (x = 0.35 m) and five horizontal profiles at heights (y = 0.07, 0.21, 0.35, 0.49 and 0.63 m) at the lateral centre plane (z = 0.35 m). Figure 8 shows mean fluid temperature thermocouple measurements, compared to the LES simulation data (Publ. 5).With LES-IDEAL, the temperature field did not coincide with the measure-ment (Fig. 8a). The radiative heat transfer between the horizontal walls, taken into consideration in LES-WT through the measured wall temperatures is
39

FP aerosol transport in the containment
lacking in LES-IDEAL, thus resulting in inaccurate temperature and flow fields. The simulated LES-WT vertical temperature profile coincides well with the DIANA measurement (Fig. 8b), showing the increase and decrease of tem-perature when reaching the close vicinity of the bottom and top walls, respec-tively. This is caused by the thermal radiation between the cavity walls and differs significantly from DHCs with perfectly adiabatic boundaries in the ab-sence of radiation (like is the case with LES-IDEAL). In the latter case, the horizontal wall temperature is only influenced by the temperature of the cold or hot fluid transported due to convection from the isothermal vertical walls.
Figure 9. a) The velocity magnitude and b) turbulence intensity maps at DIANA cavity mid-plane, obtained from the PIV data. The figure shows I contours with mean ve-locity greater than 5% of the maximum mean velocity at the centre plane (Publ. 4).
The measured horizontal mean temperature profiles at heights y = 0.21 m and 0.63 m (Figs. 8c and 8d) coincide well with the simulations. At the height y =0.49 m, the measured temperature is overall at lower level compared to the simulation results. On the other hand, in the vertical temperature profile measurement, performed earlier at the cavity mid-weight, the temperatures at y = 0.49 m seem to match fairly well with the simulation data. This variation in the temperature measurements can be due to changes at the front cavity wall between the different gas temperature profile measurements. During the temperature measurements, the front glass walls were replaced with polyure-thane insulators, which again differed between different profiles to ensure the correct placement of the thermocouple. This could lead to variation in a front wall thermal boundary condition between the gas temperature measurementsand can thus have a small effect on the temperature field of the whole enclo-sure, causing the discrepancies shown in Figs. 8c and 8d.
In the PIV measurement, the x-y plane of the DIANA cavity situated at 330 mm from the front adiabatic wall was divided into 16 200 × 200 mm imaging areas which all were measured separately. 1200 PIV vector field measurements were performed at each imaging area and the measurement data was used to compute the mean velocity components and root mean square (rms) velocities.In addition, at the imaging areas near the walls multiple measurements usingdifferent t values were conducted in order to assure accurate presentation of both the slowly moving cavity centre and the faster moving flow near the walls.PIV allowed accurate and relatively fast measurement of the whole x-y plane of
40

FP aerosol transport in the containment
the DIANA cavity with good spatial resolution (423 × 422 measurement points).
Figure 9a shows the velocity magnitude contours at the centre plane of the cavity (Publ. 4). The main flow is circulating the cavity near the isothermal vertical walls and horizontal top and bottom walls. The flow reaches its highest velocity near the isothermal walls (approximately 0.23 m/s at y = 0.35 m near the hot wall). The turbulence intensity It gives the ratio of the magnitude of fluctuating flow velocity to the magnitude of mean flow velocity:
= . (17)
The turbulence intensity map from the PIV measurements is shown in Fig. 9b(Publ. 4) and it is roughly 10-50 % for the circulating flow regions where the fluid mean velocity is greater than 5% of the maximum mean velocity. This suggests that the circulating flow in the DIANA cavity is turbulent throughout the lateral centre plane where the PIV measurement was performed.
Figure 10. Comparison between PIV measurement of mean vertical and horizontal ve-locity components and LES-WT simulation (Publ. 5). The uncertainty of the mean velocity PIV data, calculated from the sample of PIV measurements was less than 1 % with 95 % confidence level in all measurement points.
41

FP aerosol transport in the containment
Compared to the PIV measurement data (Fig. 10, Publ. 5), the mean velocity field was reproduced accurately by the LES-WT simulation. The observed flow properties, such as the recirculating opposite flow near the horizontal walls, were captured by the simulation. The comparison of rms of the velocity com-ponents from the measurement and the simulation is shown in Fig. 11. With the exception of the low horizontal rms values, the simulation was mostly within 30 % of the measured values.
All in all, the results from the temperature and velocity field comparison in-dicated that the LES-WT model was able to accurately represent the flow field inside the DIANA cavity. On the other hand, the velocity and temperaturefields obtained from the LES-IDEAL did not coincide well with the PIV meas-urement or with the LES-WT data. Also, the level of turbulence in LES-IDEAL was considerably lower compared to LES-WT with the turbulent flow mainly situated at the hot-bottom and cold-top corners of the cavity.
Figure 11. Rms of velocity along horizontal and vertical profiles from PIV measurements and LES-WT simulations (Publ. 5).
42

FP aerosol transport in the containment
5.2 Particle deposition experiments
Nine experiments were conducted with different particle sizes and altering the laser and TEOM measurement locations. The experimental matrix is described in Table 3. The change in the airborne particle concentration due to deposition was investigated in experiments 1-5 and 7-9. Laser intensity measurements consisted of one horizontal plane at y = 0 m and three vertical planes near the lateral centreline z = 0 m, shown in Fig. 2 (Note: the actual lateral placement of the sheet was approximately at z m in order to avoid a light reflection from the particle seeding tube located at the bottom of the cavity). The condi-tions in experiment 5 were similar to experiment 1 except for the dry air inject-ed to the cavity before the particle seeding commenced, thus resulting in alower humidity atmosphere in the cavity during the experiment. The place-ment of the TEOM sampling and the deposition slides are shown in Table 3.
In the laser intensity measurements, the CCD camera was placed approxi-mately at y = 0.35 m with sufficient distance from the DIANA cavity so that the whole laser measurement plane, depicted in Fig. 2, could be fitted to the image. With dp = 1 μm particles, the reflected light intensity in the CCD camera images was quite even at the whole measurement plane. However, when dp =2.5 μm particles were used the CCD camera images showed considerably lower intensity at the vicinity of vertical (or horizontal) locations y(/z) = 0.21 m and 0.49 m. This was due to change in the Mie scattering intensities to different scattering angles as the particle size was increased (Baron et al., 2011). TheMie scattering effect added to the smaller overall number concentration from the seeding with 2.5 μm particles leading to smaller number of spatial loca-tions where the change in light intensity could be analysed, compared to the experiments with smaller particles. The particle depletion was investigated with dp = 1 μm particles at vertical locations y = 0.14, 0.21, 0.35, 0.49, 0.63 mand at spatial locations z = 0.07, 0.21, 0.35, 0.49, 0.63 m. With dp = 2.5 μm particles, only vertical locations y = 0.14, 0.35 and 0.63 m were investigated.
Table 3. Experimental matrix for the particle concentration measurements (Publ. 4).
experiment number
particle diameter [μm]
laser measure-ment plane
TEOM sam-pling approx. (x,y,z) [m]
deposition slide location (x,y,z) [m]
seeding time [min]
1 1 xz hot (0.65,0.14,-) (0.35,0,0.35) 202 1 xy hot (0.65,0.14,0.63) (0.35,0,0.35) 153 1 xy centre (0.65,0.14,0.63) (0.35,0,.0.42) 154 1 xy cold (0.49,012,0.63) (0.35,0,0.35) 155 1 xz hot (0.49,012,0.63) (0.35,0,0.35) 156 2.5 xz hot (0.65,0.14,-) (0.35,0,0.35) 157 2.5 xy hot (0.49,0.12,0.63) (0.35,0,0.35) 208 2.5 xy centre (0.49,0.12,0.63) (0.35,0.0.42) 209 2.5 xy cold (0.49,0.12,0.63) (0.35,0,0.35) 20
In addition, the lateral distribution of particles was investigated in experi-ments 1 and 6 by moving the camera and the TEOM sampler to different loca-tions along the lateral z-axis and investigating the change in light intensity from 90° angle and mass concentration, respectively. The maximum relative difference in the lateral particle distribution from the laser intensity measure-ment between the measurement points was found to be 2 % for dp = 1 μm and 1
43

FP aerosol transport in the containment
% for dp = 2.5 μm particles. For the TEOM measurement, the corresponding value was 1 % for both particle sizes. This leads us to conclude that the mixing of the turbulent flow in DIANA cavity caused the lateral distribution of parti-cles to stay almost uniform after the particle seeding and during the laser in-tensity and TEOM measurements.
From the deposition samples, approximately 600-1600 particles were count-ed in each of the dp = 1 μm and 100-180 in dp = 2.5 μm particle experiments, respectively. The fractions of single particles were between 69-74 % and be-tween 89-95 % with particle sizes dp = 1 μm dp = 2.5 μm, respectively. The av-erage multiplets contained 2 single particles. Since the deposition of larger particles compared to single 1 μm particles from the cavity atmosphere is fast-er, it is reasonable to deduce that in the measurements with the smaller parti-cles, the fraction of single particles in the cavity atmosphere at the beginning of the experiment is well over 70 %. Similarly, the fraction of singlets in 2.5 μmparticle measurements can be assumed to be over 90 %, indicating that the depletion measurements accurately represent the deposition rate of single par-ticles with both particle sizes.
Table 4. Average decay constants from the laser intensity and mass concentration measure-ments with 95 % confidence interval (Publ. 4), from the particle tracking simulations (Publ. 5)and form the stirred settling calculation using Eq. (22).
Dp = 1 μm dp = 2.5 μmAverage , TEOM [s] 5220 ± 190 s 1100 ± 90 sAverage , laser intensity [s] 4970 ± 60 s 1800 ± 80 sLES-WT-CRW tp ON 4890 s 1510 sLES-WT-CRW tp OFF 5060 s 1520 sLES-WT tp (1 μm ON) (2.5 μm OFF) 5530 s 1610 sLES-IDEAL-CRW tp ON 6360 s 1860 sLES-IDEAL-CRW tp OFF 6920 s 1840 sTheoretical Stirred Settling (Hinds, 1999) 10210 s 1780 s
In particle deposition measurements, exponential curves were fitted to the measurement data at the analysis points to estimate the concentration change rate of airborne particles. For N measurements of mass concentration or light intensity ( ), ( = 1,2 … ), the method of least squares was used to obtain the estimation ( ):( ) = ( ± ) ( ± ) . (18)
The 95 % confidence intervals for parameters and are defined as (Milton and Ar-nolds, 1990):
= 1.96 × ( ) ,ln( ) = 1.96 × ( ) , (19)= ( ) ( ( ) ) .
The decay constant is the particle deposition rate in unit time. The time con-stant of deposition is defined as:
44

FP aerosol transport in the containment
= . (20)
From the experiments with 1 μm and 2.5 μm particle the time constant was determined at 25 and 15 analysis points, respectively. With respect to the par-ticle size, the time constants changed only little between different analysis points. The average time constant from laser intensity measurements as well as from the TEOM measurements for both particle sizes are shown in Table 4.
5.3 Particle charge measurement results
Figure 12a shows the number concentration and current at the impactor stage with d50 in the measurement using dp = 1 μm particles with time t = 0 s indicating the start of the particle seeding. The initial particle concentration in the cavity before the seeding was very low (N < 1 #/cm3). The flow rate through the impactor was approximately Q = 9.71 l/min. The approximate number of elementary charges in a particle with dp = 1 μm, calculated using Eq. (8), is shown in Fig. 12b. The number of elementary charges decreases with time as the particles are slowly neutralized in the air atmosphere. After the seeding, the number of charges decreased approximately from 8 to 4 ele-mentary charges per particle. An average number of elementary charges in a particle in Boltzmann equilibrium charge distribution is (Hinds, 1999):
2.37 /10 6. (21)
Based on the measurement with dp = 1 μm particles, if the decrease in charge continues as shown in Fig. 12b at the beginning of the concentration meas-urement (t = 3600 s) the number of charges per particle would be close to nave
2.37, indicating that the effect of particle charge on the deposition in DIANA is minimal. With dp = 2.5 μm particles, the number of elementary charges dropped in approximately 780 s after the seeding stopped from 120 to 12 (measurement data shown in Publ. 4).
45

FP aerosol transport in the containment
Figure 12. a) Number concentration and current from ELPI and b) calculated number of elementary charges per dp = 1 μm particle (Publ. 4).
5.4 Particle tracking simulations
Lagrangian particle tracking calculations were performed using both LES-WT and LES-IDEAL cavity models (described in section 5.1), with thermophoretic force either included or excluded. The simulations using the continuous ran-dom walk method are indicated in the naming with the ending “CRW”. The abbreviation “tp ON/OFF” indicates that the thermophoretic force is eitherconsidered or ignored in the computations, respectively. The matrix of the performed simulations is shown in Table 5.
Table 5. Simulation matrix for the particle tracking computations. Number of particle used, ap-proximate computation time and the consideration of thermophoresis (tp ON or OFF indicating thermophoresis considered or discarded, respectively).
number of particle
thermophoretic force considered
computation ended [s]
1 μm particles LES-IDEAL-CRW tp ON 10000 Yes ~6300LES-IDEAL-CRW tp OFF 10000 No ~6300LES-WT-CRW tp ON 10000 Yes ~6300LES-WT-CRW tp OFF 10000 No ~6300LES-WT tp ON 10000 Yes ~10002.5 μm particleLES-IDEAL-CRW tp ON 10000 Yes ~2300LES-IDEAL-CRW tp OFF 10000 No ~2300LES-WT-CRW tp ON 10000 Yes ~2300LES-WT-CRW tp OFF 10000 No ~2300LES-WT tp OFF 100000 No ~1700
The simulations showed that the movement of an individual particle is greatly influenced by the turbulent flow encircling near the cavity isothermal vertical and horizontal walls. In addition to the movement taking place at the x-y
46

FP aerosol transport in the containment
plane, the particles can leave the main circulation loop near the walls and drift in the lateral direction. This allows the particles to stay approximately uni-formly distributed in the cavity atmosphere, which was also observed in the measurement of the lateral particle distribution (section 5.2). The time con-stants from the simulations are shown in Table 4.
Figure 13. Comparison of airborne concentrations and wall deposition from LPT simula-tions using CRW and pure LES with dp =2.5 μm particles.
Pure LES particle tracking data was compared to the corresponding CRW cal-culation with both particle sizes to validate the CRW model in the particular case of cubical differentially heated cavity. With dp = 2.5 μm particles, the dep-osition rates obtained with LES-WT and LES-WT-CRW computations were very similar (Fig. 13a). In addition, distributions of particles deposited to dif-ferent cavity walls produced with both methods, shown in Fig. 13b, matched with good accuracy. Due to limited computing resources, only 1000 second
47
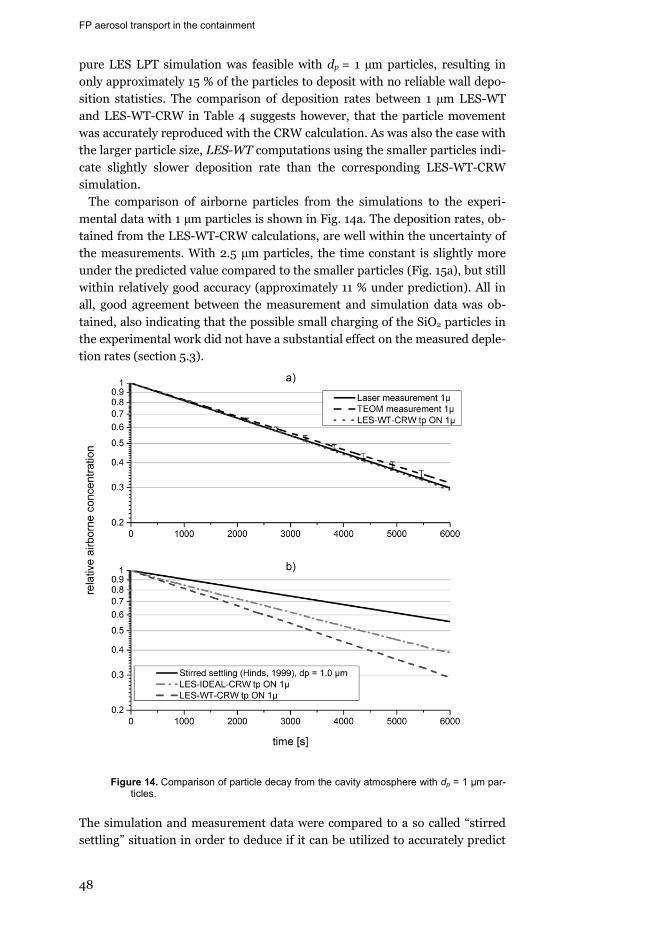
FP aerosol transport in the containment
pure LES LPT simulation was feasible with dp = 1 μm particles, resulting inonly approximately 15 % of the particles to deposit with no reliable wall depo-sition statistics. The comparison of deposition rates between 1 μm LES-WT and LES-WT-CRW in Table 4 suggests however, that the particle movement was accurately reproduced with the CRW calculation. As was also the case with the larger particle size, LES-WT computations using the smaller particles indi-cate slightly slower deposition rate than the corresponding LES-WT-CRW simulation.
The comparison of airborne particles from the simulations to the experi-mental data with 1 μm particles is shown in Fig. 14a. The deposition rates, ob-tained from the LES-WT-CRW calculations, are well within the uncertainty of the measurements. With 2.5 μm particles, the time constant is slightly more under the predicted value compared to the smaller particles (Fig. 15a), but still within relatively good accuracy (approximately 11 % under prediction). All in all, good agreement between the measurement and simulation data was ob-tained, also indicating that the possible small charging of the SiO2 particles in the experimental work did not have a substantial effect on the measured deple-tion rates (section 5.3).
Figure 14. Comparison of particle decay from the cavity atmosphere with dp = 1 μm par-ticles.
The simulation and measurement data were compared to a so called “stirred settling” situation in order to deduce if it can be utilized to accurately predict
48

FP aerosol transport in the containment
particle depletion in the case of a turbulent DHC flow. In the stirred settling case, particles are kept uniformly distributed in a cubic volume with side length L, and are deposited only through gravitational settling to the enclosure floor (Hinds, 1999). The decay constant for the stirred settling TS can be calcu-lated using equation:= . (22)
The terminal settling velocity vTS is:
= , (23)
where g is the gravitational acceleration, CC is the slip correction factor and g
and g are the kinematic viscosity and density of the gas, respectively. By using the values from Table 2 and the approximate slip correction factor values for 1 μm and 2.5 μm particles of 1.2 and 1.08, respectively, the settling velocities for dp = 1 μm and dp = 2.5 μm particles used in the experiments are vTS(1μ) =6.9×10⁻⁵ m/s and vTS(2.5μ) = 3.9×10⁻⁴ m/s and time constants (Eq. (20)) TS(1μ) =10210 s and TS(2.5μ) = 1784 s, respectively. The deposition rates using TS for dp
= 1 μm and dp = 2.5 μm are shown in Figs. 14b and 15b, respectively.
Figure 15. Comparison of particle decay from the cavity atmosphere with dp = 2.5 μm particles.
49
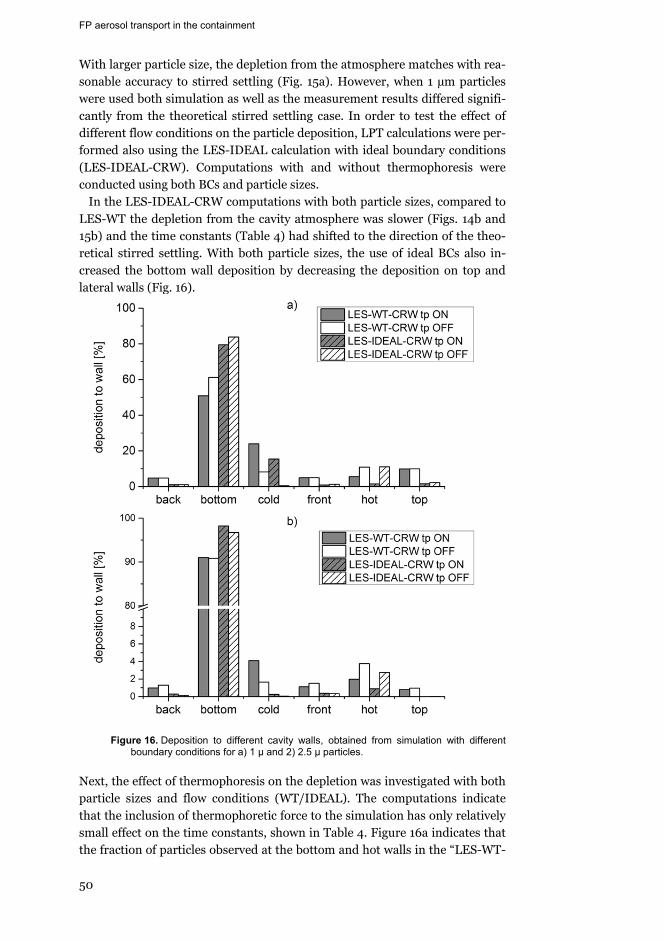
FP aerosol transport in the containment
With larger particle size, the depletion from the atmosphere matches with rea-sonable accuracy to stirred settling (Fig. 15a). However, when 1 μm particles were used both simulation as well as the measurement results differed signifi-cantly from the theoretical stirred settling case. In order to test the effect of different flow conditions on the particle deposition, LPT calculations were per-formed also using the LES-IDEAL calculation with ideal boundary conditions(LES-IDEAL-CRW). Computations with and without thermophoresis were conducted using both BCs and particle sizes.
In the LES-IDEAL-CRW computations with both particle sizes, compared to LES-WT the depletion from the cavity atmosphere was slower (Figs. 14b and 15b) and the time constants (Table 4) had shifted to the direction of the theo-retical stirred settling. With both particle sizes, the use of ideal BCs also in-creased the bottom wall deposition by decreasing the deposition on top and lateral walls (Fig. 16).
Figure 16. Deposition to different cavity walls, obtained from simulation with different boundary conditions for a) 1 μ and 2) 2.5 μ particles.
Next, the effect of thermophoresis on the depletion was investigated with both particle sizes and flow conditions (WT/IDEAL). The computations indicate that the inclusion of thermophoretic force to the simulation has only relatively small effect on the time constants, shown in Table 4. Figure 16a indicates that the fraction of particles observed at the bottom and hot walls in the “LES-WT-
50
FP aerosol transport in the containment
CRW tp OFF” case with 1 μm particles was due to thermophoresis, deposited at the cold wall in the “LES-WT-CRW tp ON” case. On the rest of the walls, the deposition was not considerably altered by the thermophoretic force. With the 2.5 μm particles, similar to the smaller particle size, thermophoresis only seems to effect on the distribution of deposited particle on different cavity sur-faces. In contrast to the 1 μm case, the fraction of particles deposited on the bottom wall is almost independent of the thermophoresis and only the hot and cold walls are affected.
Due to thermophoretic force, particles close to the cold wall are able to de-posit on it, thus reducing the number of particle close to the cavity boundary as the mean flow turns at the cold bottom wall corner. As would be expected, the effect is more evident with smaller particle size, also reducing their deposi-tion to the cavity floor. The larger particles, owing to their larger settling veloc-ity, are able to migrate through the boundary layer as being carried by the flow over the bottom wall before the turn at the hot corner. Therefore with the larg-er particle size, deposition is mainly reduced at the hot wall, where the ther-mophoretic force is repulsive.
The results from the LES-IDEAL-CRW simulations indicated that the change in the flow structure inside the cavity and in some part the overall decrease of turbulence did have an effect on the deposition rate of the particles, especially in the case of the smaller 1 μm particles. Similar results on the effect of in-creased turbulence on the particle depletion rate have been observed previous-ly in experimental investigations using cavities with forced convective flow. In their work using fan mixers or ventilation to induce the turbulent flow in a cavity, Okuyama et al. (1986), Shimada et al. (1989) and Nomura et al. (1997) observed that increase in the fan rotation or in ventilation flow rate increased the particle decay time constant. The change induced by LES-IDEAL-CRW on the turbulence and on the flow in general did not however, fully explain the over two times faster than stirred settling deposition rate seen in the 1 μ meas-urement and simulations. In addition, the thermophoresis had almost no in-fluence on the particle deposition rates and only changed the distribution of deposition on different cavity walls.
51

6. Summary
Nuclear safety research focuses on improving the nuclear power plant safety in normal operation as well as in different accident scenarios. Severe accident research studies the phenomena taking place when the fuel is damaged and radioactive fission products, nuclear fuel materials and other core materials are released to the reactor coolant system. In this thesis, specific phenomenaconcerning the materials transport inside the primary circuit and in the con-tainment building were investigated.
The materials originated from the damaged reactor core can deposit on the surface of the reactor primary circuit where they can be re-volatilized by, for example, the changes in the circuit temperature or gas atmosphere. The exper-imental work presented in this thesis focused primarily on the possible effects that the re-volatilization could have on the speciation and transport of iodine. The experiments indicated that even when only pure caesium iodide was used as a precursor at 650°C temperature, significant fraction of iodine was re-leased and transported through the experimental facility as compounds that did not condense to form particles at the approximate temperature of 100°C, most likely as molecular iodine or as hydrogen iodide. As the concentration of H2 in the gas atmosphere was increased the release of CsI aerosol and iodine in gaseous form were increased and decreased, respectively, indicating that the hydrogen affected the reaction rate of CsI and H2O to form different volatile iodine species. When additives like boron, molybdenum of silver were added to the precursor, the release of gaseous iodine was increased compared to the pure CsI precursor. Especially with the boron additive, the formation of caesi-um borate glass trapped almost all caesium to the surface of the reaction cru-cible, modelling the primary circuit surface, causing almost all of the released iodine to be transported to the facility in the gas phase. Also with molybdenum additive, the release of gaseous iodine increased, probably due to reaction be-tween of part of the Cs and Mo in the reaction crucible to form caesium mo-lybdate. In addition, the results from the experiments performed under the melting temperature of CsI indicated that the use of a precursor containing an additive, especially molybdenum oxide, increased the release of gaseous iodine significantly. It should be considered however, that the experiments presented in this thesis are only investigating the reactions of specific fission product species or other core materials in limited number of atmospheric conditions. In realistic severe accident conditions the number and composition of different
53
Summary
materials, temperature boundary conditions as well as flow and atmospheric conditions in the circuit are much more complex than what has been consid-ered in this study. For this reason, more conclusive analysis and experimental work is still needed for better identification of the effects by reactions on pri-mary circuit surface on the gaseous iodine transport during realistic severe accident conditions.
The transport and deposition of core material containing aerosol particles in the containment can have significant consequences on the source term of radi-oactivity to outside the plant in accident conditions. The experimental and numerical work presented in this thesis concentrated on the particle depletion in a cubic enclosure, where the particle transport is dominated by a turbulent natural convection. The enclosure had two isothermal vertical walls with tem-perature difference inducing a turbulent flow encircling the cavity near the vertical and horizontal cavity walls. The depletion study was conducted using monodisperse silica particles with diameters 1 and 2.5 μm. The experimental work indicated that with both particle sizes, the particles stayed approximately uniformly distributed in the cavity atmosphere resulting to approximately uni-form deposition rates at the entire enclosure. In the numerical work, the flow and temperature inside the cavity was accurately produced using large eddy simulation with horizontal wall temperature boundary conditions obtained from the experimental facility. The LES was utilized in Lagrangian particle tracking simulations which displayed particle depletion in good agreement with the experimental results. Both measurement data and the particle track-ing simulation results using realistic boundary conditions showed that com-pared to the larger particle size, the decay of smaller particles from the cavity atmosphere is more prominently mis-predicted by the theoretical stirred set-tling model. The use of validated large eddy simulation with ideal adiabatic boundary conditions at the horizontal walls for the particle tracking computa-tions resulted on slower particle decay compared to the simulation using real-istic boundary conditions. These results indicated that the flow structure and in some extent the turbulence level have significant effects on the deposition in a differentially heated cavity, especially for micron sized particles. The de-pendence of the deposition rate on the flow conditions indicate that the stirred settling model is not applicable for describing the particle depletion in theDHC arrangement presented in this study. The Rayleigh number of the flow considered in this study is small compared to one at realistic containment ge-ometries and the results shown in this thesis serve as a scoping investigation on the importance of turbulent natural convection on particle depletion rate in a cavity flow. Since the Rayleigh number is proportional to the cube root ofcavity length L (Eq. (1)), the cavities at the size range of reactor containment building would have much larger Ra number (for example using values from Table 2 and L = 10 m gives Ra approximately 3 × 10¹²) and thus larger turbu-lence level and different flow conditions. For results applicable to reactor con-tainment building sizes, more tests with different boundary conditions will be required.
54

Summary
The understanding of the different phenomena taking place in severe acci-dent conditions can be used in the prevention and mitigation of such events. The results from both of the presented studies can be utilized in testing and further development of the severe accident simulation tools. In the case of re-volatilization of iodine on the surface of the primary circuit, unexpectedly large gaseous iodine release, especially when additives such as molybdenum or bo-ron are present, can have an effect on the understanding of iodine behaviour in the containment building and further to iodine source term. The chemical re-actions taking place at the primary circuit surface are not currently considered in severe accident codes but which based on the results shown above, can in some condition have an effect on the FP release and transport. The experi-ments on particle depletion showed that, with natural convective flow in dif-ferentially heated cavity geometry with 1-2.5 μm particles, the sedimentation is not sufficient to describe the depletion even in the cavity core where the cir-cling flow does not seem to have an imminent effect on particle movement. For this reason, simulation tools applying the stirred settling model on the stag-nated regions in an enclosure with natural convective flow at the boundary regions are not able to accurately estimate particle depletion to the cavity walls. In future work, the results from the particle depletion study could be compared with computations by severe accident code like MELCOR or ASTECusing similar condition as presented in this study. With this way the capability of these codes to accurately predict the particle depletion can be investigated.
55


References
Adrian, R. J., Westerweel, J., 2011. Particle image velocimetry. Cambridge University Press, New York.
Akbar, M. K., Rahman, M., Ghiaasiaan, S. M., 2009. Particle transport in a small square enclosure in laminar natural convection. J. Aerosol Sci. 40, 747-761.
Ampofo, F., Karayiannis, T. G., 2003. Experimental benchmark data for turbulent natural convection in an air filled square cavity. Int. J. Heat Mass Transfer 46, 3551-3572.
Arts, T., Boerrigter, H., Carbonaro, M., Charbonnier, J-M., Degrez, G., Olivari, D., Riethmuller, M. L., Van den Braembussche, R. A., 1994. Measurement tech-niques in fluid dynamics. An introduction. Von Karman institute, D/1994/0238/417.
Auvinen, A., Lehtinen, K., Enriques, J., Jokiniemi, J., Zilliacus, R., 2000. Vaporization rates of CsOH and CsI in conditions simulating a severe nuclear accident. J. Aerosol Sci. 9, 1029-1043.
Auvinen, A., Jokiniemi, J., Lähde, A., Routamo, T., Lundström, P., Tuomisto, H., Dienstbier, J., Güntay, S., Suckow, D., Dehbi, A., Slootman, M., Herranz, L., Peyres, V., Polo, J., 2005 Steam generator tube rupture (SGTR) scenarios. Nucl. Eng. Des. 235, 457-472.
Baïri, A., Zarco-Pernia, E., García de Maria, J.-M., 2014. A review on natural convec-tion in enclosures for engineering applications. The particular case of the paral-lelogrammic diode cavity. Appl. Therm. Eng. 63, 304-322.
Bagheri, G. H., Salmanzadeh, M., Golkarfard, V., Ahmadi, G., 2012. Simulation of solid particles behaviour in a heated cavity at high Rayleigh numbers. Aerosol Sci. Technol. 46, 1382-1391.
Baron, P. A., Willeke, K., Kulkarni, P., 2011. Aerosol Measurement, Principles, Tech-niques and Applications. 3rd edition, John Wiley & Sons, inc., Hoboken, New Jersey.
Bejan, A., 2013. Internal natural convection, in: Convection heat transfer, 4th edition. John Wiley & Sons, Somerset, NJ, USA, pp. 233-294.
Belleoud, P., Saury, D., Joubert, P., Lemonnier, D., Djanna, F., 2012. Experimental investigations in an air-filled differentially heated cavity at large Rayleigh Num-bers. J. Phys. Conf. Ser. 395, 012119.
Benson, C. G., 2003. Fission product vapour/aerosol chemistry in the primary circuit (CHEM). Nuclear science and technology, EU co-sponsored research on reactor safety/severe accidents. Final summary reports – ‘Source term (ST)’ cluster pro-jects, EUR 19963 EN.
Beth, A., Bennett, V., Hsueh, J., 2006. Natural convection in a cubical cavity: implicit numerical solution of two benchmark problems. Num. Heat Transfer, Part A 50, 99-123.
Bosshard, C., 2012. Large Eddy simulation of particle dynamics inside a differentially heated cavity. . Ph.D. thesis, No: 5297, Ecole Polytechnique Federale de Lau-sanne, Lausanne.
57

Bosshard, C., Dehbi, A., Deville, M., Leriche, E., Soldati, A., 2014. Large eddy simula-tion of particulate flow inside a differentially heated cavity. Nucl. Eng. Des. 267, 154-163.
Bowsher, B. R., Dickinson, S., 1986. The interaction of caesium iodide with boric acid: Vapour phase and vapour-condensed phase reactions. UKAEA AEEW – R 2102.
Bowsher, B. R., 1987. Fission-product chemistry and aerosol behaviour in the primary circuit of a pressurized water reactor under severe accident conditions. Proc. Nucl. Energy. 20, 199-233.
Cantrel, L., Louis, F., Cousin, F., 2013. Advances in mechanistic understanding of io-dine behaviour in PHEBUS-FP tests with the help of ab initio calculations. Ann. Nucl. Energy 61, 170-178.
Colomer, G., Costa, M., Cònsul, R., Oliva, A., 2004. Three-dimensional numerical sim-ulation of convection and radiation in a differentially heated cavity using the discrete ordinates method. Int. J. Heat Mass Transfer 47, 257-269.
Clement, B., Hanniet-Girault, N., Repetto, G., Jacquemain, D., Jones, A. V., Kissane,M. P., Von der Hardt, P., 2003. LWR severe accident simulation: synthesis of the results and interpretation of the first Phebus FP experiment FPT0. Nucl. Eng. Des. 226, 5-82.
Clement, B., Zeyen, R., 2013. The objectives of the Phebus FP experimental pro-gramme and main findings. Ann. Nucl. Energy 61, 4-10.
Crowe, C., 2006. Multiphase flow handbook. CRC Press Taylor & Francis Group, Boca Raton, Florida.
Dehbi, A., Suckow, D., Guentay, S., 2001. Aerosol retention in low-subcooling pools under realistic accident conditions. Nucl. Eng. Des. 203, 229-241.
Dehbi, A., 2008. Turbulent particle dispersion in arbitrary wall-bounded geometries: A coupled CFD-Langevin-equation based approach. Int. J. Multiphase Flow 34, 819-828.
Dehbi, A., Aksouh, M., Kalilainen, J., 2013. 2D RANS and LES Simulations of Turbu-lent Flow inside a Differentially Heated Cavity. In NURETH-15, Pisa, Italy.
De Vahl Davis, G., 1983. Natural convection of air in a square cavity: a bench mark numerical solution. Int. J. Numer. Meth. Fluids 3, 249-264.
Fusegi, T., Hyun, J. M., Kuwahara, K., Farouk, B., 1991. A numerical study of three-dimensional natural convection in a differentially heated cubical enclosure. Int. J. Heat Mass Transfer 34, 1543-1557.
Fynbo, P., Häggblom, H., Jokiniemi, J., 1990. Aerosol Transport in Severe Reactor Accidents. Final report of the NKA project AKTI-160.
Gallais-During, A., Bonnin, J., Malgouyres, P. P., Bernard, S., Pontillon, Y., Hanus, E., Ducros, G., 2012. VERDON Laboratory: Performances of the experimental LWR severe accident device and first results of fission products release on high burn-up UO2 fuel. In: Proc. Int. Conf. on Nuclear Energy in New Europe, Ljubljana, Slovenia, 5-7 September.
Girault, N., Dickinson, S., Funke, F., Auvinen, A., Herranz, L., Krausmann, E., 2006. Iodine behaviour under LWR accident Condition: Lessons learnt from analyses of the two Phebus FP tests. Nucl. Eng. Des. 236, 1293-1208.
Gouello, M., Mutelle, H., Cousin, F., Sobanska, S., Blanquet, E., 2013. Analysis of the iodine gas phase produced by interaction of CsI and MoO3 vapours in flowing steam. Nucl. Eng. Des. 263, 462-472.
Gray, D. D., Giorgini, A., 1975. The validity of Boussinesq approximation for liquids and gases. Int J. Heat Mass Transfer 19, 545-551.
Green, G. H., Blincoe, C., Weeth, H. J., 1976. Boron contamination from borosilicate glass. J. Agric. Food Chem. 24, 1245–1246.
58

Summary
Gregoire, A. C., Mutelle, H., 2012. Experimental study of the [B, Cs, I, O, H] and [Mo, Cs, I, O, H] systems in the primary circuit of a PWR in conditions representative of a severe accident. In: Proc. Int. Conf. on Nuclear Energy in New Europe, Ljubljana, Slovenia, 5-7 September.
Guha, A., 2008. Transport and deposition of particles in turbulent and laminar flow. Annu. Rev. Fluid Mech. 40, 311-341.
Götzmann, O., 1982. Thermochemical evaluation of PCI failures in LWR fuel pins. J. Nucl. Mater. 107, 185-195.
Haste, T., Payot, F., Bosland, L., Clement, B., Girault, N., 2010. Main outcomes of fis-sion product behaviour in the Phebus FPT3 test. In: 4th European Review Meet-ing on Severe Accident Research (ERMSAR-2010), May 11-12, Bologna (Italy)
Haste, T., Payot, F., Bottomley, P. D. W., 2013. Transport and deposition in the Phebus FP circuit. Ann. Nucl. Energy 61, 102-121.
Hillard, R. K., Coleman, L. F., 1970. Natural Transport Effects on Fission Product Be-havior in the Containment System Experiment. AEC R&D report BNWL-1457.
Hinds, W. C., 1999. Aerosol Technology. 2nd edition, John Wiley & Sons, Inc.Ibrahim, A., Saury, D., Lemonnier, D., 2013. Coupling of turbulent natural convection
with radiation in an air-filled differentially-heated cavity ar Ra = 1.5 x 10⁹. Comp. Fluids 88, 115-125.
Kalilainen, J., Kärkelä, T., Rantanen, P., Forsman, J., Auvinen, A., Tapper, U., 2011. Primary circuit chemistry of iodine. SAFIR2010, The Finnish Research Pro-gramme on Nuclear Power Plant Safety 2007-2010, Final report, 312-320, VTT Technical Research Centre of Finland.
Kim, W., Menon, S., 1997. Application of the Localized Dynamic Subgrid-Scale Model to Turbulent Wall-Bounded Flows. Proc. AIAA 35th Aerospace Sciences Meeting, January 6-10, Reno, USA.
Kissane, M. P., 2008. On the nature of aerosol produced during a severe accident of a water-cooled nuclear reactor. Nucl. Eng. Des. 238, 2792-2800.
Knebel, K., Bottomley, P. D. W., Rondinella, V. V., Auvinen, A., Jokiniemi, J., 2014. An experimental device to study the revaporization behaviour of fission product deposits under severe accident conditions. Proc. Nucl. Energy 72, 77-82.
Lankhorst, A. M., 1991. Laminar and turbulent natural convection in cavities – numer-ical modelling and experimental validation. Ph.D. thesis, Delft University of technology, Delft.
Laurie, M., March, P., Simondi-Teisseire, B., Payot, F., 2013. Containment behaviour in Phébus FP. Ann. Nucl. Energy 60, 15-27.
Leong, W. H., Holland, K. G. T., Bruger, A. P., 1998. On a physically-realizable bench-mark problem in internal natural convection. Int. J. Heat Mass Transfer 41, 3817-3828.
Le Quéré, P., 1991. Accurate solutions to the square thermally driven cavity at high Rayleigh number. Comp. Fluids 20, 29-41.
Li, K., T., Hsia, L., C., Chang, T., 1998. Clean room particle monitor, airflow simulation and measurement for aerosol reduction. J. Aerosol Sci. 29, 254.
Lind, T., Dehbi, A., Güntay, S., 2011. Aerosol retention in the flooded steam generator bundle during SGTR. Nucl. Eng. Des. 241, 357-365.
Linthorst, S. J. M., 1985. Natural convection suppression in solar collectors. Ph.D. thesis, Delft University of technology, Delft.
Liu, D., 2009. Particle Deposition onto Enclosure Surfaces. Aerospace report no. TR-2009(8550)-2, The Aerospace Corporation, El Segundo, CA 90245-4691, USA.
59

Mamun, M. A. H., Johnson, D. A., Hollands, K. G. T., Leong, W. H., 2008. PIV meas-urements of flow field inside an enclosed cubical cavity in natural convection. Exp. Fluids 44, 647-659.
March, P., Simondi-Teisseire, B., 2013. Overview of the facility and experiments per-formed in Phébus FP. Ann. Nucl. Energy 61, 11-22.
Milton, J. S., Arnolds, J. C., 1990. Introduction to probability and statistics. 2nd editi-on, McGraw-Hill, Singapore.
Mäkynen, J. M., Jokiniemi, J., Ahonen, P., Kauppinen, E., Tuomisto, H., Routamo, T., 1996. Experimental studies on LWR containment aerosol behaviour at VICTO-RIA facility. J. Aerosol Sci. 27, supplement 1, S469-S470.
Mäkynen, J. M., Jokiniemi, J. K., Ahonen, P. P., Kauppinen E. I., Zilliacus, R., 1997. AHMED experiments on hygroscopic and inert aerosol behaviour in LWR con-tainment conditions: experimental results. Nucl. Eng. Des. 178, 45-59.
Nazaroff, W. W., 2004. Indoor particle dynamics. Indoor air 14, 175-183.NEA/CSNI/R(2009)5, 2009. State-of-the-art report on nuclear aerosols. Organisation
for Economic Co-operation and Development.Niemela, J. J., 2004. High Rayleigh Number Thermal Convection. J. Low Temp. Phys.
134, 447-456.Nomura, Y., Hopke, P. K., Fitzgerald, B., Mesbah, B., 1997. Deposition of particles in a
chamber as a function of ventilation rate. Aerosol Sci. Technol., 27, 62-72.NUREG-1150, 1987. Reactor risk reference document. U.S. Nuclear Regulatory Com-
mission, Washington, DC 20555.NUREG-1465, 1995. Accident source terms for light-water nuclear power plants. U.S.
Nuclear Regulatory Commission, Washington, DC 20555-0001.NUREG/CR-0247, 1978. LOFT System and Test Description. Idaho National Engi-
neering Laboratory, Idaho.NUREG/CR-6193, 1994. Primary system fission product release and transport. A
State-of-the-Art Report to the Committee on the Safety of Nuclear Installations. Oak Ridge National Laboratory.
Okuyama, K., Kousaka, Y., Yamamoto, S., Hosokawa, T., 1986. Particle loss of aerosols with particle diameters between 6 and 2000 nm in stirred tank. J. Colloid Inter-face Sci., 110, 214-223.
Ostrach, S., 1988. Natural convection in enclosures. J. Heat Transfer, 110, 1175-1190.Pons, M., Le Quéré, P., 2007. Modelling natural convection with the work of pressure-
forces: a thermodynamic necessity. Int. J. Num. Meth. Heat Fluid Flow 17, 322–332.
Pontillon, Y., Ducros, G., Malgouyres, P. P., 2010. Behaviour of fission products under severe PWR accident conditions VERCORS experimental programme – Part 1: General description of the programme. Nucl. Eng. Des. 240, 1843-1852.
Pontillon, Y., Ducros, G., 2010. Behaviour of fission products under severe PWR acci-dent conditions. The VERCORS experimental programme – Part 3: Release of low-volatile fission products and actinides. Nucl. Eng. Des. 240, 1867-1881.
Puragliesi, R., 2010. Numerical Investigation of Particle-Laden Thermally Driven Tur-bulent Flows in Enclosure. Ph.D. thesis, No: 4600, Ecole Polytechnique Feder-ale de Lausanne, Lausanne.
Puragliesi, R., Dehbi, A., Leriche, E., Soldati, A., Deville, M. O., 2011. DNS of buoyan-cy-driven flows and Lagrangian particle tracking in a square cavity at high Ray-leigh numbers. Int. J. Heat Fluid Flow 32, 915-931.
Schlichting, H., Gersten, K., 2000. Boundary Layer Theory. 8th revised and enlarged edition, Springer-Verlag Berlin Hedelberg, Germany.
60
Summary
Sehgal, B.R., 2012 Nuclear Safety in Light Water Reactors: Severe Accident Phenome-nology. 1st Edition. Academic Press.
Sergent, A., Xin, S., Joubert, P., Le Quéré, P., Salat, J., Penot, F., 2013a. Resolving the stratification discrepancy of turbulent natural convection in differentially heat-ed air filled cavities – Part I: Reference solution using Chebyshev spectral meth-ods. Int. J. Heat Fluid Flow 39, 1-14.
Sergent, A., Joubert, P., Xin, S., Le Quéré, P., 2013b. Resolving the stratification dis-crepancy of turbulent natural convection in differentially heated air filled cavi-ties – Part II: End walls effects using large eddy simulation. Int. J. Heat Fluid Flow 39, 15-27.
Shimada, M., Okuyama, K., Kousaka, Y., 1989. Influence of particle inertia on aerosol deposition in a stirred turbulent flow field. J. Aerosol Sci., 20, 419-429.
Simondi-Teisseire, B., Girault, N., Payot, F., Clément, B., 2013. Iodine behaviour in the containment in Phébus FP tests. Ann. Nucl. Energy 61, 157-169.
Talbot, L., Cheng, R. K., Schefer, R. W., Willis, D. R., 1980. Thermophoresis of parti-cles in a heated boundary layer. J. Fluid Mech. 101, 737-758
Thatcher, T. L., Fairchild, W. A., Nazaroff, W. W., 1996. Particle deposition from natu-ral convection enclosure flow onto smooth surfaces. Aerosol Sci. Technol. 25, 359-374.
Tian, Y. S., Karayiannis, T. G., 2000a. Low turbulence natural convection in an air filled square cavity. Part I: the thermal and fluid flow fields. Int. J. Heat Mass Transfer 43, 849-866.
Tian, Y. S., Karayiannis, T. G., 2000b. Low turbulence natural convection in an air filled square cavity. Part I: the turbulence quatities. Int. J. Heat Mass Transfer 43, 867-884.
Tric, E., Labrosse, G., Betrouni, M., 2000. A first incursion into the 3D structure of natural convection of air in a differentially heated cubic cavity, from accurate numerical solutions. Int. J. Heat Mass Transfer 43, 4043-4056.
Wakashima, S., Saitoh, T. S., 2004. Benchmark solutions for natural convection in a cubic cavity using the high-order time-space method. Int. J. Heat Mass Transfer 47, 853-864.
White, F. M., 1991. Viscous fluid flow. 2nd edition, McGraw-Hill.Xin, S., Salat, J., Joubert, P., Sergent, A., Penot, F., Le Quéré, P., 2013. Resolving the
stratification discrepancy of turbulent natural convection in differentially heat-ed air-filled cavities. Part III: A full convection-conduction-surface radiation coupling. Int. J. Heat Fluid Flow 42, 33-48.
Yarin, A. L., Kowalewski, T. A., Hiller, W. J., Koch, S., 1996. Distribution of particles suspended in convective flow in differentially heated cavity. Phys. Fluids 8, 1130-1140.
Zhang, Z., Chen, Q., 2009. Prediction of particle deposition onto indoor surfaces by CFD with a modified Lagrangian method. Atmos. Environ., 43, 319-328.
61

9HSTFMG*agcbdg+
ISBN 978-952-60-6213-6 (printed) ISBN 978-952-60-6214-3 (pdf) ISSN-L 1799-4934 ISSN 1799-4934 (printed) ISSN 1799-4942 (pdf) Aalto University School of Science Department of applied physics www.aalto.fi
BUSINESS + ECONOMY ART + DESIGN + ARCHITECTURE SCIENCE + TECHNOLOGY CROSSOVER DOCTORAL DISSERTATIONS
Aalto-D
D 71
/2015
Fission product transport in the primary circuit and in the containment was investigated in severe nuclear accident conditions, where the reactor core is damaged and core materials are released from the reactor pressure vessel. The re-vaporization of deposited core materials from the circuit surfaces was studied with special emphasis on iodine speciation and transport. The results indicated the possibility of gaseous iodine release in conditions of the experiments. The use of precursors with different additives like Mo, B and Ag mixed with CsI further increased the fraction of gaseous iodine in the release. Aerosol transport in the containment was studied in specific turbulent natural convective flow conditions and the results were compared to particle tracking simulations data, obtained from a validated CFD simulation of the cavity. The results indicated that the depletion of 1 micrometer silica particles was not accurately depicted by the stirred settling model due to specific nature of the turbulent flow conditions in the cavity.
Jarmo K
alilainen F
ission product transport in the primary circuit and in the containm
ent in severe nuclear accidents A
alto U
nive
rsity
Department of applied physics
Fission product transport in the primary circuit and in the containment in severe nuclear accidents
Jarmo Kalilainen
DOCTORAL DISSERTATIONS