Aalborg Universitet Innovation in the European Food ...
153
Aalborg Universitet Innovation in the European Food Products and Beverages Industry Christensen, Jesper Lindgaard; Tunzelmann, Nick von; Rama, Ruth Publication date: 1996 Document Version Accepted author manuscript, peer reviewed version Link to publication from Aalborg University Citation for published version (APA): Christensen, J. L., Tunzelmann, N. V., & Rama, R. (1996). Innovation in the European Food Products and Beverages Industry. SPRINT. General rights Copyright and moral rights for the publications made accessible in the public portal are retained by the authors and/or other copyright owners and it is a condition of accessing publications that users recognise and abide by the legal requirements associated with these rights. ? Users may download and print one copy of any publication from the public portal for the purpose of private study or research. ? You may not further distribute the material or use it for any profit-making activity or commercial gain ? You may freely distribute the URL identifying the publication in the public portal ? Take down policy If you believe that this document breaches copyright please contact us at [email protected] providing details, and we will remove access to the work immediately and investigate your claim. Downloaded from vbn.aau.dk on: January 04, 2022
Transcript of Aalborg Universitet Innovation in the European Food ...

Aalborg Universitet
Innovation in the European Food Products and Beverages Industry
Christensen, Jesper Lindgaard; Tunzelmann, Nick von; Rama, Ruth
Publication date:1996
Document VersionAccepted author manuscript, peer reviewed version
Link to publication from Aalborg University
Citation for published version (APA):Christensen, J. L., Tunzelmann, N. V., & Rama, R. (1996). Innovation in the European Food Products andBeverages Industry. SPRINT.
General rightsCopyright and moral rights for the publications made accessible in the public portal are retained by the authors and/or other copyright ownersand it is a condition of accessing publications that users recognise and abide by the legal requirements associated with these rights.
? Users may download and print one copy of any publication from the public portal for the purpose of private study or research. ? You may not further distribute the material or use it for any profit-making activity or commercial gain ? You may freely distribute the URL identifying the publication in the public portal ?
Take down policyIf you believe that this document breaches copyright please contact us at [email protected] providing details, and we will remove access tothe work immediately and investigate your claim.
Downloaded from vbn.aau.dk on: January 04, 2022

INDUSTRY STUDIES OF INNOVATION
USING CIS DATA
Study on Innovation in the European Food Products and
Beverages Industry
EIMS
SPRINT
For
The European Commission
by
Jesper Lindgaard Christensen
Ruth Rama and
Nick von Tunzelmann

TABLE OF CONTENTS
1. EXECUTIVE SUMMARY 1
1.1 The importance of the industry 1
1.2 Innovations and supply in the industry 11.2.1 A "low-tech" industry? 11.2.2 A "supplier-dominated" industry? 1
1.3 The role of demand in innovation 21.3.1 Demand and technological development 21.3.2 The role of final demand 2
1.4 The role of demand in consumption patterns 31.4.1 The national systems of consumption 31.4.2 National tastes and external competitiveness 3
1.5 The importance of profitability for innovation 3
1.6 National systems of innovation 4
1.7 Future development of the industry 41.7.1 Technological competitiveness of the European industry 41.7.2 The spread of industrialization in Europe: cohesion 4
1.8 General policy implications 5
2. INTRODUCTION, GENERAL BACKGROUND 6
2.1 The importance of innovation for the industry 62.1.1 The data for the study 62.1.2 The general importance of the industry 7
2.1.3 The incidence of innovation in the industry 7
2.2 The structure and development of the industry 10
2.3 The research agenda 13
3. THEORETICAL BACKGROUND 15
3.1 Theory and the innovation process 15
3.2 Innovation strategies 163.2.1 Offensive product development strategy 17

3.2.2 Defensive product development strategy 173.2.3 The dependent strategy 183.2.4 The imitative strategy 18
3.3 Profitability and innovation 183.3.1 Impact of innovation on profit 183.3.2 Capital structure 203.3.3 Size and innovation 20
3.4 The importance of knowledge and users 20
3.5 Implications for innovation measurement 22
4. DATA SOURCES AND THE INDUSTRY 23
4.1 General information on the CIS 23
4.2 Patent statistics 254.2.1 The method for measuring innovative output 26
4.3 Identification of the industry 27
5. TRENDS IN INNOVATION IN THE INDUSTRY 29
5.1 General background 29
5.2 Demand changes and product innovation 315.2.1 The context of demand 315.2.2 New products 345.2.3 New materials (ingredients) 355.2.4 Product quality and safety 36
5.3 Supply changes and process innovation 425.3.1 Scientific advance 425.3.2 Processes 455.3.3 Packaging 47
5.4 Summary 50
6. FEATURES OF INNOVATION AT THE FIRM LEVEL 51
6.1 Identification of leaders and laggards 52
6.2 Strategies 556.2.1 Differences in objectives 566.2.2 Differences between leaders and laggards 57
6.3 The relationship between innovation and profitability 61

6.3.1 Introduction: an inverse relationship? 616.3.2 Objectives of the analysis 626.3.3 Data and sources 636.3.4 Country and time patterns 656.3.5 Leaders and laggards 72
6.3.6 Innovative intensity and profitability 866.3.7 Conclusions 99
Appendix 6.1: Firms included in the sample 102
7. INTER-FIRM AND NATIONAL SYSTEMS OF INNOVATION 103
7.1 User-producer interactions 103
7.2 National innovation systems 1087.2.1 National patterns in patenting 1097.2.2 R&D and the NIS 126
8. IMPLICATIONS FOR INNOVATION POLICY 130
8.1 Policy and the firm 130
8.2 Policy and the nation 133
8.3 Policy and the EU 136
REFERENCES 139

10
1. Executive summary
1. Executive summary
1.1 The importance of the industry
Both in terms of employment and production the food and beverages industry isone of the world’s largest businesses. Annual global sales of packaged foodreached US$ 2.8 trillion in the early 1990s and the market for processed food hasgrown particularly quickly. Profitability has consistently been high, even inrecession years, and the vigour of the industry thus performs an importantcountercyclical function. The present Report investigates the conditions for theindustry to perform successfully.
1.2 Innovations and supply in the industry
1.2.1 A “low-tech” industry?
The food and beverages industry has generally been regarded as a “low-tech”industry. In the present Report we do not claim that the industry in isolation isvery technologically advanced (although some of the firms within the industryindeed are). But we do argue that the traditional perception of the industry doesnot render full justice to the innovativeness of food and beverages firms ingeneral. In fact, we find that a substantial level of innovation activity of diversifiedkinds is taking place. The considerable size of this industry in many economiesimplies that many of its firms will be especially responsible for making use ofinnovations developed in other technologically more advanced industries (e.g.biotechnology). Secondly, we claim that it is already near the forefront ofindustries in the application of a breadth of different scientific advances, i.e.innovating by means of “new combinations” of scientific disciplines. Thirdly, andpartly as a result, we also claim that the industry possesses high potential forfuture economic growth, by dint of becoming a “carrier industry” for embodyingtechnological advances developed upstream.
1.2.2 A “supplier-dominated” industry?
Despite its “low-tech” reputation, a striking observation from the study is theradical nature of both product and process innovation in the industry over the pasttwenty years or so. While this has frequently been pointed out in regard to the“high-tech” industries, it has much less often been noted as pervading a range ofindustries usually regarded as being rather “low-tech”, like food-processing. Of

11
course there is a high degree of dependence on those developments in high-techareas, like information technology, biotechnology and advanced materials; butthere is much more to pervasiveness than the simple “supplier-dominated” view ofsuch industries would suggest. In particular, we can draw attention to the greatvariety of technological impulses - the range of scientific disciplines andtechnological fields - which suppliers are being called on to deliver to these“users”, and still more to the complexity of integrating all of these throughindigenous efforts within the user industry such as food processing.
1.3 The role of demand in innovation
1.3.1 Demand and technological development
The supply-side factors are one reason why we find that the “supplier-dominated”label is no longer adequate as a characterisation of this industry. But the mostimportant reasons lie on the demand side. For one thing, firms in this industryassess product innovations as being as important as process innovations in theirgoals of innovation, and see market developments as more important than either.A second argument in this connection is that clients or customers, not suppliers,emerge as the most important single source of information for innovation.Suppliers of materials and components and suppliers of equipment are listed assecond and third respectively. Except for “conferences, meetings, and journals”,the technology factors appraised here have had negligible importance as a sourceof information to the innovation process alongside market factors. We also findindications of the considerable importance of proximity between users andproducers.
1.3.2 The role of final demand
Changes on the demand side are being exerted not only through intermediatedemand, e.g. of manufacturers for technologies, but also through final demand:through consumer behaviour (including the effects of “globalization” of tastes andproducts), through public opinion, and through intensifying regulatory standards(in regard to health, safety, environment, etc.), which are of course partly by wayof response to public opinion. The shift of emphasis from technology to product isaltering the nature of process change in the sense of how automation isdeveloping, and also altering the divisional structure of large firms and the natureof competition and collaboration in the industry. The interactions between thesupply-side elements (different technologies etc.), and especially between thedemand side and the supply side, are likely to prove the key determinants ofnational and supranational success in innovation in the industry. In our specificresearch - using the CIS data provided, but including other data sources as well -we find a remarkable emphasis on creating new markets when firms list theirobjectives for innovation.
12
1.4 The role of demand in consumption patterns
1.4.1 The national systems of consumption
Demand patterns show evidence of “globalization”, resulting from such factors as:better means of transportation and communication; increased tourism; the forgingof the European single market; and the internationalization of firms within theindustry. Despite these trends towards internationalization of consumer tastes, wefind that Europe is still by no means homogeneous with respect to food and drinkculture. Far from it: there are large differences both in the actual content of theculture and in the degree of homogeneity of the nations. Furthermore, nationalborders are of great importance in distinguishing these different cultures. A largedegree of overlap between linguistic regions and food culture regions suggests thatthe consumption patterns are deeply rooted in the historical and culturaldevelopment of the nations.
1.4.2 National tastes and external competitiveness
The results clearly indicate that the national consumption patterns are importantfor the development of the industry. If firms within the industry are to expand inexport markets, these national differences are important to take into account. Inrecent years barriers to free trade have decreased, better logistics and distributionsystems have been developed, as have better methods for the preserving andpacking of food and beverages. All these factors have eased consumer access toproducts from abroad and consequently the access created for foreign firms tonational markets. But this is merely the physical access to markets: it is clear fromthe study that mental barriers also exist and persist. The historical, culturallyrooted pattern of demand is of particular importance to this industry and indirectlyinfluences the limits imposed on market innovation.
1.5 The importance of profitability for innovation
The market-driven development of the industry is further displayed in therelationship between innovativeness and profitability. At first sight,innovativeness and profitability seem unrelated at the firm level in this industry.This finding, however, conceals intra-industry and cross-country differences. Theimpact of innovativeness on profit varies depending on the home country in whichthe firm is based and on the phase of the business cycle. The most innovativefirms persistently show the highest levels of profitability and least susceptibility torisk through critical phases of the business cycle. More importantly, they are the

13
only ones to make profits above the norm continuously from 1977 to 1989.Conversely, the least innovative persistently display the lowest rates of profit.Profitability, for both firms and countries, emerges as being a function not only ofusing and developing advanced technologies but of orienting production tomeeting changes in consumer demands.
1.6 National systems of innovation
The national innovation system appears from this and other studies as being ofsubstantial importance. This finding may seem to contradict notions ofglobalization of production and technology, but the industry is heavily dependenton “external” sources of technology, such as suppliers and public laboratories, andturns out to draw most of its technology from local sources. This fits with whatmight be expected from a so-called low-tech industry. It could be argued thatindustries where innovations are heavily dependent on new scientificdevelopments would be less reliant on the national innovation system - inparticular those parts of the system which support research, general education,interplay between universities and industry, etc. However, the more informalinstitutions are important elements of a national innovation system, and are notnecessarily related to high-tech industries. User-producer relations are critical tothe generation and implementation of user-led innovations, and the technologicaltrends towards increased complexity suggest that these are likely to become moreimportant still in the near future.
1.7 Future development of the industry
1.7.1 Technological competitiveness of the European industry
From scrutiny of the patent data, analysed on country or regional bases rather thancorporate ones, we can derive two broad conclusions for Western Europe. Thefirst is that Western Europe has generally fared reasonably well in patenting infood and food-related areas. This has been associated over the period 1969-1994with a strong performance in pharmaceuticals, and to the extent thatpharmaceuticals act as a “paradigm” for the food-processing industry, that may besome comfort. However, in the light of broader analyses of innovation trends inthe industry, and if new paradigms like biotechnology, electronics andinstrumentation come to predominate in food technology, then West Europe’sbroad disadvantages in these areas could become stumbling blocks.
1.7.2 The spread of industrialization in Europe: cohesion
The second conclusion is that food processing does have some inherent a priori
advantages for disseminating industrialization across countries. Many currently

14
advanced countries began their industrialization from strengths in this area.However, in recent times - at least so far as the patents evidence goes - thesebenefits have been reaped more by the medium-sized countries of Western Europethan by the smallest and most disadvantaged. The indications from our data arethat the gaps are larger still in terms of implementing new technologies. Hence,while food-processing possesses many potential advantages for catching-upcountries, much remains to be done to reap its benefits among the later developingcountries. This may also be the case in Eastern Europe.
1.8 General policy implications
The general tendency in policy-making to date has been to emphasize the supplyside. Thus, policies have aimed at supporting scientific discovery activities and atprotecting the use of the results from widespread illicit copying. Such policyinstruments include, for example, R&D subsidies, tax deductions on R&Dexpenditures, support to “high-tech” industries, funding of research institutions,and protection of intellectual property rights. In fact these instruments have beenthe main components in science and technology policy in the OECD area for thepast few decades. The EU’s recent Green Paper on Innovation if anythingreinforces these patterns.
Our results strongly indicate that a shift towards the demand side is needed inpolicy-making at all levels: in firms, countries, and supranational bodies like theEU. This should also be accompanied by a shift in emphasis towards downstreamtechnologies. The above-mentioned policy instruments are by contrast primarilydirected towards supporting technological development upstream. Users, such asthe food manufacturers, should not be seen just as the “problem” but as critical tothe “solution”. The focus needs to shift from knowledge creation to knowledgediffusion, but also from upstream to downstream in terms of the knowledgecreation itself.
Recently policy-makers have recognized to a larger extent that knowledge creationdoes not take place in a vacuum but is strongly path-dependent and systemic, andthat R&D is by no means the only input into the innovation process. We show inour policy conclusions that systemic learning is essential for the accumulation oftechnologies, and is most readily conducted at national or even supranationallevels.
2. Introduction, general background
2.1 The importance of innovation for the industry

15
“Innovation is vital. It allows individual and collective needs (health, leisure,working conditions, transport, etc.) to be better satisfied. It is also central to thespirit of enterprise: every new enterprise is created through a process which is tosome extent innovative. In addition, enterprises need to innovate constantly if theyare to remain competitive.”
The above are the opening lines of the Green Paper on Innovation published bythe European Commission on 20 December 1995. The citation illustrates that inrecent years the importance of innovation in competitiveness and economicgrowth has increased and so has the political awareness of the role of innovationin industrial development. As a consequence, policies aimed at supportinginnovations have become still more important to policy-makers. Likewise the needfor a better understanding of the innovation process is urgent in order to guidethese policies and design adequate instruments. Unfortunately the statistics fordisplaying this process have been rather poor. Policy-makers to a large extent havehad to rely on patent and R&D statistics - as output and input measuresrespectively - which do not capture the nature of the innovation process verysatisfactorily.
2.1.1 The data for the study
The primary objective of this Report is to make use of the new dataset producedby the Community Innovation Survey (hereafter CIS), in order to give a muchmore complete picture of innovation in European industry. This dataset will bedescribed more fully in Chapter 4. These studies are carried out under the EIMSprogramme (European Innovation Monitoring Studies) and the present study onInnovation in the Food Products and Beverages Industry is one of these studies.
As just noted, the statistics for measuring innovations have hitherto been ratherpoor. The Community Innovation Survey is focused directly on the innovationprocess and as such is one of the best data sources for analysis of innovationactivities in the manufacturing sector. The data are based on approximately 40,000answers to a harmonised questionnaire. The data do however have theirlimitations. One of these limitations is that we have data for only one year/period.Therefore, we use data from patent statistics when investigating developmentsover several years. Patent statistics have their limitations also. In particular, onewould expect such data to be unable to capture all the incremental, downstreamdevelopments, as well as the less radical combinations of existing knowledge intonew combinations. These features are typical characteristics of the innovationprocess within this industry. Consequently, we use CIS data to display theseinnovations. The preliminary conclusion from this short discussion about differentindicators is that, because of the complex nature of the innovation process, asingle indicator is unlikely to be adequate. Different indicators complement eachother as they reveal different aspects of the innovation process.
2.1.2 The general importance of the industry

16
Studies in the member states and the preliminary analysis in the Green Paper
suggest that innovation is very different across size-groups of firms and acrossindustries. This is the background for a series of industry studies using the CISdata.
Several characteristics of the food and beverages industry make this inquiry intoits innovation patterns of substantial importance. This is demonstrated by its quiteconsiderable share in total manufacturing value-added in major countries -between 10% and 18% (see Table 2.1.1).
Table 2.1.1: Food, drink and tobacco, shares of value-added in all manufacturing,
1988.
Country Share in value-added,
%Australia 17.8Canada 13.4Finland 11.9France 12.4Germany 10.3Italy 10.8Japan 11.5Netherlands
14.8
Norway 18.0Sweden 10.3UK 12.8USA 10.4
Source: Wyckoff, A. (1994), p. 75
Production of food, drink and tobacco accounted for 4.6 billion Ecus andemployment for more than 2.3 million people in 1993. European firms tend to behighly competitive in the international market for food and beverages. Theprofit/turnover ratio of this industry is, moreover, very high at 7.7% in that year,compared with 5.3% for the chemical industry and 4.7% for automobiles.Furthermore, as this industry is an intensive buyer of inputs and equipment,innovative activity in food and beverages is likely to stimulate research inagriculture, chemicals, packaging, capital goods, robotics and so on. Finally, theanalysis of innovation in food and beverages may be useful for understandingother traditional industries.
2.1.3 The incidence of innovation in the industry
Although often regarded as somewhat “low-tech” in relation to the scientificfrontier, in fact innovation can make a valuable contribution to this industry
17
(OECD, 1988). The large relative size of the industry in EU countries makes thisan issue of serious practical concern.
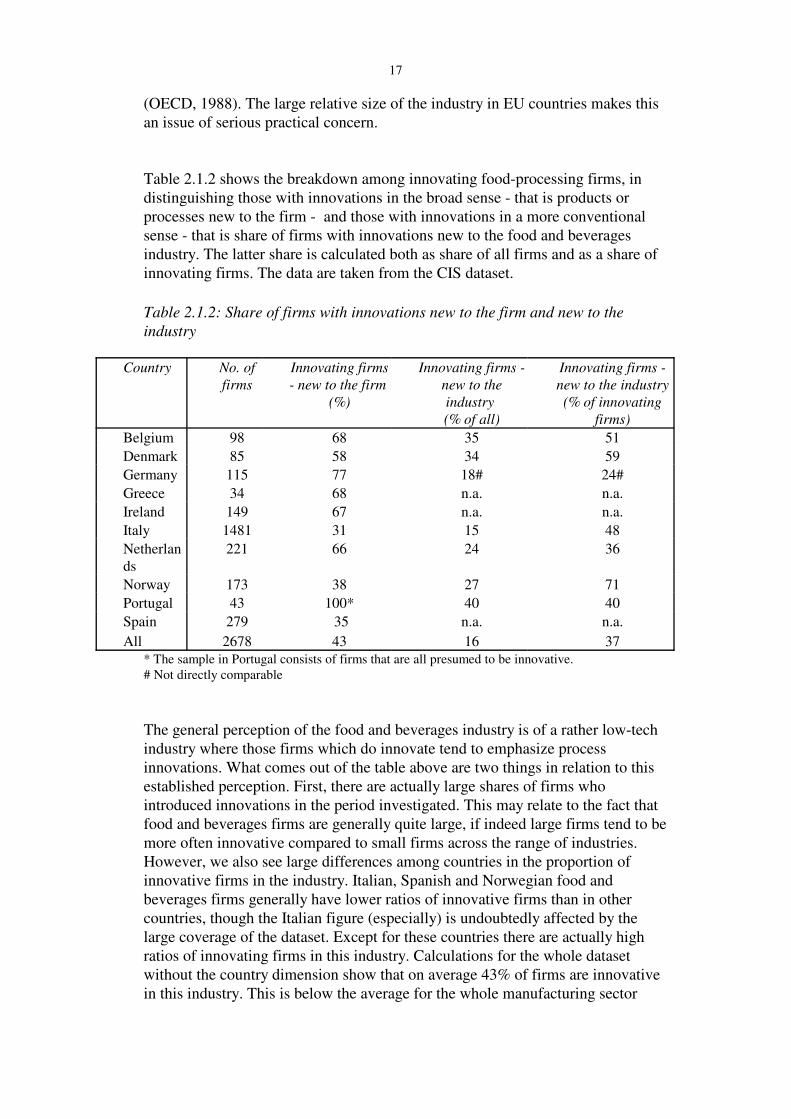
Table 2.1.2 shows the breakdown among innovating food-processing firms, indistinguishing those with innovations in the broad sense - that is products orprocesses new to the firm - and those with innovations in a more conventionalsense - that is share of firms with innovations new to the food and beveragesindustry. The latter share is calculated both as share of all firms and as a share ofinnovating firms. The data are taken from the CIS dataset.
Table 2.1.2: Share of firms with innovations new to the firm and new to the
industry
Country No. of
firms
Innovating firms
- new to the firm
(%)
Innovating firms -
new to the
industry
(% of all)
Innovating firms -
new to the industry
(% of innovating
firms)
Belgium 98 68 35 51
Denmark 85 58 34 59
Germany 115 77 18# 24#
Greece 34 68 n.a. n.a.
Ireland 149 67 n.a. n.a.
Italy 1481 31 15 48
Netherlands
221 66 24 36
Norway 173 38 27 71
Portugal 43 100* 40 40
Spain 279 35 n.a. n.a.
All 2678 43 16 37* The sample in Portugal consists of firms that are all presumed to be innovative.# Not directly comparable
The general perception of the food and beverages industry is of a rather low-techindustry where those firms which do innovate tend to emphasize processinnovations. What comes out of the table above are two things in relation to thisestablished perception. First, there are actually large shares of firms whointroduced innovations in the period investigated. This may relate to the fact thatfood and beverages firms are generally quite large, if indeed large firms tend to bemore often innovative compared to small firms across the range of industries.However, we also see large differences among countries in the proportion ofinnovative firms in the industry. Italian, Spanish and Norwegian food andbeverages firms generally have lower ratios of innovative firms than in othercountries, though the Italian figure (especially) is undoubtedly affected by thelarge coverage of the dataset. Except for these countries there are actually highratios of innovating firms in this industry. Calculations for the whole datasetwithout the country dimension show that on average 43% of firms are innovativein this industry. This is below the average for the whole manufacturing sector
18
1 In the PACE study it was found that results for patenting of products and processes are very similar -also compared to other industries (p.61).
(53%), but again that is partly accounted for by the Italian representation. Thus, ifwe calculate the total share of innovating firms without the Italian data we see that57% of firms in the industry are innovative.
The above mentioned ratios of innovative firms refer to the definition of“innovative” employed in CIS - that is firms who introduce products or processesnew to the firm itself. This definition includes therefore imitation. Takinginnovation in a narrow sense the table illustrates that the share of innovating firmsalso differs across countries, but the ranking does not follow exactly the share ofinnovating firms in the broader sense. In particular, we see that firms in Norwayand Italy - two of the countries with the lowest ratio of innovating firms in thebroader sense - have a large share of innovating firms who introduced productsnew to the industry, whereas firms in The Netherlands tend to be more imitative.
Second, an additional impression derived from analyzing the CIS data has to dowith the alleged orientation towards process innovations. The data indicate asimilarity between the share of product-innovating firms and process-innovatingfirms.1 This may have to do with the size effect mentioned above: large firms arelikely to have introduced both new products and processes in a three-year period.On the other hand the strong similarity may be (and probably is) an indication thatproduct innovations and process innovations in this industry are interrelated to alarge degree. This is plausible if we think of a firm that introduces a new foodproduct: it is likely that such new products require some novelty in processingand/or packaging.
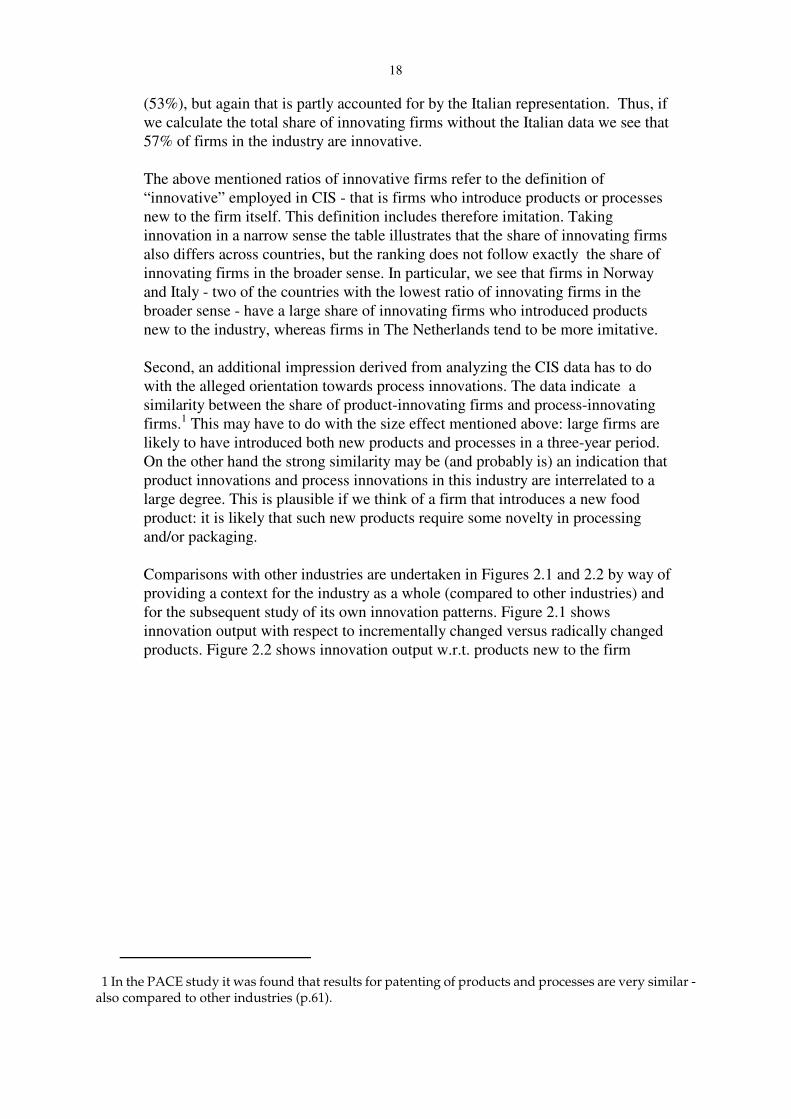
Comparisons with other industries are undertaken in Figures 2.1 and 2.2 by way ofproviding a context for the industry as a whole (compared to other industries) andfor the subsequent study of its own innovation patterns. Figure 2.1 showsinnovation output with respect to incrementally changed versus radically changedproducts. Figure 2.2 shows innovation output w.r.t. products new to the firm

19
2 Based on CIS data and Calvert et al.(1996). The food and beverages industry includes tobacco here.
versus products new to the industry.2
20
2.2 The structure and development of the industry
As a downstream industry, food manufacturing (including drink and tobacco) hastraditionally been driven by market forces and product characteristics to a greaterextent than high-tech industries such as electronics. Until recent times, theindustry was regarded as one of a jumble of oligopolies, each firm of which wouldbe competing for market share, using brand loyalty rather than product innovationas its main competitive weapon. With very stable products, technologicaldevelopment was oriented towards cost-cutting, mainly through mechanizationand through substitution between materials. In more recent years, foodmanufacturing has come to feel some of the effects of technological revolutionsoccurring in some upstream industries, and is now receiving the impact of a wholerange of new technologies, underlying which have been major shifts in consumerdemand. Product changes and associated process innovation have characterised

21
the recent state of the industry, as seen in Table 2.1.1 and as will be argued atgreater length in Chapter 5 below.
As oligopolists, such firms typically struggled for market share, and very often thiswas construed as being obtained through the creation of brand names and of brandloyalties among their consumers. Brand names and the advertising that went withthem were seen defensively as a guard against rapid erosion of market share bycompetitors, and sometimes aggressively as a way of driving competitors down.To a considerable extent, the pattern of takeovers and related organizationalmanoeuvres was determined by the quest for ownership of such brand names - tothis day, corporations in the industry are often known much better by their stableof brands than by their corporate image (of course in some cases the two areidentical, like the Coca-Cola Company).
Not only are the technologies of the industry demand-driven, but its organisationalso reflects its downstream and market orientation. Large firms in the industrytypically amalgamate several lines of business linked by a supposed marketaffinity, but often with little or no apparent technological connection. Thetechnological structure of large firms is therefore highly differentiated. The firmsmay have another core competence in textiles (Sara Lee), construction (Hanson),toys (Quaker Oats), electricals (Ralston Purina), chemicals (Procter & Gamble,Unilever), glass (BSN), and so on.
The CIS data may also be used to illustrate some of the structural patterns of theindustry. In total 2678 firms of the roughly 40,000 firms in the CIS dataset belongto the food and beverages industry. Table 2.2.1 shows the distribution of reportingfirms according to size in full-time employees.
Table 2.2.1: Number of firms in CIS dataset and their size distribution
Country No. of
firms
Size,
employees
mean
Size,employee
s, max.
Size,employees
, min.
Belgium 98 247 4404 4
Denmark 85 328 5850 40
Germany 115 628 16527 5
Greece 34 310 1853 13
Ireland 149 159 2833 10
Italy 1481 95 7030 3
Netherlands 221 525 43855 10
Norway 173 208 1653 2
Portugal 43 293 1614 3
Spain 279 208 1887 4
To give a background for the development of the industry up until the periodcovered by the innovation survey we briefly describe the re-organization of thisindustry taking place in OECD countries over the 1980s and early 1990s. On the

22
demand side, the market for processed food has grown quite rapidly owing tosignificant changes in lifestyles and extensive advertising campaigns. On thesupply side, the industry has changed in structure, showing increasedconcentration and capitalization in most developed countries. As food processorshave been squeezed between controlled agricultural prices upstream and thegrowing power of retailers downstream, they have sought increases in scale.Another reason for pursuing large scale has been the attempt to spread fixed costs,such as advertising and R&D expenditures, over a broader production base(Connor and Schiek, 1996). The launch of a new product is now exceedinglyexpensive. For instance, it has been calculated that it costs US$ 30 million tolaunch a new product on the shelves of supermarkets in Europe’s five biggestmarkets (ibid.). This interpretation implies that innovators would be inclined to astrategy for internal growth of their firms.
External growth has also been notable, especially at the end of the 1980s. Over theyears 1985-89 alone, Rastoin and Oncluoglu (1992) identified 1567 mergers andacquisitions, joint-ventures and other structural manoeuvres among the world’s100 largest food-processing firms. The individual size of a number of theseoperations, often stimulated by financial speculation, has also been extraordinarilyhigh. These combined internal and external strategies have helped promoteindustrial concentration in most advanced countries (McCorckle, 1988). Thestrategy adopted in the food-processing industry has tended to be one in whichindividual “lines of business” within each large corporation continue to maintainexisting strengths, often with little technological link to other businesses in thecompany. The companies are instead more often held together by demand-sideproduct-market interlinkages, of varying degrees of strength.
In addition, the evolution of profit has attracted new investors. Profit in food-processing is more resilient to fluctuations of the business cycle because thedemand for food is less elastic to changes in income than the demand for othertypes of goods (Connor, 1983). This is a major reason why this sector was viewedas a stable, countercyclical industry during the various crises of the 1970s and1980s. Profit rates that were higher than in most other manufacturing sectors(Marion, 1986; Dawson et al., 1987; Alc and Bedetti, 1988; Nefussi, 1989)attracted important levels of investment from non-food industries, and frominstitutional risk-averse investors such as pension funds (Caswell, 1987). As aconsequence, the funds available to firms expanded notably and the value of theirshares rose throughout the 1980s. Vieille (1996) argues that high levels ofprofitability and liquidity helped account for the substantial external growth ofEuropean manufacturers in the late 1980s and early 1990s: of the 100 largestEuropean manufacturing groups, food and drink (representing some 20% of thetotal) had the highest ratios of cash flow to value-added, along with the highestannual growth rates of the value-added.
The pattern of use of capital, labour, raw materials and energy also changed(Goodwin and Brester, 1995). In general, the food and beverages industry iserroneously believed to be labour-intensive. On the contrary, food-processing isone of the most capital-intensive industries in the US manufacturing sector

23
3 The Green Paper also concludes that industries usually assessed as low-tech may be highly innovative.
(Marion, 1986; Connor and Schiek, 1996). This trend was accentuated over the1980s (Goodwin and Brester, 1995). Nefussi (1989) also points to the transition to“intensive accumulation” in French agro-industries over the late 1970s and early1980s. Technological change contributed to greater substitutability between foodinputs and non-food inputs (Goodwin and Brester, 1995).
The range of technologies on which food and beverages companies are drawinghas greatly widened in recent decades, partly as the result of the emergence of new“technological paradigms”, such as biotechnology and electronics (see Chapter 5below). Confronted by such a world of growing technological complexity, thefood manufacturers are either buying up research-oriented businesses or, moreoften, outsourcing the technological developments to independent firms (vonTunzelmann, 1996). Similar patterns seem to be emerging for some of the newresearch-intensive upstream industries (like biotechnology) in the modern era;though the Japanese companies appear to be heading in a different direction offocusing on applications and users. The food-processing firms are therefore stillmainly dependent on suppliers, in conformance with the view of the industry as“supplier-dominated” (Pavitt, 1984), but the range of suppliers is widening farbeyond the mechanical engineering industry on which it used to lean so heavily. Inthis manner, its feedback effects on innovation in supplier industries is becomingfar more wide-ranging.
2.3 The research agenda
The food and beverages industry is generally taken as a “low-tech” industry.Nevertheless, as we have seen in Table 2.1.2, there is a substantial amount ofinnovation activity taking place.3 After a short discussion in Chapter 3 on thetheoretical background for the study we discuss the data sources used in Chapter4. We next proceed in Chapter 5 to discuss in further detail what is the actualcontent of the innovation activity and what are the main trends and conditions forthe dynamics of the industry.
In Chapter 6 we then investigate three sub-themes in greater depth at the firmlevel. The first is to investigate with CIS data what are the characteristics ofleaders and laggards within the food and beverages industry. Firms are dividedinto three groups: the best performing third being the leaders and the worstperforming third being the laggards. These three groups are mapped against somekey indicator variables; namely export share, R&D intensity, innovation-costintensity, turnover per employee, and share of new products.
The second sub-theme explored will be the role of strategies in explaining whysome firms are leaders and others are laggards. The CIS data allow us to explorethe different objectives of the two groups of firms in relation to, say,. size of firm.In this analysis the objectives of the firms are grouped in different ways, e.g. in

24
relation to product innovation, process innovation and market innovation. There isa particular focus in the investigation on whether a relationship exists betweenobjectives and success.
The third sub-theme will be to have a closer look at the relationship betweenprofitability and innovation. This requires a longer-term view and information oneconomic performance on the firm level. Both of these requirements cannot befulfilled by using CIS data. Consequently patent statistics are used on a sample oflarge food and beverages firms.
A major objective is to analyse differences across countries in such behaviour. Thecountry-level emphasis is maintained for three reasons: a) because of our view ofthe importance of national systems of innovation; b) because of its significance forpolicy-making; and c) more pragmatically, because of the country skew inresponses to the CIS questionnaire (e.g. the disproportionately high response fromItalian firms).
In Chapter 7 we move from the firm level to the interplay among firms andbetween firms and their surroundings. More specifically, we explore (mainly withCIS data) whether there is any importance attached by leaders and/or laggards touser-producer relationships and whether the national system of innovation is ofmajor importance. User-producer interactions are not directly displayed in the CISdata. However, the section in the dataset on information channels gives us someindication. Thus, an emphasis on customers and suppliers may indicate a strongimportance of user-producer interaction. Likewise, the notion of the nationalinnovation system (NIS) is not directly addressed in the CIS data. Some indirectindicators are the importance of institutions in information sources and the shareof firms who acquire and/or sell technology of certain kinds in the domesticmarket or abroad; also R&D collaboration with public institutions helps indicatesthe importance of the NIS. Some non-CIS indicators will be used as supplements.
Finally policy implications from the results are derived in Chapter 8, at the levelsof the firm, the country, and the region (the EC).
The study is conducted jointly by IKE, Aalborg University, Denmark and SPRU,University of Sussex, England. Associate Professor Jesper Lindgaard Christensenparticipated from IKE and coordinated the project. Dr Nick von Tunzelmannparticipated from SPRU, working with Dr Ruth Rama, of CSIC, Madrid.

4 Among the many sources for this Section should be mentioned Smith (1994) and Archibugi et al. (1994).5 These are broad topics and the discussion that is to follow is intended to be illustrative and focused, rather
than exhaustive. For an account of the development and state of the art in the economics of technological changesee Freeman (1994).
3. Theoretical background
No empirical study or collection of data is totally devoid of theoretical andconceptual foundation. The specific types of data collected, the way the data arecollected, the way the concepts are defined, and the way the data are afterwardsused, all reflect certain a priori perceptions of what the data are supposed toreveal.
In the following the theoretical foundation for the analysis is outlined.4 Thediscussion is kept on a general level, with a separate discussion (in Chapter 5)being devoted to the specific characteristics of the industry. Thus, following thegeneral outline of research questions specified above, the theoretical backgroundwill deal in turn with general innovation theory, strategy, the relationship betweenprofitability and innovativeness, user-producer interaction and learning andnational systems of innovation.5
3.1 Theory and the innovation process
In the minds of many people, and in many innovation studies, innovations areassociated with radically new products. Thus some studies focus on visible,radical innovations like computers, synthetic materials, etc. However, the physicalend-product is only the tip of the iceberg. In fact, the major resultant innovationsare the outcomes of a long process, which is characterized by much more gradualmodifications than the impression obtained from focusing on end-products.
The term “end-product” is not that fortunate because even after commercializationmodifications continue, as feedbacks from users, sales offices, competitors, etc.are important inputs to further development of the product. Kline and Rosenberg(1986) emphasize this perspective by developing a so-called chain-link model ofthe innovation process as an alternative to the traditional linear model, which hadseen the process as a continuous, progressive development from research throughdevelopment and production to marketing. As opposed to that model, the chain-link model emphasizes feedbacks which help to formulate how to proceed. Inparticular the model suggests that innovations are often the results of interactionbetween market opportunities and the knowledge base and resources of the firm.This model seems compatible with the “dynamic capabilities” view of the role ofthe firm, as espoused in some recent literature (Teece and Pisano, 1994); in which

26
existing resources have a major guiding influence on its development, but alsointeract with external developments in markets, technologies, finance, etc.
These two properties - the gradual modification of products and processes and theinteraction with the market in this process - are especially important in the foodand beverages industry. In particular, they are important parts of the theoreticalbackground for two of our claims in this Report. The first of these is that thetraditional perception of the industry as being low-tech may seem true if measuredonly by R&D intensities and patents, but in fact the industry may still be ratherinnovative, through such gradualism and diffusion in the innovation process.Minor changes of products and processes and combinations of existing knowledgerequire R&D to a lesser extent and are less likely to be patentable compared tomore radical innovations in some of the industries traditionally assessed as high-tech. The second claim referred to has to do with another traditional view on thefood and beverages industry: that the industry is particularly process-oriented. Aswill be argued in more detail later, the response from the market is very importantto the innovation process within the industry.
Thus, we see innovations in food and beverages as results of an open-ended,evolutionary process, which makes it hard to date the start and end of aninnovation in time and to see it as a single event. Innovations are often a result ofsmall deviations from everyday routine activity and are often created by newcombinations of existing knowledge. This suggests that many innovations, eventhe more radical, involve elements of incrementalism, and learning is a centralcharacteristic of the process. Application of an existing product, process or newknowledge to a new area may yield great effects and may contribute to furthermodifications of the original innovation. In food and beverages this has indeedbeen the case, as witnessed by the immense effect of developments withinpackaging.
3.2 Innovation strategies
In a rapidly changing world the opportunities for firms to develop successfulinnovations are not random but follow certain historically circumscribed lines withrespect to technological, market and financial developments. The ability andwillingness of firms to adapt to the changing environment are not random either.Within the limits indicated above, the single firm faces choices among the rangeof alternative strategies for survival and growth, choices which are often vital forthe future of the firm. This is the rationale for investigating the role of innovationstrategies of food and beverage firms.
Discussing strategies for firms and the effect of such strategies may sometimes bea rather difficult task, because they are not always easily identifiable and theirinfluence may likewise be hard to detect. Nevertheless it is useful to have aframework or a typology of strategies before trying to investigate what theireffects might be. The picture becomes blurred by the fact that there may existdifferent strategies in the same firm at the same time, because some products may

27
be developed with one strategy and some with another. Furthermore, one strategymay be adequate in one branch of industry and not in another, not to mention inone country compared to another.
Further complications could be added. For now we shall use as a tool for analysisan elaboration of a well-known typology in line with Freeman (1982, p.163) andKay (1988, p.288) (who adopts Freeman’s framework).
In spite of all the cautions about defining strategies and identifying them with CISdata, some effort is made to use the data to separate firms with different strategiesin accordance with the above-mentioned typology. Several different parts of thequestionnaire may be used for this purpose, as is illustrated below.
Table 3.2.1: Strategy identification and CIS data
Strategy Offensive Defensive Dependent Imitative
Importance ofR&D
large large absent absent
Importance ofProduct-/process
product product product process
Sources ofinnovation
internal,researchinstitutions
competitors costumers-/clients
competitors/generalavailableinformation
Extend productrange
yes yes within mainfield
yes
Acquisition oftechnology
results of R&D licensing,hiring skilledemployees
acquisition isfrom motherenterprise
Transfer oftechnology
licences, R&Dperformed forothers
sales ofequipment
none
Appropriability patents leadtime
Developproducts new tothe industry
yes no
Note: the strategies are those readily defined from the CIS data.
Some of the above variables are more obviously related to a particular strategythan others. In practice some will be combined so that only one of the datavariables in a group - or more than one group - of variables should be rated highlywhereas others are mandatory. For example, it could be argued that a firm with anoffensive strategy must develop products new to the industry, but the kind oftransfer of technology could be either “licences” or “R&D performed for others”.This will complicate the picture, but still the strategies may be possible to identify.

28
3.2.1 Offensive product development strategy
An offensive innovation strategy may be suitable when there are large advantagesof being first into the market. The strategy aims at getting technological andmarket leadership. Using this strategy a long time-horizon is often necessary, andthis enhances the danger of irrelevance of the product when it finally becomesready for introduction. By then, a competing or similar product may haveestablished market dominance or the conditions in the market may have changedas a result of public regulation, changes in consumer preferences, etc. Therefore,property rights and lags in competitive responses and imitations are importantfactors to take into account when deciding on this strategy (Kay, 1988, p.288).
An important prerequisite for this strategy for the firm is either its own researchand development department or easy access to relevant basic research. Thisenables the firm to develop products from ideas generated internally, but also toincorporate externally generated knowledge into the product development.
3.2.2 Defensive product development strategy
Following this second strategy a firm may be able to eliminate some of the largeuncertainties “upstream”, by developing or redesigning products which have beenintroduced by others. Firms may thus accept to be behind the first-comer firms butnot too far behind. The nature and timing of innovation is somewhat differentfrom the offensive firm but this is deliberately chosen, in order to benefit frommistakes made by first-mover firms and to react to responses from the market.This is not to say that this strategy does not involve R&D and is costless. In fact, itis often necessary to maintain a large knowledge base in-house precisely in orderto be able to respond quickly to actions taken by competitors, such as successfulradical innovations. Typically the defensive firms emphasize productdifferentiation. This enables them both to maintain a non-specific knowledge baseand to utilise the differentiation of products as a kind of insurance against marketfluctuations.
3.2.3 The dependent strategy
Some (especially small) firms may choose to be linked to a larger firm, group offirms or government institution. Such firms, often sub-contractors, usually makeonly minor, incremental innovations, often at the request of the dominant firm, orthey adjust to changes in specifications. Thus the responses from customers arevital as information sources for innovations. R&D is most often absent in firmsfollowing this product development strategy. If the firm uses R&D it is often notin-house but most likely based in a parent-firm.
3.2.4 The imitative strategy

29
Imitators rarely introduce more radical innovations but try to produce newproducts developed by others, either by utilising cost advantages (labour costs,material or energy costs) or by taking advantage of being in a specific market,through having superior distribution or marketing facilities, or benefits fromspecial legislative conditions or public sector demand, etc. To enhance such costadvantages, process innovations are ranked relatively higher than productinnovations compared to the priorities in firms following the other strategies.
R&D is limited but on the other hand imitators must keep up with technicalinformation sources in order to know about optimal production techniques andpotential products or process techniques worth imitating.
3.3 Profitability and innovation
Intuitively it would appear that one of the primary driving forces for innovation isthe search for profits, as innovation and risk have traditionally been associatedwith above-normal profits. Other influences and multiple interlinkages howevercomplicate any attempt to draw simple statistical conclusions.
3.3.1 Impact of Innovation on Profit
Although, in most cases, the results reached by different empirical studies showpositive associations between innovation and profitability, there is somedivergence in research outcomes.
First, the association of innovation and profitability is more complex and difficultto measure than often imagined (Rosenberg, 1982). The extent to whichinnovation can increase profits depends on some rather diffuse interconnections,with innovation having both direct and indirect effects on corporate profitability(Cohen and Levinthal, 1989; Geroski et al., 1993). Direct effects include theclassical influence on profit via market share; indirect effects include improvingcompetitive advantages in a variety of forms (Geroski et al., 1993), with examplesincluding the building of core competencies and the ability to imitate newproducts or use new equipment. Although less explored, innovation may also havean impact on financial aspects, which in turn can affect performance. Projectslaunched by successful innovators, for instance, may inspire confidence on thepart of investors or financial institutions (Chaney et al., 1991). This situation islikely to alter financing methods, with indirect effects on the rate of profit.
Effects of innovation on profit are probably even more diffuse when the ratio ofR&D to sales is small, as in food and beverages. Therefore, we do not expectlinear models would give full account of the influence of innovation. On thecontrary, we undertake a complex analysis in which a variety of both financial andtechnological factors will need investigation.

30
Second, evidence suggests the effects - especially direct effects - of innovation onprofit are likely to be small, even in high-tech industries. Branch (1974) found apositive association between the number of patents per unit of assets or profit in111 firms related to seven US industries (food-processing was excluded). Yet hischi-square coefficients for innovative output are small, indicating limited effects.Geroski et al. (1993) also found a positive association between commerciallysignificant innovations and profit margins in a sample of large UK firms.However, increases in profitability were modest in most industries and, moreover,negative in food and beverages.
One further reason to expect small direct effects in food and beverages is that theperiod for the innovator to obtain monopolistic gains is short, because most newfoodstuffs are easy to imitate (OECD, 1988). Expectations of direct effects couldprobably be described as an “investment in roulette” (Bowman and Asch, 1987).In many cases, however, innovation could have a subtle, indirect effect onvariables affecting the rate of profit, and probably the path to it. In a study of 17US pharmaceutical firms, Narin et al. (1987) found high correlations between anestimated financial factor and specific patents denoting originality or quality only.
Third, another area where authors disagree is over “reverse causation”, i.e. profitrates affecting subsequent R&D. Most studies have taken such a possibility to beremote, but an exception to this general view is provided by Grabowski (1968),who investigated R&D expenditures relative to sales in 41 large US firms. Othersbelieve that, although profitability and liquidity may determine innovation in smallfirms, these variables are not particularly relevant in large companies, who usuallyproduce enough internal funding to finance innovation (Acs and Isberg, 1991a;Himmelberg and Petersen, 1994); whereas the R&D budget of small firms is moresubject to economic fluctuations (Kay, 1979). After a review of the literature onthis topic, Kamien and Schwartz (1975) concluded that “the empirical evidencethat either liquidity or profitability are conducive to innovative effort appearsslim”. These results have a methodological interest for our research, in which thecausal direction that is studied is the influence of innovation on profit, and not theother way around.
3.3.2 Capital structure
The Modigliani-Miller Irrelevance Theorem concluded that the financial structureof a firm was irrelevant to both its value and its operating decisions (Copeland andWeston, 1992). However, Acs and Isberg (1991b) found capital structure may bea determinant of innovation: in large firms, innovation tends to be financed byequity, and in small firms by debt. Santarelli (1991), who reaches similarconclusions, explains that in large innovative firms, directors would increaseequity as a signalling device to attract new shareholders. In addition, indebtedorganizations are not likely to promote projects involving additional risk, which isoften the case with new technology (Bowman and Asch, 1987). Moreover, thedevelopment and sagacity of financial institutions influence innovation inindustrial firms (Dosi, 1990; Sweeting, 1991; Prakke, 1988).

31
According to such theory, an increase in gearing would discourage innovationwhile an increase in equity would stimulate it. These considerations are alsomeaningful because firms based in different home countries deal with differenttypes of financial systems and divergent institutional arrangements. A number ofJapanese and French food and beverages firms, for instance, are able to internalisefinance because they are protected by large groups including banks. These firmsare more efficient regarding funding than independent firms (Galliano, 1991;Galliano and Alcouffe, 1993; Hoshi et al., 1991).
3.3.3 Size and Innovation
As will be seen in later chapters, firms from different countries have differentaverage size. European firms, for instance, tend to be smaller than US firms. Howwill these situations affect innovation? Schumpeter came to believe that largefirms, with monopolistic market control, would be especially prone to innovate.Results of empirical tests are contradictory, however. Audretsch and Acs (1991)attribute these contradictions to different measures to quantify technologicalchange and the exclusion of small firms from the analyses. These authors found aU-shaped relationship between firm size and innovative intensity, i.e. innovationsper employee, in a sample of innovative firms of different sizes. Based on thatstandard, the smallest firms are the most innovative-intensive and the largest firmsproduce the fewest innovations per employee. Audretsch and Acs admit, however,that the innovative intensity of smaller firms is reduced if one includes non-innovative firms in the sample. In other words, the orthodox results as in the laterSchumpeter are more accurate when both innovators and non-innovators arerepresented. This methodological point is adopted in the present study: oursamples include both innovators and non-innovators.
3.4 The importance of knowledge and users
Many studies have indicated a relative shift in recent decades from tangible capitaltowards intangible capital, i.e. from physical capital formation towards humancapital formation or knowledge. Modern innovation theory has recently exploredthe concept and use of knowledge in depth. According to Dosi (1988, p.224),knowledge is a precondition for solving an innovation problem, and it has at leastthree dimensions: it can be articulated versus tacit, public versus private, universalversus specific. In our view the relevant knowledge for innovation in food andbeverages is most often tacit, cumulative and idiosyncratic.
It has been recognized that different firms use different kinds of knowledge baseswith different degrees of specificity. This specificity may relate to the societylevel, the industry level, or the firm level. At the level of the firm, the specificitiesof the firm with respect to competencies, strategy, capital equipment andorganisation determine what kind of knowledge base is used. Depending on thesize of the firm, the knowledge base may even be specific to one or a few

32
6 For an elaboration see Lundvall (1992).
individuals within the firm. At this level knowledge in innovation is thus primarilyspecific, tacit and private.
Although it is possible to make the distinction between different types ofknowledge bases, the division is of course to some extent academic rather thanpractical. In practice the different types of knowledge are interrelated andintegrated in complex ways. Likewise, their development is not separate butcomes about through an interaction between firms and institutions. Thisinteraction mainly takes place in a national context even though some knowledgeis created abroad and transferred across borders through research institutions,multinational firms, etc. Increasingly, knowledge bases are international ratherthan rooted in a national context. But still there are debates about why nationalborders matter as a framework for the creation of knowledge. These arguments aremainly related to what facilitates interaction, like language, proximity ingeography and culture, and collaboration with research institutions, but also tocommon standards and legislation, limited cross-border mobility of the labourforce and the national character of the technological infrastructure and policies.All of these are important arguments why nation-states matter in technologicaldevelopment and knowledge creation.6
The discussion above indicates that technological knowledge should be seen assystemic. Thus, the knowledge bases are highly dependent on some form ofinstitutionalization if they are to be stable. One could argue that firm-specifictechnological knowledge may be more volatile. But even at the firm level,innovating firms are likely to be dependent on what in recent innovation theoryhas been labelled the innovation system. This goes along with their search fornew, necessary technological knowledge, with the assessment, implementationand use of this knowledge in the firm, and with the need for external aid in theinnovation process. An additional argument only indirectly related to the creationand use of technological knowledge is that firms are often dependent on thefinancial system, the education and training system, the public procurement andindustrial policy, and legislation like standards, environmental regulation, etc.
The innovation process is complex and the timing of innovation is extremelydifficult - and increasingly so because the “market window” is rarely open for verylong; the imitation process being fast because of the generally higher level ofinformation on competitors and because costs of breaking down entry barriers infood and beverages are high. Therefore, the performance of an innovation systemis not solely dependent on knowledge creation and not on the single institution inthe system. Rather it is dependent on the systemic ability to learn - that is theinstitutionalization of knowledge created through interaction between institutionsand firms and among firms. In other words, the evolution of knowledge-creatingand diffusion systems is essential to industrial development. The performance ofthe innovation system is also dependent on the ability of the system to provide theright kind of information and knowledge to firms at the right time. This ability

23
will in turn affect the costs of innovation efforts at the firm level and the amountof imitation at the level of society at large.
3.5 Implications for innovation measurement
From the above we hope to have made clear that the innovation process iscomplex in several different ways. For example, the inputs to the process mayvary from institutionalized, planned basic research to on-the-spot, incrementalchanges of product or process. The output from the process may likewise takeseveral forms and is in many cases difficult to locate precisely in time. We havealso discussed knowledge used in such processes and emphasized the manydifferent kinds of knowledge, including the powerful role of tacit (non-codified)knowledge.
The implication for innovation measurement is that a single measure is unlikely tocapture all the relevant aspects of the innovation process. One must therefore beaware of the limitations of using only one indicator and we have in this studysupplemented CIS data with other indicators. Even when using severalsupplementary indicators it is not possible to cover all of the innovation process.In other words there are aspects of innovation on which we do not yet haveadequate indicators. Even on specific issues where e.g. CIS data are appropriate,there are limitations to the measurement of innovation.
4. Data sources and the industry
4.1 General information on the CIS
The background for the CIS project is a set of mostly independent surveys oninnovation carried out in the 1980s. The experience from these surveys resulted inan OECD manual in 1992 (“OECD Proposed Guidelines for collecting andinterpreting data on technological innovation” - the Oslo manual) which isintended to be a basis for more coherent future surveys. The manual is currentlybeing revised. Eurostat and DG-XIII developed the CIS in collaboration withindependent experts and the OECD, resulting in the final, harmonizedquestionnaire in June 1992. The objective of the CIS is
“to collect firm-level data on inputs to, and outputs of, the innovation processacross a wide range of industries and across Member States and regions, and touse this data in high-quality analyses, which among others, will contribute tothe future development of policies for innovation and the diffusion of newtechnologies at Community, Member States and regional level”.

24
The CIS, or closely similar, approach is also implemented - or is planned to beimplemented - in some non-member states. This goes for Canada, USA, Norway,Finland, Austria, Australia, and South Africa.
The database contains a large variety of variables on innovation in approximately40,000 firms. Item-non-response has been estimated, weighting factors applied, andlogical checks conducted. In addition, a so-called micro-aggregation has beenundertaken. The purpose of this modification is to anonymise the data while retainingthe maximum of information. The method used for the micro-aggregation dependsupon the nature of the variable. The basic principle in the modification is thatobservations are grouped by three and each observation is replaced with the clusterarithmetic mean.
Table 4.1.1 gives a list of the groups of variables in the questionnaire.

25
7 See the evaluation reports by Archibugi et al. (1994) for an in-depth assessment of the data quality as well asthe implementation in each member state.
8 One country's evaluation reckons the time used by respondents to fill in the questionnaire to be on the average120 minutes, ranging from 60 to 210 minutes.
Table 4.1.1: Variables in the CIS questionnaire
Variable group Examples of variables/sub-groups of variables Type
General information Number of employees, turnover in 1990 and 1992,innovative vs. non-innovative
metric,binary
Sources of information forinnovation
Internal sources, external/market sources, educational/research establishment, generally available information.
ordinal
Objectives of innovation Replace products, extend products, new markets, lowerproduction costs
ordinal
Acquisition/transfer oftechnology
Licences, consultants, purchase/sale of equipment, skilledemployees, R&D, communication with other enterprises; allvariables broken down on geographical bases
binary
Appropriability Patents, design, secrecy, lead-time advantages, complexity binary
R&D activity Expenditure on internal and external R&D, plans for R&D,cooperation with different partners broken down ongeographical bases
binary,metric
Factors hamperinginnovation
Economic factors, enterprise factors ordinal
Costs of innovation Current expenditures, broken down into R&D, acquisitionof patents and licences, product design, trial production,market analysis, capital expenditures
metric
Impact of innovationactivities
Distribution of sales by product stage, degree of change ofproducts, export sales, products new to the industry
metric
The questionnaire is aimed at enterprises within manufacturing and is generally sentto a stratified sample of enterprises with relatively low cut-off points. The CIS wasimplemented for the first time in the autumn of 1993 and asked for information oninnovation activities in the period 1990-92. As such the CIS may be seen as a pilotproject, and experience from the first implementation is valuable in relation to a futuresurvey. Use of the data for purposes of comparing across countries is still restricted tosome of the countries because of differences in sample, questions and implementationmethods in the member states.7 Some of the questions asked are quite new to the firmsand consequently answers on those questions are generally less precise. This goes inparticular for the questions on innovation costs and the distribution of sales accordingto product life-cycle stages. These questions are also among those frequently leftblank by respondents.8 In the micro-aggregated database this item-non-responseproblem is dealt with by means of estimations of the missing values. Differentestimation techniques have been used for different types of variables. Behind theestimations lie assumptions about relationships between the variables in the CISdataset. It could therefore be questioned whether such estimations are necessarilybeneficial for the dataset. In a way a theoretical construct is imposed on the data,

26
which were supposed to be neutral. On the other hand, the number of observations areincreased in this way. It has therefore been decided not to exclude the estimatedvalues from the database.
Even if there remains much to be done in terms of improving implementation of thesurveys, the CIS does have some advantages. The data are directly focused uponinnovation, and they are to a large extent comparable across countries, industries orother types of aggregations. The number of observations is relatively large. Inaddition, they are firm-level data, which makes it possible to link innovation to otherdata on firms.
However there are also weaknesses of the CIS data. For example much progress isstill needed with respect to coverage of the data. Some of the most important playerswithin certain industries are not in the database. This goes not only for the USA andJapan, which is to some extent natural in a Community-based survey, but it also goesfor some of the major European countries, both those covered by the survey and thosenot surveyed. Later in this report we shall provide evidence from patent data whichshows that in food and beverages Switzerland, France, the UK and Sweden are someof the major countries in this market, whilst these countries are not coveredsatisfactorily in the CIS. Another weakness is differences in the implementation of thesurvey across countries. In spite of efforts to harmonize the questionnaire andsampling, several of the member states did not follow the instructions, with the resultthat some questions and even datasets are not comparable. So even if we regard thecross-country comparability as one of the strengths of the CIS, we must also point tothe difficulties in comparisons across countries. Among the drawbacks it should alsobe mentioned that the survey is rather biased towards product innovation, whereasprocess innovation is treated in parts of the questionnaire only. The many variables inthe CIS provide many possibilities for interesting analyses. We do, though, have datafor only one year, which makes it difficult to draw robust causal conclusions as towhat is best practice in innovation. Many more weaknesses could be mentioned (thefocus upon manufacturing, the data covering just a recession period, etc.), but thecritique should not overshadow the fact that the CIS provides one of the best datasources for mapping the nature of the innovation process in manufacturing comparedto other data available.
The CIS is therefore an important data source in this study of the food and beveragesindustry but in some sections other data sources are included as well. Thus for somepurposes we use patent statistics, as described in the next section.
4.2 Patent statistics
Since the CIS data do not allow us to inquire into the important topic of profitabilityand innovation (discussed in theoretical terms in Chapter 3 above), we have usedalternative data sources for this purpose.

27
A sample has been constructed comprising 101 food and drink multinationals withaverage worldwide sales of at least US$ 1 billion in 1988 (Appendix 6.1). This isdescribed in Section 6.3.3 below. As the relationship between economic andtechnological variables may vary over different phases of the business cycle (Narin et
al., 1987) we analysed three subperiods: 1977-81, 1982-85 and 1986-89. The first is aperiod of expansion, while the second is a period of crisis and the third witnessedrecovery in this industry.
4.2.1 The Method for Measuring Innovative Output
We use the count of patented inventions, i.e. patents granted to the firm in the UnitedStates, as a proxy for innovative output. We have analysed utility patents only in thisstudy - “design patents”, which involve minor changes in presentation or packaging,are not included here.
This method for measuring innovative output has certain drawbacks. Patent countsgive no information on the technical importance or the market value of innovations.Not all inventions are patented. Many successful innovations are actually neverpatented (Rosenberg, 1982). Some types of technology are more likely to be patentedthan others (Acs and Audretsch, 1989). Likewise the propensity to patent differsacross industries. In particular, in the food and beverages industry, the downstream,incremental innovations are not patented to the same extent as more upstreamindustries. This result is found in the PACE study, which also finds a generalassociation between R&D intensities and propensities to patent. Furthermore, firmsfrom different countries have different propensities to patent their inventions(Archibugi and Pianta, 1992; Scherer, 1989) and/or different propensities to patent inforeign countries.
Some of these objections lose their importance in homogeneous samples, such as thatin this study. Enterprises with similar sizes, businesses and so on, are likely to showsimilar patenting behaviour (Branch, 1974). Multinational firms, like those in oursample, are likely to globalize their strategy for protecting their intellectual propertyand exhibit similar foreign patenting patterns (Archibugi and Pianta, 1992).Nevertheless, comparisons between US and non-US firms should be treated withsome caution. The latter firms presumably patent their inventions in the US inproportion to their business involvement in that country. On average, non-Americanfirms would expect to patent fewer inventions in the US than American firms ofsimilar size, because of the fact that the former firms enjoy smaller market shares inthe country.
On the other hand, a number of empirical studies support the idea that patents reflectwith some accuracy other manifestations of technological change. Acs and Audretsch(1989) found a strong association between direct measures of innovative activities andthe number of patented inventions at the 4-digit standard industrial classification(SIC) level in US manufacturing. Bound et al. (1984) had previously established astrong relationship between R&D expenditures and patenting activities at the firm
28
level in the US. The association between R&D expenditure or patenting, on the onehand, and significant innovations, on the other, seems to be clearly established overlonger periods of time. Cumulative curves of patents and innovations at the firm levelare more likely to be compatible over longer periods of time than on a year-to-yearbasis (Achilladelis et al., 1990). The correlation between R&D spending and totalnumber of subsequent innovations is more clearly observed over the long run as well(Mansfield, 1968). For these reasons, this research covers a period of 12 years.
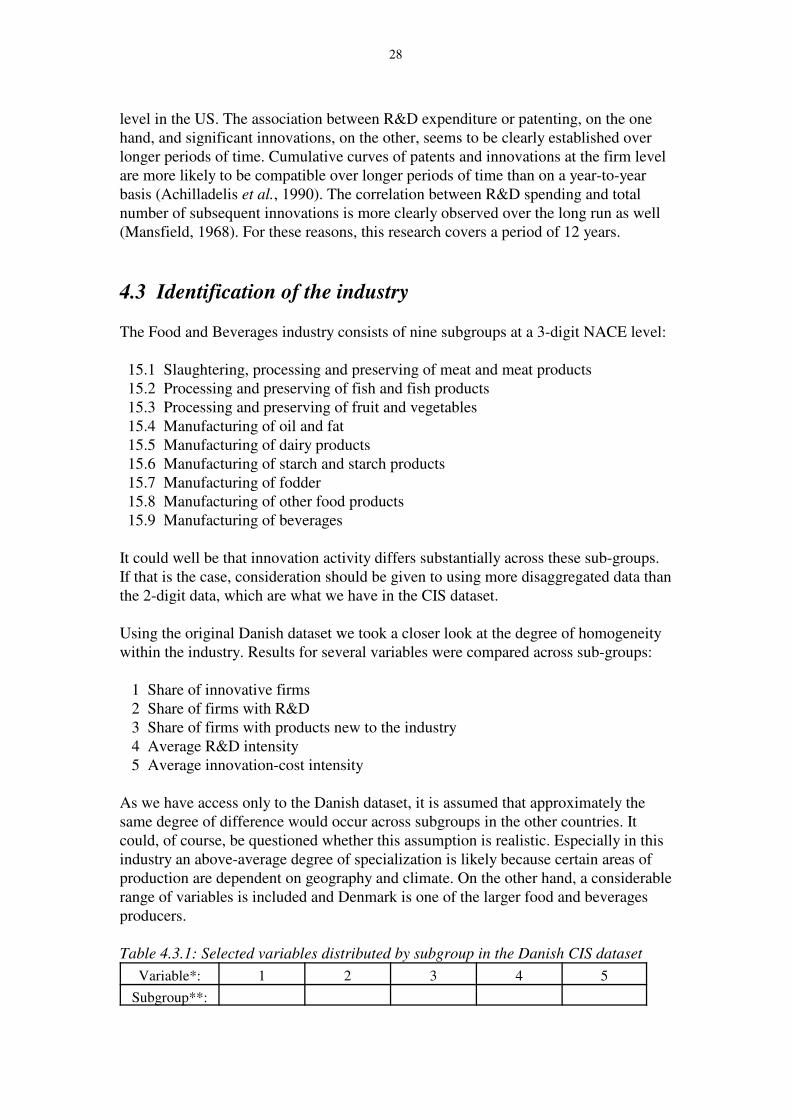
4.3 Identification of the industry
The Food and Beverages industry consists of nine subgroups at a 3-digit NACE level:
15.1 Slaughtering, processing and preserving of meat and meat products 15.2 Processing and preserving of fish and fish products 15.3 Processing and preserving of fruit and vegetables 15.4 Manufacturing of oil and fat 15.5 Manufacturing of dairy products 15.6 Manufacturing of starch and starch products 15.7 Manufacturing of fodder 15.8 Manufacturing of other food products 15.9 Manufacturing of beverages
It could well be that innovation activity differs substantially across these sub-groups.If that is the case, consideration should be given to using more disaggregated data thanthe 2-digit data, which are what we have in the CIS dataset.
Using the original Danish dataset we took a closer look at the degree of homogeneitywithin the industry. Results for several variables were compared across sub-groups:
1 Share of innovative firms 2 Share of firms with R&D 3 Share of firms with products new to the industry 4 Average R&D intensity 5 Average innovation-cost intensity
As we have access only to the Danish dataset, it is assumed that approximately thesame degree of difference would occur across subgroups in the other countries. Itcould, of course, be questioned whether this assumption is realistic. Especially in thisindustry an above-average degree of specialization is likely because certain areas ofproduction are dependent on geography and climate. On the other hand, a considerablerange of variables is included and Denmark is one of the larger food and beveragesproducers.
Table 4.3.1: Selected variables distributed by subgroup in the Danish CIS dataset
Variable*: 1 2 3 4 5
Subgroup**:
29
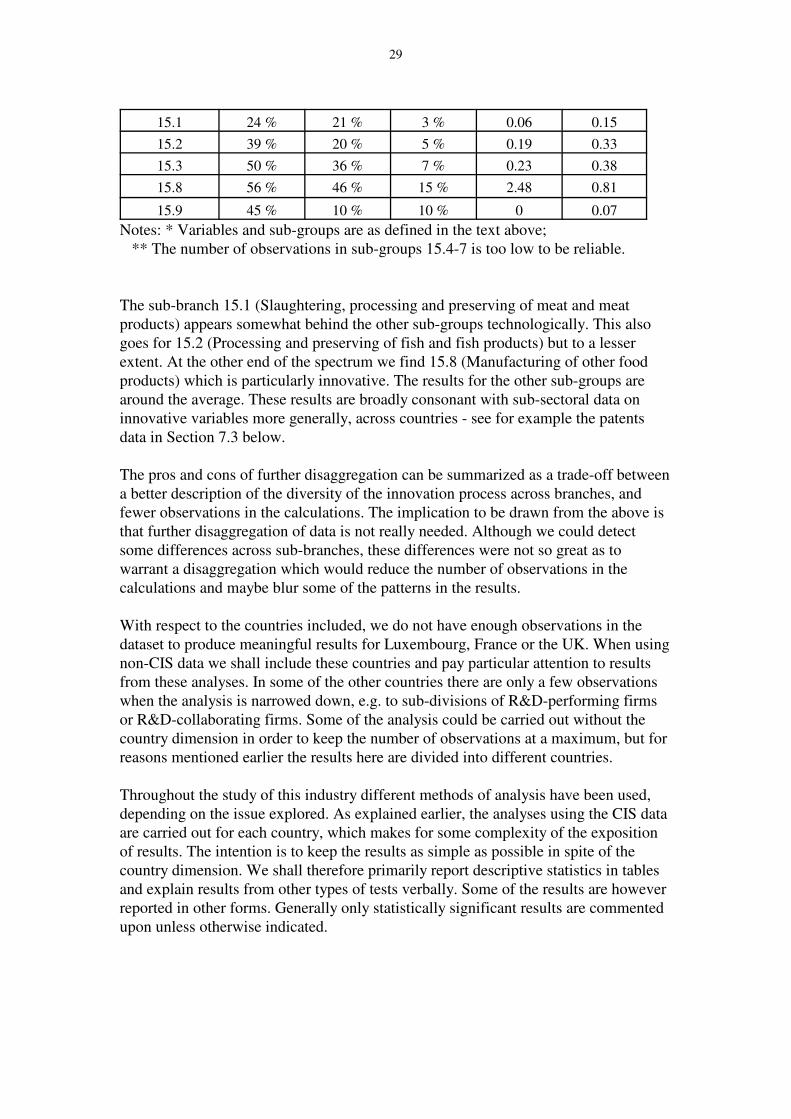
15.1 24 % 21 % 3 % 0.06 0.15
15.2 39 % 20 % 5 % 0.19 0.33
15.3 50 % 36 % 7 % 0.23 0.38
15.8 56 % 46 % 15 % 2.48 0.81
15.9 45 % 10 % 10 % 0 0.07
Notes: * Variables and sub-groups are as defined in the text above; ** The number of observations in sub-groups 15.4-7 is too low to be reliable.
The sub-branch 15.1 (Slaughtering, processing and preserving of meat and meatproducts) appears somewhat behind the other sub-groups technologically. This alsogoes for 15.2 (Processing and preserving of fish and fish products) but to a lesserextent. At the other end of the spectrum we find 15.8 (Manufacturing of other foodproducts) which is particularly innovative. The results for the other sub-groups arearound the average. These results are broadly consonant with sub-sectoral data oninnovative variables more generally, across countries - see for example the patentsdata in Section 7.3 below.
The pros and cons of further disaggregation can be summarized as a trade-off betweena better description of the diversity of the innovation process across branches, andfewer observations in the calculations. The implication to be drawn from the above isthat further disaggregation of data is not really needed. Although we could detectsome differences across sub-branches, these differences were not so great as towarrant a disaggregation which would reduce the number of observations in thecalculations and maybe blur some of the patterns in the results.
With respect to the countries included, we do not have enough observations in thedataset to produce meaningful results for Luxembourg, France or the UK. When usingnon-CIS data we shall include these countries and pay particular attention to resultsfrom these analyses. In some of the other countries there are only a few observationswhen the analysis is narrowed down, e.g. to sub-divisions of R&D-performing firmsor R&D-collaborating firms. Some of the analysis could be carried out without thecountry dimension in order to keep the number of observations at a maximum, but forreasons mentioned earlier the results here are divided into different countries.
Throughout the study of this industry different methods of analysis have been used,depending on the issue explored. As explained earlier, the analyses using the CIS dataare carried out for each country, which makes for some complexity of the expositionof results. The intention is to keep the results as simple as possible in spite of thecountry dimension. We shall therefore primarily report descriptive statistics in tablesand explain results from other types of tests verbally. Some of the results are howeverreported in other forms. Generally only statistically significant results are commentedupon unless otherwise indicated.

30
5. Trends in innovation in the industry
Traditionally the food-manufacturing industry has been regarded as rather minor in termsof its role in technological and economic development. Students of both innovationstudies and economics have been more attracted to the “high-tech” industries, where therole of science and technology has been more apparent. It is arguable that this has alwaysbeen something of an oversight: for example, the early stages of industrialization in anumber of European countries (including Denmark, Netherlands, Switzerland) wereprofoundly influenced by the technological and economic advance of food manufacturing(von Tunzelmann, 1995a). There is even less good reason to support the neglect of theindustry nowadays, for reasons to be detailed below, but there is little sign as yet of anywidespread appreciation of this situation.
We shall argue in this overview that the food-processing industry may become one of themajor “carrier” industries of the current phase of industrialization, known to somescholars as the “Fifth Kondratiev” (Freeman and Perez, 1988); though other industriesare likely to share this role. This “wave” has been sustained by dramatic technologicalchange in upstream industries, most notably electronics; more recently, areas likebiotechnology and advanced materials have emerged as high-tech fields with massiveopportunities in prospect. The role of the “carrier” industries has been less extensivelyanalysed. Their function was first elucidated by Rosenberg (1963) in studying themachine-tool industry in America in the nineteenth century. The carrier industries weredownstream consumer-oriented industries which embodied the advances carried outupstream in the machine-tool sector. In these industries, consumer demand confrontedthe supply of technologies, and the latter - the types and capabilities of the machine toolsthemselves - were changed both radically and incrementally to suit the needs of theformer. Typical carrier industries for machine tools in the nineteenth century were,successively, clockmaking, sewing machines, bicycles, and eventually automobiles(Rosenberg, 1963). From these downstream applications and modifications, the machine-tool industry itself found it straightforward to extend those changes to a host of otherapplications in less progressive downstream industries, adopting much the sameprinciples for different users (Rosenberg described this as “technological convergence”).
5.1 General Background
We consider that food processing and packaging may well act in similar vein as a carrierindustry in the foreseeable future. Of course we do not claim it will be the only carrierindustry; far from it. But the potential, in our view, has been largely ignored. One facetof this has simply to do with sheer size. The upstream and high-tech industries arecharacteristically of rather small size relative to the economies at large. This was true ofmachine tools throughout the nineteenth century, and remains true of biotechnology etc.today (though not true of electronics). Although their technological role is crucial, theireconomic impact will not be so great until their advances are embodied in a wide rangeof comparatively large downstream industries. The diffusion process involved hastypically taken a whole “Kondratiev cycle” to effect (von Tunzelmann, 1995a). An

31
9 Another view is that the location of processing has shifted from the household to the factory, e.g. through the kinds of
additional or improved packaging noted below, and thus rather artificially distorted the data.
implication is that the periods of technological ferment may not be ones of majoreconomic expansion, and this appears to be one important explanation for the“productivity paradox” of slow economic and productivity growth since the 1970s in the“Fifth Kondratiev”, notwithstanding the evidently dramatic transformation of industriessuch as information technology in that recent period. On the basis of analogies with thepast, it will require a “Sixth Kondratiev” of massive downstream applications to inducea macroeconomic effect of major proportions.
Let us now examine why the food and beverages industry would appear to possess someof the attributes required of an important carrier industry in any forthcoming “SixthKondratiev”. Clearly it has the size attribute, as shown in the data on the industry’s sizeprovided earlier in this Report (e.g. Table 2.1.1). Its rate of growth has been regarded asmore problematic. The consumption of food has traditionally been subject to “Engel’sLaw”, first elucidated in the 1880s; that as incomes go up, the share of food in totalexpenditures goes down. However it has been shown by econometric analysis that, whilefood consumption shows the expected pattern at any point of time in a country - that is,the relative expenditures of wealthy individuals and families are much less than those ofthe poorer - the pattern over time is not quite so distinctive. The decline in foodexpenditures through time is less rapid than might be expected from the cross-sectionaldata for a point of time (Deaton, 1975). It has been suggested by the econometricians thatthe rising importance of processing is an important reason for this slower decline in shareover time.9 Thus the decline of agriculture relative to national income has been muchfaster than that of food manufacturing - the value-added has been partially offsetting thedecline in share of the raw materials.
The case for food manufacturing as a carrier industry however rests on much more thanits mere size, significant as that may be. The old caricature of food processing as a rathersleepy industry has been changing rather sharply. Even today, food manufacturing isclassified by innovation studies as a “supplier-dominated” industry, dependent ontechnological changes in more dynamic upstream industries for any progress of its own(Pavitt, 1984). In our view this image is no longer adequate.
On the side of the supply of technologies, the “supplier-dominated” perspectiveunderestimates the role that empirical advances within the industry have long played. Themajor breakthroughs for the industry frequently arose out of needs generated within thesector itself, rather than being the chance application of ideas developed elsewhere forother purposes - examples include canning (at the beginning of the nineteenth century),pasteurization (in the middle of that century), and refrigeration (late in that century). Inthis sense, the “learning by doing” kind of technological change often received its initialstimulus from inside the industry, though further developed upstream. Secondly,“learning by using”, in terms of modifying and advancing the equipment supplied fromthe mechanical engineering and other sectors, always remained a potent force. It is true

32
that the latter can be compatible with the “supplier-dominated” view of the industry, butrecent advances go beyond that.
The major recent transformations of the industry can be summarised as follows. On thesupply side, there has been a substantial increase in the application of scientific asopposed to empirical principles for systematic advance in the industry. More importantstill, the range of scientific disciplines and technologies recruited to assist in the advanceof the industry has greatly widened in recent years. In the language of Schumpeter (1911),progress has come above all from new combinations - combinations of sciences,combinations of technologies, combinations of science and technology, and combinationsof these with wider changes in materials, industrial organization, markets, etc., in waysthat Schumpeter himself was at pains to stress.
Even these changes are, however, overshadowed by those on the demand side. In the lasttwo decades or less, the balance of the industry has swung from being supply-driven tobeing demand-driven. It is changing consumer tastes and requirements that have becomethe major determinant of the industry’s expansion. This has rarely, if ever, been the casebefore in regard to this industry, and it is the main reason for seeing it as prospectivelya major carrier industry into the future. These changes on the demand side have fedrapidly back to changes on the supply side, for example in areas like food packaging. Inthis way, the model of technological change has become far less “supplier-dominated”than it ever was. In place of a kind of “linear” model of change dependent on upstreamdevelopments (which at best can be accepted only with reservations, as we have arguedin Chapter 3 above), the relevant model of innovation is now much more like theinteractive model with feedbacks as developed by Kline and Rosenberg (1986). It isdifficult not to exaggerate the importance of this change.
5.2 Demand changes and product innovation
5.2.1 The context of demand
It is a widespread popular opinion that innovation in the food manufacturing industrymainly takes the form of new product development. Analysis has, on the contrary, shownthat for much of the twentieth century this has not been the case. Instead, the leadingcharacteristic has been one of great stability in the product range confronting consumersin a particular country. To explain this, we have to consider the oligopolistic structurethat has typified the manufacturing branches of food and drink, briefly described inChapter 2 above. The dominance of a smallish number of leading firms in many of themain product lines dates back in the case of at least some of the sub-sectors (like beer-brewing) to the early years of industrialization during the “First Kondratiev”. Such firmswere in the forefront of “the rise of the modern corporation” in the early twentieth century(Hannah, 1976), with much resort to takeovers and mergers.
The industry’s desire for stability through reliance on brand-naming strongly discouragedproduct innovation, at least by the established oligopolistic firms. Once a brand name hadentered consumer consciousness to the desired degree, the manufacturers sought to

33
change it as little as possible (Horrocks, 1991; e.g. for the case of Cadbury’s “DairyMilk” chocolate, introduced in 1905). Innovation in such products was thus limitedmainly to (a) improved processes for producing the same product, for which the firmswere often dependent on their equipment suppliers, and (b) ingredient changes thatpreserved as much as possible of the product’s sensory appeal but allowed productioncosts to be reduced (e.g. the replacement of cream with palm oil in ice cream byUnilever). Radically new products arrived occasionally, for example margarine, but thesetoo tended to settle down to a cosy oligopoly dependent on brand image, after quite ashort development phase.
With the assumed stability of final consumer tastes, major changes often arose from othersources of demand. Prominent among these was military demand, which emphasised firstthe need to offset the inherent perishability of most foods, and second the gains of easyportability. In response to Napoleon’s famous dictum that “An army marches on itsstomach”, the Frenchman, Nicolas Appert, experimented with the heat treatment of foodsduring the Napoleonic Wars, finding that when combined with hermetic sealing itprovided a satisfactory means of extending the “shelf life” of those foods; these advancesled to canning, as the first really revolutionary change in food processing/packaging inthe industrial era. Other areas in which military demand pioneered include instant coffee(the US forces responsible for developing much of the technology in World War II), themicrowave oven (a spin-off from trying to use very short-wave radio for early radar), andplastic packaging (retort pouch systems from the 1940s).
As in a number of other industries, the impact of military demand on food processing andpackaging has been waning in the later years of the twentieth century. The NASA spaceprogramme and similar mission-oriented public programmes had only a limited effect ofchanging the nature of food products. The civilian economy and traditional finalconsumers would now have to play the lead role in radical product change.
In the event, the role of final consumers over the past 15 or so years has radically alteredinnovation in the industry, to an extent unimaginable under the notion of the brand-loyalcustomers of the oligopolies. It is these who, en masse, have pushed the industry frombeing supply-driven to being to a much greater degree demand-driven. Their radicallyaltered function has in turn been driven by broader socioeconomic and lifestyle changes,such that it seems reasonable to predict that these changes are quasi-permanent, thoughto date they have had very different degrees of impact in different countries. At the sametime, they retain much conservatism about the sensory evaluation of food (they like theirpeas to be green, their yoghurt to be viscous, etc.), and industry’s problem is getting theright blend of novelty and tradition.
There are some important examples of consumer tastes being influenced by the consumerdurables which the rising incomes of consumers have allowed them to afford, especiallyas the costs of the appliances fell. Two of the most notable have been the diffusion acrosshouseholds of fridge-freezers and more recently of microwave ovens, both of which havehad considerable impacts on the types of food consumed. Even these, however, alsoreflect underlying changes in lifestyle which have helped make their diffusion especiallyrapid in certain countries.

34
10 Advanced packaging and microwave ovens simplify the preparation of exotic foods; see below.
The major socioeconomic changes relevant to this issue have included:
a) Global competition between producers for market share, which has helpedrestructure tastes (Coca-Cola, MacDonald’s, megabrand beers, etc.) and alsorestructure the older national oligopolies. Competition from new industrializedregions has undermined brand loyalties and provoked demand for novelty. TheJapanese food manufacturing industry, for example, has been characterised forsome decades by a high rate of product innovation, as has the North Americanindustry in certain branches. These have both competed and collaborated withEuropean producers.
b) Rising incomes and embourgeoisement of the social structure, which haveincreased demands not only for the consumer durables mentioned above but alsofor foodstuffs. As in other industries like automobiles, the rising incomes haveencouraged levelling-up of tastes but also some diversification of tastes - a desirenot just to “keep up with the Joneses” but to differentiate oneself from theJoneses. This differentiation of product demand has extended to processed andunprocessed foods in ways described below. It has paradoxically accompanied the“globalization” of taste patterns just referred to, with a great expansion ofconsumption of ethnically varied foods and meal structures, which the majorretail chains now cater for.10
c) Rising employment of married woman in the workforce, albeit much of it ona part-time basis. Apart from boosting family incomes, this has helped encouragethe interest in prepared or semi-prepared foods such as “ready meals”, wheredemand has grown especially rapidly in the past decade. It has also alteredshopping habits, in conjunction with a fall in average household size and with thehousehold technologies noted above, towards once-weekly or similar behaviourin giant supermarkets (single people shopping spend one-third of their budgetson convenience foods). The retailers have been especially prominent ininnovating in areas such as chilled ready meals, led by Marks & Spencer in theUK.
d) Increased pressure and stress in life, for adult males as well as females. Thishas encouraged an interest in rapid consumption as well as rapid preparation offoods. “Snacking” has also grown at unusually rapid rates in recent years, andalong with it a burgeoning of snack foods. New York is often identified as thecity where “grazing”, i.e. eating sporadically in an unstructured way, firstdeveloped. Together with the preceding factors this has underlain a decline inregular sit-down family meals based on intensive preparation.
e) Changes in the age distribution of populations, especially the trend towards“greying” population profiles, have altered the composition of demand. Therehave been relative increases in demands for health foods, mostly purchased from
35
specialist shops, and research into foods appropriate for specific physiologicalconditions, e.g. diabetics. Interest in vegetarianism has been growing, and by1992 vegetarian foods constituted about 10% of frozen and chilled products(Bond, 1992), since when the proportion has risen. Recently there has been muchconcern with “functional foods”, i.e. everyday food and drink products which addsupplements that have direct purported physiological benefits, e.g. high fibre orprotein-enriched.
f) Partly as an offshoot of this increased pace and stress of life, there has beenincreasing concern, especially in the wealthier countries, about personal healthand deleterious eating behaviour for people in all age groups. There has thus beenan enormous expansion in healthier foods, e.g. low-calorie, low-fat, low-cholesterol or low-sodium foods, as discussed further below. It has also requiredfood manufacturing companies and government regulators to take much greateraccount of food safety, e.g. microbial contamination. However this has takenplace in an environment in which consumers want much greater naturalness intheir foods, which has been expressed most vehemently in the campaigns againstchemical additives.
g) Thus environmental concerns have also strongly influenced the industry. Inaddition to the above, a major area of public concern relates to packaging, andespecially the use of plastics such as PET.
It has been far from easy for the food manufacturing industry to comply with this rangeof change in tastes. For example, manufacturers feel caught between the Scylla ofincreasing the freshness and naturalness of foods by reducing additives and the Charybdisof increased risk of food contamination by micro-organisms. Especially difficult, and amajor focus of research interest in the early 1990s, have been the organoleptic (i.e.sensory etc.) implications of “healthier” foods. Removing the fat or salt, or adding thefibre, etc., alters the taste, the aroma and the “mouthfeel” of the product. Manufacturersoften feel obliged to compensate for these perceived losses, and add back ingredientswhich in a sense make the resulting product much more artificial than the original“unhealthy” item.
5.2.2 New Products
Many of these determinants and constraints surface in detailing the kinds of product-oriented innovation that have been conspicuous in the last few years.
a) More exotic foods. Spurred by the socioeconomic developments noted above,and by consequences such as greater international travel (exposing people to amuch wider range of food styles), retailers in European and other countries havescoured the world for both raw and processed foods that would appeal to a moresophisticated consumer population. The common allusion to the breakdown ofCommunism in eastern Europe as the “kiwi-fruit revolution” is just one exampleof the permeation of new tastes and consumer aspirations. Brand names as well

36
11 Because of the (permitted) use of some local raw materials and standards, these local copies often differ from the product
in the country of origin.
as product types have become internationalized in terms of both production andconsumption, for example the widespread brewing of beer “under licence”.11 Asimplied above, the most striking change has, however, been towards ready mealsthat duplicate (as far as possible) ethnic dishes and meal patterns.
b) More prepared foods. For reasons given above, the amount of cooking andsimilar preparation in the home has been declining, and the purchase of readymeals off the shelf of supermarkets expanding. Analysis of new productintroductions into UK supermarkets in the early 1990s has demonstrated that thefastest growth has been in frozen foods and especially in chilled foods and“ambient products” (sauces etc.) (Bond, 1992). These have required processchanges and especially the maintenance of quality standards along lines discussedbelow. An offshoot has been the rapid increase in numbers of microwaveablefoods - the microwave oven has limitations in regard to certain aspects of foodpreparation, such as adequate browning and crisping, and this has been counteredby manufacturers in a variety of ways. Consumers have also been demandingfoods that taste fresher, and this has been met in part by altering supply chains,for instance by in-supermarket baking of breads.
c) More casual foods. In conjunction with the lifestyle changes referred to above,there has been a rapid growth in demand for snack-type foods. In practice, thereare large discrepancies from one country to the next in what are to be classifiedas “snacks” (White, 1994), but the overall trend towards more casual eatingseems unmistakable. This has progressed fastest in the most industrializedcountries, led by North America, north-west Europe and Japan. The frequentassociation of snacks with “junk food” has put pressure on producers to increasethe nutritional value of snacks and to reduce the unhealthier characteristics towhich they are particularly prone.
d) Healthier foods. The demand for low-calorie and similar preparations thatreduced the intake of allegedly “bad” ingredients was promoted in the firstinstance by concerns about physical appearance and especially obesity. Insouthern European countries, this remains the most important element in tasteshifts, but in the above-mentioned industrial regions the changes have been moreextensive and “positive”. These involve both the reduction of a wider range of“bad” constituents and the enhancement of allegedly “good” ones. Some of thesechanges are of long standing - for instance, decaffeinated coffee was firstproduced (by Hag) in Bremen in 1905, but consumption patterns have shiftedmore rapidly towards them in recent times.
It should be pointed out that scientific knowledge of what is good or bad is notoriouslylimited - for example, it has been shown that, while the relationship between blood-serumcholesterol and heart disease is evident enough, that between dietary cholesterol and

37
12 In the early 1990s p.c. consumption of fibre in breakfast cereals was still well below that recorded for the 1950s, partly
because of a lower overall consumption of such foodstuffs.
blood-serum cholesterol - or heart disease - is much less clear. Manufacturers in areaslike sugar or butter of course have strong vested interests in asserting the healthiness oftheir products, and competing claims abound. Most consumers now accept theunhealthiness of tobacco, and this has led major manufacturers into quests for newmarkets (developing countries etc.) or diversifying out of tobacco (e.g. Philip Morrisacquiring Jacobs Suchard). In regard to food products more narrowly, the main consumerconcerns have been reducing intake of calories and fats, and replacing fats with complexcarbohydrates (e.g. starch, fibre). Although there has been a marked shift in products suchas breakfast cereals towards high-fibre and similar enriched items, there has been no greatincrease in per capita consumption. 12 A converse pattern seems to emerge for sugar,consumption of which has fallen little despite the undoubtedly growing use of sugarsubstitutes. Other items accepted as having health virtues have suffered from lengthy orawkward preparation, such as rice, which in turn has led manufacturers to developingrapid rehydration and “boil in the bag” varieties. Environmental concerns have alsopromoted some interest in materials preparation, as for sales of “organic” produce, butagain growth has been rather slow, because of anxieties about safety and because ofrelatively high prices.
Although the shift to “functional” foods has been rather general across the advancedindustrial countries, the products and health concerns have remained somewhat different.In Japan, for example, a major public concern is with consumption of oligosaccharides,which have been of little moment to European consumers (Hilliam, 1995). This hasallowed scope for a certain amount of global co-operation in borrowing specific processes(such as the Japanese “surimi” process) and product types (e.g. oriental “puffed snacks”and crackers), without jeopardising product market shares. There has been somediscussion suggesting that, by use of techniques to be elaborated upon below, functionalfoods may evolve into “designer foods”, with more precise tailoring of a range ofattributes as well as nutritional content.
It appears widely accepted, at least in Europe, that local markets remain quite stronglydifferentiated, and that US and other manufacturers aiming to penetrate the Europeanmarket(s) have not fully comprehended the need for local product variation (Smith 1991).This point is developed more fully in Chapter 7 below.
5.2.3 New Materials (ingredients)
Similar factors to those mentioned for new products underpin the evolution ofingredients, and of course it is often the change in ingredients which brings about thechange in product. For example, exotic meals require the addition of exotic spices andflavourings. Even here, however, the “exotic” ingredients can be applied to a wider rangeof foods and drinks. An example is provided by soft drinks, which have begun toincorporate a broad range of flavours, such as new herbals, new fruits, and “sports

38
drinks” (mostly based on dextrose). Even new tastes have been imported - the Japanesehave promulgated the “umami” taste, which they claim differs from the four classicwestern tastes (sweet, sour, salty, and bitter), and which is associated with the presenceof glutamates. Moreover, the shift to new forms of household processing like microwaveovens has had implications for the ingredients used - for example, it has been found thatwaxy maize starches perform much better in microwave ovens, as compared with thetraditional starches that out-perform them in conventional ovens. Here we shall focus ontwo main types of ingredient change.
a) The substitution of “natural” for “artificial” ingredients. Consumer demandsfor natural rather than chemically based additives became intensified followingGerman regulations of the late 1970s and subsequently EC regulations requiringthe listing of such additives (“E-numbers”), not least because some of theadditives like the colouring tartrazine (E-102) were earning a bad press forpsychological or physical reactions, and some criticized as being potentiallycarcinogenic. The return to more natural ingredients involved higher costs insome cases, but this was not the only problem.
i) Additives used as emulsifiers, stabilisers, antioxidants, etc. figuredconspicuously among the “E-numbers”, and though many were probablyrelatively harmless, the publication of their presence alerted consumersand dissuaded manufacturers from using them. Oxidation of food is themain source of its perishability, and the more dubious chemical additiveswere in part replaceable by “beneficial” antioxidants like ascorbic acid(vitamin C), or proteins like glucose oxidase, or natural antioxidants likesome tocopherols (including vitamin E). Gelling is increasingly beingassisted by pectin, mostly obtained from apples, with the recentdevelopment of high as well as low methoxyl pectins, and recently of“instant” pectins.
ii) In regard to the more intrusive additives, influencing taste, colour, etc.,the problems became more apparent. Many authentic flavours, e.g.strawberry, are harmed by even the slightest amount of processing, sosubstitutes have to be sought. Since additives produced from nature(plants, fungi, etc.) were deemed to be more acceptable, manufacturersthus searched for “nature-identical” additives. This included theinvestigation and analysis of a range of exotic natural products. Aconsiderable difficulty is that there remain many differences in definitionsof what are “nature-identical” additives, and one of the objectives of EUharmonization is to bring greater consistency into this area.
b) The development of ingredients to compensate for the loss of organolepticproperties in “healthier” foods. The reduction or virtual removal of elements likefats and sugar, as consumers increasingly demanded, was in itself relativelystraightforward. What was problematic was to replace the contributions theseelements made to the “mouthfeel” of the product. In some cases, like skimmedmilk, no attempt was made to reproduce such “mouthfeel” (as compared with

39
full-cream milk), and it was assumed that consumers would tolerate this. In mostcases, however, this was not thought to be so, and a major proportion of product-oriented R&D in the industry as of recent times has gone into compensating forthe loss of fats and sugars. Flavour “enhancers” like maltol and ethyl maltol arebeing used in the meantime for low-calorie foods, and hydrocolloids (food gums)to mimic the texture of edible fats.
i) The reduction of fats has been particularly problematic, in view of therange of attributes which fats add to the foods that naturally contain them.Carbohydrates like the maltodextrins replaced some of the properties offats, as did emulsifiers, but efforts were made to bypass these too, eitherusing process innovations like vacuum drying, or developing enzymicprocesses to obtain bulking agents. Protein alternatives are desirable forreasons just given, e.g. the use of isolated soy proteins in reduced fat andreduced cholesterol items, or whey protein concentrate from milk (andvery recently whey protein texturisers).
ii) New substitutes for sugar were established in the chemical field.Saccharin had a long history as a sweetener, but the taste was deemedunsatisfactory in many uses. Cyclamates tasted better but on chemicalgrounds failed to win regulatory approval in many countries, includingthe USA and UK. Hence new “intense sweeteners” like aspartame founda large market in products like sugar-free soft drinks, but they too werechallenged on chemical grounds, and in particular for their lack of bulk(glucose syrup often had to be added); moreover aspartame as a proteinsuffered some degradation through time. The sugar-based polyols (sugaralcohols), like sorbitol, mannitol and xylitol, many originally derivedfrom natural sources, have been adopted instead in such items as no-sugarchewing gum. Enzymic processes for converting starches into sweetenersare being heavily researched, but products that replace all the functionsof sugar simultaneously are not yet in sight.
Overall, we might classify the changes as involving: (i) a shift from chemical additivesto the biopolymers (proteins and polysaccharides like starch); (ii) an associated upsurgeof interest in enzymic processes for modification, discussed below in relation tobiotechnology; (iii) the problems of meeting a diversity of functions (and particularlytheir synergistic interactions) supplied by food in its “natural” state, especially when thesources of those functions are wholly or partially removed; (iv) the role of legislation inlimiting the changes that are permissible, though the regulatory structure for novel foodsand ingredients remains rather chaotic.
5.2.4 Product Quality and Safety
A major shortcoming of removing additives and also the natural ingredients was ofendangering the quality of the product. The main objective in product quality formanufacturers has been one of extending “shelf life”; an aim that as we saw above dates

40
back to the development of canning two centuries ago, and indeed to the role of salt andspices in still earlier times. As manufacturers see it, consumers are wanting food to tastefresher and fresher, but with fewer and fewer of the constituents (preservatives etc.) thathave traditionally offered such possibilities. But it was not just the ingredients that posedthis dilemma - the same went for processes traditionally used to maintain food quality,like heating or freezing.
An important part of maintaining and (preferably) raising quality in food manufacturinghad to do with the raw materials; for example the closer control of fruits and vegetablesduring growing, the reduction in animal stress prior to slaughter, and the development ofsoft wheats (rather than processing hard wheats) for biscuits. By and large these falloutside our concern, except in the sense that the whole food chain was in question. Incountries like the UK, it is the large retailers (supermarket chains) that have taken controlof the product chain, as purveyors of the fast-growing ready meals noted above. Marks& Spencer et al. exercise rigid (some would say ruthless) control over at least theirdomestic suppliers. To some degree, this change has been at the expense of closer linksbetween manufacturers and growers (Raven et al., 1995).
Within the food-manufacturing segment itself, advance has come from the whole rangeof possibilities, e.g. in beverages from a combination of changes in materials, processesand packaging, which have increased the stability of the product. These are dealt withindividually elsewhere, but this is an appropriate point to focus upon instrumentation asa key field for monitoring product quality. Metrology - the science of measurement - hashad to evolve in the context of rising awareness of the roles of chemistry, physics,biology, etc. in determining product quality performance. A major problem has been thedifficulty of measuring many of the attributes of food quality that one would ideally wishto monitor. The rheological properties of foods (texture, viscosity, etc.) and especially thesensory attributes remain very awkward to measure by objective means.
An important and growing function has been to gauge the quality of the raw materials.Testing wheat quality was one of the first functions assigned to specialist R&Dlaboratories in the USA a century ago (Mowery and Rosenberg, 1989), and more recentlythe kinds of measures used have been augmented, e.g. using instruments to measure theextensibility of wheat in order to assess its hardness. Regulatory requirements have alsobeen stepped up in regard to the quality of materials, e.g. EU regulations that requirestarches used in non-food applications to be 97% “food-grade” quality.
Application of instruments to food processing has raised even bigger problems. Testingin R&D laboratories, even if set up “in-house” within manufacturing firms, hascustomarily been time-consuming, skill-demanding, and only moderate in its accuracy.The normal procedure has been to take samples from a given product at the relevantprocessing stage, remove it to the lab, test it using “wet chemistry” methods by qualifiedscientists, then decide on its acceptability; by which time the offending item may longsince have left the factory. Conversely, if (to meet regulatory standards or whatever) theresults of the tests have to be awaited, there will be a long delay in productionthroughput. This is simply one way in which time is of the essence in modern foodprocessing.

41
13 Examples include electrophoresis for protein analysis, Nuclear Magnetic Resonance (NMR) for determining the quantities
of liquid present etc., Near-Infrared Spectroscopy (NIR) and other types of vibrational spectroscopy for measuring moisture andalso protein etc. (and alcoholic content of wine in France), plasma emission spectrometry for detecting minerals.
Time is not the only problem. The sample is not necessarily valid for the whole productfrom which it has been removed - in particular, the concern with most irregularly shapedfoods is that information is required about what is taking place at the centre of the item(whether the centre has been adequately frozen, cooked, etc.), but this is difficult todiscover without disfiguring the item in question. The despatch to the lab may also alterthe sample’s characteristics. Hence the main quest has been to develop methods of testingthat are i) more reliable, and ii) applicable “on-line” and in real time (i.e. whilecontinuous processes are actually taking place). The latter in turn requires procedures thatcan be used, and reliably, by relatively unskilled operatives on the production line;moreover it requires equipment that is not too cumbersome and is sturdy enough to beused on the factory floor. Many of the changes in instrumentation and quality assessmentthat have taken place in recent years fall into these categories; though there is still someway to go before on-line real-time evaluation becomes a reality in most branches of theindustry. At the same time, it is becoming increasingly apparent that monitoring must becontinuous; for example, the temperature of frozen or chilled products must be trackedthe whole time (“full history”) if product quality and safety is not to be risked, includingmore careful handling during retailing.
Advanced instrumentation itself has replaced some of the wet chemistry procedures, withall their shortcomings. Many have been adapted from first use in biomedicalapplications13: even more recent developments include X-ray fluorescence (e.g. to assesspresence of salt or ash), ultrasoft X-rays (e.g. to detect meat contamination), and DNAassays based on monoclonal antibodies (for microbial detection, and increasingly forassessing texture, appearance etc. via the presence of biopolymers). These instrumentsare by no means cheap, though they are becoming economic for use in food-processingplants with sufficient scale (i.e. throughput levels). Their main advantages over wetchemistry are higher speed, increasing user-friendliness (ability to be used by semi-skilledoperatives), lack of environmental risk, and accuracy; though these problems have by nomeans yet been fully solved. Interpreting the spectra from, say, Near-InfraredSpectroscopy (NIR) remains quite an art, despite the growing availability of computerprocessing of the output; and the now-popular combination of chromatography andspectroscopy for analysis, apart from being somewhat expensive in equipment, stillrequires some sample preparation (via centrifuges, filters, etc.). In addition, it is beingrealised that scientific predictions are of little use, because of generally being carried outunder “optimal” conditions - hence mathematical modelling is trying to incorporate awider and wider range of variables of the kinds actually encountered under productionconditions.
As implied above, many of the most critical characteristics of food still by and large liebeyond the capability of instruments; above all the organoleptic properties, for whichpanels of alleged experts remain the overwhelmingly dominant method of assessment.Attempts are under way to supplement these rather subjective procedures, e.g.

42
physiological monitoring of the panellists themselves (electromyography), or the use ofgas sensors as an “electronic nose”, or optoelectronic means of assessing colour, ormachine-vision methods (using lasers etc.) for sorting and for analysing high-speedmotion; but most of these are understandably in their infancy. Greater rigour in panelassessment has been sought, for example through “quantitative descriptive analysis”(QDA) or the application of expert systems etc. Here too it is being found that analysishas to be continuous rather than one-off or intermittent, and of course this is very labour-intensive. Equally it has been shown that there is a large amount of discrepancy injudgements between different countries, which no doubt include objective discrepanciesin what is being looked for as well as subjective discrepancies in panel quality. EUharmonization programmes have been initiated in such areas, especially the FLAIR(Food-Linked Agro-Industrial Research) programme which ran from 1989 to 1993, anda European Sensory Network was established in 1989 (indeed the latter helpeddemonstrate the cross-country differences just mentioned - an issue we shall come backto later). Additionally, there have been attempts to award European accreditation tolaboratories meeting acceptable standards in their testing, as it is granted that in practicemeasurements vary quite widely between different labs.
Supranational and national regulatory bodies also exist to oversee any attempts to passpoor-quality food and drink off as being of good quality. Since time immemorial, theindustry generally has tempted its producers and distributors into adulteration (e.g.Hobsbawm, 1957). The original Food and Drugs Acts in the UK (1875) were passed totry to counter fraudulent practices of such kind. The industry - like many others - is oftento be found replying that its members stand too much to lose from cheating, especiallythe large oligopolistic concerns, and has tried self-regulation by detailing “GoodManufacturing Practice” (GMP). It is however obvious from the much-publicized courtcases that the practice has far from disappeared, though it may well be diminishing.Wines and fruit juices (a high proportion of the latter advertised as 100% pure but in factvariously containing extra water, sugar, “extenders” like pulpwash, colours, acids, etc.)have figured prominently here. New technologies give opportunists a broader range ofpotential tricks of the trade, but equally they give the regulators greater powers ofdetection. It has been argued that the situation is best seen as one of an on-goingevolutionary race between adulterators and regulators (Hall, 1992).
Quality assurance standards like ISO 9000, BS 5750 and EN 29000 have been of someuse in focusing attention upon quality issues (also EN 45000 for good laboratorypractice), but have been nowhere near adequate to meet the main concerns directed bythe public against the industry. This is most evident in safety standards, and especiallythe dangers of microbial or other contamination of foodstuffs. To meet these - and indeedthe wider range of issues - a major objective for the 1990s has been to identify andrespond to specific aspects of the production process that could possibly create hazards,and these are known as Hazard Analysis Critical Control Points (HACCP). There isgeneral agreement that imposition of such criteria calls into question much more of thefood manufacturing process than do the orthodox quality control standards, for exampleinsisting upon assessing the slowest heating or cooling points. The EU has programmesto elucidate HACCP standards, but it is quite apparent that just their identification, muchless their harmonization, is extremely onerous. Nevertheless, the industry has to think in

43
terms of gearing its processes and products to HACCP within the foreseeable future. Thiswill necessarily involve more accurate and much faster on-line methods and instruments.
As with quality testing more generally, the objective in safety assessment is to establishreal-time evaluation, and combined with production control (e.g. on continuousprocesses). Traditional microbiological tests to detect e.g. listeria or salmonella arenotoriously slow, taking up to several weeks to produce results, because of the sequenceof stages of sample pre-enrichment, enrichment and plating out that have to beundertaken before biochemical testing. The accuracy of the results seems acceptable; theproblem is that the procedures are time-consuming, costly, and sample-specific.Developments in instrumentation have cut the time required to a number of days (lessthan one week), but the time lapse is still far too long for practical effectiveness.Currently much favoured are identification methods emanating from genetic engineering,like DNA “fingerprinting” or nucleic acid probes; progress is rapid but many problemsremain. Of particular interest has been the utilization of the “Polymerase Chain Reaction”(PCR) for DNA enrichment, as developed in the USA jointly by Cetus (from thebiotechnology side) and Perkin-Elmer (from the instruments side), which drasticallyreduces the enrichment stage. Equivalent if less dramatic advances have been takingplace in identifying non-microbiological contaminations e.g. by heavy metals or byforeign bodies like glass splinters (including dealing with outbreaks of tampering).
These advances in techniques and accompanying regulatory changes were partly aresponse to safety scares in the late 1980s. The suggested solutions ranged from thesimple to the complex. Much could be done by improving hygiene criteria for theequipment - designing the machinery for hygienic operation as well as makingmaintenance (cleaning) more straightforward. At the other extreme, evidently theadequacy of food science and technology was much less than the industry and othersbelieved. The BSE scares have made this all too plain, along with the costs the industrywill bear if it transgresses. A conclusion that many drew is that approaches to foodquality and safety had to become much more multidisciplinary, not only because of thecomplexity of the food products but also because of the complexity of the problems theyraised.
5.3 Supply changes and process innovation
5.3.1 Scientific advance
This multifaceted approach to the problems encountered by the food industry has beenrevealed in its recruitment of a much more diversified body of sciences. The industry hada long tradition of solving its problems - or at least partially solving them - by empiricalmeans, with the science (if any) following after, e.g. pasteurization-microbiology,refrigeration-cryology. Attempts were indeed made from a relatively early stage toincrease the scientific content of food production, but apart from isolated areas such asthose just referred to, these by and large earned a poor reputation. Food science (or“domestic science”) was seen as a substitute for the “hard” sciences like physics forwomen to study; with the implications that it would not be over-taxing of their

44
supposedly tenderer intellects, and that it would prepare them for married life in thehome. Many secondary schools in the UK set up such courses, and at least one universitycollege (King’s College for Women) was founded for these purposes (Dyhouse, 1981, pp167/9). The subject was heavily criticized from its inception both for its content and forits motives, but to this day science in the food area carries certain connotations of thesekinds, which has probably hindered its progress. Most now however accept that, far frombeing relatively “soft” and easy, the science required for such applications is in fact forthe most part very demanding, not least because of the multidisciplinary standpointsinvolved. The more that science is applied, the more it becomes evident just how littlescience has so far achieved.
a) Mathematics. Predictive modelling in areas like microbiological and othercontamination has been going on for over 60 years, e.g. predicting the lethalityof bacteria, or the impact of radioactive fallout. The poor performance of thesemodels in practice, as shown up in outbreaks of food poisoning, or in the grossunder-estimate of some of the consequences of Chernobyl, have (as mentionedabove) induced the development of models encompassing a much wider range ofvariables, as empirical analysis and the findings of other sciences show them toplay their part. These much more complex models require not only moredemanding analysis in the mathematics (e.g. computational fluid dynamics), butresort to simulation and the adoption of multivariate statistical procedures.
b) Computer science. For real-time analysis, the interpretation of data such as theFourier transforms used in NIR spectroscopy etc. requires very fast computingpower. Naturally, the availability of high-speed workstations at comparativelylow cost has greatly facilitated the adoption of such instrumentation in the pastdecade or so, and the instruments and computers can readily be networked.Problems of the user interface have also been much diminished. Databases arecurrently under development, though much needs to be done to network these.The biggest difficulty nowadays in most cases - as in many other areas ofcomputer application - lies in the software. Gradually the software needed tomaintain quality standards along the food chain is emerging, but the “bottleneck”is a constrictive one. User software has been identified as the greatest single costin developing process control systems (Womersley, 1991). Expert systems havebeen proposed, and a number developed for factory-level use. The main focusnow is however upon the rival approach of neural networks (Wallin, 1995); thereasons being that practical data arising out of food processing are inherentlysomewhat “fuzzy”, and that systems which allow the programmes to “learn” haveenormous advantages where even the underlying principles remain ratherobscure.
c) Physics. The increasing use of advanced instruments, and the growingawareness of the complexity of the relevant physical processes and modifications,have promoted interest in more formal development of the physics of foodmanufacturing. The basic processes like heating and cooling are greatlydependent on such understanding and on advancing it. Optics and sonics are bothbeing adopted in highly imaginative ways to deal with some of the industry’s

45
14 Greater specificity of enzyme use in recent applications include lactase in milk, alpha-amylase in bread, lipases in fats and
oils, phospholipases for emulsifiers, and widespread use of proteinases e.g. for cheese ripening, soup flavouring and meattenderising (Law, 1990).
15 In the past, the main use of enzymes has been for degradation (hydrolysis, e.g. hydrolysing proteins into peptides), but a
much wider range of applications now seems attainable, especially in low-water environments (e.g. for producing emulsifiersor conducting biotransformations) where enzymic methods consume much less energy etc. than chemical ones, and can produce
more intractable problems. New areas like irradiation of food to destroy bacteriahave been developed, but their use remains costly and rather controversial.
d) Chemistry. Chemists have traditionally dominated scientific recruitment intothe food-processing industries. If anything their importance rose as recently as the1970s, when consumer pressure for reliable food first began to be exerted. Asimplied above, this pressure moved away from chemicals during the 1980s, andwith that went some loss of faith in what chemists could do (coupled with thegrowing need for filling other scientific gaps). However, important chemicaladvances continue to arise, for instance there remain many adherents to chemicalprocesses for modifying proteins (relying on safe reagents). Moreover thechemical industry and especially the pharmaceutical industry appears to be themodel of organization that many in the food industry implicitly aspire to. Manyof the instruments and techniques it employs were “borrowed” from earlier usein these industries.
e) Biotechnology. The shift away from wet chemistry has mostly been to the gainof biological approaches. Food and drink was of course the major area ofapplication of biological technologies from ancient history (baking, brewing,etc.). But as in areas like pharmaceuticals, though even more powerfully, it is thepotential of latest-generation biotechnologies that have attracted most research.Enzymic methods are being sought to replace chemical additives of virtually allkinds, and this is an industry which habitually uses many of them. The firstenzyme products from genetically engineered organisms entered the market in1989/90, based on work done at MIT etc. The implication is that biologicalapproaches are likely to be much safer, although current regulatory standards insome countries (those that adopt the “positive list” approach of what they willapprove, rather than the “negative list” one of what they disapprove of) often runcounter to this presumption. Protein engineering, which has been at the leadingedge of recent applications of genetic engineering, has thus proved especiallyattractive a prospect e.g. in replacing purification techniques, though muchremains to be understood of the basic biotechnology itself.
The use of proteins in food goes well beyond their nutritional value, for exampleto incorporate their roles in thickening, water- and fat-binding, gelation, foaming,emulsification, colouring and taste.14 The consumer take-up of bio-engineeredfoods like mycoprotein has however been disappointing to some. For the timebeing, it looks as though the main uses will be for ingredients and theirmodification (including improved starter cultures), and for product quality andsafety assessment (using the DNA assays as outlined above).15 Some proteins

46
more targeted products.
themselves can be used for rapid microbiological diagnostics (e.g. lectins). Theshift to “healthier” foods described previously is a major stimulus to research anddevelopment in this area: it is biotechnology that is being mostly considered toresolve the inherent conflict between the naturalness and the maintenance offreshness of foods. The particular role of biotechnology is further isolated in othersections of this Report, e.g. in the discussion of patenting in Section 6.3.
Other areas of current scientific focus are likely to prove significant for the food industry,like optoelectronics. In the meantime, we can however expect that such expertise willmainly be sought from outside the industry. Within the sector, the issue is often seen asone of choosing which scientific approach will be adopted for a particular problem,where the choice is either/or. For example, the modification of milk to produce“healthier” butter can be undertaken by physical means, by chemical means, bybiotechnological means (now much researched), or by dietary means (changing what isfed to the cows - this seems the simplest and arguably the best). In the longer term, theoverriding concern is likely to be with bringing together the results of such heterogeneousscientific advance into developments that are of concern in production. This highlightsthe importance of the “transfer sciences”, to which recent work in innovation studies hascalled special attention (OECD, 1992). It also highlights the need for improved networksof communication, as the complexity of demands becomes more and more apparent. Thepast record in terms of, for example, links between nutritionists and toxicologists, hasbeen distressingly poor.
5.3.2 Processes
The processes employed in manufacturing food and drink thus aim to coalesce thismultiplicity of scientific advance with the rapidly growing importance and change in finaldemand demonstrated above. Both heating and cooling have been profoundlytransformed by these new requirements.
Some of these changes have been drawn directly from the demand-side technologiesthemselves; for example there is growing use of microwave heating in industry-scaleoperations, including its use for pasteurization (at moderate levels of heat) and tempering(raising the temperature of frozen food without thawing). The familiar domesticadvantage of microwaving for rapid treatment is essentially duplicated for industrialpurposes, though this requires greater care in the handling of the process in view of itsbeing very rapid. Industrial-use microwaving also has to take particular care about thelack of penetration depth of microwaves into food substances.
a) Cooking
On the side of cooking, the main objectives have been to shorten the process and increaseits flexibility (adaptability to different products). The industry has long opted for heatexchangers as the most cost-effective and rapid means of heating in the context of

47
16 There has also been recent interest in ohmic heating, with the production of equipment by firms like APV.
17 For instance, sausages are increasingly being produced by co-extrusion of the filling ("dough") and the casing, using
collagen paste.
continuous processing, and developments continue regularly in regard to all the majortypes of heat exchanger (plate, tubular, scraped-surface, etc.), each of which hasdistinctive advantages or disadvantages for particular types of product. High-temperatureshort-time (HTST) processing has been sought, in the wake of success in extending shelf-life with UHT (ultra high temperature) processes and products, like long-life milk.16 Aswith microwaves, process control has to be intensified, to get the right balance betweentoo short a time (which would fail to destroy bacteria) and too long a time (which wouldharm the product quality), and equivalently the right balance of temperature. Becausemost foods are non-Newtonian in their flow properties, the knowledge of rheologicalbehaviour under conditions of, say, UHT processing is still very limited.
The changes in demands for cereals, snacks, etc. have helped prompt a radical change inmethod from rotary cookers to extruders. Extrusion cooking, originally using a singlescrew within a barrel, raises the shear imparted by the equipment, with substantial effectson cooking time and textural quality. Extrusion cooking can be conducted much fasterthan rotary steam pressure ovens (pass-through time is typically 30-90 seconds), andcontinuous rather than batch processing is much facilitated. The extruder barrel canconduct a range of processes such as grinding, mixing, compressing, heating, cooking,sterilizing, deodorizing, shaping, texturizing, drying and cutting. Subsequentmodifications such as extending barrel length have increased its range of advantages;furthermore the disadvantage of shorter shelf-life of many early products is beingovercome by use of different ingredients. The most important development within thisfield has, however, been the shift from single-screw to twin-screw extruders, which notonly double the capacity in unit time, but allow straightforward co-extrusion, for itemsthat require combinations of major ingredients - as is true of many of the new producttypes alluded to above.17 Thus extrusion cooking gives rise to economies of scale, thoughin the recent sense of greater throughput rather than greater size of operation (vonTunzelmann, 1995b) - extrusion cooking generally economizes on space instead of takingup more of it. This allows its combination with economies of scope, in the sense offlexibility in regard to the items being cooked - extruders can be converted extremelyrapidly from cooking, say, filled, coated and dual-texture breakfast cereals to snacks(Davies, 1990) - and in the sense also of combining substances for co-extrusion (Jones,1990, 1991). Very specific tailoring of the cooking process to the desired product can beundertaken, allowing gains in terms of texture, flavour, etc.; following which theextruders can quickly be re-programmed for quite different products. The issue arises notjust in cooking but in other phases of the production process, e.g. the use of high-speedmixing (multiprocessors have been developed for complex products), or accelerateddrying (spray drying, fluidized bed systems, or freeze drying). The industry has beencriticized for devoting too much attention to high speed and not enough to high flexibility(e.g. Kaye, 1992), and such equipment can help effect a better compromise; though this

48
may also require changes in the product lines themselves, like greater modularity (e.g.Greeves, 1990; also ECE, 1991, pp 59/60, for packaging machinery).
b) Freezing
On the side of freezing, the basic techniques of contact freezing have been understoodsince Birdseye’s work in 1928. The basic objectives parallel those for heating -economies of time and space, reliability and (less problematic here) flexibility. The shiftin demand from frozen to chilled products has increased awareness of the need foraccurate information on i) the extent of penetration of chilling or freezing into the foodproduct (typically rather irregularly shaped) and ii) monitoring temperature through thewhole process up to final sale. A considerable difficulty is that freezing processes areinherently nonlinear. It was established at a fairly early stage that rapid freezing generallydid much less harm to the product than slow freezing (blast freezing); although it lateremerged that there are some exceptions and the issue remains much debated, e.g. formeats. Additives (cryoprotectants) may have to be employed to slow down some of themore disruptive aspects of the process. Very rapid freezing techniques (cryogenics), usingliquid nitrogen, have been employed for certain purposes, particularly for “crust freezing”(to maintain surface colour), and recently the range of uses has greatly expanded(Tomlins, 1995). Freezing systems have customarily been developed on technologicalcriteria, especially to optimize the performance of the evaporator, and only recently hasthere been a switch of emphasis to optimizing for the product itself (Bailey, 1993).
c) Production integration
Aside from the processes employed at these key stages, there are important issues thatarise in connection with the overall integration of production. One concerns extractionand separation. Supercritical gases/fluids, generally carbon dioxide, are now becomingmore widely used for extracting certain ingredients, in place of traditional liquid solventextraction and distillation, e.g. for seed oils, fats, spices, drugs and medicinal herbs;though the capital costs remain high. It is becoming increasingly common to separate asmuch as possible at the beginning of the process, and re-combine the elements as late aspossible before final despatch. This applies not just to the obvious constituents, but toaromas etc., which as noted above are often highly sensitive to any processing. The“spinning cone” method, as now used in low-alcohol wines for example, adopts thisapproach. In beer-brewing, many large companies have developed a bland “base beer”for process efficiency, to which elements like bitterness, hop aroma, colour and foam areadded late in processing.
Flow through the whole process is central to continuity and to automation. Whilebeverages are generally straightforward to handle, certain types of particulate foods areoften difficult, though their flowability has to be maintained. Distributed PLCs(programmable logic controllers), replacing relays, were employed in the 1970s and ’80sfor such purposes, but their power was not adequate to meet many needs. They have beenovertaken by modern microprocessors and computerization. The adoption of IT in foodprocessing has however fallen below expectations, not least because so many operationsremain “art” rather than “science” (“fingertip feeling”). The stumbling block in manyareas of automation has been the instrumentation for on-line quality control, andespecially the lack of adequate sensors to assess such “difficult” products. This is slowly
49
18 An extreme example is the Italian cake, Panetonni, which takes about 24 hours to cool in air and 4 minutes under vacuum.
being met, but the requirements are arguably rising almost as rapidly (e.g. the sensorscrucially required for HTST processing). As noted above, equipment originally developedfor quite different purposes is being imaginatively applied to food processing needs, forinstance both low-intensity and high-intensity ultrasonics (though here too sensors remaina problem), and machine-vision systems. There is growing use of vacuum processing forcooking, cooling, thawing etc., to raise speeds and reduce damage. 18 The Japanesehowever lead in application of high pressures, e.g. for preservation (Earnshaw, 1992;Galazka and Ledward, 1995). The automation of transfer functions using AGVs(automatic guided vehicles, e.g. with laser tracking) or similar is becoming popular.
Essentially, it can be said that technology in the industry is being driven by systems thatcope with variety (Poley, 1993). As with the scientific developments, the technologiesincreasingly need to be integrated with one another, especially as the production systemsbecome more strongly integrated in the interests of altering consumer demand. Reflectingthe overall shift of emphasis in the industry from supply to demand factors, efforts areunder way to shift the orientation of automation from the machinery to the product.
5.3.3 Packaging
In the early 1970s, “tin” cans and glass bottles and jars remained the standard forms ofpackaging for food and drink. Since those days, when packaging was largely anafterthought, the packaging processes and products have been radically transformed.These changes were part and parcel of the changes in products and processes higher upthe food chain, as described above, and indeed they often had to be developed inconjunction with one another.
Most significant in this respect were the forms of packaging adopted for the chilled foodsand ready meals. These had to allow for the heterogeneity of such products (trays withseveral compartments, sachets, etc.), and also for the conditions under which they wouldbe prepared in the home. Plastics and seals that could be heated in ovens withoutthemselves deforming or adversely affecting the food they contained, and subsequentlythose usable with microwave ovens, became the subject of considerable research.Crystallized PET (polyethylene terephthalate) has been developed for the trays (ordinaryPET cannot withstand the temperatures encountered in an oven). For microwaving therewas the additional problem of browning or crisping the cooked food in the short time itwas in the oven, as mentioned before. Recent solutions have focused on the propertiesof “smart” materials, in this case susceptor packaging that would itself react to the heattreatment and thereby improve the nature of the cooked product. While progress here hasbeen rather impressive, there remain doubts about susceptor packages, including thepossibility of toxic effects.
More generally, progress had two main objectives: i) developing aseptic packaging, toimprove safety standards; ii) developing controlled or modified atmosphere packaging

50
(CAP and MAP), to offset declining quality during extended shelf-life. Asepticpackaging, which involves separate sterilization of product and packaging, attractedconsiderable interest from the industry; but it has been claimed that consumers haveshown less interest, and that it has failed to repay the investments in it (Kaye, 1992). Onthe other hand, for reasons already given, the industry at large may lose from any lack ofcommitment to high safety standards. CA and especially MA packaging, on the otherhand, appear to have been quite successful. These cover a range of situations. CApackaging restricts the changes that can take place within the container. The mainproblem is oxidation, the most common source of food perishability. Although it istechnically possible to block out all the oxygen (by vacuum packaging and perfectsealing), it is usually inadvisable to do so, because products like meat respire and changein other ways while on the supermarket shelf. CA packaging therefore aims to allow injust enough oxygen (etc.) to offset these changes. MA packaging can be regarded as aform of CA, in which conditions in the package are initially altered to suit the characterof the product and its perishability - a typical solution is a mixture of carbon dioxide toinhibit microbial action, nitrogen to limit oxidation, and sometimes oxygen to retaincolour e.g. of red meat. MAP can be combined with “active” packaging in whichadditives are included in the packaging film (laminated PET susceptors) or within thecontainer to enhance freshness. As noted, various forms of these are now widely used inchilled ready meals etc., although it has been claimed that their use for storage of certainvegetables etc. is unnecessary and costly (Saráy, 1994).
These developments in turn rest on advances in i) materials used for the seals, ii) methodsof sealing and filling. The materials involved are mostly laminates containing two to fourlayers of suitable polymers (polypropylene etc.) or aluminium, each designed to providea high barrier against the outer or inner environment (gas, water, etc.), and surfacecoatings are commonly applied as well. Naturally the most suitable polymers etc. varyaccording to the nature of the product, and R&D work here is often of a high level ofsophistication. The problems do not however end with obtaining and producing suitablematerials. The forming (of the material shapes), filling and sealing are usually done insingle complex machines, known as form-fill-seal machines (FFS), which require veryhigh precision and advanced microprocessor controls. Filling is much more precise thanfor cans or jars because the seal area must not be spattered with the product. Sealing,usually with adhesives, can be variously hot or cold; the latter being much faster thoughraising other difficulties. The packaging as well as the products have shifted from beingsupply-driven (reduced costs, faster speeds, etc.) to being more market-driven, withattempts to catch the consumer’s eye in one way or another, so that advances have beencontinuous. Closures have attracted particular attention - tear-strips, tear-strings, cornerseparations, etc.
For liquids, there have been other changes running concurrently with these in the past twodecades or so. The two-piece “tin” (i.e. tinplate) can has partly given way to other typesof metal, particularly aluminium. The glass bottle has given way to both cartons (Tetra-Pak etc.) and plastics, particularly PET. These carried advantages in terms of lighterweight, less fragility (than glass), storage convenience (rectangular shapes etc.) and

51
19 Recent developments include such items as bag-in-the-box, which incorporates food as well as drink packaging technology
(automatic filling, coextrusions, etc.), and usually a foldable tap closure.
permitted the development of user-friendly closures (ring-pulls, twist-off plastics,reclosable carton lids, etc.).19
On the other hand, there has been rising public resistance to excessive packaging,affecting both food and drinks containers. There has been concern about theenvironmental effects of production processes for packaging such as PET(petrochemicals). There have also been demands both for more recyclable materials (andfacilities) and for less wasteful packaging. Regulatory standards will undoubtedly bearmore heavily on manufacturers in these terms, with the EU programme designed to settargets for reduction to be achieved by 2003 (15% reduction in packaging and 60%increase in recycling). Even more problematic are regulations concerning “migration”between package and product. Manufacturers have long been concerned about the“scalping” of flavours by the packaging; regulators tend to be more concerned with themigration of substances from the packaging (including printing inks) into the product,with possibly harmful effects on the consumer. The closer the packaging to avoidoxidation, the more likely such migration must be. Some of the newer materials are at adisadvantage in this respect, for example there is more migration from PET bottles thanfrom glass. The EU programme for harmonization of migration standards is accordinglybeing developed over the years 1993 to 1997.
Packaging is thus a good illustration of four of the main themes pervading this survey ofrecent innovation in the food manufacturing industry: i) the need for adequateinstrumentation for monitoring quality and safety (infrared spectroscopy and gaschromatography are now used for analysing packaging); ii) the need for conjointdevelopment of product and package; iii) the rising importance of consumer “voice”; andiv) the rising importance of regulatory standards and their harmonization.
5.4 Summary
We can thus summarise the patterns of recent innovation according to such headings. Themost striking observation is the radical nature of both product and process innovation inthe industry over the past twenty years or so. While this has frequently been pointed outin regard to the “high-tech” industries, for example in the long-wave literature, it hasmuch less often been noted for pervading a range of industries usually regarded as beingrather “low-tech”. Of course there is a high degree of dependence on those developmentsin high-tech areas, like information technology, biotechnology and advanced materialsas demonstrated above; but there is much more to pervasiveness than the simple“supplier-dominated” view of such industries would suggest. In particular, we may drawattention to the great variety of technological impulses which “suppliers” are being calledon to deliver to these “users” - the range of scientific disciplines and technological fields -

51
and still more to the complexity of integrating these through indigenous efforts within the“user” industry such as food processing.
These supply-side impetuses are if anything being overshadowed by changes on thedemand side, exerted through consumer behaviour (including the effects of“globalization” of tastes and products), through public opinion, and through intensifyingregulatory standards (in regard to health, safety, environment, etc.), which are of coursepartly by way of response to public opinion. The shift of emphasis from technology toproduct is altering the structure of process change in the sense of how automation isdeveloped, and also altering the nature of competition and collaboration in the industry.The interactions between the supply-side elements (different technologies etc.) andespecially between the demand side and the supply side are likely to prove the keydeterminant of national and supranational success in innovation in the industry.
6. Features of innovation at the firm level
The focus in this Chapter is upon three sub-themes, all of them studied at the firm level.First leader and laggard firms within the industry are characterised. Subsequently the roleof firm strategies is investigated. Finally the relationship between innovation andprofitability is explored in much greater detail. The first thing to clarify in a study ofsuccess factors is to define what is meant by “success”. Two criteria are employed in thisstudy. As the study is on innovation, the share of innovative products in total turnoveris taken as one indicator of success, and the growth in turnover from 1990 to 1992 is theother one. It could, of course, be discussed whether other indicators - both economic andnon-economic - should be chosen. Ideally the success indicator should be compared tothe objectives of the firm. What is an indicator of success for one firm is not necessarilya success criterion for another. It is however likely that firms would regard growth inturnover as being an indicator of success. It should first be mentioned that the share ofnew products in sales does not capture improvements in process development. It couldalso be questioned whether the two indicators are interrelated or perhaps in some casescontradictory. A growth in turnover of a firm may actually reduce the share of innovativeproducts in its total sales if the growth in sales has taken place in older products. Withregard to the second indicator, the time period that it is possible to investigate could besaid to be rather short for assessing success. It could also be argued that differentcountries experienced different levels of overall macroeconomic behaviour during theperiod 1990-92. This will obviously have an impact on turnover growth. Thesereservations could be expanded. For now they serve as illustrations that the choice ofcriteria for “success” is far from trivial. The criteria chosen here are respectively relatedto innovation activity and purely economic, and they are both in the CIS database formost countries. However a few countries, i.e. Norway, Greece, Spain, and Portugal, donot list 1990 turnover. This prevents us from using the growth of turnover as a successcriterion. In these cases the share of innovative products in turnover is used. Inconclusion it can be said that the success criteria chosen are imperfect, but when usingthe CIS data they are the best that we have got.

52
Leaders and laggards have been calculated separately for each country: the bestperforming third of firms being the leaders and the worst third being the laggards. Theremaining third is not shown in the tables, which explains why the total may differ fromthe range between leaders and laggards. For both measures of success - especially thesecond one - many reservations need to be made. This is however the best approximationoffered by the CIS microaggregated dataset.
When exploring the relationship between innovation and profitability we need data oneconomic performance over time at a firm level. The CIS data are not adequate for thispurpose. Using other kinds of data for innovativeness we compensate for this inadequacyin that Section (6.3) by focusing on firm-level data from their accounts.
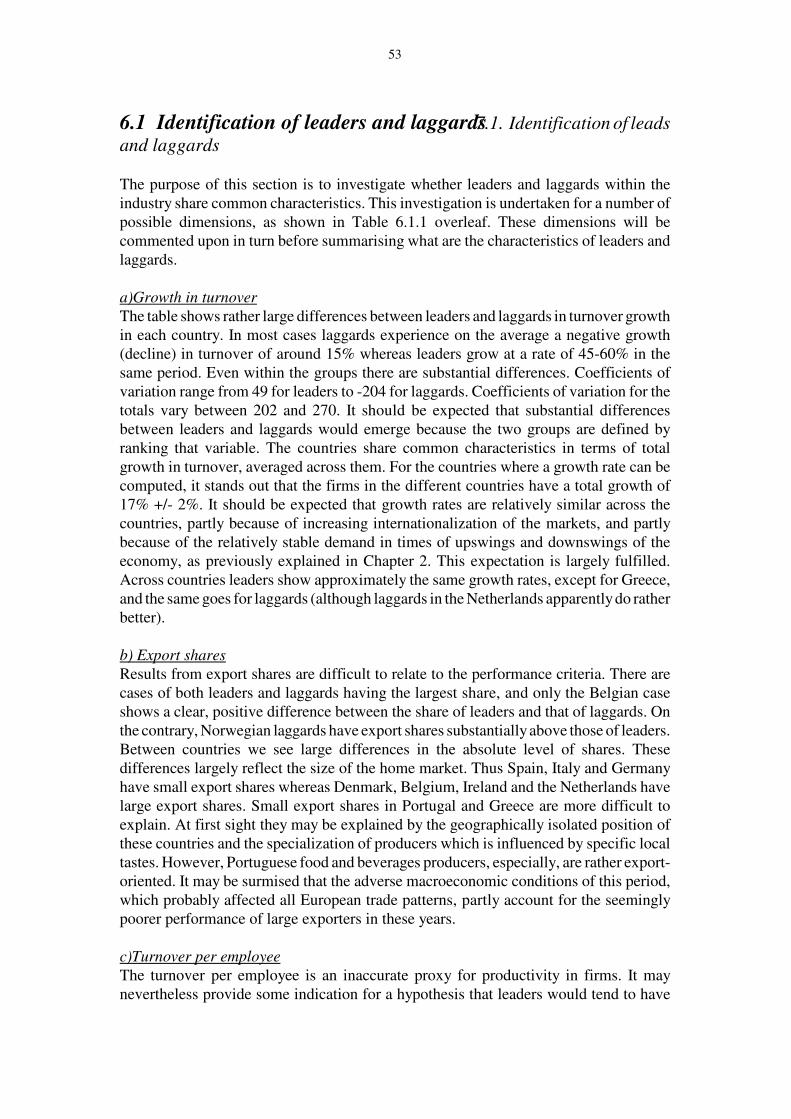
53
6.1 Identification of leaders and laggards7.1. Identification of leads
and laggards
The purpose of this section is to investigate whether leaders and laggards within theindustry share common characteristics. This investigation is undertaken for a number ofpossible dimensions, as shown in Table 6.1.1 overleaf. These dimensions will becommented upon in turn before summarising what are the characteristics of leaders andlaggards.
a)Growth in turnover
The table shows rather large differences between leaders and laggards in turnover growthin each country. In most cases laggards experience on the average a negative growth(decline) in turnover of around 15% whereas leaders grow at a rate of 45-60% in thesame period. Even within the groups there are substantial differences. Coefficients ofvariation range from 49 for leaders to -204 for laggards. Coefficients of variation for thetotals vary between 202 and 270. It should be expected that substantial differencesbetween leaders and laggards would emerge because the two groups are defined byranking that variable. The countries share common characteristics in terms of totalgrowth in turnover, averaged across them. For the countries where a growth rate can becomputed, it stands out that the firms in the different countries have a total growth of17% +/- 2%. It should be expected that growth rates are relatively similar across thecountries, partly because of increasing internationalization of the markets, and partlybecause of the relatively stable demand in times of upswings and downswings of theeconomy, as previously explained in Chapter 2. This expectation is largely fulfilled.Across countries leaders show approximately the same growth rates, except for Greece,and the same goes for laggards (although laggards in the Netherlands apparently do ratherbetter).
b) Export shares
Results from export shares are difficult to relate to the performance criteria. There arecases of both leaders and laggards having the largest share, and only the Belgian caseshows a clear, positive difference between the share of leaders and that of laggards. Onthe contrary, Norwegian laggards have export shares substantially above those of leaders.Between countries we see large differences in the absolute level of shares. Thesedifferences largely reflect the size of the home market. Thus Spain, Italy and Germanyhave small export shares whereas Denmark, Belgium, Ireland and the Netherlands havelarge export shares. Small export shares in Portugal and Greece are more difficult toexplain. At first sight they may be explained by the geographically isolated position ofthese countries and the specialization of producers which is influenced by specific localtastes. However, Portuguese food and beverages producers, especially, are rather export-oriented. It may be surmised that the adverse macroeconomic conditions of this period,which probably affected all European trade patterns, partly account for the seeminglypoorer performance of large exporters in these years.
c)Turnover per employee
The turnover per employee is an inaccurate proxy for productivity in firms. It maynevertheless provide some indication for a hypothesis that leaders would tend to have

54
higher turnover per full-time employee than laggards. The results however do notconfirm this
Table 6.1.1: Characteristics of leaders and laggards
Countries Ranking Growthin
turnover,%
Exportshare %
Turnoverper
employee(KECU)
Innovationcost
intensity
Share ofunchange
dproducts
R&Dintensity
Belgium Total 19 36 306 ** 62 12
Leaders 60 45 431 ** 51 9
Laggards -16 32 258 ** 71 16
Denmark Total 17 44 181 13 62 22
Leaders 52 42 206 16 64 19
Laggards -16 42 137 11 51 13
Germany Total n.a. 11# 169 66 57 8.6*
Leaders n.a. 7# 116 142 14 22.7*
Laggards n.a. 11 # 213 23 91 2.4 *
Greece Total -2 12& 129 2.4# n.a. 8
Leaders 14 20*& 157 4.0*# n.a. 1.3*
Laggards -23 6*& 82 1.2*# n.a. 0.8*
Ireland Total 15 33 258 28 74 14
Leaders 44 38 278 27 66 22
Laggards -11 34 206 16 83 11
Italy Total 16 10 438 26 81 22
Leaders 54 10 327 20 79 2.1*
Laggards -15 10 713* 26 81 19
Netherlands Total 16 35 323 21 68 2.3 §
Leaders 45 36 311 45 69 5.2§
Laggards -8 31 338 11 69 1.0§
Norway Total n.a. 23 284 18 60 19
Leaders n.a. 14 338 22 35 3.2*
Laggards n.a. 34 257 21 91 16
Portugal Total n.a. 16& 305 0.9& 64 **
Leaders n.a. 10& 105 0.9*& 26 **
Laggards n.a. 20& 636* 1.5*& 97 **
Spain Total n.a. 8 183 30 61 1.0&
Leaders n.a. 11 186 44 23 1.4 &
Laggards n.a. 6 158 22 92 0.7*&Notes: Calculated from CIS data.
#Only partly comparable&Not comparable§Results for R&D in the Netherlands tend to be overestimated because of differences in
formulation of the questionnaire*Less reliable data because of low number of observations or outliers**Non-meaningful data because of low number of observations.

55
20 A correlation analysis between growth in turnover and share of unchanged products gives the same picture:correlation coefficients are generally low, in many cases insignificant, with the sign varying from country to country.
d) Innovation-cost intensity
Innovation-cost intensity - namely, current expenditures on innovation as a percentageof turnover - is one of the questions most frequently left blank by respondents. Manyhave had difficulties answering it, which makes for less reliable results. In addition, thedata from some of the countries are not comparable. Of those which seem reliable we seethat firms in the majority of countries - the execption being Italy - spend more oninnovation if they are leaders compared to expenditures of laggards. The overallunweighted average intensity of expenditures in the countries is between 2-3%, with theDanish food and beverages industry being somewhat behind and the German industrysomewhat ahead.
e) Share of unchanged products
The share of unchanged products in sales is one measure of innovativeness. The residualof the percentages in the table is the share of sales which are products new to the firm.There is no clear picture from the results.20 The very clear differences between leadersand laggards in Germany, Portugal, Spain and Norway should not be taken as anindication of a relationship between growth in turnover and share of unchanged products.These differences can be explained by the special success criterion chosen for thesecountries. Of the remaining countries, Belgium and Ireland show better innovationperformance by firms growing faster, whereas the Danish case shows the opposite, andthere are differences between the two groups in the Netherlands and Italy. In other words,even if the evidence here is rather fragile, there seem to be indications that even firmswho are somewhat behind technologically and perhaps experience negative growth ratesare able to renew a large share of their product range. The results show that 20-40% ofproducts change to some degree over the three-year period. This seems at first glance toreflect a major period of turbulence in the industry in terms of how fast the whole rangeof products changes. However, it must be remembered that the innovative products in theCIS data relate to the firm level. Therefore, it is possible - and likely - that a substantialpart of the products new to the firm are imitations rather than products new to the
industry.
Italy apparently has the least innovative food and beverages industry. This result isemphasized by the fact that it is also the country with the smallest share of innovativefirms (cf. Table 2.1.2). The Irish food-processing industry is also in the lower part of theinnovation spectrum. At the other end we find once more Germany, where products newto the firms account for about half of the sales.
f) R&D intensities
There are fewer observations in each cell when the focus is narrowed down to R&D-performing firms. The results with regard to R&D intensities is therefore less reliable.But the overall picture - with Belgium as the only exception - is of a very clear difference

56
between leaders and laggards. Leaders are above laggards in close to all cases. In relatingR&D intensities to other characteristics one can find relationships that are not easilyexplained. For example, Denmark is low in innovation-cost intensity but high in R&Dintensity. Conversely, Ireland is high in innovation-cost intensity but low in R&Dintensity. It could be that such differences relate to differences in the composition ofinnovation expenditures. In some countries innovation may require a high proportion ofR&D compared to other countries.
g) Summarizing leaders and laggards
Leaders are - compared to laggards within the industry - technologically advanced interms of their expenditures on both R&D and other innovation-related expenditures. Thiscould perhaps result in a higher turnover per employee but not necessarily in highershares of innovative products in sales. One hypothesis might be that the relativelytechnologically advanced leaders emphasize process innovations, in which case this willprecisely show up in turnover per employee but not in the share of innovative products(however this is not supported by Table 6.2.1 below). The reverse causation factor couldapply, with firms perhaps increasing their R&D expenditures as a result of high growthin turnover. It has been shown, though, that generally the share of R&D in turnover israther constant, regardless of business cycles. So far as exports are concerned, it is notthe status as leader or laggard that determines the export share of the firms but rather thesize, geographical context and specialization of the home market.
The diversity of leaders and laggards is large both within the groups and between thegroups. This goes in particular for the background variables, whereas the variablesrelated to innovation show greater similarities among firms and between groups of firms.
6.2 Strategies7.2. Strategies
Knowledge of strategies is valuable for the identification of appropriate policies becausethe emphases placed by firms on different objectives for their innovation activities to alarge degree reflect the competitive environment in which they operate. Analysis ofobjectives for innovation may therefore indicate whether policies should mainly bedirected towards supporting cost reduction (or other process-related activities) or productdevelopment.
As previously discussed, the traditionally held view of the food and beverages industryis that it is heavily process-oriented. In Table 6.2.1 below we show the means of theanswers to the question in the CIS on different objectives of innovation, using an ordinalLikert scale. We would normally not use means for ordinal data as there may bediscontinuous jumps in perceptions by the respondents as to how he/she should answerone of the 5 possible assessments. The usual way to treat ordinal data is to calculate thenumber of firms responding either “crucial” or “very significant”, relative to the totalnumber of responses to the question. This “high-scores method” is used in subsequentanalysis of the ordinal data. In this table we use the means in order to keep the maximumnumber of observations and because we group the questions into sub-categories. The 18

57
objectives listed in the questionnaire are grouped into three, covering product, processand marketing innovations.
6.2.1 Differences in objectives
The results show that product development objectives are as important as processdevelopment. In fact, there are remarkable similarities between the two. Results from thecomparison of objectives indicates that product innovations and process innovations toa large degree go hand-in-hand in this industry. Only in Germany and Italy do we findsignificant differences between the two groups of objectives - in Germany productdevelopment being more important than process development, and vice versa in Italy.Table 6.2.1:Mean ordinal scores by type of innovation
Country Ranking Product
development
Process
development
Marketing
development
Belgium Total 3.3 3.3 4.0
Leaders 3.4 3.5 4.3
Laggards 3.1 3.2 4.0
Denmark Total 3.4 3.4 3.6
Leaders 3.6 3.5 3.9
Laggards 3.3 3.2 3.4
Germany Total 3.4 2.9 4.6
Leaders 3.3 3.0 4.8
Laggards 3.1 2.7 4.4
Ireland Total 3.4 3.3 4.0
Leaders 3.5 3.1 4.1
Laggards 3.4 3.3 3.9
Italy Total 2.7 3.1 4.0
Leaders 2.8 3.2 3.9
Laggards 2.6 3.2 4.1
Netherlands Total 3.3 3.0 4.1
Leaders 3.3 3.1 4.3
Laggards 3.3 3.1 4.0
Norway Total 2.8 2.9 3.9
Leaders 2.6 2.9 3.9
Laggards 2.9 3.1 4.1
Spain Total 2.5 3.2 4.6
Leaders 2.6 3.3 4.9
Laggards 2.6 3.1 4.3
Note: Calculated from CIS (Greece not comparable)
The levels of priorities are approximately similar across countries. Firms in Italy, Norwayand Spain tend to focus less on product development compared to firms in other

58
countries. With respect to process-innovation objectives there are smaller differencesacross countries. Marketing development is very important to firms in Germany andSpain, but not to firms in Denmark to the same extent.
Even more important than product- and process-related objectives are those objectivesaimed at creating new markets. The importance attached to this objective is markedlyhigher than the importance of the other two groups. This is a further indication -supporting the findings in Chapters 2 and 5 - that this industry is particularly orientedtowards the demand side, i.e. towards the users. In Section 7.1 we shall explore this issuefurther.
6.2.2 Differences between leaders and laggards
In all countries but Norway, and partly Italy, it seems as if leaders attached moreimportance to all three kinds of strategy. As with many other aspects of strategy one canonly speculate as to the explanation of this result. Could it be that leaders are generallymore conscious about choice of strategy? In any case, the gap between leaders andlaggards is not striking, and results indicate at first sight that innovation objectives andsuccess criteria chosen in this study are not strongly related. Although quantitative datahave their limitations in terms of how far one can explore certain issues - and strategy isperhaps one of the more difficult - this preliminary conclusion requires some furtherexamination.
This inquiry is undertaken in three steps. First, a correlation analysis is undertakenbetween the growth in turnover or share of innovative products in sales, and all the 18possible innovation objectives. Results from this analysis are presented in Table 6.2.2overleaf.
The conclusion to be drawn is that the correlation coefficients are generally low andinsignificant. Across different innovation goals the magnitudes of the coefficient change,and the signs of the coefficient change according to which country is in question. Thusit is difficult to detect any clear pattern from these results. Second, we try another success criterion. Assuming that firms without financialdifficulties arising out of pursuing their innovation goals have had some success to be insuch a position, we test for the relationship between financial resources as a barrier toinnovation and the different innovation objectives. Both types of data are ordinal,unweighted data, and therefore we choose Kendall’s tau correlation coefficients tocompare all the objectives and three different but related financial barriers to innovation.These barriers are:
i) lack of appropriate sources of finance
ii) innovation costs too high
iii) pay-off period for innovation too long
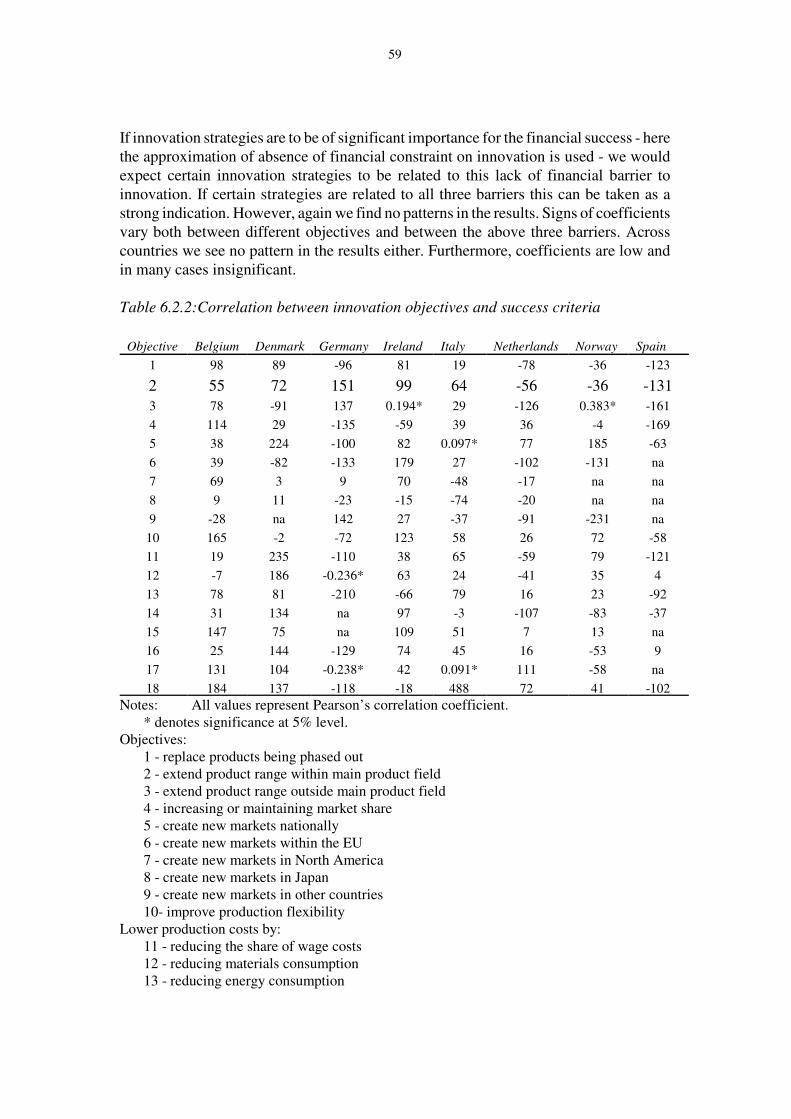
59
If innovation strategies are to be of significant importance for the financial success - herethe approximation of absence of financial constraint on innovation is used - we wouldexpect certain innovation strategies to be related to this lack of financial barrier toinnovation. If certain strategies are related to all three barriers this can be taken as astrong indication. However, again we find no patterns in the results. Signs of coefficientsvary both between different objectives and between the above three barriers. Acrosscountries we see no pattern in the results either. Furthermore, coefficients are low andin many cases insignificant.
Table 6.2.2:Correlation between innovation objectives and success criteria
Objective Belgium Denmark Germany Ireland Italy Netherlands Norway Spain
1 98 89 -96 81 19 -78 -36 -123
2 55 72 151 99 64 -56 -36 -131
3 78 -91 137 0.194* 29 -126 0.383* -161
4 114 29 -135 -59 39 36 -4 -169
5 38 224 -100 82 0.097* 77 185 -63
6 39 -82 -133 179 27 -102 -131 na
7 69 3 9 70 -48 -17 na na
8 9 11 -23 -15 -74 -20 na na
9 -28 na 142 27 -37 -91 -231 na
10 165 -2 -72 123 58 26 72 -58
11 19 235 -110 38 65 -59 79 -121
12 -7 186 -0.236* 63 24 -41 35 4
13 78 81 -210 -66 79 16 23 -92
14 31 134 na 97 -3 -107 -83 -37
15 147 75 na 109 51 7 13 na
16 25 144 -129 74 45 16 -53 9
17 131 104 -0.238* 42 0.091* 111 -58 na
18 184 137 -118 -18 488 72 41 -102
Notes: All values represent Pearson’s correlation coefficient. * denotes significance at 5% level.
Objectives:1 - replace products being phased out2 - extend product range within main product field3 - extend product range outside main product field4 - increasing or maintaining market share5 - create new markets nationally6 - create new markets within the EU7 - create new markets in North America8 - create new markets in Japan9 - create new markets in other countries10- improve production flexibility
Lower production costs by:11 - reducing the share of wage costs12 - reducing materials consumption13 - reducing energy consumption

60
14 - reducing design costs15 - reducing production lead-times16 - reducing environmental damage17 - improving product quality18 - improving working conditions/safety
Third, we divide strategies into offensive, defensive, dependent and imitative strategies(cf. Section 4.2.4) and subsequently compute the two different performance measures forthese groups.
Table 6.2.3. shows main results from these calculations. The data are mean growth inturnover from 1990-92 for the first 5 countries and share of innovative products inturnover for Germany and Norway. In brackets the number of firms in each category islisted. It is not possible to group all the firms in each country equally according to thefour types of strategies if the strategies are to be consistently comparable acrosscountries. Therefore, in some cases not all of the innovative firms in a country are placedin one of the groups and in other cases there are firms which could be placed equally wellin two groups.
Table 6.2.3: Success criteria distributed according to different strategies, Percentages
Strategy -> Offensive Defensive Dependent Imitative
Country Variable
Belgium Growth turn-over
12(N=20)
23(N=33)
18(N=17)
27(N=25)
Denmark Growth turn-over
25(N=14)
26(N=14)
28(N=19)
24(N=13)
Ireland Growth turn-over
21(N=32)
23(N=35)
11(N=12)
9 (N=13)
Italy Growth turn-over
Not com-parable
21(N=97)
21(N=71)
20(N=117)
Netherlands
Growth turn-over
15(N=40)
17(N=38)
15(N=30)
16(N=67)
Germany Share ofinnovativeproducts
41(N=15)
46(N=38)
49(N=30)
42(N=54)
Norway Share ofinnovativeproducts
28(N=14)
30(N=16)
40(N=14)
41(N=19)
Calculated from CISGreece, Portugal, Spain not comparable

61
21 Size of firm does not seem to play an important role in choice of strategy either (based on both frequencyanalysis and correlation analysis).
Standard deviations vary between 22 and 46.
There are several dimensions in this table. First, the four strategies show no clear patternwith respect to which one is the most successful. The offensive strategy is in no case themost successful but is not far from the average execpt in the case of Belgium. As thesuccess criterion used refers to the same period as the innovation objectives and as theoffensive strategy presumably has the longest time-lag between strategy and success, itis not surprisingly that this strategy does not come out as the most successful. Of theremaining strategies they are ranked the most successful in two cases each.
Second, within some of the countries there are clear differences between the success ofthe strategies (Belgium, Ireland) whereas the other countries show only small differencesin the outcome of pursuing one of the 4 innovation strategies.
Third, the distribution of firms according to the 4 strategies is interesting. Apparently theimitative strategy is the one most frequently used - at least in the majority of the countries(Italy, Netherlands, Germany, Norway). Within some of the countries there are quiteclear differences between the number of firms grouped in the different categories. Forexample, most Irish firms use an offensive or defensive strategy whereas the majority offirms in Netherlands and Germany pursue imitative strategies.
The general conclusion from the various attempts to investigate this issue is that resultsare rather blurred with respect to differences between leaders and laggards.21 This leadsus to conclude that, on the basis of the present data, we cannot identify significantdifferences in strategies between leaders and laggards. It may well be that somerelationships exist, but we have not been able to identify them with quantitative methodsand the present data. What we do find is a remarkable emphasis on goals of creating newmarkets, which encourages us to go further in investigating the importance of therelationships between users and producers, and on an even higher level of aggregationthe importance of the national innovation system. That investigation will be presentedin Chapter 7. Before moving to that chapter we explore another issue at the firm level,namely the relationship between profitability and innovation.
6.3 The relationship between innovation and profitability
6.3.1 Introduction: an inverse relationship?
Economic explanations of innovation and diffusion rest heavily on the search for profits.It has been explained in Chapter 3 above that innovations are likely to be associated withthe desire to obtain higher profits. According to the theory, new products and processesgenerate monopolistic rents for a period, until competitors are able to imitate them anderode the rents. In view of the prospective importance of this relationship, it is exploredat some length in this section of the report. A second reason for going into this matter in

62
some detail is that we can include the UK and France in the analysis - two importantcountries that we were unable to analyze adequately with CIS data.
Although most empirical studies have confirmed the hypothesis of relationships betweeninnovation and profitability, it is unclear whether these hold in every industry. Moststudies have investigated high-tech industries, where there is more likelihood of newtechnology creating monopolistic conditions for the innovators. However traditionalindustries, amongst which we can count food and beverages (food-processing),incorporate a great deal of both internal innovations and those produced by otherindustries (Rama, 1996; and Chapter 5 above). Extraordinary gains may be short-livedbecause new products and processes are comparatively easy to imitate (OECD, 1988).Modest technological change is often more common than “creative destruction” in suchindustries. Unlike in high-tech industries, non-innovators might also regularly obtainmonopolistic gains, through differentiation of products, advertising or control of naturalresources; in other words, firms might made high profits with strategies other thaninnovation. To conclude, the association between innovativeness and profitability infood-processing is likely to be more tenuous than in high-tech industries.
The issue nevertheless may be crucial. If manufacturers fail to find reasons to innovatelike high profits or similar advantages, public policies for technology are likely to be oflimited commercial value.
Previous research does not provide enough evidence on traditional industries with lowR&D intensities (R&D expenditures relative to sales). Branch (1974), for instance,deliberately excludes the food-processing industry from his analysis of innovation andperformance because he does not expect to find any association between these variables.The few studies that do tackle the problem reach contradictory results, probably owingto differing samples and methods (Geroski et al., 1993; Rama, 1994).
In similar vein, a case study on the Danish firms in the CIS sample shows seeminglyinverse results with respect to the relationship between innovation and profitability.Using the original CIS dataset and combining it with official accounts reported at thefirm level, we have measured the profitability of firms in the Danish food-processingindustry. (This possibility of combining CIS data with such other material at the firmlevel is only possible for Norway and Denmark). Two measures of profitability wereused:i) return on equity, andii) pretax results relative to total assets.
Firms were divided into the groups of innovators and non-innovators in 1990-1992. Thetime-lag between innovation and economic performance is of course uncertain and mayvary among firms. In this analysis the 1994 accounts have been used.
Table 6.3.1 : Danish innovator and non-innovator firms and profitability
A) percentage return on equity

63
No. Mean Std. Devn.
All 70 12.6 18.5
Innovative 41 11.2 17.1
Non-innovative 29 14.4 20.1
B) pretax returns as percentage of total assets
No. Mean Std. Devn.
All 70 7.9 10.2
Innovative 41 6.7 10.7
Non-innovative 29 9.6 9.3
By either measure, the hypothesis of a positive link is rejected. Indeed, the means for thenon-innovating group lie substantially above those for the innovators.
6.3.2 Objectives of the analysis
This section aims to identify structural differences between large innovative and non-innovative firms in the international food-processing industry. It also investigates howperformance and strategy, such as methods of financing growth, are associated withinnovativeness at the firm level. In this respect, the previous analysis of innovationstrategy in Section 6.2 is extended to include financial strategy. The study focuses on agroup of the world’s largest firms in food-processing, with special emphasis on Europeanfirms.
The core issues are: a) whether factors such as size, branch of industry, or home country affect howinnovation and profitability are associated; b) whether firm strategies influence the path to profitability through innovativenessfor the firm: e.g. by less innovative firms needing to balance their technologicalinadequacy with financial strategies which may involve less independence, greaterrisk and so on.
A number of difficulties should be borne in mind when assessing the results of this study.
a) Innovation is just one among many factors that might lead to high profits in thefood-processing firm. Financial and marketing strategies are also obviouslyinfluential. To incorporate these would require the examination of a great number ofinterrelated variables, which would additionally make it difficult to design clear-cutexperiments.
b) This section of the Report analyses only internal innovations, i.e. innovationspatented by large food-processing firms in our sample. This is a drawback becauseexternal innovations, i.e. innovations produced by suppliers and other firms at the 2-digit industry level, are vital (Scherer, 1989; Rama, 1996; and Chapter 5 above) andhighly favourable to obtaining profits in this industry, including those achieved by

64
non-patentors (Rama, 1994). Nor does the sample (owing to data unavailability)include patents produced by specialized firms performing R&D under contract fromfood and drink firms, a pattern which appears to be common in biotechnology(Chesnais and Walsh, 1994). The important issue of the “innovation system” in thisindustry is dealt with in Chapter 7.
c) Another area where authors disagree is over reverse causation, i.e. the situation inwhich profits affect subsequent R&D. This possibility is thought to be remote inlarge firms, where finance of R&D does not appear to be a serious constraint, and inwhich R&D is usually funded from internal sources (Acs and Isberg, 1991a;Himmelberg and Petersen, 1994). The R&D budget of small firms may be moresubject to economic fluctuations (Kay, 1979). After a review of the literature on thistopic, Kamien and Schwartz (1975) concluded that “the empirical evidence thateither liquidity or profitability are conducive to innovative effort appears slim”. Inthis part of the Report, the causal direction to be studied is the influence ofinnovation on profit, not the other way around.
6.3.3 Data and sources
The sample includes 101 food and drink multinationals, from a variety of homecountries, with worldwide sales of at least US$ 1 billion in 1988 (see Appendix 6.1). Allare processors; a number of them also include agri-businesses, restaurants or retailconcerns among their holdings. In all cases the sales value of processed foodstuffs iswhat is relevant. Firms with non-food sales greater than 50% of their global sales wereexcluded. Drink firms include soft drinks, beer and alcoholic beverages. The data wereselected from AGRODATA, a database covering the world’s largest food and drink firms(Padilla et al., 1983; IAM, 1990).
The patent data were collected by the Science Policy Research Unit (SPRU) at theUniversity of Sussex. This database provides information on patents granted in theUnited States, collated at the firm level. The sample of firms includes both patentors andnon-patentors, judged by this criterion. The merits and limitations of patents data as themeasure of innovation have been discussed previously in Chapter 4.
The period analysed is 1977-88. Though sales data for the 1990s are not yet available,this period probably reflects the current situation. Technological trends change relativelyslowly owing to conservative consumers and prudent public policy in this industry(OECD, 1988). For reasons already described, namely the possibility of variation overthe business cycle, the whole period has been divided into three sub-periods, the firstbeing a period of expansion, the second one of crisis, and the third witnessing recovery.

65
Table 6.3.2: Definition of the Variables
Variable Description
Economic Variables
Assets
Capital Intensity
Employment
Fixed Assets
Gearing
Industry
Margins
Own Capital
Product Diversification
Profits
Rotation of Capital
Sales
Technological Variables
Biotechnology
Diversification
Experience
Food
Innovative intensity
No. of Patents
Global assets in current US$
Fixed Assets / Number of Employees
Total number of employees
Global fixed assets in current US$
(Long-Term Debt + Short-Term Debt) / Own Capital
Firms are classified by the subsector in which they concentrate most oftheir sales. There are three subsectors:1) Agri-businesses and basic food (sugar, grain milling, meat, aviculture, fisheries and animal feed); 2) Highly-processed food; 3) Beverages (soft-drinks, beer and alcoholic drinks)
Net post-tax Profits / Sales
Total shareholders’ equity in current US$
Number of food and drink products produced by the firm (4-digit level).
Net post-tax Profits / Own Capital
Global Sales/Own Capital
Global sales in current US$
Percentage of biotechnological patents to total number of patents issuedto the firm
No. of technological fields other than food and biotechnology in whichthe firm is active (measured at the two-digit level)
Percentage of patents issued in 1969-76
Percentage of food patents to total number of patents issued to the firm
Number of patents per billion-dollar of sales
Number of patents granted to the firm in the US

66
6.3.4 Country and time patterns
Before undertaking the formal analyses, we shall discuss a few aspects relating todifferences across countries and evolution over time, for such variables as size, profit,fixed assets and capital structure, and for the variables used to assess technology levels.
The information provided in Tables 6.3.3 and 6.3.4 overleaf (based on the definitions ofvariables listed in Table 6.3.2) allows us to draw some broad conclusions abouteconomic and technological features of the industry. Economic features of the firms inthis fairly comprehensive sample of very large firms have changed rather quickly, as seenin Table 6.3.3. On average, firms grew larger, increased their expenditures in the meansof production, and performed better as time progressed. Though they obtained moreequity, gearing also increased. There was a considerable and quite rapid substitution oflabour by capital. Table 6.3.4 shows that the total number of patents per firm increased,as did the percentage of biotechnological patents in the total. However, patenting grewmore slowly than sales, assets and so on. Therefore firms became less innovation-intensive, i.e. the annual number of patents per billion dollar of sales tended to drop.Thus technological behaviour, by this measure, remained more stable than did economicbehaviour.
6.3.4.1 Economic features
Size The average size per firm, measured by global annual sales, increased from US$ 2.8 bnin 1977-81 to US$ 3.6 bn in 1982-85 and to US$ 5.2 bn in 1986-89. Though their saleshad been above those of the average large food and drink firm in 1977-81, Europeanfirms grew less rapidly than the others and suffered more in this respect from the crisisof the early 1980s. After recovery, their average sales fell below and remained lower thanthose of the non-European firms. Average assets experienced a similar evolution (seeTable 6.3.3).
Some food-processors were more successful than others in growing in size. Thevariability of size of the average firm increased over that period, as shown by thestandard deviation of the variable (column 4 of Table 6.3.3, for sales). The distributionof sizes actually became more and more skewed towards very large firms. The rise in thenumbers of giant firms was a consequence of both the expansion of existing foodenterprises and the entry of giant non-food corporations, such as some tobaccocompanies, into the food and drink market. The standard deviation of the sizes ofEuropean firms also increased significantly in the later 1980s (column 7 of Table 6.3.3).

67
Table 6.3.3: Descriptive Statistics of Economic Data (1977-81, 1982-85, 1986-89)
VARIABLES PERIOD Total Mean Std. Dev.
Total* Mean* Std. Dev.*
Assets
Fixed Assets
Own Capital
Long-term Debt
Short-term Debt
Sales
Net Profit
Net Cash Flow
No of Employees
Profit (%)
Margins (%)
Cashflow/Assets
Gearing
Capital Intensity
Capital Rotation
1977-811982-851986-891977-811982-851986-891977-811982-851986-891977-811982-851986-891977-811982-851986-891977-811982-851986-891977-811982-851986-891977-811982-851986-891977-811982-851986-891977-811982-851986-891977-811982-851986-891977-811982-851986-891977-811982-851986-891977-811982-851986-891977-811982-851986-89
79 97 9778 94 9678 97 9778 95 9678 94 96 8210110181 96 9778 94 96 81 99 9978 95 9481 96 9678 94 9678 94 96 78 94 9678 97 96
164422223682
80712112059
733908
1370374622
1141541718
1174280036085196
103138252169229391
345033390036667
13.412.816.7
3.23.54.3
10.610.812.21.782.082.2735.348.675.7
6.07.06.0
184128444321
84017002686
86811261560
47011271726
617827
1352293642165825
134216337196301469
474684446846844
6.27.49.92.03.73.14.49.6
17.52.062.342.1459.761.674.6
5.36.74.8
283940283839283939283839283839304242293939283839304041283938293938283839283839283839283939
191516723352
894792
1608850747
1370388359850670596
1193305527844379
9898
261173168375
436433311735253
12.512.918.5
3.23.74.8
10.111.215.31.502.092.1526.628.150.5
5.57.46.1
252724324373
99010342036111111391723
595530
1300881827
1666407737725441
140148346233242467
679145194654096
6.27.3
10.11.84.43.15.3
14.627.21.121.711.6918.614.630.4
4.96.44.7
Note: All monetary variables expressed in US$m.* European firms only

68
Table 6.3.4: Descriptive Statistics of Technological Data (1977-81, 1982-85, 1986-89)
VARIABLES PERIOD Total Mean Std. Dev. Total* Mean* Std.Dev.*
No. of Patents
Diversification
Experience
Biotechnology
Food
Innovative intensity
1977-811982-851986-89
1977-811982-851986-89
1977-811982-851986-89
1977-811982-851986-89
1977-811982-851986-89
1977-811982-851986-89
82101101
82101101
82101101
637679
637679
82101101
5.88626.32187.0677
1.96281.81601.9299
34.56632.19632.196
5.49524.20057.7676
30.61339.13034.296
.18209
.12270
.09314
15.83818.42018.903
2.57292.70232.5211
24.74625.10725.107
12.14911.00420.202
29.47238.41734.834
.30934
.20855
.14718
304242
304242
304242
202930
202930
304242
5.09334.00404.6944
1.45001.09521.3433
33.70930.65330.653
5.34153.69317.5483
22.00445.09535.240
.15227
.08453
.05520
15.18513.43315.297
2.57282.18712.3682
26.79027.20027.200
12.8129.937225.323
24.18744.05339.135
.36136
.17312
.09901
Note: Variables are defined in Table 6.3.2.* European firms only
Differences in origins of capital and the types of subsector involved contribute toexplaining differences in firm size. US firms, which are on average the largest, enjoyedrapid increases in the scale of output. European firms, which are smaller on average,enjoyed less dynamic growth; moreover they developed relatively late, showing sharprises in sales only after 1985. Finally, Japanese firms, which are the smallest in thesample, exhibited steady if unspectacular growth from the very start.
Although firms in all subsectors showed good performances, firms producing high value-added foodstuffs were the most successful in growing in size (the industry boundaries aredefined in Table 6.3.2). The success of this group, the average sales of which increasedfrom US$ 3.5 bn in 1977-81 to US$ 5.5 bn in 1986-89, was a result of changes inlifestyles and costly mass-media campaigns (see also Chapter 5 above). The size of firmsprocessing basic food and agri-businesses increased from US$ 2.1 bn to US$ 5.1 bn.Finally, the size of the average beverage firm grew from US$ 2.4 bn to US$ 4.6 bn overthe same period.
Employment
Another measure of the size of an enterprise is employment. Average employment grewslowly throughout the period investigated in this section. The rather slight increases inthe number of workers under conditions of a booming demand may be explained by asubstitution of labour by capital. This process was much more intense in Europeanenterprises as the number of employees fell sharply throughout the period. The shifttowards large firms that was seen in the sales and assets data are much less marked interms of employment data.

69

70
Fixed assets In the sample, investment grew with sales. The fixed assets of the average large firm rosefrom US$ 0.8 bn in 1977-81 to US$ 1.2 bn in 1982-85 and US$ 2.1 bn in 1986-89. Theevolution was less steady in European firms, with the big increase limited to the later1980s.
Profitability The statistical analysis confirms the view that the rate of profit of food-processing firmswas relatively immune to the crises. The average rate of profit, i.e. the net profit/owncapital ratio, declined only slightly from 13.4% in 1977-81 to 12.8% in 1982-85, to climbquickly to 16.7% over the second half of the 1980s. Margins, i.e. the net profits/salesratio, were more resilient to the crisis. European firms were even more successful: theirprofits rose slightly during the crisis and their recovery was more vigorous (Table 6.3.3).
As could be expected, given the evolution of the demand, profits were especially strongin highly-processed foods (rising from 13.3% to 18.0%) while gains were smaller inbeverages (from 13.6% to 16.3%) and basic food as well as agri-businesses (from 13.4%to 17.0%).
The profit measure separates out capital payments and adjusts the cash surplus or deficitso as to match up revenues with costs. This measure also includes costs incurred but notyet paid and the benefits obtained from sales invoiced but not yet received. For thesereasons, the profit measure may be somewhat manipulated. More importantly ininternational comparisons, it can be affected by different taxation or accounting systems.This problem, however, affects international comparisons of single-nation firms to agreater extent than those of multinationals based in different home countries. Part of therevenue of multinationals is subject to different accounting methods and taxation systemsin a variety of host countries. This circumstance presumably smoothes the home-countrybias and thus justifies the use of the profit measure in international comparisons. Tocheck this point we calculated a measure of profitability based on cash flow, i.e. cashflow/assets. As shown by Table 6.3.3, the results are similar. The cash-flow measurealso points to continuous increases in profitability in all types of firms, not just in theEuropean ones. It confirms, moreover, that the latter have performed better than averagein these terms after 1982.
The portion of firms enjoying very high profit rates, defined as more than 20%, increasednotably, from only 9% of the total number of firms in 1977-81 to nearly 30% in 1986-89(these results are not displayed in the Tables given here). However, most firms remainedin the medium-profit bracket, with rates of profit from 11% to 20%. Japanese firms werean exception because their profits were consistently rather low, i.e. 10% or less, and theproportion of firms getting low returns increased from 75% to 93% of the total numberof Japanese firms. A cross-classification of firms by cash flow/assets and countryconfirms that returns are lower in most Japanese firms.
Equity and debt The statistical analysis confirms the view that the resources available to firms expandedsignificantly. New investors gave a boost to the amount of own capital per firm, althoughdebt also grew. The average amount of equity more than doubled in all firms from 1977-

71
81 to 1986-89; it also grew in European firms, after a drop up to the mid-1980s (Table6.3.3).
Even though the cost of capital was high throughout these years, debt also played a majorrole in the financing of development. Average long-term debt more than tripled from1977-81 to 1986-89. Increases in short-term debt were also significant. European firmskept debt more in check although it grew fast towards the end of the period.
As a result of these developments, the financial structure of firms changed and debtbecame more and more vital. The table thus shows gearing increasing quickly over thisperiod in both European and non-European firms.
Cash Flow The ratio of net cash-flow to assets and the average availability of cash per firm rosesharply. The performance of European firms was noteworthy.
Capital to Labour Ratio The statistical analysis confirms the opinion that capital intensity has increased in thisinternational industry. The evolution of the capital/labour ratio, i.e. the ratio of fixedassets to number of employees, suggests a quick incorporation of technology embodiedin new capital goods. The move towards processes based on the intensive use of capitalis also pronounced among European firms in the later 1980s, even if they remained lesscapital-intensive than other firms (Table 6.3.3).
6.3.4.2 Technological features
Number of patents The total number of patents issued to all firms increased, on average, from 5.9 a year in1977-81 to 7.1 in 1986-89. By contrast, in European firms, the average dropped from 5.1a year to 4.7 over the same period (Table 6.3.4).
At first sight, the economic re-organization of this international industry has induced nomarked moves in the technological position of firms. Firms have tended to concentratein intermediate strata, with most having 2-3 patents issued a year. The extremes, i.e.groups with very low patenting (under 2 a year), or very high patenting (above 10 a year),lost importance as proportions of the total number of firms (data not displayed).
The gap between US firms and other firms has tended to close. In 1977-81, patentinginvolvement of US firms was notable by comparison with other firms; though one hasto allow for the fact that the USA is the “home country” for US firms, so one wouldexpect higher patenting levels, cet. par. Only 3% of US firms had, on average, under 2patents a year. By contrast, from 31% to 44% of non-American firms did so over thesame period. This situation has changed. Over time, the portion of firms less involvedwith patenting increased among US firms and decreased among non-US firms. Increasesin patenting activity were especially noticeable among Japanese firms. The proportionof firms with under 2 patents a year dropped from 31% to only 18% of the total numberof Japanese firms over the period. The proportion of firms with under 2 a year fell a little

72
from one-third to under 29% of European firms. This change could denote, although toa much lesser degree, some increase in patenting activity in European firms as well.However, the percentage of lesser patentors remained quite high among Europeanprocessors by the end of the 1980s, if compared with both Americans and Japanese. Onecannot completely exclude the possibility - even if these firms have long had businessexperience in the US - that what has increased is, in fact, their foreign patenting ratherthan their innovative output in total.
Biotechnology
The share of biotechnological patents on the total number of patents per firm grew bothin the average firm worldwide and in the European one. Yet, in both cases, there was areduction of the percentage of biotechnological patents over 1982-85 (Table 6.3.4). Aswill be suggested below, during the crisis firms may have withdrawn from the moreperipheral activities, such as biotechnology, to concentrate on food technology.
Food The share of food patents in the total number of patents increased in the average firm,and especially in the European firms which became much more specialized after 1982(Table 6.3.4). In both cases, food technology was remarkably strengthened over 1982-85,probably as a consequence of concentration in core businesses throughout the crisis.
Diversification The level of diversification into technological fields other than food and biotechnologyis rather low throughout the period, especially in European firms; the general pattern (asdemonstrated elsewhere in this Report) is towards a reduction of diversification (see alsovon Tunzelmann, 1996).
Innovative intensity This variable shows the number of patents issued to a firm per billion dollars of sales.Technological intensity has decreased sharply. It was reduced to less than one-half of itsinitial value (1977-81) in all firms by the final period (1986-89), and to less than one-third in European firms over the period; although in the latter case the number ofincluded firms rose and this may account for part of the decline. The variable is analyzedat length in Section 6.3.5.2 below.
6.3.4.3 Conclusions
1. The evolution of innovation has not reflected the more rapid economic changesexperienced by firms during the 1980s. Moreover, innovative intensity of firms hasdropped in spite of increases in equity and profitability, which the theory associates withhigh levels of innovativeness. Factors driving competition in this industry seem to bemarket size, fixed assets and capital intensity rather than innovativeness. Contrary to theassumptions of Utterback and Suárez (1991), exacerbation of competition has not led torapid technological change, unless relatively stable patenting behaviour conceals otherforms of incorporation of technology.
Some possible explanations for the apparent stability of innovation are:
73
a) Firms have preferred to aim at massive adoption of external innovations,notably in capital goods, rather than on patenting of their own innovations. Thisinterpretation is suggested by the rapid growth of fixed assets, the slow growthof employment and the increased capital-labour ratio.
b) Production of internal innovations increased but appropriation regimeschanged. Food-processing firms have preferred to finance R&D contracts withspecialized firms rather than to conduct in-house research. According to Aghionand Tirole (1994), when intellectual inputs (relative to capital inputs) dominate,as in biotechnology, research will often be carried out by independent units.
c) Firms have relatively stable R&D expenditures. One of the objectives of theirexpansion has been precisely that of spreading these fixed costs over a broaderbase (Connor and Schiek, 1996). If this interpretation were correct, a fall ininnovative intensity would denote success by the firm in spreading its costs.
2. Some changes experienced by firms are, in principle, favourable to innovation whileothers are adverse. Average size and availability of internal funds, which are thought toencourage growth in R&D expenditures, have increased. Yet gearing, which is believedto discourage R&D, has also increased.
6.3.5 Leaders and laggards
This section investigates the evolution of patenting activity in the world’s largest food-processing firms, as the group already studied above. The inquiry is pertinent to thepattern of technological change in this industry. Even if the contribution of smaller firmsand universities happens to be significant for innovation more broadly, largemultinational firms play a crucial role in the production of patented innovations in thisindustry (Rama, 1996). There are thus good reasons to study the largest patentors ingreater detail.
Second, we investigate whether innovative firms display any particular characteristics interms of size, profits, comparative profitability, subsectoral membership, or homecountry.

74
Table 6.3.5: Food and Drink Firms Classified According to Patenting Activity and
Assets
(1977-81, 1982-85, 1986-89; percentages of column totals)
No of patents per firm Non-patentor 3 >3 10 >10 Total
1977 - 1981
< US$ 1 bUS$ 1.1 b - 2.0 bUS$ 2.1 b - 4.0 b> US$ 4.0 b
70.6 %17.611.80.0
52.6 %34.210.52.6
27.3 %36.427.39.1
15.4 %23.138.523.1
46.8 %29.117.76.3
1982 - 85
< US$ 1 bUS$ 1.1 b - 2.0 bUS$ 2.1 b - 4.0 b> US$ 4.0 b
58.3 %12.525.04.2
53.2 %31.98.56.4
14.3 %7.1
50.028.6
8.3 %16.716.758.3
43.3 %21.619.615.5
1986 - 89
< US$ 1 bUS$ 1.1 b - 2.0 bUS$ 2.1 b - 4.0 b> US$ 4.0 b
42.9 %23.828.64.8
29.2 %29.216.725.0
0.0 %26.746.726.7
0.0 %0.0
15.484.6
23.7 %23.723.728.9
Significance levels: 1977-81 1982-85 1986-89
No. of observations 79 97 97
DF 9 9 9
Pearson Chi-square 20.40 43.41 37.65
P-value 0.0156 0.0000 0.0000
Table 6.3.6: Food and Drink Firms Classified According to Patenting Activity and
Sales
(1977-81, 1982-85, 1986-89; percentages of column totals)
No of patents per firm Non-patentor 3 >3 10 >10 Total
1977 - 1981
< US$ 1.5 bUS$ 1.6 b - 3.6 bUS$ 3.7 b - 6.0 b> US$ 6.0 b
68.4 %5.3
26.30.0
43.6 %53.82.60.0
18.2 %45.527.39.1
15.4 %15.438.530.8
41.5 %35.417.16.1
1982 - 85
< US$ 1.5 bUS$ 1.6 b - 3.6 bUS$ 3.7 b - 6.0 b> US$ 6.0 b
32.0 %32.020.016.0
44.0 %42.010.04.0
14.3 %21.435.728.6
0.0 %33.38.3
58.3
31.7 %35.615.816.8
1986 - 89
< US$ 1.5 bUS$ 1.6 b - 3.6 bUS$ 3.7 b - 6.0 b> US$ 6.0 b
18.2 %50.022.79.1
20.0 %44.014.022.0
6.7 %26.740.026.7
0.0 %7.1
21.471.4
14.9 %37.620.826.7
Significance levels: 1977-81 1982-85 1986-89
No. of observations 82 101 101
DF 9 9 9
Pearson Chi-square 43.95 32.60 26.44
P-value 0.0000 0.0002 0.0017

75
6.3.5.1 The Most Important Patentors
a) Number of Patents Granted and Size As could be expected, patented innovation tends to be produced predominantly by largefirms. Tables 6.3.5 and 6.3.6 display the distribution of firms according to different levelsof patenting activity, measured respectively by their assets and sales as alternativeindicators of the size of the enterprise. Levels of patenting are defined by the averagenumber of patents granted to the firm per year, based on the 4-year totals.
Most non-patentors are included among the smaller of these large firms in the openingperiod (1977-81), which remains true thereafter, although their share tends to declinelater while the medium-sized increase their share of non-patenting. The latter is especiallytrue when we use sales to measure the size of the firm. By contrast, heavy patentors, i.e.firms with more than 10 patents per year, are likely to be very large, and moreover tendto concentrate even more in the larger-size categories over time.
The Pearson chi-squared statistics at the bottom of each of these tables are used to testfor independence between the row and the column variables. In both tables, the testallows the rejection of the hypothesis of independence between size and average numberof patents per firm, with significant probability values (mostly under the 1% level) ineach sub-period. It may reasonably be concluded that the number of patents issued to afirm and its size are strongly interrelated.
b) Number of Patents Granted and Profitability Firms that produce a great number of patents tend to be profitable. Table 6.3.7 containsdata of the cross-classification of firms into three profit levels and four patent levels. Thechi-squared test, which allows rejection of the hypothesis of independence between thenumber of patents and the rate of profit, is significant at under the 10% level, except in1986-89.
A refinement of this result is presented in Table 6.3.8, where we calculate a new variablemeasuring the rate of return over and above the average, called “comparativeprofitability” (Geroski and Jacquemin, 1988). This variable is the difference between thefirm’s profit and average profit rates in the subsector within which the firm concentratesmost of its sales. Firms were cross-classified into the previous four patent categories andinto two levels of comparative profitability, depending on whether they made profitshigher or lower than the average. Then we tested the homogeneity of the proportion fordifferent levels of patenting activity. The null hypothesis of independence of the variablescould be rejected at under the 10% level for 1977-81, 1982-85 and 1986-89. Thissuggests that the number of patents granted to a firm are interrelated with its comparativeprofitability.
Although heavy patentors are likely to be highly profitable, conversely, it is interestingto note that a surprisingly large share of highly profitable companies are low patentorsor even non-patentors (see Table 6.3.9, which calculates percentages of the row ratherthan

76
Table 6.3.7: Food and Drink Firms Classified According to Patenting Activity and
Profit* (1977-81, 1982-85, 1986-89; percentages of column totals)
No of patents per firm Non-patentor 3 >3 10 >10 Total
1977 - 1981
10%11% - 20%> 20%
31.3 %43.825.0
34.2 %60.55.3
27.3 %72.70.0
7.7 %84.67.7
28.2 %62.89.0
1982 - 85
10%11% - 20%> 20%
43.5 %43.513.0
39.1 %52.28.7
28.6 %71.40.0
8.3 %50.041.7
34.7 %52.612.6
1986 - 89
10%11% - 20%> 20%
35.0 %45.020.0
26.1 %50.023.9
33.3 %26.740.0
7.7 %38.553.8
26.6 %43.629.8
* Net profit/own capital
Significance levels: 1977-81 1982-85 1986-89
No. of observations 78 95 94
DF 6 6 6
Pearson Chi-square 10.77 14.99 8.27
P-value 0.0958 0.0203 0.2189
Table 6.3.8: Food and Drink Firms Classified According to Patenting Activity and
Comparative Profitability* (1977-81, 1982-85, 1986-89; percentages of
column totals)
No of patents perfirm
Non-patentor 3 >3 10 >10 Total
1977 - 1981
Below AverageAbove Average
75.025.0
65.834.2
54.545.5
23.176.9
59.041.0
1982 - 85
Below AverageAbove Average
60.939.1
63.037.0
35.764.3
16.783.3
52.647.4
1986 - 89
Below AverageAbove Average
70.030.0
69.630.4
53.346.7
30.869.2
61.738.3
* Net profit/own capital (as compared with sub-sector averages)
Significance levels: 1977-81 1982-85 1986-89
No. of observations 78 95 94
DF 3 3 3
Pearson Chi-square 9.44 10.46 7.50
P-value 0.0240 0.0150 0.0577

77
Table 6.3.9: Food and Drink Firms Classified According to Patenting Activity and
Profit* (1977-81, 1982-85, 1986-89; percentages of row totals)
No of patents perfirm
Non-patentor 3 >3 10 >10 Total
1977 - 1981
10%11% - 20%> 20%TOTAL
22.7 %14.357.120.5
59.1 %46.928.648.7
13.6 %16.30.0
14.1
4.5 %22.414.316.7
100 %
100
100
100
1982 - 85
10%11% - 20%> 20%TOTAL
30.0 %20.025.024.2
54.5 %48.033.348.4
12.1 %20.00.0
14.7
3.0 %12.041.712.6
100 %
100
100
100
1986 - 89
10%11% - 20%> 20%TOTAL
28.0 %22.014.321.3
48.0 %56.139.348.9
20.0 %9.8
21.416.0
4.0 %12.225.013.8
100 %
100
100
100
* Net profit/own capital
Significance levels: 1977-81 1982-85 1986-89
No. of observations 78 95 94
DF 6 6 6
Pearson Chi-square 10.77 14.99 8.27
P-value 0.0958 0.0203 0.2189
column totals). This is especially noteworthy in 1977-81: for instance, 57% of highlyprofitable firms were non-patentors. Towards the end of the 1980s, the proportion ofhighly profitable firms with under 3 patents granted a year tends to drop but remainsconsiderable. This latter evolution probably indicates that innovation is becoming moreimportant to competition than it used to be. In short, while firms holding a great numberof patents are likely to be highly profitable, the reverse is not always true. Highlyprofitable businesses are not necessarily major patentors.
c) Number of Patents Granted, Countries and Industries
With which industries and countries are the principal patentors associated? The analysisof the combined effects of country and industry contributes to minimizing the possibilityof a home-country bias, a possibility alluded to in Section 6.3.4.2. However, in whatfollows, comparisons between US and non-US firms should be treated with a degree ofcaution, in the light of such possible biases.

78
Table 6.3.10: Cross-classification of Food and Drink Firms by Average Number of
Patents, Industry and Home-Country (1977-81, 1982-85, 1986-89; percentages of
column totals)
Industry Home Country Non-patentor 3 >3 10 > 10 Total
1977-1981
Basic Food and Agri-businesses
Highly-processed Food
Beverages
USEurJap
OtherUSEurJap
OtherUSEurJap
OtherTOTAL
5.3 %5.3
15.85.30.0
36.80.0
15.80.0
10.55.30.0100
12.8 %12.87.70.0
23.112.82.62.60.0
12.85.17.7100
9.1 %9.10.09.1
27.30.0
18.20.0
18.29.10.00.0100
23.1 %0.00.00.0
38.523.17.70.07.70.00.00.0100
12.28.57.32.4
20.718.34.94.93.79.83.73.7100
1982-1985
Basic Food and Agri-businesses
Highly-processed Food
Beverages
USEurJapOtherUSEurJapOtherUSEurJapOtherTOTAL
4.0 %12.012.00.08.0
36.08.0
16.00.04.00.00.0100
10.0 %8.04.04.0
12.026.06.02.02.0
16.04.06.0100
28.6 %0.07.10.0
50.00.07.10.00.00.07.10.0100
8.3 %8.30.00.0
33.325.08.30.0
16.80.00.00.0100
10.97.95.92.0
18.824.86.95.03.08.93.03.0100
1986-1989
Basic Food and Agri-businesses
Highly-processed Food
Beverages
USEurJapOtherUSEurJapOtherUSEurJapOtherTOTAL
13.6 %13.613.64.54.5
31.80.04.50.09.10.04.5100
8.0 %8.04.02.0
18.028.04.08.00.0
14.02.04.0100
20.0 %0.06.70.0
26.76.7
26.70.06.70.06.70.0100
7.1 %7.10.00.0
35.721.47.10.0
14.30.07.10.0100
10.97.95.92.0
18.824.86.95.03.08.93.03.0100
Significance levels: 1977-81 1982-85 1986-89
No. of observations 82 101 101
DF 33 33 33
Pearson Chi-square 51.49 55.99 45.75
P-value 0.0212 0.0075 0.0690

79
Table 6.3.10 - which classifies the firms by industry and country, on the one hand, andby number of patents, on the other - shows that a large share of heavy patentors (between33% and 39% in each period) is persistently to be found among US manufacturers ofhighly-processed food. European processors of this type of food are also well represented(21% to 25%), although to a lesser extent; while data on non-patentors in the same tableshow that a surprisingly large share of non-patentors (31% to 37%) are Europeanmanufacturers of such highly-processed foods, even though that share declines over time(i.e. from the latter to the former percentage). This reduction, however, could beattributable to increased propensities to patent in the USA, e.g. through setting up morebusinesses in that country.
The combined effects of industry and country are interrelated with the average numberof patents per year, according to the statistics displayed at the bottom of Table 6.3.10.The results of the chi-squared and G2 tests are statistically significant at under the 10%level. An alternative approach analyzing row rather than column totals and percentagesshows clear differences in the patenting behaviour of European firms and theircompetitors, by industry (data not displayed here).
The number of patents is a useful indicator of sectoral patterns of innovation but does notprovide an accurate measure of innovativeness at the firm level because it may beinfluenced by firm size. Therefore, many studies deflate the number of patents by sales,assets or employment to obtain a more reliable indicator of relative firm innovativeness(Branch, 1974). We shall focus on this interpretation in the following paragraphs.
6.3.5.2 Innovative intensity
a) Innovative intensity and Size
When patents are deflated by sales, innovative intensity reflects the number of patents perunit of output, in this case billion dollars of sales. We classify firms by three levels ofinnovative intensity, derived from a histogram: non-patentors, firms with fewer than 2.4patents per billion-dollar sales per annum, and firms with more than 2.4 patents perbillion-dollar sales per annum. Table 6.3.11 contains a cross-classification of firms intothese levels of innovative intensity and the four levels of asset values adopted previously(in Table 6.3.5). Table 6.3.12 replaces the latter with the four levels of sales values alsoused above (in Table 6.3.6).
By reading across the columns, it can be seen that “non-intensive” firms, i.e. non-patentors and firms with fewer than 2.4 annual patents per billion-dollar sales, tend to besmaller in this sample. Conversely, “intensive” firms, i.e. firms with higher patentingrates, tend to be giant businesses. However the differences are not overwhelming, and theevidence does not support the hypothesis of interrelation between size and innovativeintensity. The results of the Pearson chi-squared test (at the bottom of these Tables) arenot statistically significant, except in 1977-81.

80
Table 6.3.11: Food and Drink Firms Classified According to Innovative Intensity* and
Assets (1977-81, 1982-85, 1986-89; percentages of column totals)
Innovative Intensity Non-patentor Low-intensity High-intensity Total
1977 - 1981
< US$ 1bUS$ 1.1 b - 2.0 bUS$ 2.1 b - 4.0 b> US$ 4.0 b
70.6 %17.611.80.0
41.3 %30.421.76.5
37.5 %37.512.512.5
46.8 %29.117.76.3
1982 - 85
< US$ 1bUS$ 1.1 b - 2.0 bUS$ 2.1 b - 4.0 b> US$ 4.0 b
58.3 %12.525.04.2
39.0 %25.420.315.3
35.7 %21.47.1
35.7
43.3 %21.619.615.5
1986 - 89
< US$ 1bUS$ 1.1 b - 2.0 bUS$ 2.1 b - 4.0 b> US$ 4.0 b
42.9 %23.828.64.8
21.9 %21.923.432.8
0.0 %33.316.750.0
23.7 %23.723.728.9
* No of patents/sales x 1000; low intensity < 2.4 patents p.a.; high intensity > 2.4 p.a.
Significance levels: 1977-81 1982-85 1986-89
No. of observations 79 97 97
DF 6 6 6
Pearson Chi-square 6.88 10.19 13.63
P-value 0.3326 0.1170 0.0340
Table 6.3.12: Food and Drink Firms Classified According to Innovative Intensity and
Sales (1977-81, 1982-85, 1986-89; percentages of column totals)
Innovative Intensity Non-patentor Low-intensity High-intensity Total
1977 - 1981
< US$ 1.5 bUS$ 1.6 b - 3.6 bUS$ 3.7 b - 6.0 b> US$ 6.0 b
68.4 %5.3
26.30.0
31.9 %51.110.66.4
37.5 %25.025.012.5
41.5 %35.417.16.1
1982 - 85
< US$ 1.5 bUS$ 1.6 b - 3.6 bUS$ 3.7 b - 6.0 b> US$ 6.0 b
32.0 %32.020.016.0
31.1 %37.718.013.1
33.3 %33.30.0
33.3
31.7 %35.615.816.8
1986 - 89
< US$ 1.5 bUS$ 1.6 b - 3.6 bUS$ 3.7 b - 6.0 b> US$ 6.0 b
18.250.022.79.1
14.934.320.929.9
8.333.316.741.7
14.937.920.826.7
Significance levels: 1977-81 1982-85 1986-89
No. of observations 79 97 97
DF 6 6 6
Pearson Chi-square 17.97 5.98 5.60
P-value 0.0063 0.4255 0.4695

81
b) Innovative intensity and Profitability
Table 6.3.13 classifies the firms by the three innovative levels and by the three levels ofprofit used previously in Table 6.3.7. The chi-squared statistic at the bottom of the tableindicates that innovative intensity and rate of profit are unrelated (though results arenearly statistically significant at the 10% level in 1977-81). Innovative intensity is alsounrelated to profitability above the norm, except in 1977-81 (Table 6.3.14).
c) Innovative intensity, Countries and Industries
An important question is whether the weaker position of European firms suggested by theanalysis of patents is an effect of their having a smaller size than the US firms. We canreturn to the cross-tabulations of Table 6.3.10 as an approximation to the categories ofinnovative intensity used here. The situation regarding non-patentors has already beendescribed. US manufacturers of highly-processed food and US manufacturers of basicfood as well as agri-businesses stand out among the highly-intensive firms in 1977-81.However, the situation evolved. In 1986-89, the enterprises standing out among theintensive firms tend to be Japanese as well as US processors of highly-processed food.By contrast, European manufacturers of highly-processed food stand out among less-intensive firms. The Pearson chi-squared and the G2 tests based on the definitions ofintensity used here show innovativeness is interrelated with industry/country, with theresults being statistically significant at about the 10% level or less.
Examination of the row totals shows that firms have tended to concentrate in theintermediate stratum of “low intensity”. This situation reflects both rapid increases insales and relative stability of the average number of patents issued to firms throughoutthe period. This trend also shows up in European firms.
d) Sub-sectoral differences
a) Basic Food and Agri-businesses. The proportion of highly intensive firms falls whilethat of low-intensive firms remains rather stable and that of non-patentors drops amongboth US and European firms. Among Japanese firms, the shares of non-patentors andless-intensive firms remain stable but the proportion of highly-intensive firms rises.However this increase may simply reflect more patenting in the US, following greaterbusiness involvement of Japanese firms in this country at the end of the 1980s. b) Highly-processed Food. The proportion of non-patentors and less-intensive firms rosewhile that of highly intensive firms fell among US firms. The share of non-patentors andhighly-intensive firms decreased but that of low-intensive firms increased amongEuropean processors.c) Beverages. By the end of the 1980s, European firms were not represented in theintensive group.

82
6.3.13: Food and Drink Firms Classified According to Innovative Intensity and Profit*
(1977-81, 1982-85, 1986-89; percentages of column totals)
Innovative Intensity Non-patentor Low-intensity High-intensity Total
1977 - 1981
10%11% - 20%> 20%
31.3 %43.825.0
26.1 %67.46.5
31.3 %68.80.0
28.2 %62.89.0
1982 - 85
10%11% - 20%> 20%
43.5 %43.513.0
32.2 %59.38.5
30.8 %38.530.8
34.7 %52.612.6
1986 - 89
10%11% - 20%> 20%
35.0 %45.020.0
21.0 %48.430.6
41.7 %16.741.7
26.6 %43.629.8
* Net Profit/own capital
Significance levels: 1977-81 1982-85 1986-89
No. of observations 78 95 94
DF 4 4 4
Pearson Chi-square 7.67 6.23 5.85
P-value 0.1044 0.1824 0.2105
Table 6.3.14: Food and Drink Firms Classified According to Innovative Intensity and
Comparative Profitability* (1977-81, 1982-85, 1986-89)
Innovative Intensity Non-patentor Low-intensity High-intensity Total
1977 - 1981
Below AverageAbove Average
75.0 %25.0
60.9 %39.1
37.5 %62.5
59.0 %41.0
1982 - 85
Below AverageAbove Average
60.9 %39.1
54.2 %45.8
30.8 %69.2
52.6 %47.4
1986 - 89
Below AverageAbove Average
70.0 %30.0
59.7 %40.3
58.3 %41.7
61.7 %38.3
* Net profit/own capital of the firm (relative to sub-sector average)
Significance levels: 1977-81 1982-85 1986-89
No. of observations 78 95 94
DF 2 2 2
Pearson Chi-square 4.82 3.18 0.75
P-value 0.0900 0.2040 0.6880

83
Table 6.3.15: Cross-classification of Food and Drink Firms by Innovative Intensity*,
Industry and Home-Country (1977-81, 1982-85, 1986-89; percentages of column totals)
Industry Home Country Non-patentor Low-intensity High-intensity Total
1977-1981
Basic Food and Agri-businesses
Highly-processed Food
Beverages
USEurJap
OtherUSEurJap
OtherUSEurJap
OtherTOTAL
5.3 %5.3
15.85.30.0
36.80.0
15.80.0
10.55.30.0100
10.6 %8.56.42.1
25.512.82.12.16.4
12.84.36.4100
25.0 %12.50.00.0
31.312.518.80.00.00.00.00.0100
12.2 %8.57.32.4
20.718.34.94.93.79.83.73.7100
1982-1985
Basic Food and Agri-businesses
Highly-processed Food
Beverages
USEurJap
OtherUSEurJap
OtherUSEurJap
OtherTOTAL
4.0 %12.012.00.08.0
36.08.0
16.00.04.00.00.0100
13.1 %6.63.33.3
23.019.73.31.63.3
13.14.94.9100
13.3 %6.76.70.0
20.026.720.00.06.70.00.00.0100
10.9 %7.95.92.0
18.824.86.95.03.08.93.03.0100
1986-1989
Basic Food and Agri-businesses
Highly-processed Food
Beverages
USEurJap
OtherUSEurJap
OtherUSEurJap
OtherTOTAL
13.6 %13.613.64.54.5
31.80.04.50.09.10.04.5100
10.4 %6.03.01.5
22.425.44.56.03.0
10.44.53.0100
8.3 %8.38.30.0
25.08.3
33.30.08.30.00.00.0100
10.9 %7.95.92.0
18.824.86.95.03.08.93.03.0100
* No of patents/sales x 1000; low intensity < 2.4 patents p.a.; high intensity > 2.4 p.a.
Significance levels: 1977-81 1982-85 1986-89
No. of observations 82 101 101
DF 22 22 22
Pearson Chi-square 38.97 31.58 30.70
P-value 0.0142 0.0848 0.1025

84
6.3.5.3 Home Country and Firm Size
Another way to minimize the home-country bias in international comparisons ofinnovativeness is to combine the home-country and the firm-size effects. Here, wecompare the mean innovative intensity of nine groups: small US firms, small Europeanfirms, small Other country firms, medium US firms, medium European firms, mediumOther country firms, large US firms, large European firms and large Other country firms(Other countries include Japan). Size levels are defined as follows: up to US$ 1.5b globalsales (small firms); from US$ 1.5b to US$ 3.6b (medium-sized firms); and greater thanUS$ 3.6b (large firms). The tabulations are set out in Table 6.3.15, measured aspercentages of the column totals for each sub-period.
The null hypothesis to be tested with an analysis of variance (ANOVA) is that the meanintensity is the same for the nine groups. The results are shown separately for each sub-period in the panels of Table 6.3.16.
a) In 1977-81, US firms exhibit higher average intensity for the three size levels(panel A). This means that large US firms show higher innovative intensity thanlarge European firms, medium US firms higher than medium European firms, andso on. Moreover, medium and even small US firms show higher average intensitythan large European firms. From this Table it is not possible to establish how farthis difference is due to the USA being the country of patenting, but in our viewit also suggests a greater degree of innovativeness among the US firms (comparealso with the results on Relative Technological Advantage computed elsewherein this Report). The Two-way ANOVA (below the panel) reveals significantdifferences in innovativeness among the means of the country groups at under the5% level, but not among the size groups. This lack of significant interactionindicates that differences between countries are about the same at each size level.The greatest differences in innovative intensity are between, on the one hand,large US firms and, on the other, medium and small European firms. Thissituation is unfavourable to these medium and small European firms because theywill be encountering affiliates of the large, highly innovative US firms in theirown home markets.
b) In 1982-85, the interpretation of results is similar (panel B). However, the gapbetween large US firms and medium European firms has tended to close.
c) In 1986-89, large and medium US firms still exhibit higher average intensitythan similar firms from other countries (panel C). Small European firms couldhave become more intensive than small US and Other country firms. Thepossibility cannot be excluded that the cause was an increase in foreign patentingof small European firms, following greater involvement in the USA, rather thanany domestic increase in innovativeness. The ANOVA test reveals significantdifferences due to country and to the interaction of country as well as size.Differences in size, however, remain statistically insignificant.

85
Table 6.3.16: Two-way Analysis of Variance of Average Innovative Intensity* grouped
by type of firm A) 1977-81
Summary Statistics: Mean Std. Dev. S.E.Mean Maximum Minimum Cases
Small: US .128 .106 .037 .380 .058 8
Europe .090 .081 .022 .364 .058 14
Other .115 .068 .020 .282 .058 11
Medium: US .115 .071 .020 .319 .060 12
Europe .085 .033 .011 .169 .061 9
Other .099 .071 .025 .266 .058 8
Large: US .162 .070 .022 .351 .109 10
Europe .094 .049 .020 .182 .058 6
Other .058 .000 .000 .058 .058 3
All .109 .072** .008 .380 .058 81* Analysed in logarithmic form**Robust S.D. = 0.063
SOURCE SUM OFSQUARES
DF MEANSQUARE
F VALUE PROBABILITY
ANALYSIS OF VARIANCE:
SIZE 0.0019 2 0.0009 0.19 0.8302
COUNTRY 0.0348 2 0.0174 3.44 0.0374
INTERACTION 0.0158 4 0.0040 0.78 0.5407
ERROR 0.3640 72 0.0051
BROWN-FORSYTHE TEST*:
SIZE 2, 45 0.20 0.8202
COUNTRY 2, 44 3.88 0.0280
INTERACTION 4, 43 1.34 0.2716
LEVENE TEST**:
SIZE 2, 72 1.55 0.2195
COUNTRY 2, 72 1.10 0.3373
INTERACTION 4, 72 0.55 0.6980
* For equality of means; variances not assumed to be equal** For equality of variances
B) 1982-85
Summary Statistics: Mean Std. Dev. S.E.Mean Maximum Minimum Cases
Small: US .037 .029 .012 .069 .000 6
Europe .027 .035 .008 .118 .000 18
Other .074 .090 .032 .234 .000 8
Medium: US .050 .067 .024 .181 .000 8
Europe .034 .075 .018 .292 .000 17
Other .049 .079 .024 .279 .000 11
Large: US .075 .082 .019 .291 .000 19
Europe .035 .056 .021 .138 .000 7
Other .001 .002 .001 .005 .000 7
All .044 .067** .007 .292 .000 101* Analysed in logarithmic form**Robust S.D. = 0.059
SOURCE SUM OFSQUARES
DF MEANSQUARE
F VALUE PROBABILITY
ANALYSIS OF VARIANCE**:

86
SIZE 0.0024 2 0.0012 0.79 0.4594
COUNTRY 0.0077 2 0.0038 2.56 0.0853
INTERACTION 0.0092 4 0.0023 1.53 0.2055
ERROR 0.0926 62 0.0015
WELCH TEST*: 8, 19 6.53 0.0004
BROWN-FORSYTHE TEST*:
SIZE 2, 15 0.52 0.6035
COUNTRY 2, 14 1.86 0.1917
INTERACTION 4, 15 1.31 0.3117
* For equality of means; variances not assumed to be equal** With 15% trimming

87
C) 1986-89
Summary Statistics: Mean Std. Dev. S.E.Mean Maximum Minimum Cases
Small: US .013 .022 .013 .038 .000 3
Europe .015 .016 .005 .055 .000 10
Other .112 .145 .102 .215 .010 2
Medium: US .021 .018 .007 .044 .000 8
Europe .015 .020 .019 .250 .000 16
Other .050 .072 .024 .279 .000 14
Large: US .060 .055 .012 .231 .000 22
Europe .033 .053 .013 .183 .000 16
Other .021 .029 .009 .088 .000 10
All .035 .051** .005 .250 .000 101
* Analysed in logarithmic form**Robust S.D. = 0.045
SOURCE SUM OFSQUARES
DF MEANSQUARE
F VALUE PROBABILITY
ANALYSIS OF VARIANCE**:
SIZE 0.0030 2 0.0015 1.26 0.2918
COUNTRY 0.0110 2 0.0055 4.62 0.0135
INTERACTION 0.0162 4 0.0041 3.41 0.0139
ERROR 0.0734 62 0.0012
WELCH TEST*: 8, 17 1.25 0.3899
* For equality of means; variances not assumed to be equal** With 15% trimming
6.3.5.4 Conclusions
1. The most important sources for total numbers of patented innovations are very large,profitable firms, which obtain above-average gains.
2. Innovative intensity is little related to size, profits or profitability above the norm. Bycontrast, it is significantly related to the industry and the home country in which the firmis based. Firms from European countries have tended to show some improvement overtime but may still be lagging, particularly in certain subsectors.
6.3.6 Innovative intensity and Profitability
The preceding Section suggested that innovativeness and profitability were unrelated inthis industry. This Section further explores the relationship of both variables. In doing so,it demonstrates that this apparent lack of association conceals, in fact, different roles forinnovation in different types of firms within this industry.
6.3.6.1 The Framework and the Hypotheses

88
Salais and Storper (1992), among others, have called our attention to the differences inindustrial structures and performance among nations revealed by studies of comparativeindustrialisation. Such authors believe that countries and firms do not convergenecessarily towards the same level of profitability; neither do they use the samecombination of products, organization and resources - such as fixed capital, circulatingcapital, credit and labour - to obtain high profit. By contrast with orthodox economictheory, in these authors’ views diversity would not necessarily be a failure to adopt bestpractices. In short, different rationalities for profitability could be observed within thesame industry and even among countries.
In some cases, divergent paths to profitability are associated with different homecountries. Geroski and Jacquemin (1988) found country-wide factors were morediscriminating than firm- or industry-specific factors in a study on the persistence ofprofit in three European countries. Coriat (1990), who compares the US and Germany,concludes that paths to the achievement of profit are different in the two countries.
Other authors focus on the different paths to profitability used by groups of firms,independently of their home country. Our approach in this Chapter of the Report is drawnpartly from that of Porter (1980), in which industries are formed by “strategic groups”following the same or a similar strategy. Differences in strategy may imply differencesin product mix, scale, technology, capital requirements and other sources of entrybarriers. Groups are not equivalent to market segment. Firms in different groups oftenshow differences in profitability but not always. One of Porter’s hypotheses is that firmswhich are good at some types of strategy are often less efficient at others: firms achievinga low-cost position, for instance, are likely to be less efficient at technologicaldevelopment.
Therefore, the first idea we develop in this Section is that there are a multiplicity of profitmaximizing strategies in the food-processing industry. We shall also study whether pathsto profitability are influenced by home countries or by the presence of strategic groupswithin this industry (or by both). As shown in the last Section, highly profitable firmsmay or may not be great patentors of innovations. Therefore we shall test the hypothesisthat innovativeness plays divergent roles in different strategic groups. In other words, weassume two groups may eventually obtain similar levels of profit, one via innovativenessand the other via alternative strategies: While the rate of profit might be similar, themethod used to achieve it might not be.
The test of these hypotheses follows three steps: a) A linear regression between profitability (as the dependent variable) andinnovativeness as well as other independent variables, by home-country; b) a cluster analysis identifying different strategic groups in this industry; c) a cross-tabulation of strategic groups with a variable indicating the homecountry of the firm and a series of ANOVA tests which establish the extent ofdifferences in profitability among groups.
6.3.6.2 The Regression Analysis

89
We shall test here whether the same set of variables, including innovativeness, explainprofit in firms based in different home countries. We shall also test the hypothesis thatthe sign and level of association of innovativeness as well as profitability are distinct infirms based in different home countries.
We use a least-squares linear regression equation between the dependent variable, profit,and the following independent variables: assets, capital structure or gearing, andinnovative intensity. The equality of regression lines across groups of countries is testedfor, i.e. whether the regression equations for different countries are the same.
Although a number of authors utilise a lagged variable to measure the impact ofinnovativeness on profit (Branch, 1974; Grabowski, 1968), others measure both variablesin the same year (Himmelberg and Petersen, 1994; Acs and Isberg, 1991b). We havetherefore used both measures of innovativeness. A set of equations analyses the effectsof innovative intensity in period t-1 on profit in period t (Table 6.3.18). Another studiesthe influence of innovative intensity in period t on profit in period t (Table 6.3.19).
The distribution of the variables is log-normal. That of the residuals of the technologicalvariable is normal and does not suggest a significant non-linear association with profit.There is no evidence of multicollinearity among the variables.
The general results seem to confirm a lack of association between innovativeness andprofitability (Table 6.3.17). The analysis by home country, however, shows a differentpicture. For the final years 1986-89, according to the F statistic and the multiple R2(bottom of Tables 6.3.18 and 6.3.19), the model explains a significant share of thevariance of the profitability of US and, especially, Other country firms for bothspecifications of the technological variable. However, the model fits the data of Europeanfirms poorly. This means the combined effects of size, capital structure andinnovativeness are insufficient to explain the variance of profit in European firms. Thisconclusion implies that profit is not explained by the same set of variables for firms basedin different home countries. As suggested by Lecraw (1983), multinationals fromdifferent home countries operate abroad based on different competitive advantages theyhave developed as a response to the availability of funding, technology and so on in theirhome market.

90
Table 6.3.17: Regression Results for Profit Equations, All Firms, 1982-85 and 1986-89
1982-85 1986-89
Variable LaggedInnovationIntensity*
Non-laggedInnovationIntensity
LaggedInnovationIntensity**
Non-laggedInnovationIntensity
Intercept
Log Assets
Log Gearing
Log Innovative Intensity
0.1032
0.0025(0.37)
-0.0544(-2.83)
0.0471(1.66)
0.0921
0.0036(0.54)
-0.0360(-1.86)
0.0393(0.93)
0.0358
0.0115(1.11)
0.0307(1.15)
0.0281(0.44)
0.0242
0.0149(0.16)
0.0295(0.11)
-0.0339(-0.05)
No. of CasesF-RatioMultiple R2
784.27
0.148
932.04
0.064
941.08
0.035
941.07
0.035
(t statistics below coefficients)* i.e. for 1977-81** i.e. for 1982-85
Table 6.3.18: Regression Results for Profit Equations, by Country (1982-85 and
1986-89), with Lagged Variable for Innovative Intensity
VARIABLE 1982-85 1986-89
US Europe Other US Europe Other
Intercept
Log Assets
Log Gearing
Log Inn. Intensity(non lagged)
0.1109
0.0004(-0.04)
-0.0457(-0.92)
0.0720*(1.92)
0.2970
-0.0396**(-2.58)
-0.0970**(-3.16)
0.3860**(2.45)
0.0481
0.0176*(1.95)
-0.0644**(-4.35)
-0.0583(-1.52)
-0.0253
0.0098(0.73)
0.1851**(4.22)
-0.0092(-0.12)
0.1707
-0.0174(-0.69)
0.0084(0.14)
0.1840(0.53)
-0.0005
0.0283**(2.80)
-0.0716**(-4.91)
-0.1164**(-2.68)
No. of Cases
F Statistics
Multiple R2
481.42
0.088
104.28*0.681
207.79**0.594
506.98*0.313
190.21
0.040
259.21**0.568
(t statistics below coefficients)* Significant at between 5% and 10% levels** Significant at 5% level or less.

91
Table 6.3.19: Regression Results for Profit Equations, by Country (1982-85 and
1986-89), with Non-Lagged Variable for Innovative Intensity
VARIABLE 1982-85 1986-89
US Europe Other US Europe Other
Intercept
Log Assets
Log Gearing
Log Inn. Intensity(non lagged)
0.0807
0.0039(0.39)
-0.0174(-0.37)
0.0997*(1.73)
0.2043
-0.0227(-0.94)
-0.0489(-1.05)
0.2266(0.70)
0.0479
0.0173**(2.23)
-0.0665**(-4.71)
-0.0673**(-2.06)
-0.0314
0.0114(0.87)
0.1853**(4.37)
-0.0412(-0.37)
0.2060
-0.0256(-0.94)
0.0025(0.04)
0.3759(0.85)
-0.0020
0.0280**(2.65)
-0.0679**(-3.75)
-0.1109**(-2.19)
No. of CasesF StatisticsMultiple R2
511.58
0.092
190.55
0.099
238.65*0.577
507.04**0.315
190.36
0.067
257.85**0.529
(t statistics below coefficients)* Significant at between 5% and 10% levels** Significant at 5% level or less.
In both US and Other country firms the sign and significance of the technologicalcoefficient remain unchanged when we modify the specification of the technologicalvariable (lagged or non-lagged). In US firms, the sign of the technological coefficient ispositive and significant during the 1982-85 crisis; however, it is negative, although notstatistically significant, over the 1986-89 recovery period. The result for the secondperiod would seem to contradict the theory put forward in Section 6.3.2 above, i.e. of apositive association between innovativeness and profit. It is consistent, however, with thenotion of a trade-off between innovativeness and profit developed by Kamien andSchwartz (1975) as well as by Branch (1974). A possible explanation is that R&Dbecame less crucial to US firms owing to the anticipation of high profits over 1986-89.Directors would be less prone to spend money on R&D when the firm is alreadyperforming well (or success is predicted). In addition, high profits usually coincide withperiods of heavy demand during which engineers and scientists are likely to be shiftedfrom the firm laboratories to the industrial plant, a situation tending to reduce innovationsby unit value of sales (Branch, 1974). The significant coefficient for gearing in the USfirms for this period suggest the primacy of financial determinants of profitability.
The negative and significant sign of the technological coefficient in Other country firmsalso confirms these authors’ point of view. According to them, when the firm predictslower performance than its competitors, it is likely to embark on R&D projects generatingnew products and processes (this also constitutes the assumption underlying “search”behaviour in the non-neoclassical model of Nelson and Winter, 1974). As seen in Section6.3.3, Other country firms - especially Japanese ones - actually got lower returns thantheir competitors over the period studied here.
Finally, in European firms, the sign of the technological coefficient is positive butinsignificant. Geroski et al. (1993) also found a negative association between innovationand profit in British food-processing firms.

92
6.3.6.3 The Cluster Analysis
Even though the regression analysis gives some interesting insights into divergencesbetween firms based in different home countries, it does not supply a general explanationfor the association of innovativeness and profit in this industry.
We shall now attempt to establish a more global explanation based on Porter’s strategic-group construct. The previous discussion suggested that the relationship betweeninnovativeness and profit depended on a number of trade-offs and interrelated factors.Therefore it is necessary to study the mutual association among a great number ofstructural characteristics and strategies. The underlying premise is that firms are nothomogeneous within industries (Bush and Sinclair, 1991). We assume, by contrast, thateach cluster would be a coherent combination of technological and financial strategiesas well as practices of resource use (Salais and Storper, 1992). These models have, in ourview, implications for the pattern of competition in the food-processing industry at large.
To study the underlying structure of a great mass of data, including profit andinnovativeness data, we use the K-means cluster analysis, which is an interdependentmultivariate method that classifies each firm into the cluster whose centre is closest inEuclidean distance to the firm (the centre of the cluster is defined as the mean of the casesin the cluster). This technique groups cases which are very similar in a variety ofcharacteristics. Since the variables are measured in different units, we use the varianceto standardize our data and give equal weight to each variable. The model comprises both economic and technological variables: assets*, profits,margins*, rotation*, gearing*, number of patents*, innovative intensity, food,biotechnology, diversification, and experience (starred variables are measured as theirlogarithms, for variables that are lognormally distributed).
These variables - which have been defined in Table 6.3.2 - denote strategic optionsregarding the type of financial resources, the type and level of technology, the use ofproduction factors, and so on. The reasons for selecting this set are the following:Sales Large size may bring economies of scale in production, R&D and distribution.Scale is an important element to building entry or mobility barriers and a determinant ofbargaining power of the firm vis-à-vis suppliers as well as retailers (Porter, 1980). Margins Low margins suggest low sales prices or high costs (or both). It is adecomposition of the profit rate so it helps to describe how profits arise.Profits This is a measure of the rate of return on investment.Gearing This shows the leverage of the firm. It provides a measure of the fundscontributed by creditors relative to investors. A high level of gearing increases risk andthe profitability-versus-risk trade-off is a crucial consideration for the firm. Moreover,low gearing increases the value of the firm though, on the contrary, high gearing raisesthe cost of equity. According to the signalling theory, capital structure may be used bymanagers to send signals to the public about the future performance of the firm, signs thatcannot be imitated by unsuccessful firms because such firms do not have enough cashflow to back this strategy (Copeland and Weston, 1992). In general, managers preferinternal funds supplemented by loans because this structure gives the firm more certaintyand independence (Bowman and Asch, 1987).

93
Rotation of Capital The sales to capital ratio is a measure of both the level of firmactivity and efficient utilization of own capital. A low rate means the firm is notgenerating a sufficient volume of business, given its level of investment.Capital Intensity This measures the use of capital relative to labour.Number of patents A great number of patents suggest the firm owns important intangibleassets.Biotechnology, food and diversification These variables point to capabilities andspecialization options in the technological field. In addition, biotechnology indicatesexpertise in technologically advanced products, as a generic technology applicable tonumerous fields within food-processing, animal and plant genetics; this characteristicmay promote product diversification and vertical integration. Diversification may reducedependence on suppliers of technology.Experience One school of thought sees knowledge as accumulative. In this light, earlypatentors would show technological advantages vis-à-vis less experienced firms. Anotherperceives technological change as a basically discontinuous process. This perspectivewould produce a “dinosaur” syndrome among early patentors, who may be frozen intoold technology, putting a brake on production of current technology in these firms.
We obtain three clusters which are shown in Tables 6.3.20 to 6.3.22. As indicated by theF-ratios, the technological variables, with the exception of biotechnology, are ratherimportant determinants of cluster formation. The cluster profiles are easier to assess byfirst ordering the variables according to their F-ratio. This provides an insight into howstrategic groups compete in food-processing.
The strategic groups with the highest levels of innovativeness persistently display thehighest average profit rates in 1977-81 (column 1 of Table 6.3.20), 1982-85 (column 2of Table 6.3.21) and 1986-89 (column 2 of Table 6.3.22). Throughout 1977-81, andespecially the 1982-85 crisis, these groups moreover show the lowest standard deviationof profits, a feature often interpreted as an indicator of lower risk (Telser, 1988). Moreimportantly, these groups are the only ones to display profits above the norm. Innovativefirms tend to display larger sizes, significant intangible assets and higher degrees ofdiversification into non-food technologies.
Data on the least innovative groups are shown in the third columns of each of theseTables. These firms are persistently the most specialized in food technology, the leastdiversified into non-food technology and the least experienced. They consistently exhibitthe lowest rates of profits and margins. They demonstrate efficient use of capital, asevidenced by the highest rates of rotation, and great potential to secure external funding.Capital intensity, on the contrary, is rather low.

94
Table 6.3.20: Cluster Analysis, 1977-81
Variables Cluster 1* Cluster 2 Cluster 3 Grand Mean F-Ratio P-value
Economic variables
Log Sales
Profit
Log Margin
Log Rotation
Log Capital Intensity
Log Gearing
Technological variables
Log no of Patents
Innovative intensity
Biotechnology
Food
Diversification
Experience
4.5780(0.3378)0.1522
(0.0385)0.0172
(0.0007)0.6067
(0.1392)1.3416
(0.2730)0.4707
(0.0616)
1.1783(0.31410.4862
(0.4231)0.0678
(0.1228)0.2893
(0.2239)5.6548
(2.4503)44.1376
(16.2654)
4.2537 (0.3084) 0.1205 (0.0935) 0.0058 (0.0033) 0.9580 (0.1874) 1.3454 (0.2582) 0.6317 (0.1521)
0.2258 (0.2314) 0.0688 (0.0984) 0.0728 (0.1407) 0.3724 (0.3739) 0.6885 (0.7946) 29.0085 (24.4460)
4.1641 (0.3286) 0.1325 (0.0445) 0.0182 (0.0074) 0.4895 (0.1796) 1.4172 (0.2634) 0.4336 (0.0911)
0.2252 (0.1898) 0.0863 (0.1990) 0.0320 (0.1069) 0.2752 (0.2917) 0.7147 (0.6759) 33.9209 (27.7622)
4.3002
0.1343
0.0140
0.6613
1.3760
0.5003
0.4725
0.1843
0.0550
0.3061
1.9870
34.9928
10.92
1.46
33.02
49.25
0.74
24.36
122.36
19.68
0.74
0.59
98.54
2.33
0.000
0.238
0.000
0.000
0.483
0.000
0.000
0.000
0.481
0.555
0.000
0.104
N 21 26 34
Notes: Figures in Clusters columns represent Cluster Means, with Standard Deviations below in parentheses* = Most innovative-intense cluster.

95
Table 6.3.21: Cluster Analysis, 1982-85
Variables Cluster 1 Cluster 2* Cluster 3 Grand Mean F-Ratio P-value
Economic variables
Log Sales
Log Profit
Log Margin
Log Rotation
Log Capital Intensity
Log Gearing
Technological variables
Log no of Patents
Innovative intensity
Biotechnology
Food
Diversification
Experience
4.3437(0.3196)0.0868
(0.0227)0.0284
(0.0118)0.4663
(0.1793)1.6247
(0.3174)0.3322
(0.0907)
0.3501(0.3045)0.0875
(0.1109)0.0628
(0.1422)0.2817
(0.3203)1.1500
(1.1263)37.8090
(28.7795)
4.8121 (0.3682) 0.1025 (0.0193) 0.0298 (0.0113) 0.6255 (0.2049) 1.5207 (0.2933) 0.4129 (0.0868)
1.3043 (0.3909) 0.4240 (0.3213) 0.0501 (0.1105) 0.2169 (0.1648) 6.8148 (2.5848) 38.4756 (12.9068)
4.2329 (0.3033) 0.0857 (0.0300) 0.0204 (0.0163) 0.9764 (0.2592) 1.4400 (0.3472) 0.5465 (0.1876)
0.1308 (0.1309) 0.0301 (0.0369) 0.0127 (0.0464) 0.6334 (0.4397) 0.3512 (0.3907) 24.9255 (23.5175)
4.3815
0.0893
0.0252
0.7167
1.5262
0.4377
0.4298
0.1239
0.0420
0.3913
1.8342
32.5179
20.83
2.97
4.50
53.89
3.04
22.41
124.66
43.28
1.59
10.66
159.73
3.51
0.000
0.056
0.014
0.000
0.053
0.000
0.000
0.000
0.212
0.000
0.000
0.034
N 40 18 42
Notes: Figures in Clusters columns represent Cluster Means, with Standard Deviations below in parentheses* = Most innovative-intense cluster.

96
Table 6.3.22: Cluster Analysis, 1986-89
Variables Cluster 1 Cluster 2* Cluster 3 Grand Mean F-Ratio P-value
Economic variables
Log Sales
Log Profit
Log Margin
Log Rotation
Log Capital Intensity
Log Gearing
Technological variables
Log no of Patents
Innovative intensity
Biotechnology
Food
Diversification
Experience
4.5655(0.2954)0.9664
(0.0217)0.0245
(0.0120)0.7144
(0.1571)1.7251
(0.3379)0.4233
(0.0995)
0.3772(0.2951)0.0522(0.585)0.0812
(0.2169)0.3298
(0.3431)1.2283
(1.0933)43.8515
(24.8921)
4.8925(0.3684)0.1011
(0.0295)0.0233
(0.0123)0.7263
(0.1117)1.8900
(0.3534)0.4997
(0.1127)
1.3561(0.3804)0.3261
(0.2065)0.0474
(0.0735)0.2188
(0.1803)6.4583
(2.4449)30.0083
(16.8095)
4.3891(0.2731)0.0742
(0.0258)0.0089
(0.0067)1.0181
(0.1931)1.6685
(0.3209)0.6184
(0.2156)
0.1934(0.2115)0.0316
(0.0504)0.0949
(0.2444)0.4564
(0.4212)0.6157
(0.8026)19.2908
(22.0280)
4.5609
0.0897
0.0188
0.8272
1.7336
0.5079
0.4872
0.0941
0.0777
0.3430
1.9492
32.5179
16.68
9.26
23.24
36.93
2.54
15.66
105.33
59.67
0.29
2.54
123.71
12.03
0.000
0.000
0.000
0.000
0.085
0.000
0.000
0.000
0.750
0.086
0.000
0.000
N 46 18 36
Notes: Figures in Clusters columns represent Cluster Means, with Standard Deviations below in parentheses* = Most innovative-intense cluster.
6.3.6.4 The Analysis of Variance
The results of a One-way ANOVA test indicate divergences in comparative profitabilityare statistically significant at under the 10% level among the three strategic groups ineach period (Table 6.3.23), with the sharpest differences being recorded in the final sub-period (1986-89). The results are robust to changes in the specification of the variable:similar results are obtained when we calculate the ANOVA for the logarithm of profits(Table 6.3.24).
Where are profit differences? A Tukey-Cramer test indicates that the mean groups differsignificantly (p < 0.005) in 1977-81 and 1982-85. In 1986-89, the least innovative groupdiffers significantly (p < 0.001) from the other two groups; though the latter two do notdo so by themselves. One-way ANOVA in Table 6.3.23, testing the null hypothesis thatcomparative profits (i.e. profits higher or lower than average in the sub-sector) are similarin all groups, clarifies this question: only the most innovative group obtains profits abovethe norm. Although, in absolute terms, the performance of the other group is rather good,profits are slightly below the average of the sub-sectors in which the firms in this groupcompete.

97
Table 6.3.23: ANOVA of Comparative Profitability* grouped by Cluster
Summary Statistics: Mean Std. Dev. Robust SD S.E.Mean Maximum Minimum Cases
A) 1977-81
Cluster 1** .018 .038 .008 .076 -.064 21
Cluster 2 -.014 .093 .019 .175 -.235 23
Cluster 3 -.002 .045 .008 .113 -.106 34
All .000 .062 .058 .007 .175 -.235 78
B) 1982-85
Cluster 1 -.009 .065 .011 .244 -.227 36
Cluster 2** .036 .055 .013 .128 -.082 18
Cluster 3 -.008 .084 .013 .303 -.216 41
All -.000 .074 .065 .008 .303 -.227 95
C) 1986-89
Cluster 1 -.003 .064 .010 .165 -.140 43
Cluster 2** .010 .087 .022 .210 -.130 16
Cluster 3 -.006 .071 .013 .107 -.249 30
All -.022 .077 .077 .008 .210 -.249 89* Net profit/own capital of the firm minus sub-sector average** Most innovative cluster
SOURCE SUM OF SQU-ARES
DF MEANSQUARE
F VALUE PROBABILITY
ANALYSIS OF VARIANCE:
1977-81++
CLUSTER 0.0125 2 0.0063 2.55 0.0880
ERROR 0.1268 52 0.0025
1982-85
CLUSTER 0.0296 2 0.0148 2.82 0.0650
ERROR 0.4835 92 0.0053
1986-89
CLUSTER 0.0907 2 0.0453 8.94 0.0003
ERROR 0.4358 86 0.0051
WELCH TEST*:
1977-81 2, 28 3.11 0.0601
1982-85 2, 52 4.27 0.0192
1986-89 2, 37 8.54 0.0009
BROWN-FORSYTHE TEST*:
1977-81 2, 29 2.33 0.1154
1982-85 2, 87 3.25 0.0434
1986-89 2, 44 7.69 0.0014
LEVENE TEST**:
1982-85 2, 92 1.47 0.2363
1986-89 2, 86 0.75 0.2363
++ With 15% trimming* For equality of means; variances not assumed to be equal** For equality of variances
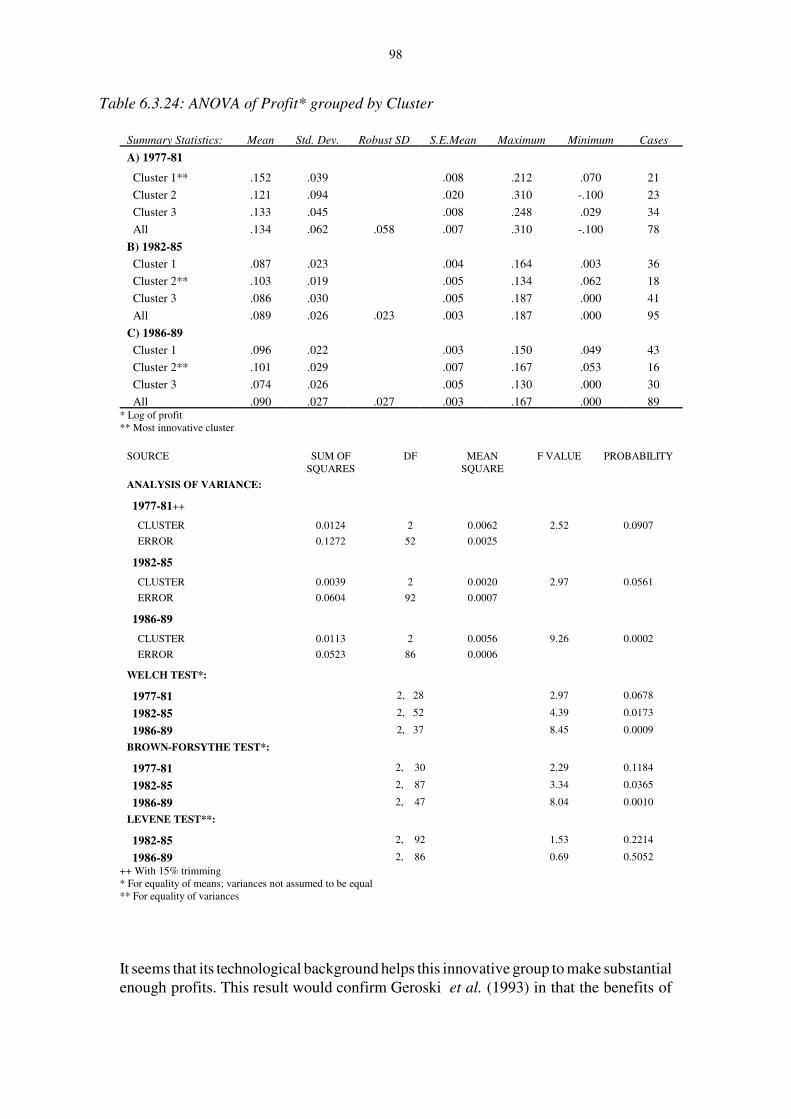
98
Table 6.3.24: ANOVA of Profit* grouped by Cluster
Summary Statistics: Mean Std. Dev. Robust SD S.E.Mean Maximum Minimum Cases
A) 1977-81
Cluster 1** .152 .039 .008 .212 .070 21
Cluster 2 .121 .094 .020 .310 -.100 23
Cluster 3 .133 .045 .008 .248 .029 34
All .134 .062 .058 .007 .310 -.100 78
B) 1982-85
Cluster 1 .087 .023 .004 .164 .003 36
Cluster 2** .103 .019 .005 .134 .062 18
Cluster 3 .086 .030 .005 .187 .000 41
All .089 .026 .023 .003 .187 .000 95
C) 1986-89
Cluster 1 .096 .022 .003 .150 .049 43
Cluster 2** .101 .029 .007 .167 .053 16
Cluster 3 .074 .026 .005 .130 .000 30
All .090 .027 .027 .003 .167 .000 89* Log of profit** Most innovative cluster
SOURCE SUM OFSQUARES
DF MEANSQUARE
F VALUE PROBABILITY
ANALYSIS OF VARIANCE:
1977-81++
CLUSTER 0.0124 2 0.0062 2.52 0.0907
ERROR 0.1272 52 0.0025
1982-85
CLUSTER 0.0039 2 0.0020 2.97 0.0561
ERROR 0.0604 92 0.0007
1986-89
CLUSTER 0.0113 2 0.0056 9.26 0.0002
ERROR 0.0523 86 0.0006
WELCH TEST*:
1977-81 2, 28 2.97 0.0678
1982-85 2, 52 4.39 0.0173
1986-89 2, 37 8.45 0.0009
BROWN-FORSYTHE TEST*:
1977-81 2, 30 2.29 0.1184
1982-85 2, 87 3.34 0.0365
1986-89 2, 47 8.04 0.0010
LEVENE TEST**:
1982-85 2, 92 1.53 0.2214
1986-89 2, 86 0.69 0.5052
++ With 15% trimming* For equality of means; variances not assumed to be equal** For equality of variances
It seems that its technological background helps this innovative group to make substantialenough profits. This result would confirm Geroski et al. (1993) in that the benefits of

99
innovation seem to be permanent. Failure to generate current technology, however,hampers this group’s potential for extraordinary gains. This half-way position regardingprofit concurs somewhat with both those who believe old technology generates a“dinosaur” syndrome (Dosi, 1990) and those who think technology has long-run positive,indirect effects (Geroski et al., 1993). This group actually performs better than that whichis both weakly innovative and technologically inexperienced (columns 1 and 3 of Table6.3.24).
The comparison of the two higher-profit groups (with only the most innovative of themachieving extraordinary gains) illustrates how firms use different types of resources anddivergent technological competencies to do well (columns 1 and 2 of Table 6.3.22). Themost innovative group probably produces standard products with important economiesof scale and low shares of labour in value-added. This interpretation is suggested by highlevel of rotation (which is facilitated by production of a few generic items), considerablecapital per worker and smaller margins (by comparison with the other group). The othergroup (column 1 of Table 6.3.22) is likely to produce speciality products necessitatingthe use of skilled labour. The range of products is probably wide, and thus routinizationof production is rather difficult; margins are substantial but the use of capital is lessefficient, probably owing to the nature of the business.
A cross-tabulation of the clusters against a variable indicating the home country of thefirm discloses that only 10%-12% of the European companies in our sample appear in themost innovative clusters. On the other hand, European firms are doing well, as wasshown in Section 6.3.4. This result, together with insignificant association betweeninnovativeness and profit, is rather enigmatic. A possible cause for good performance isthat large European firms balance their low levels of internal innovation with exceptionalabsorption of external innovation. Previous research suggests, in fact, that innovativenessof national food-processing industries, i.e. the ratio of the number of foreign patentsissued to firms at the two-digit industry level, their suppliers and public centres ofresearch to the value-added of each industry, is noteworthy in the EU. Moreover, thepositive effect of these spillovers of knowledge on the performance of large foodmanufacturing firms has been proved elsewhere (Rama, 1994).
On the other hand, the bulk of Japanese firms (50%-62%) compete with the lowestinnovative levels, the lowest profits and the highest gearing (although Ajinomoto andothers are highly innovative). These firms are well placed to attract external financebecause they are often part of large Japanese industrial-financial groups. Abundant loanshelp them to finance development and counterbalance moderate innovativeness as wellas technological inexperience. As indicated in Section 6.3.4, financial considerationshave been crucial in this industry. Yet this is probably a transitory strategy in theexpansion of Japanese food-processing firms. As seen in Sections 6.3.4 and 6.3.5, aportion of these firms is becoming highly innovative. The regression results suggested,moreover, that this strategy is a response to the low profits earned on the part of thesefirms.
The bulk of firms in innovative, highly profitable clusters is made up of: the world’slargest firms (Nestlé and Unilever), the largest producers of soft-drinks (Coca-Cola andPepsico) and the largest US grain-processors (Ralston Purina, Quaker Oats, etc.). After

100
1982, however, a number of the latter firms have shifted to other types of strategy.Coversely, after this date, some large conglomerates (RJR Nabisco, Philip Morris, etc.)have adopted this model to operate in the food-manufacturing market.
6.3.6.5 Conclusions from Hypothesis Testing
The empirical tests supported our hypotheses to some extent. Paths to profitability arecertainly influenced by country factors. In addition, the association of innovativeness andprofit varies according to differences in home countries. While the association inclinesto be positive in European firms, it is negative in firms based in new source countries.The latter try to balance their expected low profits with increases in innovativeness. InUS firms, the relationship changes throughout the period, tending to be negative whenhigh profits are anticipated.
Even if we identified several strategic groups within this industry, we proved only partof our hypothesis regarding different profit-maximizing strategies. Although it is true thattwo of these groups achieved similar absolute profit rates with divergent levels ofinnovativeness, only the most innovative made profits above the norm. The other groupis not a good example of low innovativeness: as it is an important early patentor, its goodperformance could be, in part, a result of earlier experience even though firms in thisgroup are unable to produce current technology to similar extents. Weakly innovative andtechnologically inexperienced groups are actually the least profitable.
6.3.7 Conclusions
1. In terms of the number of patents, innovation tends to be produced by giant, highlyprofitable firms with earnings above the norm. This implies that national food-processingindustries formed by these types of enterprises - rather than by smaller, less successfulconcerns - are likely to lead world R&D in this field, to signal the direction oftechnological search and to have substantial influence upon the technical interfacebetween this industry and its suppliers. This is an important consideration for homecountries where firms are lesser patentors, because followers are likely to imitateinnovation produced in the world’s leading centres for food-processing technology; thistechnology, however, risks being less adaptable to conditions in their home countries interms of natural resources and so on. This strategy therefore risks causing increases inimports of agricultural products, equipment, etc., and hence minimizing the beneficialeffects of food processors’ demand on the rest of the national food-chain. In this industry,there is some indication that US firms producing highly-processed food could play asignificant role as technological leaders.
2. Heavy patentors tend to be profitable firms but the reverse is not always true. Thisresult suggests that innovativeness is not the sole path to profit in food processing and/orthat some profitable firms incorporate technology via purchases of new machinery orimitation of other firms rather than by patenting of innovations. Another possibility is thatsome of these successful firms prefer to finance R&D in specialized enterprises ratherthan to conduct in-house R&D. A number of European firms seem to display relatively

101
low patenting activity in spite of their good performances. One possible interpretation isthat these firms patent most of their inventions in Europe exclusively. As our data reflectpatenting in the US, one could draw the erroneous conclusion that European firms areweakly innovative vis-à-vis US firms. A second, not exclusive hypothesis, is thatEuropean firms chiefly incorporate new technology by methods other than the patentingof inventions. Two facts would support these explanations. First, European firms haveshown rapid growth of their fixed assets and capital per worker over the period analysedin this Section. Second, previous research suggests that a number of European food-processing industries are innovation-intensive, a situation positively influencing profitin large firms (Rama, 1994). These findings suggest that learning from spilloversoriginating in other firms and in research centres could be a significant source oftechnological progress in this industry in Europe.
On the other hand, the mix of different types of R&D - privately and publicly funded -should also be investigated in this industry. It may well be that European firms rely muchmore on publicly financed R&D than do firms based in other countries. If thisexplanation is correct, in European firms, low patenting of inventions would be balancedby adoption of new technology produced by public sources. This situation wouldimplicitly pose the question of which of the two types of R&D funding is the moreeffective in generating productivity growth (Griliches, 1986) and profitability at the firmlevel.
The pattern of adoption of technology and its links with economic performance at thefirm level are relevant to the selection of effective technological policies. If Europeanprocessors relied chiefly on the adoption of new equipment, for instance, then incentivesto innovation among suppliers and credit at low interest rates for purchases of capitalgoods would probably be especially desirable actions.
3. Innovative intensity, i.e. the number of patents per unit of sales, is not significantlyrelated to firm size but is related to the home country and to sub-sectors in which the firmis based. Beyond a certain threshold, size is not likely to affect innovativeness. As thispart of the study focuses on very large firms, such a threshold is largely surpassed byfirms in our sample.
4. At first sight, innovativeness and profitability are unrelated in this industry. Thisfinding, however, conceals within-industry differences. The impact of innovativeness onprofit varies depending on the home-country in which the firm is based and on the phaseof the business cycle. In a number of firms, especially those based in the US or in Othercountries, changes in innovativeness are apparently a consequence of foreseendisadvantages vis-à-vis competitors or of different phases of the business cycle.
On the contrary, the association of both variables has a positive but statisticallyinsignificant sign in European firms. If the cause were that they use, as it seems, methodsother than the patenting of innovations to incorporate technological progress, then itwould be difficult to stimulate increases in innovativeness in these firms. If thisinterpretation were correct, links between innovation and profitability - links which area powerful engine of technological progress in other countries - would be tenuous inEuropean food-processing firms. European manufacturers would not be likely to view a

102
clear cause-effect relationship between their own innovative efforts and the profitabilityof their firms. This perception would render technological policies less effective.
5. Firms in divergent strategic groups within this industry compete with distinctivetechnological features associated, in turn, with different patterns of use of resources andrates of profit. The highest levels of innovativeness are associated with significantdiversification into non-food technological fields. Diversification may be crucial tocontrol the supply of upstream technology, enjoy independence from suppliers andproduce (or co-operate in the production of) customized equipment, packaging materialsor chemical additives. Conversely, the least innovative firms specialize in foodtechnology (and, to some extent, in biotechnology). The latter seems the commonestpattern in European firms.
6. These technological competencies, as mentioned previously, are associated withdifferent financial strategies and levels of profit. The most innovative firms persistentlyshow the highest levels of profitability and least risk throughout critical phases of thebusiness cycle. More importantly, they are the only ones to make profits above the normcontinuously from 1977 to 1989.
On the contrary, the least innovative persistently display the lowest rates of profit. Theyare able, however, to use their capital efficiently. High rates of rotation of capital areprobably connected to their producing a small range of standardized products. Some ofthese firms are also able to secure a great volume of external funding because they areprotected by large industrial-financial groups providing them with low-cost loans, suchas some Japanese and probably some French industrial-financial groups.
7. In some cases, strategic groups converge towards similar levels of profitability withdifferent strategies and divergent innovative intensities. Only the most innovative,however, continuously attain extraordinary gains. Different rationalities of profitabilitymay lead to similar profits but some paths seem better than others.
8. Technological experience matters because it helps to transform the firm internally, andhence achieve good performance. Technological experience, however, is insufficient topromote extraordinary earnings if it is not associated with current innovativeness.
9. This research suggests an interest in further investigating forms of incorporation oftechnology other than by the patenting of inventions. Analysis of spillovers and contractR&D would be useful to understand patterns of technological change in food-processingmore adequately. This is especially valid for European firms. We study the “innovationsystems” in the next Chapter.

103
Appendix 6.1: Firms Included in the Sample
Name of Firm HomeCountry
* Name of Firm HomeCountry
*
1. AGWAY INC.2. AJINOMOTO CO. INC.3. ALLIED LYONS4. AMATIL LTD5. AMERICAN BRANDS INC.6. ANHEUSER BUSCH CO. INC.7. ARCHER DANIELS MIDLAND CO.8. ARLA9. ASSOCIATED BRITISH FOODS PLC10.BARLOW RAND LTD11.BASS PLC12.BEATRICE CO. INC.13.BESNIER S.A.14.BOND CORP. HOLDINGS LTD.15.BONGRAIN S.A.16.BOOKER17.BORDEN INC.18.BSN GROUP19.C.P.C. INTERNATIONAL20.CADBURY SCHWEPPES PLC21.CAMPBELL SOUP CO.22.CANADA PACKERS INC.23.CARGILL INC.24.CARLSBERG A/S25.CASTLE & COOKE INC.26.CIE FINANCIERE SUCRES ET DENREES27.COBERCO28.COCA COLA CO.29.CON AGRA INC30.DALGETY PLC31.DEAN FOODS CO.32.DMV CAMPINA33.ELDERS IXL LTD.34.FERRERO SPA35.GENERAL MILLS INC.36.GEO HORMEL & CO.37.GEORGE WESTON LTD.38.GOLD KIST INC.39.GRAND METROPOLITAN PLC40.GUINNESS PLC41.GUYOMARC’H S.A.42.H.J. HEINZ COMPANY43.HANSON PLC44.HEINEKEN N.V.45.HERSHEY FOODS CORP.46.HILLSDOWN HOLDINGS PLC47.HOUSE FOOD INDUSTRIAL CO. LTD.48.IMASCO LTD.
USJapanUKAustraliaUSUSUSSwedenUKS. AfricaUKUSAFranceAustraliaFranceUKUSFranceUSUKUSCanadaUSDenmarkUSFranceNeth’ldsUSUSUKUSNeth’ldsAustraliaItalyUSUSCanadaUSUKUKFranceUSUKNeth’ldsUSUKJapanCanada
123223222212222122122113212312221211213312232122
52.JOHN LABATT53.KELLOGG CO.54.KIRIN BREWERY CO LTD.55.KONINKLIJKE WESSANEN N.V.56.LAND O’LAKES INC.57.LVMH MOET HENNESSY/LOUIS VUITTON58.MC CORMICK & CO. LTD.59.MD FOODS AMBA60.MEIJI SEIKA KAISHA61.MELKUNIE HOLLAND62.MOLSON COMPANIES LTD.63.MORINAGA MILK INDUSTRY64.NESTLE65.NICHIREI CORP.66.NICHIRO GYOGYO KAISHA67.NIPPON MEAT PACKERS INC.68.NIPPON SUISAN KAISHA LTD.69.NISSHIN FLOUR MILLING GO.LTD70.NORTHERN FOODS PLC.71.PEPSICO INC.72.PERNOD RICARD73.PHILIP MORRIS COMPANIES INC.74.PILLSBURY CO.75.PROCTER & GAMBLE CO.76.PROVENDOR GROUP77.QUAKER OATS COMPANY78.RALSTON PURINA CO.79.RANK HOVIS MC DOUGALL PLC.80.RJR NABISCO INC.81.S & W BERISFORD LTD.82.SAPPORO BREWERIES LTD.83.SARA LEE CORPORATION84.SCOTTISH & NEWCASTLE BREWERIES PLC.85.SEAGRAM CO. LTD86.SNOW BRAND MILK PRODUCTS CO.87.SODIMA88.SOURCE PERRIER89.SUNTORY LTD90.TAIYO FISHERY CO. LTD.91.TATE & LYLE PLC92.TYSON FOODS INC.93.UNIGATE PLC94.UNILEVER95.UNION INTERNATIONAL PLC96.UNION LAITIERE NORMANDE97.UNITED BISCUITS98.UNITED BRANDS CO.99.WHITBREAD & CO. PLC
CanadaUSJapanNeth’ldsUSFranceUSDenmarkJapanNeth’ldsCanadaJapanSwitz’ldJapanJapanJapanJapanJapanUKUSFranceUSUSUSSwedenUSUSUKUSUSJapanUSUKCanadaJapanFranceFranceJapanJapanUKUSUKNeth./UKUKFranceUKUSUK
313223222232221111233222212122323322331112212212
* Industry: definitions are in Table 6.3.2.
104
7. Inter-firm and national systems of innovation
7.1 User-producer interactions
As explained above in Chapter 5 and in Section 6.2, the food and beverages industry may be
particularly focused on market possibilities and the needs of end-users (despite being so often
classified as a supplier-dominated industry in the sense of Pavitt’s taxonomy). Therefore, we
investigate the degree to which market factors are important to this industry as an inspiration to
innovations.
Chapter 3 provided the theoretical hypotheses underlying the assumption that user-producer
interactions have an impact on the speed and direction of the innovation process, through more
intense interaction between users and producers helping producers to identify the needs of users.
Proximity in terms such as culture, geography, or common language, facilitates an articulation
and understanding of those needs which may in turn become an input to the innovation process.
It is important to stress that in practice the producers do not usually interact with the end-users
directly. As in all other manufacturing there is a link in-between, most often consisting of a
wholesale firm and/or retail firm before the products reach the final users. Attention should also
be paid to the duality in the term “user”. A firm in this industry may be a user of raw materials
from the agricultural and fishing industry but at the same time a producer of the final food
products to be consumed by final users.
Some of the CIS data does address user-producer interaction. This is the case for example of the
sources of information for innovation activity, where the role of customers, suppliers etc. are
assessed. Also the exchange of technology in terms of firms purchasing or selling various forms
of technology may be taken as an indirect yardstick of the qualitative aspect of user-producer
interaction. We shall return to this measure later.
In Tables 7.1.1 and 7.1.2 results are shown with respect to those of the variables relevant for
user-producer interaction in the light of the former question about the importance of different
information sources for innovation activity. The tables show mean high scores for the groups,
i.e. the share of firms who assess “clients or customers” (for example) as either crucial or very
significant as a source of information for innovation in relation to total responses to that question.
Market factors are generally more important than technology factors. Thus, clients or customers
come out as the most important source of information for innovation, with suppliers of materials
and components and suppliers of equipment as second and third respectively. Except for
“conferences, meetings and journals”, the technology factors

105
Table 7.1.1: Selected external sources of innovation assessed as very important or crucial, by
country
A: Market factors
Country Ranking Clients or
Customers
Suppliers of
materials or
components
Suppliers of
equipment
Competitors Fairs and
exhibitions
Belgium Total 57 36 45 19 36
Leaders 50 46 55 9* 45
Laggards 55 23 41 27 14*
Denmark Total 67 39 35 28 35
Leaders 60 47 40 20* 13*
Laggards 67 47 40 40 67
Germany Total 76 55 56 57 60
Leaders 75 54 57 54 71
Laggards 70 56 56 59 52
Ireland Total 78 49 42 44 46
Leaders 88 42 33 42 55
Laggards 79 55 55 46 42
Italy Total 37# 28 37 20 28
Leaders 38# 31 36 21 29
Laggards 35# 26 37 17 30
Netherlands Total 70 45 44 23 32
Leaders 65 44 38 21 40
Laggards 71 44 48 29 19
Norway Total 54 48 44 12 32
Leaders 46 58 58 15 35
Laggards 59 41 29 12* 18*
Spain Total 58# 7# 61# 78# 53
Leaders 58# 9*# 73# 79# 52
Laggards 59# 9*# 50# 72# 47
Notes: Calculated from CIS data
All figures represent percentages of firms assessing as very important or crucial
# Only partly comparable
* Less reliable data because of low number of observations

106
Table 7.1.2: Selected external sources of innovation assessed as very important or crucial, by
country
B: Technology factors
Country Ranking Conferences,
meetings,
journals
Technical
institutes
Universities
and higher
education
Government
laboratories
Belgium Total 30 13 12 **
Leaders 32 ** ** **
Laggards 27 ** ** **
Denmark Total 35 15 ** **
Leaders 33 20* ** **
Laggards 53 20* ** **
Germany Total 67 8 27 11
Leaders 71 11 29 14
Laggards 59 4* 19 4*
Ireland Total 31 15 13 10
Leaders 36 18 15 12
Laggards 24 18 9* 9*
Italy Total 13 3 2 3
Leaders 14 3 1* 3
Laggards 16 2* 3 4
Netherlands Total 31 ** 9 5
Leaders 33 ** 6* 4*
Laggards 27 ** 8 8
Norway Total 44 25* 5* 12
Leaders 50 27 ** **
Laggards 53 35 ** **
Spain Total 19# 24# 17 13
Leaders 18# 27# 24 12
Laggards 9*# 16# 6* 6*
Notes: Calculated from CIS data
All figures represent percentages of firms assessing as very important or crucial
# Only partly comparable
* Less reliable data because of low number of observations
** Non-meaningful data because of low number of observations

107
have little importance as a source of information to the innovation process in most countries, for
both leaders and laggards. This does not mean that technological institutes, for instance, have no
importance for the innovation process. They are not the spark setting off the process, but they
may be important in carrying the process through.
There is no clear conclusion that emerges about the sources used by leaders relative to laggards.
The only obvious difference identified is that leaders tend to use more sources of information
than laggards. This result is based on an analysis of all the 13 sources listed in the questionnaire
as opposed to the 9 reported in the tables.
Across countries we find differences both in how many firms use each single source of
information and in how many firms attach great importance to a broad variety of sources. Thus,
we see that German enterprises both assess more sources as important than in other countries and
also assess the sources as important by more firms than in other countries. The same goes for
Irish and Spanish firms, although not to same extent. More specifically “clients or customers”
are particularly important to German and Irish food and beverages firms. The Italian firms within
this industry assess this source of information as of very low importance. Suppliers are important
to firms in Germany, the Netherlands, Norway and Ireland, but not to Italian firms. Scientific
inputs from universities and higher education institutions, government laboratories and technical
institutes are relatively important to firms in Germany, Ireland and Spain, but - again -
particularly low in Italy. The latter finding corresponds with that of Malerba (1993), who finds
that public research played a very weak role in innovation in Italy, and also corresponds with
findings in the PACE study.
Large firms tend to use more sources than do other firms. This is however for obvious reasons:
a large firm is more likely to have introduced several innovations and it is likely that different
products or processes require different information sources. It then follows naturally that the
more innovations are introduced, the more sources they tend to use.
The other group of indicators of user-producer interaction mentioned above is acquisition and
transfer of different types of technology, regionally distributed. The questionnaire asks whether
the firms are engaged in various types of sale and purchase or not, rather than undertaking
quantification of these transfers. Results are set out in Tables 7.1.3 and 7.1.4.
In general it seems as if geography matters in terms of where food-processing firms buy their
technology. National purchases are by far the most frequent, followed by acquisition from other
EU countries. US and Japanese sources are not used by many firms in spite of their advanced
technologies. Small and generally technologically less advanced countries, like Denmark and
Ireland, are low in national acquisitions and high in EU acquisitions. On the other hand this is
not the case for Norway, though it is not an EU member. Nevertheless, the size of the economy
seems to be an indication of whether acquisitions take place mainly nationally or from the rest
of the EU or other regions. For example, in Germany and Italy, the share of firms who purchase
technology nationally is more than double that of firms who acquire from the EU. Conclusions
from the literature on globalization resemble those above: the size of the national economy
matters for the geography of technology acquisition.
Table 7.1.3: Regional sources for the purchase of technology (percentages)

108
Country National
source
Other EU
country
Non-EU
European
USA Japan Other source
Belgium 81 72 21 7 4 1
Denmark 67 59 30 11 4 2
Germany 96 41 8 7 2 4
Ireland 65 71 10 14 7 3
Italy 95 33 5 4 2 2
Netherlands 83 44 9 10 1 1
Norway 93 51 na na na na
Table 7.1.4: Regional sources for the sale of technology (percentages)
Country National
source
Other EU
country
Non-EU
European
USA Japan Other
source
Belgium 51 82 57 12 30 24
Denmark 54 39 57 11 7 22
Germany 92 24 13 2 0 7
Ireland 35 29 2 21 0 14
Italy 82 32 20 9 3 7
Netherlands 59 52 43 14 4 20
Norway 98 19 na na na na
With regard to the regions to which firms sell technology, the home country is still the most
important but - as could be expected - not so frequently as for technology purchases. At first sight
it might seem strange that so many more firms buy technology domestically compared to those
selling technology. A national acquisition must also result in national sales. But the tables count
only the number of firms selling or buying technology, not the number of transactions. Therefore,
part of the explanation may be one firm selling to several other firms. Another explanation is that
firms may buy technology from the public sector, e.g. technological institutes, or may buy
technology (e.g. consultancy services) from outside the manufacturing sector. When it comes to
the more distant markets it shows that firms are more prone to sell to non-EU European markets
and other areas rather than to North America and Japan.
Large firms are generally more active in both types of technology transfer and the difference
relative to smaller firms becomes greater the more distant the country of origin or destination.
There are no patterns in differences between leaders and laggards in either purchases or sales.
In essence, national sales and acquisitions are more important than other sources. This may
indicate some importance of proximity between users and producers but also that the nation state
may have some importance for firms in this sector. This is the issue we now turn to.
7.2 National innovation systems

109
Amongst both theorists and policy-makers, the concept of the national innovation system is used
increasingly frequently. The importance of the elements in a national innovation system (NIS)
and the interplay between these elements are now widely recognised. But the concept is still
relatively new and calls for further research and practical use.
One definition of a national innovation system claims that it is
“... constituted by elements and relationships which interact in the production, diffusion
and use of new, and economically useful, knowledge and that a national system
encompasses elements and relationships, either located within or rooted inside the
borders of a nation state.” (Lundvall, 1992, p 2)
It is furthermore argued that the nation state has two dimensions - the social-cultural and the
étatist-political. It is not necessarily the case that these two dimensions coincide. A nation may
thus be defined by its individual cultural, ethnic and linguistic characteristics, but nations, as they
are generally perceived, differ in their degree of cultural homogeneity.
The public elements in a system include cultural and social conditions, the financial system, the
education system, technological infrastructure and government policies for promoting
innovations. Private elements include the way firms organize innovation internally and their
interaction with other firms or the technological infrastructure to acquire external information
supporting or initiating the innovation process.
The links between elements of the system may be vital for determining how much innovation the
firms can undertake. A further reason for this is closely related to why user-producer interaction
is better promoted when a certain proximity is present: individuals find it easier to communicate
with people with whom they share culture, language and history. These dimensions often
coincide with national borders, although the European countries are somewhat diverse in this
respect. But what further enhances the importance of nation states is the legislative and political
regulatory systems which are primarily national. In addition, the structure of demand is often to
some extent a result of the historical evolution of both production and broader societal
conditions, as we indicate below.
The notion of a national innovation system is not directly addressed in the CIS. Indirect
indicators include the importance of institutions in barriers to innovation and in information
sources. The latter gave little importance to the supply-side factors in dictating sources -
Germany, Ireland and Spain more than others and Italy much less than others. We also saw (in
Tables 7.1.3 and 7.1.4) that proximity matters in respect of acquisitions and sales of technology.
In the PACE study respondents were asked to list the region of origin of the sources of
information for innovation. The results from this study further enhance our claim that national
innovation systems are of importance, both in general and to the food and beverages industry in
particular. Specifically the PACE study shows that there are national differences in the
importance of domestic versus foreign sources of information, independently of national
differences in industry structure. It is also found that there is a marked effect of cultural distance
in the use of information sources for innovation. For example, the general picture is that sources

110
from other European countries are the most important ones, followed by North America and
finally Japan. But sources from North America are of greater importance to the UK firms than
sources from other countries in Europe, which could be explained by the small cultural distance
between the UK and North America as compared to the equivalent distance between the UK and
the rest of Europe.
One view of the relative importance of national innovation systems for different industries claims
that science-based industries are less dependent on the national innovation system compared to
less science-based industries like the food and beverages industry. The PACE study largely
confirms this view. Out of 16 investigated industries, firms in the food-processing industry come
third in attaching greatest importance to domestic information sources. Public research is
assessed as being very important compared to other industries. Across countries the PACE study
confirms the findings in the present study: German respondents attach great importance to
national sources related to technological infrastructure (technical institutes, universities and
higher education institutions and government laboratories) as opposed to Italian firms
(especially).
7.2.1 National Patterns in Patenting
Further evidence on regional and national tendencies to innovate may be derived from the
patenting patterns. The relevant data are all taken from the numbers of patents granted at the US
Patent Office (USPO) between 1969 and 1994. These data are nowadays available on CD-ROM,
but working the data from CD-ROM into usable results still involves intensive effort (such as has
been required for the company-level data used elsewhere in this Report). However, detailed
analysis of these figures in certain respects has recently become more practicable with the
development of software by Pari Patel of SPRU.
The results of this section are based on country aggregations, as defined by the USPO and
narrowed further by the Patel format. Over the period 1969/94 there were nearly two million
patents granted by this Office, almost 60% of which specified the USA itself as the country of
invention (see Table 7.2.1). The remaining 40% or so were distributed around other countries of
the globe in terms of their country of origin. The basic nature of the data should be stressed from
the outset: that what is being referred to is the source country of the patent, not necessarily the
country of origin of the company carrying out the patenting. For example, patenting from France
may stem from French companies, but may also be from US or Italian companies which
happened to carry out patentable activities in France. Conversely, patents from French companies
may come from France (the majority seem to), but may also come from foreign activities of
French companies, in which case they would be listed under the foreign country.
Table 7.2.1: Numbers of patents, by technological field
Region/ Country Abbrev. Patents1969/94
Share%*
Growth %1969/73-1990/4
Food Patents1969/94
Growth %1969/73-1990/4
All Countries ALL 1953497 100.00 35.07 23022 8.37
Western Europe WE 419814 21.49 26.46 5019 65.09
Eastern Europe EE 12543 0.64 -54.42 111 -20.83

111
USA USA 1164474 59.61 1.39 14905 -15.77
Other New World ONW 44905 2.30 74.90 718 68.81
Latin America LA 1870 0.10 30.70 57 60.00
Japan JP 285602 14.62 466.92 1888 179.69
East Asia EA 12153 0.62 49977.78 122 4050.00
Other Regions OT 12136 0.62 148.83 202 21.43
Belgium BE 7299 1.74 22.13 85 -8.00
Switzerland CH 32547 7.75 0.46 544 148.94
Germany DE 162938 38.81 40.39 1346 44.33
Denmark DK 4300 1.02 23.88 129 26.09
Spain ES 2412 0.57 112.46 85 450.00
Finland FI 5655 1.35 436.72 60 625.00
France FR 61656 14.69 44.28 648 65.22
UK GB 69172 16.48 -19.77 935 29.41
Greece GR 240 0.06 -3.64 2 -
Ireland IE 776 0.18 167.00 21 500.00
Italy IT 23398 5.57 80.85 412 213.16
Netherlands NL 19138 4.56 41.11 426 79.37
Norway NO 2475 0.59 48.70 32 -30.00
Austria OE 7555 1.80 51.27 68 40.00
Portugal PT 116 0.03 -4.00 4 200.00
Sweden SE 20137 4.80 -6.30 224 2.50
Notes: * Share of All Countries for Regions; share of Western Europe totals for Countries.Food patents comprise Food (including sugars), Food and beverage apparatus, and Tobacco.
WE includes only the larger countries of Western Europe (as detailed in the lower panel); EE excludesEast Germany; ONW is Canada, Australia and New Zealand; LA is Brazil and Mexico only; EA isSouth Korea and Taiwan only.
A further problem is that, for USPO data, the USA itself is the “home country”. According to the
figures in Table 7.2.1, total patents from US sources have scarcely changed between the initial
quinquennium, 1969/73, and the final one, 1990/4; while the overall totals have risen by more
than one-third. Thus the US share in patenting in the USA has dropped. However this does not
necessarily signify declining competitiveness (in terms of patents granted) for the USA. The
expansion of other countries in their patents and patent shares in US patenting has come about
partly because of growing internationalization, implying that firms of foreign countries have
become more concerned with patenting in the USA, and no doubt in other countries apart from
their own as well. How much of the US relative decline is simply this “home country” effect
cannot be estimated from these data alone. For more recent times, comparisons can be drawn
with patenting at the European Patent Office (EPO), but this too is not undertaken here. For the
EPO, of course, the converse situation would apply regarding European companies.
With such limitations in mind, we can nevertheless draw certain inferences about the country
orientation of patenting. Table 7.2.1, and the remaining tables of this section, list global regions,
and also list separately the major countries of Western Europe. In most of the subsequent tables,
abbreviations will be used for the regions or countries; these are given in the second column of
112
this Table. The first two data columns give totals of patents from each of these sources for the
whole period and the associated share (share in Western European total for the specific
countries). The next column gives the simple percentage growth for all patents of the
country/region between the first quinquennium and the final one. The last two columns treat
“food” patents alone, here defined as the sum of food proper, food and beverage apparatus, and
tobacco.
East Asia (South Korea and Taiwan) shows enormous growth in percentage terms, partly because
of the very small initial base. Japan also shows high rates of growth, and over the period as a
whole received about two-thirds of the numbers of patents granted to Western Europe in total.
Eastern Europe shows an absolute as well as relative decline, of considerable proportions - this
decline actually began in the 1980s before the end of communism, though it has accelerated to
date in the post-communist period. Other regions show a degree of “catching up”, at least as
measured through the growth percentage. A similar “catching up” process is partly evident in
Europe, as shown by the figures for Finland, Spain, Ireland and Italy, both for all patents and for
food patents; although some countries like Portugal and Greece still appear to be excluded in
terms of patenting.
Table 7.2.2 breaks down the column of All Patents in Table 7.2.1 (i.e. first data column), as
percentages by technological field. The columns of fields defined towards the left-hand side of
the Table are regarded as food or food-related, though to lesser degrees as one moves rightwards.
The columns towards the right are regarded as having some possible links with food processing,
though they might be of quite small magnitude relative to all their foci. At the regional level, the
shares of food and food equipment patents appear to be strongly correlated with land availability
- the land-abundant countries of Latin America and the New World contrasting with the land-
scarce countries of East Asia, including Japan. Within Western Europe, there seems to be a
different factor operating, in which countries with considerable histories of machine-based food
production (Denmark, Ireland, Netherlands, etc.) feature among those with relatively high shares.
These two factors might well be linked at the regional level, as for instance via the argument of
Hayami and Ruttan (1971), that land-abundant countries adopt machine-intensive methods of
land cultivation, which indeed seems borne out by the column relating to agricultural machinery.
However for tobacco there seems to be surprisingly little link between growing the raw produce
and patenting ways of processing it (see the third column of the Table). Climate appears to have
some impact on the patenting of refrigeration equipment and procedures.

113
Table 7.2.2: Percentage of patents by technological field, 1969/94
Field: Food FoodEqpt
Tob-acco
AgricMachy
Refrig Bio-tech
Chems Drugs Mater Elect Instrts Other
ALL 74 26 17 65 35 105 1871 272 408 1557 1374 4195
WE 65 29 26 55 18 95 2216 419 402 1169 1177 4330
EE 65 27 5 50 17 147 2364 521 314 622 1570 4299
USA 84 27 17 78 39 104 1854 232 378 1485 1323 4377
ONW 97 44 18 187 40 107 1452 217 371 1026 1133 5307
LA 171 123 11 118 37 64 1759 348 652 642 850 5225
JP 49 12 5 11 39 119 1549 222 559 2541 1883 3010
EA 17 61 22 9 72 25 653 55 184 2186 1749 4967
OT 82 59 26 68 43 174 1626 370 279 913 1466 4895
BE 79 32 5 136 12 141 2683 510 836 1600 743 3224
CH 112 27 29 96 14 94 2870 532 269 749 1320 3888
DE 38 20 24 36 14 80 2495 333 412 995 1194 4358
DK 200 84 16 47 126 333 1719 670 426 735 1063 4584
ES 133 95 25 37 21 95 1542 655 294 522 854 5626
FI 90 16 0 48 2 126 1533 129 302 2874 852 4028
FR 60 30 15 55 14 94 1899 499 372 1569 1143 4250
GB 73 17 46 38 14 95 1952 554 452 1339 1253 4167
GR 0 0 83 42 42 83 2500 292 708 1208 792 4250
IE 142 64 64 90 26 116 1637 438 219 1456 1327 4420
IT 52 74 50 41 32 114 2237 605 387 1138 815 4456
NL 155 52 15 167 21 101 2175 197 406 2335 1060 3314
NO 89 36 4 109 28 137 1240 214 331 792 764 6255
OE 48 40 3 95 19 98 1436 214 426 690 1067 5865
PT 86 86 0 172 0 345 2845 431 172 517 862 4483
SE 74 26 11 55 51 118 1227 213 315 923 1186 5802
Note: All figures are percentages of Regional or National totals.Key: Fields: Food Eqpt = Food and Beverage Apparatus;
Agric Machy = Agricultural Machinery;Refrig = Refrigeration;Biotech = Bioengineering;Chems = Chemicals;Drugs = Pharmaceuticals;Mater = Materials (principally glass and plastics, also superconductors);Elect = Electronics;Instrts = Instruments;Other (includes other machinery, metals, paper and print, textiles, vehicles, construction).Regions / Countries: see Table 7.2.1.

114
The other side of the Hayami-Ruttan argument is that land-deficient countries should focus more
on biological and chemical means of solving agricultural problems. This gets only very limited
support from the Table, probably because food-related aspects are only a minority of the
activities encompassed by these fields. The main factor that seems to account for strength in areas
like biotechnology and pharmaceuticals, at least in looking at patenting by European countries,
would seem to be the science base. However it was implied in Chapter 5 of this Report that
Japanese food companies have shown rapid increases in the proportions of their patenting from
biotechnology and drugs, and to that extent the Hayami-Ruttan argument could be re-established.
Where Japan and East Asia score highly, according to the present table, is in the somewhat
predictable areas of electronics and instrumentation. Western Europe is rather low in these fields.
The next table, Table 7.2.3, shows the change in terms of percentage points between the first sub-
period, here 1969/74, and the final one, which remains as 1990/4. The absolute values of course
influence the extent of change, so to compare columns one might also relate these percentage
point differences to differing means, as in the preceding table. Most regions see a decline in the
food and food-related areas (first three data columns), but Western Europe shows some increase.
All areas except Japan show a rise in the share of biotechnology (in Japan and East Asia it is
being overshadowed by the very rapid growth of total patenting), and a rise in pharmaceuticals
that is generally about twice as large, while other chemicals are relatively shrinking. The regional
specificity of the growth of electronics is evident, and corresponds generally with the pattern of
growth of instruments. Within Western Europe, the growth of biotechnology appears to be fairly
well distributed across countries, though some of the disadvantaged countries like Greece or
Portugal seem to be slipping back in some of the high-tech areas. Food patents have grown
rapidly in Switzerland, the Netherlands and Sweden, as shown in Figure 7.1.
Table 7.2.4 gives the shares in patenting in each of the fields displayed.. The USA shares are
influenced by the “home country” factor described above. Its shares are highest for the categories
of agricultural machinery, refrigeration and food, which supports the view of the US as still a
resource-based economy (Wright, 1990). The percentages are of course affected by the levels of
aggregation, which are here much more detailed in such fields as compared with chemicals,
electronics, etc. For Western Europe, the highest shares are for drugs and tobacco; while the
lowest shares apart from refrigeration go to electronics, agricultural machinery, instruments, food
and biotechnology. Considerable variability is evident across particular European countries. This
is also the case for food patents as displayed in Figure 7.2. The same figure illuminates an
argument that we put forward earlier: the CIS data are not covering all the major players in food
and beverages. The UK, France, and Switzerland especially, also Sweden, are among the
countries most active in food patenting, but they are not adequately represented in the CIS data.

115
Figure 7.1: Change in Food patent shares for Western European major players, 1969/74
to1990/94,%
Figure 7.2: Share of Food patents for Western European major players, 1969/74
to1990/94,%

116
Table 7.2.3: Change in Patent Shares, by Technological Field, 1969/74 to 1990/4, %
Field: Food FoodEqpt
Tob-acco
AgricMachy
Refrig Bio-tech
Chems
Drugs Mater Elect Instrts Other
ALL -0.11 -0.10 -0.04 -0.44 0.06 1.13 -3.99 2.60 0.69 5.83 3.24 -8.89
WE 0.25 0.01 0.02 -0.13 -0.02 1.09 -2.68 4.42 0.51 1.05 1.34 -5.86
EE 0.55 -0.13 0.24 0.17 0.23 1.70 2.15 12.98 -0.51 -2.69 1.81 -16.49
USA -0.08 -0.11 -0.03 -0.47 0.06 1.45 -3.01 2.56 0.32 3.51 2.90 -7.10
ONW 0.03 -0.03 0.00 -0.42 0.24 1.53 -4.24 2.35 0.73 0.39 3.49 -4.06
LA -0.16 1.08 0.00 -0.30 1.12 0.88 -9.96 -0.01 0.78 -1.39 -1.89 9.85
JP -0.43 -0.05 -0.05 0.03 0.15 -0.63 -7.97 1.20 1.15 11.75 1.72 -6.87
EA 0.16 0.55 -7.79 0.09 0.74 0.28 -5.33 0.57 -2.07 5.78 10.13 -3.10
OT -0.67 -0.18 -0.51 -0.64 0.11 1.52 -3.98 3.68 -1.09 6.44 5.30 -9.97
BE 0.33 -0.52 -0.06 -0.51 -0.18 1.99 4.02 6.65 0.56 -10.75 1.59 -3.14
CH 0.71 0.24 0.12 -0.64 0.00 1.06 -8.13 2.59 0.78 -0.34 1.01 2.62
DE -0.12 -0.01 0.03 -0.11 0.05 0.87 -2.43 3.16 0.98 -0.08 0.46 -2.96
DK -0.12 -0.01 -0.10 0.83 -0.32 4.86 -3.41 14.50 0.37 -3.20 3.75 -17.13
ES 1.07 1.52 -0.10 -0.47 0.04 1.44 -1.16 5.28 -2.04 -0.89 5.57 -10.27
FI 0.46 -0.38 -- 0.05 0.00 1.22 2.70 1.65 1.88 7.41 1.76 -16.75
FR 0.38 -0.09 -0.16 0.07 0.03 1.05 -3.07 4.86 0.71 4.16 0.91 -8.86
GB 0.35 -0.10 0.19 0.00 0.04 1.36 -2.68 8.17 -0.40 2.72 4.19 -13.83
GR -- -- 1.89 0.00 -1.39 3.77 0.31 0.50 -8.73 -2.96 8.15 -1.55
IE 0.27 0.75 0.37 -0.48 0.37 1.39 -6.82 7.87 -2.40 18.84 1.89 -22.06
IT 0.21 0.36 0.29 0.09 -0.12 0.87 -6.41 6.28 0.09 -1.33 2.36 -2.67
NL 0.68 -0.14 -0.04 -1.39 -0.16 1.20 -1.91 1.60 0.06 1.97 4.97 -6.84
NO -0.63 -0.63 0.17 -0.98 -0.45 1.60 -4.12 4.53 -2.91 0.47 1.13 1.82
OE -0.02 0.00 -0.07 0.00 -0.23 1.48 2.59 3.18 1.01 -1.07 -0.22 -6.64
PT 4.17 -3.23 -- 8.33 -- -6.45 11.69 12.50 4.17 -5.51 -22.58 -3.09
SE 0.44 -0.12 -0.17 0.31 -0.42 1.07 -2.03 2.32 0.85 0.92 4.20 -7.37Note: All figures represent changes in the field‘s share in total regional or national patenting between the beginning and end
periods defined. -- indicates no patents in this field. For abbreviations and definitions, see Tables 7.2.1 and 7.2.2.
The patterns are more easily identified from Table 7.2.5, which computes the “RevealedTechnological Advantage” (RTA) for each case. The RTA is now a well-known measure ofcomparative technological advantage, being the relative share of a country in a particulartechnology - relative, that is, to the country’s own totals and to world averages. USA figures tendto lie close to unity, the median value, because of the large-country effect. In food, Western andEastern Europe, Japan and East Asia all lie below unity, indicating a comparative disadvantage;though for food equipment, only Japan lies in this category. Other regional patterns are as alreadydescribed, with Western Europe being below average in biotechnology, electronics andinstruments, among other things. For the individual West European countries, we see in Figure7.3 that Germany is well below average in food and food equipment, while Austria, Italy andFrance are also low in terms of food patents. Denmark and the Netherlands top the RTAs forfood, with Ireland, Spain and Switzerland also with high levels.
Figure 7.3: RTA for Food products for Western European major players, 1969/74

117
to1990/94,% RTA.
The list of countries indicates a variety of possible reasons, but what does seem apparent is theniche that the industry offers for technological development in medium-sized countries.Agricultural machinery is generally correlated with food, though Denmark and Spain areexceptions to this (Denmark pulls up in refrigeration). In biotechnology, again Germany faresbadly and Denmark does very well, while in drugs most of the larger European countries (apartfrom Sweden and the Netherlands) perform well. Conversely in electronics, most of the largecountries are below average, while in instruments all the West European countries are belowaverage. In the light of what we have had to say in Chapter 5 about the importance ofinstrumentation, this appears rather worrying.
Table 7.2.4: Percentage Share of Countries in All or West European Patents, by Technological
Field, 1969/94
Field: Food FoodEqpt
Tob-acco
AgricMachy
Refrig Bio-tech
Chems Drugs Mater Elect Instrts Other
WE 18.74 23.45 32.43 18.06 11.24 19.53 25.35 32.90 21.12 16.42 18.35 22.16
EE 0.56 0.66 0.18 0.50 0.31 0.90 0.81 1.23 0.49 0.26 0.73 0.66

118
USA 67.00 62.02 58.93 71.43 67.25 59.37 59.10 50.96 55.36 56.73 57.45 62.20
ONW 3.01 3.86 2.46 6.63 2.64 2.34 1.78 1.84 2.09 1.51 1.90 2.91
LA 0.22 0.45 0.06 0.17 0.10 0.06 0.09 0.12 0.15 0.04 0.06 0.12
JP 9.64 6.72 4.21 2.48 16.40 16.62 12.11 11.97 20.07 23.81 20.05 10.49
EA 0.14 1.44 0.80 0.09 1.28 0.15 0.22 0.13 0.28 0.87 0.79 0.74
OT 0.68 1.40 0.92 0.65 0.77 1.03 0.54 0.85 0.42 0.36 0.66 0.72
BE 2.13 1.91 0.37 4.33 1.18 2.57 2.11 2.13 3.63 2.33 1.10 1.30
CH 13.33 7.23 8.60 13.72 6.04 7.62 10.09 9.93 5.22 4.87 8.72 6.97
DE 22.92 27.35 35.96 25.47 29.40 32.51 43.90 31.08 39.97 32.39 39.52 39.11
DK 3.16 2.99 0.64 0.87 7.09 3.57 0.80 1.65 1.09 0.63 0.93 1.09
ES 1.18 3.91 0.55 0.39 0.66 0.57 0.40 0.91 0.42 0.25 0.42 0.75
FI 1.87 0.75 0.00 1.18 0.13 1.77 0.94 0.42 1.02 3.25 0.98 1.25
FR 13.55 15.38 8.60 14.85 11.42 14.47 12.64 17.65 13.65 19.32 14.31 14.43
GB 18.44 9.73 28.91 11.40 12.34 16.42 14.58 22.00 18.61 18.51 17.61 15.87
GR 0.00 0.00 0.18 0.04 0.13 0.05 0.06 0.04 0.10 0.06 0.04 0.06
IE 0.40 0.42 0.46 0.31 0.26 0.22 0.14 0.20 0.10 0.23 0.21 0.19
IT 4.48 14.38 10.70 4.24 9.84 6.67 5.65 8.12 5.38 5.32 3.87 5.74
NL 10.91 8.31 2.65 13.98 5.38 4.82 4.49 2.16 4.62 8.93 4.12 3.49
NO 0.81 0.75 0.09 1.18 0.92 0.85 0.33 0.30 0.49 0.39 0.38 0.85
OE 1.32 2.49 0.18 3.15 1.84 1.85 1.17 0.93 1.91 1.04 1.64 2.44
PT 0.04 0.08 0.00 0.09 0.00 0.10 0.04 0.03 0.01 0.01 0.02 0.03
SE 5.47 4.32 2.10 4.81 13.39 5.92 2.67 2.45 3.77 3.71 4.85 6.43
Note: Regional figures (top panel) are percentages of All patenting; Country figures (bottom panel) are shares in West Europe totals. For abbreviations and definitions, see Tables 7.2.1 and 7.2.2.
The remaining tables in this section undertake correlation and cluster analyses of these panels
of data in Table 7.2.5 just described. Because of the problems of handling the RTA index, i.e.
its tendency to produce a non-normal distribution, especially for small countries or fields, the
correlations and clusters have used transformed data. The transformation employed is a simple
one, with the RTAs transformed to the value of the natural logarithm of (RTA + 1). Apart from
correcting for some lognormality in the raw data, this transformation also has the advantage of
producing very similar results to transformations aimed specifically at inducing normality, such
as the arctan distribution. The median value is now ln(2), i.e. 0.693, rather than 1, but that can
be corrected by another very simple transformation if required. Several of the correlations were
also run on untransformed data, with little significant effect on the results.

119
Table 7.2.5: Revealed Technological Advantage (RTA) by Region or Country, 1969/94
Field: Food FoodEqpt
Tob-acco
AgricMachy
Refrig Bio-tech
Chems Drugs Mater Elect Instrts Other
WE 0.87 1.10 1.53 0.84 0.53 0.91 1.18 1.54 0.99 0.75 0.86 1.03
EE 0.88 1.03 0.28 0.77 0.48 1.40 1.26 1.92 0.77 0.40 1.14 1.02
USA 1.12 1.04 0.99 1.20 1.13 1.00 0.99 0.85 0.93 0.95 0.96 1.04
ONW 1.31 1.68 1.07 2.88 1.15 1.02 0.78 0.80 0.91 0.66 0.82 1.27
LA 2.30 4.68 0.62 1.81 1.08 0.61 0.94 1.28 1.60 0.41 0.62 1.25
JP 0.66 0.46 0.29 0.17 1.12 1.14 0.83 0.82 1.37 1.63 1.37 0.72
EA 0.23 2.32 1.28 0.14 2.06 0.24 0.35 0.20 0.45 1.40 1.27 1.18
OT 1.10 2.26 1.48 1.05 1.23 1.66 0.87 1.36 0.68 0.59 1.07 1.17
BE 1.07 1.20 0.32 2.09 0.35 1.35 1.43 1.88 2.05 1.03 0.54 0.77
CH 1.50 1.02 1.67 1.49 0.41 0.89 1.53 1.96 0.66 0.48 0.96 0.93
DE 0.52 0.77 1.39 0.55 0.40 0.76 1.33 1.22 1.01 0.64 0.87 1.04
DK 2.69 3.18 0.94 0.72 3.61 3.17 0.92 2.47 1.04 0.47 0.77 1.09
ES 1.78 7.41 1.44 0.57 0.60 0.91 0.82 2.41 0.72 0.34 0.62 1.34
FI 1.21 0.61 -- 0.74 0.05 1.20 0.82 0.48 0.74 1.85 0.62 0.96
FR 0.81 1.14 0.88 0.85 0.41 0.90 1.01 1.84 0.91 1.01 0.83 1.01
GB 0.98 0.64 2.64 0.58 0.39 0.91 1.04 2.04 1.11 0.86 0.91 0.99
GR -- -- 4.82 0.64 1.20 0.79 1.34 1.07 1.74 0.78 0.58 1.01
IE 1.91 2.45 3.72 1.39 0.74 1.11 0.87 1.61 0.54 0.94 0.97 1.05
IT 0.70 2.81 2.89 0.64 0.92 1.09 1.20 2.23 0.95 0.73 0.59 1.06
NL 2.09 1.99 0.88 2.57 0.62 0.96 1.16 0.73 1.00 1.50 0.77 0.79
NO 1.20 1.38 0.23 1.68 0.81 1.31 0.66 0.79 0.81 0.51 0.56 1.49
OE 0.64 1.51 0.15 1.47 0.53 0.93 0.77 0.79 1.05 0.44 0.78 1.40
PT 1.16 3.28 -- 2.65 -- 3.29 1.52 1.59 0.42 0.33 0.63 1.07
SE 1.00 0.98 0.66 0.84 1.46 1.12 0.66 0.78 0.77 0.59 0.86 1.38Note: All figures are RTAs relative to world totals and field shares. The RTA is calculated as the share of the field in the country or regional total divided by the field‘s share in the overall total (see Table 7.2.2). -- indicates no patents in this field. For abbreviations and definitions see Tables 7.2.1 and 7.2.2.
The correlations displayed in these tables are shown as their probability levels, given the number
of degrees of freedom, in order to make comparisons most evident. Negative simple correlations
are shown by minus signs in front of the probability levels. Values significant at the .05 (5%)
level are shown in bold type. Cases where the untransformed data gave significant results while
the transformed data (as shown) did not are marked with asterisks. Because of the nature of the
RTA data, where the values are not independent of one another, negative as well as positive
correlations are very likely. Strictly speaking, this lack of independence invalidates the regression
analysis deployed, but the infringements involved are unlikely to be serious enough to undermine
the broad conclusions.
The cluster analyses are carried out as in Section 6.3 of this Report, using the K-means
procedure. The number of clusters (K) varies between 2 and 5, and is the result of

120
experimentation with the data. The two panels display which field or country/region is assigned
to which cluster, and secondly display the F values for discriminating between the relevant
country/region or field in terms of this assignment to a cluster. Thus in Table 7.2.6, the bottom
panel shows that the USA, Other New World, Latin America and Japan were significant at the
.05 level or better in assigning the chosen technological fields of the first panel to the first case,
of two clusters. In this particular example, the second of the two clusters was composed of food,
food equipment and agricultural machinery, hence the high values recorded for the USA etc.
RTAs in these areas plus low values for Japan have dictated the outcome. Similar arguments
prevail in all other cases.
Tables 7.2.6 and 7.2.7 use regional data, i.e. the upper panel of Table 7.2.5 (transformed). The
correlations in Table 7.2.6 show strong positive relationships between the “land-abundant”
countries of the USA, Other New World, and Latin America, and one strong negative correlation
with the “land-scarce” country of Japan. This supports the findings already described. As just
noted in the example, the cluster analysis at the level of 2 clusters does likewise. The 4-cluster
level shows another cluster of fields relating to electronics, instruments, refrigeration, along with
tobacco, in which West Europe generally does rather badly (though - probably because of the
tobacco - its impact is not significant).
Table 7.2.6: Correspondences among regional data, by region
1) Correlation coefficient probabilities (zero-order)
Region: WE EE USA ONW LA JP EA
EE .297USA -0.059 -0.264
ONW -0.609 -0.739 0.002
LA 0.860 0.562 0.256 0.044
JP -0.177 0.811 -0.102 -0.004 -0.118EA -0.451 -0.108 0.879 -0.753 0.828 0.69OT 0.344 0.398 0.698 0.282 0.131* -0.105 0.418
Notes: All figures represent probabilities of not rejecting the null hypothesis of no correlation (n = 12). Minus signs in front indicate negative simple correlations.All data based on transformed RTAs (= ln(RTA + 1)).Bold data show significant positive or negative correlations at 0.05 level.* indicates correlation significant at 0.05 level using untransformed RTAs.

121
2) Cluster Analysis
Cluster Membership: 2 Clusters 4 Clusters Food 2 4 Food Equipment 2 2 Tobacco 1 1 Agricultural Machinery 2 4 Refrigeration 1 1 Biotechnology 1 3 Chemicals 1 3 Drugs 1 3 Materials 1 3 Electronics 1 1 Instruments 1 1 Other Fields 1 3
Discriminating probability (F values) 2 Clusters 4 Clusters
West Europe .702 .611 East Europe .981 .104 USA .023 .077 Other New World .002 .038 Latin America .002 .001 Japan .034 .256 East Asia .727 .002 Other Regions .302 .192
Table 7.2.7 examines these data by field rather than by region. Relatively high patenting in food
is positively correlated with agricultural machinery and negatively with instruments and
electronics Food and beverage apparatus is significantly correlated only with Other fields, no
doubt because the latter are dominated by mechanical engineering. Agricultural machinery is also
correlated with Other fields at the 10% level, and negatively with instruments at almost the 1%
level. Tobacco has no significant correlations, while refrigeration has strong negative correlations
with chemicals and drugs, despite being in part a chemicals technology. As expected, chemicals
and drugs are themselves very strongly intercorrelated. The clusters isolate Japan and East Asia
at the 2-cluster level, with electronics and instruments evidently important in this outcome (also
food at the .05 level).
Table 7.2.7: Correspondences among regional data, by technological field
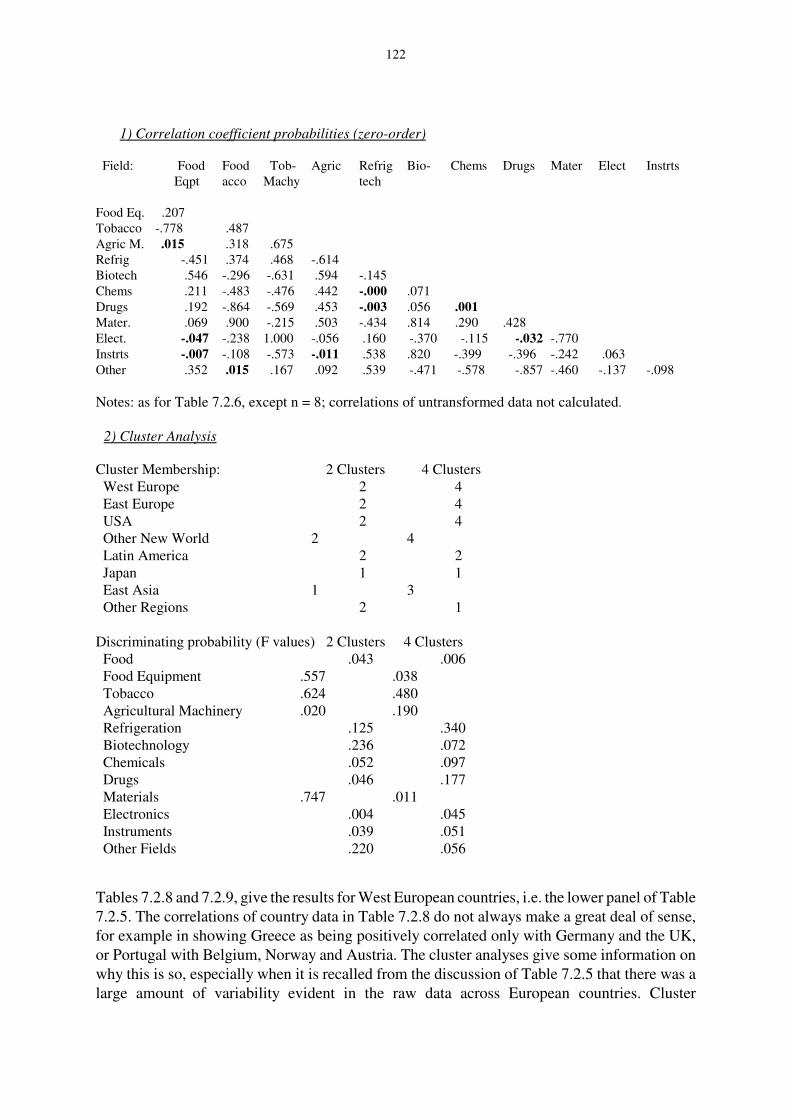
122
1) Correlation coefficient probabilities (zero-order)
Field: Food Food Tob- Agric Refrig Bio- Chems Drugs Mater Elect Instrts Eqpt acco Machy tech
Food Eq. .207Tobacco -.778 .487
Agric M. .015 .318 .675Refrig -.451 .374 .468 -.614Biotech .546 -.296 -.631 .594 -.145
Chems .211 -.483 -.476 .442 -.000 .071
Drugs .192 -.864 -.569 .453 -.003 .056 .001
Mater. .069 .900 -.215 .503 -.434 .814 .290 .428
Elect. -.047 -.238 1.000 -.056 .160 -.370 -.115 -.032 -.770
Instrts -.007 -.108 -.573 -.011 .538 .820 -.399 -.396 -.242 .063
Other .352 .015 .167 .092 .539 -.471 -.578 -.857 -.460 -.137 -.098
Notes: as for Table 7.2.6, except n = 8; correlations of untransformed data not calculated.
2) Cluster Analysis
Cluster Membership: 2 Clusters 4 Clusters West Europe 2 4 East Europe 2 4 USA 2 4 Other New World 2 4 Latin America 2 2 Japan 1 1 East Asia 1 3 Other Regions 2 1
Discriminating probability (F values) 2 Clusters 4 Clusters Food .043 .006 Food Equipment .557 .038 Tobacco .624 .480 Agricultural Machinery .020 .190 Refrigeration .125 .340 Biotechnology .236 .072 Chemicals .052 .097 Drugs .046 .177 Materials .747 .011 Electronics .004 .045 Instruments .039 .051 Other Fields .220 .056
Tables 7.2.8 and 7.2.9, give the results for West European countries, i.e. the lower panel of Table
7.2.5. The correlations of country data in Table 7.2.8 do not always make a great deal of sense,
for example in showing Greece as being positively correlated only with Germany and the UK,
or Portugal with Belgium, Norway and Austria. The cluster analyses give some information on
why this is so, especially when it is recalled from the discussion of Table 7.2.5 that there was a
large amount of variability evident in the raw data across European countries. Cluster

123
membership of the various fields is very unstable as one goes from the 2-cluster analysis to the
5-cluster one. However at both of these levels, the extremes of Table 7.2.8, there is a group of
food, agricultural machinery, biotechnology, drugs and other fields (also food equipment in the
2-cluster assignment). From the summary of the ANOVA table, we can see that it is basically the
smaller countries that are dictating the results (especially Spain, Greece, Ireland, Norway and
Portugal) - hence the instability.
Analyses of the same panel of data at the level of technological fields, in Table 7.2.9, are in a way
simpler, because there is only one significant positive correlation, namely that between food and
food equipment. This is another reflection of the variability across countries. Study of the cluster
memberships in the second panel reveals, as expected from what has just been said, many strange
bedfellows. At the 2-cluster level, this is because tobacco is the only significant determinant.
When we move to the 4 or 5 cluster level, we can see that other food-related areas plus
biotechnology come in as significant determinants, and with odd exceptions the patterns of
cluster membership begin to make rather greater sense. The overriding impression however
remains one of cross-country diversity.

124
Table 7.2.8: Correspondences among West European data, by country
1) Correlation coefficient probabilities (zero-order)
Ctry: BE CH DE DK ES FI FR GB GR IE IT
CH .399DE .835 .088DK -.863 -.913 -.282ES .808 .260 .617 .076FI .140 -.579 -.497 -.468 -.602
FR .078 .063 .046 -.835 .130 .490
GB -.851 .035 .002 -.532 -.650 -.372 .066
GR -.375 .753 .037 -.248 -.265 -.066 -.866 .025
IE -.431 .037 .453 .625 .031 -.253 .440 .024 .690
IT -.761 .178 .060 .344 .006 -.091 .111 .047 .294 .009
NL .150 .499 -.179 -.776 .461 .166 -.961 -.275 -.060 .387 -.653NO .131 .977 -.150 .245 .368 .277 .967 -.058 -.023 -.713 -.500OE .052 -.977 -.653 .743 .302 .348 .501 -.105 -.062 -.442 -.701
PT .031 .251 -.869 .348 .134 .205 .173 -.450 -.044 .739 .759
SE -.322 -.246 -.127 .034 .717 -.615 -.161 -.098 -.357 -.540 -.614
(cont‘d) NL NO OE PTNO .112
OE .247 .000
PT .096 .006 .007
SE -.451 .052 -.266 .771
Notes: as for Table 7.2.6. For country abbreviations see Table 7.2.1.
2) Cluster Analysis
Cluster Membership: 2 Clusters 3 Clusters 4 Clusters 5 Clusters Food 2 1 4 1 Food Equipment 2 2 2 2 Tobacco 1 3 3 3 Agricultural machinery 2 1 4 1 Refrigeration 1 1 1 5 Biotechnology 2 1 4 1 Chemicals 1 1 4 4 Drugs 2 2 2 1 Materials 1 1 4 4 Electronics 1 1 4 4 Instruments 1 1 1 4 Other Fields 2 1 4 1
Table continued overleaf.

125
Table 7.2.8 (cont’d); 2) Cluster Analysis (cont’d)
Discriminating probability 2 Clusters 3 Clusters 4 Clusters 5 Clusters Belgium .183 .208 .022 .218 Switzerland .205 .274 .304 .229 Germany .570 .232 .320 .275 Denmark .138 .315 .450 .082 Spain .074 .004 .013 .006 Finland .387 .117 .017 .065 France .198 .046 .021 .284 UK .785 .023 .043 .058 Greece .063 .016 .050 .022 Ireland .341 .003 .009 .002 Italy .664 .000 .000 .056 Netherlands .183 .851 .447 .558 Norway .001 .148 .169 .011 Austria .034 .076 .120 .064 Portugal .003 .157 .102 .021 Sweden .216 .596 .553 .065Note: discriminating probability based on F values from ANOVA table.
Table 7.2.9: Correspondences among West European data, by technological field
1) Correlation coefficient probabilities (zero-order)
Field: Food Food Tob- Agric Refrig Bio- Chems Drugs Mater Elect Instrts Eqpt acco Machy tech
Food Eq. .007
Tobacco -.386 -.635Agric M. .254 .557 -.064Refrig .425 .634 .248 -.219Biotech .087 .111 -.105 .209 .353Chems -.386 -.561 .418 .324 -.220 .751Drugs -.356 .058 .114 -.398 .435 .390 .173Mater -.086 -.074 .512 -.643 .431 -.350 .358 .912Elect .950 -.108 -.970 .909 -.315 -.254 -.990 -.114 .370Instrts .376 -.666 .279 -.636 .775 -.398 -.856 .683 -.187 -.934
Other -.794 .336 -.511 -.395 .313 .923 -.002 -.521 -.180 -.010 -.811
Notes: as for Table 7.2.6, except n = 16; correlations of untransformed data not calculated.
Table continued overleaf.

126
Table 7.2.9 (cont’d): 2) Cluster Analysis
Cluster Membership: 2 Clusters 3 Clusters 4 Clusters 5 Clusters Belgium 1 1 1 3 Switzerland 2 1 1 3 Germany 2 3 3 2 Denmark 1 2 4 4 Spain 1 2 4 5 Finland 1 1 1 3 France 1 1 1 3 UK 2 3 3 2 Greece 2 3 3 2 Ireland 2 2 4 5 Italy 2 2 4 5 Netherlands 1 1 1 3 Norway 1 1 1 3 Austria 1 1 1 3 Portugal 1 1 2 1 Sweden 1 1 1 3
Discriminating probability 2 Clusters 3 Clusters 4 Clusters 5 Clusters Food .164 .021 .061 .055 Food Equipment .207 .001 .001 .002 Tobacco .000 .002 .005 .006 Agricultural Machinery .155 .021 .016 .041 Refrigeration .963 .152 .164 .006 Biotechnology .112 .368 .013 .000 Chemicals .106 .483 .267 .435 Drugs .289 .049 .088 .167 Materials .804 .278 .151 .215 Electronics .940 .695 .424 .578 Instruments .162 .866 .874 .945 Other Fields .352 .774 .920 .972Note: discriminating probability based on F values from ANOVA table.
Two broad conclusions for Western Europe emerge from this scrutiny of the patent data,
conducted on country or regional bases rather than corporate ones. The first is that Western
Europe has generally fared reasonably well in patenting in food and food-related areas. This has
been associated over the period studied here with a strong performance in pharmaceuticals, and
to the extent that pharmaceuticals act as a “paradigm” for the food-processing industry, that may
be some comfort. However if our analysis of trends elsewhere in this Report is valid, and if new
paradigms like biotechnology, electronics and instrumentation come to hold sway over food
technology, then West Europe’s broad disadvantages in these areas could become stumbling
blocks.
The second conclusion is that food processing does have some inherent a priori advantages for
disseminating industrialization across countries. Many currently advanced countries began their
industrialization from strengths in this area. However, in recent times - at least so far as the

127
patents evidence goes - these benefits have been reaped more by the medium-sized countries of
Western Europe than by the smallest and most disadvantaged.
7.2.2 R&D and the NIS
R&D collaborations with different types of partners also indicate some importance of the NIS.
Calculated from CIS data, Table 7.2.10 below shows R&D collaboration by partners in different
countries as a percentage of R&D-performing firms. They are distributed according to four types
of partner.
The results show that generally domestic partners are preferred as partners in R&D projects. But
if we disregard the German and Dutch cases, then domestic partners and foreign private partners
are equally frequently used. Again we find that German firms benefit from the national
technological infrastructure. 44% of R&D-performing firms in the German food and beverages
industry have some R&D collaboration with domestic public partners, the highest proportion in
this category. On the other hand Germany has the smallest share of firms collaborating with
foreign partners. In Denmark and Ireland foreign partners are relatively frequently used, which
may reflect the smaller sizes of the economies: firms are more likely to find a partner with
competencies matching their own in a large country than in a small country.
Table 7.2.10: Share of collaborations according to type of partner, among R&D-performing
firms, percentages
Country Domestic,
private
Foreign,
private
Domestic,
public
Foreign,
public
Other
partners
Belgium 30 28 34 11 0
Denmark# 45 40 26 12 3
Germany# 29 10 44 5 0
Ireland# 26 33 25 17 2
Netherlands# 41 13 24 4 5
Norway# 28 26 23 4 5
Notes: Greece, Italy and Spain not comparable
# based on the original datasets
Compared to other industries we find that food-processing is more oriented towards the domestic
partners than many other industries. This is also the case for other low-tech industries. This
finding may relate to the fact that forefront research usable for high-tech industries is increasingly
international in character. It may also perhaps be the case that, in the high-tech industries, foreign
partners are often sought in order to limit competition.

128
The industry differences are shown for selected industries below. Because of the low number of
observations on this question, calculations on the original datasets in each of the comparable
countries are used.
Table 7.2.11: Share of R&D collaborations with domestic private partners, among R&D
performing firms in selected industries, percentages
NACE code Industry Denmark W.Germany
Ireland Netherlands Norway Mean
15-16 Food &beverages 45 29 26 41 28 34
23-25 Chemical, oil,rubber 36 34 20 43 52 37
28 Iron & metal42 30 24 47 54 39
29.3, 29.5,29.7
Machinery*39 29 18 28 33 29
30, 32 Officemachy,Telecoms
61 29 24 43 17 35
Note: * Machinery excluding motors, machine tools, weaponsCalculated from the original CIS dataset
Table 7.2.12: Share of R&D collaborations with foreign private partners, among R&D
performing firms in selected industries, percentages
NACE code Industry Denmark W.Germany
Ireland Netherlands Norway Mean
15-16 Food &beverages 40 10 33 13 26 24
23-25 Chemical, oil,rubber 48 22 31 54 30 37
28 Iron & metal28 18 26 21 23 23
29.3, 29.5,29.7
Machinery*47 17 12 17 51 29
30, 32 Officemachy,Telecoms
61 19 32 43 5 32
Note: * Machinery excluding motors, machine tools, weaponsCalculated from the original CIS dataset
Tables 7.2.11 and 7.2.12 show that the low-tech industries, metallurgy and food and beverages,
cooperate in R&D with domestic partners to an extent similar to firms in high-tech industries.
But when it comes to foreign partners these two industries are below other industries. As between
leaders and laggards we find no marked differences in the propensity to collaborate in R&D.
A preliminary conclusion from the CIS data is that the NIS indeed is important for the industry.
But the importance is greater on the market side than on the supply side. For example, we saw
that information sources like technological institutes, universities and government laboratories -
129
22 See Askegaard and Madsen (1993) for further elaboration.
information sources that are important parts of a national innovation system - are of less
importance to firms than are their customers and suppliers. Likewise we saw that R&D
collaboration is less frequent with public partners than private partners, and less frequent with
foreign partners than domestic partners. This result is plausible in the light of the great
importance of suppliers and end-users to this industry.
In spite of these trends, we shall argue that a national innovation system is not limited to the
interplay among firms, between firms and institutions, the legal system, etc. What matters
particularly in this industry are also the cultural and historical patterns of demand. Thus, we shall
argue that the global competition and internationalization of consumption patterns has not wiped
out nationally and regionally based habits of food and beverage consumption, which were
touched upon in Chapter 5.
The CIS data are not adequate for establishing this argument. Instead we shall include data from
another harmonized questionnaire send out by Centre de Communication Avancé. This research
aimed at investigating the lifestyles of people in 15 European countries (12 EU and 4 EFTA;
Luxembourg is analytically treated as a region of Belgium). The questionnaire was answered by
about 20,000 respondents, and 138 questions related to food. The 15 countries were subdivided
into 79 regions and this disaggregation allows investigating to what extent regions coincide with
nation-states.
In the analysis22 of the data, factor analysis and clustering of regions reduced the number of
regions into ‘food-habit homogeneous’ regions. First, the 138 food-related questions were
grouped into 41 items by means of factor analysis. Second, the 79 regions were clustered into 12
new, relatively homogeneous regions. In the process of clustering the regions, the degree of
homogeneity of the clusters is displayed. The most homogeneous regions with respect to food
and drink culture are Denmark, Sweden, West Germany except Bavaria, and Switzerland except
francophone Switzerland. The Netherlands, Great Britain and France are also rather
homogeneous, whereas Belgium, Portugal, Greece and Italy are heterogeneous countries. In
addition, French Switzerland is very different from the rest of Switzerland and Bavaria is very
different from the rest of Germany.
Of the 12 clusters, 7 coincide with nation-states: Denmark, Sweden, Norway, Portugal, Spain,
Italy and Greece. The remaining 5 clusters are cross-national: the British Isles; the Netherlands
and Flanders; France and francophone Switzerland; Germany, Austria and German-speaking
Switzerland; Brussels, Wallonia and Luxembourg.
Two features of the resulting clusters are of particular interest in our context. There is a large
degree of overlap between national borders and regional food culture. A further aspect of this is
that language borders and regions of food culture coincide. In fact there are only very minor
exceptions to this result. The other interesting feature is that nation-states on the periphery of

130
23 In Askegaard and Madsen (1993) it is explained what the actual content of these patterns are.
Europe tend to have their own food and drink culture, whereas the nations of Continental Europe
are more likely to have cross-national cultural patterns.23
In a wider perspective it can be concluded that, in spite of internationalization trends, Europe is
not homogeneous with respect to food and drink culture. Far from it: there are large differences
both in the actual content of the culture and in the degree of homogeneity of the nations.
Furthermore, the national borders are of great importance in distinguishing different cultures. The
large degree of overlap between linguistic regions and food culture regions suggests that the
consumption patterns are deeply rooted in the historical and cultural development of the nations.
The results clearly indicate that the national consumption patterns are important for the
development of the industry. If firms within the industry are to expand through export markets,
the national differences will be important to take into account. In recent years barriers to free
trade have decreased, better logistics and distribution systems have been developed as have better
methods for preserving and packing of food and beverages. All these factors ease consumer
access to products from abroad and consequently the access for foreign firms to national markets.
But this is no more than the physical access to the markets. It is clear from the above that cultural
barriers also exist and persist despite trends towards internationalization. If the national
innovation system includes the historical, culturally rooted pattern of demand, it follows directly
that the latter is of particular importance to this industry, and indirectly limits the extent of
market innovation.
This fits with what might be expected from a so-called low-tech industry. It could be argued that
industries where innovations are heavily dependent on new scientific developments would be less
reliant on the national innovation system - in particular the parts of the system which support
research, general education, interplay between universities and industry, etc. Some empirical
evidence for this assertion is implied in the discussion above on partners for R&D cooperation.
However, the more informal institutions are important elements of a national innovation system,
and are not necessarily related to high-tech industries. Furthermore, the principal effect of an NIS
is to increase the ability of firms to take advantage of new scientific developments and to diffuse
the use of technologies to those firms who might benefit from such technologies. As previously
argued, the innovation process in food and beverages is precisely characterised by combining
different, interdisciplinary levels of scientific progress. This further enhances our argument: the
NIS is particularly important to food-processing for reasons related to both demand- and supply-
side features.

131
8. Implications for innovation policy
The policy implications to be drawn from this wide-ranging consideration of data, bothfrom the CIS and from other sources, will be considered at the levels successively of thefirm, the nation-state, and supranational bodies (especially the EU).
Although this is a convenient way of separating the circumstances of policy-makers, itshould also be recognised that our study draws fairly similar types of conclusion at eachlevel: micro, macro, and international. Our overriding conclusion is thus along the linesthat a co-ordinated policy would involve undertaking more or less parallel strategies ateach level.
The two most consistent findings throughout the Report are somewhat at odds with theconventional wisdom regarding the food-processing industry. The first is that, thoughthere is an element of truth involved in seeing this as a rather "low-tech" industry, it isone that is coming to confront an increasingly complex set of technological conditions.Instead of being dominated by one major type of supplier - the producer of food-processing machinery - as it seemed appropriate to envisage it as recently as a decade ago(e.g. Pavitt, 1984), it is coming to be strongly influenced by a broad range of upstreamtechnological "suppliers". It may be expected to be crucially important which firms andwhich countries succeed best at integrating this ever-broadening technological contextinto the production of the industry's products. It may equally be expected that this wouldinvolve the active inclusion of the industry into technological development, in place ofthe somewhat passive role assigned by the conventional "supplier-dominated"perspective.
The second finding partly underlies the first, and is probably the most importantconclusion of this Report. It is that the industry is shifting from being a supply-focused,process-oriented industry towards being a demand-focused, product-oriented industry.More precisely, our findings, and notably those from the CIS data, suggest a high degreeof complementarity between process innovation and product innovation. In thismutuality, both ends are to a degree acting as driving forces, with the supply side beingpushed by the growing technological complexity just mentioned. If anything, however,it is the demand side of which greatest note has to be taken, not least because this scarcelycharacterised the industry until the 1980s.
8.1 Policy and the firm
The shift of emphasis towards demand is reflected immediately in the changing natureof corporate strategy. The traditional international oligopolistic firm of the pre-1980stype, heavily dependent on standardization and brand name, still flourishes, but has beenjoined by newer large firms (including a number from Japan), which aim instead atproduct differentiation and market segmentation. This duality of demand appears to be

132
characteristic of a large number of industries in this era (Ruigrok and van Tulder, 1995),but is particularly marked in food and beverages. This development of productdiversification as an alternative firm strategy has arisen within a pattern of corporatestructure which has continued to be organized primarily according to demand criteria:that is, the specific lines of business pursued by a firm within any one major branch ofthe industry tend to be linked more by demand characteristics (selling to similar markets)than by supply characteristics (e.g. using similar technologies).
1. Firms in the industry pursue the full range of possible strategies - offensive, defensive,dependent, imitative. The CIS data allow only limited comparisons among firmsaccording to their strategies. Even when we make use of other data, we do not find majordifferences in economic indicators of success, such as profitability, growth in turnoveror innovativeness, that stem from differences in strategy. In terms of linkinginnovativeness to profitability, our data appear to support a midway position between thefirst-mover advantages of new entry, and the long-experience advantages of incumbency.This is consistent with findings in other industries favouring the "fast-second" strategyas the surest route to profiting from innovation.
2. The food-manufacturing industry is characterised by much higher levels of newproduct development than is often supposed. Even firms that lag behind in terms ofturnover growth appear to have relatively high rates of introduction of new products(recall that the Italian data largely account for the "tail" of relative backwardness of theindustry, cf. p 8). Moreover some sub-branches of the industry appear to be highlyinnovative, as the original disaggregated dataset for Denmark showed. It is true that themain measure provided by the CIS survey is of products that are new to the firm, notthose that may be new to the industry. High ratios of new products in sales may thus beconsistent with following imitative rather than innovative strategies in the sense usuallyunderstood. Nevertheless, the important point is that the shift towards productdevelopment affects all firms. In addition, the data on innovations that were new to theindustry (Table 2.1.2) also displayed reasonably high levels.
3. The industry over recent decades therefore is at odds with the view that it is atraditional, supplier-dominated, process-oriented industry. What our data show is anstrong association across countries between product development and processdevelopment. To some extent this association may reflect problems in collecting the CISdata, as our further enquiries have suggested. Nevertheless, it seems valid to argue thatit is the interaction between product innovation and process innovation that firms (andcountries) need to get right. A major aspect of this is the continuing progress towardoverall integration of production processes, including progress towards on-lineinstrumentation and quality and safety assurance. This is being hindered by the extent offragmentation of the industry.
4. The industry comes out rather low in terms of conventional indicators ofinnovativeness, such as patenting; as might have been predicted from conventional viewsof its technology levels. Against this has to be ranged the limitations of patents data forstudying this particular industry, with its emphasis on incremental change, application ofexisting technologies drawn from other fields, focus on marketing improvements

133
1 This paper appeared in the week in which our final Report was being prepared, too late to assess it ingreater detail in the main part of our text.
(including packaging developments), and so on. Either way, the industry remains highlydependent on "buying in" technologies, or outsourcing technology development tospecialized units. This runs the risk of perpetuating fragmentation along the lines justindicated. The clear pattern has been one towards a rapid diversification in the kinds oftechnology involved. The food-processing industry is no longer technologicallydominated by equipment suppliers, but has to draw on such high-tech fields aspharmaceuticals, biotechnology, instrumentation and IT, advanced materials, etc.Developing in-house capability at least to interface with these expanding technologicalinputs will be a major consideration for food manufacturers over the foreseeable future -how much they will need to develop their own in-house R&D in these fields remains tobe seen. The extent of diversification appears to be statistically associated with thestrength of innovation/profitability linkages and with the performances of leader firms.
5. Developments in market-related areas appear to be even more important than eitherproduct or process introductions (see Tables 6.2.1 and 7.1.1). Although food andbeverage producers may not link directly to end-users, they are being called on to meetthe criteria increasingly imposed by the retailers etc. who do carry out his function. Thusthe manufacturers confront the rising power and broadening requirements of downstreammarketing as well as upstream technology suppliers. The industry appears to be movinginescapably towards the network model of management, which has often been taken toapply only among some high-tech industries.
6. The 1980s were a period of rapid growth in the size of at least the larger firms in thisindustry, and external sources of growth were a major contributor to this increase inaverage real size. However there are signs that the external route to growth (mergers,takeovers, etc.) has abated in the first half of the 1990s. Much of our analysis has probedquestions of the relationship between firm size and innovation. In general our work seemsconsistent with conventional views about a U-shaped relationship in which innovativesmall firms are also important innovators in relative terms (though the totality of smallfirms may not be, and we should allow here for well-known results relating to smallfirms, such as their under-reporting of R&D). Although we find higher R&D intensitiesamong larger firms, we do not find firm size to be especially important in relationship toinnovative intensity. Our findings are probably consistent with the paper published veryrecently by Cohen and Klepper (1996), in which large firms conduct more R&D becauseof being able to spread the costs over a greater amount of output of each particularproduct.1 However our findings about technological diversification suggest that thediversification of products may be involved as well.
7. Our very detailed study of the relationships between innovation and profitabilityindicates that they are much more complex than they appear at first glance. One generalinference we draw is that the more innovative firms are on average more profitable, butthe converse does not hold - the more profitable firms are not necessarily the moreinnovative (indeed a further reworking of the CIS data for Denmark indicates an inverse

134
relationship). The problems of interpretation that arise here mean that we cannot simplyadvocate innovation as a strategy for commercial success. Note that innovativeness isjudged purely by internal (in-house) measures, so differences in incorporating externaladvances are not allowed for at this point.
8. Nor do financial considerations emerge as important for innovative success. Contraryto theoretical axioms such as the Modigliani-Miller theorem (which argues that gearingis irrelevant if appropriate assumptions are met), or the more general view that equity isfavourable to innovation, the gearing of firms in the 1980s was changing towards higherdebt:equity ratios. The debt may have been used in part to finance embodied forms oftechnology, purchased from elsewhere. Again, we are not in a position to make strongproposals regarding corporate financial policy as a factor in innovation.
8.2 Policy and the nation
1. The food-processing industry has to be ranked among the largest of manufacturingindustries in European countries in terms of orthodox economic indicators - share invalue-added, employment, profit performance, and so on. No country can readily affordto ignore its potential for contributing to economic growth and development. Europeancountries have moreover tended to maintain a high level of competitiveness in thisindustry. Furthermore, the industry is characterised by a high level of stability in termsof profitability, hence acting as a natural countercyclical agent.
2. Although the industry is regarded as low-tech, a point which we partially confirm inrespect of its low rate of patenting etc., it is a major user of innovations developed inmore upstream industries, in ways noted above. We have just pointed out that this hasstrong implications for the innovation strategies of individual firms, but we would alsostress the potentiality that the industry offers to countries as a "carrier industry". Thevarious streams of new technology which interpenetrate it (like biotechnology,informatics, etc.) may be diffused precisely through their usage in such a large sector. Ourhistorical studies (von Tunzelmann, 1995a) have shown both the importance foreconomic growth of the "diffusion phase" of new technologies, and the specificimportance of food-processing in the industrialization of many European countries.
3. However it also must be recognised that the food and beverages industry is, contraryto popular impression, a very capital-intensive one. In European countries especially, thegrowth in employment that it has offered during the 1980s has been very limited, inconformity with the notion of "jobless growth" which has regrettably characterised manyof them in this era. The substitution of capital for labour has accentuated this weakimpact on employment, and technology has probably played a part in this substitution.A more reliable assessment of its potentiality for employment creation would, however,examine the entire food chain.
4. The relative growth of large firms since the early 1980s has had a considerable impacton the market structure of the industry, tending to reinforce oligopolistic control. Therelationship between market structure and innovation remains convoluted, and our data

135
do not really illuminate it. Two points however emerge from the broader considerationsdiscussed. The first is that internationalization has led towards global rather than nationaloligopolies, thus restricting the scope for national policy-making but also reducing itsjustification. The second is the shift away from the manufacturing phase in terms ofcontrolling the food chain: upstream to suppliers of high-tech technologies, butparticularly downstream to retailers linking to consumers.
5. When groups of firms are aggregated at national levels, depending on whether they areleaders or laggards in terms of turnover growth or new product development, we findsurprisingly little difference in performance according to orthodox evaluation criteria.That is, there is little difference, say, in the export shares of leaders vs. laggards (ifanything laggards have higher export shares in 1990/2), in the levels of turnover peremployee (i.e. labour productivity), or in the intensity of innovation costs. There is,however, some indication of leaders having higher R&D intensities overall. Thus thechoice of policies by governments aimed at fostering the companies in their countriesmay face contradictions in regard to the "success" they should achieve. In particular, anyattainment of higher rates of internal innovation within firms arising out of governmentalsupport may not necessarily satisfy other targets, such as success in foreign markets.Governments need to recognise differences between the various target groups they maybe aiming at. Broad-spectrum policies may be less useful than specific goal-orientedpolicies thus differentiated. For example, governments might distinguish betweenpolicies to make non-innovators innovate (indicated by increasing frequency of innovatorfirms), policies to make innovating firms more innovative (indicated by higher shares ofnew products in turnover), and policies to diffuse innovations to other firms in the sameor other industries (indicated by the difference in products new to the firm vs. new to theindustry, etc.).
6. Nevertheless, our investigations establish significant differences between countries interms of their innovative performances. Although much of our evidence is indirect, wefind strong support for the impact of "national innovation systems" in this industry. In anindustry as dependent as this one on external sources of innovation, close ties betweenproducers and users of technology appear to be crucial, especially as local and regionalsources of technology turn out to be so predominant. Countries like Germany display anespecially powerful user-producer system, despite a relative shortfall in terms oftechnology generation. This is not just a matter of supporting the production oftechnology, nor even their links to users, important as both of these may be, butsupporting the advance of the knowledge base of the users themselves. Equally, otherfindings have established the importance of national boundaries in defining patterns ofconsumer tastes, so links downstream also have a strong national orientation. Our resultstherefore support the notion of systemic learning, in which the country or region plays amajor role.
7. An important aspect of the national innovation system so far as governments areconcerned is the development of the science base. With food-processing firms still highlydependent on external developments in new areas of science such as biotechnology, thegovernmental laboratories etc. are likely to play an important part. However it is not onlyunrealistic but probably ill-advised for smaller and lagging countries in Europe to plan

136
for science bases that would become major actors in terms of international scientificleadership. The driving force for these developments in such countries needs to comefrom downstream, and especially from the users in sectors such as food-processing.Domestic partners emerge from our analysis as being the most important for the upstreamscience-based industries. As just mentioned, the progress of the knowledge base in theusers is of critical importance. Their needs, as we have so often pointed out, are for abreadth of scientific expertise, and governments thus need to give particular attention tothe "transfer sciences" and to the appropriate combinations of sciences. In this industry,technology is developed principally through the chain-link mechanism of Kline andRosenberg (1986), in which firms' capabilities progress interactively through incrementallearning. There is a case for governments to pay greater attention to institutes designedto transfer and co-ordinate technology, such as the CRTOs or co-operative R&Dinstitutes. It also needs to be asked whether the shifts of funding of such institutestowards greater reliance on external funding, while probably desirable in itself, may alsohave disadvantages for their overall level of funding and more broadly for their role inthe national system of innovation.
8. We have drawn attention to the importance of final as well as intermediate demand,in driving the industry - local markets and tastes, per capita incomes, etc. These directlyinfluence the nature of product and process innovation in the manufacturing branches ofthe industry, where the main trajectories have been towards higher speed in processing(to satisfy rising levels of demand and particularly demands for freshness etc.), and - mostpronounced in recent years - towards flexibility in processing that underpins thedevelopment of new product varieties. These build upon changes in lifestyles which areunlikely to be reversed in the near future. A key area in this respect has been in raisingquality and safety standards. Recent scares have highlighted all too clearly the need forconstant and intensified vigilance in maintaining quality standards. Governments haveto play the leading role in imposing and raising standards, primarily of course to protectconsumers, but also to protect the reputations of their producers.
9. The context of this industry as primarily a consumer of innovations, but in a positionto have a major impact on the economic climate of the country, suggests thatgovernments should give even greater attention than they already do to policies orientedto the diffusion of innovations, rather than their generation. In general, we would supportthe arguments of Ergas (1987) for governments to shift from a "mission-oriented" to a"diffusion-oriented" attitude to science and technology policy. There is a possibility thatpolicies to augment diffusion may directly conflict with those to augment innovation, e.g.policies to strengthen IPRs (see next section, and cf. Stoneman and David, 1986).However, in the chain-linked innovation model of Kline and Rosenberg (1986) adoptedin this Report, policies to augment diffusion may have a feedback effect of alsoaugmenting innovation, thus creating a "virtuous circle". These points are furtherdeveloped in the next section.
8.3 Policy and the EU

137
Most of the conclusions derived for countries apply at the higher level of supranationalbodies such as the EU. To avoid unnecessary repetition, we shall return to the point fromwhich we began and consider them in the light of the EU's Green Paper on Innovation
of December 1995, and in particular of its "routes of action" outlined in the concludingpart of that Green Paper. We take it for granted that some part of the role of supranationalauthority is to harmonize national policies.
1. Route of action 10 of the Green Paper argues for the development of a favourable legaland regulatory framework to facilitate industrial innovation. This needs to be interpretedwith great care. As we have just emphasised, a "favourable" regulatory framework shouldnot be confused with a lenient one, as it so often is by national governments, andespecially by industry itself. The EU should ignore pleas by the industry to regulate itself,as its past performance has been too poor to give any reassurance. Moreover, it is, as weare implying, in the industry's best long-term interests to be overviewed by a very vigilantexternal regulatory system. The EU has a particularly important role to play in theharmonization of standards, as it is indeed progressing towards at the time of writing: ourpoint is that this should be biased towards levelling up, not levelling down. We wouldpoint in particular to the implementation of HACCP standards in this industry, sinceorthodox quality assessment criteria such as ISO 9000 are much too weak to meet suchobjectives. There is also a case for tightening up regulatory standards in regard tobranding products as environmentally friendly; there appears to be some awareness ofthis weakness in EU circles but at present there are substantial differences amongmember states.
2. Routes of actions 2 and 12 deal primarily with diffusing innovational behaviour,especially to SMEs. The evidence we have surveyed suggests considerable innovatorycontributions from the SMEs that can be listed as innovative, but also a long tail of non-innovative SMEs. We therefore agree with this policy, and emphasise that it needs to beplaced in the broader context of the organization of the industry as a whole. We haveobserved that the growth of large firms has been slower in Europe than in majorcompetitor regions, though we cannot settle the question of how far this has restricted thegrowth of European competitiveness. The investigations here need to consider therelationships in both directions: the impact of innovation on market structure as well asthe impact of market structure on innovation. We echo the call of the Green Paper to usethe Fourth Framework Programme to assist research into this area.
3. Route of action 12 also emphasises the role of regional systems of innovation. Ourfindings are very similar, though we would place more emphasis on bottom-upapproaches to enhancing networks and technology diffusion than is done in the GreenPaper. The Green Paper tends towards a top-down view of the diffusion process, inimplicitly seeing the problem as one of shortcomings of the adopters and non-adopters -this perspective is common in the orthodox economics literature on diffusion. We wouldargue for looking at the issue more from the perspective of the adopters (and non-adopters) themselves, in which the problems may also lie upstream or downstream fromthem. Our systemic approach would couple such developments of regional or nationalinnovation systems with the strengthening of public action for innovation (route of action

138
13). This too should look at the issue from the perspective of users of technology, not justthe producers of technology.
4. For similar reasons, we support the route of action 11, aimed at promoting thediffusion of economic intelligence. We would link this and the previous point with theareas of shortcoming identified in our Report. This may be associated with route of action1, favouring the adoption of technology foresight and monitoring. Western Europe issomewhat deficient in its development (and perhaps utilization) of new technologicalparadigms such as biotechnology, advanced instrumentation and electronics; though itis stronger in fields like pharmaceuticals and food technologies themselves. We againenvisage the problems as not only those of generating such technologies but ofimplementing them in users in the manufacturing sector.
5. The promotion of intellectual and industrial property (route of action 8) has to bereconciled with the need to diffuse these new technologies. In our view, the Green Papergives insufficient thought to the kinds of problems this may raise for policy. This is likelyto be especially critical in the later developing countries, such as some of theMediterranean regions. The catching-up countries have to some extent been improvingtheir record in technology generation (e.g. patenting), but there is less indication ofbenefiting from technology implementation, at least in the data we have surveyed. Thedecline in Eastern Europe, beginning in the 1980s, should also be noted. The food-processing industry has in fact traditionally maintained a high degree of separationbetween its manufacturing segment and the development of new technologies, but withthe growing complexity of technological accumulation described in our Report, it mayprove increasingly difficult to maintain such separation and at the same time attain anadequate level of technological advance. More research is warranted in this area, too.
6. The Green Paper places considerable emphasis on improving the financing ofinnovation as a way of promoting it (route of action 6). In the industry we are studying,this does not appear to be a major problem, and we would therefore advise that little canbe expected from governmental strategies which place their hopes on, for instance,lowering the costs of finance.
7. This becomes important in the light of the Green Paper's recommendation ofintroducing more beneficial fiscal regimes (route of action 7). The Green Paper'sdiscussion of macroeconomic circumstances (pp 8-9) is limited almost entirely to supply-side policies, such as lowering interest rates. Our findings throughout this Report indicatethat it is the demand side of both micro and macro policies which are critical for thisindustry, and the ignoring of these in the Green Paper reflects a fundamental deficiency.Policies to improve the supply side run the risk of being counterproductive or worse ifthey cut back demand, and there is considerable evidence that this is precisely what hashappened since the beginning of the 1980s. Paradoxically, the shift from supply todemand as a driving force in innovation in the industry has coincided with a shift fromdemand to supply focus in macroeconomic policies.
This is the strongest conclusion to come out of this study. The primary emphasis onpolicy at all levels - firm, country and wider region - must be squared with the changing

139
nature of innovation in the industry. Only by considering the primacy of demand can theindustry hope to fulfil its potential for carrying industrialization over the foreseeablefuture.
References
Achilladelis, B., Schwarzkopf, A., and Cines, M. (1990), "The dynamics of technological
innovation: the case of the chemical industry", Research Policy, 19, 1-34.
Acs, Z.J., and Audretsch, D. (1989), "Patents as a measure of innovative activity",mimeo, WzB, Berlin.
Acs, Z.J. and Isberg, S.C. (1991a), "Innovation, firm size and corporate finance",
Economics Letters, 35, 323-326.
Acs, Z. and Isberg, S.C. (1991b), "Capital structure, innovation, and firm size", mimeo,WzB, Berlin.
Aghion, P. and Tirole, J. (1994), "The management of innovation", Quarterly Journal of
Economics, 109, 1185-1209.
Alc, C., and Bedetti, R. (1988), Il business in tavole: come cambia l'industria alimentare,Edizioni del Sole 24 Ore, Milano.
Archibugi et al. (1994), “Evaluation of the Community Innovation Survey”, Dept. ofBusiness Studies, Aalborg University.
Archibugi, D., and Pianta, M. (1992), "Specialization and size of technological activities
in industrial countries: the analysis of patent data", Research Policy, 21, 79-93.
Askegaard and Madsen (1993), “Fødevareforbrug - et regionernes Europa? Perspektiver
for danske virksomheder”, Ledelse og Erhvervsøkonomi, 4/93, 233-248.
Arundel A., van de Paal G. and Soete L. (1995), “Innovation Strategies of Europe’s
largest industrial firms, Results of the PACE survey, report by MERIT for theSPRINT programme, EC.
Audretsch, D.B., and Acs, Z.J. (1991), "Innovation and size at the firm level", Southern
Economic Journal, 57, 739-744.
Bailey, C. (1993), "Refrigeration and legislation: facts and fallacies", Food Technology
International - Europe, 6, 35-39.
Bond, S. (1992), "New products in the market place", Food Technology International -
Europe, 5, 109-111.

140
Bound, J., Cummins, C., Griliches, Z., Hall, B.H., and Jaffe, A. (1984), "Who does R&Dand who patents?", in Z. Griliches (ed.), R&D, Patents, and Productivity, NBER,University of Chicago Press, 21-54.
Bowman, C., and Asch, D. (1987), Strategic Management, Macmillan, London.
Branch, B. (1974), "Research and Development activity and profitability: a distributed
lag analysis", Journal of Political Economy, 82, 995-1012.
Bush R.J. and Sinclair, S.A., "A multivariate model and analysis of competitive strategy
in the U.S. hardwood lumber industry", Forest Science, 37, 481-499.
Calvert et al. (1996), “Innovation Output in European Industry: Analysis from CIS”,mimeo, SPRU.
Caswell, J.A. (1987), "Dominant forms of corporate control in the US agribusiness
sector", American Journal of Agricultural Economics, 69.
Chaney, P.K., Devinney, T.M., and Winer, R.S. (1991), "The impact of new product
introductions on the market value of firms", Journal of Business, 64.
Chesnais, F. and Walsh, V. (1994), "How strongly and in what ways is biotechnologyreally affecting the 'evolution' of the chemical industry?", in P. Cohendet and M.Willinger (eds.), Evolutionary Economics of Technological Change: assessment
of results and new frontiers, EUNETIC, Strasbourg, vol.2, 571-576.
Cohen, W.M., and Klepper, S. (1996), "A reprise of size and R&D", Economic Journal,
106, 925-951.
Cohen, W.M., and Levinthal, D.A. (1989), "Innovation and learning: the two faces of
R&D", Economic Journal, 99, 384-397.
Connor, J.M. (1983), "Determinants of structural adjustment in the food industries", inOECD (ed.), OECD Food Industries in the 1980s, OECD, Paris.
Connor, J.M. and Schiek, W.A. (1996), Food Processing: an industrial powerhouse in
transition, John Wiley & Sons, New York.
Copeland, T.E. and Weston, J.F. (1992), Financial Theory and Corporate Policy, 3rdedn., Addison-Wesley, Reading PA.
Coriat, B. (1990), L'atelier et le robot, Edn. Christian Bourgeois, Paris.
Davies, R.M. (1990), "The widening technology of breakfast cereal production", Food
Technology International - Europe, 3, 35-38.
Dawson, J.A., Shaw, S.A., Burt, S., and Rana, J. (1987), Structural Change and Public
Policy in the European Food Industry, CEE-FAST, 115, Brussels.

141
Deaton, A.S. (1975), "The structure of demand 1920-1970", The Fontana Economic
History of Europe, vol. 5, ch. 2, London.
Dosi, G. (1988), "The nature of the innovative process", in G. Dosi et al. (eds.),Technical Change and Economic Theory, Pinter, London, 221-238.
Dosi, G. (1990), "Finance, innovation and industrial change", Journal of Economic
Behavior and Organisation, 13, 299-319.
Dyhouse, C.A. (1981), Girls Growing Up in Late Victorian and Edwardian England ,Routledge & Kegan Paul, London.
Earnshaw, R.G. (1992), "High pressure technology and its potential use", Food
Technology International - Europe, 5, 85-88.
ECE (Economic Commission for Europe) (1991), Food-Processing Machinery, including
packaging techniques, United Nations, New York.
Ergas, H.(1987), "The importance of technology policy", in P. Dasgupta and P. Stoneman(eds.), Economic Policy and Technological Performance, CEPR / CambridgeUniversity Press, Cambridge, pp 51-96.
European Commission (1995), Green Paper on Innovation (EC DG XIII/D: E. Cresson& M. Bangemann), Brussels & Luxembourg.
Freeman, C. (1982), The Economics of Industrial Innovation, 2nd edn., Pinter, London.
Freeman (1994), “Critical Survey: The economics of technical change”, Cambridge
Journal of Economics, 18, 463-514.
Freeman, C., and Perez, C. (1988), "Structural crises of adjustment: business cycles andinvestment behaviour", in G. Dosi et al. (eds.), Technical Change and Economic
Theory, Pinter, London, 38-66.
Galazka, V.B., and Ledward, D.A. (1995), "Developments in high pressure food
processing", Food Technology International - Europe, 8, 123-125.
Galliano, D. (1991), "Groupes de sociétés et meso-analyse: le cas des IAA", Revue
d'Economie Industrielle, 58
Galliano, D., and Alcouffe, A. (1993), "Corporate control and competitiveness: theFrench case", in K.S. Hughes (ed.), European Competitiveness, CambridgeUniversity Press, Cambridge, 87-102.
Geroski, P.A. and Jacquemin, A. (1988), "The persistence of profits: a European
comparison", Economic Journal, 98, 375-389.

142
Geroski, P., Machin, S. and van Reenen, J (1993), "The profitability of innovating firms",
RAND Journal of Economics, 24, 198-211.
Goodwin, B.K., and Brester, G.W. (1995), "Structural change in factor demandrelationships in the US food and kindred products industry", American Journal of
Agricultural Economics, 77.
Grabowski, H.G. (1968), "The determinants of industrial research and development: astudy of the chemical, drug, and petroleum industries", Journal of Political
Economy, 76, 292-306.
Greeves, T.W. (1990), "Keeping high speed packaging efficient", Food Technology
International - Europe, 3, 325-326.
Griliches, Z. (1986), "Productivity, R&D and basic research at the firm level in the
1970s", American Economic Review, 76, 141-154.
Hall, M.N. (1992), "Fruit juice authenticity", Food Technology International - Europe,5, 197-201.
Hannah, L. (1976), The Rise of the Corporate Economy, Methuen, London.
Hayami, Y., and Ruttan, V.W. (1971), Agricultural Development: an international
perspective, Johns Hopkins Press, Baltimore & London.
Hilliam, M. (1995), "Functional foods: current and future market developments", Food
Technology International - Europe, 8, 27-31.
Himmelberg, C.P. and Petersen, B.C. (1994), "R&D and internal finance: a panel study
of small firms in high-tech industries", Review of Economics and Statistics, 76, 38-51.
Hobsbawm, E.J. (1957), "The British standard of living 1790-1850", Economic History
Review, 2nd ser., 10, 46-68.
Horrocks, S.A.J. (1991), "Technology and chocolate: research in the British food industrybefore 1940", mimeo, Centre for the History of Science, Technology and Medicine,Manchester.
Hoshi, T., Kasheyap, A., and Scharfstein, D. (1991), "Corporate structure, liquidity, andinvestment: evidence from Japanese industrial groups", Quarterly Journal of
Economics, 106, 33-60.
IAM (1990), AGRODATA: Les 100 premiers groupes agro-alimentaires mondiaux, 2volumes, Montpellier.
Jones, S.A. (1990), "New developments in extrusion cooking", Food Technology
International - Europe, 3, 54-58.

143
Jones, S.A. (1991), "New advances in continuous extrusion cooking", Food Technology
International - Europe, 4, 67-70.
Kamien, M.I. and Schwartz, N.L. (1975), "Market structure and innovation: a survey",
Journal of Economic Literature, 13, 1-37.
Kay, N.M. (1979), "Corporate decision-making for allocation to research and
development", Research Policy, 8, 46-69.
Kay (1988), "The R&D function: corporate strategy and structure", in G. Dosi et al.
(eds.), Technical Change and Economic Theory, Pinter, London, 282-294.
Kaye, F. (1992), "A holistic view of technology in the food and drink industry", Food
Technology International - Europe, 5, 47-48.
Kline, S.J., and Rosenberg, N. (1986), "An overview of innovation", in R. Landau & N.Rosenberg (eds.), The Positive Sum Strategy: harnessing technology for economic
growth, National Academy Press, Washington, 275-305.
Law, B.A. (1990), "Tailoring enzymes for food users", Food Technology International -
Europe, 3, 161-165.
Lecraw, D.J. (1983), "Performance of transnational corporations in less developedcountries", Journal of International Business Studies.
Lundvall, B.-A. (ed.) (1992), National Systems of Innovation, Pinter, London.
McCorckle, C., jr. (ed.) (1988), Economics of Food Processing in the United States ,Academic Press.
Malerba and Orsenigo (1993), “The Dynamics of Evolution of Industries”, Evolutionary
Economics of Technological Change: assessment of results and new frontiers,EUNETIC, Strasbourg, 211-248.
Mansfield, E. (1968), The Economics of Technological Change, Norton, New York.
Marion, B.W. (1986), The Organization and Performance of the US Food System ,Lexington Books.
Mowery, D.C., and Rosenberg, N. (1989), Technology and the Pursuit of Economic
Growth, Cambridge University Press, Cambridge etc.
Narin, F., Noma, E. and Perry, R. (1987), "Patents as indicators of corporate
technological strength", Research Policy, 16, 143-155.
Nefussi, J. (1989), Les industries agro-alimentaires, Presses Universitaires de France,Paris.

144
Nelson, R.R., and Winter, S.G. (1974), "Neoclassical vs. evolutionary theories of
economic growth: critique and prospectus", Economic Journal, 84, 886-905.
OECD (1988), Industrial Revival through Technology, OECD, Paris.
OECD, Technology/Economy Programme (1992), Technology and the Economy: the key
relationships, OECD / HMSO, Paris / London.
Padilla, M., Ghersi, G., Allaya, M.C. and Allaya, M. (1983), Les cent premiers groupes
agro-industriels mondiaux, IAM, Montpellier.
Pavitt, K. (1984), "Sectoral patterns of technical change: towards a taxonomy and a
theory", Research Policy, 13, 343-374.
Poley, J. (1993), "Choosing new technologies in inspection and automation", Food
Technology International - Europe, 6, 83-84.
Porter, M.E. (1980), Competitive Strategy: techniques for analyzing industries and
competitors, The Free Press, London.
Prakke, F. (1988), "The financing of technical innovation", in A. Heertje (ed.),Innovation, Technology, and Finance, Blackwells, Oxford, 71-100.
Rama, R. (1994), "The outcome of innovation in the international food industry", inP.Cohendet and M. Willinger (eds.) Evolutionary Economics of Technological
Change: assessment of results and new frontiers , EUNETIC, Strasbourg, vol. 2,605-642.
Rama, R. (1996), "Empirical study on sources of innovation in international food and
beverage industry", Agribusiness, 12, 123-134.
Rastoin, J.-L., and Oncluoglu, S. (1992), "Les multinationales et le système alimentairemondial: tendances strategiques", Economies et Sociétés.
Raven, H., Lang, T., with Dumonteil, C. (1995), Off Our Trolleys: food, retailing and the
hypermarket economy, IPPR, London.
Rosenberg, N. (1963), "Technological change in the machine tool industry, 1840-1910",
Journal of Economic History, 23, 414-446.
Rosenberg, N. (1982), Inside the Black Box: technology and economics, CambridgeUniversity Press, Cambridge.
Ruigrok, W., and van Tulder, R. (1995), The Logic of International Restructuring,Routledge, London & New York.
Salais, R. and Storper, M. (1992), "The four 'worlds' of contemporary industry",
Cambridge Journal of Economics, 16, 169-193.

145
Santarelli, E. (1991), "Asset specificity, R&D financing, and the signalling properties of
the firm's financial structure", Economics of Innovation & New Technology, 1, 279-294.
Saráy, T. (1994), "Controlled atmosphere storage of vegetables: the possibilities", Food
Technology International - Europe, 7, 69-73.
Scherer, F.M. (1989), Innovation and Growth: Schumpeterian perspectives, MIT Press,Cambridge MA.
Schumpeter, J.A. (1911), Theory of Economic Development: an inquiry into profits,
capital, credit, interest, and the business cycle , (transl. R. Opie), HarvardUniversity Press, Cambridge MA, 1934.
Smith, F.W. (1991), "Food industry globalisation - an interview", Food Technology
International - Europe, 4, 22-24.[check title]
Smith, Keith (1994), “Interactions in knowledge systems: foundations, policyimplications and empirical mapping”, mimeo, STEP, Oslo.
Stoneman, P. and P. David (1986), "Adoption subsidies vs information provision as
instruments of technology policy", Economic Journal 96, Supp., pp 142-150.
Sweeting, R.C. (1991), "UK venture capital funds and the funding of new technology-
based businesses: process and relationships", Journal of Management Studies, 28.
Teece, D., and Pisano, G. (1994), "The dynamic capabilities of firms: an introduction",
Industrial & Corporate Change, 3, 537-556.
Telser, L.G. (1988), Theories of Competition, North-Holland.
Tomlins, R. (1995), "Cryogenic freezing and chilling of food", Food Technology
International - Europe, 8, 145-149.
Utterback, J.M. and Suárez, F.F. (1993), "Innovation, competition, and industry
structure", Research Policy, 22, 1-21.
Vieille, J.-N. (1996), "Analyse des performances des leaders mondiaux de l'agro-
alimentaire", Economie Rurale, 231.
von Tunzelmann, G.N. (1995a), Technology and Industrial Progress: the foundations of
economic growth, Edward Elgar, Aldershot.
von Tunzelmann, G.N. (1995b), "The transfer of process technologies in historicalperspective", mimeo, SPRU, University of Sussex.

146
von Tunzelmann, G.N. (1996), "Localized technological search and multi-technologycompanies", University of Sussex, SPRU, STEEP Discussion Paper No 29(forthcoming in Economics of Innovation and New Technology).
Wallin, P.J. (1995), "Advanced food manufacturing technology", Food Technology
International - Europe, 8, 112-114.
White, G. (1994), "Defining the true meaning of snacks", Food Technology International
- Europe, 7, 115-117.
Womersley, A. (1991), "Developments in approaches to process control", Food
Technology International - Europe, 4, 111-114.
Wright, G. (1990), "The origins of American industrial success, 1879-1940", American
Economic Review, 80, 651-668.
Wyckoff, A. (1994), “Investment, Innovation and Competitiveness: sectoral performancewithin the triad”, EIMS publication no.2.