AA The Asian Waterborne LNG Report - WikiLeaks · The Asian Waterborne LNG Report . 2 ... purchase...
206
Waterborne Energy, Inc. 2323 S. Shepherd Dr. Suite 1010 Houston, Texas 77019 713/526-1555 www.waterbornelng.com 26 Aug 2011 Vol. 8, Week 33 The Asian Waterborne LNG Report
Transcript of AA The Asian Waterborne LNG Report - WikiLeaks · The Asian Waterborne LNG Report . 2 ... purchase...

Waterborne Energy, Inc.
2323 S. Shepherd Dr. Suite 1010 Houston, Texas
77019 713/526-1555 www.waterbornelng.com
26 Aug 2011
Vol. 8, Week 33
The Asian Waterborne LNG Report

2
Waterborne Energy, Inc.
2323 S. Shepherd Dr. Suite 1010 Housmt, Texas
77019 713/526-1555 www.waterbornelng.com
26 Aug 2011
Vol. 8, Week 33
Notes of Interest LNG Imports of Japanese Gas Utilities Decline 15.7% in June LNG imports for Japan’s gas utilities in June were 1.893 million metric tons, a year-over-year drop of 15.7% that was driven by declining sales of city gas, according to Japan’s Ministry of Economy, Trade and Industry. It was the first year-over-year decrease in three months. Cumulative year-to-date LNG imports for the Japanese gas utilities through June were 13.40 million metric tons, up 2.5%. The gas utilities’ consumption of LNG increased during the month. They consumed 1.893 million metric tons of LNG in June, a year-over-year increase of 1.4%. Kansai Electric to Receive Nigerian Spot Cargo Next Week Japan next week will receive a spot LNG cargo from Nigeria that we learned about just before publishing and is not reflected in the data of this issue. The vessel “Trinity Glory” will deliver a cargo to Kansai Electric at the Himeji LNG terminal on August 30. Tokyo Electric Bought 70,000 Tonnes of Spot LNG in July Tokyo Electric bought 70,000 metric tons of LNG from the spot market in July reports Reuters, down 50,000 metric tons from the same month a year earlier. As a result of the Fukushima nuclear crisis that has caused Tokyo Electric to shut down a substantial amount of its nuclear generating capacity, Tokyo Electric during the previous three months of this year (April-June) purchased 1.2 million metric tons of LNG on a spot basis versus the 390,000 metric tons that the utility bought through the spot market during the same period last year. In July, Tokyo Electric’s LNG imports increased 323,000 metric tons or 18.7% year-over-year. “Gallina” has Damaged Rudder A Shell LNG tanker, the 136,967-cbm “Gallina”, is in a Dubai shipyard for repairs to the rudder, which was damaged while delivering a cargo from Trinidad to Dubai. The ship has been in Drydocks World in Dubai since August 12. It is not yet clear when the ship will return to service. Will South East Asia be the Next Growth Market for LNG Imports? (Part 3) The two countries in South East Asia that are most likely to follow Thailand, Singapore, Indonesia, and Malaysia as LNG importers are the Philippines and Vietnam. Currently, both countries are entirely dependent on domestic gas production to meet demand, which is mainly in the power sector. Both countries are now looking to LNG imports to meet growing demand, which is outpacing domestic production. For the Philippines,

3
Waterborne Energy, Inc.
2323 S. Shepherd Dr. Suite 1010 Housmt, Texas
77019 713/526-1555 www.waterbornelng.com
14 Aug 2011
Vol. 8, Week 31
LNG imports have been on the agenda for 10 years, but for Vietnam, the interest in LNG imports is more recent. Philippines: Gas supply in the Philippines is currently based on a single source, the Malampaya field, which is located in deep water offshore of the south west of the country. The field, which has proven reserves of 2.7 Tcf of natural gas and 85 million barrels of condensate, was discovered in the mid-1990s by a consortium of Shell (the operator) 45%, Unocal (now Chevron) 45%, and the Philippines National Oil Company (PNOC) 10%. The discovery was declared commercial in 1998, and the project was inaugurated in October 2001. The gas, which is produced using nine subsea wells, is piped 30km away to a platform located in shallower water where it is treated and the condensate is separated and exported. A 504-km pipeline links the platform to an onshore gas plant at Batangas on Luzon Island, 100 km south of the capital Manila. Nearly all the gas is used for power generation at three combined-cycle plants – Santa Rita (1 GW), San Lorenzo (0.5 GW), and Ilijan (1.2 GW). A small amount is delivered to a pilot compressed natural gas plant, which is used to fuel public utility vehicles.
LNG
0
2
4
6
8
10
2000
2001
2002
2003
2004
2005
2006
2007
2008
2009
2010
Vietnam Philippines
In b
illio
n c
ub
ic m
etre
s p
er a
nn
um
Figure 1: Gas Consumption in the Philippines and Vietnam 2000 to 2010

4
Waterborne Energy, Inc.
2323 S. Shepherd Dr. Suite 1010 Housmt, Texas
77019 713/526-1555 www.waterbornelng.com
14 Aug 2011
Vol. 8, Week 31
As Figure 1 shows, gas consumption built up quickly following the start-up of production from the Malampaya field in 2001 and reached 2.7 Bcm per annum (equivalent to 2 mmtpa of LNG) by 2003. Since 2007, it has averaged just over 3 Bcm per annum (equivalent to 2.2 mmtpa). Roughly one-third of the reserves have been produced since start-up. The existing gas production licence expires in 2024, but the Malampaya consortium has announced plans to invest up to $1.5 billion in the drilling of additional wells and the installation of a second platform to extend production by 15 years to 2039. The gas-fired power plants supplied by the Malampaya field currently account for roughly half of the power consumption on the main island Luzon and 32% of the total for the Philippines. Coal-fired generation is the second largest source of power supply, accounting for 27% of the total. Coal is followed by geothermal (17%), hydro (16%), and oil (9%). The country is the second largest producer of geothermal energy after the USA. Plans to increase gas-fired power capacity using LNG as the source of fuel supply date back to 2001 when a developer, GNPower, signed a letter of intent (LOI) to purchase 1.3 mmtpa of LNG from Indonesia’s Tangguh project, the first sales agreement of any type signed by that project. GNPower’s plans to build a combined-cycle gas turbine power plant and an LNG import terminal on Luzon Island made no progress, so the LOI lapsed. Several other power projects using imported LNG have been proposed over the last 10 years, but none have made any progress. One of the problems is that power generation is divided between several companies, none of which have the demand to support the construction of a conventional onshore receiving terminal. Furthermore, there is no gas grid to move regasified LNG around the islands that make up the country. The only company that says it is actively constructing an onshore terminal is Energy World Corporation (EWC), a Hong Kong-based company with no LNG experience. In August 2009, it held a ground breaking ceremony for an LNG import terminal and power project at Pagbilau in the south of Luzon Island. At that time, the plan was for the facility to import LNG for use in the Philippines and also to operate as a trading hub, receiving supply from a liquefaction plant that EWC said it would build at Senkang in the south of Sulawesi Island in Indonesia. There was no further news of the Pagbilau project until January of this year, when EWC announced that it had received a permit for the construction and operation of the terminal from the Secretary of the Philippines Ministry of Energy. The permit is for a period of 25

5
Waterborne Energy, Inc.
2323 S. Shepherd Dr. Suite 1010 Housmt, Texas
77019 713/526-1555 www.waterbornelng.com
26 Aug 2011
Vol. 8, Week 33
years, which can be extended. EWC said that the terminal will be built in two phases. The first phase will include a 130,000-cbm storage tank, regasification facilities, a jetty, and supporting infrastructure, which EWC estimates will cost $100 million. Phase two, which will include a second 130,000-cbm storage tank, is estimated to cost an additional $70 million. A 300-MW combined-cycle power plant will also be built on the site. EWC said in January that construction work would start before June and commercial operations would commence in 2012 or 2013. The cost estimate is only a fraction of those for other onshore receiving terminals, and the schedule for completion is much shorter, which raises questions over how realistic EWC’s plans are. There have been no reports so far of whether construction has commenced. The Senkang liquefaction plant has now apparently been abandoned. The latest indications are that LNG supply for Pagbilau will come from the 2-mmtpa onshore LNG plant that EWC has agreed to build in Papua New Guinea as part of the Interoil-led Gulf LNG project. Other companies in the Philippines are now looking to the development of LNG imports using floating storage and regas units (FSRUs). Several possible locations are being considered including Manila Bay and the Port of Davao on the southern island of Mindanao. Other options are the use of an FSRU as an import hub with smaller ships delivering LNG from the hub to small-scale terminals around the islands and the use of small ships to lift LNG from the Singapore terminal, when it comes into operation in 2013. Vietnam: The consumption of natural gas in Vietnam has been increasing since the 1990s when production commenced from offshore fields in the southern part of the country. The power sector now accounts for roughly 90% of gas consumption, which was 9.4 Bcm in 2010 (Figure 1). The remaining use is mainly in the industrial sector with a small amount in the transport sector. Gas-fired power accounted for 31.7% of power production last year. In the 1990s, optimistic projections for the potential size of the country’s offshore gas reserves and the level of production led to talk of the possibility of Vietnam’s becoming an LNG exporter. However, the drilling results from exploration did not live up to expectations, so demand growth has rapidly outpaced production. Thus, Vietnam now needs to import LNG. PetroVietnam is planning to build a 1-mmtpa (0.13-Bcf/d) capacity terminal with a 100,000-cbm storage tank at Thi Vai port, roughly 100 km south-east of Ho Chi Minh City. It would be supplied using

6
Waterborne Energy, Inc.
2323 S. Shepherd Dr. Suite 1010 Housmt, Texas
77019 713/526-1555 www.waterbornelng.com
26 Aug 2011
Vol. 8, Week 33
medium-sized LNG ships. Speaking at a conference in Singapore at the end of May 2011, Ngo Anh Hien, Deputy General Manager of PetroVietnam’s Gas Division, said that his company had submitted plans for the terminal to the government and expected approval imminently. However, that does not appear to have happened, and construction has not yet started. The plan is for the terminal to come into service in 2013 or 2014 at an estimated cost of $300 million. PetroVietnam is also reported to be completing a feasibility study for a second terminal to be located in the province of Binh Thuan, east of the capital. The initial capacity will be 2 mmtpa (0.26 Bcf/d), but there will be the potential for it to be eventually expanded to a capacity of 5 to 10 mmtpa (0.65 to 1.3 Bcf/d). The use of FSRUs to import LNG for power generation in the centre and north of the country, which are not connected to the pipeline network, is also being considered. Vietnam’s current gas-fired power plants are located in the south of the country close to the landfall of pipelines from the offshore gas fields. PetroVietnam has said that it has been in discussions with LNG suppliers in the Middle East and Australia. In late July, officials from its gas trading unit, PV Gas, met with a delegation from Qatargas to discuss possible long-term LNG supplies. Vietnam and the Philippines have some way to go before LNG imports become a reality, but in the medium-term, their demand could add to that of Thailand, which has already commenced LNG imports, Malaysia and Indonesia, which should start receiving LNG in 2012, and Singapore, which is set to follow in 2013. Overall, South East Asia could be receiving 15 to 20 mmtpa (1.95 to 2.6 Bcf/d) of LNG by the second half of the current decade. The region’s requirements will add to the growth of demand in the Pacific Basin and help support the development of new liquefaction capacity, especially in Australia. Contributing Editor: Andy Flower Korea Gas to Buy 5.64 Million Tonnes of LNG per Year from Shell and Total South Korea’s Ministry of Knowledge Economy (MKE) last week announced that it has given approval to Korean Gas to sign in September two finalized long-term LNG supply agreements with Shell and Total for the purchase of a combined 5.64 million metric tons of LNG per year. Under the agreement with Shell, Korea Gas will receive 3.64 million metric tons of LNG per year over 20 years from Shell’s Prelude floating LNG project in Australia, which is expected to start production sometime between

7
Waterborne Energy, Inc.
2323 S. Shepherd Dr. Suite 1010 Housmt, Texas
77019 713/526-1555 www.waterbornelng.com
26 Aug 2011
Vol. 8, Week 33
2015 and 2018. From 2013 to the start-up of the Prelude project, Shell will provide a combined 1 million metric tons of LNG per year to Korea Gas from the Nigeria LNG and Sakhalin-2 projects. Korea Gas will also acquire a 10% equity stake in the Prelude project. Under the agreement with Total, Total will supply 2 million metric tons of LNG per year to Korea Gas for 18 years starting in 2014. Total will source its volumes under the agreement primarily from Australia’s Ichthys LNG project (expected to become operational in 2016) and secondarily from the rest of Total’s LNG supply portfolio, which includes Nigeria, Norway, and Yemen. The two agreements will be enough to replace current LNG supply contracts with Indonesia, Malaysia, and Brunei totaling 4.7 million metric tons of LNG per year that will expire between 2013 and 2015. Petronas and Progress Energy Resources Finalize BC Shale Gas and LNG Deal Canada’s Progress Energy Resources and Malaysia’s Petronas earlier this month finalized an agreement to develop Progress’ Montney shale assets covering 607 sq. km in the foothills of northeast British Columbia and to study the feasibility of a liquefaction plant somewhere on Canada’s Pacific Coast that would use Montney shale gas as its feedstock. Petronas will pay C$1.07 billion to Progress for a 50% stake in Progress’ Montney shale assets, including the Altares, Lily, and Kahta reservoirs. 25% of this amount was paid in cash upon the closing of the deal. The rest of the acquisition price will be paid by Petronas in the form of funding 75% of Progress’ share of the project’s capital expenditures over the next five years to a total of C$802.5 million. The project, which currently has proven and probable gas reserves of 0.6 Tcf, will begin exploration drilling in the fourth quarter. Petronas and Progress have also formed an LNG export joint venture to perform a feasibility study on the proposed LNG plant, in which Petronas and Progress would own stakes of 80% and 20% respectively. Work on the feasibility study will begin immediately. If the feasibility study leads to a final investment decision to build the LNG plant, Petronas would provide a standby equity financing commitment of up to C$600 million for Progress’ capital requirements for the development of the LNG project. The project partners are envisioning the construction of a two-train liquefaction plant with an annual production capacity of 7.4 million metric tons that would export LNG to Asia. Petronas would be the operator of the LNG plant, but both companies would jointly market the plant’s LNG output.

8
Waterborne Energy, Inc.
2323 S. Shepherd Dr. Suite 1010 Housmt, Texas
77019 713/526-1555 www.waterbornelng.com
26 Aug 2011
Vol. 8, Week 33
Mundra LNG Terminal Receives State Approval India’s Gujarat state government recently approved the construction of the proposed LNG import terminal at the port of Mundra. Construction work will soon begin on the terminal. The terminal, which will have an annual receiving capacity of 5 million metric tons with an option to expand the capacity to 10 million metric tons, is being developed by a 50/50 joint venture of Adani Enterprises and state-owned Gujarat State Petroleum Corp. The project has awarded a front-end engineering and design contract to Belgium’s Tractebel and is in the process of selecting a consultant to assist in commercial negotiations for LNG supplies. 13 companies, including Poten & Partners, have submitted expressions of interest for the commercial consultant role. Adani wants to buy regasified LNG from the terminal for its planned 2,000-MW power generation plant in Mundra. In addition to supplying Adnai’s power plant, the terminal could supply natural gas to the states of Gujarat, Maharashtra, and Rajasthan. Tanker Conversion for Malaysian LNG Terminal Begins The Malaysia Marine and Heavy Engineering (MMHE) shipyard in Malaysia has started work on the conversion of one of two LNG tankers that will be used as floating storage units (FSUs) for Malaysia’s first LNG import terminal. In July, MMHE was awarded the contract to convert the 130,000-cbm “Tenaga Satu” into an FSU. The conversion of the second vessel to be used as an FSU for the terminal, the 130,000-cbm “Tenaga Empat”, will start in the near future at the Keppel Shipyard in Singapore. The new 3.8-mmtpa LNG import terminal, which will be located at Sungai Udang near Malacca, will have its regasifiers and a jetty located onshore, while nearby offshore, the two FSUs will provide storage. The terminal’s start-up is targeted for May 2012. Pakistan’s Tender Process for LNG Terminal Challenged in Supreme Court Pakistan’s tender process for the country’s first LNG receiving terminal is being challenged in the country’s Supreme Court just as the country’s previous proposed LNG terminal project was challenged in the same court. Government officials are accused of breaking government procurement rules and holding secret talks with foreign companies for personal gain. The court, which in April 2010 struck down the original award of the LNG import terminal and the LNG supplies contracts for

9
Waterborne Energy, Inc.
2323 S. Shepherd Dr. Suite 1010 Housmt, Texas
77019 713/526-1555 www.waterbornelng.com
26 Aug 2011
Vol. 8, Week 33
the Mashal LNG project because the lowest bid submitted was ignored in the selection process, has begun a hearing on the latest LNG import plan. In May, state-owned Sui Southern Gas Co. received expressions of interest from foreign and domestic companies for the supply of 500 MMcf of LNG per day from those companies’ own floating storage and regasification unit for up to 10 years, starting from early 2012. State Environment Minister Wants Tough Conditions on Wheatstone LNG Project The Western Australian state government’s Environment Minister last week said that he wants to impose 24 tough conditions on the environmental approval of Chevron’s proposed Wheatstone LNG project. He will consult with other ministers to obtain final agreement on the conditions for the project. He expects the consultation with state government ministers over the conditions to take a couple of weeks. The project requires environmental approval from both the state and federal Ministers for the Environment. The project has not yet received either environmental approval. Chevron expects to make a final investment decision on the project in the second half of this year. The project would involve the development of a two-train 8.9-mmtpa liquefaction plant on Western Australia’s Pilbara coast near Onslow. Besides project operator Chevron, shareholders in the project include Apache, Kuwait Foreign Petroleum Exploration Co., and Shell. Arrow LNG Awards FEED Contract Australia’s Arrow LNG project, a 50/50 joint venture of Shell and PetroChina, has awarded its front-end engineering and design (FEED) contract to a consortium of Chiyoda, CB&I, and Saipem. The FEED work will be carried out over the next 12 months. The proposed Arrow LNG project involves the development of a two-train 8-mmtpa liquefaction plant on Curtis Island near Gladstone, Queensland that will use CBM sourced from the Surat and Bowen Basins in Queensland as its feedstock. The project partners hope eventually to expand the plant’s annual capacity to 16 million metric tons. A final investment decision is expected to be made in the second half of 2012 with start-up targeted for between 2015 and 2017. China to Grant VAT Rebates on Gas Imports China's Ministry of Finance this week said that it will grant value-added tax (VAT)

10
Waterborne Energy, Inc.
2323 S. Shepherd Dr. Suite 1010 Housmt, Texas
77019 713/526-1555 www.waterbornelng.com
26 Aug 2011
Vol. 8, Week 33
rebates on natural gas imports when imported prices are higher than government-set domestic gas prices. A VAT of 13% is applicable to natural gas, and the VAT rebate will be based on the VAT on the difference between imported and domestic gas prices. The rebates will apply to LNG imports, the Central Asia-China gas pipeline, and other pipeline gas import projects that will come on line in the future. The tax rebates will be effective from January 1, 2011, through December 31, 2020. The new tax rebate policy should encourage higher spot LNG purchases by China, although current Asian spot prices of more than $15/MMbtu are likely too high for the tax rebates to make a difference in China’s LNG Imports in the near term. Quick Glance Netback Table ($/mmbtu)
2011 to 2015 Project Status
Project* # of Trains
Annual Capacity Estimated Start-up Date
Current Status
Pluto LNG (Australia) 1 4.8 mtpa (230 bcf) Q1 2012
Angola LNG (Angola) 1 5.2 mtpa (249 bcf) Mar 2012
PNG (Papua New Guinea) 2 6.6 mtpa (317 bcf) 2014
Curtis Island (Australia) 2 8.5 mtpa (408 bcf) 2014
Gorgon (Australia) 3 15 mtpa (721 bcf) 2014
Skikda (Algeria) 1 4.7 mtpa (225 bcf) 2015
Gladstone (Australia) 2 7.8 mtpa (374 bcf) 2015
Total 52.6 mtpa (2,529 bcf)
* All projects either under construction or highly likely
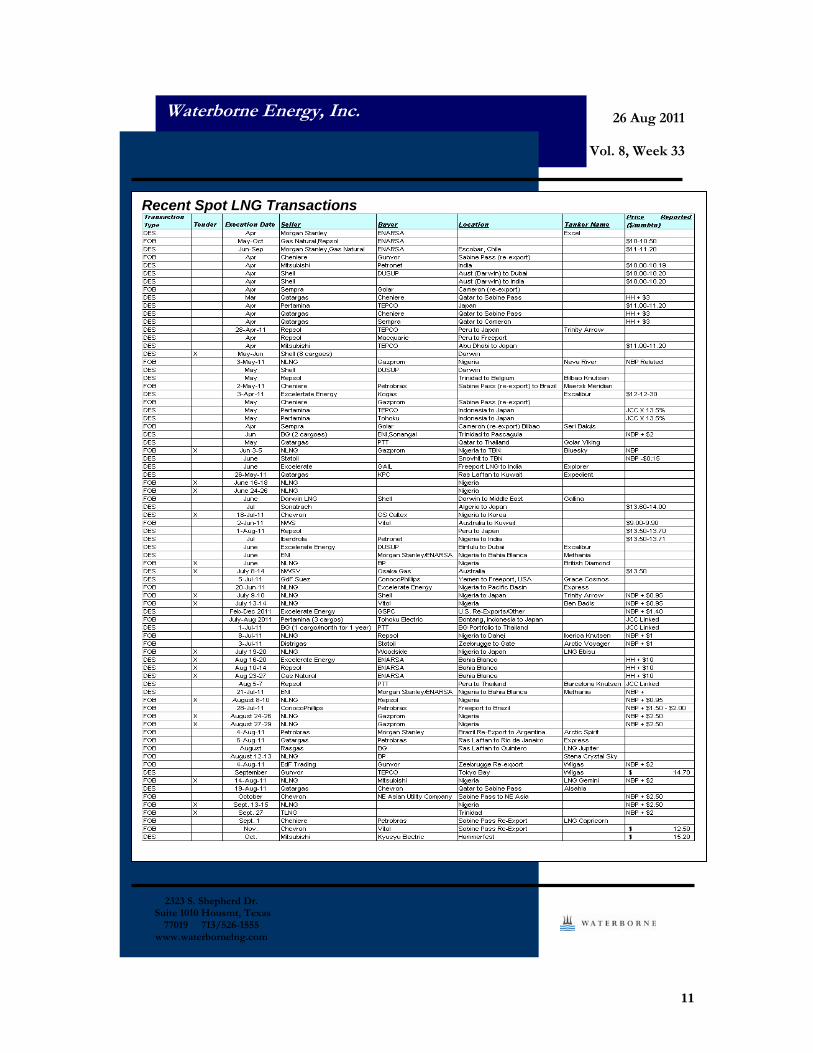
Recent Spot Transactions
11
Waterborne Energy, Inc.
2323 S. Shepherd Dr. Suite 1010 Housmt, Texas
77019 713/526-1555 www.waterbornelng.com
26 Aug 2011
Vol. 8, Week 33
Recent Spot LNG Transactions

12
Waterborne Energy, Inc.
2323 S. Shepherd Dr. Suite 1010 Housmt, Texas
77019 713/526-1555 www.waterbornelng.com
26 Aug 2011
Vol. 8, Week 33

13
14
Waterborne Energy, Inc.
2323 S. Shepherd Dr. Suite 1010 Houston, Texas
77019 713/526-1555 www.waterbornelng.com
26 Aug 2011
Vol. 8, Week 33
Asian Summary Data

15
Waterborne Energy, Inc.
2323 S. Shepherd Dr. Suite 1010 Houston, Texas
77019 713/526-1555 www.waterbornelng.com
26 Aug 2011
Vol. 8, Week 33
Total Asia

16
LNG Shipments Received In Asia by Destination Country (1000's of Metric Tons)
Jan Feb Mar Apr May Jun Jul Aug Sep Oct Nov Dec Total
China 879 663 986 945 1,005 1,253 1,055 984 0 0 0 0 7,771Dubai 0 93 0 0 260 188 193 66 0 0 0 0 801India 760 1,002 1,084 1,062 870 1,201 1,166 1,125 60 0 0 0 8,328Japan 6,387 6,372 6,497 6,471 5,461 6,105 7,091 6,707 432 0 0 0 51,524Kuwait 0 0 138 368 317 426 306 304 121 0 0 0 1,980South Korea 3,674 3,721 3,980 2,200 2,814 2,134 1,999 2,443 299 0 0 0 23,263Taiwan 995 661 856 1,012 1,042 1,047 1,188 1,316 139 0 0 0 8,255Thailand 0 0 0 0 59 128 145 225 0 0 0 0 5572011 Total 12,694 12,511 13,542 12,058 11,828 12,482 13,143 13,171 1,050 0 0 0 102,478 China 665 508 663 663 829 807 834 888 797 816 957 1,034 9,460Dubai 0 0 0 0 0 0 0 0 0 0 116 0 116India 704 575 697 770 636 667 698 831 1,004 916 851 953 9,302Japan 6,154 5,978 6,416 5,403 5,344 5,401 5,926 6,320 6,021 5,298 5,664 6,501 70,424Kuwait 0 0 60 123 323 303 328 377 318 239 0 0 2,071South Korea 3,523 3,484 3,652 2,360 2,067 2,013 2,056 2,100 2,350 2,707 3,489 4,262 34,061Taiwan 816 552 913 880 1,054 978 1,292 1,146 1,120 991 879 801 11,4222010 Total 11,862 11,096 12,400 10,199 10,253 10,168 11,133 11,661 11,611 10,967 11,956 13,551 136,856 China 269 268 322 264 642 453 668 524 572 606 451 604 5,643India 422 552 1,064 775 885 817 842 1,115 813 896 845 467 9,493Japan 5,721 5,365 5,641 5,331 4,577 5,016 5,587 5,380 5,503 5,058 5,407 6,229 64,816Kuwait 0 0 0 0 0 0 0 122 304 236 0 0 663South Korea 3,280 2,767 2,535 1,755 1,390 1,478 1,052 1,221 1,261 2,441 2,630 3,540 25,350Taiwan 421 418 645 630 918 935 928 919 968 923 733 673 9,1122009 Total 10,114 9,370 10,206 8,755 8,412 8,700 9,077 9,283 9,421 10,161 10,066 11,513 115,077
17
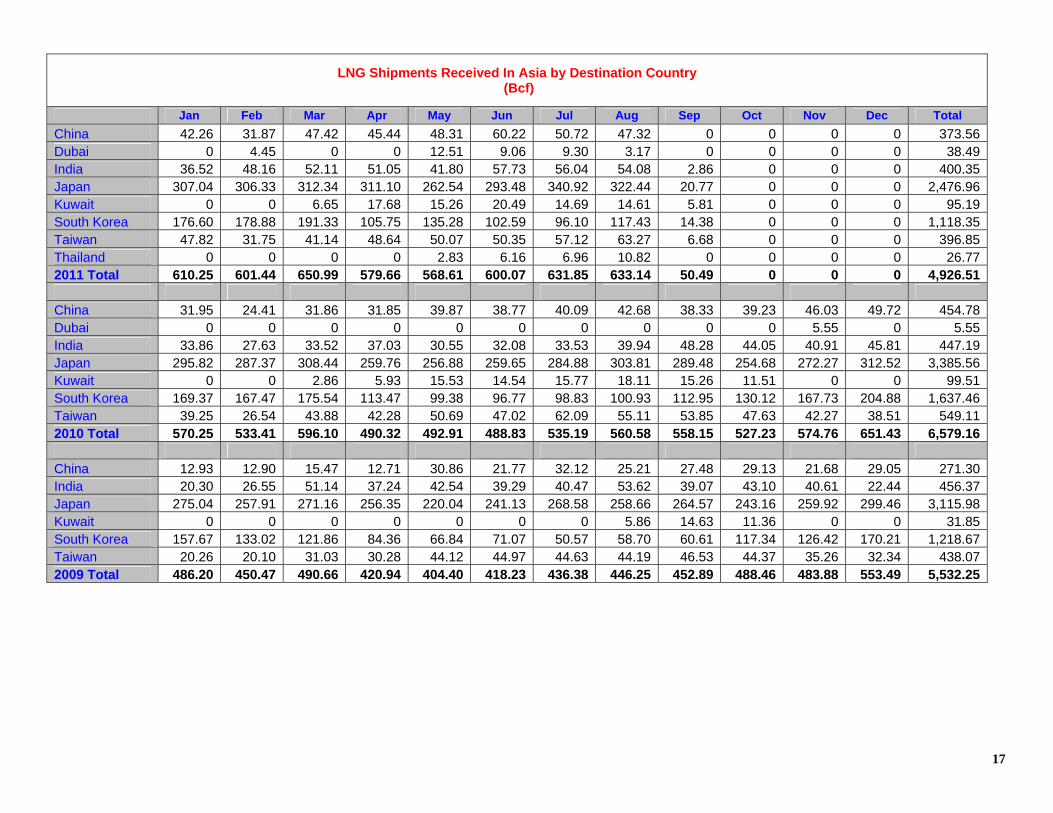
LNG Shipments Received In Asia by Destination Country (Bcf)
Jan Feb Mar Apr May Jun Jul Aug Sep Oct Nov Dec Total
China 42.26 31.87 47.42 45.44 48.31 60.22 50.72 47.32 0 0 0 0 373.56Dubai 0 4.45 0 0 12.51 9.06 9.30 3.17 0 0 0 0 38.49India 36.52 48.16 52.11 51.05 41.80 57.73 56.04 54.08 2.86 0 0 0 400.35Japan 307.04 306.33 312.34 311.10 262.54 293.48 340.92 322.44 20.77 0 0 0 2,476.96Kuwait 0 0 6.65 17.68 15.26 20.49 14.69 14.61 5.81 0 0 0 95.19South Korea 176.60 178.88 191.33 105.75 135.28 102.59 96.10 117.43 14.38 0 0 0 1,118.35Taiwan 47.82 31.75 41.14 48.64 50.07 50.35 57.12 63.27 6.68 0 0 0 396.85Thailand 0 0 0 0 2.83 6.16 6.96 10.82 0 0 0 0 26.772011 Total 610.25 601.44 650.99 579.66 568.61 600.07 631.85 633.14 50.49 0 0 0 4,926.51 China 31.95 24.41 31.86 31.85 39.87 38.77 40.09 42.68 38.33 39.23 46.03 49.72 454.78Dubai 0 0 0 0 0 0 0 0 0 0 5.55 0 5.55India 33.86 27.63 33.52 37.03 30.55 32.08 33.53 39.94 48.28 44.05 40.91 45.81 447.19Japan 295.82 287.37 308.44 259.76 256.88 259.65 284.88 303.81 289.48 254.68 272.27 312.52 3,385.56Kuwait 0 0 2.86 5.93 15.53 14.54 15.77 18.11 15.26 11.51 0 0 99.51South Korea 169.37 167.47 175.54 113.47 99.38 96.77 98.83 100.93 112.95 130.12 167.73 204.88 1,637.46Taiwan 39.25 26.54 43.88 42.28 50.69 47.02 62.09 55.11 53.85 47.63 42.27 38.51 549.112010 Total 570.25 533.41 596.10 490.32 492.91 488.83 535.19 560.58 558.15 527.23 574.76 651.43 6,579.16 China 12.93 12.90 15.47 12.71 30.86 21.77 32.12 25.21 27.48 29.13 21.68 29.05 271.30India 20.30 26.55 51.14 37.24 42.54 39.29 40.47 53.62 39.07 43.10 40.61 22.44 456.37Japan 275.04 257.91 271.16 256.35 220.04 241.13 268.58 258.66 264.57 243.16 259.92 299.46 3,115.98Kuwait 0 0 0 0 0 0 0 5.86 14.63 11.36 0 0 31.85South Korea 157.67 133.02 121.86 84.36 66.84 71.07 50.57 58.70 60.61 117.34 126.42 170.21 1,218.67Taiwan 20.26 20.10 31.03 30.28 44.12 44.97 44.63 44.19 46.53 44.37 35.26 32.34 438.072009 Total 486.20 450.47 490.66 420.94 404.40 418.23 436.38 446.25 452.89 488.46 483.88 553.49 5,532.25

18
LNG Shipments Received In Asia by Source (1000's of Metric Tons)
Jan Feb Mar Apr May Jun Jul Aug Sep Oct Nov Dec Total
Abu Dhabi 484 482 407 463 421 539 598 477 120 0 0 0 3,991Algeria 0 0 0 0 0 59 61 0 0 0 0 0 120Australia 1,766 1,502 1,848 1,465 1,667 1,731 1,849 1,604 120 0 0 0 13,552Brunei 614 614 618 585 524 461 586 517 0 0 0 0 4,519Egypt 258 208 336 118 183 122 308 128 75 0 0 0 1,736Equatorial Guinea 281 267 211 127 63 191 253 329 0 0 0 0 1,722Indonesia 1,761 1,744 1,756 1,753 1,697 1,631 1,677 1,614 0 0 0 0 13,633Malaysia 2,311 2,088 2,406 2,324 1,700 2,053 1,864 1,753 0 0 0 0 16,499Nigeria 248 374 371 123 361 479 816 836 186 0 0 0 3,794Norway 0 0 128 0 0 0 0 128 61 0 0 0 317Oman 686 745 686 686 565 498 567 748 61 0 0 0 5,242Peru 224 212 231 63 139 282 76 68 0 0 0 0 1,295Qatar 2,537 2,651 2,833 2,842 2,675 2,917 3,098 3,635 246 0 0 0 23,434Russia 1,042 850 1,037 917 897 772 588 713 0 0 0 0 6,816Trinidad 122 176 236 284 476 165 355 181 181 0 0 0 2,176US Re-export 0 0 0 0 114 122 0 0 0 0 0 0 236USA 25 339 102 35 21 0 39 39 0 0 0 0 600Yemen 335 260 335 270 324 460 406 400 0 0 0 0 2,7902011 Total 12,694 12,512 13,541 12,055 11,827 12,482 13,141 13,170 1,050 0 0 0 102,472 Abu Dhabi 489 487 490 492 547 550 489 491 425 425 496 475 5,856Algeria 60 0 0 0 0 0 0 0 0 0 0 0 60Australia 1,414 1,521 1,669 1,645 1,350 1,435 1,796 1,863 1,427 1,508 1,898 1,591 19,117Belgium Re-export 0 0 0 0 62 0 0 67 0 0 64 0 193Brunei 649 588 580 490 522 486 588 590 461 649 428 621 6,652Egypt 140 132 132 0 119 75 264 60 192 135 198 198 1,645Equatorial Guinea 263 397 254 125 202 128 257 195 249 136 184 349 2,739Indonesia 2,102 1,579 1,879 1,827 1,774 1,661 1,977 1,797 1,926 1,674 1,868 2,082 22,146Malaysia 2,111 1,832 2,399 1,486 1,887 1,679 2,001 1,829 1,937 1,947 1,863 2,156 23,127Nigeria 195 60 307 0 60 58 73 237 605 245 350 582 2,772Norway 0 0 0 0 0 0 0 55 0 0 0 133 188Oman 870 683 875 749 559 735 621 681 633 626 809 740 8,581Peru 0 0 0 0 0 0 0 0 0 0 0 68 68Qatar 2,302 2,395 2,554 2,170 1,957 2,007 2,067 2,311 2,320 2,179 2,495 2,780 27,537Russia 841 972 901 779 986 958 643 852 849 839 847 971 10,438Trinidad 194 184 187 189 61 58 61 164 225 227 166 242 1,958

19
USA 102 71 35 35 36 71 100 71 36 132 36 163 888Yemen 129 195 137 213 132 268 195 396 327 245 253 400 2,8902010 Total 11,861 11,096 12,399 10,200 10,254 10,169 11,132 11,659 11,612 10,967 11,955 13,551 136,855
LNG Shipments Received In Asia by Source (1000's of Metric Tons)
Abu Dhabi 480 477 481 421 555 426 365 545 541 421 188 368 5,268Algeria 0 0 0 0 0 0 0 0 57 0 0 61 118Australia 1,620 1,485 1,296 1,463 1,277 1,533 1,770 1,739 1,401 1,275 1,772 1,637 18,268Belgium Re-export 0 0 0 0 0 0 0 0 0 60 0 58 118Brunei 588 556 622 556 365 523 521 614 555 555 549 710 6,714Egypt 64 186 120 0 0 0 0 187 0 0 64 130 751Equatorial Guinea 255 249 267 254 249 457 243 64 137 368 263 382 3,188Indonesia 1,613 1,518 1,649 1,454 1,532 1,508 1,679 1,462 1,576 1,564 1,613 1,695 18,863Malaysia 2,309 1,931 2,171 1,990 1,539 1,970 1,777 1,631 1,598 2,126 1,736 1,952 22,730Nigeria 290 309 175 66 122 64 58 62 190 120 186 312 1,954Oman 682 617 861 554 496 372 443 369 624 556 750 807 7,131Qatar 1,891 1,698 2,131 1,637 1,663 1,416 1,782 1,958 1,931 2,282 2,215 2,146 22,750Russia 0 0 0 268 515 396 391 580 775 591 581 842 4,939Trinidad 259 306 387 61 64 0 0 0 0 171 111 184 1,543USA 62 40 48 31 36 35 47 71 36 71 35 35 547Yemen 0 0 0 0 0 0 0 0 0 0 0 195 1952009 Total 10,113 9,372 10,208 8,755 8,413 8,700 9,076 9,282 9,421 10,160 10,063 11,514 115,077

20
LNG Shipments Received In Asia by Source (Bcf)
Jan Feb Mar Apr May Jun Jul Aug Sep Oct Nov Dec Total
Abu Dhabi 23.28 23.16 19.58 22.27 20.26 25.92 28.76 22.93 5.78 0 0 0 191.96Algeria 0 0 0 0 0 2.82 2.93 0 0 0 0 0 5.74Australia 84.89 72.20 88.85 70.43 80.15 83.19 88.90 77.12 5.75 0 0 0 651.48Brunei 29.54 29.53 29.69 28.12 25.18 22.15 28.17 24.87 0 0 0 0 217.24Egypt 12.42 9.99 16.15 5.69 8.81 5.87 14.80 6.15 3.60 0 0 0 83.47Equatorial Guinea 13.51 12.82 10.14 6.12 3.03 9.19 12.18 15.79 0 0 0 0 82.79Indonesia 84.66 83.86 84.44 84.28 81.59 78.43 80.63 77.61 0 0 0 0 655.48Malaysia 111.10 100.38 115.69 111.74 81.74 98.70 89.62 84.28 0 0 0 0 793.24Nigeria 11.92 17.97 17.82 5.93 17.35 23.03 39.25 40.17 8.95 0 0 0 182.38Norway 0 0 6.16 0 0 0 0 6.15 2.93 0 0 0 15.24Oman 32.98 35.81 32.98 32.97 27.18 23.95 27.25 35.94 2.93 0 0 0 251.98Peru 10.79 10.18 11.10 3.05 6.67 13.54 3.67 3.26 0 0 0 0 62.27Qatar 121.95 127.43 136.18 136.63 128.59 140.25 148.93 174.76 11.83 0 0 0 1,126.56Russia 50.07 40.87 49.84 44.09 43.12 37.11 28.29 34.30 0 0 0 0 327.70Trinidad 5.85 8.44 11.37 13.66 22.89 7.94 17.08 8.71 8.72 0 0 0 104.66US Re-export 0 0 0 0 5.48 5.89 0 0 0 0 0 0 11.37USA 1.18 16.31 4.91 1.70 1.01 0 1.89 1.89 0 0 0 0 28.88Yemen 16.11 12.49 16.09 12.97 15.57 22.11 19.51 19.21 0 0 0 0 134.062011 Total 610.25 601.44 650.99 579.66 568.61 600.07 631.85 633.14 50.49 0 0 0 4,926.51 Abu Dhabi 23.51 23.40 23.54 23.67 26.28 26.44 23.50 23.62 20.41 20.42 23.85 22.84 281.48Algeria 2.90 0 0 0 0 0 0 0 0 0 0 0 2.90Australia 67.97 73.12 80.23 79.08 64.88 68.97 86.35 89.57 68.61 72.48 91.24 76.50 919.00Belgium Re-export 0 0 0 0 3.00 0 0 3.24 0 0 3.07 0 9.32Brunei 31.21 28.29 27.87 23.54 25.10 23.38 28.29 28.38 22.16 31.19 20.58 29.84 319.83Egypt 6.72 6.35 6.34 0 5.72 3.60 12.71 2.90 9.21 6.47 9.54 9.52 79.08Equatorial Guinea 12.67 19.10 12.21 6.00 9.73 6.14 12.37 9.39 11.98 6.55 8.86 16.77 131.78Indonesia 101.05 75.92 90.32 87.83 85.27 79.83 95.05 86.41 92.58 80.49 89.79 100.09 1,064.63Malaysia 101.46 88.08 115.33 71.43 90.74 80.72 96.21 87.93 93.11 93.63 89.59 103.62 1,111.83Nigeria 9.39 2.86 14.78 0 2.88 2.76 3.50 11.40 29.06 11.78 16.85 27.96 133.20Norway 0 0 0 0 0 0 0 2.62 0 0 0 6.41 9.03Oman 41.82 32.82 42.06 36.03 26.87 35.30 29.83 32.73 30.42 30.10 38.87 35.58 412.45Peru 0 0 0 0 0 0 0 0 0 0 0 3.26 3.26Qatar 110.68 115.13 122.79 104.31 94.07 96.49 99.38 111.10 111.51 104.74 119.95 133.67 1,323.82Russia 40.44 46.70 43.32 37.44 47.41 46.07 30.90 40.97 40.83 40.34 40.74 46.67 501.83Trinidad 9.35 8.85 9.01 9.07 2.93 2.81 2.93 7.87 10.83 10.91 7.98 11.64 94.18

21
USA 4.89 3.41 1.70 1.70 1.71 3.42 4.79 3.43 1.71 6.34 1.71 7.83 42.63Yemen 6.20 9.38 6.59 10.23 6.32 12.88 9.39 19.03 15.72 11.79 12.14 19.23 138.912010 Total 570.25 533.41 596.10 490.32 492.91 488.83 535.19 560.58 558.15 527.23 574.76 651.43 6,579.16
LNG Shipments Received In Asia by Source (Bcf)
Abu Dhabi 23.06 22.94 23.12 20.24 26.68 20.46 17.57 26.21 26.03 20.25 9.05 17.68 253.28Algeria 0 0 0 0 0 0 0 0 2.75 0 0 2.93 5.68Australia 77.90 71.38 62.28 70.35 61.41 73.69 85.11 83.58 67.35 61.28 85.19 78.69 878.21Belgium Re-export 0 0 0 0 0 0 0 0 0 2.88 0 2.78 5.66Brunei 28.29 26.71 29.91 26.71 17.56 25.15 25.07 29.52 26.69 26.68 26.40 34.12 322.82Egypt 3.07 8.93 5.75 0 0 0 0 8.98 0 0 3.09 6.25 36.07Equatorial Guinea 12.26 11.97 12.84 12.21 11.97 21.95 11.67 3.09 6.58 17.71 12.66 18.37 153.28Indonesia 77.55 72.98 79.27 69.96 73.63 72.48 80.71 70.30 75.78 75.21 77.54 81.48 906.89Malaysia 111.01 92.83 104.39 95.69 73.97 94.72 85.40 78.41 76.81 102.20 83.47 93.83 1,092.75Nigeria 13.95 14.85 8.39 3.18 5.86 3.07 2.79 2.98 9.11 5.76 8.94 14.99 93.86Oman 32.78 29.65 41.38 26.64 23.84 17.90 21.31 17.75 30.01 26.75 36.05 38.80 342.86Qatar 90.93 81.61 102.43 78.68 79.94 68.07 85.66 94.12 92.81 109.72 106.50 103.18 1,093.64Russia 0 0 0 12.87 24.75 19.02 18.81 27.88 37.25 28.41 27.94 40.47 237.42Trinidad 12.44 14.71 18.59 2.93 3.07 0 0 0 0 8.21 5.34 8.83 74.14USA 2.96 1.92 2.31 1.49 1.71 1.70 2.28 3.42 1.71 3.40 1.70 1.71 26.31Yemen 0 0 0 0 0 0 0 0 0 0 0 9.38 9.382009 Total 486.20 450.47 490.66 420.94 404.40 418.23 436.38 446.25 452.89 488.46 483.88 553.49 5,532.25
22
Waterborne Energy, Inc.
2323 S. Shepherd Dr. Suite 1010 Houston, Texas
77019 713/526-1555 www.waterbornelng.com
26 Aug 2011
Vol. 8, Week 33
China

23
LNG Shipments Received In China By Terminal (1000's of Metric Tons)
Jan Feb Mar Apr May Jun Jul Aug Sep Oct Nov Dec Total
Fujian 200 124 186 265 233 315 317 267 0 0 0 0 1,906Guangdong 483 418 582 505 569 677 559 581 0 0 0 0 4,375Rudong 0 0 0 0 64 82 64 78 0 0 0 0 287Shanghai (Mengtougou) 0 0 39 0 21 0 0 0 0 0 0 0 60Shanghai LNG 196 121 179 176 118 180 115 58 0 0 0 0 1,1422011 Total 879 663 986 945 1,005 1,253 1,055 984 0 0 0 0 7,771 Fujian 185 122 62 123 197 195 253 244 182 182 254 326 2,324Guangdong 352 326 480 482 517 551 520 520 506 516 546 587 5,902Rudong 0 0 0 0 0 0 0 0 0 0 0 0 0Shanghai (Mengtougou) 0 0 0 0 0 0 0 0 0 0 39 0 39Shanghai LNG 127 60 121 58 116 61 60 124 109 118 118 121 1,1942010 Total 665 508 663 663 829 807 834 888 797 816 957 1,034 9,460 Fujian 0 0 58 0 137 53 59 0 0 0 0 62 370Guangdong 269 260 255 256 505 378 565 486 495 484 412 403 4,767Rudong 0 0 0 0 0 0 0 0 0 0 0 0 0Shanghai (Mengtougou) 0 8 9 8 0 22 43 38 77 39 39 22 307Shanghai LNG 0 0 0 0 0 0 0 0 0 83 0 117 2002009 Total 269 268 322 264 642 453 668 524 572 606 451 604 5,643

24
LNG Shipments Received In China By Terminal (Bcf)
Jan Feb Mar Apr May Jun Jul Aug Sep Oct Nov Dec Total
Fujian 9.62 5.97 8.93 12.72 11.21 15.12 15.22 12.85 0 0 0 0 91.65Guangdong 23.23 20.09 27.99 24.28 27.33 32.54 26.90 27.95 0 0 0 0 210.32Rudong 0 0 0 0 3.07 3.92 3.07 3.75 0 0 0 0 13.82Shanghai (Mengtougou) 0 0 1.89 0 1.01 0 0 0 0 0 0 0 2.90Shanghai LNG 9.41 5.81 8.61 8.44 5.69 8.63 5.53 2.76 0 0 0 0 54.882011 Total 42.26 31.87 47.42 45.44 48.31 60.22 50.72 47.32 0 0 0 0 373.56 Fujian 8.89 5.85 2.96 5.92 9.45 9.35 12.18 11.74 8.75 8.75 12.23 15.67 111.74Guangdong 16.94 15.65 23.07 23.16 24.86 26.50 25.01 24.97 24.34 24.81 26.24 28.22 283.76Rudong 0 0 0 0 0 0 0 0 0 0 0 0 0Shanghai (Mengtougou) 0 0 0 0 0 0 0 0 0 0 1.89 0 1.89Shanghai LNG 6.12 2.91 5.83 2.77 5.56 2.93 2.90 5.96 5.25 5.67 5.67 5.83 57.402010 Total 31.95 24.41 31.86 31.85 39.87 38.77 40.09 42.68 38.33 39.23 46.03 49.72 454.78 Fujian 0 0 2.79 0 6.59 2.55 2.86 0 0 0 0 2.98 17.78Guangdong 12.93 12.50 12.27 12.31 24.27 18.16 27.18 23.37 23.78 23.25 19.79 19.36 229.17Rudong 0 0 0 0 0 0 0 0 0 0 0 0 0Shanghai (Mengtougou) 0 0.39 0.41 0.40 0 1.06 2.09 1.84 3.69 1.89 1.89 1.08 14.74Shanghai LNG 0 0 0 0 0 0 0 0 0 3.99 0 5.62 9.612009 Total 12.93 12.90 15.47 12.71 30.86 21.77 32.12 25.21 27.48 29.13 21.68 29.05 271.30

25
LNG Shipments Received In China By Source (1000's of Metric Tons)
Jan Feb Mar Apr May Jun Jul Aug Sep Oct Nov Dec Total
Abu Dhabi 0 0 0 0 0 0 0 0 0 0 0 0 0Algeria 0 0 0 0 0 0 0 0 0 0 0 0 0Australia 260 261 330 195 325 388 324 259 0 0 0 0 2,342Belgium Re-export 0 0 0 0 0 0 0 0 0 0 0 0 0Egypt 65 0 68 0 0 0 0 0 0 0 0 0 133Equatorial Guinea 0 0 0 66 0 0 0 0 0 0 0 0 66Indonesia 132 124 120 195 182 251 130 195 0 0 0 0 1,329Malaysia 65 61 285 176 179 237 115 58 0 0 0 0 1,176Nigeria 61 64 0 0 60 0 191 215 0 0 0 0 591Oman 0 0 0 0 0 0 0 0 0 0 0 0 0Peru 70 0 0 0 0 77 0 0 0 0 0 0 147Qatar 97 93 183 191 64 163 95 185 0 0 0 0 1,071Russia 0 60 0 0 0 64 0 0 0 0 0 0 124Trinidad 61 0 0 54 105 0 60 0 0 0 0 0 280USA 0 0 0 0 21 0 0 0 0 0 0 0 21Yemen 68 0 0 70 70 73 140 73 0 0 0 0 4942011 Total 879 663 986 947 1,006 1,253 1,055 985 0 0 0 0 7,774 Abu Dhabi 0 0 0 0 0 62 0 0 0 0 0 0 62Algeria 0 0 0 0 0 0 0 0 0 0 0 0 0Australia 195 326 326 260 326 324 324 455 259 325 456 326 3,902Belgium Re-export 0 0 0 0 0 0 0 0 0 0 0 0 0Egypt 0 0 0 0 0 0 0 0 0 0 0 0 0Equatorial Guinea 0 0 0 0 66 0 0 0 0 0 0 0 66Indonesia 59 60 62 123 130 195 253 180 182 182 254 195 1,875Malaysia 61 60 121 127 116 61 60 61 60 181 157 121 1,186Nigeria 68 0 61 0 0 0 73 0 0 0 0 0 202Oman 0 0 0 0 0 0 0 0 0 0 0 0 0Peru 0 0 0 0 0 0 0 0 0 0 0 0 0Qatar 89 62 93 90 191 92 56 64 183 64 90 188 1,262Russia 127 0 0 62 0 0 0 64 0 63 0 65 381Trinidad 0 0 0 0 0 0 0 0 49 0 0 0 49USA 0 0 0 0 0 0 0 0 0 0 0 0 0Yemen 65 0 0 0 0 73 67 63 65 0 0 140 4732010 Total 664 508 663 662 829 807 833 887 798 815 957 1,035 9,458

26
LNG Shipments Received In China By Source (1000's of Metric Tons)
Abu Dhabi 0 0 0 0 0 0 0 0 0 0 0 0 0Algeria 0 0 0 0 0 0 0 0 0 0 0 0 0Australia 269 260 255 195 313 314 315 365 371 256 321 254 3,488Belgium Re-export 0 0 0 0 0 0 0 0 0 0 0 58 58Egypt 0 0 0 0 0 0 0 0 0 0 0 58 58Equatorial Guinea 0 0 0 0 63 0 0 0 0 67 0 0 130Indonesia 0 0 0 0 137 53 59 0 0 0 0 62 311Malaysia 0 8 9 69 0 86 165 160 77 122 39 82 817Nigeria 0 0 0 0 0 0 0 0 64 0 0 0 64Oman 0 0 0 0 0 0 64 0 0 0 0 0 64Peru 0 0 0 0 0 0 0 0 0 0 0 0 0Qatar 0 0 0 0 0 0 0 0 60 160 90 90 400Russia 0 0 0 0 128 0 65 0 0 0 0 0 193Trinidad 0 0 58 0 0 0 0 0 0 0 0 0 58USA 0 0 0 0 0 0 0 0 0 0 0 0 0Yemen 0 0 0 0 0 0 0 0 0 0 0 0 02009 Total 269 268 322 264 641 453 668 525 572 605 450 604 5,641

27
LNG Shipments Received In China By Source (Bcf)
Jan Feb Mar Apr May Jun Jul Aug Sep Oct Nov Dec Total
Abu Dhabi 0 0 0 0 0 0 0 0 0 0 0 0 0Algeria 0 0 0 0 0 0 0 0 0 0 0 0 0Australia 12.52 12.56 15.86 9.35 15.61 18.66 15.58 12.47 0 0 0 0 112.62Belgium Re-export 0 0 0 0 0 0 0 0 0 0 0 0 0Egypt 3.13 0 3.29 0 0 0 0 0 0 0 0 0 6.41Equatorial Guinea 0 0 0 3.18 0 0 0 0 0 0 0 0 3.18Indonesia 6.34 5.97 5.78 9.35 8.73 12.05 6.24 9.35 0 0 0 0 63.81Malaysia 3.13 2.94 13.72 8.44 8.62 11.39 5.53 2.76 0 0 0 0 56.53Nigeria 2.92 3.06 0 0 2.86 0 9.20 10.32 0 0 0 0 28.36Oman 0 0 0 0 0 0 0 0 0 0 0 0 0Peru 3.37 0 0 0 0 3.69 0 0 0 0 0 0 7.05Qatar 4.66 4.47 8.78 9.17 3.07 7.85 4.58 8.91 0 0 0 0 51.48Russia 0 2.86 0 0 0 3.07 0 0 0 0 0 0 5.94Trinidad 2.93 0 0 2.58 5.06 0 2.86 0 0 0 0 0 13.43USA 0 0 0 0 1.01 0 0 0 0 0 0 0 1.01Yemen 3.28 0 0 3.37 3.37 3.50 6.73 3.50 0 0 0 0 23.742011 Total 42.26 31.87 47.42 45.44 48.31 60.22 50.72 47.32 0 0 0 0 373.56 Abu Dhabi 0 0 0 0 0 2.99 0 0 0 0 0 0 2.99Algeria 0 0 0 0 0 0 0 0 0 0 0 0 0Australia 9.40 15.65 15.65 12.50 15.66 15.59 15.59 21.89 12.44 15.63 21.90 15.67 187.57Belgium Re-export 0 0 0 0 0 0 0 0 0 0 0 0 0Egypt 0 0 0 0 0 0 0 0 0 0 0 0 0Equatorial Guinea 0 0 0 0 3.19 0 0 0 0 0 0 0 3.19Indonesia 2.85 2.88 2.96 5.92 6.26 9.35 12.18 8.67 8.75 8.75 12.23 9.35 90.16Malaysia 2.91 2.91 5.83 6.09 5.56 2.93 2.90 2.91 2.89 8.72 7.56 5.83 57.05Nigeria 3.29 0 2.95 0 0 0 3.50 0 0 0 0 0 9.75Oman 0 0 0 0 0 0 0 0 0 0 0 0 0Peru 0 0 0 0 0 0 0 0 0 0 0 0 0Qatar 4.25 2.97 4.46 4.33 9.20 4.42 2.69 3.08 8.79 3.08 4.33 9.02 60.64Russia 6.12 0 0 3.00 0 0 0 3.07 0 3.04 0 3.12 18.36Trinidad 0 0 0 0 0 0 0 0 2.36 0 0 0 2.36USA 0 0 0 0 0 0 0 0 0 0 0 0 0Yemen 3.12 0 0 0 0 3.50 3.23 3.05 3.11 0 0 6.73 22.732010 Total 31.95 24.41 31.86 31.85 39.87 38.77 40.09 42.68 38.33 39.23 46.03 49.72 454.78

28
LNG Shipments Received In China By Source (Bcf)
Abu Dhabi 0 0 0 0 0 0 0 0 0 0 0 0 0Algeria 0 0 0 0 0 0 0 0 0 0 0 0 0Australia 12.93 12.50 12.27 9.40 15.04 15.08 15.14 17.53 17.84 12.33 15.44 12.22 167.73Belgium Re-export 0 0 0 0 0 0 0 0 0 0 0 2.78 2.78Egypt 0 0 0 0 0 0 0 0 0 0 0 2.81 2.81Equatorial Guinea 0 0 0 0 3.05 0 0 0 0 3.23 0 0 6.28Indonesia 0 0 0 0 6.59 2.55 2.86 0 0 0 0 2.98 14.99Malaysia 0 0.39 0.41 3.32 0 4.13 7.93 7.68 3.69 5.88 1.89 3.92 39.24Nigeria 0 0 0 0 0 0 0 0 3.07 0 0 0 3.07Oman 0 0 0 0 0 0 3.07 0 0 0 0 0 3.07Peru 0 0 0 0 0 0 0 0 0 0 0 0 0Qatar 0 0 0 0 0 0 0 0 2.87 7.69 4.34 4.34 19.25Russia 0 0 0 0 6.17 0 3.12 0 0 0 0 0 9.29Trinidad 0 0 2.79 0 0 0 0 0 0 0 0 0 2.79USA 0 0 0 0 0 0 0 0 0 0 0 0 0Yemen 0 0 0 0 0 0 0 0 0 0 0 0 02009 Total 12.93 12.90 15.47 12.71 30.86 21.77 32.12 25.21 27.48 29.13 21.68 29.05 271.30

29
LNG Shipments Received In Fujian, China by Source (1000's of Metric Tons)
Jan Feb Mar Apr May Jun Jul Aug Sep Oct Nov Dec Total
Australia 0 0 66 0 0 0 0 0 0 0 0 0 66Indonesia 132 124 120 195 182 251 130 195 0 0 0 0 1,329Nigeria 0 0 0 0 0 0 127 73 0 0 0 0 200Russia 0 0 0 0 0 64 0 0 0 0 0 0 64Trinidad 0 0 0 0 52 0 60 0 0 0 0 0 112Yemen 68 0 0 70 0 0 0 0 0 0 0 0 1382011 Total 200 124 186 265 234 315 317 268 0 0 0 0 1,909 Australia 0 0 0 0 0 0 0 0 0 0 0 67 67Equatorial Guinea 0 0 0 0 66 0 0 0 0 0 0 0 66Indonesia 59 60 62 123 130 195 253 180 182 182 254 195 1,875Malaysia 61 0 0 0 0 0 0 0 0 0 0 0 61Qatar 0 62 0 0 0 0 0 0 0 0 0 0 62Russia 0 0 0 0 0 0 0 64 0 0 0 65 129Yemen 65 0 0 0 0 0 0 0 0 0 0 0 652010 Total 185 122 62 123 196 195 253 244 182 182 254 327 2,325 Indonesia 0 0 0 0 137 53 59 0 0 0 0 62 311Trinidad 0 0 58 0 0 0 0 0 0 0 0 0 582009 Total 0 0 58 0 137 53 59 0 0 0 0 62 369

30
LNG Shipments Received In Fujian, China by Source (Bcf)
Jan Feb Mar Apr May Jun Jul Aug Sep Oct Nov Dec Total
Australia 0 0 3.15 0 0 0 0 0 0 0 0 0 3.15Indonesia 6.34 5.97 5.78 9.35 8.73 12.05 6.24 9.35 0 0 0 0 63.81Nigeria 0 0 0 0 0 0 6.13 3.50 0 0 0 0 9.63Russia 0 0 0 0 0 3.07 0 0 0 0 0 0 3.07Trinidad 0 0 0 0 2.48 0 2.86 0 0 0 0 0 5.34Yemen 3.28 0 0 3.37 0 0 0 0 0 0 0 0 6.652011 Total 9.62 5.97 8.93 12.72 11.21 15.12 15.22 12.85 0 0 0 0 91.65 Australia 0 0 0 0 0 0 0 0 0 0 0 3.20 3.20Equatorial Guinea 0 0 0 0 3.19 0 0 0 0 0 0 0 3.19Indonesia 2.85 2.88 2.96 5.92 6.26 9.35 12.18 8.67 8.75 8.75 12.23 9.35 90.16Malaysia 2.91 0 0 0 0 0 0 0 0 0 0 0 2.91Qatar 0 2.97 0 0 0 0 0 0 0 0 0 0 2.97Russia 0 0 0 0 0 0 0 3.07 0 0 0 3.12 6.19Yemen 3.12 0 0 0 0 0 0 0 0 0 0 0 3.122010 Total 8.89 5.85 2.96 5.92 9.45 9.35 12.18 11.74 8.75 8.75 12.23 15.67 111.74 Indonesia 0 0 0 0 6.59 2.55 2.86 0 0 0 0 2.98 14.99Trinidad 0 0 2.79 0 0 0 0 0 0 0 0 0 2.792009 Total 0 0 2.79 0 6.59 2.55 2.86 0 0 0 0 2.98 17.78

31
LNG Shipments Received In Guangdong, China by Source (1000's of Metric Tons)
Jan Feb Mar Apr May Jun Jul Aug Sep Oct Nov Dec Total
Australia 260 261 264 195 325 388 324 259 0 0 0 0 2,276Egypt 65 0 68 0 0 0 0 0 0 0 0 0 133Equatorial Guinea 0 0 0 66 0 0 0 0 0 0 0 0 66Malaysia 0 0 67 0 61 57 0 0 0 0 0 0 185Nigeria 0 64 0 0 60 0 0 64 0 0 0 0 188Peru 0 0 0 0 0 77 0 0 0 0 0 0 77Qatar 97 93 183 191 0 82 95 185 0 0 0 0 926Trinidad 61 0 0 54 54 0 0 0 0 0 0 0 169Yemen 0 0 0 0 70 73 140 73 0 0 0 0 3562011 Total 483 418 582 506 570 677 559 581 0 0 0 0 4,376 Abu Dhabi 0 0 0 0 0 62 0 0 0 0 0 0 62Australia 195 326 326 260 326 324 324 455 259 325 456 259 3,835Malaysia 0 0 0 69 0 0 0 0 0 64 0 0 133Nigeria 68 0 61 0 0 0 73 0 0 0 0 0 202Qatar 89 0 93 90 191 92 56 64 183 64 90 188 1,200Russia 0 0 0 62 0 0 0 0 0 63 0 0 125Yemen 0 0 0 0 0 73 67 0 65 0 0 140 3452010 Total 352 326 480 481 517 551 520 519 507 516 546 587 5,902 Australia 269 260 255 195 313 314 315 365 371 256 321 254 3,488Egypt 0 0 0 0 0 0 0 0 0 0 0 58 58Equatorial Guinea 0 0 0 0 63 0 0 0 0 67 0 0 130Malaysia 0 0 0 61 0 64 121 122 0 0 0 0 368Nigeria 0 0 0 0 0 0 0 0 64 0 0 0 64Oman 0 0 0 0 0 0 64 0 0 0 0 0 64Qatar 0 0 0 0 0 0 0 0 60 160 90 90 400Russia 0 0 0 0 128 0 65 0 0 0 0 0 1932009 Total 269 260 255 256 504 378 565 487 495 483 411 402 4,765

32
LNG Shipments Received In Guangdong, China by Source (Bcf)
Jan Feb Mar Apr May Jun Jul Aug Sep Oct Nov Dec Total
Australia 12.52 12.56 12.71 9.35 15.61 18.66 15.58 12.47 0 0 0 0 109.47Egypt 3.13 0 3.29 0 0 0 0 0 0 0 0 0 6.41Equatorial Guinea 0 0 0 3.18 0 0 0 0 0 0 0 0 3.18Malaysia 0 0 3.22 0 2.92 2.76 0 0 0 0 0 0 8.91Nigeria 0 3.06 0 0 2.86 0 0 3.07 0 0 0 0 8.99Peru 0 0 0 0 0 3.69 0 0 0 0 0 0 3.69Qatar 4.66 4.47 8.78 9.17 0 3.92 4.58 8.91 0 0 0 0 44.49Trinidad 2.93 0 0 2.58 2.58 0 0 0 0 0 0 0 8.09Yemen 0 0 0 0 3.37 3.50 6.73 3.50 0 0 0 0 17.092011 Total 23.23 20.09 27.99 24.28 27.33 32.54 26.90 27.95 0 0 0 0 210.32 Abu Dhabi 0 0 0 0 0 2.99 0 0 0 0 0 0 2.99Australia 9.40 15.65 15.65 12.50 15.66 15.59 15.59 21.89 12.44 15.63 21.90 12.47 184.37Malaysia 0 0 0 3.32 0 0 0 0 0 3.06 0 0 6.37Nigeria 3.29 0 2.95 0 0 0 3.50 0 0 0 0 0 9.75Qatar 4.25 0 4.46 4.33 9.20 4.42 2.69 3.08 8.79 3.08 4.33 9.02 57.67Russia 0 0 0 3.00 0 0 0 0 0 3.04 0 0 6.05Yemen 0 0 0 0 0 3.50 3.23 0 3.11 0 0 6.73 16.562010 Total 16.94 15.65 23.07 23.16 24.86 26.50 25.01 24.97 24.34 24.81 26.24 28.22 283.76 Australia 12.93 12.50 12.27 9.40 15.04 15.08 15.14 17.53 17.84 12.33 15.44 12.22 167.73Egypt 0 0 0 0 0 0 0 0 0 0 0 2.81 2.81Equatorial Guinea 0 0 0 0 3.05 0 0 0 0 3.23 0 0 6.28Malaysia 0 0 0 2.91 0 3.07 5.84 5.84 0 0 0 0 17.67Nigeria 0 0 0 0 0 0 0 0 3.07 0 0 0 3.07Oman 0 0 0 0 0 0 3.07 0 0 0 0 0 3.07Qatar 0 0 0 0 0 0 0 0 2.87 7.69 4.34 4.34 19.25Russia 0 0 0 0 6.17 0 3.12 0 0 0 0 0 9.292009 Total 12.93 12.50 12.27 12.31 24.27 18.16 27.18 23.37 23.78 23.25 19.79 19.36 229.17

33
LNG Shipments Received In Rudong, China by Source (1000's of Metric Tons)
Jan Feb Mar Apr May Jun Jul Aug Sep Oct Nov Dec Total
Nigeria 0 0 0 0 0 0 64 78 0 0 0 0 142Qatar 0 0 0 0 64 82 0 0 0 0 0 0 1462011 Total 0 0 0 0 64 82 64 78 0 0 0 0 288 0 0 0 0 0 0 0 0 0 0 0 0 02010 Total 0 0 0 0 0 0 0 0 0 0 0 0 0 0 0 0 0 0 0 0 0 0 0 0 0 02009 Total 0 0 0 0 0 0 0 0 0 0 0 0 0
LNG Shipments Received In Rudong, China by Source (Bcf)
Jan Feb Mar Apr May Jun Jul Aug Sep Oct Nov Dec Total
Nigeria 0 0 0 0 0 0 3.07 3.75 0 0 0 0 6.83Qatar 0 0 0 0 3.07 3.92 0 0 0 0 0 0 6.992011 Total 0 0 0 0 3.07 3.92 3.07 3.75 0 0 0 0 13.82 0 0 0 0 0 0 0 0 0 0 0 0 02010 Total 0 0 0 0 0 0 0 0 0 0 0 0 0 0 0 0 0 0 0 0 0 0 0 0 0 02009 Total 0 0 0 0 0 0 0 0 0 0 0 0 0

34
LNG Shipments Received In Shanghai (Mengtougou), China by Source (1000's of Metric Tons)
Jan Feb Mar Apr May Jun Jul Aug Sep Oct Nov Dec Total
Malaysia 0 0 39 0 0 0 0 0 0 0 0 0 39USA 0 0 0 0 21 0 0 0 0 0 0 0 212011 Total 0 0 39 0 21 0 0 0 0 0 0 0 60 Malaysia 0 0 0 0 0 0 0 0 0 0 39 0 392010 Total 0 0 0 0 0 0 0 0 0 0 39 0 39 Malaysia 0 8 9 8 0 22 43 38 77 39 39 22 3052009 Total 0 8 9 8 0 22 43 38 77 39 39 22 305
LNG Shipments Received In Shanghai (Mengtougou), China by Source (Bcf)
Jan Feb Mar Apr May Jun Jul Aug Sep Oct Nov Dec Total
Malaysia 0 0 1.89 0 0 0 0 0 0 0 0 0 1.89USA 0 0 0 0 1.01 0 0 0 0 0 0 0 1.012011 Total 0 0 1.89 0 1.01 0 0 0 0 0 0 0 2.90 Malaysia 0 0 0 0 0 0 0 0 0 0 1.89 0 1.892010 Total 0 0 0 0 0 0 0 0 0 0 1.89 0 1.89 Malaysia 0 0.39 0.41 0.40 0 1.06 2.09 1.84 3.69 1.89 1.89 1.08 14.742009 Total 0 0.39 0.41 0.40 0 1.06 2.09 1.84 3.69 1.89 1.89 1.08 14.74

35
LNG Shipments Received In Shanghai LNG, China by Source (1000's of Metric Tons)
Jan Feb Mar Apr May Jun Jul Aug Sep Oct Nov Dec Total
Malaysia 65 61 179 176 118 180 115 58 0 0 0 0 952Nigeria 61 0 0 0 0 0 0 0 0 0 0 0 61Peru 70 0 0 0 0 0 0 0 0 0 0 0 70Russia 0 60 0 0 0 0 0 0 0 0 0 0 602011 Total 196 121 179 176 118 180 115 58 0 0 0 0 1,143 Malaysia 0 60 121 58 116 61 60 61 60 118 118 121 954Russia 127 0 0 0 0 0 0 0 0 0 0 0 127Trinidad 0 0 0 0 0 0 0 0 49 0 0 0 49Yemen 0 0 0 0 0 0 0 63 0 0 0 0 632010 Total 127 60 121 58 116 61 60 124 109 118 118 121 1,193 Belgium Re-export 0 0 0 0 0 0 0 0 0 0 0 58 58Malaysia 0 0 0 0 0 0 0 0 0 83 0 59 1422009 Total 0 0 0 0 0 0 0 0 0 83 0 117 200

36
LNG Shipments Received In Shanghai LNG, China by Source (Bcf)
Jan Feb Mar Apr May Jun Jul Aug Sep Oct Nov Dec Total
Malaysia 3.13 2.94 8.61 8.44 5.69 8.63 5.53 2.76 0 0 0 0 45.74Nigeria 2.92 0 0 0 0 0 0 0 0 0 0 0 2.92Peru 3.37 0 0 0 0 0 0 0 0 0 0 0 3.37Russia 0 2.86 0 0 0 0 0 0 0 0 0 0 2.862011 Total 9.41 5.81 8.61 8.44 5.69 8.63 5.53 2.76 0 0 0 0 54.88 Malaysia 0 2.91 5.83 2.77 5.56 2.93 2.90 2.91 2.89 5.67 5.67 5.83 45.87Russia 6.12 0 0 0 0 0 0 0 0 0 0 0 6.12Trinidad 0 0 0 0 0 0 0 0 2.36 0 0 0 2.36Yemen 0 0 0 0 0 0 0 3.05 0 0 0 0 3.052010 Total 6.12 2.91 5.83 2.77 5.56 2.93 2.90 5.96 5.25 5.67 5.67 5.83 57.40 Belgium Re-export 0 0 0 0 0 0 0 0 0 0 0 2.78 2.78Malaysia 0 0 0 0 0 0 0 0 0 3.99 0 2.84 6.832009 Total 0 0 0 0 0 0 0 0 0 3.99 0 5.62 9.61

37
Waterborne Energy, Inc.
2323 S. Shepherd Dr. Suite 1010 Houston, Texas
77019 713/526-1555 www.waterbornelng.com
26 Aug 2011
Vol. 8, Week 33
India

38
LNG Shipments Received In India By Terminal (1000's of Metric Tons)
Jan Feb Mar Apr May Jun Jul Aug Sep Oct Nov Dec Total
Dahej 760 780 961 928 701 1,013 950 896 60 0 0 0 7,048Hazira 0 222 123 134 168 188 215 229 0 0 0 0 1,2792011 Total 760 1,002 1,084 1,062 870 1,201 1,166 1,125 60 0 0 0 8,328 Dahej 704 575 697 698 636 575 637 637 816 856 698 857 8,384Hazira 0 0 0 73 0 93 61 194 188 61 153 95 9182010 Total 704 575 697 770 636 667 698 831 1,004 916 851 953 9,302 Dahej 358 552 810 650 755 559 747 797 746 777 559 372 7,683Hazira 64 0 254 125 130 259 95 318 67 119 285 95 1,8102009 Total 422 552 1,064 775 885 817 842 1,115 813 896 845 467 9,493
LNG Shipments Received In India By Terminal (Bcf)
Jan Feb Mar Apr May Jun Jul Aug Sep Oct Nov Dec Total
Dahej 36.52 37.48 46.20 44.63 33.71 48.68 45.69 43.08 2.86 0 0 0 338.84Hazira 0 10.69 5.91 6.42 8.09 9.05 10.35 11.00 0 0 0 0 61.512011 Total 36.52 48.16 52.11 51.05 41.80 57.73 56.04 54.08 2.86 0 0 0 400.35 Dahej 33.86 27.63 33.52 33.53 30.55 27.63 30.61 30.61 39.24 41.14 33.53 41.22 403.07Hazira 0 0 0 3.50 0 4.45 2.93 9.33 9.04 2.92 7.38 4.58 44.122010 Total 33.86 27.63 33.52 37.03 30.55 32.08 33.53 39.94 48.28 44.05 40.91 45.81 447.19 Dahej 17.21 26.55 38.94 31.26 36.30 26.86 35.91 38.33 35.86 37.36 26.90 17.88 369.35Hazira 3.09 0 12.20 5.99 6.24 12.44 4.56 15.29 3.22 5.74 13.71 4.56 87.022009 Total 20.30 26.55 51.14 37.24 42.54 39.29 40.47 53.62 39.07 43.10 40.61 22.44 456.37

39
LNG Shipments Received In India By Source (1000's of Metric Tons)
Jan Feb Mar Apr May Jun Jul Aug Sep Oct Nov Dec Total
Abu Dhabi 0 60 0 0 0 0 60 0 0 0 0 0 120Algeria 0 0 0 0 0 0 61 0 0 0 0 0 61Australia 0 0 0 43 0 0 0 0 0 0 0 0 43Belgium Re-export 0 0 0 0 0 0 0 0 0 0 0 0 0Egypt 0 0 130 0 66 61 61 0 0 0 0 0 318Equatorial Guinea 0 0 0 0 0 0 0 0 0 0 0 0 0Indonesia 0 0 0 0 0 0 0 0 0 0 0 0 0Malaysia 0 0 0 64 0 0 0 0 0 0 0 0 64Nigeria 0 64 126 0 0 127 187 61 0 0 0 0 565Norway 0 0 64 0 0 0 0 66 0 0 0 0 130Oman 0 0 0 64 0 64 0 0 0 0 0 0 128Qatar 760 739 697 770 682 823 738 931 0 0 0 0 6,140Russia 0 0 0 0 0 0 0 0 0 0 0 0 0Trinidad 0 0 0 120 61 60 60 0 60 0 0 0 361US Re-export 0 0 0 0 61 67 0 0 0 0 0 0 128USA 0 139 67 0 0 0 0 0 0 0 0 0 206Yemen 0 0 0 0 0 0 0 67 0 0 0 0 672011 Total 760 1,002 1,084 1,061 870 1,202 1,167 1,125 60 0 0 0 8,331 Abu Dhabi 0 0 0 0 0 0 0 0 0 0 0 0 0Algeria 0 0 0 0 0 0 0 0 0 0 0 0 0Australia 0 0 0 0 0 0 0 0 0 0 61 0 61Belgium Re-export 0 0 0 0 0 0 0 0 0 0 0 0 0Egypt 0 0 0 0 0 0 0 0 0 0 0 64 64Equatorial Guinea 0 0 0 0 0 0 0 0 117 0 0 0 117Indonesia 0 0 0 0 0 0 0 0 0 0 0 0 0Malaysia 0 0 0 0 0 0 0 0 0 0 0 0 0Nigeria 0 0 61 0 0 0 0 0 124 64 0 0 249Norway 0 0 0 0 0 0 0 0 0 0 0 0 0Oman 0 0 0 0 0 0 0 0 0 0 0 0 0Qatar 704 575 637 637 575 667 637 637 635 792 729 828 8,053Russia 0 0 0 0 0 0 0 0 0 0 0 0 0Trinidad 0 0 0 61 61 0 61 53 61 61 61 61 480US Re-export 0 0 0 0 0 0 0 0 0 0 0 0 0USA 0 0 0 0 0 0 0 0 0 0 0 0 0

40
Yemen 0 0 0 73 0 0 0 141 67 0 0 0 2812010 Total 704 575 698 771 636 667 698 831 1,004 917 851 953 9,305
LNG Shipments Received In India By Source (1000's of Metric Tons)
Abu Dhabi 0 0 0 0 68 0 0 64 0 0 0 0 132Algeria 0 0 0 0 0 0 0 0 57 0 0 0 57Australia 64 0 0 0 0 249 122 181 67 188 0 0 871Belgium Re-export 0 0 0 0 0 0 0 0 0 0 0 0 0Egypt 0 0 0 0 0 0 0 60 0 0 64 0 124Equatorial Guinea 0 0 0 0 0 65 0 0 0 0 64 0 129Indonesia 0 0 0 60 0 0 0 0 0 0 0 0 60Malaysia 0 0 64 124 0 0 0 0 0 0 0 0 188Nigeria 54 0 0 0 0 0 0 0 0 58 126 0 238Norway 0 0 0 0 0 0 0 0 0 0 0 0 0Oman 0 0 120 0 0 0 0 0 64 0 0 0 184Qatar 304 490 682 465 566 374 658 746 625 589 530 467 6,496Russia 0 0 0 65 187 130 62 65 0 0 0 0 509Trinidad 0 62 199 61 64 0 0 0 0 61 61 0 508US Re-export 0 0 0 0 0 0 0 0 0 0 0 0 0USA 0 0 0 0 0 0 0 0 0 0 0 0 0Yemen 0 0 0 0 0 0 0 0 0 0 0 0 02009 Total 422 552 1,065 775 885 818 842 1,116 813 896 845 467 9,496

41
LNG Shipments Received In India By Source (Bcf)
Jan Feb Mar Apr May Jun Jul Aug Sep Oct Nov Dec Total
Abu Dhabi 0 2.90 0 0 0 0 2.86 0 0 0 0 0 5.77Algeria 0 0 0 0 0 0 2.93 0 0 0 0 0 2.93Australia 0 0 0 2.07 0 0 0 0 0 0 0 0 2.07Belgium Re-export 0 0 0 0 0 0 0 0 0 0 0 0 0Egypt 0 0 6.26 0 3.17 2.93 2.93 0 0 0 0 0 15.29Equatorial Guinea 0 0 0 0 0 0 0 0 0 0 0 0 0Indonesia 0 0 0 0 0 0 0 0 0 0 0 0 0Malaysia 0 0 0 3.09 0 0 0 0 0 0 0 0 3.09Nigeria 0 3.05 6.05 0 0 6.13 9.01 2.93 0 0 0 0 27.17Norway 0 0 3.07 0 0 0 0 3.18 0 0 0 0 6.25Oman 0 0 0 3.07 0 3.07 0 0 0 0 0 0 6.15Qatar 36.52 35.53 33.52 37.03 32.78 39.54 35.45 44.75 0 0 0 0 295.12Russia 0 0 0 0 0 0 0 0 0 0 0 0 0Trinidad 0 0 0 5.79 2.93 2.86 2.86 0 2.86 0 0 0 17.30US Re-export 0 0 0 0 2.93 3.20 0 0 0 0 0 0 6.12USA 0 6.68 3.20 0 0 0 0 0 0 0 0 0 9.88Yemen 0 0 0 0 0 0 0 3.22 0 0 0 0 3.222011 Total 36.52 48.16 52.11 51.05 41.80 57.73 56.04 54.08 2.86 0 0 0 400.35 Abu Dhabi 0 0 0 0 0 0 0 0 0 0 0 0 0Algeria 0 0 0 0 0 0 0 0 0 0 0 0 0Australia 0 0 0 0 0 0 0 0 0 0 2.93 0 2.93Belgium Re-export 0 0 0 0 0 0 0 0 0 0 0 0 0Egypt 0 0 0 0 0 0 0 0 0 0 0 3.09 3.09Equatorial Guinea 0 0 0 0 0 0 0 0 5.62 0 0 0 5.62Indonesia 0 0 0 0 0 0 0 0 0 0 0 0 0Malaysia 0 0 0 0 0 0 0 0 0 0 0 0 0Nigeria 0 0 2.91 0 0 0 0 0 5.98 3.07 0 0 11.96Norway 0 0 0 0 0 0 0 0 0 0 0 0 0Oman 0 0 0 0 0 0 0 0 0 0 0 0 0Qatar 33.86 27.63 30.61 30.61 27.63 32.08 30.61 30.61 30.54 38.05 35.06 39.79 387.07Russia 0 0 0 0 0 0 0 0 0 0 0 0 0Trinidad 0 0 0 2.93 2.93 0 2.93 2.55 2.93 2.93 2.93 2.93 23.03US Re-export 0 0 0 0 0 0 0 0 0 0 0 0 0USA 0 0 0 0 0 0 0 0 0 0 0 0 0

42
Yemen 0 0 0 3.50 0 0 0 6.78 3.22 0 0 0 13.502010 Total 33.86 27.63 33.52 37.03 30.55 32.08 33.53 39.94 48.28 44.05 40.91 45.81 447.19
LNG Shipments Received In India By Source (Bcf)
Abu Dhabi 0 0 0 0 3.29 0 0 3.09 0 0 0 0 6.38Algeria 0 0 0 0 0 0 0 0 2.75 0 0 0 2.75Australia 3.09 0 0 0 0 11.95 5.88 8.69 3.21 9.06 0 0 41.88Belgium Re-export 0 0 0 0 0 0 0 0 0 0 0 0 0Egypt 0 0 0 0 0 0 0 2.87 0 0 3.09 0 5.95Equatorial Guinea 0 0 0 0 0 3.11 0 0 0 0 3.07 0 6.18Indonesia 0 0 0 2.87 0 0 0 0 0 0 0 0 2.87Malaysia 0 0 3.07 5.95 0 0 0 0 0 0 0 0 9.02Nigeria 2.58 0 0 0 0 0 0 0 0 2.81 6.05 0 11.44Norway 0 0 0 0 0 0 0 0 0 0 0 0 0Oman 0 0 5.75 0 0 0 0 0 3.07 0 0 0 8.82Qatar 14.63 23.57 32.77 22.37 27.21 17.99 31.62 35.85 30.04 28.30 25.47 22.44 312.26Russia 0 0 0 3.12 8.97 6.24 2.97 3.12 0 0 0 0 24.41Trinidad 0 2.98 9.55 2.93 3.07 0 0 0 0 2.93 2.93 0 24.40US Re-export 0 0 0 0 0 0 0 0 0 0 0 0 0USA 0 0 0 0 0 0 0 0 0 0 0 0 0Yemen 0 0 0 0 0 0 0 0 0 0 0 0 02009 Total 20.30 26.55 51.14 37.24 42.54 39.29 40.47 53.62 39.07 43.10 40.61 22.44 456.37

43
LNG Shipments Received In Dahej, India by Source (1000's of Metric Tons)
Jan Feb Mar Apr May Jun Jul Aug Sep Oct Nov Dec Total
Abu Dhabi 0 60 0 0 0 0 0 0 0 0 0 0 60Algeria 0 0 0 0 0 0 61 0 0 0 0 0 61Australia 0 0 0 43 0 0 0 0 0 0 0 0 43Egypt 0 0 130 0 66 0 61 0 0 0 0 0 257Malaysia 0 0 0 64 0 0 0 0 0 0 0 0 64Nigeria 0 0 64 0 0 0 127 61 0 0 0 0 252Norway 0 0 64 0 0 0 0 66 0 0 0 0 130Oman 0 0 0 64 0 64 0 0 0 0 0 0 128Qatar 760 580 637 637 514 823 642 769 0 0 0 0 5,362Trinidad 0 0 0 120 61 60 60 0 60 0 0 0 361US Re-export 0 0 0 0 61 67 0 0 0 0 0 0 128USA 0 139 67 0 0 0 0 0 0 0 0 0 2062011 Total 760 779 962 928 702 1,014 951 896 60 0 0 0 7,052 Australia 0 0 0 0 0 0 0 0 0 0 61 0 61Egypt 0 0 0 0 0 0 0 0 0 0 0 64 64Equatorial Guinea 0 0 0 0 0 0 0 0 117 0 0 0 117Nigeria 0 0 61 0 0 0 0 0 64 64 0 0 189Qatar 704 575 637 637 575 575 637 637 575 731 637 732 7,652Trinidad 0 0 0 61 61 0 0 0 61 61 0 61 3052010 Total 704 575 698 698 636 575 637 637 817 856 698 857 8,388 Abu Dhabi 0 0 0 0 68 0 0 0 0 0 0 0 68Algeria 0 0 0 0 0 0 0 0 57 0 0 0 57Australia 0 0 0 0 0 184 122 181 67 128 0 0 682Egypt 0 0 0 0 0 0 0 60 0 0 64 0 124Malaysia 0 0 64 124 0 0 0 0 0 0 0 0 188Nigeria 54 0 0 0 0 0 0 0 0 0 0 0 54Oman 0 0 60 0 0 0 0 0 64 0 0 0 124Qatar 304 490 556 465 566 374 563 557 558 589 434 372 5,828Russia 0 0 0 0 57 0 62 0 0 0 0 0 119Trinidad 0 62 130 61 64 0 0 0 0 61 61 0 4392009 Total 358 552 810 650 755 558 747 798 746 778 559 372 7,683

44
LNG Shipments Received In Dahej, India by Source (Bcf)
Jan Feb Mar Apr May Jun Jul Aug Sep Oct Nov Dec Total
Abu Dhabi 0 2.90 0 0 0 0 0 0 0 0 0 0 2.90Algeria 0 0 0 0 0 0 2.93 0 0 0 0 0 2.93Australia 0 0 0 2.07 0 0 0 0 0 0 0 0 2.07Egypt 0 0 6.26 0 3.17 0 2.93 0 0 0 0 0 12.36Malaysia 0 0 0 3.09 0 0 0 0 0 0 0 0 3.09Nigeria 0 0 3.05 0 0 0 6.10 2.93 0 0 0 0 12.08Norway 0 0 3.07 0 0 0 0 3.18 0 0 0 0 6.25Oman 0 0 0 3.07 0 3.07 0 0 0 0 0 0 6.15Qatar 36.52 27.89 30.61 30.61 24.69 39.54 30.88 36.97 0 0 0 0 257.71Trinidad 0 0 0 5.79 2.93 2.86 2.86 0 2.86 0 0 0 17.30US Re-export 0 0 0 0 2.93 3.20 0 0 0 0 0 0 6.12USA 0 6.68 3.20 0 0 0 0 0 0 0 0 0 9.882011 Total 36.52 37.48 46.20 44.63 33.71 48.68 45.69 43.08 2.86 0 0 0 338.84 Australia 0 0 0 0 0 0 0 0 0 0 2.93 0 2.93Egypt 0 0 0 0 0 0 0 0 0 0 0 3.09 3.09Equatorial Guinea 0 0 0 0 0 0 0 0 5.62 0 0 0 5.62Nigeria 0 0 2.91 0 0 0 0 0 3.07 3.07 0 0 9.06Qatar 33.86 27.63 30.61 30.61 27.63 27.63 30.61 30.61 27.63 35.14 30.61 35.21 367.75Trinidad 0 0 0 2.93 2.93 0 0 0 2.93 2.93 0 2.93 14.632010 Total 33.86 27.63 33.52 33.53 30.55 27.63 30.61 30.61 39.24 41.14 33.53 41.22 403.07 Abu Dhabi 0 0 0 0 3.29 0 0 0 0 0 0 0 3.29Algeria 0 0 0 0 0 0 0 0 2.75 0 0 0 2.75Australia 0 0 0 0 0 8.86 5.88 8.69 3.21 6.13 0 0 32.78Egypt 0 0 0 0 0 0 0 2.87 0 0 3.09 0 5.95Malaysia 0 0 3.07 5.95 0 0 0 0 0 0 0 0 9.02Nigeria 2.58 0 0 0 0 0 0 0 0 0 0 0 2.58Oman 0 0 2.88 0 0 0 0 0 3.07 0 0 0 5.96Qatar 14.63 23.57 26.71 22.37 27.21 17.99 27.06 26.77 26.83 28.30 20.88 17.88 280.21Russia 0 0 0 0 2.73 0 2.97 0 0 0 0 0 5.70Trinidad 0 2.98 6.27 2.93 3.07 0 0 0 0 2.93 2.93 0 21.112009 Total 17.21 26.55 38.94 31.26 36.30 26.86 35.91 38.33 35.86 37.36 26.90 17.88 369.35
45
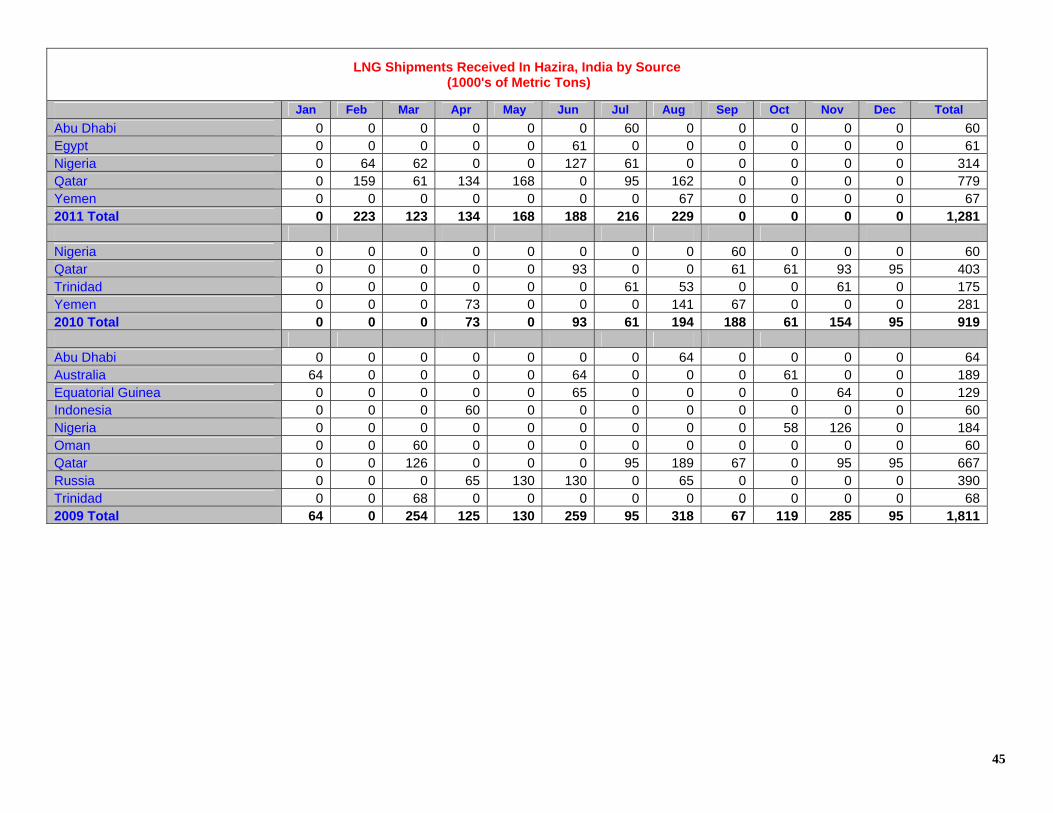
LNG Shipments Received In Hazira, India by Source (1000's of Metric Tons)
Jan Feb Mar Apr May Jun Jul Aug Sep Oct Nov Dec Total
Abu Dhabi 0 0 0 0 0 0 60 0 0 0 0 0 60Egypt 0 0 0 0 0 61 0 0 0 0 0 0 61Nigeria 0 64 62 0 0 127 61 0 0 0 0 0 314Qatar 0 159 61 134 168 0 95 162 0 0 0 0 779Yemen 0 0 0 0 0 0 0 67 0 0 0 0 672011 Total 0 223 123 134 168 188 216 229 0 0 0 0 1,281 Nigeria 0 0 0 0 0 0 0 0 60 0 0 0 60Qatar 0 0 0 0 0 93 0 0 61 61 93 95 403Trinidad 0 0 0 0 0 0 61 53 0 0 61 0 175Yemen 0 0 0 73 0 0 0 141 67 0 0 0 2812010 Total 0 0 0 73 0 93 61 194 188 61 154 95 919 Abu Dhabi 0 0 0 0 0 0 0 64 0 0 0 0 64Australia 64 0 0 0 0 64 0 0 0 61 0 0 189Equatorial Guinea 0 0 0 0 0 65 0 0 0 0 64 0 129Indonesia 0 0 0 60 0 0 0 0 0 0 0 0 60Nigeria 0 0 0 0 0 0 0 0 0 58 126 0 184Oman 0 0 60 0 0 0 0 0 0 0 0 0 60Qatar 0 0 126 0 0 0 95 189 67 0 95 95 667Russia 0 0 0 65 130 130 0 65 0 0 0 0 390Trinidad 0 0 68 0 0 0 0 0 0 0 0 0 682009 Total 64 0 254 125 130 259 95 318 67 119 285 95 1,811

46
LNG Shipments Received In Hazira, India by Source (Bcf)
Jan Feb Mar Apr May Jun Jul Aug Sep Oct Nov Dec Total
Abu Dhabi 0 0 0 0 0 0 2.86 0 0 0 0 0 2.86Egypt 0 0 0 0 0 2.93 0 0 0 0 0 0 2.93Nigeria 0 3.05 3.00 0 0 6.13 2.91 0 0 0 0 0 15.09Qatar 0 7.63 2.91 6.42 8.09 0 4.58 7.77 0 0 0 0 37.41Yemen 0 0 0 0 0 0 0 3.22 0 0 0 0 3.222011 Total 0 10.69 5.91 6.42 8.09 9.05 10.35 11.00 0 0 0 0 61.51 Nigeria 0 0 0 0 0 0 0 0 2.90 0 0 0 2.90Qatar 0 0 0 0 0 4.45 0 0 2.91 2.92 4.45 4.58 19.32Trinidad 0 0 0 0 0 0 2.93 2.55 0 0 2.93 0 8.40Yemen 0 0 0 3.50 0 0 0 6.78 3.22 0 0 0 13.502010 Total 0 0 0 3.50 0 4.45 2.93 9.33 9.04 2.92 7.38 4.58 44.12 Abu Dhabi 0 0 0 0 0 0 0 3.09 0 0 0 0 3.09Australia 3.09 0 0 0 0 3.09 0 0 0 2.93 0 0 9.10Equatorial Guinea 0 0 0 0 0 3.11 0 0 0 0 3.07 0 6.18Indonesia 0 0 0 2.87 0 0 0 0 0 0 0 0 2.87Nigeria 0 0 0 0 0 0 0 0 0 2.81 6.05 0 8.86Oman 0 0 2.86 0 0 0 0 0 0 0 0 0 2.86Qatar 0 0 6.05 0 0 0 4.56 9.08 3.22 0 4.58 4.56 32.05Russia 0 0 0 3.12 6.24 6.24 0 3.12 0 0 0 0 18.72Trinidad 0 0 3.29 0 0 0 0 0 0 0 0 0 3.292009 Total 3.09 0 12.20 5.99 6.24 12.44 4.56 15.29 3.22 5.74 13.71 4.56 87.02
47
Waterborne Energy, Inc.
2323 S. Shepherd Dr. Suite 1010 Houston, Texas
77019 713/526-1555 www.waterbornelng.com
26 Aug 2011
Vol. 8, Week 33
Japan

48
Waterborne Energy, Inc.
2323 S. Shepherd Dr. Suite 1010 Houston, Texas
77019 713/526-1555 www.waterbornelng.com
26 Aug 2011
Vol. 8, Week 33
Total Japan

49
LNG Shipments Received In Japan By Terminal (1000's of Metric Tons)
Jan Feb Mar Apr May Jun Jul Aug Sep Oct Nov Dec Total
Chita 798 836 703 714 687 732 822 883 121 0 0 0 6,296Fukuoka 25 25 38 42 25 25 25 25 0 0 0 0 229Futtsu 857 796 788 887 766 846 937 818 61 0 0 0 6,756Hatsukaichi 46 36 17 45 19 27 29 46 0 0 0 0 264Higashi-Ohgishima / Ohgishima 859 681 922 732 859 673 911 738 124 0 0 0 6,498Himeji 494 520 388 440 353 412 626 478 0 0 0 0 3,712Kagoshima 0 10 10 0 0 0 9 9 0 0 0 0 37Mizushima 56 56 63 56 119 53 55 126 0 0 0 0 585Nagasaki 8 8 4 8 8 8 0 8 0 0 0 0 54Negishi 398 435 356 441 271 360 377 335 0 0 0 0 2,973Nihonkai LNG Niigata 237 510 347 412 299 406 394 501 64 0 0 0 3,170Oita 128 128 191 128 182 189 188 258 0 0 0 0 1,392Sakai / Senboku 792 569 728 816 622 658 882 545 62 0 0 0 5,673Sakaide 0 61 0 60 0 58 0 58 0 0 0 0 237Shin Minato Works 8 17 8 0 0 0 0 0 0 0 0 0 34Sodegaura 802 814 1,139 789 714 843 866 894 0 0 0 0 6,862Sodeshi 121 61 123 124 61 63 121 65 0 0 0 0 738Tobata 223 224 181 183 121 241 186 321 0 0 0 0 1,681Yanai 124 118 56 241 0 63 181 174 0 0 0 0 958Yokkaichi / Kawagoe 410 466 435 352 357 446 482 426 0 0 0 0 3,3752011 Total 6,387 6,372 6,497 6,471 5,461 6,105 7,091 6,707 432 0 0 0 51,524 Chita 799 770 661 499 549 694 678 784 823 508 839 821 8,426Fukuoka 17 17 16 34 17 25 17 33 8 33 16 33 267Futtsu 704 708 862 767 672 649 838 868 799 477 642 848 8,834Hatsukaichi 35 27 19 35 46 27 8 19 37 37 37 27 354Higashi-Ohgishima / Ohgishima 790 702 834 671 688 682 736 823 927 538 790 786 8,966Himeji 435 642 473 449 416 343 531 473 346 284 289 379 5,061Kagoshima 10 10 10 0 0 0 19 27 17 8 9 8 119Mizushima 55 55 64 56 55 62 62 63 61 64 62 64 723Nagasaki 17 8 16 0 9 0 17 17 17 0 8 8 117Negishi 346 327 478 319 373 338 382 396 278 464 275 425 4,402Nihonkai LNG Niigata 319 304 359 234 234 232 233 230 229 268 229 304 3,174Oita 126 126 121 240 186 55 129 127 190 129 128 118 1,674Sakai / Senboku 848 729 756 695 574 848 622 738 658 706 700 780 8,654

50
Sakaide 60 0 0 61 0 61 0 57 0 61 0 58 358Shin Minato Works 8 17 16 9 17 17 8 17 17 17 8 17 167Sodegaura 766 743 965 639 871 607 784 962 767 883 750 1,029 9,765Sodeshi 64 58 66 121 59 121 58 57 61 122 128 62 976Tobata 169 165 230 111 171 112 226 168 168 109 168 167 1,965Yanai 117 120 172 119 117 179 120 62 147 142 120 173 1,587Yokkaichi / Kawagoe 469 449 296 346 289 349 460 400 472 448 465 394 4,8372010 Total 6,154 5,978 6,416 5,403 5,344 5,401 5,926 6,320 6,021 5,298 5,664 6,501 70,424
LNG Shipments Received In Japan By Terminal (1000's of Metric Tons)
Chita 645 700 751 527 580 529 738 773 694 656 671 833 8,096Fukuoka 25 25 24 33 16 41 25 25 25 17 25 8 289Futtsu 793 664 817 609 672 552 715 604 672 745 692 725 8,261Hatsukaichi 44 19 27 35 27 36 36 37 17 46 36 27 388Higashi-Ohgishima / Ohgishima 752 690 687 588 611 661 549 676 783 478 660 717 7,851Himeji 380 420 448 340 266 286 552 412 382 345 563 521 4,916Kagoshima 10 19 19 0 10 0 10 9 10 0 19 19 125Mizushima 39 0 63 64 56 55 56 63 64 58 64 56 639Nagasaki 17 0 8 8 8 0 8 8 8 8 8 17 99Negishi 280 438 428 365 249 281 272 441 218 316 256 473 4,016Nihonkai LNG Niigata 346 229 331 438 228 294 283 267 282 306 330 291 3,624Oita 196 147 94 113 112 229 66 120 55 64 121 129 1,445Sakai / Senboku 626 785 590 492 399 406 662 531 552 594 527 702 6,865Shin Minato Works 0 17 8 17 8 16 16 0 16 8 17 8 132Sodegaura 814 655 826 972 640 865 774 724 850 764 722 944 9,552Sodeshi 58 58 0 57 55 65 57 0 60 65 0 61 535Tobata 167 164 150 108 167 168 174 173 229 112 114 168 1,893Yanai 106 99 17 173 119 176 121 111 111 119 167 119 1,438Yokkaichi / Kawagoe 424 236 355 393 353 355 471 406 477 356 415 411 4,6512009 Total 5,721 5,365 5,641 5,331 4,577 5,016 5,587 5,380 5,503 5,058 5,407 6,229 64,816

51
LNG Shipments Received In Japan By Terminal (Bcf)
Jan Feb Mar Apr May Jun Jul Aug Sep Oct Nov Dec Total
Chita 38.38 40.20 33.77 34.35 33.02 35.19 39.50 42.43 5.83 0 0 0 302.67 Fukuoka 1.21 1.21 1.81 2.00 1.18 1.19 1.20 1.20 0 0 0 0 11.00 Futtsu 41.20 38.25 37.90 42.62 36.83 40.69 45.06 39.30 2.92 0 0 0 324.77 Hatsukaichi 2.21 1.71 0.81 2.15 0.89 1.30 1.39 2.21 0 0 0 0 12.67 Higashi-Ohgishima / Ohgishima 41.30 32.74 44.32 35.20 41.28 32.34 43.81 35.46 5.95 0 0 0 312.38 Himeji 23.74 25.02 18.63 21.16 16.99 19.82 30.09 22.99 0 0 0 0 178.44 Kagoshima 0 0.49 0.48 0 0 0 0.41 0.41 0 0 0 0 1.80 Mizushima 2.69 2.68 3.04 2.71 5.73 2.57 2.66 6.05 0 0 0 0 28.14 Nagasaki 0.40 0.41 0.20 0.39 0.39 0.41 0 0.40 0 0 0 0 2.60 Negishi 19.13 20.91 17.10 21.20 13.02 17.32 18.10 16.12 0 0 0 0 142.91 Nihonkai LNG Niigata 11.41 24.51 16.66 19.82 14.38 19.50 18.95 24.10 3.09 0 0 0 152.41 Oita 6.17 6.15 9.20 6.15 8.73 9.06 9.06 12.40 0 0 0 0 66.93 Sakai / Senboku 38.06 27.37 35.00 39.23 29.88 31.63 42.38 26.21 2.98 0 0 0 272.74 Sakaide 0 2.93 0 2.90 0 2.77 0 2.76 0 0 0 0 11.36 Shin Minato Works 0.40 0.81 0.40 0 0 0 0 0 0 0 0 0 1.61 Sodegaura 38.57 39.15 54.75 37.95 34.34 40.55 41.63 42.97 0 0 0 0 329.91 Sodeshi 5.80 2.94 5.93 5.96 2.91 3.01 5.82 3.12 0 0 0 0 35.49 Tobata 10.71 10.79 8.72 8.80 5.80 11.61 8.97 15.43 0 0 0 0 80.83 Yanai 5.96 5.68 0 11.59 0 3.06 8.71 8.38 0 0 0 0 46.07 Yokkaichi / Kawagoe 19.69 22.39 20.93 16.94 17.17 21.46 23.18 20.47 0 0 0 0 162.23 2011 Total 307.04 306.33 312.34 311.10 262.54 293.48 340.92 322.44 20.77 0 0 0 2,476.96 Chita 38.43 37.04 31.80 23.97 26.39 33.37 32.61 37.70 39.55 24.44 40.32 39.47 405.08 Fukuoka 0.80 0.81 0.79 1.64 0.82 1.20 0.80 1.61 0.40 1.61 0.77 1.61 12.85 Futtsu 33.84 34.04 41.46 36.87 32.29 31.18 40.28 41.74 38.43 22.92 30.88 40.76 424.68 Hatsukaichi 1.69 1.29 0.90 1.70 2.21 1.32 0.40 0.90 1.79 1.76 1.79 1.28 17.03 Higashi-Ohgishima / Ohgishima 37.97 33.76 40.07 32.27 33.07 32.81 35.37 39.56 44.55 25.86 37.98 37.78 431.05 Himeji 20.93 30.86 22.76 21.59 20.00 16.51 25.53 22.72 16.64 13.64 13.90 18.20 243.30 Kagoshima 0.48 0.48 0.49 0 0 0 0.90 1.32 0.83 0.40 0.41 0.40 5.72 Mizushima 2.62 2.66 3.06 2.70 2.66 2.98 3.00 3.01 2.93 3.08 2.98 3.06 34.74 Nagasaki 0.80 0.40 0.79 0 0.41 0 0.80 0.81 0.80 0 0.39 0.40 5.61 Negishi 16.63 15.74 23.00 15.33 17.95 16.24 18.35 19.06 13.37 22.29 13.20 20.45 211.61 Nihonkai LNG Niigata 15.33 14.59 17.27 11.23 11.26 11.15 11.20 11.03 10.99 12.90 11.02 14.60 152.58 Oita 6.04 6.05 5.79 11.51 8.95 2.66 6.19 6.08 9.14 6.19 6.15 5.69 80.46 Sakai / Senboku 40.75 35.04 36.36 33.40 27.59 40.74 29.89 35.49 31.65 33.96 33.66 37.48 416.01

52
Sakaide 2.88 0 0 2.91 0 2.91 0 2.76 0 2.71 0 2.76 16.93 Shin Minato Works 0.40 0.81 0.79 0.41 0.82 0.80 0.40 0.80 0.80 0.80 0.39 0.80 8.03 Sodegaura 36.81 35.70 46.41 30.70 41.88 29.18 37.68 46.23 36.86 42.44 36.07 49.48 469.43 Sodeshi 3.09 2.79 3.16 5.80 2.82 5.84 2.76 2.76 2.91 5.84 6.18 2.99 46.94 Tobata 8.12 7.95 11.07 5.33 8.24 5.37 10.85 8.06 8.08 5.25 8.09 8.04 94.45 Yanai 5.63 5.75 8.26 5.75 5.62 8.61 5.75 2.95 7.08 7.07 5.78 8.33 76.56 Yokkaichi / Kawagoe 22.57 21.60 14.22 16.64 13.91 16.77 22.12 19.21 22.69 21.52 22.34 18.93 232.52 2010 Total 295.82 287.37 308.44 259.76 256.88 259.65 284.88 303.81 289.48 254.68 272.27 312.52 3,385.56
LNG Shipments Received In Japan By Terminal (Bcf)
Chita 30.98 33.67 36.09 25.32 27.87 25.42 35.49 37.16 33.34 31.56 32.24 40.04 389.20 Fukuoka 1.20 1.21 1.15 1.61 0.77 1.98 1.19 1.20 1.18 0.81 1.20 0.40 13.91 Futtsu 38.14 31.91 39.26 29.29 32.31 26.55 34.38 29.05 32.32 35.83 33.28 34.83 397.16 Hatsukaichi 2.13 0.93 1.29 1.72 1.30 1.72 1.72 1.79 0.82 2.20 1.75 1.31 18.68 Higashi-Ohgishima / Ohgishima 36.17 33.19 33.02 28.24 29.37 31.75 26.40 32.48 37.66 22.99 31.71 34.45 377.43 Himeji 18.26 20.20 21.55 16.34 12.79 13.76 26.55 19.83 18.36 16.58 27.06 25.07 236.34 Kagoshima 0.49 0.93 0.90 0 0.49 0 0.49 0.41 0.48 0 0.91 0.91 6.02 Mizushima 1.90 0 3.02 3.09 2.70 2.66 2.70 3.04 3.09 2.80 3.07 2.68 30.74 Nagasaki 0.80 0 0.38 0.40 0.38 0 0.40 0.40 0.39 0.41 0.40 0.80 4.77 Negishi 13.46 21.05 20.57 17.54 11.99 13.50 13.07 21.20 10.46 15.19 12.29 22.76 193.07 Nihonkai LNG Niigata 16.61 11.00 15.89 21.06 10.96 14.14 13.63 12.84 13.55 14.70 15.87 13.97 174.23 Oita 9.42 7.07 4.53 5.41 5.39 10.99 3.17 5.76 2.64 3.07 5.82 6.19 69.47 Sakai / Senboku 30.10 37.72 28.36 23.64 19.18 19.52 31.83 25.52 26.52 28.56 25.32 33.77 330.03 Shin Minato Works 0 0.81 0.38 0.80 0.38 0.79 0.79 0 0.79 0.41 0.80 0.40 6.36 Sodegaura 39.11 31.51 39.71 46.75 30.77 41.60 37.22 34.81 40.86 36.73 34.73 45.39 459.19 Sodeshi 2.76 2.78 0 2.76 2.64 3.13 2.73 0 2.86 3.12 0 2.93 25.70 Tobata 8.01 7.87 7.19 5.18 8.05 8.07 8.37 8.31 10.99 5.38 5.49 8.08 90.98 Yanai 5.09 4.75 0.80 8.33 5.73 8.46 5.84 5.32 5.32 5.74 8.03 5.73 69.13 Yokkaichi / Kawagoe 20.40 11.33 17.06 18.89 16.96 17.08 22.62 19.52 22.94 17.11 19.93 19.76 223.59 2009 Total 275.04 257.91 271.16 256.35 220.04 241.13 268.58 258.66 264.57 243.16 259.92 299.46 3,115.98

53
LNG Shipments Received In Japan by Region (1000's of Metric Tons)
Jan Feb Mar Apr May Jun Jul Aug Sep Oct Nov Dec Total
Ise Bay 1,208 1,302 1,138 1,067 1,044 1,178 1,304 1,308 121 0 0 0 9,671Kyushu Island 385 396 425 361 335 463 409 621 0 0 0 0 3,394Niigata 237 510 347 412 299 406 394 501 64 0 0 0 3,170Osaka 1,285 1,090 1,116 1,256 975 1,070 1,507 1,024 62 0 0 0 9,385Sendai 8 17 8 0 0 0 0 0 0 0 0 0 34Suruga Bay 121 61 123 124 61 63 121 65 0 0 0 0 738Tokyo Bay 2,916 2,726 3,205 2,849 2,610 2,723 3,091 2,784 185 0 0 0 23,089Western Inland Sea 226 270 136 402 138 202 265 404 0 0 0 0 2,0432011 Total 6,387 6,372 6,497 6,471 5,461 6,105 7,091 6,707 432 0 0 0 51,524 Ise Bay 1,269 1,220 957 845 838 1,043 1,138 1,184 1,295 956 1,303 1,215 13,263Kyushu Island 338 327 394 385 383 192 406 372 400 280 329 336 4,141Niigata 319 304 359 234 234 232 233 230 229 268 229 304 3,174Osaka 1,283 1,371 1,230 1,144 990 1,191 1,153 1,211 1,004 990 989 1,158 13,714Sendai 8 17 16 9 17 17 8 17 17 17 8 17 167Suruga Bay 64 58 66 121 59 121 58 57 61 122 128 62 976Tokyo Bay 2,605 2,480 3,140 2,396 2,604 2,276 2,739 3,049 2,771 2,361 2,457 3,088 31,967Western Inland Sea 267 202 254 272 218 329 190 200 245 304 219 321 3,0212010 Total 6,154 5,978 6,416 5,403 5,344 5,401 5,926 6,320 6,021 5,298 5,664 6,501 70,424 Ise Bay 1,069 936 1,106 920 933 884 1,209 1,179 1,171 1,012 1,085 1,244 12,747Kyushu Island 415 355 295 262 314 438 283 335 326 201 288 341 3,852Niigata 346 229 331 438 228 294 283 267 282 306 330 291 3,624Osaka 1,006 1,205 1,038 831 665 692 1,214 943 933 939 1,090 1,224 11,781Sendai 0 17 8 17 8 16 16 0 16 8 17 8 132Suruga Bay 58 58 0 57 55 65 57 0 60 65 0 61 535Tokyo Bay 2,639 2,447 2,757 2,534 2,173 2,359 2,310 2,445 2,523 2,303 2,330 2,859 29,680Western Inland Sea 190 118 106 272 202 267 213 211 192 223 267 202 2,4652009 Total 5,721 5,365 5,641 5,331 4,577 5,016 5,587 5,380 5,503 5,058 5,407 6,229 64,816

54
LNG Shipments Received In Japan by Region (Bcf)
Jan Feb Mar Apr May Jun Jul Aug Sep Oct Nov Dec Total
Ise Bay 58.07 62.59 54.70 51.29 50.18 56.65 62.68 62.90 5.83 0 0 0 464.90Kyushu Island 18.49 19.05 20.42 17.34 16.10 22.26 19.64 29.86 0 0 0 0 163.15Niigata 11.41 24.51 16.66 19.82 14.38 19.50 18.95 24.10 3.09 0 0 0 152.41Osaka 61.80 52.39 53.63 60.39 46.87 51.46 72.46 49.20 2.98 0 0 0 451.18Sendai 0.40 0.81 0.40 0 0 0 0 0 0 0 0 0 1.61Suruga Bay 5.80 2.94 5.93 5.96 2.91 3.01 5.82 3.12 0 0 0 0 35.49Tokyo Bay 140.21 131.04 154.06 136.96 125.47 130.90 148.60 133.86 8.87 0 0 0 1,109.97Western Inland Sea 10.87 13.00 6.54 19.35 6.62 9.70 12.76 19.40 0 0 0 0 98.242011 Total 307.04 306.33 312.34 311.10 262.54 293.48 340.92 322.44 20.77 0 0 0 2,476.96 Ise Bay 61.00 58.63 46.02 40.61 40.30 50.14 54.73 56.91 62.24 45.96 62.65 58.40 637.60Kyushu Island 16.25 15.70 18.94 18.49 18.41 9.24 19.54 17.88 19.25 13.45 15.80 16.14 199.09Niigata 15.33 14.59 17.27 11.23 11.26 11.15 11.20 11.03 10.99 12.90 11.02 14.60 152.58Osaka 61.68 65.91 59.11 55.00 47.59 57.25 55.42 58.22 48.29 47.60 47.55 55.69 659.31Sendai 0.40 0.81 0.79 0.41 0.82 0.80 0.40 0.80 0.80 0.80 0.39 0.80 8.03Suruga Bay 3.09 2.79 3.16 5.80 2.82 5.84 2.76 2.76 2.91 5.84 6.18 2.99 46.94Tokyo Bay 125.25 119.24 150.94 115.16 125.19 109.41 131.68 146.59 133.20 113.51 118.13 148.47 1,536.76Western Inland Sea 12.82 9.70 12.21 13.06 10.49 15.82 9.15 9.62 11.80 14.62 10.54 15.43 145.252010 Total 295.82 287.37 308.44 259.76 256.88 259.65 284.88 303.81 289.48 254.68 272.27 312.52 3,385.56 Ise Bay 51.39 45.01 53.15 44.21 44.83 42.51 58.11 56.68 56.28 48.66 52.17 59.80 612.79Kyushu Island 19.93 17.08 14.16 12.60 15.08 21.04 13.61 16.09 15.68 9.67 13.82 16.38 185.15Niigata 16.61 11.00 15.89 21.06 10.96 14.14 13.63 12.84 13.55 14.70 15.87 13.97 174.23Osaka 48.36 57.92 49.91 39.97 31.97 33.28 58.38 45.35 44.87 45.14 52.38 58.84 566.37Sendai 0 0.81 0.38 0.80 0.38 0.79 0.79 0 0.79 0.41 0.80 0.40 6.36Suruga Bay 2.76 2.78 0 2.76 2.64 3.13 2.73 0 2.86 3.12 0 2.93 25.70Tokyo Bay 126.88 117.65 132.56 121.83 104.44 113.40 111.07 117.54 121.30 110.73 112.01 137.43 1,426.84Western Inland Sea 9.11 5.68 5.11 13.13 9.73 12.85 10.25 10.16 9.23 10.73 12.85 9.72 118.552009 Total 275.04 257.91 271.16 256.35 220.04 241.13 268.58 258.66 264.57 243.16 259.92 299.46 3,115.98

55
LNG Shipments Received In Japan By Source (1000's of Metric Tons)
Jan Feb Mar Apr May Jun Jul Aug Sep Oct Nov Dec Total
Abu Dhabi 484 421 407 366 421 539 539 477 120 0 0 0 3,774Algeria 0 0 0 0 0 59 0 0 0 0 0 0 59Australia 1,307 1,060 1,268 893 1,039 1,157 1,464 1,345 64 0 0 0 9,597Brunei 494 555 553 520 459 396 586 452 0 0 0 0 4,015Egypt 61 58 0 57 117 0 68 128 0 0 0 0 489Equatorial Guinea 0 58 0 0 0 118 189 197 0 0 0 0 562Indonesia 991 1,115 1,093 888 591 711 819 614 0 0 0 0 6,822Malaysia 1,486 1,510 1,491 1,557 993 1,158 1,162 1,001 0 0 0 0 10,358Nigeria 63 0 120 0 178 181 252 189 126 0 0 0 1,109Norway 0 0 0 0 0 0 0 62 0 0 0 0 62Oman 318 250 186 318 383 191 384 443 0 0 0 0 2,473Peru 0 0 0 63 68 77 0 68 0 0 0 0 276Qatar 698 743 767 997 628 811 1,007 917 121 0 0 0 6,689Russia 460 532 521 724 583 585 461 713 0 0 0 0 4,579Trinidad 0 0 55 50 0 0 120 61 0 0 0 0 286US Re-export 0 0 0 0 0 56 0 0 0 0 0 0 56USA 25 70 36 35 0 0 39 39 0 0 0 0 244Yemen 0 0 0 0 0 65 0 0 0 0 0 0 652011 Total 6,387 6,372 6,497 6,468 5,460 6,104 7,090 6,706 431 0 0 0 51,515 Abu Dhabi 423 487 422 425 547 427 364 431 365 365 428 420 5,104Algeria 60 0 0 0 0 0 0 0 0 0 0 0 60Australia 1,044 1,077 1,287 1,189 832 983 1,279 1,279 979 937 1,194 1,200 13,280Belgium Re-export 0 0 0 0 0 0 0 0 0 0 64 0 64Brunei 589 528 459 429 522 365 528 528 461 528 368 621 5,926Egypt 0 0 0 0 119 0 62 60 63 0 63 59 426Equatorial Guinea 59 184 59 58 0 0 59 62 0 0 57 0 538Indonesia 1,074 1,027 1,102 1,026 1,101 979 1,136 1,043 1,154 964 928 1,218 12,752Malaysia 1,238 1,185 1,218 1,011 1,195 922 1,188 1,191 1,237 1,052 1,063 1,387 13,887Nigeria 60 0 0 0 0 0 0 59 227 0 233 0 579Oman 380 190 446 192 191 252 251 185 195 132 192 255 2,861Qatar 734 707 804 574 396 695 567 686 657 613 637 785 7,855Russia 456 463 583 463 405 707 455 660 593 520 401 521 6,227Trinidad 0 58 0 0 0 0 0 0 56 0 0 0 114USA 36 71 35 35 36 71 36 71 36 132 36 35 630

56
Yemen 0 0 0 0 0 0 0 65 0 54 0 0 1192010 Total 6,153 5,977 6,415 5,402 5,344 5,401 5,925 6,320 6,023 5,297 5,664 6,501 70,422
LNG Shipments Received In Japan By Source (1000's of Metric Tons)
Abu Dhabi 480 477 481 421 487 426 365 481 541 421 188 368 5,136Australia 1,111 996 921 1,082 909 836 1,272 1,070 829 718 1,271 1,256 12,271Brunei 528 495 562 556 365 523 521 554 495 495 428 649 6,171Egypt 0 122 120 0 0 0 0 0 0 0 0 0 242Equatorial Guinea 60 117 0 59 56 115 118 64 64 171 66 176 1,066Indonesia 1,029 1,056 1,131 1,047 1,035 977 1,211 875 1,106 917 1,073 1,101 12,558Malaysia 1,369 1,216 1,238 1,209 823 1,104 868 980 1,112 815 942 1,159 12,835Nigeria 112 182 113 0 60 0 0 0 0 0 0 64 531Oman 253 188 311 189 185 187 257 186 257 188 196 187 2,584Qatar 718 476 716 600 487 546 662 649 662 797 763 851 7,927Russia 0 0 0 138 135 266 265 450 401 466 394 328 2,843Trinidad 0 0 0 0 0 0 0 0 0 0 50 54 104USA 62 40 48 31 36 35 47 71 36 71 35 35 5472009 Total 5,722 5,365 5,641 5,332 4,578 5,015 5,586 5,380 5,503 5,059 5,406 6,228 64,815

57
LNG Shipments Received In Japan By Source (Bcf)
Jan Feb Mar Apr May Jun Jul Aug Sep Oct Nov Dec Total
Abu Dhabi 23.28 20.26 19.58 17.60 20.26 25.92 25.90 22.93 5.78 0 0 0 181.52Algeria 0 0 0 0 0 2.82 0 0 0 0 0 0 2.82Australia 62.81 50.97 60.94 42.95 49.96 55.63 70.38 64.65 3.09 0 0 0 461.38Brunei 23.77 26.67 26.57 25.01 22.06 19.04 28.17 21.75 0 0 0 0 193.04Egypt 2.94 2.78 0 2.76 5.64 0 3.29 6.15 0 0 0 0 23.55Equatorial Guinea 0 2.79 0 0 0 5.69 9.11 9.49 0 0 0 0 27.08Indonesia 47.66 53.59 52.56 42.70 28.44 34.20 39.40 29.54 0 0 0 0 328.09Malaysia 71.44 72.60 71.68 74.87 47.73 55.68 55.87 48.10 0 0 0 0 497.98Nigeria 3.03 0 5.79 0 8.56 8.69 12.11 9.07 6.07 0 0 0 53.33Norway 0 0 0 0 0 0 0 2.97 0 0 0 0 2.97Oman 15.28 12.00 8.94 15.27 18.42 9.20 18.46 21.32 0 0 0 0 118.89Peru 0 0 0 3.05 3.27 3.71 0 3.26 0 0 0 0 13.29Qatar 33.54 35.73 36.86 47.93 30.20 38.98 48.41 44.09 5.83 0 0 0 321.56Russia 22.11 25.59 25.05 34.83 28.01 28.11 22.15 34.30 0 0 0 0 220.14Trinidad 0 0 2.66 2.43 0 0 5.79 2.93 0 0 0 0 13.80US Re-export 0 0 0 0 0 2.69 0 0 0 0 0 0 2.69USA 1.18 3.36 1.71 1.70 0 0 1.89 1.89 0 0 0 0 11.72Yemen 0 0 0 0 0 3.14 0 0 0 0 0 0 3.142011 Total 307.04 306.33 312.34 311.10 262.54 293.48 340.92 322.44 20.77 0 0 0 2,476.96 Abu Dhabi 20.34 23.40 20.28 20.44 26.28 20.53 17.50 20.70 17.55 17.55 20.57 20.19 245.33Algeria 2.90 0 0 0 0 0 0 0 0 0 0 0 2.90Australia 50.19 51.78 61.87 57.17 40.02 47.26 61.50 61.51 47.05 45.05 57.41 57.70 638.51Belgium Re-export 0 0 0 0 0 0 0 0 0 0 3.07 0 3.07Brunei 28.31 25.38 22.07 20.64 25.10 17.57 25.39 25.40 22.16 25.39 17.68 29.84 284.93Egypt 0 0 0 0 5.72 0 3.00 2.90 3.01 0 3.03 2.83 20.49Equatorial Guinea 2.83 8.86 2.83 2.78 0 0 2.84 2.99 0 0 2.76 0 25.88Indonesia 51.64 49.39 52.98 49.31 52.94 47.04 54.63 50.13 55.48 46.33 44.63 58.53 613.05Malaysia 59.52 56.95 58.57 48.60 57.44 44.32 57.09 57.23 59.49 50.57 51.08 66.68 667.54Nigeria 2.88 0 0 0 0 0 0 2.86 10.92 0 11.20 0 27.85Oman 18.29 9.14 21.44 9.24 9.18 12.14 12.05 8.88 9.36 6.34 9.24 12.24 137.52Qatar 35.29 33.98 38.66 27.62 19.02 33.39 27.27 32.98 31.57 29.49 30.63 37.74 377.63Russia 21.93 22.27 28.04 22.27 19.48 33.98 21.87 31.71 28.49 25.02 19.27 25.07 299.40Trinidad 0 2.80 0 0 0 0 0 0 2.68 0 0 0 5.48USA 1.71 3.41 1.70 1.70 1.71 3.42 1.71 3.43 1.71 6.34 1.71 1.70 30.25

58
Yemen 0 0 0 0 0 0 0 3.11 0 2.61 0 0 5.722010 Total 295.82 287.37 308.44 259.76 256.88 259.65 284.88 303.81 289.48 254.68 272.27 312.52 3,385.56
LNG Shipments Received In Japan By Source (Bcf)
Abu Dhabi 23.06 22.94 23.12 20.24 23.40 20.46 17.57 23.13 26.03 20.25 9.05 17.68 246.90Australia 53.42 47.90 44.27 52.01 43.70 40.19 61.14 51.44 39.84 34.53 61.10 60.37 589.92Brunei 25.38 23.81 27.01 26.71 17.56 25.15 25.07 26.62 23.79 23.78 20.60 31.22 296.69Egypt 0 5.84 5.75 0 0 0 0 0 0 0 0 0 11.59Equatorial Guinea 2.88 5.63 0 2.82 2.67 5.53 5.66 3.09 3.07 8.22 3.18 8.46 51.22Indonesia 49.48 50.79 54.39 50.38 49.74 46.99 58.22 42.06 53.18 44.06 51.56 52.94 603.79Malaysia 65.80 58.44 59.50 58.11 39.58 53.10 41.71 47.10 53.47 39.16 45.28 55.71 616.95Nigeria 5.39 8.76 5.44 0 2.86 0 0 0 0 0 0 3.07 25.52Oman 12.15 9.03 14.94 9.09 8.91 8.97 12.37 8.96 12.37 9.05 9.41 9.00 124.24Qatar 34.52 22.87 34.44 28.85 23.42 26.25 31.82 31.22 31.84 38.30 36.67 40.90 381.11Russia 0 0 0 6.66 6.49 12.79 12.73 21.64 19.27 22.40 18.94 15.78 136.69Trinidad 0 0 0 0 0 0 0 0 0 0 2.42 2.62 5.04USA 2.96 1.92 2.31 1.49 1.71 1.70 2.28 3.42 1.71 3.40 1.70 1.71 26.312009 Total 275.04 257.91 271.16 256.35 220.04 241.13 268.58 258.66 264.57 243.16 259.92 299.46 3,115.98

59
Waterborne Energy, Inc.
2323 S. Shepherd Dr. Suite 1010 Houston, Texas
77019 713/526-1555 www.waterbornelng.com
26 Aug 2011
Vol. 8, Week 33
Japan By Region

60
LNG Shipments Received In the Ise Bay Region of Japan By Terminal (1000's of Metric Tons)
Jan Feb Mar Apr May Jun Jul Aug Sep Oct Nov Dec Total
Chita 798 836 703 714 687 732 822 883 121 0 0 0 6,296Yokkaichi / Kawagoe 410 466 435 352 357 446 482 426 0 0 0 0 3,3752011 Total 1,208 1,302 1,138 1,067 1,044 1,178 1,304 1,308 121 0 0 0 9,671 Chita 799 770 661 499 549 694 678 784 823 508 839 821 8,426Yokkaichi / Kawagoe 469 449 296 346 289 349 460 400 472 448 465 394 4,8372010 Total 1,269 1,220 957 845 838 1,043 1,138 1,184 1,295 956 1,303 1,215 13,263 Chita 645 700 751 527 580 529 738 773 694 656 671 833 8,096Yokkaichi / Kawagoe 424 236 355 393 353 355 471 406 477 356 415 411 4,6512009 Total 1,069 936 1,106 920 933 884 1,209 1,179 1,171 1,012 1,085 1,244 12,747
LNG Shipments Received In the Ise Bay Region of Japan By Terminal (Bcf)
Jan Feb Mar Apr May Jun Jul Aug Sep Oct Nov Dec Total
Chita 38.38 40.20 33.77 34.35 33.02 35.19 39.50 42.43 5.83 0 0 0 302.67Yokkaichi / Kawagoe 19.69 22.39 20.93 16.94 17.17 21.46 23.18 20.47 0 0 0 0 162.232011 Total 58.07 62.59 54.70 51.29 50.18 56.65 62.68 62.90 5.83 0 0 0 464.90 Chita 38.43 37.04 31.80 23.97 26.39 33.37 32.61 37.70 39.55 24.44 40.32 39.47 405.08Yokkaichi / Kawagoe 22.57 21.60 14.22 16.64 13.91 16.77 22.12 19.21 22.69 21.52 22.34 18.93 232.522010 Total 61.00 58.63 46.02 40.61 40.30 50.14 54.73 56.91 62.24 45.96 62.65 58.40 637.60 Chita 30.98 33.67 36.09 25.32 27.87 25.42 35.49 37.16 33.34 31.56 32.24 40.04 389.20Yokkaichi / Kawagoe 20.40 11.33 17.06 18.89 16.96 17.08 22.62 19.52 22.94 17.11 19.93 19.76 223.592009 Total 51.39 45.01 53.15 44.21 44.83 42.51 58.11 56.68 56.28 48.66 52.17 59.80 612.79

61
LNG Shipments Received In Ise Bay Region of Japan By Source (1000's of Metric Tons)
Jan Feb Mar Apr May Jun Jul Aug Sep Oct Nov Dec Total
Australia 286 235 174 111 173 170 233 237 0 0 0 0 1,619Egypt 0 0 0 0 0 0 0 64 0 0 0 0 64Indonesia 284 348 387 172 172 55 180 112 0 0 0 0 1,710Malaysia 122 191 121 117 119 0 125 0 0 0 0 0 795Nigeria 0 0 0 0 0 120 61 125 0 0 0 0 306Peru 0 0 0 0 0 77 0 0 0 0 0 0 77Qatar 516 528 455 603 389 626 640 643 121 0 0 0 4,521Russia 0 0 0 64 192 65 65 127 0 0 0 0 513Yemen 0 0 0 0 0 65 0 0 0 0 0 0 652011 Total 1,208 1,302 1,137 1,067 1,045 1,178 1,304 1,308 121 0 0 0 9,670 Australia 227 178 119 111 112 56 288 232 176 55 168 168 1,890Indonesia 276 330 280 277 392 280 277 446 279 382 392 380 3,991Malaysia 121 58 60 62 0 118 61 61 57 61 55 185 899Nigeria 0 0 0 0 0 0 0 0 57 0 233 0 290Oman 63 0 0 0 0 0 0 0 0 0 0 0 63Qatar 520 590 498 395 335 395 447 444 596 458 455 482 5,615Russia 61 65 0 0 0 194 65 0 128 0 0 0 5132010 Total 1,268 1,221 957 845 839 1,043 1,138 1,183 1,293 956 1,303 1,215 13,261 Australia 178 56 113 177 119 56 223 223 112 112 246 290 1,905Egypt 0 58 60 0 0 0 0 0 0 0 0 0 118Indonesia 224 403 279 322 392 223 504 279 274 167 228 224 3,519Malaysia 176 180 55 57 55 180 0 118 116 120 121 0 1,178Qatar 492 240 599 363 367 425 482 494 543 486 426 730 5,647Russia 0 0 0 0 0 0 0 64 125 127 65 0 3812009 Total 1,070 937 1,106 919 933 884 1,209 1,178 1,170 1,012 1,086 1,244 12,748

62
LNG Shipments Received In Ise Bay Region of Japan By Source (Bcf)
Jan Feb Mar Apr May Jun Jul Aug Sep Oct Nov Dec Total
Australia 13.75 11.30 8.36 5.34 8.30 8.17 11.19 11.42 0 0 0 0 77.84Egypt 0 0 0 0 0 0 0 3.07 0 0 0 0 3.07Indonesia 13.67 16.74 18.62 8.26 8.25 2.66 8.68 5.40 0 0 0 0 82.26Malaysia 5.85 9.16 5.83 5.61 5.72 0 5.99 0 0 0 0 0 38.16Nigeria 0 0 0 0 0 5.76 2.93 6.00 0 0 0 0 14.69Peru 0 0 0 0 0 3.71 0 0 0 0 0 0 3.71Qatar 24.81 25.39 21.89 29.01 18.69 30.08 30.78 30.90 5.83 0 0 0 217.38Russia 0 0 0 3.08 9.22 3.12 3.12 6.11 0 0 0 0 24.65Yemen 0 0 0 0 0 3.14 0 0 0 0 0 0 3.142011 Total 58.07 62.59 54.70 51.29 50.18 56.65 62.68 62.90 5.83 0 0 0 464.90 Australia 10.93 8.54 5.73 5.32 5.36 2.70 13.85 11.16 8.48 2.66 8.07 8.06 90.87Indonesia 13.26 15.84 13.48 13.32 18.84 13.46 13.31 21.46 13.43 18.37 18.84 18.25 191.87Malaysia 5.84 2.79 2.88 2.97 0 5.68 2.93 2.91 2.76 2.91 2.65 8.91 43.25Nigeria 0 0 0 0 0 0 0 0 2.75 0 11.20 0 13.94Oman 3.04 0 0 0 0 0 0 0 0 0 0 0 3.04Qatar 24.99 28.36 23.93 18.99 16.10 18.97 21.49 21.37 28.66 22.02 21.89 23.17 269.94Russia 2.93 3.11 0 0 0 9.33 3.14 0 6.16 0 0 0 24.672010 Total 61.00 58.63 46.02 40.61 40.30 50.14 54.73 56.91 62.24 45.96 62.65 58.40 637.60 Australia 8.54 2.67 5.41 8.51 5.73 2.70 10.73 10.73 5.41 5.41 11.81 13.94 91.60Egypt 0 2.77 2.87 0 0 0 0 0 0 0 0 0 5.64Indonesia 10.75 19.36 13.43 15.50 18.82 10.73 24.21 13.43 13.19 8.01 10.97 10.78 169.18Malaysia 8.44 8.64 2.65 2.76 2.64 8.65 0 5.68 5.57 5.75 5.83 0 56.61Qatar 23.66 11.56 28.78 17.43 17.64 20.42 23.17 23.75 26.10 23.39 20.46 35.07 271.42Russia 0 0 0 0 0 0 0 3.10 6.02 6.11 3.11 0 18.342009 Total 51.39 45.01 53.15 44.21 44.83 42.51 58.11 56.68 56.28 48.66 52.17 59.80 612.79

63
LNG Shipments Received In the Kyushu Island Region of Japan By Terminal (1000's of Metric Tons)
Jan Feb Mar Apr May Jun Jul Aug Sep Oct Nov Dec Total
Fukuoka 25 25 38 42 25 25 25 25 0 0 0 0 229Kagoshima 0 10 10 0 0 0 9 9 0 0 0 0 37Nagasaki 8 8 4 8 8 8 0 8 0 0 0 0 54Oita 128 128 191 128 182 189 188 258 0 0 0 0 1,392Tobata 223 224 181 183 121 241 186 321 0 0 0 0 1,6812011 Total 385 396 425 361 335 463 409 621 0 0 0 0 3,394 Fukuoka 17 17 16 34 17 25 17 33 8 33 16 33 267Kagoshima 10 10 10 0 0 0 19 27 17 8 9 8 119Nagasaki 17 8 16 0 9 0 17 17 17 0 8 8 117Oita 126 126 121 240 186 55 129 127 190 129 128 118 1,674Tobata 169 165 230 111 171 112 226 168 168 109 168 167 1,9652010 Total 338 327 394 385 383 192 406 372 400 280 329 336 4,141 Fukuoka 25 25 24 33 16 41 25 25 25 17 25 8 289Kagoshima 10 19 19 0 10 0 10 9 10 0 19 19 125Nagasaki 17 0 8 8 8 0 8 8 8 8 8 17 99Oita 196 147 94 113 112 229 66 120 55 64 121 129 1,445Tobata 167 164 150 108 167 168 174 173 229 112 114 168 1,8932009 Total 415 355 295 262 314 438 283 335 326 201 288 341 3,852

64
LNG Shipments Received In the Kyushu Island Region of Japan By Terminal (Bcf)
Jan Feb Mar Apr May Jun Jul Aug Sep Oct Nov Dec Total
Fukuoka 1.21 1.21 1.81 2.00 1.18 1.19 1.20 1.20 0 0 0 0 11.00Kagoshima 0 0.49 0.48 0 0 0 0.41 0.41 0 0 0 0 1.80Nagasaki 0.40 0.41 0.20 0.39 0.39 0.41 0 0.40 0 0 0 0 2.60Oita 6.17 6.15 9.20 6.15 8.73 9.06 9.06 12.40 0 0 0 0 66.93Tobata 10.71 10.79 8.72 8.80 5.80 11.61 8.97 15.43 0 0 0 0 80.832011 Total 18.49 19.05 20.42 17.34 16.10 22.26 19.64 29.86 0 0 0 0 163.15 Fukuoka 0.80 0.81 0.79 1.64 0.82 1.20 0.80 1.61 0.40 1.61 0.77 1.61 12.85Kagoshima 0.48 0.48 0.49 0 0 0 0.90 1.32 0.83 0.40 0.41 0.40 5.72Nagasaki 0.80 0.40 0.79 0 0.41 0 0.80 0.81 0.80 0 0.39 0.40 5.61Oita 6.04 6.05 5.79 11.51 8.95 2.66 6.19 6.08 9.14 6.19 6.15 5.69 80.46Tobata 8.12 7.95 11.07 5.33 8.24 5.37 10.85 8.06 8.08 5.25 8.09 8.04 94.452010 Total 16.25 15.70 18.94 18.49 18.41 9.24 19.54 17.88 19.25 13.45 15.80 16.14 199.09 Fukuoka 1.20 1.21 1.15 1.61 0.77 1.98 1.19 1.20 1.18 0.81 1.20 0.40 13.91Kagoshima 0.49 0.93 0.90 0 0.49 0 0.49 0.41 0.48 0 0.91 0.91 6.02Nagasaki 0.80 0 0.38 0.40 0.38 0 0.40 0.40 0.39 0.41 0.40 0.80 4.77Oita 9.42 7.07 4.53 5.41 5.39 10.99 3.17 5.76 2.64 3.07 5.82 6.19 69.47Tobata 8.01 7.87 7.19 5.18 8.05 8.07 8.37 8.31 10.99 5.38 5.49 8.08 90.982009 Total 19.93 17.08 14.16 12.60 15.08 21.04 13.61 16.09 15.68 9.67 13.82 16.38 185.15

65
LNG Shipments Received In Kyushu Island Region of Japan By Source (1000's of Metric Tons)
Jan Feb Mar Apr May Jun Jul Aug Sep Oct Nov Dec Total
Australia 119 118 191 64 122 124 64 128 0 0 0 0 930Egypt 0 58 0 57 0 0 0 64 0 0 0 0 179Equatorial Guinea 0 0 0 0 0 58 64 65 0 0 0 0 187Indonesia 168 122 66 125 55 119 193 77 0 0 0 0 925Malaysia 33 34 106 50 33 25 25 33 0 0 0 0 339Nigeria 0 0 0 0 61 0 62 0 0 0 0 0 123Norway 0 0 0 0 0 0 0 62 0 0 0 0 62Russia 65 65 62 65 65 138 0 192 0 0 0 0 6522011 Total 385 397 425 361 336 464 408 621 0 0 0 0 3,397 Australia 62 64 65 240 64 55 129 64 64 64 184 64 1,119Egypt 0 0 0 0 59 0 0 0 0 0 0 59 118Equatorial Guinea 59 0 0 0 0 0 59 0 0 0 0 0 118Indonesia 120 175 235 111 168 112 185 195 185 118 121 171 1,896Malaysia 33 25 33 34 26 25 33 42 25 33 24 42 375Russia 64 62 62 0 66 0 0 71 126 65 0 0 5162010 Total 338 326 395 385 383 192 406 372 400 280 329 336 4,142 Australia 147 98 94 113 56 60 66 64 64 64 64 64 954Equatorial Guinea 0 57 0 0 56 56 54 0 0 56 0 0 279Indonesia 164 175 168 108 178 280 66 176 230 55 190 187 1,977Malaysia 42 25 32 42 24 41 33 33 33 25 33 25 388Oman 62 0 0 0 0 0 0 0 0 0 0 0 62Russia 0 0 0 0 0 0 65 61 0 0 0 65 1912009 Total 415 355 294 263 314 437 284 334 327 200 287 341 3,851

66
LNG Shipments Received In Kyushu Island Region of Japan By Source (Bcf)
Jan Feb Mar Apr May Jun Jul Aug Sep Oct Nov Dec Total
Australia 5.71 5.68 9.20 3.09 5.85 5.94 3.07 6.15 0 0 0 0 44.69Egypt 0 2.78 0 2.76 0 0 0 3.07 0 0 0 0 8.61Equatorial Guinea 0 0 0 0 0 2.77 3.07 3.13 0 0 0 0 8.98Indonesia 8.06 5.86 3.15 5.99 2.65 5.71 9.29 3.70 0 0 0 0 44.42Malaysia 1.61 1.62 5.08 2.39 1.57 1.19 1.20 1.61 0 0 0 0 16.27Nigeria 0 0 0 0 2.93 0 3.00 0 0 0 0 0 5.93Norway 0 0 0 0 0 0 0 2.97 0 0 0 0 2.97Russia 3.11 3.11 2.98 3.11 3.10 6.65 0 9.23 0 0 0 0 31.292011 Total 18.49 19.05 20.42 17.34 16.10 22.26 19.64 29.86 0 0 0 0 163.15 Australia 2.98 3.07 3.10 11.51 3.07 2.66 6.19 3.10 3.07 3.07 8.85 3.09 53.78Egypt 0 0 0 0 2.85 0 0 0 0 0 0 2.83 5.68Equatorial Guinea 2.83 0 0 0 0 0 2.84 0 0 0 0 0 5.67Indonesia 5.78 8.43 11.28 5.33 8.08 5.37 8.90 9.38 8.90 5.65 5.80 8.22 91.12Malaysia 1.61 1.21 1.58 1.64 1.23 1.20 1.61 2.01 1.20 1.61 1.16 2.01 18.06Russia 3.06 2.98 2.98 0 3.18 0 0 3.39 6.07 3.12 0 0 24.772010 Total 16.25 15.70 18.94 18.49 18.41 9.24 19.54 17.88 19.25 13.45 15.80 16.14 199.09 Australia 7.05 4.71 4.53 5.41 2.70 2.90 3.17 3.07 3.07 3.07 3.07 3.09 45.87Equatorial Guinea 0 2.75 0 0 2.67 2.69 2.57 0 0 2.71 0 0 13.40Indonesia 7.91 8.41 8.09 5.18 8.55 13.46 3.18 8.48 11.04 2.67 9.14 8.98 95.09Malaysia 2.01 1.21 1.54 2.01 1.15 1.98 1.59 1.61 1.57 1.22 1.61 1.20 18.68Oman 2.97 0 0 0 0 0 0 0 0 0 0 0 2.97Russia 0 0 0 0 0 0 3.10 2.94 0 0 0 3.10 9.142009 Total 19.93 17.08 14.16 12.60 15.08 21.04 13.61 16.09 15.68 9.67 13.82 16.38 185.15

67
LNG Shipments Received In the Niigata Region of Japan By Terminal (1000's of Metric Tons)
Jan Feb Mar Apr May Jun Jul Aug Sep Oct Nov Dec Total
Nihonkai LNG Niigata 237 510 347 412 299 406 394 501 64 0 0 0 3,1702011 Total 237 510 347 412 299 406 394 501 64 0 0 0 3,170 Nihonkai LNG Niigata 319 304 359 234 234 232 233 230 229 268 229 304 3,1742010 Total 319 304 359 234 234 232 233 230 229 268 229 304 3,174 Nihonkai LNG Niigata 346 229 331 438 228 294 283 267 282 306 330 291 3,6242009 Total 346 229 331 438 228 294 283 267 282 306 330 291 3,624
LNG Shipments Received In the Niigata Region of Japan By Terminal (Bcf)
Jan Feb Mar Apr May Jun Jul Aug Sep Oct Nov Dec Total
Nihonkai LNG Niigata 11.41 24.51 16.66 19.82 14.38 19.50 18.95 24.10 3.09 0 0 0 152.412011 Total 11.41 24.51 16.66 19.82 14.38 19.50 18.95 24.10 3.09 0 0 0 152.41 Nihonkai LNG Niigata 15.33 14.59 17.27 11.23 11.26 11.15 11.20 11.03 10.99 12.90 11.02 14.60 152.582010 Total 15.33 14.59 17.27 11.23 11.26 11.15 11.20 11.03 10.99 12.90 11.02 14.60 152.58 Nihonkai LNG Niigata 16.61 11.00 15.89 21.06 10.96 14.14 13.63 12.84 13.55 14.70 15.87 13.97 174.232009 Total 16.61 11.00 15.89 21.06 10.96 14.14 13.63 12.84 13.55 14.70 15.87 13.97 174.23
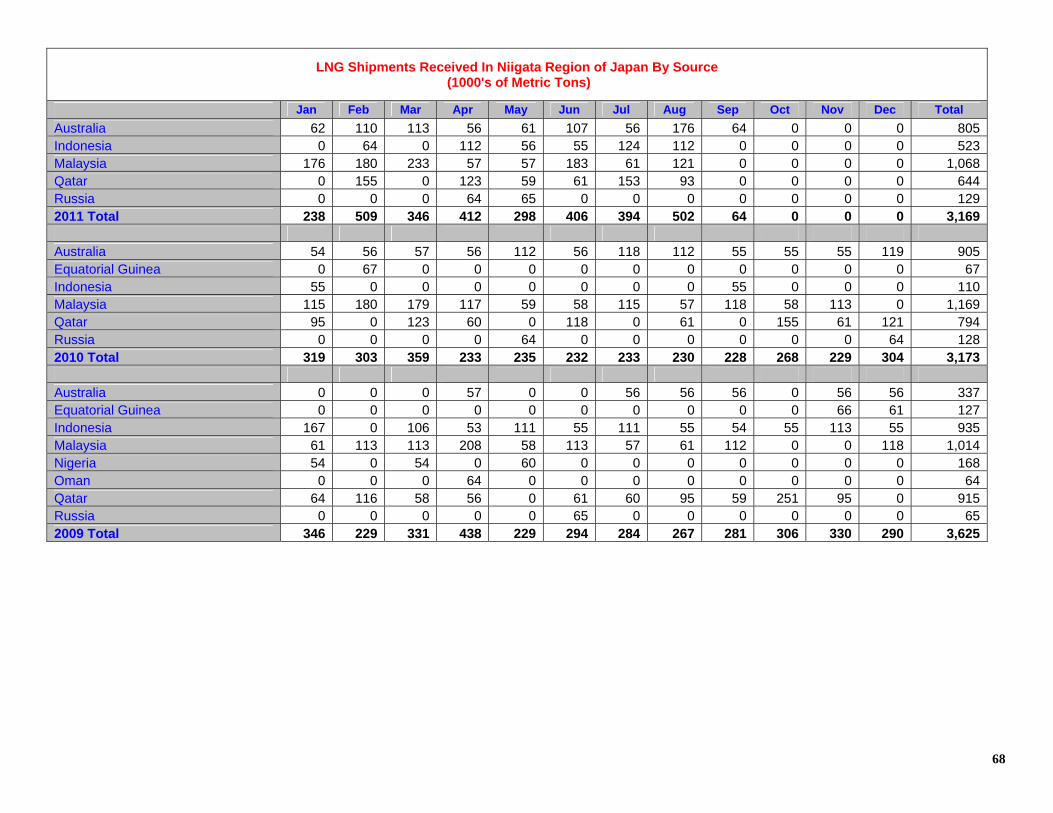
68
LNG Shipments Received In Niigata Region of Japan By Source (1000's of Metric Tons)
Jan Feb Mar Apr May Jun Jul Aug Sep Oct Nov Dec Total
Australia 62 110 113 56 61 107 56 176 64 0 0 0 805Indonesia 0 64 0 112 56 55 124 112 0 0 0 0 523Malaysia 176 180 233 57 57 183 61 121 0 0 0 0 1,068Qatar 0 155 0 123 59 61 153 93 0 0 0 0 644Russia 0 0 0 64 65 0 0 0 0 0 0 0 1292011 Total 238 509 346 412 298 406 394 502 64 0 0 0 3,169 Australia 54 56 57 56 112 56 118 112 55 55 55 119 905Equatorial Guinea 0 67 0 0 0 0 0 0 0 0 0 0 67Indonesia 55 0 0 0 0 0 0 0 55 0 0 0 110Malaysia 115 180 179 117 59 58 115 57 118 58 113 0 1,169Qatar 95 0 123 60 0 118 0 61 0 155 61 121 794Russia 0 0 0 0 64 0 0 0 0 0 0 64 1282010 Total 319 303 359 233 235 232 233 230 228 268 229 304 3,173 Australia 0 0 0 57 0 0 56 56 56 0 56 56 337Equatorial Guinea 0 0 0 0 0 0 0 0 0 0 66 61 127Indonesia 167 0 106 53 111 55 111 55 54 55 113 55 935Malaysia 61 113 113 208 58 113 57 61 112 0 0 118 1,014Nigeria 54 0 54 0 60 0 0 0 0 0 0 0 168Oman 0 0 0 64 0 0 0 0 0 0 0 0 64Qatar 64 116 58 56 0 61 60 95 59 251 95 0 915Russia 0 0 0 0 0 65 0 0 0 0 0 0 652009 Total 346 229 331 438 229 294 284 267 281 306 330 290 3,625

69
LNG Shipments Received In Niigata Region of Japan By Source (Bcf)
Jan Feb Mar Apr May Jun Jul Aug Sep Oct Nov Dec Total
Australia 2.97 5.31 5.46 2.68 2.94 5.14 2.70 8.45 3.09 0 0 0 38.74Indonesia 0 3.08 0 5.40 2.69 2.66 5.96 5.37 0 0 0 0 25.15Malaysia 8.44 8.65 11.20 2.75 2.75 8.78 2.91 5.83 0 0 0 0 51.32Qatar 0 7.47 0 5.93 2.85 2.91 7.37 4.45 0 0 0 0 30.99Russia 0 0 0 3.07 3.14 0 0 0 0 0 0 0 6.212011 Total 11.41 24.51 16.66 19.82 14.38 19.50 18.95 24.10 3.09 0 0 0 152.41 Australia 2.62 2.70 2.72 2.70 5.37 2.71 5.67 5.37 2.66 2.66 2.66 5.71 43.54Equatorial Guinea 0 3.22 0 0 0 0 0 0 0 0 0 0 3.22Indonesia 2.62 0 0 0 0 0 0 0 2.65 0 0 0 5.28Malaysia 5.52 8.67 8.63 5.64 2.82 2.76 5.53 2.75 5.67 2.76 5.45 0 56.21Qatar 4.57 0 5.92 2.89 0 5.67 0 2.91 0 7.47 2.91 5.83 38.18Russia 0 0 0 0 3.08 0 0 0 0 0 0 3.07 6.152010 Total 15.33 14.59 17.27 11.23 11.26 11.15 11.20 11.03 10.99 12.90 11.02 14.60 152.58 Australia 0 0 0 2.72 0 0 2.70 2.70 2.70 0 2.70 2.71 16.22Equatorial Guinea 0 0 0 0 0 0 0 0 0 0 3.18 2.91 6.09Indonesia 8.02 0 5.09 2.56 5.32 2.66 5.32 2.66 2.61 2.64 5.44 2.67 45.01Malaysia 2.93 5.42 5.43 10.02 2.78 5.44 2.72 2.93 5.39 0 0 5.68 48.74Nigeria 2.58 0 2.58 0 2.86 0 0 0 0 0 0 0 8.02Oman 0 0 0 3.09 0 0 0 0 0 0 0 0 3.09Qatar 3.09 5.58 2.79 2.68 0 2.91 2.88 4.56 2.85 12.05 4.56 0 43.95Russia 0 0 0 0 0 3.12 0 0 0 0 0 0 3.122009 Total 16.61 11.00 15.89 21.06 10.96 14.14 13.63 12.84 13.55 14.70 15.87 13.97 174.23

70
LNG Shipments Received In the Osaka Region of Japan By Terminal (1000's of Metric Tons)
Jan Feb Mar Apr May Jun Jul Aug Sep Oct Nov Dec Total
Himeji 494 520 388 440 353 412 626 478 0 0 0 0 3,712Sakai / Senboku 792 569 728 816 622 658 882 545 62 0 0 0 5,6732011 Total 1,285 1,090 1,116 1,256 975 1,070 1,507 1,024 62 0 0 0 9,385 Himeji 435 642 473 449 416 343 531 473 346 284 289 379 5,061Sakai / Senboku 848 729 756 695 574 848 622 738 658 706 700 780 8,6542010 Total 1,283 1,371 1,230 1,144 990 1,191 1,153 1,211 1,004 990 989 1,158 13,714 Himeji 380 420 448 340 266 286 552 412 382 345 563 521 4,916Sakai / Senboku 626 785 590 492 399 406 662 531 552 594 527 702 6,8652009 Total 1,006 1,205 1,038 831 665 692 1,214 943 933 939 1,090 1,224 11,781
LNG Shipments Received In the Osaka Region of Japan By Terminal (Bcf)
Jan Feb Mar Apr May Jun Jul Aug Sep Oct Nov Dec Total
Himeji 23.74 25.02 18.63 21.16 16.99 19.82 30.09 22.99 0 0 0 0 178.44Sakai / Senboku 38.06 27.37 35.00 39.23 29.88 31.63 42.38 26.21 2.98 0 0 0 272.742011 Total 61.80 52.39 53.63 60.39 46.87 51.46 72.46 49.20 2.98 0 0 0 451.18 Himeji 20.93 30.86 22.76 21.59 20.00 16.51 25.53 22.72 16.64 13.64 13.90 18.20 243.30Sakai / Senboku 40.75 35.04 36.36 33.40 27.59 40.74 29.89 35.49 31.65 33.96 33.66 37.48 416.012010 Total 61.68 65.91 59.11 55.00 47.59 57.25 55.42 58.22 48.29 47.60 47.55 55.69 659.31 Himeji 18.26 20.20 21.55 16.34 12.79 13.76 26.55 19.83 18.36 16.58 27.06 25.07 236.34Sakai / Senboku 30.10 37.72 28.36 23.64 19.18 19.52 31.83 25.52 26.52 28.56 25.32 33.77 330.032009 Total 48.36 57.92 49.91 39.97 31.97 33.28 58.38 45.35 44.87 45.14 52.38 58.84 566.37
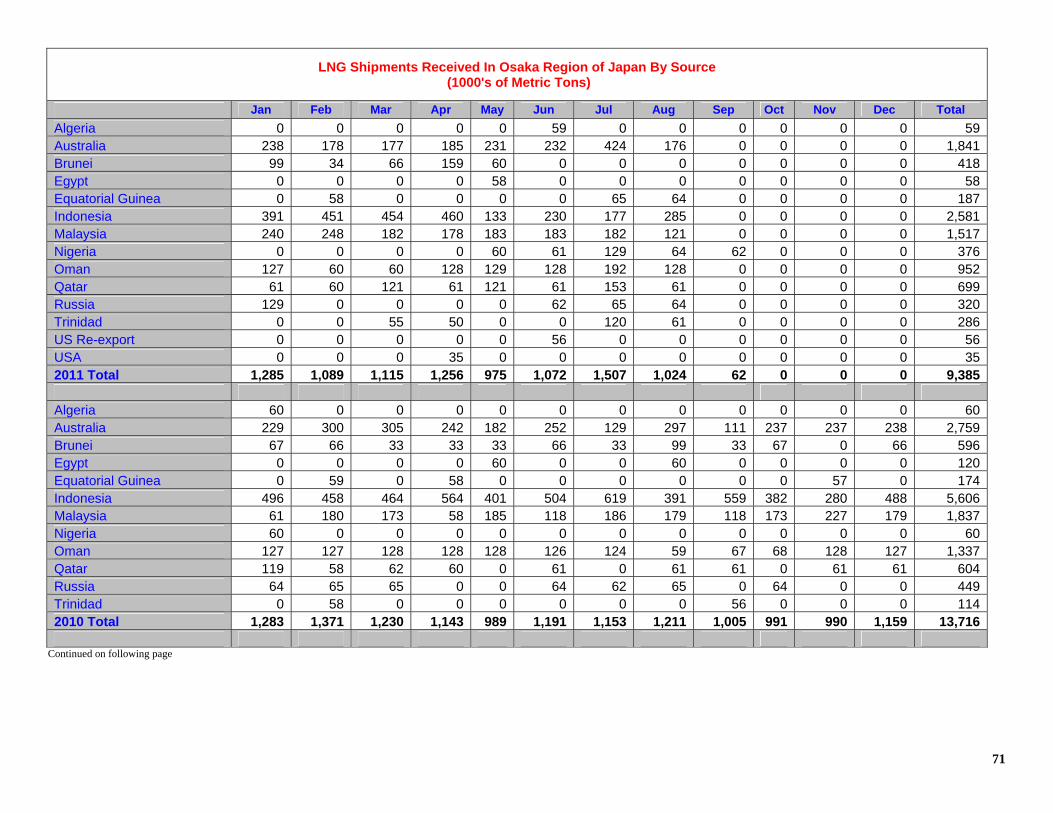
71
LNG Shipments Received In Osaka Region of Japan By Source (1000's of Metric Tons)
Jan Feb Mar Apr May Jun Jul Aug Sep Oct Nov Dec Total
Algeria 0 0 0 0 0 59 0 0 0 0 0 0 59Australia 238 178 177 185 231 232 424 176 0 0 0 0 1,841Brunei 99 34 66 159 60 0 0 0 0 0 0 0 418Egypt 0 0 0 0 58 0 0 0 0 0 0 0 58Equatorial Guinea 0 58 0 0 0 0 65 64 0 0 0 0 187Indonesia 391 451 454 460 133 230 177 285 0 0 0 0 2,581Malaysia 240 248 182 178 183 183 182 121 0 0 0 0 1,517Nigeria 0 0 0 0 60 61 129 64 62 0 0 0 376Oman 127 60 60 128 129 128 192 128 0 0 0 0 952Qatar 61 60 121 61 121 61 153 61 0 0 0 0 699Russia 129 0 0 0 0 62 65 64 0 0 0 0 320Trinidad 0 0 55 50 0 0 120 61 0 0 0 0 286US Re-export 0 0 0 0 0 56 0 0 0 0 0 0 56USA 0 0 0 35 0 0 0 0 0 0 0 0 352011 Total 1,285 1,089 1,115 1,256 975 1,072 1,507 1,024 62 0 0 0 9,385 Algeria 60 0 0 0 0 0 0 0 0 0 0 0 60Australia 229 300 305 242 182 252 129 297 111 237 237 238 2,759Brunei 67 66 33 33 33 66 33 99 33 67 0 66 596Egypt 0 0 0 0 60 0 0 60 0 0 0 0 120Equatorial Guinea 0 59 0 58 0 0 0 0 0 0 57 0 174Indonesia 496 458 464 564 401 504 619 391 559 382 280 488 5,606Malaysia 61 180 173 58 185 118 186 179 118 173 227 179 1,837Nigeria 60 0 0 0 0 0 0 0 0 0 0 0 60Oman 127 127 128 128 128 126 124 59 67 68 128 127 1,337Qatar 119 58 62 60 0 61 0 61 61 0 61 61 604Russia 64 65 65 0 0 64 62 65 0 64 0 0 449Trinidad 0 58 0 0 0 0 0 0 56 0 0 0 1142010 Total 1,283 1,371 1,230 1,143 989 1,191 1,153 1,211 1,005 991 990 1,159 13,716
Continued on following page

72
Continued from previous page
LNG Shipments Received In Osaka Region of Japan By Source (1000's of Metric Tons)
Australia 185 241 129 129 119 118 311 182 61 174 235 235 2,119Brunei 66 67 66 33 33 66 93 66 66 33 33 67 689Egypt 0 64 0 0 0 0 0 0 0 0 0 0 64Equatorial Guinea 0 0 0 0 0 0 64 64 0 56 0 58 242Indonesia 392 288 559 430 336 391 503 335 439 556 457 504 5,190Malaysia 182 180 165 118 58 57 57 175 178 0 61 175 1,406Nigeria 58 182 60 0 0 0 0 0 0 0 0 64 364Oman 61 123 59 61 59 60 125 60 129 60 68 60 925Qatar 61 60 0 61 60 0 60 61 60 60 121 61 665Russia 0 0 0 0 0 0 0 0 0 0 65 0 65Trinidad 0 0 0 0 0 0 0 0 0 0 50 0 502009 Total 1,005 1,205 1,038 832 665 692 1,213 943 933 939 1,090 1,224 11,779

73
LNG Shipments Received In Osaka Region of Japan By Source (Bcf)
Jan Feb Mar Apr May Jun Jul Aug Sep Oct Nov Dec Total
Algeria 0 0 0 0 0 2.82 0 0 0 0 0 0 2.82Australia 11.46 8.58 8.52 8.87 11.09 11.14 20.40 8.44 0 0 0 0 88.49Brunei 4.76 1.65 3.17 7.64 2.90 0 0 0 0 0 0 0 20.12Egypt 0 0 0 0 2.79 0 0 0 0 0 0 0 2.79Equatorial Guinea 0 2.79 0 0 0 0 3.13 3.07 0 0 0 0 9.00Indonesia 18.80 21.69 21.83 22.09 6.40 11.07 8.51 13.68 0 0 0 0 124.07Malaysia 11.53 11.94 8.77 8.57 8.81 8.78 8.75 5.84 0 0 0 0 73.00Nigeria 0 0 0 0 2.88 2.93 6.19 3.07 2.98 0 0 0 18.05Oman 6.11 2.87 2.87 6.16 6.18 6.14 9.24 6.16 0 0 0 0 45.72Qatar 2.91 2.87 5.83 2.93 5.82 2.91 7.35 2.92 0 0 0 0 33.53Russia 6.22 0 0 0 0 2.99 3.12 3.09 0 0 0 0 15.42Trinidad 0 0 2.66 2.43 0 0 5.79 2.93 0 0 0 0 13.80US Re-export 0 0 0 0 0 2.69 0 0 0 0 0 0 2.69USA 0 0 0 1.70 0 0 0 0 0 0 0 0 1.702011 Total 61.80 52.39 53.63 60.39 46.87 51.46 72.46 49.20 2.98 0 0 0 451.18 Algeria 2.90 0 0 0 0 0 0 0 0 0 0 0 2.90Australia 11.01 14.41 14.68 11.64 8.77 12.10 6.20 14.27 5.32 11.38 11.37 11.43 132.58Brunei 3.23 3.18 1.59 1.59 1.59 3.16 1.59 4.77 1.59 3.24 0 3.18 28.72Egypt 0 0 0 0 2.87 0 0 2.90 0 0 0 0 5.77Equatorial Guinea 0 2.82 0 2.78 0 0 0 0 0 0 2.76 0 8.35Indonesia 23.84 22.01 22.32 27.12 19.29 24.23 29.77 18.80 26.85 18.35 13.45 23.45 269.49Malaysia 2.93 8.67 8.32 2.81 8.92 5.68 8.93 8.60 5.69 8.29 10.90 8.59 88.33Nigeria 2.88 0 0 0 0 0 0 0 0 0 0 0 2.88Oman 6.10 6.10 6.13 6.17 6.15 6.07 5.97 2.85 3.24 3.26 6.16 6.13 64.32Qatar 5.73 2.81 2.96 2.89 0 2.92 0 2.92 2.91 0 2.91 2.91 28.96Russia 3.06 3.11 3.11 0 0 3.09 2.96 3.12 0 3.08 0 0 21.53Trinidad 0 2.80 0 0 0 0 0 0 2.68 0 0 0 5.482010 Total 61.68 65.91 59.11 55.00 47.59 57.25 55.42 58.22 48.29 47.60 47.55 55.69 659.31
Continued on following page

74
Continued from previous page
LNG Shipments Received In Osaka Region of Japan By Source (Bcf)
Australia 8.91 11.58 6.21 6.21 5.74 5.68 14.97 8.76 2.93 8.34 11.31 11.30 101.92Brunei 3.18 3.24 3.18 1.59 1.59 3.18 4.49 3.18 3.19 1.60 1.59 3.24 33.25Egypt 0 3.07 0 0 0 0 0 0 0 0 0 0 3.07Equatorial Guinea 0 0 0 0 0 0 3.09 3.09 0 2.71 0 2.77 11.66Indonesia 18.83 13.85 26.87 20.66 16.14 18.81 24.20 16.10 21.11 26.72 21.95 24.22 249.46Malaysia 8.75 8.64 7.93 5.68 2.78 2.73 2.73 8.44 8.56 0 2.91 8.43 67.59Nigeria 2.81 8.76 2.87 0 0 0 0 0 0 0 0 3.07 17.51Oman 2.95 5.91 2.85 2.92 2.86 2.88 6.01 2.87 6.18 2.90 3.26 2.89 44.47Qatar 2.94 2.87 0 2.92 2.87 0 2.89 2.91 2.90 2.87 5.83 2.91 31.90Russia 0 0 0 0 0 0 0 0 0 0 3.11 0 3.11Trinidad 0 0 0 0 0 0 0 0 0 0 2.42 0 2.422009 Total 48.36 57.92 49.91 39.97 31.97 33.28 58.38 45.35 44.87 45.14 52.38 58.84 566.37

75
LNG Shipments Received In the Sendai Region of Japan By Terminal (1000's of Metric Tons)
Jan Feb Mar Apr May Jun Jul Aug Sep Oct Nov Dec Total
Shin Minato Works 8 17 8 0 0 0 0 0 0 0 0 0 342011 Total 8 17 8 0 0 0 0 0 0 0 0 0 34 Shin Minato Works 8 17 16 9 17 17 8 17 17 17 8 17 1672010 Total 8 17 16 9 17 17 8 17 17 17 8 17 167 Shin Minato Works 0 17 8 17 8 16 16 0 16 8 17 8 1322009 Total 0 17 8 17 8 16 16 0 16 8 17 8 132
LNG Shipments Received In the Sendai Region of Japan By Terminal (Bcf)
Jan Feb Mar Apr May Jun Jul Aug Sep Oct Nov Dec Total
Shin Minato Works 0.40 0.81 0.40 0 0 0 0 0 0 0 0 0 1.612011 Total 0.40 0.81 0.40 0 0 0 0 0 0 0 0 0 1.61 Shin Minato Works 0.40 0.81 0.79 0.41 0.82 0.80 0.40 0.80 0.80 0.80 0.39 0.80 8.032010 Total 0.40 0.81 0.79 0.41 0.82 0.80 0.40 0.80 0.80 0.80 0.39 0.80 8.03 Shin Minato Works 0 0.81 0.38 0.80 0.38 0.79 0.79 0 0.79 0.41 0.80 0.40 6.362009 Total 0 0.81 0.38 0.80 0.38 0.79 0.79 0 0.79 0.41 0.80 0.40 6.36

76
LNG Shipments Received In Sendai Region of Japan By Source (1000's of Metric Tons)
Jan Feb Mar Apr May Jun Jul Aug Sep Oct Nov Dec Total
Malaysia 8 17 8 0 0 0 0 0 0 0 0 0 332011 Total 8 17 8 0 0 0 0 0 0 0 0 0 33 Malaysia 8 17 16 9 17 17 8 17 17 17 8 17 1682010 Total 8 17 16 9 17 17 8 17 17 17 8 17 168 Malaysia 0 17 8 17 8 16 16 0 16 8 17 8 1312009 Total 0 17 8 17 8 16 16 0 16 8 17 8 131
LNG Shipments Received In Sendai Region of Japan By Source (Bcf)
Jan Feb Mar Apr May Jun Jul Aug Sep Oct Nov Dec Total
Malaysia 0.40 0.81 0.40 0 0 0 0 0 0 0 0 0 1.612011 Total 0.40 0.81 0.40 0 0 0 0 0 0 0 0 0 1.61 Malaysia 0.40 0.81 0.79 0.41 0.82 0.80 0.40 0.80 0.80 0.80 0.39 0.80 8.032010 Total 0.40 0.81 0.79 0.41 0.82 0.80 0.40 0.80 0.80 0.80 0.39 0.80 8.03 Malaysia 0 0.81 0.38 0.80 0.38 0.79 0.79 0 0.79 0.41 0.80 0.40 6.362009 Total 0 0.81 0.38 0.80 0.38 0.79 0.79 0 0.79 0.41 0.80 0.40 6.36

77
LNG Shipments Received In the Suruga Bay Region of Japan By Terminal (1000's of Metric Tons)
Jan Feb Mar Apr May Jun Jul Aug Sep Oct Nov Dec Total
Sodeshi 121 61 123 124 61 63 121 65 0 0 0 0 7382011 Total 121 61 123 124 61 63 121 65 0 0 0 0 738 Sodeshi 64 58 66 121 59 121 58 57 61 122 128 62 9762010 Total 64 58 66 121 59 121 58 57 61 122 128 62 976 Sodeshi 58 58 0 57 55 65 57 0 60 65 0 61 5352009 Total 58 58 0 57 55 65 57 0 60 65 0 61 535
LNG Shipments Received In the Suruga Bay Region of Japan By Terminal (Bcf)
Jan Feb Mar Apr May Jun Jul Aug Sep Oct Nov Dec Total
Sodeshi 5.80 2.94 5.93 5.96 2.91 3.01 5.82 3.12 0 0 0 0 35.492011 Total 5.80 2.94 5.93 5.96 2.91 3.01 5.82 3.12 0 0 0 0 35.49 Sodeshi 3.09 2.79 3.16 5.80 2.82 5.84 2.76 2.76 2.91 5.84 6.18 2.99 46.942010 Total 3.09 2.79 3.16 5.80 2.82 5.84 2.76 2.76 2.91 5.84 6.18 2.99 46.94 Sodeshi 2.76 2.78 0 2.76 2.64 3.13 2.73 0 2.86 3.12 0 2.93 25.702009 Total 2.76 2.78 0 2.76 2.64 3.13 2.73 0 2.86 3.12 0 2.93 25.70

78
LNG Shipments Received In Suruga Bay Region of Japan By Source (1000's of Metric Tons)
Jan Feb Mar Apr May Jun Jul Aug Sep Oct Nov Dec Total
Australia 0 0 0 0 0 63 0 0 0 0 0 0 63Equatorial Guinea 0 0 0 0 0 0 60 0 0 0 0 0 60Malaysia 58 61 58 60 61 0 61 0 0 0 0 0 359Nigeria 63 0 0 0 0 0 0 0 0 0 0 0 63Russia 0 0 66 64 0 0 0 65 0 0 0 0 1952011 Total 121 61 124 124 61 63 121 65 0 0 0 0 740 Australia 0 0 66 0 0 64 0 0 0 0 64 0 194Malaysia 64 58 0 121 59 58 58 57 61 57 0 0 593Russia 0 0 0 0 0 0 0 0 0 64 65 62 1912010 Total 64 58 66 121 59 122 58 57 61 121 129 62 978 Australia 0 0 0 0 0 65 0 0 0 65 0 0 130Malaysia 58 58 0 57 55 0 57 0 60 0 0 61 4062009 Total 58 58 0 57 55 65 57 0 60 65 0 61 536
LNG Shipments Received In Suruga Bay Region of Japan By Source (Bcf)
Jan Feb Mar Apr May Jun Jul Aug Sep Oct Nov Dec Total
Australia 0 0 0 0 0 3.01 0 0 0 0 0 0 3.01Equatorial Guinea 0 0 0 0 0 0 2.90 0 0 0 0 0 2.90Malaysia 2.77 2.94 2.76 2.89 2.91 0 2.91 0 0 0 0 0 17.19Nigeria 3.03 0 0 0 0 0 0 0 0 0 0 0 3.03Russia 0 0 3.16 3.07 0 0 0 3.12 0 0 0 0 9.352011 Total 5.80 2.94 5.93 5.96 2.91 3.01 5.82 3.12 0 0 0 0 35.49 Australia 0 0 3.16 0 0 3.07 0 0 0 0 3.07 0 9.30Malaysia 3.09 2.79 0 5.80 2.82 2.76 2.76 2.76 2.91 2.76 0 0 28.47Russia 0 0 0 0 0 0 0 0 0 3.08 3.10 2.99 9.172010 Total 3.09 2.79 3.16 5.80 2.82 5.84 2.76 2.76 2.91 5.84 6.18 2.99 46.94 Australia 0 0 0 0 0 3.13 0 0 0 3.12 0 0 6.25Malaysia 2.76 2.78 0 2.76 2.64 0 2.73 0 2.86 0 0 2.93 19.452009 Total 2.76 2.78 0 2.76 2.64 3.13 2.73 0 2.86 3.12 0 2.93 25.70

79
LNG Shipments Received In the Tokyo Bay Region of Japan By Terminal (1000's of Metric Tons)
Jan Feb Mar Apr May Jun Jul Aug Sep Oct Nov Dec Total
Sodegaura 802 814 1,139 789 714 843 866 894 0 0 0 0 6,862Higashi-Ohgishima / Ohgishima 859 681 922 732 859 673 911 738 124 0 0 0 6,498Futtsu 857 796 788 887 766 846 937 818 61 0 0 0 6,756Negishi 398 435 356 441 271 360 377 335 0 0 0 0 2,9732011 Total 2,916 2,726 3,205 2,849 2,610 2,723 3,091 2,784 185 0 0 0 23,089 Sodegaura 766 743 965 639 871 607 784 962 767 883 750 1,029 9,765Higashi-Ohgishima / Ohgishima 790 702 834 671 688 682 736 823 927 538 790 786 8,966Futtsu 704 708 862 767 672 649 838 868 799 477 642 848 8,834Negishi 346 327 478 319 373 338 382 396 278 464 275 425 4,4022010 Total 2,605 2,480 3,140 2,396 2,604 2,276 2,739 3,049 2,771 2,361 2,457 3,088 31,967 Sodegaura 814 655 826 972 640 865 774 724 850 764 722 944 9,552Higashi-Ohgishima / Ohgishima 752 690 687 588 611 661 549 676 783 478 660 717 7,851Futtsu 793 664 817 609 672 552 715 604 672 745 692 725 8,261Negishi 280 438 428 365 249 281 272 441 218 316 256 473 4,0162009 Total 2,639 2,447 2,757 2,534 2,173 2,359 2,310 2,445 2,523 2,303 2,330 2,859 29,680
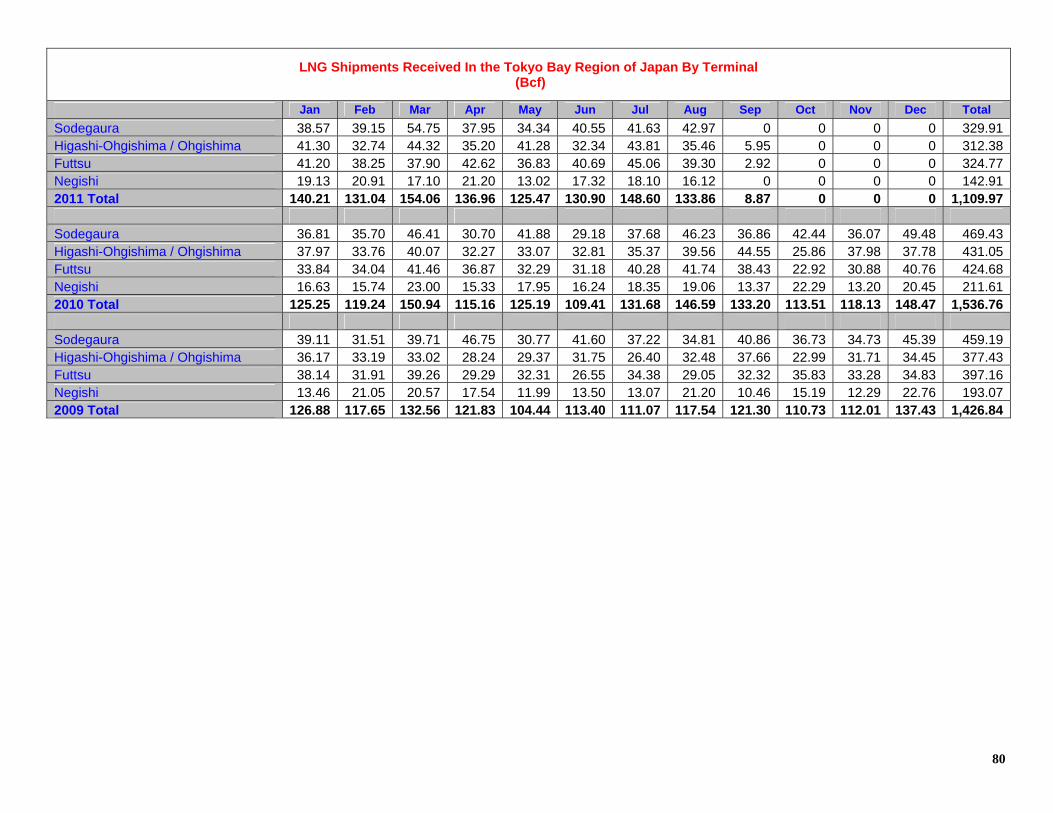
80
LNG Shipments Received In the Tokyo Bay Region of Japan By Terminal (Bcf)
Jan Feb Mar Apr May Jun Jul Aug Sep Oct Nov Dec Total
Sodegaura 38.57 39.15 54.75 37.95 34.34 40.55 41.63 42.97 0 0 0 0 329.91 Higashi-Ohgishima / Ohgishima 41.30 32.74 44.32 35.20 41.28 32.34 43.81 35.46 5.95 0 0 0 312.38 Futtsu 41.20 38.25 37.90 42.62 36.83 40.69 45.06 39.30 2.92 0 0 0 324.77 Negishi 19.13 20.91 17.10 21.20 13.02 17.32 18.10 16.12 0 0 0 0 142.91 2011 Total 140.21 131.04 154.06 136.96 125.47 130.90 148.60 133.86 8.87 0 0 0 1,109.97 Sodegaura 36.81 35.70 46.41 30.70 41.88 29.18 37.68 46.23 36.86 42.44 36.07 49.48 469.43 Higashi-Ohgishima / Ohgishima 37.97 33.76 40.07 32.27 33.07 32.81 35.37 39.56 44.55 25.86 37.98 37.78 431.05 Futtsu 33.84 34.04 41.46 36.87 32.29 31.18 40.28 41.74 38.43 22.92 30.88 40.76 424.68 Negishi 16.63 15.74 23.00 15.33 17.95 16.24 18.35 19.06 13.37 22.29 13.20 20.45 211.61 2010 Total 125.25 119.24 150.94 115.16 125.19 109.41 131.68 146.59 133.20 113.51 118.13 148.47 1,536.76 Sodegaura 39.11 31.51 39.71 46.75 30.77 41.60 37.22 34.81 40.86 36.73 34.73 45.39 459.19 Higashi-Ohgishima / Ohgishima 36.17 33.19 33.02 28.24 29.37 31.75 26.40 32.48 37.66 22.99 31.71 34.45 377.43 Futtsu 38.14 31.91 39.26 29.29 32.31 26.55 34.38 29.05 32.32 35.83 33.28 34.83 397.16 Negishi 13.46 21.05 20.57 17.54 11.99 13.50 13.07 21.20 10.46 15.19 12.29 22.76 193.07 2009 Total 126.88 117.65 132.56 121.83 104.44 113.40 111.07 117.54 121.30 110.73 112.01 137.43 1,426.84

81
LNG Shipments Received In Tokyo Bay Region of Japan By Source (1000's of Metric Tons)
Jan Feb Mar Apr May Jun Jul Aug Sep Oct Nov Dec Total
Abu Dhabi 484 421 407 366 421 539 539 477 120 0 0 0 3,774Australia 485 308 556 243 397 409 514 510 0 0 0 0 3,422Brunei 395 520 487 361 399 396 586 452 0 0 0 0 3,596Egypt 61 0 0 0 59 0 68 0 0 0 0 0 188Equatorial Guinea 0 0 0 0 0 61 0 68 0 0 0 0 129Indonesia 111 111 178 0 166 233 125 0 0 0 0 0 924Malaysia 850 719 783 1,035 540 711 709 601 0 0 0 0 5,948Nigeria 0 0 120 0 57 0 0 0 64 0 0 0 241Oman 127 126 63 127 192 0 128 251 0 0 0 0 1,014Peru 0 0 0 63 68 0 0 68 0 0 0 0 199Qatar 121 0 190 209 59 64 61 61 0 0 0 0 765Russia 257 451 385 444 252 311 322 257 0 0 0 0 2,679USA 25 70 36 0 0 0 39 39 0 0 0 0 2092011 Total 2,916 2,726 3,205 2,848 2,610 2,724 3,091 2,784 184 0 0 0 23,088 Abu Dhabi 423 487 422 425 547 427 364 431 365 365 428 420 5,104Australia 363 368 564 429 251 382 497 513 428 383 368 439 4,985Belgium Re-export 0 0 0 0 0 0 0 0 0 0 64 0 64Brunei 522 462 426 396 489 300 495 429 428 461 368 555 5,331Egypt 0 0 0 0 0 0 62 0 63 0 63 0 188Equatorial Guinea 0 59 59 0 0 0 0 62 0 0 0 0 180Indonesia 109 55 113 55 111 55 55 0 55 54 116 161 939Malaysia 775 666 756 549 849 468 727 720 841 593 635 907 8,486Nigeria 0 0 0 0 0 0 0 59 170 0 0 0 229Oman 127 0 255 0 63 63 63 63 64 0 0 64 762Qatar 0 59 62 59 0 61 120 120 0 0 61 121 663Russia 252 255 448 446 258 449 320 516 321 319 320 387 4,291USA 36 71 35 35 36 71 36 71 36 132 36 35 630Yemen 0 0 0 0 0 0 0 65 0 54 0 0 1192010 Total 2,607 2,482 3,140 2,394 2,604 2,276 2,739 3,049 2,771 2,361 2,459 3,089 31,971
Continued on following page

82
Continued from previous page
LNG Shipments Received In Tokyo Bay Region of Japan By Source (1000's of Metric Tons)
Abu Dhabi 480 477 481 421 487 426 365 481 541 421 188 368 5,136Australia 561 503 568 494 502 368 504 434 425 248 503 499 5,609Brunei 462 428 496 523 332 457 428 488 428 461 395 582 5,480Egypt 0 0 60 0 0 0 0 0 0 0 0 0 60Equatorial Guinea 60 60 0 59 0 59 0 0 64 58 0 58 418Indonesia 55 171 0 107 0 0 0 0 109 55 57 112 666Malaysia 834 643 857 709 566 697 648 592 597 603 710 771 8,227Oman 65 65 189 0 63 63 66 63 64 64 64 64 830Qatar 61 60 60 61 61 61 60 0 0 0 121 61 606Russia 0 0 0 130 127 193 192 316 259 322 256 255 2,050Trinidad 0 0 0 0 0 0 0 0 0 0 0 54 54USA 62 40 48 31 36 35 47 71 36 71 35 35 5472009 Total 2,640 2,447 2,759 2,535 2,174 2,359 2,310 2,445 2,523 2,303 2,329 2,859 29,683

83
LNG Shipments Received In Tokyo Bay Region of Japan By Source (Bcf)
Jan Feb Mar Apr May Jun Jul Aug Sep Oct Nov Dec Total
Abu Dhabi 23.28 20.26 19.58 17.60 20.26 25.92 25.90 22.93 5.78 0 0 0 181.52Australia 23.33 14.79 26.71 11.68 19.06 19.65 24.72 24.50 0 0 0 0 164.43Brunei 19.01 25.02 23.40 17.37 19.16 19.04 28.17 21.75 0 0 0 0 172.92Egypt 2.94 0 0 0 2.85 0 3.29 0 0 0 0 0 9.07Equatorial Guinea 0 0 0 0 0 2.91 0 3.29 0 0 0 0 6.20Indonesia 5.32 5.32 8.56 0 7.96 11.20 5.99 0 0 0 0 0 44.35Malaysia 40.85 34.54 37.63 49.76 25.96 34.16 34.10 28.90 0 0 0 0 285.90Nigeria 0 0 5.79 0 2.76 0 0 0 3.09 0 0 0 11.63Oman 6.12 6.08 3.04 6.11 9.23 0 6.15 12.08 0 0 0 0 48.80Peru 0 0 0 3.05 3.27 0 0 3.26 0 0 0 0 9.58Qatar 5.82 0 9.15 10.06 2.83 3.07 2.91 2.91 0 0 0 0 36.76Russia 12.37 21.67 18.50 21.33 12.14 14.94 15.50 12.34 0 0 0 0 128.79USA 1.18 3.36 1.71 0 0 0 1.89 1.89 0 0 0 0 10.022011 Total 140.21 131.04 154.06 136.96 125.47 130.90 148.60 133.86 8.87 0 0 0 1,109.97 Abu Dhabi 20.34 23.40 20.28 20.44 26.28 20.53 17.50 20.70 17.55 17.55 20.57 20.19 245.33Australia 17.44 17.70 27.12 20.62 12.08 18.37 23.92 24.66 20.56 18.41 17.70 21.08 239.68Belgium Re-export 0 0 0 0 0 0 0 0 0 0 3.07 0 3.07Brunei 25.07 22.21 20.48 19.04 23.50 14.41 23.80 20.63 20.57 22.15 17.68 26.67 256.21Egypt 0 0 0 0 0 0 3.00 0 3.01 0 3.03 0 9.04Equatorial Guinea 0 2.82 2.83 0 0 0 0 2.99 0 0 0 0 8.64Indonesia 5.25 2.62 5.41 2.64 5.34 2.66 2.64 0 2.66 2.60 5.56 7.74 45.13Malaysia 37.26 32.01 36.36 26.41 40.84 22.51 34.94 34.63 40.44 28.51 30.53 43.60 408.03Nigeria 0 0 0 0 0 0 0 2.86 8.18 0 0 0 11.03Oman 6.10 0 12.25 0 3.03 3.03 3.01 3.01 3.06 0 0 3.06 36.55Qatar 0 2.81 2.96 2.84 0 2.92 5.78 5.78 0 0 2.91 5.83 31.84Russia 12.09 12.26 21.54 21.47 12.40 21.56 15.36 24.79 15.46 15.34 15.36 18.60 206.24USA 1.71 3.41 1.70 1.70 1.71 3.42 1.71 3.43 1.71 6.34 1.71 1.70 30.25Yemen 0 0 0 0 0 0 0 3.11 0 2.61 0 0 5.722010 Total 125.25 119.24 150.94 115.16 125.19 109.41 131.68 146.59 133.20 113.51 118.13 148.47 1,536.76
Continued on following page
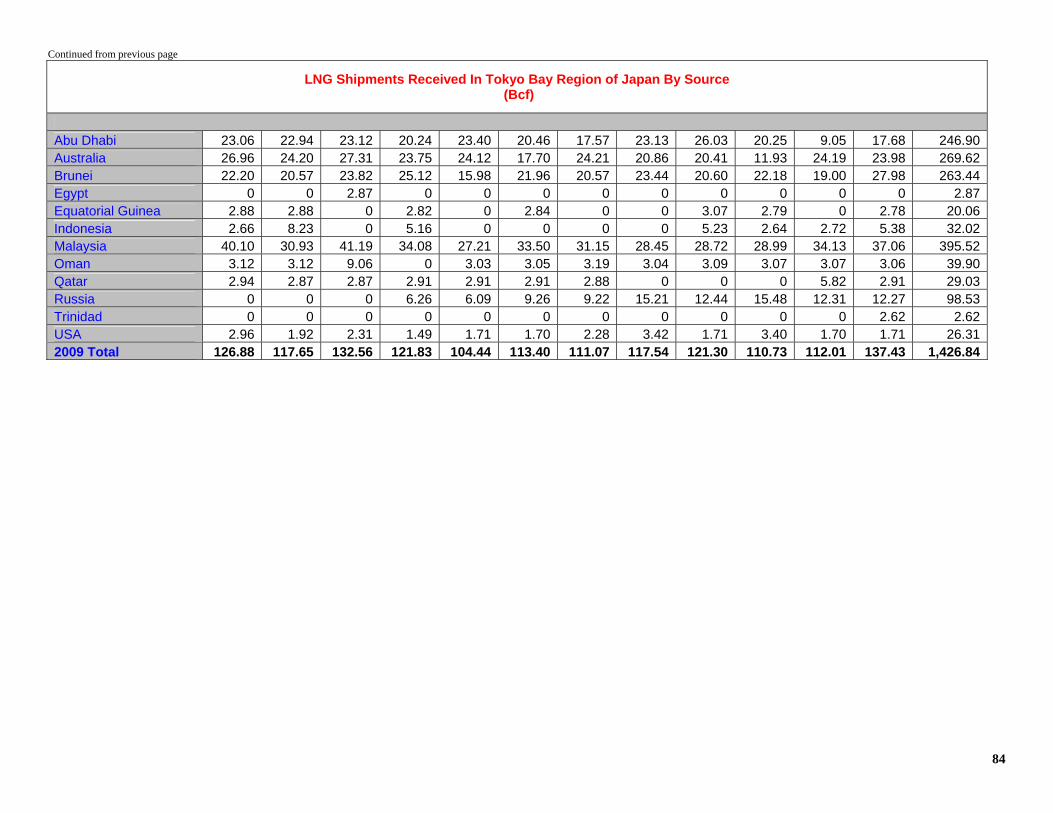
84
Continued from previous page
LNG Shipments Received In Tokyo Bay Region of Japan By Source (Bcf)
Abu Dhabi 23.06 22.94 23.12 20.24 23.40 20.46 17.57 23.13 26.03 20.25 9.05 17.68 246.90Australia 26.96 24.20 27.31 23.75 24.12 17.70 24.21 20.86 20.41 11.93 24.19 23.98 269.62Brunei 22.20 20.57 23.82 25.12 15.98 21.96 20.57 23.44 20.60 22.18 19.00 27.98 263.44Egypt 0 0 2.87 0 0 0 0 0 0 0 0 0 2.87Equatorial Guinea 2.88 2.88 0 2.82 0 2.84 0 0 3.07 2.79 0 2.78 20.06Indonesia 2.66 8.23 0 5.16 0 0 0 0 5.23 2.64 2.72 5.38 32.02Malaysia 40.10 30.93 41.19 34.08 27.21 33.50 31.15 28.45 28.72 28.99 34.13 37.06 395.52Oman 3.12 3.12 9.06 0 3.03 3.05 3.19 3.04 3.09 3.07 3.07 3.06 39.90Qatar 2.94 2.87 2.87 2.91 2.91 2.91 2.88 0 0 0 5.82 2.91 29.03Russia 0 0 0 6.26 6.09 9.26 9.22 15.21 12.44 15.48 12.31 12.27 98.53Trinidad 0 0 0 0 0 0 0 0 0 0 0 2.62 2.62USA 2.96 1.92 2.31 1.49 1.71 1.70 2.28 3.42 1.71 3.40 1.70 1.71 26.312009 Total 126.88 117.65 132.56 121.83 104.44 113.40 111.07 117.54 121.30 110.73 112.01 137.43 1,426.84

85
LNG Shipments Received In the Western Inland Sea Region of Japan By Terminal (1000's of Metric Tons)
Jan Feb Mar Apr May Jun Jul Aug Sep Oct Nov Dec Total
Hatsukaichi 46 36 17 45 19 27 29 46 0 0 0 0 264Mizushima 56 56 63 56 119 53 55 126 0 0 0 0 585Sakaide 0 61 0 60 0 58 0 58 0 0 0 0 237Yanai 124 118 56 241 0 63 181 174 0 0 0 0 9582011 Total 226 270 136 402 138 202 265 404 0 0 0 0 2,043 Hatsukaichi 35 27 19 35 46 27 8 19 37 37 37 27 354Mizushima 55 55 64 56 55 62 62 63 61 64 62 64 723Sakaide 60 0 0 61 0 61 0 57 0 61 0 58 658Yanai 117 120 172 119 117 179 120 62 147 142 120 173 1,5872010 Total 267 202 254 272 218 329 190 200 245 304 219 321 3,021 Hatsukaichi 44 19 27 35 27 36 36 37 17 46 36 27 388Mizushima 39 0 63 64 56 55 56 63 64 58 64 56 639Yanai 106 99 17 173 119 176 121 111 111 119 167 119 1,4382009 Total 190 118 106 272 202 267 213 211 192 223 267 202 2,465

86
LNG Shipments Received In the Western Inland Sea Region of Japan By Terminal (Bcf)
Jan Feb Mar Apr May Jun Jul Aug Sep Oct Nov Dec Total
Hatsukaichi 2.21 1.71 0.81 2.15 0.89 1.30 1.39 2.21 0 0 0 0 12.67Mizushima 2.69 2.68 3.04 2.71 5.73 2.57 2.66 6.05 0 0 0 0 28.14Sakaide 0 2.93 0 2.90 0 2.77 0 2.76 0 0 0 0 11.36Yanai 5.96 5.68 0 11.59 0 3.06 8.71 8.38 0 0 0 0 46.072011 Total 10.87 13.00 6.54 19.35 6.62 9.70 12.76 19.40 0 0 0 0 98.24 Hatsukaichi 1.69 1.29 0.90 1.70 2.21 1.32 0.40 0.90 1.79 1.76 1.79 1.28 17.03Mizushima 2.62 2.66 3.06 2.70 2.66 2.98 3.00 3.01 2.93 3.08 2.98 3.06 34.74Sakaide 2.88 0 0 2.91 0 2.91 0 2.76 0 2.91 0 2.76 16.93Yanai 5.63 5.75 8.26 5.75 5.62 8.61 5.75 2.95 7.08 7.07 5.78 8.33 76.562010 Total 12.82 9.70 12.21 13.06 10.49 15.82 9.15 9.62 11.80 14.62 10.54 15.43 145.25 Hatsukaichi 2.13 0.93 1.29 1.72 1.30 1.72 1.72 1.79 0.82 2.20 1.75 1.31 18.68Mizushima 1.90 0 3.02 3.09 2.70 2.66 2.70 3.04 3.09 2.80 3.07 2.68 30.74Yanai 5.09 4.75 0.80 8.33 5.73 8.46 5.84 5.32 5.32 5.74 8.03 5.73 69.132009 Total 9.11 5.68 5.11 13.13 9.73 12.85 10.25 10.16 9.23 10.73 12.85 9.72 118.55
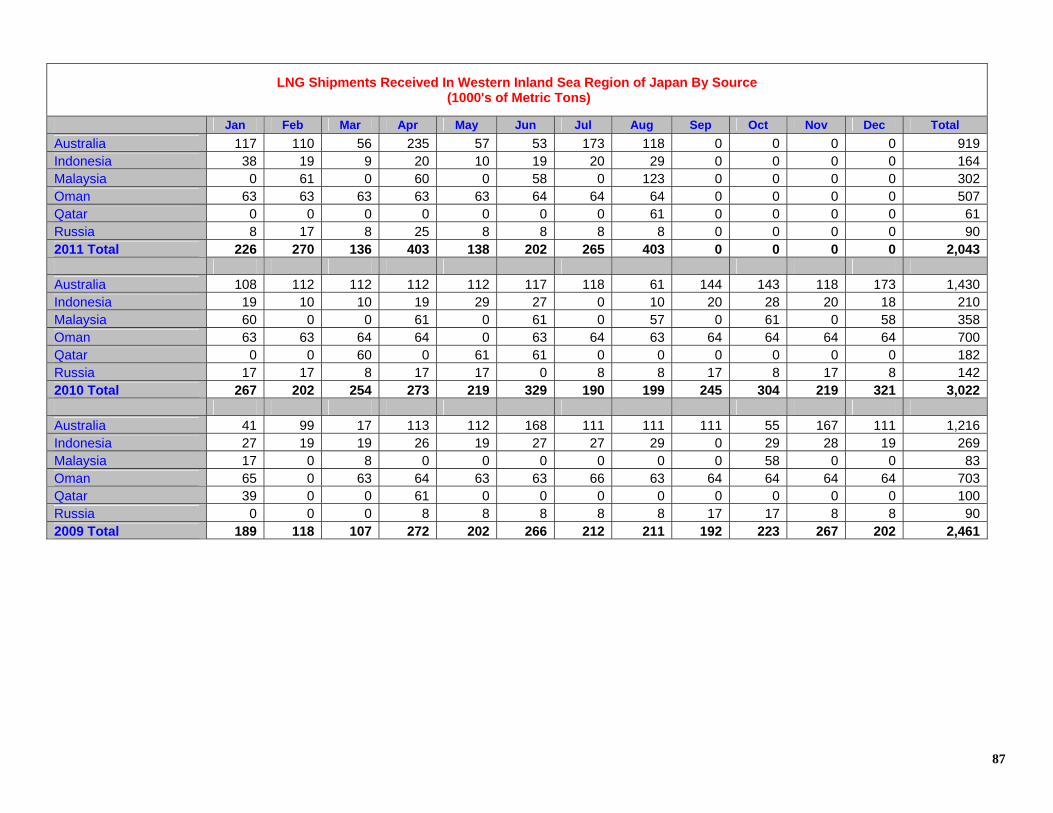
87
LNG Shipments Received In Western Inland Sea Region of Japan By Source (1000's of Metric Tons)
Jan Feb Mar Apr May Jun Jul Aug Sep Oct Nov Dec Total
Australia 117 110 56 235 57 53 173 118 0 0 0 0 919Indonesia 38 19 9 20 10 19 20 29 0 0 0 0 164Malaysia 0 61 0 60 0 58 0 123 0 0 0 0 302Oman 63 63 63 63 63 64 64 64 0 0 0 0 507Qatar 0 0 0 0 0 0 0 61 0 0 0 0 61Russia 8 17 8 25 8 8 8 8 0 0 0 0 902011 Total 226 270 136 403 138 202 265 403 0 0 0 0 2,043 Australia 108 112 112 112 112 117 118 61 144 143 118 173 1,430Indonesia 19 10 10 19 29 27 0 10 20 28 20 18 210Malaysia 60 0 0 61 0 61 0 57 0 61 0 58 358Oman 63 63 64 64 0 63 64 63 64 64 64 64 700Qatar 0 0 60 0 61 61 0 0 0 0 0 0 182Russia 17 17 8 17 17 0 8 8 17 8 17 8 1422010 Total 267 202 254 273 219 329 190 199 245 304 219 321 3,022 Australia 41 99 17 113 112 168 111 111 111 55 167 111 1,216Indonesia 27 19 19 26 19 27 27 29 0 29 28 19 269Malaysia 17 0 8 0 0 0 0 0 0 58 0 0 83Oman 65 0 63 64 63 63 66 63 64 64 64 64 703Qatar 39 0 0 61 0 0 0 0 0 0 0 0 100Russia 0 0 0 8 8 8 8 8 17 17 8 8 902009 Total 189 118 107 272 202 266 212 211 192 223 267 202 2,461

88
LNG Shipments Received In Western Inland Sea Region of Japan By Source (Bcf)
Jan Feb Mar Apr May Jun Jul Aug Sep Oct Nov Dec Total
Australia 5.61 5.31 2.69 11.29 2.72 2.57 8.30 5.69 0 0 0 0 44.17Indonesia 1.81 0.90 0.41 0.97 0.48 0.89 0.98 1.39 0 0 0 0 7.84Malaysia 0 2.93 0 2.90 0 2.77 0 5.93 0 0 0 0 14.53Oman 3.05 3.04 3.04 3.01 3.01 3.06 3.07 3.07 0 0 0 0 24.36Qatar 0 0 0 0 0 0 0 2.91 0 0 0 0 2.91Russia 0.41 0.81 0.41 1.18 0.41 0.41 0.41 0.41 0 0 0 0 4.432011 Total 10.87 13.00 6.54 19.35 6.62 9.70 12.76 19.40 0 0 0 0 98.24 Australia 5.21 5.37 5.37 5.36 5.36 5.64 5.68 2.95 6.95 6.86 5.68 8.33 68.75Indonesia 0.89 0.48 0.49 0.90 1.40 1.32 0 0.49 0.98 1.36 0.98 0.88 10.16Malaysia 2.88 0 0 2.92 0 2.92 0 2.76 0 2.92 0 2.76 17.16Oman 3.04 3.04 3.06 3.08 0 3.03 3.07 3.01 3.06 3.08 3.07 3.06 33.60Qatar 0 0 2.89 0 2.91 2.91 0 0 0 0 0 0 8.71Russia 0.80 0.81 0.41 0.80 0.81 0 0.40 0.41 0.81 0.40 0.81 0.41 6.872010 Total 12.82 9.70 12.21 13.06 10.49 15.82 9.15 9.62 11.80 14.62 10.54 15.43 145.25 Australia 1.97 4.75 0.80 5.41 5.41 8.07 5.36 5.32 5.32 2.66 8.03 5.35 58.45Indonesia 1.32 0.93 0.90 1.32 0.90 1.32 1.32 1.39 0 1.39 1.35 0.91 13.04Malaysia 0.81 0 0.38 0 0 0 0 0 0 2.80 0 0 3.99Oman 3.12 0 3.02 3.09 3.03 3.05 3.18 3.04 3.09 3.07 3.07 3.06 33.81Qatar 1.90 0 0 2.91 0 0 0 0 0 0 0 0 4.81Russia 0 0 0 0.40 0.40 0.41 0.40 0.40 0.82 0.81 0.41 0.40 4.452009 Total 9.11 5.68 5.11 13.13 9.73 12.85 10.25 10.16 9.23 10.73 12.85 9.72 118.55

89
Waterborne Energy, Inc.
2323 S. Shepherd Dr. Suite 1010 Houston, Texas
77019 713/526-1555 www.waterbornelng.com
26 Aug 2011
Vol. 8, Week 33
Japan By Terminal

90
LNG Shipments Received In Chita, Japan by Source (1000's of Metric Tons)
Jan Feb Mar Apr May Jun Jul Aug Sep Oct Nov Dec Total
Australia 230 179 174 55 119 170 177 237 0 0 0 0 1,341Egypt 0 0 0 0 0 0 0 64 0 0 0 0 64Indonesia 172 181 166 54 56 0 120 56 0 0 0 0 805Malaysia 122 191 121 117 119 0 125 0 0 0 0 0 795Nigeria 0 0 0 0 0 61 61 64 0 0 0 0 186Qatar 274 286 241 425 329 436 274 334 121 0 0 0 2,720Russia 0 0 0 64 64 65 65 127 0 0 0 0 3852011 Total 798 837 702 715 687 732 822 882 121 0 0 0 6,296 Australia 174 178 119 55 112 56 176 121 176 55 112 56 1,390Indonesia 166 55 168 167 224 56 55 280 112 55 224 217 1,779Malaysia 121 58 60 62 0 118 61 61 57 61 55 185 899Nigeria 0 0 0 0 0 0 0 0 57 0 113 0 170Qatar 339 416 314 215 214 334 387 323 354 338 335 362 3,931Russia 0 65 0 0 0 130 0 0 66 0 0 0 2612010 Total 800 772 661 499 550 694 679 785 822 509 839 820 8,430 Australia 178 56 113 120 119 56 167 112 112 56 246 233 1,568Egypt 0 0 60 0 0 0 0 0 0 0 0 0 60Indonesia 167 346 224 108 224 112 391 56 164 111 57 112 2,072Malaysia 176 180 55 57 55 180 0 118 116 120 121 0 1,178Qatar 124 119 300 241 182 181 180 423 301 242 182 487 2,962Russia 0 0 0 0 0 0 0 64 0 127 65 0 2562009 Total 645 701 752 526 580 529 738 773 693 656 671 832 8,096

91
LNG Shipments Received In Chita, Japan by Source (Bcf)
Jan Feb Mar Apr May Jun Jul Aug Sep Oct Nov Dec Total
Australia 11.06 8.62 8.36 2.63 5.73 8.17 8.53 11.42 0 0 0 0 64.54Egypt 0 0 0 0 0 0 0 3.07 0 0 0 0 3.07Indonesia 8.28 8.68 7.97 2.61 2.68 0 5.78 2.70 0 0 0 0 38.71Malaysia 5.85 9.16 5.83 5.61 5.72 0 5.99 0 0 0 0 0 38.16Nigeria 0 0 0 0 0 2.93 2.93 3.07 0 0 0 0 8.93Qatar 13.19 13.73 11.60 20.41 15.80 20.97 13.15 16.06 5.83 0 0 0 130.74Russia 0 0 0 3.08 3.09 3.12 3.12 6.11 0 0 0 0 18.522011 Total 38.38 40.20 33.77 34.35 33.02 35.19 39.50 42.43 5.83 0 0 0 302.67 Australia 8.35 8.54 5.73 2.66 5.36 2.70 8.45 5.80 8.48 2.66 5.36 2.71 66.82Indonesia 7.96 2.63 8.09 8.01 10.75 2.69 2.65 13.44 5.38 2.62 10.76 10.44 85.42Malaysia 5.84 2.79 2.88 2.97 0 5.68 2.93 2.91 2.76 2.91 2.65 8.91 43.25Nigeria 0 0 0 0 0 0 0 0 2.75 0 5.42 0 8.17Qatar 16.28 19.98 15.10 10.33 10.28 16.06 18.58 15.54 17.00 16.24 16.11 17.40 188.90Russia 0 3.11 0 0 0 6.24 0 0 3.17 0 0 0 12.522010 Total 38.43 37.04 31.80 23.97 26.39 33.37 32.61 37.70 39.55 24.44 40.32 39.47 405.08 Australia 8.54 2.67 5.41 5.78 5.73 2.70 8.03 5.36 5.41 2.70 11.81 11.22 75.38Egypt 0 0 2.87 0 0 0 0 0 0 0 0 0 2.87Indonesia 8.05 16.61 10.75 5.17 10.75 5.38 18.82 2.67 7.91 5.34 2.76 5.39 99.58Malaysia 8.44 8.64 2.65 2.76 2.64 8.65 0 5.68 5.57 5.75 5.83 0 56.61Qatar 5.95 5.74 14.42 11.60 8.75 8.69 8.64 20.35 14.46 11.65 8.73 23.43 142.43Russia 0 0 0 0 0 0 0 3.10 0 6.11 3.11 0 12.322009 Total 30.98 33.67 36.09 25.32 27.87 25.42 35.49 37.16 33.34 31.56 32.24 40.04 389.20

92
LNG Shipments Received In Fukuoka, Japan by Source (1000's of Metric Tons)
Jan Feb Mar Apr May Jun Jul Aug Sep Oct Nov Dec Total
Malaysia 25 25 38 42 25 25 25 25 0 0 0 0 2302011 Total 25 25 38 42 25 25 25 25 0 0 0 0 230 Malaysia 17 17 16 34 17 25 17 33 8 33 16 33 2662010 Total 17 17 16 34 17 25 17 33 8 33 16 33 266 Malaysia 25 25 24 33 16 41 25 25 25 17 25 8 2892009 Total 25 25 24 33 16 41 25 25 25 17 25 8 289
LNG Shipments Received In Fukuoka, Japan by Source (Bcf)
Jan Feb Mar Apr May Jun Jul Aug Sep Oct Nov Dec Total
Malaysia 1.21 1.21 1.81 2.00 1.18 1.19 1.20 1.20 0 0 0 0 11.002011 Total 1.21 1.21 1.81 2.00 1.18 1.19 1.20 1.20 0 0 0 0 11.00 Malaysia 0.80 0.81 0.79 1.64 0.82 1.20 0.80 1.61 0.40 1.61 0.77 1.61 12.852010 Total 0.80 0.81 0.79 1.64 0.82 1.20 0.80 1.61 0.40 1.61 0.77 1.61 12.85 Malaysia 1.20 1.21 1.15 1.61 0.77 1.98 1.19 1.20 1.18 0.81 1.20 0.40 13.912009 Total 1.20 1.21 1.15 1.61 0.77 1.98 1.19 1.20 1.18 0.81 1.20 0.40 13.91

93
LNG Shipments Received In Futtsu, Japan by Source (1000's of Metric Tons)
Jan Feb Mar Apr May Jun Jul Aug Sep Oct Nov Dec Total
Abu Dhabi 365 240 290 123 122 304 117 181 61 0 0 0 1,803Australia 242 57 123 64 139 113 320 133 0 0 0 0 1,191Brunei 0 0 0 0 0 0 60 0 0 0 0 0 60Indonesia 0 55 68 0 0 68 68 0 0 0 0 0 259Malaysia 60 60 120 174 124 178 115 120 0 0 0 0 951Nigeria 0 0 60 0 57 0 0 0 0 0 0 0 117Oman 127 126 0 0 192 0 128 128 0 0 0 0 701Peru 0 0 0 63 68 0 0 68 0 0 0 0 199Qatar 0 0 0 209 0 64 0 61 0 0 0 0 334Russia 64 257 127 253 64 119 129 128 0 0 0 0 1,1412011 Total 858 795 788 886 766 846 937 819 61 0 0 0 6,756 Abu Dhabi 122 426 182 243 365 122 244 184 304 304 245 180 2,921Australia 121 0 120 115 60 64 126 189 124 0 60 124 1,103Belgium Re-export 0 0 0 0 0 0 0 0 0 0 64 0 64Brunei 33 33 0 34 65 33 33 0 0 0 33 0 264Indonesia 0 0 0 0 0 0 0 0 0 0 0 54 54Malaysia 239 58 177 119 119 174 120 119 60 118 114 178 1,595Nigeria 0 0 0 0 0 0 0 59 55 0 0 0 114Oman 127 0 191 0 63 63 63 0 64 0 0 64 635Qatar 0 0 0 0 0 0 61 60 0 0 0 121 242Russia 63 191 192 255 0 192 192 193 193 0 127 128 1,726Yemen 0 0 0 0 0 0 0 65 0 54 0 0 1192010 Total 705 708 862 766 672 648 839 869 800 476 643 849 8,837 Abu Dhabi 240 176 239 360 245 60 183 298 359 241 126 185 2,712Australia 124 188 250 121 183 123 120 0 64 123 189 60 1,545Brunei 66 66 28 67 0 0 34 0 0 68 66 0 395Malaysia 237 233 174 61 55 178 123 117 121 122 120 234 1,775Oman 65 0 126 0 63 63 66 63 0 64 64 64 638Qatar 61 0 0 0 0 0 60 0 0 0 0 0 121Russia 0 0 0 0 127 128 128 126 129 128 127 128 1,021Trinidad 0 0 0 0 0 0 0 0 0 0 0 54 542009 Total 793 663 817 609 673 552 714 604 673 746 692 725 8,261

94
LNG Shipments Received In Futtsu, Japan by Source (Bcf)
Jan Feb Mar Apr May Jun Jul Aug Sep Oct Nov Dec Total
Abu Dhabi 17.53 11.54 13.96 5.92 5.86 14.63 5.61 8.68 2.92 0 0 0 86.65Australia 11.62 2.74 5.89 3.06 6.68 5.44 15.40 6.37 0 0 0 0 57.19Brunei 0 0 0 0 0 0 2.90 0 0 0 0 0 2.90Indonesia 0 2.65 3.25 0 0 3.25 3.29 0 0 0 0 0 12.43Malaysia 2.86 2.89 5.78 8.35 5.98 8.58 5.52 5.78 0 0 0 0 45.74Nigeria 0 0 2.89 0 2.76 0 0 0 0 0 0 0 5.65Oman 6.12 6.08 0 0 9.23 0 6.15 6.15 0 0 0 0 33.72Peru 0 0 0 3.05 3.27 0 0 3.26 0 0 0 0 9.58Qatar 0 0 0 10.06 0 3.07 0 2.91 0 0 0 0 16.04Russia 3.07 12.35 6.13 12.17 3.07 5.72 6.19 6.15 0 0 0 0 54.852011 Total 41.20 38.25 37.90 42.62 36.83 40.69 45.06 39.30 2.92 0 0 0 324.77 Abu Dhabi 5.85 20.47 8.73 11.69 17.53 5.88 11.71 8.85 14.60 14.63 11.79 8.64 140.37Australia 5.81 0 5.79 5.52 2.86 3.07 6.04 9.09 5.98 0 2.86 5.96 52.98Belgium Re-export 0 0 0 0 0 0 0 0 0 0 3.07 0 3.07Brunei 1.59 1.59 0 1.65 3.14 1.58 1.59 0 0 0 1.59 0 12.73Indonesia 0 0 0 0 0 0 0 0 0 0 0 2.57 2.57Malaysia 11.48 2.78 8.52 5.73 5.73 8.38 5.78 5.72 2.86 5.68 5.46 8.55 76.67Nigeria 0 0 0 0 0 0 0 2.86 2.67 0 0 0 5.52Oman 6.10 0 9.17 0 3.03 3.03 3.01 0 3.06 0 0 3.06 30.46Qatar 0 0 0 0 0 0 2.91 2.87 0 0 0 5.83 11.61Russia 3.01 9.19 9.24 12.28 0 9.23 9.23 9.26 9.26 0 6.11 6.14 82.96Yemen 0 0 0 0 0 0 0 3.11 0 2.61 0 0 5.722010 Total 33.84 34.04 41.46 36.87 32.29 31.18 40.28 41.74 38.43 22.92 30.88 40.76 424.68 Abu Dhabi 11.54 8.47 11.49 17.31 11.76 2.89 8.80 14.34 17.25 11.58 6.05 8.87 130.35Australia 5.97 9.06 12.03 5.83 8.80 5.94 5.78 0 3.07 5.94 9.06 2.88 74.36Brunei 3.18 3.18 1.32 3.24 0 0 1.65 0 0 3.25 3.18 0 19.00Malaysia 11.40 11.20 8.38 2.91 2.64 8.53 5.92 5.63 5.81 5.84 5.79 11.24 85.29Oman 3.12 0 6.04 0 3.03 3.05 3.19 3.04 0 3.07 3.07 3.06 30.67Qatar 2.94 0 0 0 0 0 2.88 0 0 0 0 0 5.82Russia 0 0 0 0 6.09 6.14 6.16 6.04 6.19 6.15 6.13 6.16 49.06Trinidad 0 0 0 0 0 0 0 0 0 0 0 2.62 2.622009 Total 38.14 31.91 39.26 29.29 32.31 26.55 34.38 29.05 32.32 35.83 33.28 34.83 397.16

95
LNG Shipments Received In Hatsukaichi, Japan by Source (1000's of Metric Tons)
Jan Feb Mar Apr May Jun Jul Aug Sep Oct Nov Dec Total
Indonesia 38 19 9 20 10 19 20 29 0 0 0 0 164Malaysia 0 0 0 0 0 0 0 8 0 0 0 0 8Russia 8 17 8 25 8 8 8 8 0 0 0 0 902011 Total 46 36 17 45 18 27 28 45 0 0 0 0 262 Indonesia 19 10 10 19 29 27 0 10 20 28 20 18 210Russia 17 17 8 17 17 0 8 8 17 8 17 8 1422010 Total 36 27 18 36 46 27 8 18 37 36 37 26 352 Indonesia 27 19 19 26 19 27 27 29 0 29 28 19 269Malaysia 17 0 8 0 0 0 0 0 0 0 0 0 25Russia 0 0 0 8 8 8 8 8 17 17 8 8 902009 Total 44 19 27 34 27 35 35 37 17 46 36 27 384
LNG Shipments Received In Hatsukaichi, Japan by Source (Bcf)
Jan Feb Mar Apr May Jun Jul Aug Sep Oct Nov Dec Total
Indonesia 1.81 0.90 0.41 0.97 0.48 0.89 0.98 1.39 0 0 0 0 7.84Malaysia 0 0 0 0 0 0 0 0.41 0 0 0 0 0.41Russia 0.41 0.81 0.41 1.18 0.41 0.41 0.41 0.41 0 0 0 0 4.432011 Total 2.21 1.71 0.81 2.15 0.89 1.30 1.39 2.21 0 0 0 0 12.67 Indonesia 0.89 0.48 0.49 0.90 1.40 1.32 0 0.49 0.98 1.36 0.98 0.88 10.16Russia 0.80 0.81 0.41 0.80 0.81 0 0.40 0.41 0.81 0.40 0.81 0.41 6.872010 Total 1.69 1.29 0.90 1.70 2.21 1.32 0.40 0.90 1.79 1.76 1.79 1.28 17.03 Indonesia 1.32 0.93 0.90 1.32 0.90 1.32 1.32 1.39 0 1.39 1.35 0.91 13.04Malaysia 0.81 0 0.38 0 0 0 0 0 0 0 0 0 1.19Russia 0 0 0 0.40 0.40 0.41 0.40 0.40 0.82 0.81 0.41 0.40 4.452009 Total 2.13 0.93 1.29 1.72 1.30 1.72 1.72 1.79 0.82 2.20 1.75 1.31 18.68

96
LNG Shipments Received In Higashi-Ohgishima/Ohgishima, Japan by Source (1000's of Metric Tons)
Jan Feb Mar Apr May Jun Jul Aug Sep Oct Nov Dec Total
Abu Dhabi 120 181 117 243 300 235 422 296 60 0 0 0 1,974Australia 124 123 125 119 258 171 65 192 0 0 0 0 1,177Brunei 0 67 60 0 0 33 0 0 0 0 0 0 160Egypt 61 0 0 0 59 0 0 0 0 0 0 0 120Equatorial Guinea 0 0 0 0 0 0 0 68 0 0 0 0 68Indonesia 55 55 56 0 110 111 56 0 0 0 0 0 443Malaysia 315 189 121 182 68 123 179 57 0 0 0 0 1,234Nigeria 0 0 60 0 0 0 0 0 64 0 0 0 124Oman 0 0 63 127 0 0 0 123 0 0 0 0 313Qatar 121 0 190 0 0 0 61 0 0 0 0 0 372Russia 64 65 129 61 64 0 129 0 0 0 0 0 5122011 Total 860 680 921 732 859 673 912 736 124 0 0 0 6,497 Abu Dhabi 301 61 240 182 182 305 121 247 61 61 183 240 2,184Australia 125 313 256 120 64 188 251 64 238 188 188 121 2,116Brunei 0 34 34 0 69 0 67 69 34 99 0 0 406Egypt 0 0 0 0 0 0 62 0 63 0 63 0 188Equatorial Guinea 0 59 0 0 0 0 0 62 0 0 0 0 121Indonesia 55 0 56 55 56 0 55 0 55 0 55 54 441Malaysia 120 236 119 186 189 0 120 129 360 64 173 306 2,002Nigeria 0 0 0 0 0 0 0 0 115 0 0 0 115Oman 0 0 64 0 0 0 0 63 0 0 0 0 127Qatar 0 0 0 0 0 61 60 61 0 0 0 0 182Russia 189 0 64 128 129 129 0 129 0 65 128 65 1,026USA 0 0 0 0 0 0 0 0 0 61 0 0 612010 Total 790 703 833 671 689 683 736 824 926 538 790 786 8,969
Continued on following page

97
Continued from previous page
LNG Shipments Received In Higashi-Ohgishima/Ohgishima, Japan by Source (1000's of Metric Tons)
Abu Dhabi 240 301 242 61 242 366 182 183 183 180 62 183 2,425Australia 129 0 65 186 189 115 129 248 120 60 120 177 1,538Brunei 33 93 33 0 0 61 0 61 0 0 0 0 281Egypt 0 0 60 0 0 0 0 0 0 0 0 0 60Equatorial Guinea 60 60 0 59 0 59 0 0 64 58 0 58 418Indonesia 55 171 0 107 0 0 0 0 109 55 57 56 610Malaysia 235 0 224 115 120 60 174 121 179 61 357 118 1,764Oman 0 65 63 0 0 0 0 0 64 0 0 0 192Qatar 0 0 0 61 61 0 0 0 0 0 0 61 183Russia 0 0 0 0 0 0 64 63 64 64 64 64 3832009 Total 752 690 687 589 612 661 549 676 783 478 660 717 7,854

98
LNG Shipments Received In Higashi-Ohgishima/Ohgishima, Japan by Source (Bcf)
Jan Feb Mar Apr May Jun Jul Aug Sep Oct Nov Dec Total
Abu Dhabi 5.75 8.72 5.63 11.68 14.40 11.29 20.28 14.25 2.86 0 0 0 94.87Australia 5.95 5.93 5.99 5.72 12.38 8.21 3.12 9.22 0 0 0 0 56.53Brunei 0 3.23 2.89 0 0 1.59 0 0 0 0 0 0 7.72Egypt 2.94 0 0 0 2.85 0 0 0 0 0 0 0 5.78Equatorial Guinea 0 0 0 0 0 0 0 3.29 0 0 0 0 3.29Indonesia 2.65 2.66 2.67 0 5.28 5.33 2.70 0 0 0 0 0 21.30Malaysia 15.12 9.08 5.84 8.73 3.28 5.92 8.60 2.76 0 0 0 0 59.34Nigeria 0 0 2.89 0 0 0 0 0 3.09 0 0 0 5.98Oman 0 0 3.04 6.11 0 0 0 5.94 0 0 0 0 15.08Qatar 5.82 0 9.15 0 0 0 2.91 0 0 0 0 0 17.88Russia 3.07 3.11 6.21 2.95 3.09 0 6.19 0 0 0 0 0 24.612011 Total 41.30 32.74 44.32 35.20 41.28 32.34 43.81 35.46 5.95 0 0 0 312.38 Abu Dhabi 14.49 2.93 11.54 8.75 8.75 14.65 5.79 11.86 2.95 2.92 8.78 11.55 104.96Australia 6.01 15.04 12.29 5.78 3.07 9.05 12.05 3.10 11.46 9.05 9.05 5.80 101.76Brunei 0 1.65 1.65 0 3.29 0 3.24 3.29 1.65 4.77 0 0 19.54Egypt 0 0 0 0 0 0 3.00 0 3.01 0 3.03 0 9.04Equatorial Guinea 0 2.82 0 0 0 0 0 2.99 0 0 0 0 5.80Indonesia 2.62 0 2.71 2.64 2.67 0 2.64 0 2.66 0 2.67 2.58 21.20Malaysia 5.78 11.33 5.74 8.94 9.08 0 5.78 6.20 17.31 3.07 8.29 14.73 96.26Nigeria 0 0 0 0 0 0 0 0 5.51 0 0 0 5.51Oman 0 0 3.08 0 0 0 0 3.01 0 0 0 0 6.09Qatar 0 0 0 0 0 2.92 2.87 2.92 0 0 0 0 8.70Russia 9.08 0 3.06 6.15 6.20 6.19 0 6.19 0 3.12 6.15 3.11 49.26USA 0 0 0 0 0 0 0 0 0 2.93 0 0 2.932010 Total 37.97 33.76 40.07 32.27 33.07 32.81 35.37 39.56 44.55 25.86 37.98 37.78 431.05
Continued on following page

99
Continued from previous page
LNG Shipments Received In Higashi-Ohgishima/Ohgishima, Japan by Source (Bcf)
Abu Dhabi 11.52 14.47 11.63 2.93 11.63 17.58 8.77 8.78 8.78 8.67 3.00 8.81 116.56Australia 6.22 0 3.14 8.92 9.07 5.52 6.19 11.91 5.78 2.86 5.78 8.53 73.93Brunei 1.59 4.49 1.59 0 0 2.93 0 2.92 0 0 0 0 13.52Egypt 0 0 2.87 0 0 0 0 0 0 0 0 0 2.87Equatorial Guinea 2.88 2.88 0 2.82 0 2.84 0 0 3.07 2.79 0 2.78 20.06Indonesia 2.66 8.23 0 5.16 0 0 0 0 5.23 2.64 2.72 2.67 29.31Malaysia 11.30 0 10.76 5.51 5.75 2.89 8.38 5.84 8.61 2.95 17.14 5.69 84.82Oman 0 3.12 3.02 0 0 0 0 0 3.09 0 0 0 9.23Qatar 0 0 0 2.91 2.91 0 0 0 0 0 0 2.91 8.74Russia 0 0 0 0 0 0 3.06 3.02 3.10 3.07 3.06 3.06 18.372009 Total 36.17 33.19 33.02 28.24 29.37 31.75 26.40 32.48 37.66 22.99 31.71 34.45 377.43

100
LNG Shipments Received In Himeji, Japan by Source (1000's of Metric Tons)
Jan Feb Mar Apr May Jun Jul Aug Sep Oct Nov Dec Total
Australia 175 115 65 56 113 115 128 64 0 0 0 0 831Brunei 33 0 33 125 0 0 0 0 0 0 0 0 191Equatorial Guinea 0 0 0 0 0 0 65 0 0 0 0 0 65Indonesia 168 284 165 113 0 111 56 228 0 0 0 0 1,125Malaysia 118 61 64 60 120 63 64 61 0 0 0 0 611Nigeria 0 0 0 0 60 61 129 0 0 0 0 0 250Oman 0 60 0 0 0 0 64 0 0 0 0 0 124Qatar 0 0 61 0 60 0 61 61 0 0 0 0 243Russia 0 0 0 0 0 62 0 64 0 0 0 0 126Trinidad 0 0 0 50 0 0 60 0 0 0 0 0 110USA 0 0 0 35 0 0 0 0 0 0 0 0 352011 Total 494 520 388 439 353 412 627 478 0 0 0 0 3,711 Australia 117 119 244 187 118 64 129 240 55 62 176 173 1,684Brunei 33 0 0 33 0 0 0 0 0 0 0 33 99Egypt 0 0 0 0 0 0 0 60 0 0 0 0 60Equatorial Guinea 0 59 0 0 0 0 0 0 0 0 0 0 59Indonesia 165 220 168 111 112 279 277 112 112 164 0 54 1,774Malaysia 61 119 0 58 185 0 61 61 118 58 113 58 892Nigeria 60 0 0 0 0 0 0 0 0 0 0 0 60Oman 0 60 0 0 0 0 64 0 0 0 0 0 124Qatar 0 0 62 60 0 0 0 0 61 0 0 61 244Russia 0 65 0 0 0 0 0 0 0 0 0 0 652010 Total 436 642 474 449 415 343 531 473 346 284 289 379 5,061 Australia 0 120 0 65 119 118 117 182 61 117 180 122 1,201Brunei 33 0 0 0 33 0 33 0 33 0 33 0 165Egypt 0 64 0 0 0 0 0 0 0 0 0 0 64Equatorial Guinea 0 0 0 0 0 0 0 0 0 56 0 58 114Indonesia 168 58 279 215 56 111 223 112 165 112 229 224 1,952Malaysia 118 119 110 0 58 57 57 118 63 0 61 118 879Oman 0 0 59 0 0 0 62 0 0 0 0 0 121Qatar 61 60 0 61 0 0 60 0 60 60 61 0 4232009 Total 380 421 448 341 266 286 552 412 382 345 564 522 4,919

101
LNG Shipments Received In Himeji, Japan by Source (Bcf)
Jan Feb Mar Apr May Jun Jul Aug Sep Oct Nov Dec Total
Australia 8.39 5.53 3.11 2.71 5.44 5.55 6.16 3.08 0 0 0 0 39.95Brunei 1.59 0 1.58 6.00 0 0 0 0 0 0 0 0 9.17Equatorial Guinea 0 0 0 0 0 0 3.13 0 0 0 0 0 3.13Indonesia 8.08 13.67 7.95 5.42 0 5.33 2.69 10.98 0 0 0 0 54.13Malaysia 5.68 2.94 3.08 2.91 5.78 3.03 3.07 2.93 0 0 0 0 29.41Nigeria 0 0 0 0 2.88 2.93 6.19 0 0 0 0 0 12.00Oman 0 2.87 0 0 0 0 3.07 0 0 0 0 0 5.95Qatar 0 0 2.92 0 2.89 0 2.91 2.92 0 0 0 0 11.64Russia 0 0 0 0 0 2.99 0 3.09 0 0 0 0 6.08Trinidad 0 0 0 2.43 0 0 2.86 0 0 0 0 0 5.29USA 0 0 0 1.70 0 0 0 0 0 0 0 0 1.702011 Total 23.74 25.02 18.63 21.16 16.99 19.82 30.09 22.99 0 0 0 0 178.44 Australia 5.61 5.74 11.73 8.98 5.69 3.08 6.20 11.54 2.66 2.98 8.45 8.34 80.99Brunei 1.59 0 0 1.59 0 0 0 0 0 0 0 1.59 4.77Egypt 0 0 0 0 0 0 0 2.90 0 0 0 0 2.90Equatorial Guinea 0 2.82 0 0 0 0 0 0 0 0 0 0 2.82Indonesia 7.93 10.59 8.07 5.32 5.39 13.43 13.34 5.37 5.37 7.90 0 2.61 85.32Malaysia 2.93 5.74 0 2.81 8.92 0 2.93 2.91 5.69 2.76 5.45 2.76 42.90Nigeria 2.88 0 0 0 0 0 0 0 0 0 0 0 2.88Oman 0 2.87 0 0 0 0 3.07 0 0 0 0 0 5.94Qatar 0 0 2.96 2.89 0 0 0 0 2.91 0 0 2.91 11.68Russia 0 3.11 0 0 0 0 0 0 0 0 0 0 3.112010 Total 20.93 30.86 22.76 21.59 20.00 16.51 25.53 22.72 16.64 13.64 13.90 18.20 243.30 Australia 0 5.77 0 3.11 5.74 5.68 5.63 8.76 2.93 5.64 8.64 5.86 57.75Brunei 1.59 0 0 0 1.59 0 1.59 0 1.60 0 1.59 0 7.96Egypt 0 3.07 0 0 0 0 0 0 0 0 0 0 3.07Equatorial Guinea 0 0 0 0 0 0 0 0 0 2.71 0 2.77 5.48Indonesia 8.06 2.78 13.40 10.31 2.69 5.36 10.71 5.39 7.93 5.36 10.99 10.76 93.75Malaysia 5.67 5.70 5.29 0 2.78 2.73 2.73 5.68 3.01 0 2.91 5.68 42.18Oman 0 0 2.85 0 0 0 3.00 0 0 0 0 0 5.85Qatar 2.94 2.87 0 2.92 0 0 2.89 0 2.90 2.87 2.92 0 20.292009 Total 18.26 20.20 21.55 16.34 12.79 13.76 26.55 19.83 18.36 16.58 27.06 25.07 236.34

102
LNG Shipments Received In Kagoshima, Japan by Source (1000's of Metric Tons)
Jan Feb Mar Apr May Jun Jul Aug Sep Oct Nov Dec Total
Indonesia 0 10 10 0 0 0 9 9 0 0 0 0 382011 Total 0 10 10 0 0 0 9 9 0 0 0 0 38 Indonesia 10 10 10 0 0 0 19 27 17 8 9 8 1182010 Total 10 10 10 0 0 0 19 27 17 8 9 8 118 Indonesia 10 19 19 0 10 0 10 9 10 0 19 19 1252009 Total 10 19 19 0 10 0 10 9 10 0 19 19 125
LNG Shipments Received In Kagoshima, Japan by Source (Bcf)
Jan Feb Mar Apr May Jun Jul Aug Sep Oct Nov Dec Total
Indonesia 0 0.49 0.48 0 0 0 0.41 0.41 0 0 0 0 1.802011 Total 0 0.49 0.48 0 0 0 0.41 0.41 0 0 0 0 1.80 Indonesia 0.48 0.48 0.49 0 0 0 0.90 1.32 0.83 0.40 0.41 0.40 5.722010 Total 0.48 0.48 0.49 0 0 0 0.90 1.32 0.83 0.40 0.41 0.40 5.72 Indonesia 0.49 0.93 0.90 0 0.49 0 0.49 0.41 0.48 0 0.91 0.91 6.022009 Total 0.49 0.93 0.90 0 0.49 0 0.49 0.41 0.48 0 0.91 0.91 6.02

103
LNG Shipments Received In Mizushima, Japan by Source (1000's of Metric Tons)
Jan Feb Mar Apr May Jun Jul Aug Sep Oct Nov Dec Total
Australia 56 56 0 56 57 53 55 62 0 0 0 0 395Oman 0 0 63 0 63 0 0 64 0 0 0 0 1902011 Total 56 56 63 56 120 53 55 126 0 0 0 0 585 Australia 55 55 0 56 55 62 62 0 61 0 62 0 468Oman 0 0 64 0 0 0 0 63 0 64 0 64 2552010 Total 55 55 64 56 55 62 62 63 61 64 62 64 723 Australia 0 0 0 0 56 55 56 0 0 0 0 56 223Malaysia 0 0 0 0 0 0 0 0 0 58 0 0 58Oman 0 0 63 64 0 0 0 63 64 0 64 0 318Qatar 39 0 0 0 0 0 0 0 0 0 0 0 392009 Total 39 0 63 64 56 55 56 63 64 58 64 56 638
LNG Shipments Received In Mizushima, Japan by Source (Bcf)
Jan Feb Mar Apr May Jun Jul Aug Sep Oct Nov Dec Total
Australia 2.69 2.68 0 2.71 2.72 2.57 2.66 2.98 0 0 0 0 19.01Oman 0 0 3.04 0 3.01 0 0 3.07 0 0 0 0 9.122011 Total 2.69 2.68 3.04 2.71 5.73 2.57 2.66 6.05 0 0 0 0 28.14 Australia 2.62 2.66 0 2.70 2.66 2.98 3.00 0 2.93 0 2.98 0 22.53Oman 0 0 3.06 0 0 0 0 3.01 0 3.08 0 3.06 12.212010 Total 2.62 2.66 3.06 2.70 2.66 2.98 3.00 3.01 2.93 3.08 2.98 3.06 34.74 Australia 0 0 0 0 2.70 2.66 2.70 0 0 0 0 2.68 10.73Malaysia 0 0 0 0 0 0 0 0 0 2.80 0 0 2.80Oman 0 0 3.02 3.09 0 0 0 3.04 3.09 0 3.07 0 15.32Qatar 1.90 0 0 0 0 0 0 0 0 0 0 0 1.902009 Total 1.90 0 3.02 3.09 2.70 2.66 2.70 3.04 3.09 2.80 3.07 2.68 30.74

104
LNG Shipments Received In Nagasaki, Japan by Source (1000's of Metric Tons)
Jan Feb Mar Apr May Jun Jul Aug Sep Oct Nov Dec Total
Malaysia 8 8 4 8 8 0 0 8 0 0 0 0 44Russia 0 0 0 0 0 8 0 0 0 0 0 0 82011 Total 8 8 4 8 8 8 0 8 0 0 0 0 52 Malaysia 17 8 16 0 9 0 17 8 17 0 8 8 108Russia 0 0 0 0 0 0 0 8 0 0 0 0 82010 Total 17 8 16 0 9 0 17 16 17 0 8 8 116 Malaysia 17 0 8 8 8 0 8 8 8 8 8 17 982009 Total 17 0 8 8 8 0 8 8 8 8 8 17 98
LNG Shipments Received In Nagasaki, Japan by Source (Bcf)
Jan Feb Mar Apr May Jun Jul Aug Sep Oct Nov Dec Total
Malaysia 0.40 0.41 0.20 0.39 0.39 0 0 0.40 0 0 0 0 2.20Russia 0 0 0 0 0 0.41 0 0 0 0 0 0 0.412011 Total 0.40 0.41 0.20 0.39 0.39 0.41 0 0.40 0 0 0 0 2.60 Malaysia 0.80 0.40 0.79 0 0.41 0 0.80 0.40 0.80 0 0.39 0.40 5.20Russia 0 0 0 0 0 0 0 0.41 0 0 0 0 0.412010 Total 0.80 0.40 0.79 0 0.41 0 0.80 0.81 0.80 0 0.39 0.40 5.61 Malaysia 0.80 0 0.38 0.40 0.38 0 0.40 0.40 0.39 0.41 0.40 0.80 4.772009 Total 0.80 0 0.38 0.40 0.38 0 0.40 0.40 0.39 0.41 0.40 0.80 4.77
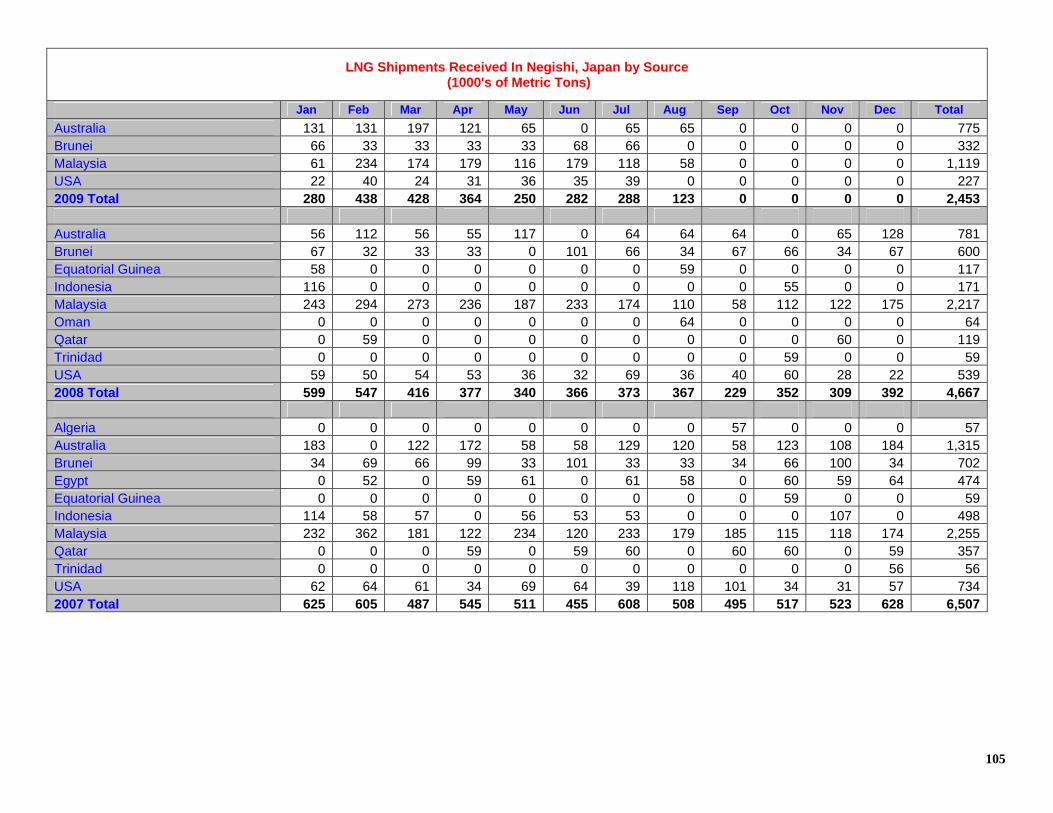
105
LNG Shipments Received In Negishi, Japan by Source (1000's of Metric Tons)
Jan Feb Mar Apr May Jun Jul Aug Sep Oct Nov Dec Total
Australia 131 131 197 121 65 0 65 65 0 0 0 0 775Brunei 66 33 33 33 33 68 66 0 0 0 0 0 332Malaysia 61 234 174 179 116 179 118 58 0 0 0 0 1,119USA 22 40 24 31 36 35 39 0 0 0 0 0 2272009 Total 280 438 428 364 250 282 288 123 0 0 0 0 2,453 Australia 56 112 56 55 117 0 64 64 64 0 65 128 781Brunei 67 32 33 33 0 101 66 34 67 66 34 67 600Equatorial Guinea 58 0 0 0 0 0 0 59 0 0 0 0 117Indonesia 116 0 0 0 0 0 0 0 0 55 0 0 171Malaysia 243 294 273 236 187 233 174 110 58 112 122 175 2,217Oman 0 0 0 0 0 0 0 64 0 0 0 0 64Qatar 0 59 0 0 0 0 0 0 0 0 60 0 119Trinidad 0 0 0 0 0 0 0 0 0 59 0 0 59USA 59 50 54 53 36 32 69 36 40 60 28 22 5392008 Total 599 547 416 377 340 366 373 367 229 352 309 392 4,667 Algeria 0 0 0 0 0 0 0 0 57 0 0 0 57Australia 183 0 122 172 58 58 129 120 58 123 108 184 1,315Brunei 34 69 66 99 33 101 33 33 34 66 100 34 702Egypt 0 52 0 59 61 0 61 58 0 60 59 64 474Equatorial Guinea 0 0 0 0 0 0 0 0 0 59 0 0 59Indonesia 114 58 57 0 56 53 53 0 0 0 107 0 498Malaysia 232 362 181 122 234 120 233 179 185 115 118 174 2,255Qatar 0 0 0 59 0 59 60 0 60 60 0 59 357Trinidad 0 0 0 0 0 0 0 0 0 0 0 56 56USA 62 64 61 34 69 64 39 118 101 34 31 57 7342007 Total 625 605 487 545 511 455 608 508 495 517 523 628 6,507

106
LNG Shipments Received In Negishi, Japan by Source (Bcf)
Jan Feb Mar Apr May Jun Jul Aug Sep Oct Nov Dec Total
Australia 6.29 6.28 9.46 5.84 3.13 0 3.13 3.14 0 0 0 0 37.26Brunei 3.18 1.59 1.59 1.59 1.59 3.28 3.18 0 0 0 0 0 15.99Malaysia 2.91 11.26 8.37 8.62 5.57 8.61 5.69 2.79 0 0 0 0 53.82USA 1.07 1.92 1.16 1.49 1.71 1.70 1.89 0 0 0 0 0 10.942009 Total 13.46 21.05 20.57 17.54 11.99 13.59 13.88 5.93 0 0 0 0 118.01 Australia 2.69 5.37 2.68 2.63 5.64 0 3.09 3.09 3.08 0 3.11 6.15 37.52Brunei 3.24 1.56 1.59 1.59 0 4.86 3.16 1.63 3.24 3.18 1.64 3.24 28.93Equatorial Guinea 2.78 0 0 0 0 0 0 2.84 0 0 0 0 5.62Indonesia 5.59 0 0 0 0 0 0 0 0 2.66 0 0 8.25Malaysia 11.68 14.13 13.15 11.35 8.99 11.22 8.37 5.30 2.78 5.39 5.85 8.43 106.65Oman 0 0 0 0 0 0 0 3.06 0 0 0 0 3.06Qatar 0 2.85 0 0 0 0 0 0 0 0 2.89 0 5.74Trinidad 0 0 0 0 0 0 0 0 0 2.83 0 0 2.83USA 2.85 2.42 2.58 2.57 1.72 1.54 3.30 1.72 1.90 2.87 1.34 1.07 25.892008 Total 28.83 26.33 20.00 18.14 16.35 17.62 17.92 17.64 11.00 16.93 14.83 18.89 224.49 Algeria 0 0 0 0 0 0 0 0 2.74 0 0 0 2.74Australia 8.79 0 5.87 8.28 2.81 2.77 6.21 5.79 2.77 5.90 5.20 8.86 63.24Brunei 1.64 3.30 3.18 4.77 1.60 4.85 1.58 1.59 1.64 3.18 4.82 1.65 33.80Egypt 0 2.50 0 2.84 2.92 0 2.91 2.79 0 2.87 2.85 3.07 22.75Equatorial Guinea 0 0 0 0 0 0 0 0 0 2.85 0 0 2.85Indonesia 5.50 2.78 2.75 0 2.70 2.56 2.55 0 0 0 5.15 0 23.99Malaysia 11.13 17.39 8.69 5.86 11.26 5.79 11.19 8.61 8.88 5.51 5.69 8.36 108.35Qatar 0 0 0 2.85 0 2.83 2.88 0 2.87 2.87 0 2.82 17.13Trinidad 0 0 0 0 0 0 0 0 0 0 0 2.70 2.70USA 3.00 3.08 2.92 1.62 3.29 3.08 1.89 5.66 4.88 1.63 1.48 2.73 35.252007 Total 30.07 29.05 23.41 26.22 24.58 21.88 29.21 24.44 23.78 24.81 25.19 30.18 312.82

107
LNG Shipments Received In Nihonkai LNG Niigata, Japan by Source (1000's of Metric Tons)
Jan Feb Mar Apr May Jun Jul Aug Sep Oct Nov Dec Total
Australia 62 110 113 56 61 107 56 176 64 0 0 0 805Indonesia 0 64 0 112 56 55 124 112 0 0 0 0 523Malaysia 176 180 233 57 57 183 61 121 0 0 0 0 1,068Qatar 0 155 0 123 59 61 153 93 0 0 0 0 644Russia 0 0 0 64 65 0 0 0 0 0 0 0 1292011 Total 238 509 346 412 298 406 394 502 64 0 0 0 3,169 Australia 54 56 57 56 112 56 118 112 55 55 55 119 905Equatorial Guinea 0 67 0 0 0 0 0 0 0 0 0 0 67Indonesia 55 0 0 0 0 0 0 0 55 0 0 0 110Malaysia 115 180 179 117 59 58 115 57 118 58 113 0 1,169Qatar 95 0 123 60 0 118 0 61 0 155 61 121 794Russia 0 0 0 0 64 0 0 0 0 0 0 64 1282010 Total 319 303 359 233 235 232 233 230 228 268 229 304 3,173 Australia 0 0 0 57 0 0 56 56 56 0 56 56 337Equatorial Guinea 0 0 0 0 0 0 0 0 0 0 66 61 127Indonesia 167 0 106 53 111 55 111 55 54 55 113 55 935Malaysia 61 113 113 208 58 113 57 61 112 0 0 118 1,014Nigeria 54 0 54 0 60 0 0 0 0 0 0 0 168Oman 0 0 0 64 0 0 0 0 0 0 0 0 64Qatar 64 116 58 56 0 61 60 95 59 251 95 0 915Russia 0 0 0 0 0 65 0 0 0 0 0 0 652009 Total 346 229 331 438 229 294 284 267 281 306 330 290 3,625

108
LNG Shipments Received In Nihonkai LNG Niigata, Japan by Source (Bcf)
Jan Feb Mar Apr May Jun Jul Aug Sep Oct Nov Dec Total
Australia 2.97 5.31 5.46 2.68 2.94 5.14 2.70 8.45 3.09 0 0 0 38.74Indonesia 0 3.08 0 5.40 2.69 2.66 5.96 5.37 0 0 0 0 25.15Malaysia 8.44 8.65 11.20 2.75 2.75 8.78 2.91 5.83 0 0 0 0 51.32Qatar 0 7.47 0 5.93 2.85 2.91 7.37 4.45 0 0 0 0 30.99Russia 0 0 0 3.07 3.14 0 0 0 0 0 0 0 6.212011 Total 11.41 24.51 16.66 19.82 14.38 19.50 18.95 24.10 3.09 0 0 0 152.41 Australia 2.62 2.70 2.72 2.70 5.37 2.71 5.67 5.37 2.66 2.66 2.66 5.71 43.54Equatorial Guinea 0 3.22 0 0 0 0 0 0 0 0 0 0 3.22Indonesia 2.62 0 0 0 0 0 0 0 2.65 0 0 0 5.28Malaysia 5.52 8.67 8.63 5.64 2.82 2.76 5.53 2.75 5.67 2.76 5.45 0 56.21Qatar 4.57 0 5.92 2.89 0 5.67 0 2.91 0 7.47 2.91 5.83 38.18Russia 0 0 0 0 3.08 0 0 0 0 0 0 3.07 6.152010 Total 15.33 14.59 17.27 11.23 11.26 11.15 11.20 11.03 10.99 12.90 11.02 14.60 152.58 Australia 0 0 0 2.72 0 0 2.70 2.70 2.70 0 2.70 2.71 16.22Equatorial Guinea 0 0 0 0 0 0 0 0 0 0 3.18 2.91 6.09Indonesia 8.02 0 5.09 2.56 5.32 2.66 5.32 2.66 2.61 2.64 5.44 2.67 45.01Malaysia 2.93 5.42 5.43 10.02 2.78 5.44 2.72 2.93 5.39 0 0 5.68 48.74Nigeria 2.58 0 2.58 0 2.86 0 0 0 0 0 0 0 8.02Oman 0 0 0 3.09 0 0 0 0 0 0 0 0 3.09Qatar 3.09 5.58 2.79 2.68 0 2.91 2.88 4.56 2.85 12.05 4.56 0 43.95Russia 0 0 0 0 0 3.12 0 0 0 0 0 0 3.122009 Total 16.61 11.00 15.89 21.06 10.96 14.14 13.63 12.84 13.55 14.70 15.87 13.97 174.23

109
LNG Shipments Received In Oita, Japan by Source (1000's of Metric Tons)
Jan Feb Mar Apr May Jun Jul Aug Sep Oct Nov Dec Total
Australia 64 63 191 64 66 124 64 128 0 0 0 0 764Indonesia 0 0 0 64 55 0 124 68 0 0 0 0 311Nigeria 0 0 0 0 61 0 0 0 0 0 0 0 61Norway 0 0 0 0 0 0 0 62 0 0 0 0 62Russia 65 65 0 0 0 65 0 0 0 0 0 0 1952011 Total 129 128 191 128 182 189 188 258 0 0 0 0 1,393 Australia 62 64 65 240 64 55 129 64 64 64 128 64 1,063Indonesia 0 0 56 0 56 0 0 0 0 0 0 54 166Russia 64 62 0 0 66 0 0 62 126 65 0 0 4452010 Total 126 126 121 240 186 55 129 126 190 129 128 118 1,674 Australia 147 98 94 113 56 60 66 64 0 64 64 64 890Indonesia 49 49 0 0 56 168 0 56 55 0 57 0 490Russia 0 0 0 0 0 0 0 0 0 0 0 65 652009 Total 196 147 94 113 112 228 66 120 55 64 121 129 1,445

110
LNG Shipments Received In Oita, Japan by Source (Bcf)
Jan Feb Mar Apr May Jun Jul Aug Sep Oct Nov Dec Total
Australia 3.06 3.04 9.20 3.09 3.15 5.94 3.07 6.15 0 0 0 0 36.72Indonesia 0 0 0 3.06 2.65 0 5.98 3.29 0 0 0 0 14.97Nigeria 0 0 0 0 2.93 0 0 0 0 0 0 0 2.93Norway 0 0 0 0 0 0 0 2.97 0 0 0 0 2.97Russia 3.11 3.11 0 0 0 3.12 0 0 0 0 0 0 9.342011 Total 6.17 6.15 9.20 6.15 8.73 9.06 9.06 12.40 0 0 0 0 66.93 Australia 2.98 3.07 3.10 11.51 3.07 2.66 6.19 3.10 3.07 3.07 6.15 3.09 51.08Indonesia 0 0 2.69 0 2.69 0 0 0 0 0 0 2.61 7.99Russia 3.06 2.98 0 0 3.18 0 0 2.98 6.07 3.12 0 0 21.392010 Total 6.04 6.05 5.79 11.51 8.95 2.66 6.19 6.08 9.14 6.19 6.15 5.69 80.46 Australia 7.05 4.71 4.53 5.41 2.70 2.90 3.17 3.07 0 3.07 3.07 3.09 42.79Indonesia 2.37 2.36 0 0 2.69 8.09 0 2.69 2.64 0 2.74 0 23.57Russia 0 0 0 0 0 0 0 0 0 0 0 3.10 3.102009 Total 9.42 7.07 4.53 5.41 5.39 10.99 3.17 5.76 2.64 3.07 5.82 6.19 69.47

111
LNG Shipments Received In Sakai/Senboku, Japan by Source (1000's of Metric Tons)
Jan Feb Mar Apr May Jun Jul Aug Sep Oct Nov Dec Total
Algeria 0 0 0 0 0 59 0 0 0 0 0 0 59Australia 64 63 113 128 118 116 296 112 0 0 0 0 1,010Brunei 66 34 33 34 60 0 0 0 0 0 0 0 227Egypt 0 0 0 0 58 0 0 0 0 0 0 0 58Equatorial Guinea 0 58 0 0 0 0 0 64 0 0 0 0 122Indonesia 223 167 289 347 133 119 121 56 0 0 0 0 1,455Malaysia 122 187 118 118 63 120 118 61 0 0 0 0 907Nigeria 0 0 0 0 0 0 0 64 62 0 0 0 126Oman 127 0 60 128 129 128 128 128 0 0 0 0 828Qatar 61 60 61 61 61 61 92 0 0 0 0 0 457Russia 129 0 0 0 0 0 65 0 0 0 0 0 194Trinidad 0 0 55 0 0 0 61 61 0 0 0 0 177US Re-export 0 0 0 0 0 56 0 0 0 0 0 0 562011 Total 792 569 729 816 622 659 881 546 62 0 0 0 5,676 Algeria 60 0 0 0 0 0 0 0 0 0 0 0 60Australia 112 180 61 55 64 188 0 57 55 175 61 64 1,072Brunei 34 66 33 0 33 66 33 99 33 67 0 33 497Egypt 0 0 0 0 60 0 0 0 0 0 0 0 60Equatorial Guinea 0 0 0 58 0 0 0 0 0 0 57 0 115Indonesia 331 238 297 453 289 225 342 279 447 217 280 434 3,832Malaysia 0 61 173 0 0 118 125 118 0 115 113 121 944Oman 127 67 128 128 128 126 60 59 67 68 128 127 1,213Qatar 119 58 0 0 0 61 0 61 0 0 61 0 360Russia 64 0 65 0 0 64 62 65 0 64 0 0 384Trinidad 0 58 0 0 0 0 0 0 56 0 0 0 1142010 Total 847 728 757 694 574 848 622 738 658 706 700 779 8,651
Continued on following page

112
Continued from previous page
LNG Shipments Received In Sakai/Senboku, Japan by Source (1000's of Metric Tons)
Australia 185 121 129 65 0 0 194 0 0 56 55 113 918Brunei 33 67 66 33 0 66 60 66 33 33 0 67 524Equatorial Guinea 0 0 0 0 0 0 64 64 0 0 0 0 128Indonesia 224 230 280 215 280 280 280 223 274 444 228 280 3,238Malaysia 64 61 55 118 0 0 0 57 116 0 0 57 528Nigeria 58 182 60 0 0 0 0 0 0 0 0 64 364Oman 61 123 0 61 59 60 63 60 129 60 68 60 804Qatar 0 0 0 0 60 0 0 61 0 0 61 61 243Russia 0 0 0 0 0 0 0 0 0 0 65 0 65Trinidad 0 0 0 0 0 0 0 0 0 0 50 0 502009 Total 625 784 590 492 399 406 661 531 552 593 527 702 6,862
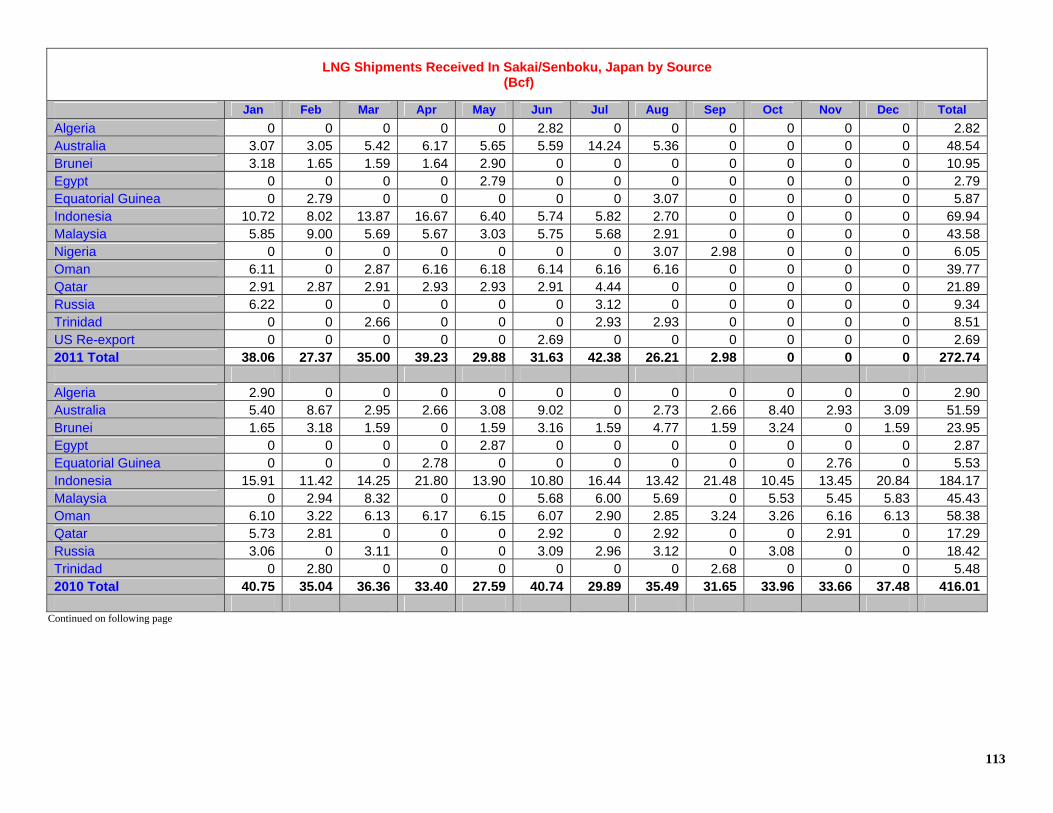
113
LNG Shipments Received In Sakai/Senboku, Japan by Source (Bcf)
Jan Feb Mar Apr May Jun Jul Aug Sep Oct Nov Dec Total
Algeria 0 0 0 0 0 2.82 0 0 0 0 0 0 2.82Australia 3.07 3.05 5.42 6.17 5.65 5.59 14.24 5.36 0 0 0 0 48.54Brunei 3.18 1.65 1.59 1.64 2.90 0 0 0 0 0 0 0 10.95Egypt 0 0 0 0 2.79 0 0 0 0 0 0 0 2.79Equatorial Guinea 0 2.79 0 0 0 0 0 3.07 0 0 0 0 5.87Indonesia 10.72 8.02 13.87 16.67 6.40 5.74 5.82 2.70 0 0 0 0 69.94Malaysia 5.85 9.00 5.69 5.67 3.03 5.75 5.68 2.91 0 0 0 0 43.58Nigeria 0 0 0 0 0 0 0 3.07 2.98 0 0 0 6.05Oman 6.11 0 2.87 6.16 6.18 6.14 6.16 6.16 0 0 0 0 39.77Qatar 2.91 2.87 2.91 2.93 2.93 2.91 4.44 0 0 0 0 0 21.89Russia 6.22 0 0 0 0 0 3.12 0 0 0 0 0 9.34Trinidad 0 0 2.66 0 0 0 2.93 2.93 0 0 0 0 8.51US Re-export 0 0 0 0 0 2.69 0 0 0 0 0 0 2.692011 Total 38.06 27.37 35.00 39.23 29.88 31.63 42.38 26.21 2.98 0 0 0 272.74 Algeria 2.90 0 0 0 0 0 0 0 0 0 0 0 2.90Australia 5.40 8.67 2.95 2.66 3.08 9.02 0 2.73 2.66 8.40 2.93 3.09 51.59Brunei 1.65 3.18 1.59 0 1.59 3.16 1.59 4.77 1.59 3.24 0 1.59 23.95Egypt 0 0 0 0 2.87 0 0 0 0 0 0 0 2.87Equatorial Guinea 0 0 0 2.78 0 0 0 0 0 0 2.76 0 5.53Indonesia 15.91 11.42 14.25 21.80 13.90 10.80 16.44 13.42 21.48 10.45 13.45 20.84 184.17Malaysia 0 2.94 8.32 0 0 5.68 6.00 5.69 0 5.53 5.45 5.83 45.43Oman 6.10 3.22 6.13 6.17 6.15 6.07 2.90 2.85 3.24 3.26 6.16 6.13 58.38Qatar 5.73 2.81 0 0 0 2.92 0 2.92 0 0 2.91 0 17.29Russia 3.06 0 3.11 0 0 3.09 2.96 3.12 0 3.08 0 0 18.42Trinidad 0 2.80 0 0 0 0 0 0 2.68 0 0 0 5.482010 Total 40.75 35.04 36.36 33.40 27.59 40.74 29.89 35.49 31.65 33.96 33.66 37.48 416.01
Continued on following page

114
Continued from previous page
LNG Shipments Received In Sakai/Senboku, Japan by Source (Bcf)
Australia 8.91 5.81 6.21 3.10 0 0 9.34 0 0 2.70 2.66 5.44 44.17Brunei 1.59 3.24 3.18 1.59 0 3.18 2.90 3.18 1.60 1.60 0 3.24 25.30Equatorial Guinea 0 0 0 0 0 0 3.09 3.09 0 0 0 0 6.18Indonesia 10.77 11.07 13.46 10.35 13.45 13.46 13.48 10.71 13.18 21.35 10.96 13.46 155.71Malaysia 3.08 2.94 2.64 5.68 0 0 0 2.76 5.56 0 0 2.76 25.41Nigeria 2.81 8.76 2.87 0 0 0 0 0 0 0 0 3.07 17.51Oman 2.95 5.91 0 2.92 2.86 2.88 3.01 2.87 6.18 2.90 3.26 2.89 38.62Qatar 0 0 0 0 2.87 0 0 2.91 0 0 2.92 2.91 11.60Russia 0 0 0 0 0 0 0 0 0 0 3.11 0 3.11Trinidad 0 0 0 0 0 0 0 0 0 0 2.42 0 2.422009 Total 30.10 37.72 28.36 23.64 19.18 19.52 31.83 25.52 26.52 28.56 25.32 33.77 330.03

115
LNG Shipments Received In Sakaide, Japan By Terminal (1000's of Metric Tons)
Jan Feb Mar Apr May Jun Jul Aug Sep Oct Nov Dec Total
Malaysia 0 61 0 60 0 58 0 58 0 0 0 0 2372011 Total 0 61 0 60 0 58 0 58 0 0 0 0 237 Malaysia 60 0 0 61 0 61 0 57 0 61 0 58 3582010 Total 60 0 0 61 0 61 0 57 0 61 0 58 358
LNG Shipments Received In Sakaide Japan By Terminal (Bcf)
Jan Feb Mar Apr May Jun Jul Aug Sep Oct Nov Dec Total
Malaysia 0 2.93 0 2.90 0 2.77 0 2.76 0 0 0 0 11.272011 Total 0 2.93 0 2.90 0 2.77 0 2.76 0 0 0 0 11.27 Malaysia 2.88 0 0 2.92 0 2.91 0 2.76 0 2.91 0 2.76 17.142010 Total 2.88 0 0 2.92 0 2.91 0 2.76 0 2.91 0 2.76 17.14

116
LNG Shipments Received In Shin Minato Works, Japan by Source (1000's of Metric Tons)
Jan Feb Mar Apr May Jun Jul Aug Sep Oct Nov Dec Total
Malaysia 8 17 8 0 0 0 0 0 0 0 0 0 332011 Total 8 17 8 0 0 0 0 0 0 0 0 0 33 Malaysia 8 17 16 9 17 17 8 17 17 17 8 17 1682010 Total 8 17 16 9 17 17 8 17 17 17 8 17 168 Malaysia 0 17 8 17 8 16 16 0 16 8 17 8 1312009 Total 0 17 8 17 8 16 16 0 16 8 17 8 131
LNG Shipments Received In Shin Minato Works, Japan by Source (Bcf)
Jan Feb Mar Apr May Jun Jul Aug Sep Oct Nov Dec Total
Malaysia 0.40 0.81 0.40 0 0 0 0 0 0 0 0 0 1.612011 Total 0.40 0.81 0.40 0 0 0 0 0 0 0 0 0 1.61 Malaysia 0.40 0.81 0.79 0.41 0.82 0.80 0.40 0.80 0.80 0.80 0.39 0.80 8.032010 Total 0.40 0.81 0.79 0.41 0.82 0.80 0.40 0.80 0.80 0.80 0.39 0.80 8.03 Malaysia 0 0.81 0.38 0.80 0.38 0.79 0.79 0 0.79 0.41 0.80 0.40 6.362009 Total 0 0.81 0.38 0.80 0.38 0.79 0.79 0 0.79 0.41 0.80 0.40 6.36

117
LNG Shipments Received In Sodegaura, Japan by Source (1000's of Metric Tons)
Jan Feb Mar Apr May Jun Jul Aug Sep Oct Nov Dec Total
Australia 64 127 252 60 0 62 65 65 0 0 0 0 695Brunei 362 386 361 294 364 363 457 419 0 0 0 0 3,006Indonesia 55 0 55 0 56 55 0 0 0 0 0 0 221Malaysia 296 231 308 306 175 236 240 241 0 0 0 0 2,033Qatar 0 0 0 0 59 0 0 0 0 0 0 0 59Russia 0 0 128 129 60 128 65 129 0 0 0 0 639USA 25 70 36 0 0 0 39 39 0 0 0 0 2092011 Total 802 814 1,140 789 714 844 866 893 0 0 0 0 6,862 Australia 54 55 131 65 64 0 121 194 65 130 120 130 1,129Brunei 421 327 359 328 287 267 327 327 359 295 301 487 4,085Indonesia 55 55 0 0 56 55 0 0 0 54 0 0 275Malaysia 236 242 283 124 366 121 236 239 243 178 294 247 2,809Qatar 0 0 0 59 0 0 0 0 0 0 0 0 59Russia 0 64 192 63 64 128 63 130 64 190 0 130 1,088USA 0 0 0 0 36 36 36 71 36 36 36 35 3222010 Total 766 743 965 639 873 607 783 961 767 883 751 1,029 9,767 Australia 176 184 56 66 65 130 189 56 240 0 65 65 1,292Brunei 297 235 402 422 299 327 327 394 362 359 296 515 4,235Malaysia 301 176 285 354 276 282 234 175 182 239 175 301 2,980Qatar 0 60 60 0 0 61 0 0 0 0 121 0 302Russia 0 0 0 130 0 65 0 64 66 130 65 64 584USA 39 0 24 0 0 0 24 36 0 35 0 0 1582009 Total 813 655 827 972 640 865 774 725 850 763 722 945 9,551

118
LNG Shipments Received In Sodegaura, Japan by Source (Bcf)
Jan Feb Mar Apr May Jun Jul Aug Sep Oct Nov Dec Total
Australia 3.06 6.13 12.10 2.89 0 2.97 3.13 3.13 0 0 0 0 33.41Brunei 17.42 18.56 17.34 14.13 17.52 17.45 21.98 20.16 0 0 0 0 144.54Indonesia 2.66 0 2.63 0 2.69 2.63 0 0 0 0 0 0 10.62Malaysia 14.25 11.10 14.80 14.72 8.42 11.35 11.52 11.61 0 0 0 0 97.78Qatar 0 0 0 0 2.83 0 0 0 0 0 0 0 2.83Russia 0 0 6.17 6.21 2.88 6.15 3.12 6.19 0 0 0 0 30.71USA 1.18 3.36 1.71 0 0 0 1.89 1.89 0 0 0 0 10.022011 Total 38.57 39.15 54.75 37.95 34.34 40.55 41.63 42.97 0 0 0 0 329.91 Australia 2.58 2.66 6.31 3.12 3.07 0 5.83 9.31 3.13 6.25 5.79 6.23 54.28Brunei 20.25 15.73 17.24 15.75 13.77 12.82 15.73 15.74 17.28 14.20 14.45 23.43 196.40Indonesia 2.62 2.62 0 0 2.67 2.66 0 0 0 2.60 0 0 13.18Malaysia 11.36 11.62 13.62 5.96 17.57 5.84 11.36 11.51 11.67 8.54 14.12 11.88 135.04Qatar 0 0 0 2.84 0 0 0 0 0 0 0 0 2.84Russia 0 3.06 9.24 3.03 3.08 6.14 3.05 6.24 3.07 9.15 0 6.23 52.29USA 0 0 0 0 1.71 1.71 1.71 3.43 1.71 1.71 1.71 1.70 15.392010 Total 36.81 35.70 46.41 30.70 41.88 29.18 37.68 46.23 36.86 42.44 36.07 49.48 469.43 Australia 8.48 8.86 2.68 3.16 3.13 6.24 9.11 2.71 11.56 0 3.12 3.15 62.19Brunei 14.25 11.31 19.32 20.29 14.39 15.74 15.74 18.92 17.40 17.28 14.23 24.75 203.63Malaysia 14.49 8.47 13.68 17.04 13.26 13.58 11.23 8.39 8.75 11.49 8.44 14.45 143.26Qatar 0 2.87 2.87 0 0 2.91 0 0 0 0 5.82 0 14.47Russia 0 0 0 6.26 0 3.12 0 3.07 3.15 6.26 3.12 3.05 28.03USA 1.89 0 1.15 0 0 0 1.14 1.71 0 1.70 0 0 7.602009 Total 39.11 31.51 39.71 46.75 30.77 41.60 37.22 34.81 40.86 36.73 34.73 45.39 459.19

119
LNG Shipments Received In Sodeshi, Japan by Source (1000's of Metric Tons)
Jan Feb Mar Apr May Jun Jul Aug Sep Oct Nov Dec Total
Australia 0 0 0 0 0 63 0 0 0 0 0 0 63Equatorial Guinea 0 0 0 0 0 0 60 0 0 0 0 0 60Malaysia 58 61 58 60 61 0 61 0 0 0 0 0 359Nigeria 63 0 0 0 0 0 0 0 0 0 0 0 63Russia 0 0 66 64 0 0 0 65 0 0 0 0 1952011 Total 121 61 124 124 61 63 121 65 0 0 0 0 740 Australia 0 0 66 0 0 64 0 0 0 0 64 0 194Malaysia 64 58 0 121 59 58 58 57 61 57 0 0 593Russia 0 0 0 0 0 0 0 0 0 64 65 62 1912010 Total 64 58 66 121 59 122 58 57 61 121 129 62 978 Australia 0 0 0 0 0 65 0 0 0 65 0 0 130Malaysia 58 58 0 57 55 0 57 0 60 0 0 61 4062009 Total 58 58 0 57 55 65 57 0 60 65 0 61 536
LNG Shipments Received In Sodeshi, Japan by Source (Bcf)
Jan Feb Mar Apr May Jun Jul Aug Sep Oct Nov Dec Total
Australia 0 0 0 0 0 3.01 0 0 0 0 0 0 3.01Equatorial Guinea 0 0 0 0 0 0 2.90 0 0 0 0 0 2.90Malaysia 2.77 2.94 2.76 2.89 2.91 0 2.91 0 0 0 0 0 17.19Nigeria 3.03 0 0 0 0 0 0 0 0 0 0 0 3.03Russia 0 0 3.16 3.07 0 0 0 3.12 0 0 0 0 9.352011 Total 5.80 2.94 5.93 5.96 2.91 3.01 5.82 3.12 0 0 0 0 35.49 Australia 0 0 3.16 0 0 3.07 0 0 0 0 3.07 0 9.30Malaysia 3.09 2.79 0 5.80 2.82 2.76 2.76 2.76 2.91 2.76 0 0 28.47Russia 0 0 0 0 0 0 0 0 0 3.08 3.10 2.99 9.172010 Total 3.09 2.79 3.16 5.80 2.82 5.84 2.76 2.76 2.91 5.84 6.18 2.99 46.94 Australia 0 0 0 0 0 3.13 0 0 0 3.12 0 0 6.25Malaysia 2.76 2.78 0 2.76 2.64 0 2.73 0 2.86 0 0 2.93 19.452009 Total 2.76 2.78 0 2.76 2.64 3.13 2.73 0 2.86 3.12 0 2.93 25.70

120
LNG Shipments Received In Tobata, Japan by Source (1000's of Metric Tons)
Jan Feb Mar Apr May Jun Jul Aug Sep Oct Nov Dec Total
Australia 55 55 0 0 56 0 0 0 0 0 0 0 166Egypt 0 58 0 57 0 0 0 64 0 0 0 0 179Equatorial Guinea 0 0 0 0 0 58 64 65 0 0 0 0 187Indonesia 168 112 56 61 0 119 60 0 0 0 0 0 576Malaysia 0 0 64 0 0 0 0 0 0 0 0 0 64Nigeria 0 0 0 0 0 0 62 0 0 0 0 0 62Russia 0 0 62 65 65 65 0 192 0 0 0 0 4492011 Total 223 225 182 183 121 242 186 321 0 0 0 0 1,683 Australia 0 0 0 0 0 0 0 0 0 0 56 0 56Egypt 0 0 0 0 59 0 0 0 0 0 0 59 118Equatorial Guinea 59 0 0 0 0 0 59 0 0 0 0 0 118Indonesia 110 165 168 111 112 112 166 168 168 109 112 108 1,609Russia 0 0 62 0 0 0 0 0 0 0 0 0 622010 Total 169 165 230 111 171 112 225 168 168 109 168 167 1,963 Australia 0 0 0 0 0 0 0 0 64 0 0 0 64Equatorial Guinea 0 57 0 0 56 56 54 0 0 56 0 0 279Indonesia 105 107 150 108 112 112 56 112 165 55 114 168 1,364Oman 62 0 0 0 0 0 0 0 0 0 0 0 62Russia 0 0 0 0 0 0 65 61 0 0 0 0 1262009 Total 167 164 150 108 168 168 175 173 229 111 114 168 1,895

121
LNG Shipments Received In Tobata, Japan by Source (Bcf)
Jan Feb Mar Apr May Jun Jul Aug Sep Oct Nov Dec Total
Australia 2.65 2.63 0 0 2.69 0 0 0 0 0 0 0 7.98Egypt 0 2.78 0 2.76 0 0 0 3.07 0 0 0 0 8.61Equatorial Guinea 0 0 0 0 0 2.77 3.07 3.13 0 0 0 0 8.98Indonesia 8.06 5.37 2.67 2.94 0 5.71 2.89 0 0 0 0 0 27.65Malaysia 0 0 3.08 0 0 0 0 0 0 0 0 0 3.08Nigeria 0 0 0 0 0 0 3.00 0 0 0 0 0 3.00Russia 0 0 2.98 3.11 3.10 3.12 0 9.23 0 0 0 0 21.542011 Total 10.71 10.79 8.72 8.80 5.80 11.61 8.97 15.43 0 0 0 0 80.83 Australia 0 0 0 0 0 0 0 0 0 0 2.70 0 2.70Egypt 0 0 0 0 2.85 0 0 0 0 0 0 2.83 5.68Equatorial Guinea 2.83 0 0 0 0 0 2.84 0 0 0 0 0 5.67Indonesia 5.30 7.95 8.09 5.33 5.39 5.37 8.00 8.06 8.08 5.25 5.38 5.21 77.41Russia 0 0 2.98 0 0 0 0 0 0 0 0 0 2.982010 Total 8.12 7.95 11.07 5.33 8.24 5.37 10.85 8.06 8.08 5.25 8.09 8.04 94.45 Australia 0 0 0 0 0 0 0 0 3.07 0 0 0 3.07Equatorial Guinea 0 2.75 0 0 2.67 2.69 2.57 0 0 2.71 0 0 13.40Indonesia 5.05 5.12 7.19 5.18 5.37 5.37 2.69 5.37 7.92 2.67 5.49 8.08 65.50Oman 2.97 0 0 0 0 0 0 0 0 0 0 0 2.97Russia 0 0 0 0 0 0 3.10 2.94 0 0 0 0 6.042009 Total 8.01 7.87 7.19 5.18 8.05 8.07 8.37 8.31 10.99 5.38 5.49 8.08 90.98

122
LNG Shipments Received In Yanai, Japan by Source (1000's of Metric Tons)
Jan Feb Mar Apr May Jun Jul Aug Sep Oct Nov Dec Total
Australia 61 55 56 178 0 0 117 56 0 0 0 0 523Oman 63 63 0 63 0 64 64 0 0 0 0 0 317Qatar 0 0 0 0 0 0 0 61 0 0 0 0 612011 Total 124 118 56 241 0 64 181 117 0 0 0 0 901 Australia 54 56 112 55 56 55 56 61 84 143 56 173 961Oman 63 63 0 64 0 63 64 0 64 0 64 0 445Qatar 0 0 60 0 61 61 0 0 0 0 0 0 1822010 Total 117 119 172 119 117 179 120 61 148 143 120 173 1,588 Australia 41 99 17 113 56 113 55 111 111 55 167 56 994Oman 65 0 0 0 63 63 66 0 0 64 0 64 385Qatar 0 0 0 61 0 0 0 0 0 0 0 0 612009 Total 106 99 17 174 119 176 121 111 111 119 167 120 1,440

123
LNG Shipments Received In Yanai, Japan by Source (Bcf)
Jan Feb Mar Apr May Jun Jul Aug Sep Oct Nov Dec Total
Australia 2.91 2.63 2.69 8.58 0 0 5.64 2.71 0 0 0 0 25.16Oman 3.05 3.04 0 3.01 0 3.06 3.07 0 0 0 0 0 15.24Qatar 0 0 0 0 0 0 0 2.91 0 0 0 0 2.912011 Total 5.96 5.68 2.69 11.59 0 3.06 8.71 5.62 0 0 0 0 43.31 Australia 2.58 2.70 5.37 2.66 2.70 2.66 2.68 2.95 4.02 6.86 2.70 8.33 46.22Oman 3.04 3.04 0 3.08 0 3.03 3.07 0 3.06 0 3.07 0 21.39Qatar 0 0 2.89 0 2.91 2.91 0 0 0 0 0 0 8.712010 Total 5.63 5.75 8.26 5.74 5.62 8.60 5.75 2.95 7.08 6.86 5.78 8.33 76.33 Australia 1.97 4.75 0.80 5.41 2.71 5.41 2.66 5.32 5.32 2.66 8.03 2.68 47.72Oman 3.12 0 0 0 3.03 3.05 3.18 0 0 3.07 0 3.06 18.50Qatar 0 0 0 2.91 0 0 0 0 0 0 0 0 2.912009 Total 5.09 4.75 0.80 8.33 5.73 8.46 5.84 5.32 5.32 5.74 8.03 5.73 69.13

124
LNG Shipments Received In Yokkaichi/Kawagoe, Japan by Source (1000's of Metric Tons)
Jan Feb Mar Apr May Jun Jul Aug Sep Oct Nov Dec Total
Australia 56 56 0 56 53 0 55 0 0 0 0 0 276Indonesia 112 168 221 117 116 55 60 56 0 0 0 0 905Nigeria 0 0 0 0 0 59 0 61 0 0 0 0 120Peru 0 0 0 0 0 77 0 0 0 0 0 0 77Qatar 242 243 214 179 60 190 367 309 0 0 0 0 1,804Russia 0 0 0 0 128 0 0 0 0 0 0 0 128Yemen 0 0 0 0 0 65 0 0 0 0 0 0 652011 Total 410 467 435 352 357 446 482 426 0 0 0 0 3,375 Australia 54 0 0 55 0 0 112 112 0 0 56 111 500Indonesia 110 275 112 111 168 224 222 167 167 328 168 162 2,214Nigeria 0 0 0 0 0 0 0 0 0 0 120 0 120Oman 63 0 0 0 0 0 0 0 0 0 0 0 63Qatar 181 174 184 180 121 61 61 121 242 120 120 120 1,685Russia 61 0 0 0 0 64 65 0 62 0 0 0 2522010 Total 469 449 296 346 289 349 460 400 471 448 464 393 4,834 Australia 0 0 0 57 0 0 56 112 0 56 0 57 338Egypt 0 58 0 0 0 0 0 0 0 0 0 0 58Indonesia 56 57 56 215 168 111 112 224 110 56 171 112 1,448Qatar 368 121 299 121 185 244 302 71 242 244 244 242 2,683Russia 0 0 0 0 0 0 0 0 125 0 0 0 1252009 Total 424 236 355 393 353 355 470 407 477 356 415 411 4,652

125
LNG Shipments Received In Yokkaichi/Kawagoe, Japan by Source (Bcf)
Jan Feb Mar Apr May Jun Jul Aug Sep Oct Nov Dec Total
Australia 2.69 2.68 0 2.70 2.57 0 2.66 0 0 0 0 0 13.30Indonesia 5.39 8.06 10.64 5.64 5.57 2.66 2.89 2.70 0 0 0 0 43.55Nigeria 0 0 0 0 0 2.84 0 2.93 0 0 0 0 5.76Peru 0 0 0 0 0 3.71 0 0 0 0 0 0 3.71Qatar 11.61 11.66 10.28 8.60 2.89 9.11 17.63 14.84 0 0 0 0 86.64Russia 0 0 0 0 6.14 0 0 0 0 0 0 0 6.14Yemen 0 0 0 0 0 3.14 0 0 0 0 0 0 3.142011 Total 19.69 22.39 20.93 16.94 17.17 21.46 23.18 20.47 0 0 0 0 162.23 Australia 2.58 0 0 2.66 0 0 5.40 5.37 0 0 2.70 5.35 24.06Indonesia 5.30 13.21 5.40 5.32 8.08 10.77 10.66 8.03 8.05 15.75 8.08 7.81 106.45Nigeria 0 0 0 0 0 0 0 0 0 0 5.77 0 5.77Oman 3.04 0 0 0 0 0 0 0 0 0 0 0 3.04Qatar 8.71 8.38 8.83 8.66 5.83 2.91 2.91 5.82 11.66 5.78 5.78 5.78 81.05Russia 2.93 0 0 0 0 3.09 3.14 0 2.99 0 0 0 12.152010 Total 22.57 21.60 14.22 16.64 13.91 16.77 22.12 19.21 22.69 21.52 22.34 18.93 232.52 Australia 0 0 0 2.73 0 0 2.70 5.37 0 2.70 0 2.72 16.22Egypt 0 2.77 0 0 0 0 0 0 0 0 0 0 2.77Indonesia 2.70 2.75 2.69 10.33 8.07 5.36 5.39 10.76 5.28 2.67 8.20 5.40 69.59Qatar 17.71 5.81 14.37 5.82 8.89 11.73 14.53 3.39 11.64 11.73 11.73 11.64 128.99Russia 0 0 0 0 0 0 0 0 6.02 0 0 0 6.022009 Total 20.40 11.33 17.06 18.89 16.96 17.08 22.62 19.52 22.94 17.11 19.93 19.76 223.59

126
Waterborne Energy, Inc.
2323 S. Shepherd Dr. Suite 1010 Houston, Texas
77019 713/526-1555 www.waterbornelng.com
26 Aug 2011
Vol. 8, Week 33
South Korea

127
LNG Shipments Received In South Korea By Terminal (1000's of Metric Tons)
Jan Feb Mar Apr May Jun Jul Aug Sep Oct Nov Dec Total
Gwangyang 133 135 137 137 186 64 133 137 0 0 0 0 1,060Incheon 1,530 1,687 1,497 736 853 674 540 898 0 0 0 0 8,417Pyeongtaek 1,336 1,009 1,470 707 1,041 742 891 750 183 0 0 0 8,129Tongyong 675 890 876 619 734 654 436 657 116 0 0 0 5,6572011 Total 3,674 3,721 3,980 2,200 2,814 2,134 1,999 2,443 299 0 0 0 23,263 Gwangyang 205 133 137 133 68 133 137 134 133 133 129 199 1,671Incheon 1,406 1,356 1,401 988 648 476 720 688 876 945 1,272 1,541 12,317Pyeongtaek 1,296 1,229 1,403 499 853 674 715 847 731 955 1,173 1,417 11,792Tongyong 616 767 712 740 497 730 484 431 610 673 916 1,104 8,2812010 Total 3,523 3,484 3,652 2,360 2,067 2,013 2,056 2,100 2,350 2,707 3,489 4,262 34,061 Gwangyang 239 126 56 64 133 132 68 130 124 68 249 129 1,517Incheon 1,364 936 986 589 553 550 360 366 456 902 1,015 1,314 9,390Pyeongtaek 1,019 979 943 618 409 513 452 432 434 808 947 1,338 8,890Tongyong 658 726 550 484 296 283 172 293 247 663 420 760 5,5522009 Total 3,280 2,767 2,535 1,755 1,390 1,478 1,052 1,221 1,261 2,441 2,630 3,540 25,350

128
LNG Shipments Received In South Korea By Terminal (Bcf)
Jan Feb Mar Apr May Jun Jul Aug Sep Oct Nov Dec Total
Gwangyang 6.38 6.49 6.57 6.57 8.93 3.09 6.38 6.57 0 0 0 0 50.97Incheon 73.57 81.10 71.98 35.40 41.03 32.41 25.95 43.19 0 0 0 0 404.63Pyeongtaek 64.21 48.53 70.68 33.99 50.03 35.65 42.81 36.08 8.79 0 0 0 390.77Tongyong 32.45 42.77 42.10 29.78 35.29 31.44 20.96 31.60 5.59 0 0 0 271.972011 Total 176.60 178.88 191.33 105.75 135.28 102.59 96.10 117.43 14.38 0 0 0 1,118.35 Gwangyang 9.86 6.38 6.57 6.38 3.29 6.38 6.57 6.42 6.38 6.38 6.18 9.57 80.34Incheon 67.57 65.18 67.33 47.49 31.17 22.89 34.63 33.07 42.10 45.44 61.15 74.09 592.12Pyeongtaek 62.32 59.06 67.43 24.01 41.02 32.39 34.36 40.72 35.15 45.93 56.38 68.14 566.91Tongyong 29.63 36.86 34.21 35.59 23.91 35.11 23.27 20.72 29.32 32.38 44.02 53.07 398.102010 Total 169.37 167.47 175.54 113.47 99.38 96.77 98.83 100.93 112.95 130.12 167.73 204.88 1,637.46 Gwangyang 11.50 6.05 2.69 3.07 6.38 6.36 3.29 6.25 5.94 3.26 11.96 6.18 72.94Incheon 65.58 45.02 47.39 28.29 26.57 26.46 17.28 17.62 21.91 43.34 48.78 63.18 451.42Pyeongtaek 48.97 47.06 45.32 29.72 19.67 24.65 21.72 20.75 20.86 38.86 45.50 64.31 427.40Tongyong 31.61 34.89 26.46 23.26 14.23 13.60 8.28 14.08 11.90 31.88 20.18 36.54 266.912009 Total 157.67 133.02 121.86 84.36 66.84 71.07 50.57 58.70 60.61 117.34 126.42 170.21 1,218.67

129
LNG Shipments Received In South Korea By Source (1000's of Metric Tons)
Jan Feb Mar Apr May Jun Jul Aug Sep Oct Nov Dec Total
Australia 138 117 251 117 180 61 61 0 55 0 0 0 980Brunei 120 60 65 65 65 65 0 65 0 0 0 0 505Egypt 66 150 75 0 0 0 0 0 0 0 0 0 291Equatorial Guinea 281 209 143 0 0 73 0 0 0 0 0 0 706Indonesia 515 382 430 486 740 423 481 622 0 0 0 0 4,079Malaysia 457 345 337 225 173 231 289 455 0 0 0 0 2,512Nigeria 64 190 64 0 0 0 53 128 0 0 0 0 499Norway 0 0 64 0 0 0 0 0 61 0 0 0 125Oman 304 495 436 304 182 243 183 304 61 0 0 0 2,512Peru 154 212 231 0 71 68 0 0 0 0 0 0 736Qatar 727 791 852 551 662 483 550 488 61 0 0 0 5,165Russia 520 258 516 193 192 61 128 0 0 0 0 0 1,868Trinidad 61 122 181 60 242 106 55 120 61 0 0 0 1,008US Re-export 0 0 0 0 53 0 0 0 0 0 0 0 53USA 0 130 0 0 0 0 0 0 0 0 0 0 130Yemen 267 260 335 200 254 322 199 260 0 0 0 0 2,0972011 Total 3,674 3,721 3,980 2,201 2,814 2,136 1,999 2,442 299 0 0 0 23,266 Abu Dhabi 66 0 68 0 0 0 0 0 0 0 0 55 189Australia 174 118 56 65 0 0 65 0 126 121 187 65 977Belgium Re-export 0 0 0 0 0 0 0 67 0 0 0 0 67Brunei 60 60 121 60 0 121 60 62 0 121 60 0 725Egypt 140 132 132 0 0 75 0 0 129 0 135 75 818Equatorial Guinea 205 213 195 67 73 0 73 71 64 136 0 349 1,446Indonesia 726 373 536 499 361 426 464 399 411 350 566 431 5,542Malaysia 634 472 762 169 337 342 344 343 340 413 401 407 4,964Nigeria 0 60 0 0 0 0 0 61 62 119 118 451 871Norway 0 0 0 0 0 0 0 0 0 0 0 133 133Oman 425 365 429 429 304 304 243 302 246 494 617 486 4,644Peru 0 0 0 0 0 0 0 0 0 0 0 68 68Qatar 581 860 829 677 606 361 549 604 587 452 602 788 7,496Russia 258 508 318 253 323 189 64 64 257 255 447 384 3,320Trinidad 125 126 68 0 0 0 0 0 0 55 105 181 660USA 66 0 0 0 0 0 64 0 0 0 0 127 257Yemen 64 195 137 140 64 195 128 127 128 191 253 260 1,882

130
2010 Total 3,524 3,482 3,651 2,359 2,068 2,013 2,054 2,100 2,350 2,707 3,491 4,260 34,059
LNG Shipments Received In South Korea By Source (1000's of Metric Tons)
Algeria 0 0 0 0 0 0 0 0 0 0 0 61 61Australia 176 228 120 125 55 68 0 0 68 112 116 127 1,195Brunei 60 60 60 0 0 0 0 60 60 60 121 60 541Egypt 64 64 0 0 0 0 0 66 0 0 0 72 266Equatorial Guinea 195 132 267 64 0 146 64 0 73 67 73 206 1,287Indonesia 344 344 228 227 120 178 179 288 111 400 297 408 3,124Malaysia 823 532 695 401 362 537 351 192 55 822 695 536 6,001Nigeria 124 64 0 0 0 0 0 0 0 0 0 64 252Oman 429 429 430 365 311 186 122 183 244 304 494 557 4,054Qatar 805 669 671 508 478 364 336 431 520 610 705 610 6,707Russia 0 0 0 64 65 0 0 0 129 65 129 514 966Trinidad 259 244 64 0 0 0 0 0 0 0 0 129 696Yemen 0 0 0 0 0 0 0 0 0 0 0 195 1952009 Total 3,279 2,766 2,535 1,754 1,391 1,479 1,052 1,220 1,260 2,440 2,630 3,539 25,345

131
LNG Shipments Received In South Korea By Source (Bcf)
Jan Feb Mar Apr May Jun Jul Aug Sep Oct Nov Dec Total
Australia 6.63 5.64 12.05 5.64 8.67 2.93 2.93 0 2.66 0 0 0 47.15Brunei 5.77 2.86 3.12 3.12 3.12 3.11 0 3.12 0 0 0 0 24.21Egypt 3.18 7.21 3.60 0 0 0 0 0 0 0 0 0 13.99Equatorial Guinea 13.51 10.02 6.89 0 0 3.51 0 0 0 0 0 0 33.93Indonesia 24.74 18.37 20.67 23.36 35.57 20.34 23.11 29.90 0 0 0 0 196.05Malaysia 21.97 16.56 16.22 10.81 8.33 11.10 13.91 21.90 0 0 0 0 120.79Nigeria 3.07 9.14 3.07 0 0 0 2.56 6.15 0 0 0 0 24.00Norway 0 0 3.09 0 0 0 0 0 2.93 0 0 0 6.01Oman 14.62 23.81 20.95 14.62 8.76 11.67 8.79 14.62 2.93 0 0 0 120.78Peru 7.42 10.18 11.10 0 3.41 3.26 0 0 0 0 0 0 35.38Qatar 34.97 38.04 40.97 26.47 31.83 23.20 26.46 23.48 2.93 0 0 0 248.34Russia 24.98 12.42 24.79 9.27 9.21 2.93 6.14 0 0 0 0 0 89.73Trinidad 2.93 5.85 8.71 2.86 11.64 5.07 2.63 5.79 2.93 0 0 0 48.41US Re-export 0 0 0 0 2.56 0 0 0 0 0 0 0 2.56USA 0 6.27 0 0 0 0 0 0 0 0 0 0 6.27Yemen 12.82 12.49 16.09 9.61 12.20 15.47 9.56 12.49 0 0 0 0 100.742011 Total 176.60 178.88 191.33 105.75 135.28 102.59 96.10 117.43 14.38 0 0 0 1,118.35 Abu Dhabi 3.17 0 3.26 0 0 0 0 0 0 0 0 2.65 9.09Australia 8.38 5.69 2.71 3.13 0 0 3.13 0 6.05 5.79 8.99 3.13 47.00Belgium Re-export 0 0 0 0 0 0 0 3.24 0 0 0 0 3.24Brunei 2.90 2.90 5.81 2.90 0 5.81 2.90 2.97 0 5.81 2.90 0 34.91Egypt 6.72 6.35 6.34 0 0 3.60 0 0 6.20 0 6.51 3.60 39.33Equatorial Guinea 9.84 10.25 9.38 3.23 3.51 0 3.51 3.40 3.07 6.55 0 16.77 69.50Indonesia 34.88 17.94 25.78 23.99 17.35 20.48 22.32 19.17 19.75 16.81 27.20 20.74 266.39Malaysia 30.48 22.71 36.65 8.15 16.21 16.44 16.54 16.51 16.37 19.86 19.25 19.58 238.75Nigeria 0 2.86 0 0 0 0 0 2.93 2.98 5.70 5.65 21.67 41.79Norway 0 0 0 0 0 0 0 0 0 0 0 6.41 6.41Oman 20.41 17.55 20.63 20.64 14.62 14.62 11.71 14.52 11.83 23.76 29.64 23.35 223.28Peru 0 0 0 0 0 0 0 0 0 0 0 3.26 3.26Qatar 27.93 41.36 39.84 32.53 29.12 17.38 26.40 29.02 28.21 21.71 28.93 37.89 360.31Russia 12.39 24.43 15.28 12.17 15.51 9.07 3.09 3.07 12.34 12.28 21.47 18.48 159.58Trinidad 6.01 6.05 3.29 0 0 0 0 0 0 2.66 5.06 8.72 31.79USA 3.18 0 0 0 0 0 3.07 0 0 0 0 6.12 12.38Yemen 3.07 9.38 6.59 6.73 3.07 9.38 6.16 6.10 6.14 9.18 12.14 12.50 90.46

132
2010 Total 169.37 167.47 175.54 113.47 99.38 96.77 98.83 100.93 112.95 130.12 167.73 204.88 1,637.46
LNG Shipments Received In South Korea By Source (Bcf)
Algeria 0 0 0 0 0 0 0 0 0 0 0 2.93 2.93Australia 8.46 10.98 5.75 6.01 2.66 3.29 0 0 3.29 5.37 5.59 6.10 57.49Brunei 2.90 2.90 2.90 0 0 0 0 2.90 2.90 2.90 5.81 2.90 26.12Egypt 3.07 3.09 0 0 0 0 0 3.18 0 0 0 3.44 12.79Equatorial Guinea 9.38 6.34 12.84 3.07 0 7.01 3.07 0 3.51 3.23 3.51 9.91 61.87Indonesia 16.55 16.55 10.96 10.93 5.78 8.55 8.63 13.86 5.32 19.25 14.30 19.64 150.31Malaysia 39.54 25.57 33.39 19.29 17.38 25.80 16.85 9.22 2.65 39.51 33.41 25.77 288.40Nigeria 5.98 3.07 0 0 0 0 0 0 0 0 0 3.09 12.14Oman 20.63 20.63 20.69 17.55 14.93 8.93 5.86 8.80 11.71 14.62 23.77 26.80 194.92Qatar 38.71 32.16 32.25 24.41 22.97 17.49 16.16 20.74 25.02 29.34 33.87 29.34 322.46Russia 0 0 0 3.09 3.12 0 0 0 6.21 3.12 6.18 24.69 46.41Trinidad 12.44 11.73 3.07 0 0 0 0 0 0 0 0 6.21 33.46Yemen 0 0 0 0 0 0 0 0 0 0 0 9.38 9.382009 Total 157.67 133.02 121.86 84.36 66.84 71.07 50.57 58.70 60.61 117.34 126.42 170.21 1,218.67

133
LNG Shipments Received In Gwangyang, South Korea by Source (1000's of Metric Tons)
Jan Feb Mar Apr May Jun Jul Aug Sep Oct Nov Dec Total
Indonesia 133 68 137 137 133 64 133 137 0 0 0 0 942US Re-export 0 0 0 0 53 0 0 0 0 0 0 0 53USA 0 67 0 0 0 0 0 0 0 0 0 0 672011 Total 133 135 137 137 186 64 133 137 0 0 0 0 1,062 Indonesia 205 133 137 133 68 133 137 134 133 133 129 133 1,608USA 0 0 0 0 0 0 0 0 0 0 0 67 672010 Total 205 133 137 133 68 133 137 134 133 133 129 200 1,675 Australia 64 0 0 0 0 68 0 0 68 0 0 0 200Egypt 0 0 0 0 0 0 0 66 0 0 0 0 66Indonesia 0 0 56 0 64 0 68 0 55 0 119 64 426Malaysia 0 0 0 64 68 64 0 64 0 68 0 0 328Nigeria 60 0 0 0 0 0 0 0 0 0 0 0 60Oman 0 64 0 0 0 0 0 0 0 0 129 0 193Qatar 46 0 0 0 0 0 0 0 0 0 0 0 46Trinidad 68 62 0 0 0 0 0 0 0 0 0 0 130Yemen 0 0 0 0 0 0 0 0 0 0 0 64 642009 Total 238 126 56 64 132 132 68 130 123 68 248 128 1,513

134
LNG Shipments Received In Gwangyang, South Korea by Source (Bcf)
Jan Feb Mar Apr May Jun Jul Aug Sep Oct Nov Dec Total
Indonesia 6.38 3.29 6.57 6.57 6.38 3.09 6.38 6.57 0 0 0 0 45.22US Re-export 0 0 0 0 2.56 0 0 0 0 0 0 0 2.56USA 0 3.20 0 0 0 0 0 0 0 0 0 0 3.202011 Total 6.38 6.49 6.57 6.57 8.93 3.09 6.38 6.57 0 0 0 0 50.97 Indonesia 9.86 6.38 6.57 6.38 3.29 6.38 6.57 6.42 6.38 6.38 6.18 6.38 77.14USA 0 0 0 0 0 0 0 0 0 0 0 3.20 3.202010 Total 9.86 6.38 6.57 6.38 3.29 6.38 6.57 6.42 6.38 6.38 6.18 9.57 80.34 Australia 3.09 0 0 0 0 3.29 0 0 3.29 0 0 0 9.66Egypt 0 0 0 0 0 0 0 3.18 0 0 0 0 3.18Indonesia 0 0 2.69 0 3.09 0 3.29 0 2.65 0 5.74 3.09 20.55Malaysia 0 0 0 3.07 3.29 3.07 0 3.07 0 3.26 0 0 15.77Nigeria 2.90 0 0 0 0 0 0 0 0 0 0 0 2.90Oman 0 3.07 0 0 0 0 0 0 0 0 6.22 0 9.29Qatar 2.23 0 0 0 0 0 0 0 0 0 0 0 2.23Trinidad 3.29 2.98 0 0 0 0 0 0 0 0 0 0 6.27Yemen 0 0 0 0 0 0 0 0 0 0 0 3.09 3.092009 Total 11.50 6.05 2.69 3.07 6.38 6.36 3.29 6.25 5.94 3.26 11.96 6.18 72.94

135
LNG Shipments Received In Incheon, South Korea by Source (1000's of Metric Tons)
Jan Feb Mar Apr May Jun Jul Aug Sep Oct Nov Dec Total
Australia 0 0 125 0 0 0 0 0 0 0 0 0 125Brunei 60 60 0 65 0 0 0 0 0 0 0 0 185Egypt 66 0 0 0 0 0 0 0 0 0 0 0 66Equatorial Guinea 0 141 68 0 0 73 0 0 0 0 0 0 282Indonesia 126 198 58 180 61 177 119 248 0 0 0 0 1,167Malaysia 291 231 56 56 116 59 56 97 0 0 0 0 962Nigeria 0 62 64 0 0 0 0 0 0 0 0 0 126Norway 0 0 64 0 0 0 0 0 0 0 0 0 64Oman 122 121 246 0 61 61 61 61 0 0 0 0 733Peru 154 135 76 0 71 0 0 0 0 0 0 0 436Qatar 452 610 546 307 420 120 122 367 0 0 0 0 2,944Russia 195 64 64 64 0 0 64 0 0 0 0 0 451Trinidad 0 0 61 0 61 53 55 61 0 0 0 0 291Yemen 64 65 68 64 64 132 64 65 0 0 0 0 5862011 Total 1,530 1,687 1,496 736 854 675 541 899 0 0 0 0 8,418 Abu Dhabi 0 0 68 0 0 0 0 0 0 0 0 0 68Australia 56 56 56 0 0 0 0 0 0 64 66 0 298Brunei 60 60 60 60 0 0 0 0 0 0 0 0 240Egypt 0 66 64 0 0 0 0 0 64 0 68 75 337Equatorial Guinea 0 0 67 0 0 0 73 0 64 136 0 137 477Indonesia 284 172 111 116 116 180 156 206 217 217 123 111 2,009Malaysia 353 229 363 56 169 111 122 116 61 64 228 116 1,988Nigeria 0 60 0 0 0 0 0 61 62 62 59 262 566Norway 0 0 0 0 0 0 0 0 0 0 0 72 72Oman 121 243 307 61 243 0 61 0 125 65 307 244 1,777Qatar 277 276 303 555 120 118 245 304 283 209 179 271 3,140Russia 64 65 0 0 0 0 0 0 0 62 64 0 255Trinidad 61 0 0 0 0 0 0 0 0 0 53 122 236USA 66 0 0 0 0 0 0 0 0 0 0 0 66Yemen 64 128 0 140 0 67 64 0 0 65 127 131 7862010 Total 1,406 1,355 1,399 988 648 476 721 687 876 944 1,274 1,541 12,315
Continued on following page

136
Continued from previous page
LNG Shipments Received In Incheon, South Korea by Source (1000's of Metric Tons)
Australia 55 55 55 61 0 0 0 0 0 56 55 67 404Brunei 60 60 0 0 0 0 0 0 0 0 0 60 180Egypt 64 0 0 0 0 0 0 0 0 0 0 0 64Equatorial Guinea 137 65 66 0 0 0 0 0 0 0 0 133 401Indonesia 172 56 56 55 0 122 0 56 0 166 122 228 1,033Malaysia 304 178 287 168 125 185 55 67 55 342 352 357 2,475Nigeria 64 0 0 0 0 0 0 0 0 0 0 0 64Oman 122 304 244 183 183 61 122 61 122 122 122 125 1,771Qatar 387 156 214 122 245 183 183 182 279 215 300 275 2,741Russia 0 0 0 0 0 0 0 0 0 0 64 0 64Trinidad 0 62 64 0 0 0 0 0 0 0 0 68 1942009 Total 1,365 936 986 589 553 551 360 366 456 901 1,015 1,313 9,391

137
LNG Shipments Received In Incheon, South Korea by Source (Bcf)
Jan Feb Mar Apr May Jun Jul Aug Sep Oct Nov Dec Total
Australia 0 0 5.99 0 0 0 0 0 0 0 0 0 5.99Brunei 2.90 2.86 0 3.12 0 0 0 0 0 0 0 0 8.88Egypt 3.18 0 0 0 0 0 0 0 0 0 0 0 3.18Equatorial Guinea 0 6.79 3.29 0 0 3.51 0 0 0 0 0 0 13.59Indonesia 6.07 9.51 2.79 8.66 2.93 8.49 5.70 11.94 0 0 0 0 56.09Malaysia 13.97 11.11 2.70 2.70 5.56 2.83 2.71 4.65 0 0 0 0 46.23Nigeria 0 2.98 3.07 0 0 0 0 0 0 0 0 0 6.05Norway 0 0 3.09 0 0 0 0 0 0 0 0 0 3.09Oman 5.87 5.84 11.83 0 2.92 2.92 2.93 2.93 0 0 0 0 35.24Peru 7.42 6.51 3.67 0 3.41 0 0 0 0 0 0 0 21.00Qatar 21.72 29.30 26.27 14.76 20.18 5.76 5.84 17.63 0 0 0 0 141.46Russia 9.35 3.09 3.09 3.09 0 0 3.05 0 0 0 0 0 21.67Trinidad 0 0 2.93 0 2.93 2.54 2.63 2.93 0 0 0 0 13.95Yemen 3.09 3.11 3.27 3.09 3.10 6.36 3.07 3.11 0 0 0 0 28.202011 Total 73.57 81.10 71.98 35.40 41.03 32.41 25.95 43.19 0 0 0 0 404.63 Abu Dhabi 0 0 3.26 0 0 0 0 0 0 0 0 0 3.26Australia 2.70 2.71 2.71 0 0 0 0 0 0 3.09 3.17 0 14.37Brunei 2.90 2.90 2.90 2.90 0 0 0 0 0 0 0 0 11.61Egypt 0 3.17 3.09 0 0 0 0 0 3.09 0 3.25 3.60 16.21Equatorial Guinea 0 0 3.23 0 0 0 3.51 0 3.07 6.55 0 6.59 22.95Indonesia 13.65 8.27 5.34 5.59 5.58 8.66 7.51 9.92 10.44 10.44 5.93 5.35 96.68Malaysia 16.96 11.02 17.47 2.70 8.11 5.35 5.85 5.59 2.91 3.06 10.94 5.58 95.55Nigeria 0 2.86 0 0 0 0 0 2.93 2.98 2.98 2.82 12.61 27.19Norway 0 0 0 0 0 0 0 0 0 0 0 3.44 3.44Oman 5.80 11.69 14.76 2.91 11.71 0 2.91 0 6.01 3.14 14.74 11.71 85.38Qatar 13.29 13.27 14.57 26.67 5.77 5.67 11.78 14.62 13.60 10.05 8.60 13.02 150.91Russia 3.09 3.12 0 0 0 0 0 0 0 3.00 3.07 0 12.27Trinidad 2.93 0 0 0 0 0 0 0 0 0 2.53 5.86 11.31USA 3.18 0 0 0 0 0 0 0 0 0 0 0 3.18Yemen 3.07 6.16 0 6.73 0 3.22 3.07 0 0 3.14 6.10 6.31 37.812010 Total 67.57 65.18 67.33 47.49 31.17 22.89 34.63 33.07 42.10 45.44 61.15 74.09 592.12
Continued on following page

138
Continued from previous page
LNG Shipments Received In Incheon, South Korea by Source (Bcf)
Australia 2.66 2.66 2.66 2.93 0 0 0 0 0 2.71 2.66 3.20 19.47Brunei 2.90 2.90 0 0 0 0 0 0 0 0 0 2.90 8.71Egypt 3.07 0 0 0 0 0 0 0 0 0 0 0 3.07Equatorial Guinea 6.57 3.11 3.17 0 0 0 0 0 0 0 0 6.40 19.26Indonesia 8.27 2.69 2.69 2.65 0 5.87 0 2.69 0 8.00 5.87 10.96 49.69Malaysia 14.59 8.57 13.78 8.06 5.99 8.90 2.65 3.23 2.65 16.46 16.91 17.18 118.98Nigeria 3.07 0 0 0 0 0 0 0 0 0 0 0 3.07Oman 5.85 14.62 11.73 8.79 8.80 2.91 5.86 2.93 5.87 5.85 5.85 6.02 85.07Qatar 18.59 7.49 10.29 5.86 11.78 8.77 8.77 8.77 13.39 10.32 14.41 13.22 131.67Russia 0 0 0 0 0 0 0 0 0 0 3.09 0 3.09Trinidad 0 2.98 3.07 0 0 0 0 0 0 0 0 3.29 9.342009 Total 65.58 45.02 47.39 28.29 26.57 26.46 17.28 17.62 21.91 43.34 48.78 63.18 451.42

139
LNG Shipments Received In Pyeongtaek, South Korea by Source (1000's of Metric Tons)
Jan Feb Mar Apr May Jun Jul Aug Sep Oct Nov Dec Total
Australia 73 56 65 56 64 61 61 0 0 0 0 0 436Brunei 60 0 0 0 0 0 0 65 0 0 0 0 125Egypt 0 150 75 0 0 0 0 0 0 0 0 0 225Equatorial Guinea 281 0 75 0 0 0 0 0 0 0 0 0 356Indonesia 256 116 113 169 417 122 168 182 0 0 0 0 1,543Malaysia 0 114 224 111 0 0 111 76 0 0 0 0 636Nigeria 64 64 0 0 0 0 53 0 0 0 0 0 181Norway 0 0 0 0 0 0 0 0 61 0 0 0 61Oman 121 60 129 122 61 61 61 243 61 0 0 0 919Peru 0 76 155 0 0 68 0 0 0 0 0 0 299Qatar 154 182 185 61 122 303 368 61 61 0 0 0 1,497Russia 195 0 191 129 127 0 0 0 0 0 0 0 642Trinidad 61 61 120 60 122 0 0 60 0 0 0 0 484Yemen 72 131 139 0 128 127 68 64 0 0 0 0 7292011 Total 1,337 1,010 1,471 708 1,041 742 890 751 183 0 0 0 8,133 Abu Dhabi 66 0 0 0 0 0 0 0 0 0 0 0 66Australia 56 0 0 0 0 0 0 0 65 56 0 0 177Belgium Re-export 0 0 0 0 0 0 0 67 0 0 0 0 67Brunei 0 0 0 0 0 0 0 62 0 60 60 0 182Egypt 68 0 68 0 0 75 0 0 0 0 68 0 279Equatorial Guinea 205 140 128 0 73 0 0 0 0 0 0 143 689Indonesia 237 68 172 139 116 113 55 0 61 0 314 187 1,462Malaysia 170 118 115 56 169 173 166 171 167 176 61 61 1,603Nigeria 0 0 0 0 0 0 0 0 0 57 59 124 240Oman 122 122 61 183 61 122 122 242 61 305 185 182 1,768Peru 0 0 0 0 0 0 0 0 0 0 0 68 68Qatar 244 462 465 61 242 0 243 241 121 181 363 335 2,958Russia 65 125 189 60 129 62 0 0 128 0 63 128 949Trinidad 64 126 68 0 0 0 0 0 0 55 0 60 373USA 0 0 0 0 0 0 64 0 0 0 0 61 125Yemen 0 67 137 0 64 128 64 65 128 64 0 68 7852010 Total 1,297 1,228 1,403 499 854 673 714 848 731 954 1,173 1,417 11,791
Continued on following page

140
Continued from previous page
LNG Shipments Received In Pyeongtaek, South Korea by Source (1000's of Metric Tons)
Algeria 0 0 0 0 0 0 0 0 0 0 0 61 61Australia 56 112 0 64 0 0 0 0 0 0 0 60 292Brunei 0 0 60 0 0 0 0 0 60 60 60 0 240Egypt 0 0 0 0 0 0 0 0 0 0 0 72 72Equatorial Guinea 58 67 137 0 0 146 64 0 73 0 73 73 691Indonesia 117 233 55 111 56 0 56 122 56 112 56 116 1,090Malaysia 349 111 295 57 56 61 239 61 0 115 170 57 1,571Oman 122 61 0 121 61 125 0 61 0 122 182 243 1,098Qatar 191 274 396 264 172 181 93 188 181 335 405 335 3,015Russia 0 0 0 0 65 0 0 0 64 65 0 192 386Trinidad 126 120 0 0 0 0 0 0 0 0 0 61 307Yemen 0 0 0 0 0 0 0 0 0 0 0 67 672009 Total 1,019 978 943 617 410 513 452 432 434 809 946 1,337 8,890

141
LNG Shipments Received In Pyeongtaek, South Korea by Source (Bcf)
Jan Feb Mar Apr May Jun Jul Aug Sep Oct Nov Dec Total
Australia 3.50 2.71 3.13 2.70 3.07 2.93 2.93 0 0 0 0 0 20.98Brunei 2.87 0 0 0 0 0 0 3.12 0 0 0 0 5.98Egypt 0 7.21 3.60 0 0 0 0 0 0 0 0 0 10.81Equatorial Guinea 13.51 0 3.60 0 0 0 0 0 0 0 0 0 17.12Indonesia 12.29 5.58 5.44 8.13 20.06 5.85 8.10 8.73 0 0 0 0 74.17Malaysia 0 5.46 10.76 5.35 0 0 5.33 3.68 0 0 0 0 30.57Nigeria 3.07 3.08 0 0 0 0 2.56 0 0 0 0 0 8.72Norway 0 0 0 0 0 0 0 0 2.93 0 0 0 2.93Oman 5.83 2.86 6.19 5.85 2.92 2.91 2.93 11.69 2.93 0 0 0 44.11Peru 0 3.68 7.43 0 0 3.26 0 0 0 0 0 0 14.37Qatar 7.38 8.73 8.87 2.93 5.86 14.58 17.69 2.91 2.93 0 0 0 71.88Russia 9.38 0 9.20 6.18 6.13 0 0 0 0 0 0 0 30.89Trinidad 2.93 2.93 5.79 2.86 5.85 0 0 2.86 0 0 0 0 23.21Yemen 3.44 6.29 6.66 0 6.15 6.12 3.27 3.09 0 0 0 0 35.032011 Total 64.21 48.53 70.68 33.99 50.03 35.65 42.81 36.08 8.79 0 0 0 390.77 Abu Dhabi 3.17 0 0 0 0 0 0 0 0 0 0 0 3.17Australia 2.71 0 0 0 0 0 0 0 3.12 2.70 0 0 8.53Belgium Re-export 0 0 0 0 0 0 0 3.24 0 0 0 0 3.24Brunei 0 0 0 0 0 0 0 2.97 0 2.90 2.90 0 8.78Egypt 3.28 0 3.25 0 0 3.60 0 0 0 0 3.25 0 13.39Equatorial Guinea 9.84 6.74 6.15 0 3.51 0 0 0 0 0 0 6.89 33.12Indonesia 11.37 3.29 8.27 6.69 5.59 5.44 2.65 0 2.93 0 15.09 9.01 70.34Malaysia 8.17 5.68 5.52 2.70 8.10 8.33 8.00 8.21 8.04 8.48 2.92 2.91 77.05Nigeria 0 0 0 0 0 0 0 0 0 2.72 2.82 5.98 11.53Oman 5.86 5.87 2.93 8.79 2.91 5.86 5.86 11.63 2.91 14.66 8.90 8.77 84.95Peru 0 0 0 0 0 0 0 0 0 0 0 3.26 3.26Qatar 11.71 22.23 22.35 2.93 11.65 0 11.69 11.56 5.84 8.72 17.44 16.09 142.22Russia 3.12 5.99 9.07 2.90 6.18 2.99 0 0 6.16 0 3.05 6.16 45.63Trinidad 3.09 6.05 3.29 0 0 0 0 0 0 2.66 0 2.86 17.95USA 0 0 0 0 0 0 3.07 0 0 0 0 2.93 6.00Yemen 0 3.22 6.59 0 3.07 6.16 3.09 3.11 6.14 3.08 0 3.27 37.742010 Total 62.32 59.06 67.43 24.01 41.02 32.39 34.36 40.72 35.15 45.93 56.38 68.14 566.91
Continued on following page

142
Continued from previous page
LNG Shipments Received In Pyeongtaek, South Korea by Source (Bcf)
Algeria 0 0 0 0 0 0 0 0 0 0 0 2.93 2.93Australia 2.71 5.39 0 3.09 0 0 0 0 0 0 0 2.90 14.09Brunei 0 0 2.90 0 0 0 0 0 2.90 2.90 2.90 0 11.61Egypt 0 0 0 0 0 0 0 0 0 0 0 3.44 3.44Equatorial Guinea 2.81 3.23 6.57 0 0 7.01 3.07 0 3.51 0 3.51 3.51 33.22Indonesia 5.62 11.21 2.65 5.34 2.69 0 2.69 5.87 2.67 5.37 2.69 5.59 52.38Malaysia 16.79 5.35 14.16 2.76 2.70 2.91 11.51 2.91 0 5.52 8.17 2.76 75.53Oman 5.85 2.93 0 5.83 2.91 6.01 0 2.93 0 5.85 8.77 11.69 52.78Qatar 9.16 13.18 19.03 12.70 8.25 8.72 4.45 9.04 8.69 16.09 19.46 16.11 144.90Russia 0 0 0 0 3.12 0 0 0 3.09 3.12 0 9.23 18.56Trinidad 6.04 5.77 0 0 0 0 0 0 0 0 0 2.93 14.73Yemen 0 0 0 0 0 0 0 0 0 0 0 3.22 3.222009 Total 48.97 47.06 45.32 29.72 19.67 24.65 21.72 20.75 20.86 38.86 45.50 64.31 427.40
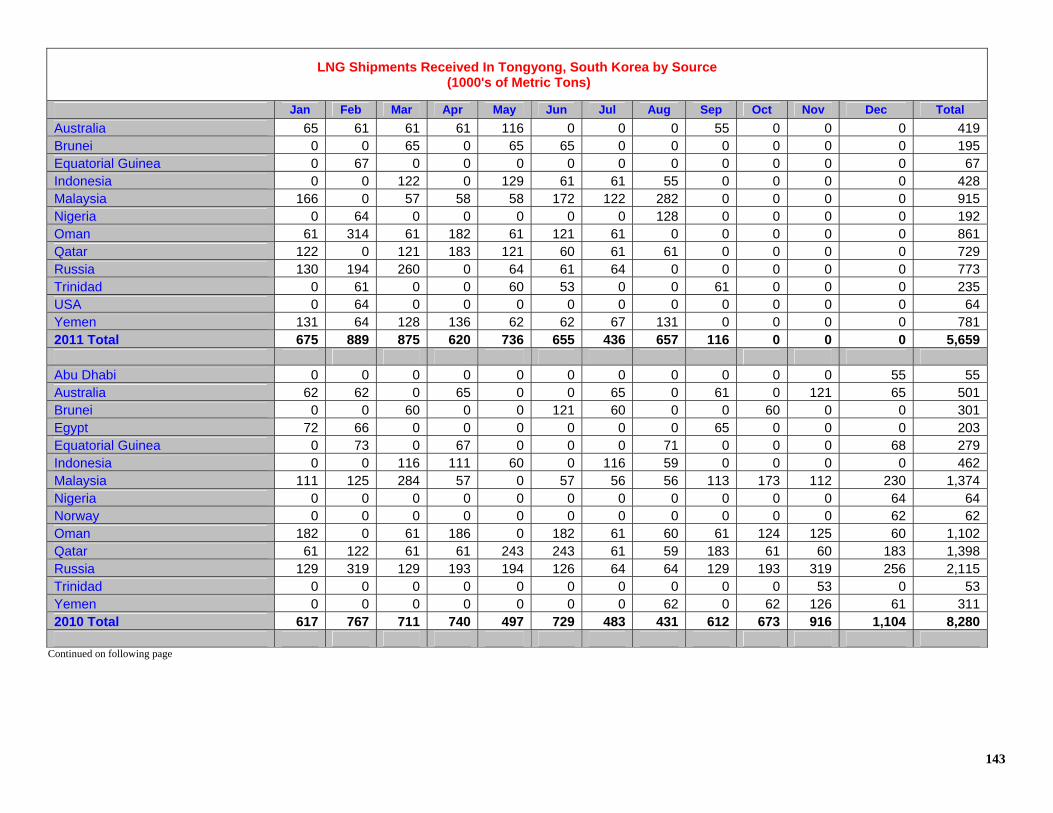
143
LNG Shipments Received In Tongyong, South Korea by Source (1000's of Metric Tons)
Jan Feb Mar Apr May Jun Jul Aug Sep Oct Nov Dec Total
Australia 65 61 61 61 116 0 0 0 55 0 0 0 419Brunei 0 0 65 0 65 65 0 0 0 0 0 0 195Equatorial Guinea 0 67 0 0 0 0 0 0 0 0 0 0 67Indonesia 0 0 122 0 129 61 61 55 0 0 0 0 428Malaysia 166 0 57 58 58 172 122 282 0 0 0 0 915Nigeria 0 64 0 0 0 0 0 128 0 0 0 0 192Oman 61 314 61 182 61 121 61 0 0 0 0 0 861Qatar 122 0 121 183 121 60 61 61 0 0 0 0 729Russia 130 194 260 0 64 61 64 0 0 0 0 0 773Trinidad 0 61 0 0 60 53 0 0 61 0 0 0 235USA 0 64 0 0 0 0 0 0 0 0 0 0 64Yemen 131 64 128 136 62 62 67 131 0 0 0 0 7812011 Total 675 889 875 620 736 655 436 657 116 0 0 0 5,659 Abu Dhabi 0 0 0 0 0 0 0 0 0 0 0 55 55Australia 62 62 0 65 0 0 65 0 61 0 121 65 501Brunei 0 0 60 0 0 121 60 0 0 60 0 0 301Egypt 72 66 0 0 0 0 0 0 65 0 0 0 203Equatorial Guinea 0 73 0 67 0 0 0 71 0 0 0 68 279Indonesia 0 0 116 111 60 0 116 59 0 0 0 0 462Malaysia 111 125 284 57 0 57 56 56 113 173 112 230 1,374Nigeria 0 0 0 0 0 0 0 0 0 0 0 64 64Norway 0 0 0 0 0 0 0 0 0 0 0 62 62Oman 182 0 61 186 0 182 61 60 61 124 125 60 1,102Qatar 61 122 61 61 243 243 61 59 183 61 60 183 1,398Russia 129 319 129 193 194 126 64 64 129 193 319 256 2,115Trinidad 0 0 0 0 0 0 0 0 0 0 53 0 53Yemen 0 0 0 0 0 0 0 62 0 62 126 61 3112010 Total 617 767 711 740 497 729 483 431 612 673 916 1,104 8,280
Continued on following page

144
Continued from previous page
LNG Shipments Received In Tongyong, South Korea by Source (1000's of Metric Tons)
Australia 0 61 64 0 55 0 0 0 0 55 61 0 296Brunei 0 0 0 0 0 0 0 60 0 0 60 0 120Egypt 0 64 0 0 0 0 0 0 0 0 0 0 64Equatorial Guinea 0 0 64 64 0 0 0 0 0 67 0 0 195Indonesia 55 55 61 61 0 56 55 110 0 122 0 0 575Malaysia 170 243 113 112 113 227 56 0 0 297 173 121 1,625Nigeria 0 64 0 0 0 0 0 0 0 0 0 64 128Oman 186 0 187 61 67 0 0 61 122 61 61 189 995Qatar 182 239 61 122 61 0 61 61 61 61 0 0 909Russia 0 0 0 64 0 0 0 0 65 0 64 322 515Trinidad 65 0 0 0 0 0 0 0 0 0 0 0 65Yemen 0 0 0 0 0 0 0 0 0 0 0 64 642009 Total 658 726 550 484 296 283 172 292 248 663 419 760 5,551

145
LNG Shipments Received In Tongyong, South Korea by Source (Bcf)
Jan Feb Mar Apr May Jun Jul Aug Sep Oct Nov Dec Total
Australia 3.13 2.93 2.93 2.93 5.59 0 0 0 2.66 0 0 0 20.18Brunei 0 0 3.12 0 3.12 3.11 0 0 0 0 0 0 9.34Equatorial Guinea 0 3.23 0 0 0 0 0 0 0 0 0 0 3.23Indonesia 0 0 5.87 0 6.20 2.91 2.93 2.65 0 0 0 0 20.57Malaysia 8.00 0 2.76 2.76 2.76 8.27 5.87 13.57 0 0 0 0 43.99Nigeria 0 3.07 0 0 0 0 0 6.15 0 0 0 0 9.22Oman 2.93 15.11 2.93 8.77 2.92 5.84 2.93 0 0 0 0 0 41.43Qatar 5.86 0 5.83 8.79 5.79 2.86 2.93 2.93 0 0 0 0 35.00Russia 6.24 9.33 12.50 0 3.08 2.93 3.09 0 0 0 0 0 37.17Trinidad 0 2.93 0 0 2.86 2.54 0 0 2.93 0 0 0 11.25USA 0 3.07 0 0 0 0 0 0 0 0 0 0 3.07Yemen 6.29 3.09 6.16 6.52 2.96 2.99 3.22 6.29 0 0 0 0 37.522011 Total 32.45 42.77 42.10 29.78 35.29 31.44 20.96 31.60 5.59 0 0 0 271.97 Abu Dhabi 0 0 0 0 0 0 0 0 0 0 0 2.65 2.65Australia 2.98 2.98 0 3.13 0 0 3.13 0 2.93 0 5.82 3.13 24.10Brunei 0 0 2.90 0 0 5.81 2.90 0 0 2.90 0 0 14.51Egypt 3.44 3.18 0 0 0 0 0 0 3.11 0 0 0 9.73Equatorial Guinea 0 3.51 0 3.23 0 0 0 3.40 0 0 0 3.29 13.42Indonesia 0 0 5.59 5.34 2.89 0 5.59 2.82 0 0 0 0 22.23Malaysia 5.35 6.00 13.67 2.76 0 2.76 2.70 2.71 5.41 8.33 5.39 11.08 66.16Nigeria 0 0 0 0 0 0 0 0 0 0 0 3.07 3.07Norway 0 0 0 0 0 0 0 0 0 0 0 2.97 2.97Oman 8.76 0 2.93 8.94 0 8.76 2.93 2.89 2.91 5.97 5.99 2.86 52.95Qatar 2.93 5.86 2.91 2.93 11.69 11.70 2.93 2.84 8.77 2.93 2.89 8.78 67.18Russia 6.18 15.32 6.21 9.27 9.33 6.08 3.09 3.07 6.18 9.29 15.35 12.32 101.68Trinidad 0 0 0 0 0 0 0 0 0 0 2.53 0 2.53Yemen 0 0 0 0 0 0 0 2.99 0 2.96 6.04 2.93 14.912010 Total 29.63 36.86 34.21 35.59 23.91 35.11 23.27 20.72 29.32 32.38 44.02 53.07 398.10
Continued on following page

146
Continued from previous page
LNG Shipments Received In Tongyong, South Korea by Source (Bcf)
Australia 0 2.93 3.09 0 2.66 0 0 0 0 2.66 2.93 0 14.26Brunei 0 0 0 0 0 0 0 2.90 0 0 2.90 0 5.81Egypt 0 3.09 0 0 0 0 0 0 0 0 0 0 3.09Equatorial Guinea 0 0 3.09 3.07 0 0 0 0 0 3.23 0 0 9.39Indonesia 2.65 2.65 2.93 2.93 0 2.69 2.65 5.31 0 5.87 0 0 27.69Malaysia 8.16 11.66 5.45 5.39 5.41 10.91 2.70 0 0 14.26 8.33 5.83 78.11Nigeria 0 3.07 0 0 0 0 0 0 0 0 0 3.09 6.16Oman 8.93 0 8.97 2.93 3.22 0 0 2.93 5.85 2.93 2.93 9.09 47.78Qatar 8.74 11.49 2.93 5.84 2.93 0 2.93 2.93 2.93 2.93 0 0 43.66Russia 0 0 0 3.09 0 0 0 0 3.12 0 3.09 15.46 24.76Trinidad 3.12 0 0 0 0 0 0 0 0 0 0 0 3.12Yemen 0 0 0 0 0 0 0 0 0 0 0 3.07 3.072009 Total 31.61 34.89 26.46 23.26 14.23 13.60 8.28 14.08 11.90 31.88 20.18 36.54 266.91

147

148
Waterborne Energy, Inc.
2323 S. Shepherd Dr. Suite 1010 Houston, Texas
77019 713/526-1555 www.waterbornelng.com
26 Aug 2011
Vol. 8, Week 33
Taiwan

149
LNG Shipments Received In Kaohsiung, Taiwan by Source (1000's of Metric Tons)
Jan Feb Mar Apr May Jun Jul Aug Sep Oct Nov Dec Total
Abu Dhabi 0 0 0 60 0 0 0 0 0 0 0 0 60Australia 61 63 0 152 63 0 0 0 0 0 0 0 339Egypt 66 0 62 61 0 61 129 0 75 0 0 0 454Equatorial Guinea 0 0 68 61 63 0 64 131 0 0 0 0 387Indonesia 123 123 113 184 184 246 179 184 0 0 0 0 1,336Malaysia 303 115 293 238 227 302 233 239 0 0 0 0 1,950Nigeria 60 57 0 0 0 60 132 127 0 0 0 0 436Oman 64 0 64 0 0 0 0 0 0 0 0 0 128Peru 0 0 0 0 0 60 0 0 0 0 0 0 60Qatar 0 0 0 0 64 64 128 254 0 0 0 0 510Russia 62 0 0 0 123 0 0 0 0 0 0 0 185Trinidad 0 54 0 0 0 0 0 0 0 0 0 0 54Yemen 0 0 0 0 0 0 67 0 0 0 0 0 672011 Total 739 412 600 756 724 793 932 935 75 0 0 0 5,966 Abu Dhabi 0 0 0 67 0 0 125 0 0 60 68 0 320Australia 0 0 0 131 127 128 128 128 64 64 0 0 770Egypt 0 0 0 0 0 0 0 0 0 68 0 0 68Equatorial Guinea 0 0 0 0 0 64 0 0 68 0 127 0 259Indonesia 243 119 179 179 181 62 123 119 179 179 119 239 1,921Malaysia 178 115 297 115 240 354 409 235 236 301 243 240 2,963Nigeria 67 0 185 0 60 58 0 117 191 0 0 131 809Norway 0 0 0 0 0 0 0 55 0 0 0 0 55Oman 65 127 0 128 0 0 0 0 64 0 0 0 384Qatar 65 0 0 0 0 0 66 66 66 66 65 0 394Russia 0 0 0 0 194 63 124 65 0 0 0 0 446Trinidad 69 0 60 68 0 0 0 51 0 0 0 0 2482010 Total 687 361 721 688 802 729 975 836 868 738 622 610 8,637
Continued on following page

150
Continued from previous page
LNG Shipments Received In Kaohsiung, Taiwan by Source (1000's of Metric Tons)
Australia 0 0 0 61 0 66 61 66 66 0 64 0 384Equatorial Guinea 0 0 0 131 66 67 61 0 0 0 60 0 385Indonesia 240 117 290 120 240 299 229 299 359 248 243 123 2,807Malaysia 118 175 167 188 354 243 393 300 354 301 60 175 2,828Nigeria 0 63 61 66 62 64 58 62 126 61 60 184 867Oman 0 0 0 0 0 0 0 0 0 64 60 62 186Qatar 64 63 62 0 0 0 0 0 0 0 0 0 189Russia 0 0 0 0 0 0 0 0 0 60 59 0 119Trinidad 0 0 66 0 0 0 0 0 0 0 0 0 662009 Total 422 418 646 566 722 739 802 727 905 734 606 544 7,831

151
LNG Shipments Received In Kaohsiung, Taiwan by Source (Bcf)
Jan Feb Mar Apr May Jun Jul Aug Sep Oct Nov Dec Total
Abu Dhabi 0 0 0 2.87 0 0 0 0 0 0 0 0 2.87Australia 2.93 3.03 0 7.29 3.02 0 0 0 0 0 0 0 16.27Egypt 3.17 0 3.00 2.93 0 2.94 6.18 0 3.60 0 0 0 21.83Equatorial Guinea 0 0 3.25 2.94 3.03 0 3.07 6.30 0 0 0 0 18.60Indonesia 5.92 5.92 5.43 8.86 8.86 11.84 8.60 8.82 0 0 0 0 64.25Malaysia 14.57 5.52 14.07 11.46 10.92 14.53 11.22 11.51 0 0 0 0 93.79Nigeria 2.90 2.72 0 0 0 2.89 6.36 6.13 0 0 0 0 21.01Oman 3.07 0 3.09 0 0 0 0 0 0 0 0 0 6.17Peru 0 0 0 0 0 2.88 0 0 0 0 0 0 2.88Qatar 0 0 0 0 3.05 3.05 6.16 12.21 0 0 0 0 24.48Russia 2.99 0 0 0 5.90 0 0 0 0 0 0 0 8.89Trinidad 0 2.59 0 0 0 0 0 0 0 0 0 0 2.59Yemen 0 0 0 0 0 0 3.22 0 0 0 0 0 3.222011 Total 35.56 19.78 28.84 36.36 34.78 38.14 44.83 44.97 3.60 0 0 0 286.86 Abu Dhabi 0 0 0 3.23 0 0 5.99 0 0 2.87 3.29 0 15.38Australia 0 0 0 6.28 6.12 6.13 6.13 6.17 3.07 3.07 0 0 36.98Egypt 0 0 0 0 0 0 0 0 0 3.29 0 0 3.29Equatorial Guinea 0 0 0 0 0 3.07 0 0 3.29 0 6.11 0 12.47Indonesia 11.68 5.71 8.60 8.60 8.72 2.96 5.92 5.73 8.60 8.60 5.73 11.47 92.33Malaysia 8.55 5.51 14.28 5.52 11.53 17.04 19.67 11.28 11.37 14.47 11.69 11.53 142.43Nigeria 3.22 0 8.91 0 2.88 2.76 0 5.61 9.18 0 0 6.29 38.85Norway 0 0 0 0 0 0 0 2.62 0 0 0 0 2.62Oman 3.12 6.13 0 6.15 0 0 0 0 3.07 0 0 0 18.47Qatar 3.12 0 0 0 0 0 3.18 3.16 3.18 3.18 3.11 0 18.93Russia 0 0 0 0 9.30 3.02 5.94 3.12 0 0 0 0 21.38Trinidad 3.33 0 2.86 3.29 0 0 0 2.46 0 0 0 0 11.942010 Total 33.01 17.35 34.66 33.06 38.54 34.99 46.84 40.16 41.76 35.48 29.92 29.29 415.05
Continued on following page

152
Continued from previous page
LNG Shipments Received In Kaohsiung, Taiwan by Source (Bcf)
Australia 0 0 0 2.93 0 3.17 2.94 3.17 3.17 0 3.06 0 18.44Equatorial Guinea 0 0 0 6.32 3.17 3.23 2.94 0 0 0 2.89 0 18.55Indonesia 11.52 5.64 13.92 5.78 11.52 14.38 11.00 14.38 17.28 11.90 11.69 5.92 134.94Malaysia 5.67 8.43 8.01 9.03 17.01 11.69 18.91 14.42 17.00 14.45 2.89 8.43 135.94Nigeria 0 3.01 2.95 3.18 3.00 3.07 2.79 2.98 6.04 2.95 2.88 8.83 41.68Oman 0 0 0 0 0 0 0 0 0 3.07 2.87 3.00 8.95Qatar 3.07 3.01 2.97 0 0 0 0 0 0 0 0 0 9.06Russia 0 0 0 0 0 0 0 0 0 2.89 2.83 0 5.72Trinidad 0 0 3.17 0 0 0 0 0 0 0 0 0 3.172009 Total 20.26 20.10 31.03 27.23 34.70 35.55 38.58 34.95 43.49 35.26 29.11 26.18 376.45
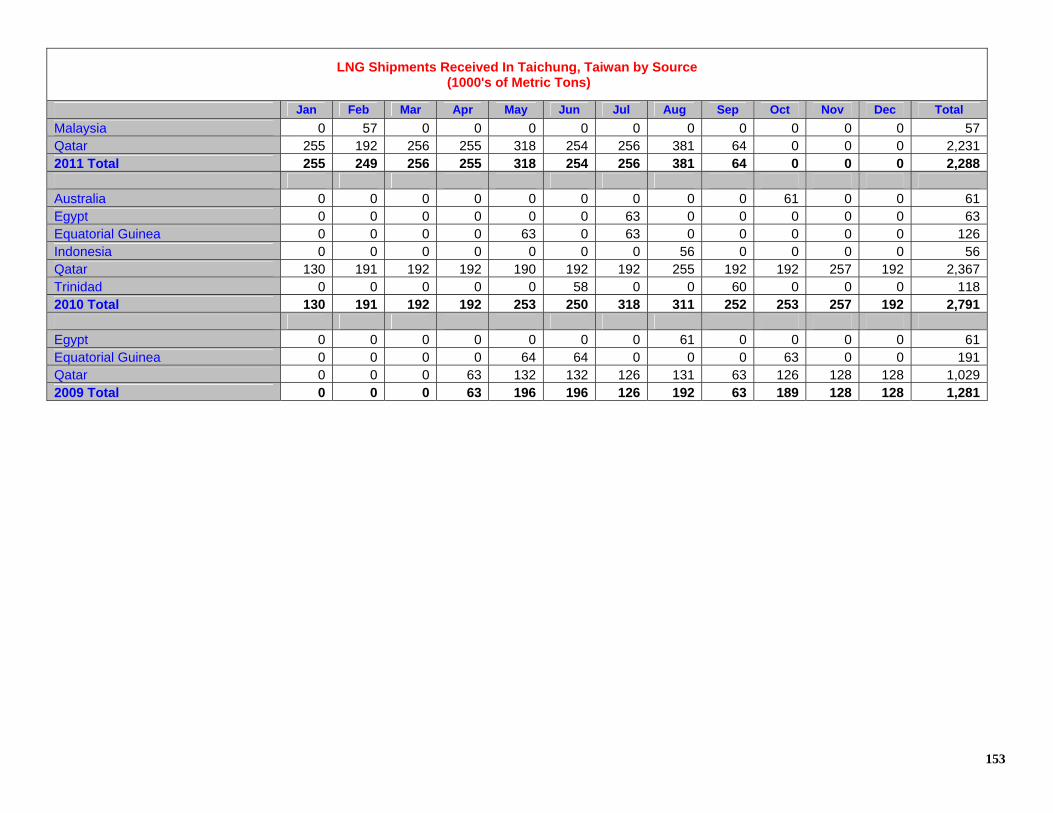
153
LNG Shipments Received In Taichung, Taiwan by Source (1000's of Metric Tons)
Jan Feb Mar Apr May Jun Jul Aug Sep Oct Nov Dec Total
Malaysia 0 57 0 0 0 0 0 0 0 0 0 0 57Qatar 255 192 256 255 318 254 256 381 64 0 0 0 2,2312011 Total 255 249 256 255 318 254 256 381 64 0 0 0 2,288 Australia 0 0 0 0 0 0 0 0 0 61 0 0 61Egypt 0 0 0 0 0 0 63 0 0 0 0 0 63Equatorial Guinea 0 0 0 0 63 0 63 0 0 0 0 0 126Indonesia 0 0 0 0 0 0 0 56 0 0 0 0 56Qatar 130 191 192 192 190 192 192 255 192 192 257 192 2,367Trinidad 0 0 0 0 0 58 0 0 60 0 0 0 1182010 Total 130 191 192 192 253 250 318 311 252 253 257 192 2,791 Egypt 0 0 0 0 0 0 0 61 0 0 0 0 61Equatorial Guinea 0 0 0 0 64 64 0 0 0 63 0 0 191Qatar 0 0 0 63 132 132 126 131 63 126 128 128 1,0292009 Total 0 0 0 63 196 196 126 192 63 189 128 128 1,281

154
LNG Shipments Received In Taichung, Taiwan by Source (Bcf)
Jan Feb Mar Apr May Jun Jul Aug Sep Oct Nov Dec Total
Malaysia 0 2.75 0 0 0 0 0 0 0 0 0 0 2.75Qatar 12.27 9.22 12.30 12.28 15.29 12.21 12.30 18.30 3.07 0 0 0 107.242011 Total 12.27 11.97 12.30 12.28 15.29 12.21 12.30 18.30 3.07 0 0 0 109.99 Australia 0 0 0 0 0 0 0 0 0 2.93 0 0 2.93Egypt 0 0 0 0 0 0 3.01 0 0 0 0 0 3.01Equatorial Guinea 0 0 0 0 3.04 0 3.02 0 0 0 0 0 6.06Indonesia 0 0 0 0 0 0 0 2.70 0 0 0 0 2.70Qatar 6.24 9.19 9.22 9.22 9.11 9.22 9.22 12.25 9.22 9.22 12.35 9.22 113.69Trinidad 0 0 0 0 0 2.81 0 0 2.86 0 0 0 5.672010 Total 6.24 9.19 9.22 9.22 12.15 12.03 15.25 14.95 12.08 12.15 12.35 9.22 134.05 Egypt 0 0 0 0 0 0 0 2.93 0 0 0 0 2.93Equatorial Guinea 0 0 0 0 3.07 3.07 0 0 0 3.03 0 0 9.18Qatar 0 0 0 3.04 6.34 6.34 6.05 6.31 3.04 6.08 6.15 6.15 49.522009 Total 0 0 0 3.04 9.41 9.41 6.05 9.24 3.04 9.11 6.15 6.15 61.63

155
LNG Shipments Received In Taiwan By Source (1000's of Metric Tons)
Jan Feb Mar Apr May Jun Jul Aug Sep Oct Nov Dec Total
Abu Dhabi 0 0 0 60 0 0 0 0 0 0 0 0 60Australia 61 63 0 152 63 0 0 0 0 0 0 0 339Egypt 66 0 62 61 0 61 129 0 75 0 0 0 454Equatorial Guinea 0 0 68 61 63 0 64 131 0 0 0 0 387Indonesia 123 123 113 184 184 246 179 184 0 0 0 0 1,336Malaysia 303 172 293 238 227 302 233 239 0 0 0 0 2,007Nigeria 60 57 0 0 0 60 132 127 0 0 0 0 436Oman 64 0 64 0 0 0 0 0 0 0 0 0 128Peru 0 0 0 0 0 60 0 0 0 0 0 0 60Qatar 255 192 256 255 382 318 384 635 64 0 0 0 2,741Russia 62 0 0 0 123 0 0 0 0 0 0 0 185Trinidad 0 54 0 0 0 0 0 0 0 0 0 0 54Yemen 0 0 0 0 0 0 67 0 0 0 0 0 672011 Total 994 661 856 1,011 1,042 1,047 1,188 1,316 139 0 0 0 8,254 Abu Dhabi 0 0 0 67 0 0 125 0 0 60 68 0 320Australia 0 0 0 131 127 128 128 128 64 125 0 0 831Egypt 0 0 0 0 0 0 63 0 0 68 0 0 131Equatorial Guinea 0 0 0 0 63 64 63 0 68 0 127 0 385Indonesia 243 119 179 179 181 62 123 175 179 179 119 239 1,977Malaysia 178 115 297 115 240 354 409 235 236 301 243 240 2,963Nigeria 67 0 185 0 60 58 0 117 191 0 0 131 809Norway 0 0 0 0 0 0 0 55 0 0 0 0 55Oman 65 127 0 128 0 0 0 0 64 0 0 0 384Qatar 195 191 192 192 190 192 258 321 258 258 321 192 2,760Russia 0 0 0 0 194 63 124 65 0 0 0 0 446Trinidad 69 0 60 68 0 58 0 51 60 0 0 0 3662010 Total 817 552 913 880 1,055 979 1,293 1,147 1,120 991 878 802 11,427
Continued on following page
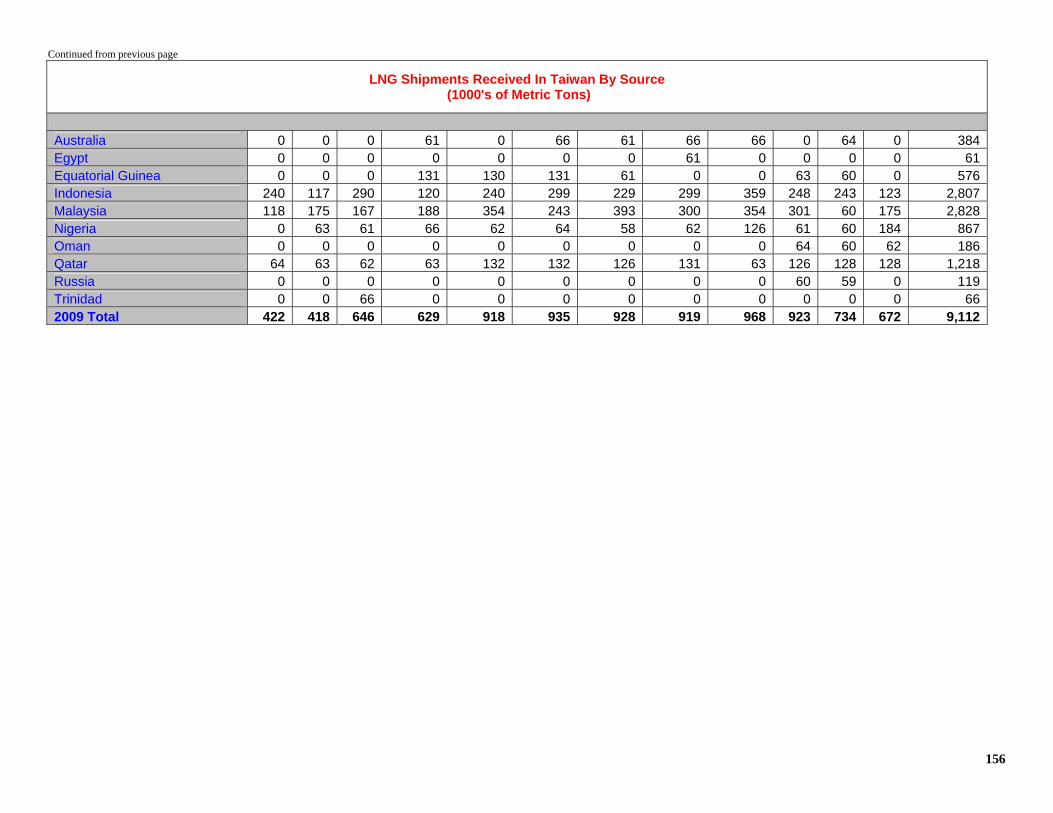
156
Continued from previous page
LNG Shipments Received In Taiwan By Source (1000's of Metric Tons)
Australia 0 0 0 61 0 66 61 66 66 0 64 0 384Egypt 0 0 0 0 0 0 0 61 0 0 0 0 61Equatorial Guinea 0 0 0 131 130 131 61 0 0 63 60 0 576Indonesia 240 117 290 120 240 299 229 299 359 248 243 123 2,807Malaysia 118 175 167 188 354 243 393 300 354 301 60 175 2,828Nigeria 0 63 61 66 62 64 58 62 126 61 60 184 867Oman 0 0 0 0 0 0 0 0 0 64 60 62 186Qatar 64 63 62 63 132 132 126 131 63 126 128 128 1,218Russia 0 0 0 0 0 0 0 0 0 60 59 0 119Trinidad 0 0 66 0 0 0 0 0 0 0 0 0 662009 Total 422 418 646 629 918 935 928 919 968 923 734 672 9,112

157
LNG Shipments Received In Taiwan By Source (Bcf)
Jan Feb Mar Apr May Jun Jul Aug Sep Oct Nov Dec Total
Abu Dhabi 0 0 0 2.87 0 0 0 0 0 0 0 0 2.87Australia 2.93 3.03 0 7.29 3.02 0 0 0 0 0 0 0 16.27Egypt 3.17 0 3.00 2.93 0 2.94 6.18 0 3.60 0 0 0 21.83Equatorial Guinea 0 0 3.25 2.94 3.03 0 3.07 6.30 0 0 0 0 18.60Indonesia 5.92 5.92 5.43 8.86 8.86 11.84 8.60 8.82 0 0 0 0 64.25Malaysia 14.57 8.27 14.07 11.46 10.92 14.53 11.22 11.51 0 0 0 0 96.54Nigeria 2.90 2.72 0 0 0 2.89 6.36 6.13 0 0 0 0 21.01Oman 3.07 0 3.09 0 0 0 0 0 0 0 0 0 6.17Peru 0 0 0 0 0 2.88 0 0 0 0 0 0 2.88Qatar 12.27 9.22 12.30 12.28 18.35 15.26 18.46 30.51 3.07 0 0 0 131.72Russia 2.99 0 0 0 5.90 0 0 0 0 0 0 0 8.89Trinidad 0 2.59 0 0 0 0 0 0 0 0 0 0 2.59Yemen 0 0 0 0 0 0 3.22 0 0 0 0 0 3.222011 Total 47.82 31.75 41.14 48.64 50.07 50.35 57.12 63.27 6.68 0 0 0 396.85 Abu Dhabi 0 0 0 3.23 0 0 5.99 0 0 2.87 3.29 0 15.38Australia 0 0 0 6.28 6.12 6.13 6.13 6.17 3.07 6.00 0 0 39.90Egypt 0 0 0 0 0 0 3.01 0 0 3.29 0 0 6.30Equatorial Guinea 0 0 0 0 3.04 3.07 3.02 0 3.29 0 6.11 0 18.52Indonesia 11.68 5.71 8.60 8.60 8.72 2.96 5.92 8.43 8.60 8.60 5.73 11.47 95.03Malaysia 8.55 5.51 14.28 5.52 11.53 17.04 19.67 11.28 11.37 14.47 11.69 11.53 142.43Nigeria 3.22 0 8.91 0 2.88 2.76 0 5.61 9.18 0 0 6.29 38.85Norway 0 0 0 0 0 0 0 2.62 0 0 0 0 2.62Oman 3.12 6.13 0 6.15 0 0 0 0 3.07 0 0 0 18.47Qatar 9.35 9.19 9.22 9.22 9.11 9.22 12.40 15.41 12.40 12.40 15.45 9.22 132.61Russia 0 0 0 0 9.30 3.02 5.94 3.12 0 0 0 0 21.38Trinidad 3.33 0 2.86 3.29 0 2.81 0 2.46 2.86 0 0 0 17.612010 Total 39.25 26.54 43.88 42.28 50.69 47.02 62.09 55.11 53.85 47.63 42.27 38.51 549.11
Continued on following page

158
Continued from previous page
LNG Shipments Received In Taiwan By Source (Bcf)
Australia 0 0 0 2.93 0 3.17 2.94 3.17 3.17 0 3.06 0 18.44Egypt 0 0 0 0 0 0 0 2.93 0 0 0 0 2.93Equatorial Guinea 0 0 0 6.32 6.25 6.30 2.94 0 0 3.03 2.89 0 27.73Indonesia 11.52 5.64 13.92 5.78 11.52 14.38 11.00 14.38 17.28 11.90 11.69 5.92 134.94Malaysia 5.67 8.43 8.01 9.03 17.01 11.69 18.91 14.42 17.00 14.45 2.89 8.43 135.94Nigeria 0 3.01 2.95 3.18 3.00 3.07 2.79 2.98 6.04 2.95 2.88 8.83 41.68Oman 0 0 0 0 0 0 0 0 0 3.07 2.87 3.00 8.95Qatar 3.07 3.01 2.97 3.04 6.34 6.34 6.05 6.31 3.04 6.08 6.15 6.15 58.57Russia 0 0 0 0 0 0 0 0 0 2.89 2.83 0 5.72Trinidad 0 0 3.17 0 0 0 0 0 0 0 0 0 3.172009 Total 20.26 20.10 31.03 30.28 44.12 44.97 44.63 44.19 46.53 44.37 35.26 32.34 438.07

159
Waterborne Energy, Inc.
2323 S. Shepherd Dr. Suite 1010 Houston, Texas
77019 713/526-1555 www.waterbornelng.com
26 Aug 2011
Vol. 8, Week 33
Thailand

160
LNG Shipments Received In Thailand By Source (1000's of Metric Tons)
Jan Feb Mar Apr May Jun Jul Aug Sep Oct Nov Dec Total
Indonesia 0 0 0 0 0 0 68 0 0 0 0 0 68Nigeria 0 0 0 0 0 0 0 66 0 0 0 0 66Peru 0 0 0 0 0 0 76 0 0 0 0 0 76Qatar 0 0 0 0 59 66 0 159 0 0 0 0 284Russia 0 0 0 0 0 62 0 0 0 0 0 0 622011 Total 0 0 0 0 59 128 144 225 0 0 0 0 556 2010 Total 0 0 0 0 0 0 0 0 0 0 0 0 0
LNG Shipments Received In Thailand By Source (Bcf)
Jan Feb Mar Apr May Jun Jul Aug Sep Oct Nov Dec Total
Indonesia 0 0 0 0 0 0 3.29 0 0 0 0 0 3.29Nigeria 0 0 0 0 0 0 0 3.17 0 0 0 0 3.17Peru 0 0 0 0 0 0 3.67 0 0 0 0 0 3.67Qatar 0 0 0 0 2.83 3.16 0 7.65 0 0 0 0 13.64Russia 0 0 0 0 0 3.00 0 0 0 0 0 0 3.002011 Total 0 0 0 0 2.83 6.16 6.96 10.82 0 0 0 0 26.77 2010 Total 0 0 0 0 0 0 0 0 0 0 0 0 0

161
Waterborne Energy, Inc.
2323 S. Shepherd Dr. Suite 1010 Houston, Texas
77019 713/526-1555 www.waterbornelng.com
26 Aug 2011
Vol. 8, Week 33
Kuwait

162
LNG Shipments Received In Kuwait By Source (1000's of Metric Tons)
Jan Feb Mar Apr May Jun Jul Aug Sep Oct Nov Dec Total
Abu Dhabi 0 0 0 38 0 0 0 0 0 0 0 0 38Australia 0 0 0 65 0 124 0 0 0 0 0 0 189Egypt 0 0 0 0 0 0 50 0 0 0 0 0 50Malaysia 0 0 0 64 128 64 64 0 0 0 0 0 320Nigeria 0 0 60 123 123 111 0 50 60 0 0 0 527Qatar 0 0 78 78 67 127 191 254 0 0 0 0 795Trinidad 0 0 0 0 0 0 0 0 61 0 0 0 612011 Total 0 0 138 368 318 426 305 304 121 0 0 0 1,980 Abu Dhabi 0 0 0 0 0 61 0 61 60 0 0 0 182Australia 0 0 0 0 64 0 0 0 0 0 0 0 64Belgium Re-export 0 0 0 0 62 0 0 0 0 0 0 0 62Egypt 0 0 0 0 0 0 139 0 0 66 0 0 205Equatorial Guinea 0 0 0 0 0 64 62 62 0 0 0 0 188Malaysia 0 0 0 64 0 0 0 0 62 0 0 0 126Nigeria 0 0 0 0 0 0 0 0 0 62 0 0 62Oman 0 0 0 0 64 178 127 194 128 0 0 0 691Russia 0 0 0 0 65 0 0 0 0 0 0 0 65Trinidad 0 0 60 60 0 0 0 60 0 111 0 0 291Yemen 0 0 0 0 68 0 0 0 68 0 0 0 1362010 Total 0 0 60 124 323 303 328 377 318 239 0 0 2,072 Australia 0 0 0 0 0 0 0 57 0 0 0 0 57Belgium Re-export 0 0 0 0 0 0 0 0 0 60 0 0 60Malaysia 0 0 0 0 0 0 0 0 0 67 0 0 67Oman 0 0 0 0 0 0 0 0 60 0 0 0 60Russia 0 0 0 0 0 0 0 65 245 0 0 0 310Trinidad 0 0 0 0 0 0 0 0 0 110 0 0 1102009 Total 0 0 0 0 0 0 0 122 305 237 0 0 664
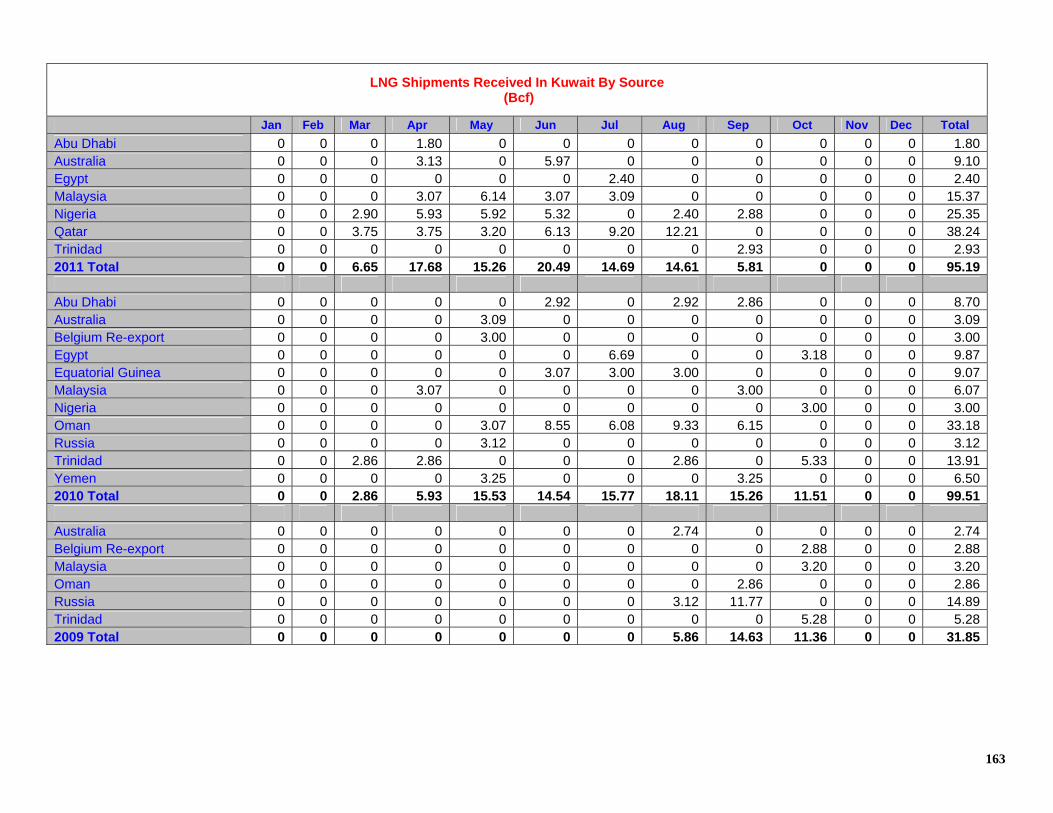
163
LNG Shipments Received In Kuwait By Source (Bcf)
Jan Feb Mar Apr May Jun Jul Aug Sep Oct Nov Dec Total
Abu Dhabi 0 0 0 1.80 0 0 0 0 0 0 0 0 1.80Australia 0 0 0 3.13 0 5.97 0 0 0 0 0 0 9.10Egypt 0 0 0 0 0 0 2.40 0 0 0 0 0 2.40Malaysia 0 0 0 3.07 6.14 3.07 3.09 0 0 0 0 0 15.37Nigeria 0 0 2.90 5.93 5.92 5.32 0 2.40 2.88 0 0 0 25.35Qatar 0 0 3.75 3.75 3.20 6.13 9.20 12.21 0 0 0 0 38.24Trinidad 0 0 0 0 0 0 0 0 2.93 0 0 0 2.932011 Total 0 0 6.65 17.68 15.26 20.49 14.69 14.61 5.81 0 0 0 95.19 Abu Dhabi 0 0 0 0 0 2.92 0 2.92 2.86 0 0 0 8.70Australia 0 0 0 0 3.09 0 0 0 0 0 0 0 3.09Belgium Re-export 0 0 0 0 3.00 0 0 0 0 0 0 0 3.00Egypt 0 0 0 0 0 0 6.69 0 0 3.18 0 0 9.87Equatorial Guinea 0 0 0 0 0 3.07 3.00 3.00 0 0 0 0 9.07Malaysia 0 0 0 3.07 0 0 0 0 3.00 0 0 0 6.07Nigeria 0 0 0 0 0 0 0 0 0 3.00 0 0 3.00Oman 0 0 0 0 3.07 8.55 6.08 9.33 6.15 0 0 0 33.18Russia 0 0 0 0 3.12 0 0 0 0 0 0 0 3.12Trinidad 0 0 2.86 2.86 0 0 0 2.86 0 5.33 0 0 13.91Yemen 0 0 0 0 3.25 0 0 0 3.25 0 0 0 6.502010 Total 0 0 2.86 5.93 15.53 14.54 15.77 18.11 15.26 11.51 0 0 99.51 Australia 0 0 0 0 0 0 0 2.74 0 0 0 0 2.74Belgium Re-export 0 0 0 0 0 0 0 0 0 2.88 0 0 2.88Malaysia 0 0 0 0 0 0 0 0 0 3.20 0 0 3.20Oman 0 0 0 0 0 0 0 0 2.86 0 0 0 2.86Russia 0 0 0 0 0 0 0 3.12 11.77 0 0 0 14.89Trinidad 0 0 0 0 0 0 0 0 0 5.28 0 0 5.282009 Total 0 0 0 0 0 0 0 5.86 14.63 11.36 0 0 31.85

164
Waterborne Energy, Inc.
2323 S. Shepherd Dr. Suite 1010 Houston, Texas
77019 713/526-1555 www.waterbornelng.com
26 Aug 2011
Vol. 8, Week 33
Dubai
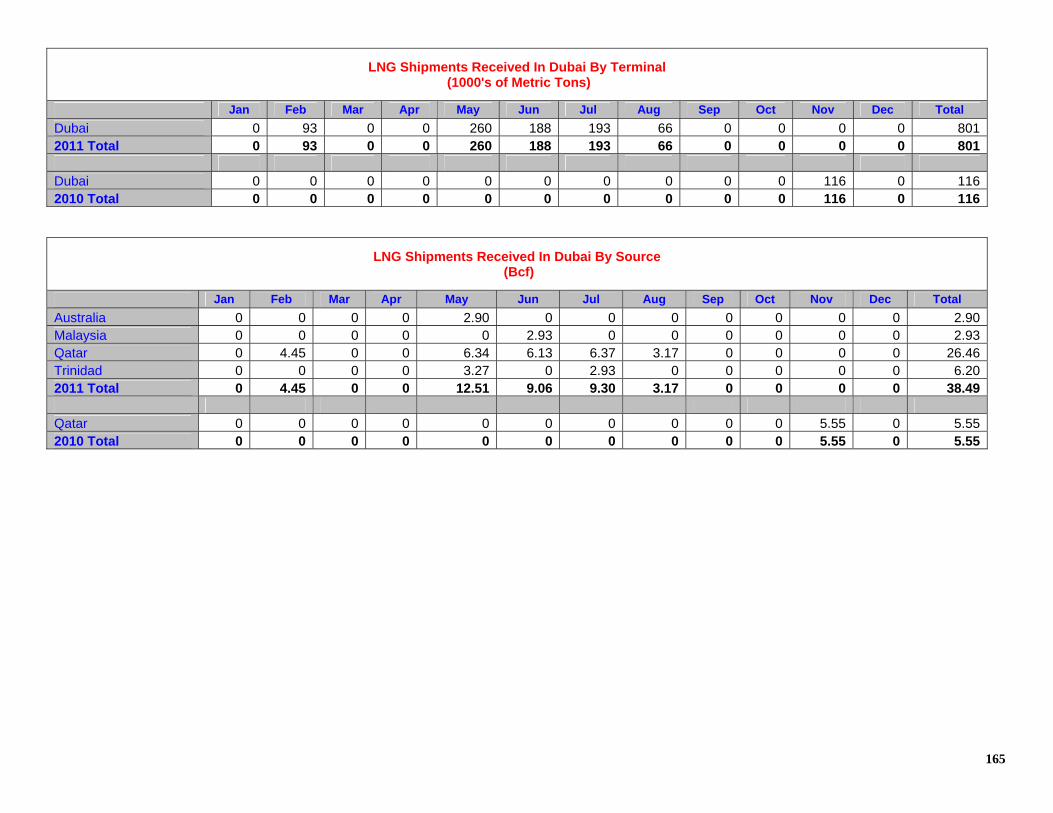
165
LNG Shipments Received In Dubai By Terminal (1000's of Metric Tons)
Jan Feb Mar Apr May Jun Jul Aug Sep Oct Nov Dec Total
Dubai 0 93 0 0 260 188 193 66 0 0 0 0 8012011 Total 0 93 0 0 260 188 193 66 0 0 0 0 801 Dubai 0 0 0 0 0 0 0 0 0 0 116 0 1162010 Total 0 0 0 0 0 0 0 0 0 0 116 0 116
LNG Shipments Received In Dubai By Source (Bcf)
Jan Feb Mar Apr May Jun Jul Aug Sep Oct Nov Dec Total
Australia 0 0 0 0 2.90 0 0 0 0 0 0 0 2.90Malaysia 0 0 0 0 0 2.93 0 0 0 0 0 0 2.93Qatar 0 4.45 0 0 6.34 6.13 6.37 3.17 0 0 0 0 26.46Trinidad 0 0 0 0 3.27 0 2.93 0 0 0 0 0 6.202011 Total 0 4.45 0 0 12.51 9.06 9.30 3.17 0 0 0 0 38.49 Qatar 0 0 0 0 0 0 0 0 0 0 5.55 0 5.552010 Total 0 0 0 0 0 0 0 0 0 0 5.55 0 5.55

166
Waterborne Energy, Inc.
2323 S. Shepherd Dr. Suite 1010 Houston, Texas
77019 713/526-1555 www.waterbornelng.com
26 Aug 2011
Vol. 8, Week 33
Detailed Asian LNG Shipping Data

167
Waterborne Energy, Inc.
2323 S. Shepherd Dr. Suite 1010 Houston, Texas
77019 713/526-1555 www.waterbornelng.com
26 Aug 2011
Vol. 8, Week 33
China

168
Asian LNG IMPORTS Some of the data below is unconfirmed and forward schedules are considered incomplete data. Date Vessel Name CBM Volume (mt) Volume (Bcf) Source Participants Fujian, China 11-May-11 Min Rong 147,000 60,618 2.91 Indonesia CNOOC 21-May-11 Min Lu 147,100 60,451 2.91 Indonesia CNOOC 26-May-11 Methane Heather Sally 145,000 51,573 2.48 Trinidad BG/CNOOC 29-May-11 Min Rong 147,000 60,451 2.91 Indonesia CNOOC Totals For May 2011 233,093 11.21
06-Jun-11 Min Lu 147,100 60,451 2.91 Indonesia CNOOC 13-Jun-11 Min Rong 147,000 60,451 2.91 Indonesia CNOOC 17-Jun-11 Neva River 145,000 63,945 3.07 Russia CNOOC 25-Jun-11 Min Lu 147,100 64,871 3.12 Indonesia CNOOC 30-Jun-11 Min Rong 147,000 64,827 3.12 Indonesia CNOOC Totals For June 2011 314,545 15.12
08-Jul-11 LNG Enugu 144,000 63,504 3.05 Nigeria Nigeria LNG/CNOOC 10-Jul-11 Min Lu 147,100 64,871 3.12 Indonesia CNOOC 19-Jul-11 Min Rong 147,000 64,827 3.12 Indonesia CNOOC 23-Jul-11 Methane Jane 145,000 63,945 3.07 Nigeria BG/CNOOC 26-Jul-11 Methane Mickie Harper 170,000 59,535 2.86 Trinidad BG/CNOOC Totals For July 2011 316,682 15.22
02-Aug-11 Min Lu 147,100 64,871 3.12 Indonesia CNOOC 10-Aug-11 Min Rong 147,000 64,827 3.12 Indonesia CNOOC 19-Aug-11 Min Lu 147,100 64,871 3.12 Indonesia CNOOC 25-Aug-11 Maersk Marib 165,000 72,765 3.50 Nigeria CNOOC Totals For August 2011 267,334 12.85

169
Asian LNG IMPORTS Some of the data below is unconfirmed and forward schedules are considered incomplete data. Date Vessel Name CBM Volume (mt) Volume (Bcf) Source Participants Guangdong, China 01-May-11 Dapeng Sun 147,000 64,905 3.12 Australia CNOOC 04-May-11 Dapeng Star 147,100 64,949 3.12 Australia CNOOC 07-May-11 Maersk Marib 165,000 70,004 3.37 Yemen Yemen LNG/CNOOC 11-May-11 Seri Bakti 145,000 53,680 2.58 Trinidad BG/CNOOC 13-May-11 Dapeng Moon 147,000 64,905 3.12 Australia CNOOC 19-May-11 Dapeng Sun 147,000 64,905 3.12 Australia CNOOC 24-May-11 Dapeng Star 147,100 64,949 3.12 Australia CNOOC 25-May-11 Seri Alam 145,000 60,798 2.92 Malaysia Malaysia LNG/CNOOC 27-May-11 Muscat LNG 145,494 59,502 2.86 Nigeria CNOOC Totals For May 2011 568,597 27.33
01-Jun-11 Dapeng Moon 147,000 64,673 3.11 Australia CNOOC 05-Jun-11 Dapeng Sun 147,000 64,673 3.11 Australia CNOOC 09-Jun-11 Dapeng Star 147,100 64,673 3.11 Australia CNOOC 12-Jun-11 Al Gattara 215,000 81,624 3.92 Qatar Qatagas/CNOOC 17-Jun-11 Maersk Marib 165,000 72,765 3.50 Yemen Yemen LNG/CNOOC 19-Jun-11 Dapeng Moon 147,000 64,673 3.11 Australia CNOOC 24-Jun-11 Dapeng Sun 147,000 64,673 3.11 Australia CNOOC 26-Jun-11 Sevilla Knutsen 173,000 76,744 3.69 Peru RepsolYPF/Kogas 28-Jun-11 Dapeng Star 147,100 64,871 3.12 Australia CNOOC 30-Jun-11 Puteri Firus 130,358 57,488 2.76 Malaysia Malaysia LNG/CNOOC Totals For June 2011 676,857 32.54
03-Jul-11 Seri Balqis 152,300 67,164 3.23 Yemen Yemen LNG/CNOOC 04-Jul-11 Dapeng Moon 147,000 64,827 3.12 Australia CNOOC 09-Jul-11 Maersk Arwa 165,000 72,765 3.50 Yemen CNOOC 14-Jul-11 Dapeng Sun 147,000 64,827 3.12 Australia CNOOC 18-Jul-11 Dapeng Star 147,100 64,871 3.12 Australia CNOOC 18-Jul-11 Al Rekayyat 216,200 95,344 4.58 Qatar Qatagas/CNOOC 26-Jul-11 Dapeng Moon 147,000 64,827 3.12 Australia CNOOC 30-Jul-11 Dapeng Sun 147,000 64,827 3.12 Australia CNOOC Totals For July 2011 559,452 26.90
04-Aug-11 Al Sheehaniya 210,100 92,654 4.45 Qatar Qatagas/CNOOC 04-Aug-11 Dapeng Star 147,100 64,871 3.12 Australia CNOOC 10-Aug-11 Maersk Arwa 165,000 72,765 3.50 Yemen CNOOC 12-Aug-11 Dapeng Moon 147,000 64,827 3.12 Australia CNOOC 13-Aug-11 LNG River Orashi 145,000 63,945 3.07 Nigeria NLNG/CNOOC 18-Aug-11 Dapeng Sun 147,000 64,827 3.12 Australia CNOOC 21-Aug-11 Dapeng Star 147,100 64,871 3.12 Australia CNOOC 24-Aug-11 Al Safliya 210,000 92,610 4.45 Qatar Qatagas/CNOOC Totals For August 2011 581,370 27.95 Asian LNG IMPORTS Some of the data below is unconfirmed and forward schedules are considered incomplete data. Date Vessel Name CBM Volume (mt) Volume (Bcf) Source Participants Rudong, China 24-May-11 Al Rekayyat 216,200 63,800 3.07 Qatar Qatargas 4/PetroChina Totals For May 2011 63,800 3.07
18-Jun-11 Al Ghariya 210,100 81,624 3.92 Qatar Qatargas 4/PetroChina Totals For June 2011 81,624 3.92
18-Jul-11 Methane Heather Sally 145,000 63,945 3.07 Nigeria BG/PetroChina Totals For July 2011 63,945 3.07
08-Aug-11 Ben Badis 177,000 78,057 3.75 Nigeria Vitol/PetroChina Totals For August 2011 78,057 3.75

170
Asian LNG IMPORTS Some of the data below is unconfirmed and forward schedules are considered incomplete data. Date Vessel Name CBM Volume (mt) Volume (Bcf) Source Participants Shanghai (Mengtougou), China 25-May-11 Polar Spirit 88,996 20,984 1.01 USA ConocoPhillips/Marathon/Sh energy
Totals For May 2011 20,984 1.01
Asian LNG IMPORTS Some of the data below is unconfirmed and forward schedules are considered incomplete data. Date Vessel Name CBM Volume (mt) Volume (Bcf) Source Participants Shanghai LNG, China 05-May-11 Seri Ayu 145,000 60,798 2.92 Malaysia Malaysia LNG 16-May-11 Puteri Delima Satu 137,489 57,648 2.77 Malaysia Malaysia LNG/CNOOC Totals For May 2011 118,446 5.69
01-Jun-11 Puteri Delima Satu 137,489 59,841 2.88 Malaysia Malaysia LNG/CNOOC 16-Jun-11 Puteri Zamrud 130,358 59,841 2.88 Malaysia Malaysia LNG/CNOOC 23-Jun-11 Puteri Nilam 130,405 59,841 2.88 Malaysia Malaysia LNG/CNOOC Totals For June 2011 179,523 8.63
06-Jul-11 Puteri Nilam 130,405 57,509 2.76 Malaysia Malaysia LNG/CNOOC 21-Jul-11 Puteri Zamrud 130,358 57,488 2.76 Malaysia Malaysia LNG/CNOOC Totals For July 2011 114,997 5.53
16-Aug-11 Puteri Intan 130,405 57,509 2.76 Malaysia Malaysia LNG/CNOOC Totals For August 2011 57,509 2.76

171
Waterborne Energy, Inc.
2323 S. Shepherd Dr. Suite 1010 Houston, Texas
77019 713/526-1555 www.waterbornelng.com
26 Aug 2011
Vol. 8, Week 33
India

172
Asian LNG IMPORTS Some of the data below is unconfirmed and forward schedules are considered incomplete data. Date Vessel Name CBM Volume (mt) Volume (Bcf) Source Participants Dahej, India 04-May-11 Raahi 138,000 62,000 2.98 Qatar Petronet 06-May-11 Aseem 153,200 67,561 3.25 Qatar Petronet 09-May-11 Maersk Qatar 145,000 63,945 3.07 Qatar Petronet 11-May-11 Raahi 138,000 62,000 2.98 Qatar Petronet 13-May-11 Bluesky 138,000 60,858 2.93 US Re-export Gazprom 14-May-11 Aseem 153,200 67,561 3.25 Qatar Petronet 22-May-11 Raahi 138,000 62,000 2.98 Qatar Petronet 23-May-11 Castillo de Villalba 138,000 60,858 2.93 Trinidad RepsolYPF/GSPC 25-May-11 Aseem 153,200 67,561 3.25 Qatar Petronet 27-May-11 Clean Energy 149,700 66,018 3.17 Egypt Gazprom/GAIL 29-May-11 Fuwairit 138,200 60,946 2.93 Qatar Rasgas/GAIL Totals For May 2011 701,308 33.71
01-Jun-11 Maersk Ras Laffan 138,200 60,946 2.93 Qatar 02-Jun-11 Raahi 138,000 62,000 2.98 Qatar Petronet 03-Jun-11 Aseem 153,200 67,561 3.25 Qatar Petronet 05-Jun-11 Maersk Qatar 145,000 63,945 3.07 Qatar Petronet 07-Jun-11 Disha 138,000 62,000 2.98 Qatar Petronet 09-Jun-11 Explorer 150,900 66,547 3.20 US Re-export Excelerate Energy 11-Jun-11 Raahi 138,000 62,000 2.98 Qatar Petronet 12-Jun-11 Methane Lydon Volney 145,000 59,535 2.86 Trinidad BG 14-Jun-11 Aseem 153,200 67,561 3.25 Qatar Petronet 17-Jun-11 Disha 138,000 62,000 2.98 Qatar Petronet 20-Jun-11 Salalah LNG 145,000 63,945 3.07 Oman 22-Jun-11 Raahi 138,000 62,000 2.98 Qatar Petronet 24-Jun-11 Aseem 153,200 67,561 3.25 Qatar Petronet 25-Jun-11 Fuwairit 138,200 60,946 2.93 Qatar Rasgas 27-Jun-11 Disha 138,000 62,000 2.98 Qatar Petronet 30-Jun-11 Raahi 138,000 62,000 2.98 Qatar Petronet Totals For June 2011 1,012,547 48.68
02-Jul-11 Aseem 153,200 67,561 3.25 Qatar Petronet 06-Jul-11 Disha 138,000 62,000 2.98 Qatar Petronet 06-Jul-11 Clean Energy 149,700 66,018 3.17 Nigeria Gazprom 09-Jul-11 Raahi 138,000 62,000 2.98 Qatar Petronet 10-Jul-11 Aseem 153,200 67,561 3.25 Qatar Petronet 12-Jul-11 Cadiz Knutsen 138,000 60,858 2.93 Egypt Union Fenosa 14-Jul-11 Methane Kari Elin 138,200 59,535 2.86 Trinidad BG 17-Jul-11 Disha 138,000 62,000 2.98 Qatar Petronet 18-Jul-11 Raahi 138,000 62,000 2.98 Qatar Petronet 20-Jul-11 Aseem 153,200 67,561 3.25 Qatar Petronet 22-Jul-11 BW Suez Boston 138,000 60,858 2.93 Algeria GDF Suez 24-Jul-11 Disha 138,000 62,000 2.98 Qatar Petronet 25-Jul-11 Iberica Knutsen 138,000 60,858 2.93 Nigeria RepsolYPF 28-Jul-11 Raahi 138,000 62,000 2.98 Qatar Petronet 30-Jul-11 Aseem 153,200 67,561 3.25 Qatar Petronet Totals For July 2011 950,371 45.69

173
Asian LNG IMPORTS Some of the data below is unconfirmed and forward schedules are considered incomplete data. Date Vessel Name CBM Volume (mt) Volume (Bcf) Source Participants Dahej, India (Continued...)
04-Aug-11 Maersk Ras Laffan 138,200 60,946 2.93 Qatar 06-Aug-11 Disha 138,000 62,000 2.98 Qatar Petronet 08-Aug-11 Aseem 153,200 67,561 3.25 Qatar Petronet 10-Aug-11 Raahi 138,000 62,000 2.98 Qatar Petronet 13-Aug-11 Al Deebel 145,000 63,945 3.07 Qatar Petronet 14-Aug-11 Disha 138,000 62,000 2.98 Qatar Petronet 16-Aug-11 Aseem 153,200 67,561 3.25 Qatar Petronet 18-Aug-11 Raahi 138,000 62,000 2.98 Qatar Petronet 20-Aug-11 Ejnan 145,000 63,945 3.07 Qatar 21-Aug-11 Grace Cosmos 150,000 66,150 3.18 Norway GDF Suez 23-Aug-11 Disha 138,000 62,000 2.98 Qatar Petronet 24-Aug-11 Castillo de Villalba 138,000 60,858 2.93 Nigeria RepsolYPF/GSPC 26-Aug-11 Aseem 153,200 67,561 3.25 Qatar Petronet 26-Aug-11 Aseem 153,200 67,561 3.25 Qatar Petronet Totals For August 2011 896,088 43.08
03-Sep-11 Methane Kari Elin 138,200 59,535 2.86 Trinidad BG Totals For September 2011 59,535 2.86 Asian LNG IMPORTS Some of the data below is unconfirmed and forward schedules are considered incomplete data. Date Vessel Name CBM Volume (mt) Volume (Bcf) Source Participants Hazira, India 03-May-11 Maersk Magellan 165,500 72,986 3.51 Qatar 23-May-11 Al Ghashamiya 216,000 95,256 4.58 Qatar Qatargas/Reliance Totals For May 2011 168,242 8.09
04-Jun-11 Cadiz Knutsen 138,000 60,858 2.93 Egypt Union Fenosa/Shell 10-Jun-11 Seri Angkasa 145,000 63,945 3.07 Nigeria 22-Jun-11 LNG Adamawa 144,000 63,504 3.05 Nigeria NLNG Totals For June 2011 188,307 9.05
02-Jul-11 LNG Sokoto 137,300 60,549 2.91 Nigeria Nigeria LNG 18-Jul-11 Al Ghashamiya 216,000 95,256 4.58 Qatar 23-Jul-11 Sohar LNG 135,000 59,535 2.86 Abu Dhabi Totals For July 2011 215,340 10.35
04-Aug-11 Al Kharsaah 217,000 95,697 4.60 Qatar 18-Aug-11 Seri Balhaf 152,000 67,032 3.22 Yemen Total 19-Aug-11 Clean Power 149,700 66,018 3.17 Qatar Totals For August 2011 228,747 11.00
174
Waterborne Energy, Inc.
2323 S. Shepherd Dr. Suite 1010 Houston, Texas
77019 713/526-1555 www.waterbornelng.com
26 Aug 2011
Vol. 8, Week 33
Japan

175
Asian LNG IMPORTS Some of the data below is unconfirmed and forward schedules are considered incomplete data. Date Vessel Name CBM Volume (mt) Volume (Bcf) Source Participants Chita, Japan 03-May-11 Al Jasra 135,169 59,610 2.87 Qatar Qatargas 06-May-11 Doha 137,262 60,533 2.91 Qatar Qatargas 07-May-11 Northwest Seaeagle 125,541 56,262 2.70 Australia North West Shelf 09-May-11 Puteri Zamrud Satu 138,000 59,493 2.86 Malaysia Malaysia LNG/Toho Gas 12-May-11 LNG Vesta 127,547 55,704 2.68 Indonesia Toho Gas 18-May-11 Northwest Swan 140,500 62,966 3.03 Australia North West Shelf 19-May-11 Grand Mereya 147,200 64,207 3.09 Russia Sakhalin 2 23-May-11 Onaiza 210,100 73,960 3.56 Qatar 25-May-11 Puteri Zamrud Satu 138,000 59,493 2.86 Malaysia Malaysia LNG/Toho Gas 28-May-11 Broog 137,529 60,650 2.92 Qatar Qatargas 31-May-11 Al Safliya 210,000 73,916 3.55 Qatar Totals For May 2011 686,794 33.02
02-Jun-11 Neva River 145,000 60,869 2.93 Nigeria 05-Jun-11 Al Jasra 135,169 59,610 2.87 Qatar Qatargas 07-Jun-11 Doha 137,262 60,533 2.91 Qatar Qatargas 10-Jun-11 Al Ruwais 210,100 65,753 3.16 Qatar 14-Jun-11 Zekreet 137,482 60,630 2.91 Qatar Qatargas 15-Jun-11 Northwest Shearwater 127,500 54,343 2.61 Australia North West Shelf 18-Jun-11 Seri Anggun 145,731 62,113 2.99 Australia 22-Jun-11 Al Zubarah 137,573 60,670 2.92 Qatar Qatargas 24-Jun-11 LNG Flora 125,637 53,549 2.57 Australia Toho Gas 25-Jun-11 Grand Aniva 147,200 64,915 3.12 Russia Sakhalin 2 29-Jun-11 Al Gharrafa 216,200 68,443 3.29 Qatar 30-Jun-11 Al Bidda 137,339 60,566 2.91 Qatar Qatargas Totals For June 2011 731,994 35.19
04-Jul-11 Bluesky 138,000 60,858 2.93 Nigeria Gazprom/Chubu Electric 05-Jul-11 Energy Confidence 147,000 64,827 3.12 Australia BG 07-Jul-11 Senshu Maru 127,167 56,081 2.70 Indonesia Pertamina 09-Jul-11 Al Jasra 135,169 59,610 2.87 Qatar Qatargas 12-Jul-11 Puteri Intan Satu 137,489 60,633 2.91 Malaysia Malaysia LNG/Toho Gas 14-Jul-11 Al Rayyan 137,420 60,602 2.91 Qatar Qatargas 16-Jul-11 Tangguh Batur 145,700 64,254 3.09 Indonesia Pertamina 22-Jul-11 Al Ruwais 210,100 92,654 4.45 Qatar 22-Jul-11 Northwest Snipe 127,747 56,336 2.71 Australia North West Shelf 25-Jul-11 Grand Elena 147,200 64,915 3.12 Russia Sakhalin-2/Chubu Electric 27-Jul-11 Al Wakrah 137,568 60,667 2.92 Qatar Qatargas 29-Jul-11 Northwest Swallow 127,544 56,247 2.70 Australia North West Shelf 30-Jul-11 Seri Ayu 145,000 63,945 3.07 Malaysia Malaysia LNG Totals For July 2011 821,629 39.50
03-Aug-11 Broog 137,529 60,650 2.92 Qatar Qatargas 07-Aug-11 Grand Mereya 147,200 64,915 3.12 Russia Sakhalin-2/Chubu Electric 08-Aug-11 Northwest Seaeagle 125,541 55,364 2.66 Australia North West Shelf 08-Aug-11 Al Wajbah 137,308 60,553 2.91 Qatar Qatargas 09-Aug-11 Al Jasra 135,169 59,610 2.87 Qatar Qatargas 11-Aug-11 Senshu Maru 127,167 56,081 2.70 Indonesia Pertamina 13-Aug-11 Northwest Sandpiper 125,500 55,346 2.66 Australia North West Shelf 15-Aug-11 Al Rayyan 137,420 60,602 2.91 Qatar Qatargas 16-Aug-11 Lalla Fatma N'Soumer 145,000 63,945 3.07 Egypt Sonatrach 19-Aug-11 Energy Confidence 147,000 64,827 3.12 Australia BG 21-Aug-11 Grace Barleria 141,000 62,181 2.99 Russia Sakhalin 2/Chubu Electric 24-Aug-11 Al Ruwais 210,100 92,654 4.45 Qatar 28-Aug-11 Seri Angkasa 145,000 63,945 3.07 Nigeria Nigeria LNG/Chubu Electric 28-Aug-11 Northwest Swan 140,500 61,960 2.98 Australia North West Shelf Totals For August 2011 882,633 42.43
01-Sep-11 Al Bidda 137,339 60,566 2.91 Qatar Qatargas 03-Sep-11 Broog 137,529 60,650 2.92 Qatar Qatargas Totals For September 2011 121,216 5.83

176
Asian LNG IMPORTS Some of the data below is unconfirmed and forward schedules are considered incomplete data. Date Vessel Name CBM Volume (mt) Volume (Bcf) Source Participants Fukuoka, Japan 14-May-11 Aman Bintulu 18,927 8,184 0.39 Malaysia Malaysia LNG/Saibu Gas 25-May-11 Aman Hakata 18,942 8,191 0.39 Malaysia Malaysia LNG/Saibu Gas 28-May-11 Aman Bintulu 18,927 8,184 0.39 Malaysia Malaysia LNG/Saibu Gas Totals For May 2011 24,559 1.18
06-Jun-11 Aman Hakata 18,942 8,233 0.40 Malaysia Malaysia LNG/Saibu Gas 12-Jun-11 Aman Bintulu 18,927 8,226 0.40 Malaysia Malaysia LNG/Saibu Gas 27-Jun-11 Aman Bintulu 18,927 8,226 0.40 Malaysia Malaysia LNG/Saibu Gas Totals For June 2011 24,685 1.19
11-Jul-11 Aman Bintulu 18,927 8,347 0.40 Malaysia Malaysia LNG/Saibu Gas 24-Jul-11 Aman Hakata 18,942 8,353 0.40 Malaysia Malaysia LNG/Saibu Gas 26-Jul-11 Aman Bintulu 18,927 8,347 0.40 Malaysia Malaysia LNG/Saibu Gas Totals For July 2011 25,047 1.20
08-Aug-11 Aman Hakata 18,942 8,353 0.40 Malaysia Malaysia LNG/Saibu Gas 21-Aug-11 Aman Hakata 18,942 8,353 0.40 Malaysia Malaysia LNG/Saibu Gas 23-Aug-11 Aman Bintulu 18,927 8,347 0.40 Malaysia Malaysia LNG/Saibu Gas Totals For August 2011 25,053 1.20

177
Asian LNG IMPORTS Some of the data below is unconfirmed and forward schedules are considered incomplete data. Date Vessel Name CBM Volume (mt) Volume (Bcf) Source Participants Futtsu, Japan 02-May-11 Al Khaznah 137,540 60,899 2.93 Abu Dhabi ADNOC/Tokyo Electric 05-May-11 Alto Acrux 145,000 63,681 3.06 Malaysia Tokyo Electric 08-May-11 Cygnus Passage 145,000 63,945 3.07 Russia Tokyo Electric 11-May-11 Ben Badis 177,000 78,057 3.75 Australia Vitol/Tokyo Electric 15-May-11 Puteri Mutiara Satu 138,000 60,607 2.91 Malaysia Malaysia LNG/Tokyo Electric 19-May-11 Maersk Methane 165,000 67,943 3.27 Peru BG/Tokyo Electric 20-May-11 Salalah LNG 145,000 64,088 3.08 Oman Tokyo Electric 21-May-11 Arctic Lady 145,000 57,324 2.76 Nigeria Total/Tokyo Electric 25-May-11 LNG Pioneer 138,000 60,858 2.93 Australia North West Shelf/Tokyo 26-May-11 Shahamah 137,756 60,995 2.93 Abu Dhabi ADNOC/Tokyo Electric 27-May-11 Ibri LNG 145,000 64,088 3.08 Oman CELT/Tokyo Electric 31-May-11 Ibra LNG 145,000 63,718 3.06 Oman Tokyo Electric Totals For May 2011 766,203 36.83
04-Jun-11 Al Khaznah 137,540 61,222 2.94 Abu Dhabi ADNOC/Tokyo Electric 06-Jun-11 Pacific Notus 135,000 59,523 2.86 Russia Tokyo Electric 08-Jun-11 Ghasha 137,100 61,027 2.93 Abu Dhabi ADNOC/Tokyo Electric 09-Jun-11 Clean Power 149,700 63,852 3.07 Qatar Tokyo Electric 11-Jun-11 Northwest Swallow 127,544 54,362 2.61 Australia North West Shelf/Tokyo 13-Jun-11 Pacific Eurus 135,000 58,675 2.82 Malaysia Tokyo Electric 17-Jun-11 Pacific Notus 135,000 59,523 2.86 Russia Tokyo Electric 19-Jun-11 Ish 137,512 61,210 2.94 Abu Dhabi ADNOC/Tokyo Electric 20-Jun-11 LNG Pioneer 138,000 58,818 2.83 Australia North West Shelf/Tokyo 22-Jun-11 Mubaraz 135,000 60,092 2.89 Abu Dhabi ADNOC/Tokyo Electric 25-Jun-11 Tangguh Foja 155,000 67,527 3.25 Indonesia Tangguh LNG/Tokyo Electric 26-Jun-11 Puteri Intan Satu 137,489 59,757 2.87 Malaysia Malaysia LNG/Tokyo Electric 28-Jun-11 Shahamah 137,756 60,750 2.92 Abu Dhabi ADNOC/Tokyo Electric 30-Jun-11 Puteri Mutiara Satu 138,000 59,979 2.88 Malaysia Malaysia LNG/Tokyo Electric Totals For June 2011 846,317 40.69
02-Jul-11 Ibra LNG 145,000 63,945 3.07 Oman Tokyo Electric 03-Jul-11 Woodside Donaldson 165,500 72,986 3.51 Australia Tokyo Electric 06-Jul-11 Pacific Eurus 135,000 59,535 2.86 Australia Tokyo Electric 07-Jul-11 LNG Swift 127,580 56,263 2.70 Abu Dhabi Tokyo Electric 08-Jul-11 Echigo Maru 125,568 55,375 2.66 Malaysia Tokyo Electric 11-Jul-11 Ghasha 137,100 60,461 2.91 Abu Dhabi ADNOC/Tokyo Electric 13-Jul-11 Seri Anggun 145,731 64,267 3.09 Australia BG/Tokyo Electric 14-Jul-11 Alto Acrux 145,000 63,945 3.07 Australia Tokyo Electric 17-Jul-11 Grand Mereya 147,200 64,915 3.12 Russia Sakhalin 2/Tokyo Electric 22-Jul-11 Abadi 136,912 60,378 2.90 Brunei Brunei LNG/Tokyo Electric 22-Jul-11 Pacific Eurus 135,000 59,535 2.86 Malaysia Tokyo Electric 23-Jul-11 Cygnus Passage 145,000 63,945 3.07 Russia Tokyo Electric 24-Jul-11 Tangguh Palung 155,000 68,355 3.29 Indonesia Tangguh 27-Jul-11 Pacific Notus 135,000 59,535 2.86 Australia Tokyo Electric 31-Jul-11 Ibri LNG 145,000 63,945 3.07 Oman CELT/Tokyo Electric Totals For July 2011 937,385 45.06
02-Aug-11 Cygnus Passage 145,000 63,945 3.07 Russia Tokyo Electric 03-Aug-11 Puteri Intan Satu 137,489 60,633 2.91 Malaysia Malaysia LNG/Tokyo Electric 04-Aug-11 Mraweh 135,000 59,535 2.86 Abu Dhabi ADNOC/Tokyo Electric 08-Aug-11 Trinity Arrow 154,000 67,914 3.26 Peru Repsol YPF/Tokyo Electric 10-Aug-11 Pacific Eurus 135,000 59,535 2.86 Malaysia Tokyo Electric 12-Aug-11 Doha 137,262 60,533 2.91 Qatar Qatargas/Tokyo Electric 14-Aug-11 Ghasha 137,100 60,461 2.91 Abu Dhabi ADNOC/Tokyo Electric 16-Aug-11 Woodside Donaldson 165,500 72,986 3.51 Australia Tokyo Electric 17-Aug-11 Pacific Notus 135,000 59,535 2.86 Australia Tokyo Electric 21-Aug-11 Salalah LNG 145,000 63,945 3.07 Oman Tokyo Electric 25-Aug-11 Ish 137,512 60,643 2.92 Abu Dhabi ADNOC/Tokyo Electric 26-Aug-11 Cygnus Passage 145,000 63,945 3.07 Russia Tokyo Electric 29-Aug-11 Ibra LNG 145,000 63,945 3.07 Oman Tokyo Electric Totals For August 2011 817,555 39.30
02-Sep-11 Shahamah 137,756 60,750 2.92 Abu Dhabi ADNOC/Tokyo Electric Totals For September 2011 60,750 2.92

178
Asian LNG IMPORTS Some of the data below is unconfirmed and forward schedules are considered incomplete data. Date Vessel Name CBM Volume (mt) Volume (Bcf) Source Participants Hatsukaichi, Japan 17-May-11 Sun Arrows 19,176 8,457 0.41 Russia Hiroshima Gas 20-May-11 Surya Satsuma 23,096 10,057 0.48 Indonesia Pertamina/Hiroshima Gas Totals For May 2011 18,514 0.89
05-Jun-11 Sun Arrows 19,176 8,455 0.41 Russia Hiroshima Gas 12-Jun-11 Surya Satsuma 23,096 10,062 0.48 Indonesia Pertamina/Hiroshima Gas 16-Jun-11 Surya Aki 19,538 8,512 0.41 Indonesia Pertamina/Hiroshima Gas Totals For June 2011 27,029 1.30
08-Jul-11 Surya Satsuma 23,096 10,185 0.49 Indonesia Pertamina/Hiroshima Gas 24-Jul-11 Surya Satsuma 23,096 10,185 0.49 Indonesia Pertamina/Hiroshima Gas 26-Jul-11 Sun Arrows 19,176 8,457 0.41 Russia Hiroshima Gas Totals For July 2011 28,827 1.39
09-Aug-11 Surya Satsuma 23,096 10,185 0.49 Indonesia Pertamina/Hiroshima Gas 11-Aug-11 Surya Aki 19,538 8,616 0.41 Indonesia Pertamina/Hiroshima Gas 15-Aug-11 Sun Arrows 19,176 8,457 0.41 Russia Hiroshima Gas 25-Aug-11 Surya Satsuma 23,096 10,185 0.49 Indonesia Pertamina/Hiroshima Gas 29-Aug-11 Sun Arrows 19,176 8,457 0.41 Malaysia Hiroshima Gas Totals For August 2011 45,900 2.21

179
Asian LNG IMPORTS Some of the data below is unconfirmed and forward schedules are considered incomplete data. Date Vessel Name CBM Volume (mt) Volume (Bcf) Source Participants Higashi-Ohgishima/Ohgishima, Japan 02-May-11 Energy Confidence 147,000 66,122 3.18 Australia Tokyo Gas 03-May-11 LNG Taurus 126,750 54,872 2.64 Indonesia Pertamina 05-May-11 Energy Frontier 147,599 59,191 2.85 Egypt Tokyo Gas 06-May-11 Ghasha 137,100 61,109 2.94 Abu Dhabi ADNOC/Tokyo Electric 10-May-11 Pacific Notus 135,000 60,724 2.92 Australia Tokyo Electric 13-May-11 LNG Swift 127,580 56,866 2.73 Abu Dhabi Marubeni/Tokyo Electric 17-May-11 Ish 137,512 61,293 2.95 Abu Dhabi ADNOC/Tokyo Electric 19-May-11 Energy Confidence 147,000 68,270 3.28 Malaysia Tokyo Gas 20-May-11 Mubaraz 135,000 60,173 2.89 Abu Dhabi ADNOC/Tokyo Electric 21-May-11 Energy Advance 145,000 64,255 3.09 Russia Tokyo Gas 22-May-11 LNG Taurus 126,750 54,872 2.64 Indonesia Pertamina 26-May-11 Alto Acrux 145,000 65,222 3.14 Australia Tokyo Electric 28-May-11 Seri Anggun 145,731 65,551 3.15 Australia BG/Tokyo Electric 30-May-11 Mraweh 135,000 60,092 2.89 Abu Dhabi ADNOC/Tokyo Electric Totals For May 2011 858,612 41.28
02-Jun-11 Banshu Maru 126,885 56,480 2.72 Abu Dhabi Tokyo Electric 07-Jun-11 LNG Taurus 126,750 55,220 2.65 Indonesia Pertamina 10-Jun-11 Puteri Intan Satu 137,489 59,757 2.87 Malaysia Malaysia LNG 11-Jun-11 Al Hamra 137,000 60,982 2.93 Abu Dhabi ADNOC/Tokyo Electric 15-Jun-11 Umm Al Ashtan 137,000 60,982 2.93 Abu Dhabi ADNOC/Tokyo Electric 18-Jun-11 LNG Vesta 127,547 55,567 2.67 Indonesia Tokyo Gas 18-Jun-11 Seri Amanah 145,709 63,329 3.04 Malaysia Malaysia LNG/Tokyo Electric 22-Jun-11 Banshu Maru 126,885 56,480 2.72 Abu Dhabi Tokyo Electric 25-Jun-11 Northwest Snipe 127,747 54,448 2.62 Australia North West Shelf 26-Jun-11 Energy Progress 147,558 62,892 3.02 Australia Tokyo Gas 27-Jun-11 Northwest Sanderling 125,452 53,470 2.57 Australia North West Shelf/Tokyo Gas 28-Jun-11 Bebatik 75,056 33,100 1.59 Brunei Brunei LNG Totals For June 2011 672,707 32.34
01-Jul-11 Mraweh 135,000 59,535 2.86 Abu Dhabi ADNOC/Tokyo Electric 05-Jul-11 Puteri Intan 130,405 57,509 2.76 Malaysia Malaysia LNG/Tokyo Gas 07-Jul-11 Al Khaznah 137,540 60,655 2.92 Abu Dhabi ADNOC/Tokyo Electric 10-Jul-11 Cygnus Passage 145,000 63,945 3.07 Russia Tokyo Electric 11-Jul-11 Doha 137,262 60,533 2.91 Qatar Qatargas 14-Jul-11 Al Hamra 137,000 60,417 2.90 Abu Dhabi ADNOC/Tokyo Electric 16-Jul-11 Seri Alam 145,000 63,945 3.07 Malaysia BG 18-Jul-11 Umm Al Ashtan 137,000 60,417 2.90 Abu Dhabi ADNOC/Tokyo Electric 22-Jul-11 Ish 137,512 60,643 2.92 Abu Dhabi ADNOC/Tokyo Electric 22-Jul-11 LNG Vesta 127,547 56,248 2.70 Indonesia Tokyo Gas 25-Jul-11 Mubaraz 135,000 59,535 2.86 Abu Dhabi ADNOC/Tokyo Electric 26-Jul-11 Energy Confidence 147,000 64,827 3.12 Australia Tokyo Gas 28-Jul-11 Puteri Intan 130,405 57,509 2.76 Malaysia Malaysia LNG/Tokyo Gas 29-Jul-11 Energy Navigator 147,000 64,827 3.12 Russia Tokyo Gas 31-Jul-11 Shahamah 137,756 60,750 2.92 Abu Dhabi ADNOC/Tokyo Electric Totals For July 2011 911,295 43.81
02-Aug-11 Alto Acrux 145,000 63,945 3.07 Australia Tokyo Electric 05-Aug-11 Puteri Zamrud 130,358 57,488 2.76 Malaysia Malaysia LNG/Tokyo Gas 08-Aug-11 Al Khaznah 137,540 60,655 2.92 Abu Dhabi ADNOC/Tokyo Electric 09-Aug-11 Energy Advance 145,000 63,945 3.07 Australia Tokyo Gas 11-Aug-11 Echigo Maru 125,568 55,375 2.66 Abu Dhabi 14-Aug-11 Sohar LNG 135,000 59,535 2.86 Oman 16-Aug-11 Gaslog Singapore 155,000 68,355 3.29 Equatorial Guinea BG/Tokyo Gas 17-Aug-11 Al Hamra 137,000 60,417 2.90 Abu Dhabi ADNOC/Tokyo Electric 21-Aug-11 Umm Al Ashtan 137,000 60,417 2.90 Abu Dhabi ADNOC/Tokyo Electric 24-Aug-11 Alto Acrux 145,000 63,945 3.07 Australia Tokyo Electric 28-Aug-11 Mubaraz 135,000 59,535 2.86 Abu Dhabi ADNOC/Tokyo Electric 30-Aug-11 Ibri LNG 145,000 63,945 3.07 Oman CELT/Tokyo Electric Totals For August 2011 737,557 35.46
04-Sep-11 Golar Grand 145,700 64,254 3.09 Nigeria Shell/Tokyo Electric 06-Sep-11 Mraweh 135,000 59,535 2.86 Abu Dhabi ADNOC/Tokyo Electric Totals For September 2011 123,789 5.95

180
Asian LNG IMPORTS Some of the data below is unconfirmed and forward schedules are considered incomplete data. Date Vessel Name CBM Volume (mt) Volume (Bcf) Source Participants Himeji, Japan 07-May-11 Puteri Firus Satu 137,489 60,099 2.89 Malaysia Malaysia LNG 09-May-11 Northwest Sandpiper 125,500 56,072 2.70 Australia North West Shelf 17-May-11 Northwest Swallow 127,544 56,985 2.74 Australia North West Shelf 19-May-11 Al Bidda 137,339 60,196 2.89 Qatar Qatargas 22-May-11 Puteri Intan Satu 137,489 60,099 2.89 Malaysia Malaysia LNG 25-May-11 LNG Benue 145,000 59,921 2.88 Nigeria Nigeria LNG Totals For May 2011 353,372 16.99
05-Jun-11 Northwest Sanderling 125,452 53,470 2.57 Australia North West Shelf 07-Jun-11 Grace Barleria 141,000 62,169 2.99 Russia Sakhalin 2 12-Jun-11 LNG Dream 145,254 61,910 2.98 Australia Osaka Gas 14-Jun-11 LNG River Orashi 145,000 60,869 2.93 Nigeria Nigeria LNG/Kansai Electric 19-Jun-11 Dwiputra 127,386 55,497 2.67 Indonesia Pertamina 23-Jun-11 Senshu Maru 127,167 55,402 2.66 Indonesia Pertamina 27-Jun-11 Seri Alam 145,000 63,021 3.03 Malaysia BG Totals For June 2011 412,338 19.82
02-Jul-11 Energy Frontier 147,599 65,091 3.13 Equatorial Guinea 04-Jul-11 LNG Dream 145,254 64,057 3.08 Australia Osaka Gas 07-Jul-11 Al Wajbah 137,308 60,553 2.91 Qatar Qatargas 13-Jul-11 LNG Taurus 126,750 55,897 2.69 Indonesia Pertamina 15-Jul-11 Seri Ayu 145,000 63,945 3.07 Malaysia Malaysia LNG 17-Jul-11 Express 150,900 66,547 3.20 Nigeria Excelerate Energy 22-Jul-11 Salalah LNG 145,000 63,945 3.07 Oman 25-Jul-11 LNG Dream 145,254 64,057 3.08 Australia Osaka Gas 27-Jul-11 LNG Akwa Ibom 141,000 62,181 2.99 Nigeria Nigeria LNG/Kansai Electric 30-Jul-11 Methane Lydon Volney 145,000 59,535 2.86 Trinidad BG Totals For July 2011 625,808 30.09
06-Aug-11 K.Jasmine 145,700 64,254 3.09 Russia 11-Aug-11 Puteri Mutiara Satu 138,000 60,858 2.93 Malaysia Malaysia LNG 13-Aug-11 LNG Taurus 126,750 55,897 2.69 Indonesia Pertamina 15-Aug-11 Ekaputra 136,400 60,152 2.89 Indonesia Pertamina 17-Aug-11 LNG Dream 145,254 64,057 3.08 Australia Osaka Gas 20-Aug-11 LNG Vesta 127,547 56,248 2.70 Indonesia Osaka Gas 22-Aug-11 Dwiputra 127,386 56,177 2.70 Indonesia Pertamina 27-Aug-11 Al Wakrah 137,568 60,667 2.92 Qatar Qatargas Totals For August 2011 478,310 22.99

181
Asian LNG IMPORTS Some of the data below is unconfirmed and forward schedules are considered incomplete data. Date Vessel Name CBM Volume (mt) Volume (Bcf) Source Participants Kagoshima, Japan 10-Jul-11 Surya Aki 19,538 8,616 0.41 Indonesia Pertamina/Nippon Gas Totals For July 2011 8,616 0.41
24-Aug-11 Surya Aki 19,538 8,616 0.41 Indonesia Pertamina/Nippon Gas Totals For August 2011 8,616 0.41 Asian LNG IMPORTS Some of the data below is unconfirmed and forward schedules are considered incomplete data. Date Vessel Name CBM Volume (mt) Volume (Bcf) Source Participants Mizushima, Japan 10-May-11 Northwest Snipe 127,747 56,592 2.72 Australia North West Shelf/Chugoku Electric 25-May-11 Nizwa LNG 145,000 62,697 3.01 Oman Qman LNG/Itochu/Chugoku Electric
Totals For May 2011 119,289 5.73
24-Jun-11 Northwest Sandpiper 125,500 53,490 2.57 Australia North West Shelf/Chugoku Electric
Totals For June 2011 53,490 2.57
24-Jul-11 Northwest Stormpetrel 125,525 55,357 2.66 Australia North West Shelf/Chugoku Electric
Totals For July 2011 55,357 2.66
06-Aug-11 Northwest Swan 140,500 61,960 2.98 Australia North West Shelf/Chugoku Electric 25-Aug-11 Nizwa LNG 145,000 63,945 3.07 Oman Qman LNG/Itochu/Chugoku Electric
Totals For August 2011 125,905 6.05 Asian LNG IMPORTS Some of the data below is unconfirmed and forward schedules are considered incomplete data. Date Vessel Name CBM Volume (mt) Volume (Bcf) Source Participants Nagasaki, Japan 09-May-11 Aman Hakata 18,942 8,196 0.39 Malaysia Malaysia LNG/Saibu Gas Totals For May 2011 8,196 0.39
24-Jun-11 Sun Arrows 19,176 8,455 0.41 Russia Hiroshima Gas/Saibu Gas Totals For June 2011 8,455 0.41
09-Aug-11 Aman Bintulu 18,927 8,347 0.40 Malaysia Malaysia LNG/Saibu Gas Totals For August 2011 8,347 0.40

182
Asian LNG IMPORTS Some of the data below is unconfirmed and forward schedules are considered incomplete data. Date Vessel Name CBM Volume (mt) Volume (Bcf) Source Participants Negishi, Japan 03-May-11 Bilis 77,731 34,124 1.64 Brunei Brunei LNG 08-May-11 Energy Advance 145,000 64,364 3.09 Russia Tokyo Gas 10-May-11 Puteri Intan 130,405 56,497 2.72 Malaysia Malaysia LNG 13-May-11 Tenaga Lima 130,000 56,321 2.71 Malaysia Malaysia LNG 26-May-11 Puteri Nilam Satu 137,489 59,566 2.86 Malaysia Malaysia LNG Totals For May 2011 270,872 13.02
03-Jun-11 Tenaga Lima 130,000 56,502 2.72 Malaysia Malaysia LNG 07-Jun-11 Energy Progress 147,558 62,892 3.02 Australia Tokyo Gas 07-Jun-11 Cygnus Passage 145,000 63,932 3.07 Russia Tokyo Electric 13-Jun-11 Puteri Nilam Satu 137,489 59,757 2.87 Malaysia Malaysia LNG 21-Jun-11 Puteri Delima 130,405 56,678 2.72 Malaysia Malaysia LNG 25-Jun-11 Seri Bijaksana 152,300 60,589 2.91 Equatorial Guinea BG Totals For June 2011 360,350 17.32
02-Jul-11 Gaslog Savannah 155,000 68,355 3.29 Egypt BG 04-Jul-11 Puteri Zamrud Satu 138,000 60,858 2.93 Malaysia Malaysia LNG 07-Jul-11 Bubuk 77,679 34,256 1.65 Brunei Brunei LNG 10-Jul-11 Energy Advance 145,000 63,945 3.07 Australia Tokyo Gas 12-Jul-11 Tenaga Lima 130,000 57,330 2.76 Malaysia Malaysia LNG 22-Jul-11 Bubuk 77,679 34,256 1.65 Brunei Brunei LNG 23-Jul-11 Puteri Delima 130,405 57,509 2.76 Malaysia Malaysia LNG Totals For July 2011 376,509 18.10
08-Aug-11 Puteri Firus Satu 137,489 60,633 2.91 Malaysia Malaysia LNG 15-Aug-11 Seri Amanah 145,000 63,945 3.07 Malaysia Malaysia LNG 17-Aug-11 Bekulan 75,072 33,107 1.59 Brunei Brunei LNG 21-Aug-11 Puteri Firus 130,358 57,488 2.76 Malaysia Malaysia LNG 25-Aug-11 LNG Swift 127,580 56,263 2.70 Australia North West Shelf 28-Aug-11 Energy Advance 145,000 63,945 3.07 Australia Tokyo Gas Totals For August 2011 335,381 16.12

183
Asian LNG IMPORTS Some of the data below is unconfirmed and forward schedules are considered incomplete data. Date Vessel Name CBM Volume (mt) Volume (Bcf) Source Participants Nihonkai LNG Niigata, Japan 01-May-11 Al Wajbah 137,308 59,337 2.85 Qatar Qatargas/Tohoku Electric 04-May-11 Puteri Firus 130,358 57,307 2.75 Malaysia Malaysia LNG 16-May-11 Sohar LNG 135,000 61,136 2.94 Australia Mitsui/Tohoku Electric 17-May-11 Cygnus Passage 145,000 65,379 3.14 Russia Tokyo Electric/Tohoku Electric 20-May-11 Hyundai Oceanpia 137,415 56,026 2.69 Indonesia Pertamina/Tohoku Electric Totals For May 2011 299,185 14.38
02-Jun-11 Wakaba Maru 127,209 55,420 2.66 Indonesia 08-Jun-11 Northwest Stormpetrel 125,525 53,501 2.57 Australia North West Shelf/Tohoku Electric 11-Jun-11 Al Rayyan 137,420 60,602 2.91 Qatar Qatargas/Tohoku Electric 15-Jun-11 Puteri Delima Satu 137,489 59,757 2.87 Malaysia Malaysia LNG 20-Jun-11 Northwest Seaeagle 125,541 53,508 2.57 Australia North West Shelf/Tohoku Electric 25-Jun-11 Puteri Firus Satu 137,489 59,757 2.87 Malaysia Malaysia LNG 28-Jun-11 Seri Ayu 145,000 63,021 3.03 Malaysia Malaysia LNG Totals For June 2011 405,566 19.50
02-Jul-11 Al Karaana 210,100 92,654 4.45 Qatar 07-Jul-11 Northwest Swallow 127,544 56,247 2.70 Australia Tohoku Electric 09-Jul-11 Wilpower 125,915 55,529 2.67 Indonesia Pertamina/Tohoku Electric 15-Jul-11 Puteri Delima Satu 137,489 60,633 2.91 Malaysia Malaysia LNG 25-Jul-11 Al Zubarah 137,573 60,670 2.92 Qatar Qatargas/Tohoku Electric 30-Jul-11 Tangguh Foja 155,000 68,355 3.29 Indonesia Tangguh/Tohoku Electric Totals For July 2011 394,088 18.95
02-Aug-11 Wakaba Maru 127,209 56,099 2.70 Indonesia 07-Aug-11 Seri Anggun 145,731 64,267 3.09 Australia BG 13-Aug-11 Northwest Sanderling 125,452 55,324 2.66 Australia North West Shelf/Tohoku Electric 15-Aug-11 Tenaga Lima 130,000 57,330 2.76 Malaysia Malaysia LNG 17-Aug-11 Al Karaana 210,100 92,654 4.45 Qatar 23-Aug-11 Seri Alam 145,000 63,945 3.07 Malaysia Malaysia LNG 26-Aug-11 Wilpower 125,915 55,529 2.67 Indonesia Pertamina/Tohoku Electric 28-Aug-11 Northwest Swallow 127,544 56,247 2.70 Australia Tohoku Electric Totals For August 2011 501,395 24.10
01-Sep-11 Seri Anggun 145,731 64,267 3.09 Australia BG Totals For September 2011 64,267 3.09

184
Asian LNG IMPORTS Some of the data below is unconfirmed and forward schedules are considered incomplete data. Date Vessel Name CBM Volume (mt) Volume (Bcf) Source Participants Oita, Japan 11-May-11 Pacific Enlighten 145,000 65,556 3.15 Australia Kyushu Electric 17-May-11 LNG Kano 140,500 60,915 2.93 Nigeria Nigeria LNG/Kyushu Electric 25-May-11 Senshu Maru 127,167 55,089 2.65 Indonesia Pertamina/Kyushu Electric Totals For May 2011 181,560 8.73
02-Jun-11 Pacific Enlighten 145,000 61,802 2.97 Australia Kyushu Electric 11-Jun-11 Grand Aniva 147,200 64,902 3.12 Russia Sakhalin 2 22-Jun-11 Pacific Enlighten 145,000 61,802 2.97 Australia Kyushu Electric Totals For June 2011 188,506 9.06
08-Jul-11 Tangguh Jaya 155,000 68,355 3.29 Indonesia Tangguh/Kyushu Electric 14-Jul-11 Pacific Enlighten 145,000 63,945 3.07 Australia Kyushu Electric 27-Jul-11 Senshu Maru 127,167 56,081 2.70 Indonesia Pertamina/Kyushu Electric Totals For July 2011 188,381 9.06
05-Aug-11 Pacific Enlighten 145,000 63,945 3.07 Australia Kyushu Electric 10-Aug-11 Tangguh Jaya 155,000 68,355 3.29 Indonesia Tangguh/Kyushu Electric 24-Aug-11 Pacific Enlighten 145,000 63,945 3.07 Australia Kyushu Electric 29-Aug-11 Arctic Discoverer 140,000 61,740 2.97 Norway Statoil/Kyushu Electric Totals For August 2011 257,985 12.40

185
Asian LNG IMPORTS Some of the data below is unconfirmed and forward schedules are considered incomplete data. Date Vessel Name CBM Volume (mt) Volume (Bcf) Source Participants Sakai/Senboku, Japan 01-May-11 Surya Aki 19,538 8,616 0.41 Indonesia Pertamina 08-May-11 Dwiputra 127,386 56,177 2.70 Indonesia Pertamina 10-May-11 LNG Jamal 136,977 60,569 2.91 Oman Osaka Gas 10-May-11 Methane Nile Eagle 145,000 58,030 2.79 Egypt BG 12-May-11 Tangguh Palung 155,000 68,355 3.29 Indonesia Tangguh 18-May-11 LNG Barka 153,643 67,938 3.27 Oman Osaka Gas 19-May-11 LNG Dream 145,254 64,057 3.08 Australia Osaka Gas 24-May-11 Excelerate 138,074 60,891 2.93 Qatar Excelerate 28-May-11 Northwest Seaeagle 125,541 53,508 2.57 Australia North West Shelf 30-May-11 Seri Amanah 145,000 63,021 3.03 Malaysia Malaysia LNG 31-May-11 Abadi 136,912 60,378 2.90 Brunei Brunei LNG/Osaka Gas Totals For May 2011 621,540 29.88
01-Jun-11 Surya Aki 19,538 8,512 0.41 Indonesia Pertamina 03-Jun-11 LNG Vesta 127,547 55,567 2.67 Indonesia Osaka Gas 03-Jun-11 Northwest Snipe 127,747 54,448 2.62 Australia North West Shelf 07-Jun-11 Seri Alam 145,000 63,021 3.03 Malaysia BG 12-Jun-11 LNG Jamal 136,977 60,192 2.89 Oman Osaka Gas 12-Jun-11 LNG Ebisu 145,000 61,802 2.97 Australia Kansai Electric 18-Jun-11 LNG Barka 153,643 67,516 3.25 Oman Osaka Gas 21-Jun-11 Al Khor 137,354 60,573 2.91 Qatar Qatargas 22-Jun-11 LNG Taurus 126,750 55,220 2.65 Indonesia Pertamina 26-Jun-11 Berge Arzew 138,000 58,612 2.82 Algeria Sonatrach 27-Jun-11 LNG Gemini 126,750 55,897 2.69 US Re-export Kansai Electric 29-Jun-11 Puteri Zamrud 130,358 56,657 2.72 Malaysia Malaysia LNG Totals For June 2011 658,017 31.63
01-Jul-11 Northwest Stormpetrel 125,525 55,357 2.66 Australia North West Shelf 03-Jul-11 British Ruby 155,000 60,858 2.93 Trinidad BP 05-Jul-11 LNG Vesta 127,547 56,248 2.70 Indonesia Osaka Gas 07-Jul-11 Northwest Shearwater 127,500 56,228 2.70 Australia North West Shelf 10-Jul-11 Dwiputra 127,386 56,177 2.70 Indonesia Pertamina 10-Jul-11 Puteri Nilam Satu 137,489 60,633 2.91 Malaysia Malaysia LNG 12-Jul-11 LNG Jamal 136,977 60,407 2.90 Oman Osaka Gas 16-Jul-11 Northwest Seaeagle 125,541 55,364 2.66 Australia North West Shelf 21-Jul-11 LNG Barka 153,643 67,757 3.26 Oman Osaka Gas 21-Jul-11 Grand Aniva 147,200 64,915 3.12 Russia Sakhalin 2 23-Jul-11 Woodside Donaldson 165,500 72,986 3.51 Australia 25-Jul-11 Surya Aki 19,538 8,616 0.41 Indonesia Pertamina 27-Jul-11 Puteri Firus 130,358 57,488 2.76 Malaysia Malaysia LNG 29-Jul-11 Al Bahiya 209,200 92,257 4.44 Qatar Kansai Electric 31-Jul-11 Northwest Shearwater 127,500 56,228 2.70 Australia North West Shelf Totals For July 2011 881,519 42.38
04-Aug-11 Puteri Delima Satu 137,489 60,633 2.91 Malaysia Malaysia LNG 09-Aug-11 Methane Shirley 145,000 63,945 3.07 Equatorial Guinea BG 15-Aug-11 British Emerald 155,000 60,858 2.93 Trinidad BP/Kansai Electric 16-Aug-11 LNG Jamal 136,977 60,407 2.90 Oman Osaka Gas 19-Aug-11 LNG Barka 153,643 67,757 3.26 Oman Osaka Gas 20-Aug-11 LNG Ebisu 145,000 63,945 3.07 Nigeria Kansai Electric 21-Aug-11 Northwest Stormpetrel 125,525 55,357 2.66 Australia North West Shelf 25-Aug-11 Senshu Maru 127,167 56,081 2.70 Indonesia Pertamina 29-Aug-11 Northwest Shearwater 127,500 56,228 2.70 Australia North West Shelf Totals For August 2011 545,211 26.21
15-Sep-11 LNG Kano 140,500 61,960 2.98 Nigeria Nigeria LNG Totals For September 2011 61,960 2.98

186
Asian LNG IMPORTS Some of the data below is unconfirmed and forward schedules are considered incomplete data. Date Vessel Name CBM Volume (mt) Volume (Bcf) Source Participants Sakaide, Japan
08-Jun-11 Puteri Nilam 130,405 57,530 2.77 Malaysia Malaysia LNG/Shikoku Electric Totals For June 2011 57,530 2.77
11-Aug-11 Puteri Delima 130,405 57,509 2.76 Malaysia Malaysia LNG/Shikoku Electric Totals For Aug 2011 57,509 2.76 Asian LNG IMPORTS Some of the data below is unconfirmed and forward schedules are considered incomplete data. Date Vessel Name CBM Volume (mt) Volume (Bcf) Source Participants Shin Minato Works, Japan 09-Mar-11 Aman Sendai 18,928 8,350 0.40 Malaysia Malaysia LNG/Sendai Gas Totals For March 2011 8,350 0.40

187
Asian LNG IMPORTS Some of the data below is unconfirmed and forward schedules are considered incomplete data. Date Vessel Name CBM Volume (mt) Volume (Bcf) Source Participants Sodegaura, Japan 02-May-11 Belanak 75,000 33,075 1.59 Brunei Brunei LNG 03-May-11 Bubuk 77,679 34,256 1.65 Brunei Brunei LNG 05-May-11 Bebatik 75,056 33,100 1.59 Brunei Brunei LNG 07-May-11 Arkat 147,000 35,777 1.72 Brunei Brunei LNG 11-May-11 Zekreet 137,482 58,875 2.83 Qatar Qatargas/Tokyo Electric 12-May-11 Abadi 136,912 60,378 2.90 Brunei Brunei LNG 13-May-11 Bekulan 75,072 33,107 1.59 Brunei Brunei LNG 15-May-11 LNG Flora 125,637 55,913 2.69 Indonesia Tokyo Gas 16-May-11 Belanak 75,000 33,075 1.59 Brunei Brunei LNG 17-May-11 Bubuk 77,679 34,256 1.65 Brunei Brunei LNG 23-May-11 Pacific Eurus 135,000 59,535 2.86 Malaysia Tokyo Electric 23-May-11 Bilis 77,731 34,279 1.65 Brunei Brunei LNG 23-May-11 Puteri Delima 130,405 57,509 2.76 Malaysia Malaysia LNG/Tokyo Electric 27-May-11 Pacific Notus 135,000 59,912 2.88 Russia Tokyo Electric 28-May-11 Puteri Intan 130,405 58,059 2.79 Malaysia Malaysia LNG 28-May-11 Bekulan 75,072 33,107 1.59 Brunei Brunei LNG Totals For May 2011 714,213 34.34
01-Jun-11 Seri Ayu 145,000 63,021 3.03 Malaysia Malaysia LNG 02-Jun-11 Bubuk 77,679 34,256 1.65 Brunei Brunei LNG 02-Jun-11 LNG Flora 125,637 54,735 2.63 Indonesia Tokyo Gas 04-Jun-11 Energy Advance 145,000 63,932 3.07 Russia Tokyo Gas 04-Jun-11 Puteri Firus 130,358 56,657 2.72 Malaysia Malaysia LNG 04-Jun-11 Belanak 75,000 33,075 1.59 Brunei Brunei LNG 07-Jun-11 Bilis 77,731 34,279 1.65 Brunei Brunei LNG 13-Jun-11 Bebatik 75,056 33,100 1.59 Brunei Brunei LNG 15-Jun-11 Bekulan 75,072 33,107 1.59 Brunei Brunei LNG 16-Jun-11 Puteri Mutiara Satu 138,000 59,979 2.88 Malaysia Malaysia LNG 17-Jun-11 Energy Advance 145,000 63,932 3.07 Russia Tokyo Gas 19-Jun-11 Abadi 136,912 60,378 2.90 Brunei Brunei LNG 20-Jun-11 Alto Acrux 145,000 61,802 2.97 Australia Tokyo Electric 21-Jun-11 Bubuk 77,679 34,256 1.65 Brunei Brunei LNG 22-Jun-11 Tenaga Lima 130,000 56,502 2.72 Malaysia Malaysia LNG 25-Jun-11 Belanak 75,000 33,075 1.59 Brunei Brunei LNG 26-Jun-11 Bilis 77,731 34,279 1.65 Brunei Brunei LNG 30-Jun-11 Bekulan 75,072 33,107 1.59 Brunei Brunei LNG Totals For June 2011 843,472 40.55
01-Jul-11 Arkat 147,000 64,827 3.12 Brunei Brunei LNG 02-Jul-11 Energy Navigator 147,000 64,827 3.12 Russia Tokyo Gas 05-Jul-11 Abadi 136,912 60,378 2.90 Brunei Brunei LNG 06-Jul-11 Polar Spirit 88,996 39,247 1.89 USA ConocoPhillips/Marathon 09-Jul-11 Puteri Firus Satu 137,489 60,633 2.91 Malaysia Malaysia LNG 09-Jul-11 Belanak 75,000 33,075 1.59 Brunei Brunei LNG 10-Jul-11 Bilis 77,731 34,279 1.65 Brunei Brunei LNG 12-Jul-11 Bebatik 75,056 33,100 1.59 Brunei Brunei LNG 14-Jul-11 Bekulan 75,072 33,107 1.59 Brunei Brunei LNG 16-Jul-11 Arkat 147,000 64,827 3.12 Brunei Brunei LNG 18-Jul-11 Puteri Zamrud Satu 138,000 60,858 2.93 Malaysia Malaysia LNG 22-Jul-11 Energy Progress 147,558 65,073 3.13 Australia Tokyo Gas 23-Jul-11 Belanak 75,000 33,075 1.59 Brunei Brunei LNG 25-Jul-11 Bilis 77,731 34,279 1.65 Brunei Brunei LNG 26-Jul-11 Bebatik 75,056 33,100 1.59 Brunei Brunei LNG 28-Jul-11 Puteri Mutiara Satu 138,000 60,858 2.93 Malaysia Malaysia LNG 29-Jul-11 Tenaga Lima 130,000 57,330 2.76 Malaysia Malaysia LNG 29-Jul-11 Bekulan 75,072 33,107 1.59 Brunei Brunei LNG Totals For July 2011 865,980 41.63

188
Asian LNG IMPORTS Some of the data below is unconfirmed and forward schedules are considered incomplete data. Date Vessel Name CBM Volume (mt) Volume (Bcf) Source Participants Sodegaura, Japan (Continued...)
01-Aug-11 Arkat 147,000 64,827 3.12 Brunei Brunei LNG 03-Aug-11 Seri Alam 145,000 63,945 3.07 Malaysia Malaysia LNG 06-Aug-11 LNG Vesta 127,547 56,248 2.70 Malaysia Tokyo Gas 06-Aug-11 Abadi 136,912 60,378 2.90 Brunei Brunei LNG 07-Aug-11 Bubuk 77,679 34,256 1.65 Brunei Brunei LNG 09-Aug-11 Energy Progress 147,558 65,073 3.13 Australia Tokyo Gas 09-Aug-11 Belanak 75,000 33,075 1.59 Brunei Brunei LNG 11-Aug-11 Bilis 77,731 34,279 1.65 Brunei Brunei LNG 12-Aug-11 Energy Navigator 147,000 64,827 3.12 Russia Tokyo Gas 13-Aug-11 Bebatik 75,056 33,100 1.59 Brunei Brunei LNG 14-Aug-11 Polar Spirit 88,996 39,247 1.89 USA ConocoPhillips/Marathon 15-Aug-11 Cygnus Passage 145,000 63,945 3.07 Russia Tokyo Electric 17-Aug-11 Arkat 147,000 64,827 3.12 Brunei Brunei LNG 19-Aug-11 Puteri Intan Satu 137,489 60,633 2.91 Malaysia Malaysia LNG 23-Aug-11 Abadi 136,912 60,378 2.90 Brunei Brunei LNG 24-Aug-11 Puteri Firus Satu 137,489 60,633 2.91 Malaysia Malaysia LNG 25-Aug-11 Bubuk 77,679 34,256 1.65 Brunei Brunei LNG Totals For August 2011 893,927 42.97
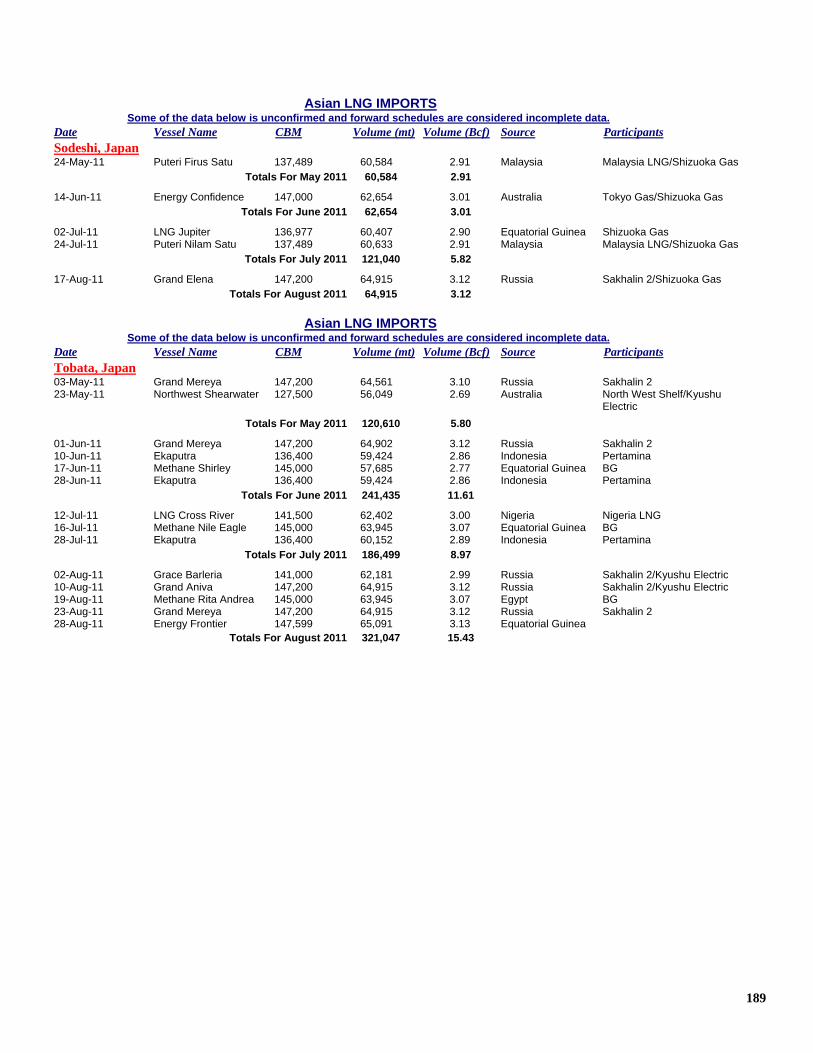
189
Asian LNG IMPORTS Some of the data below is unconfirmed and forward schedules are considered incomplete data. Date Vessel Name CBM Volume (mt) Volume (Bcf) Source Participants Sodeshi, Japan 24-May-11 Puteri Firus Satu 137,489 60,584 2.91 Malaysia Malaysia LNG/Shizuoka Gas Totals For May 2011 60,584 2.91
14-Jun-11 Energy Confidence 147,000 62,654 3.01 Australia Tokyo Gas/Shizuoka Gas Totals For June 2011 62,654 3.01
02-Jul-11 LNG Jupiter 136,977 60,407 2.90 Equatorial Guinea Shizuoka Gas 24-Jul-11 Puteri Nilam Satu 137,489 60,633 2.91 Malaysia Malaysia LNG/Shizuoka Gas Totals For July 2011 121,040 5.82
17-Aug-11 Grand Elena 147,200 64,915 3.12 Russia Sakhalin 2/Shizuoka Gas Totals For August 2011 64,915 3.12 Asian LNG IMPORTS Some of the data below is unconfirmed and forward schedules are considered incomplete data. Date Vessel Name CBM Volume (mt) Volume (Bcf) Source Participants Tobata, Japan 03-May-11 Grand Mereya 147,200 64,561 3.10 Russia Sakhalin 2 23-May-11 Northwest Shearwater 127,500 56,049 2.69 Australia North West Shelf/Kyushu Electric
Totals For May 2011 120,610 5.80
01-Jun-11 Grand Mereya 147,200 64,902 3.12 Russia Sakhalin 2 10-Jun-11 Ekaputra 136,400 59,424 2.86 Indonesia Pertamina 17-Jun-11 Methane Shirley 145,000 57,685 2.77 Equatorial Guinea BG 28-Jun-11 Ekaputra 136,400 59,424 2.86 Indonesia Pertamina Totals For June 2011 241,435 11.61
12-Jul-11 LNG Cross River 141,500 62,402 3.00 Nigeria Nigeria LNG 16-Jul-11 Methane Nile Eagle 145,000 63,945 3.07 Equatorial Guinea BG 28-Jul-11 Ekaputra 136,400 60,152 2.89 Indonesia Pertamina Totals For July 2011 186,499 8.97
02-Aug-11 Grace Barleria 141,000 62,181 2.99 Russia Sakhalin 2/Kyushu Electric 10-Aug-11 Grand Aniva 147,200 64,915 3.12 Russia Sakhalin 2/Kyushu Electric 19-Aug-11 Methane Rita Andrea 145,000 63,945 3.07 Egypt BG 23-Aug-11 Grand Mereya 147,200 64,915 3.12 Russia Sakhalin 2 28-Aug-11 Energy Frontier 147,599 65,091 3.13 Equatorial Guinea Totals For August 2011 321,047 15.43

190
Asian LNG IMPORTS Some of the data below is unconfirmed and forward schedules are considered incomplete data. Date Vessel Name CBM Volume (mt) Volume (Bcf) Source Participants Yanai, Japan 23-Jun-11 Nizwa LNG 145,000 63,718 3.06 Oman Qman LNG/Itochu/Chugoku Electric
Totals For June 2011 63,718 3.06
11-Jul-11 Northwest Swan 140,500 61,960 2.98 Australia North West Shelf/Chugoku Electric 21-Jul-11 Northwest Sanderling 125,452 55,324 2.66 Australia North West Shelf/Chugoku Electric 26-Jul-11 Nizwa LNG 145,000 63,945 3.07 Oman Qman LNG/Itochu/Chugoku Electric
Totals For July 2011 181,229 8.71 18-Aug-11 Northwest Snipe 127,747 56,336 2.71 Australia North West Shelf/Chugoku Electric 21-Aug-11 Al Khor 137,354 60,573 2.91 Qatar Qatargas/Chugoku Electric Totals For August 2011 116,909 5.62 Asian LNG IMPORTS Some of the data below is unconfirmed and forward schedules are considered incomplete data. Date Vessel Name CBM Volume (mt) Volume (Bcf) Source Participants Yokkaichi/Kawagoe, Japan 07-May-11 Senshu Maru 127,167 55,873 2.69 Indonesia Pertamina 10-May-11 Al Rayyan 137,420 60,166 2.89 Qatar Qatargas/Chubu Electric 16-May-11 Grace Barleria 141,000 62,453 3.00 Russia Sakhalin 2/Chubu Electric 21-May-11 Ekaputra 136,400 59,930 2.88 Indonesia Pertamina 26-May-11 Grand Aniva 147,200 65,199 3.13 Russia Sakhalin 2/Chubu Electric 31-May-11 Northwest Sandpiper 125,500 53,490 2.57 Australia North West Shelf Totals For May 2011 357,111 17.17
01-Jun-11 Valencia Knutsen 173,000 77,097 3.71 Peru RepsolYPF/Chubu Electric 03-Jun-11 Al Wajbah 137,308 60,553 2.91 Qatar Qatargas 08-Jun-11 Senshu Maru 127,167 55,402 2.66 Indonesia Pertamina 12-Jun-11 Seri Balhaf 152,000 65,308 3.14 Yemen Yemen LNG/Chubu Electric 17-Jun-11 Al Ghashamiya 216,000 68,355 3.29 Qatar Chubu Electric 26-Jun-11 Al Wakrah 137,568 60,667 2.92 Qatar Qatargas 27-Jun-11 LNG Ondo 140,500 58,980 2.84 Nigeria Nigeria LNG/Chubu Electric Totals For June 2011 446,362 21.46
02-Jul-11 Broog 137,529 60,650 2.92 Qatar Qatargas 08-Jul-11 Duhail 210,100 92,654 4.45 Qatar Chubu Electric 12-Jul-11 Ekaputra 136,400 60,152 2.89 Indonesia Pertamina 16-Jul-11 Zekreet 137,482 60,630 2.91 Qatar Qatargas 18-Jul-11 Northwest Sandpiper 125,500 55,346 2.66 Australia North West Shelf 22-Jul-11 Al Khor 137,354 60,573 2.91 Qatar Qatargas/Chubu Electric 27-Jul-11 Al Khattiya 209,200 92,257 4.44 Qatar Totals For July 2011 482,262 23.18
01-Aug-11 Al Bidda 137,339 60,566 2.91 Qatar Qatargas 06-Aug-11 Al Ghariya 210,100 92,654 4.45 Qatar 07-Aug-11 Dwiputra 127,386 56,177 2.70 Indonesia Pertamina 15-Aug-11 LNG Imo 138,000 60,858 2.93 Nigeria Nigeria LNG/Chubu Electric 19-Aug-11 Zekreet 137,482 60,630 2.91 Qatar Qatargas 21-Aug-11 Al Gattara 215,000 94,815 4.56 Qatar Qatargas/Chubu Electric Totals For August 2011 425,700 20.47

191
Waterborne Energy, Inc.
2323 S. Shepherd Dr. Suite 1010 Houston, Texas
77019 713/526-1555 www.waterbornelng.com
26 Aug 2011
Vol. 8, Week 33
South Korea

192
Asian LNG IMPORTS Some of the data below is unconfirmed and forward schedules are considered incomplete data. Date Vessel Name CBM Volume (mt) Volume (Bcf) Source Participants Gwangyang, South Korea 12-May-11 Excalibur 138,000 53,223 2.56 US Re-export Excelerate/K-Power 22-May-11 Tangguh Batur 145,700 64,254 3.09 Indonesia Pertamina/BP 25-May-11 Tangguh Sago 155,000 68,355 3.29 Indonesia Tangguh/BP Totals For May 2011 185,832 8.93
20-Jun-11 Tangguh Towuti 145,700 64,254 3.09 Indonesia Tangguh/BP Totals For June 2011 64,254 3.09
05-Jul-11 Tangguh Hiri 155,000 68,355 3.29 Indonesia Tangguh/Kogas 17-Jul-11 Tangguh Towuti 145,700 64,254 3.09 Indonesia Tangguh/BP Totals For July 2011 132,609 6.38
04-Aug-11 Tangguh Hiri 155,000 68,355 3.29 Indonesia Tangguh/Kogas 26-Aug-11 Tangguh Palung 155,000 68,355 3.29 Indonesia Tangguh/BP Totals For August 2011 136,710 6.57

193
Asian LNG IMPORTS Some of the data below is unconfirmed and forward schedules are considered incomplete data. Date Vessel Name CBM Volume (mt) Volume (Bcf) Source Participants Incheon, South Korea 01-May-11 SK Summit 135,230 59,636 2.87 Qatar Kogas 02-May-11 Puteri Delima Satu 137,489 60,633 2.91 Malaysia Malaysia LNG/Kogas 02-May-11 Sevilla Knutsen 173,000 70,898 3.41 Peru RepsolYPF/Kogas 03-May-11 Hyundai Cosmopia 137,415 60,600 2.91 Qatar Kogas 04-May-11 K.Mugungwha 151,800 64,406 3.10 Yemen Kogas 07-May-11 SK Splendor 138,370 60,792 2.92 Oman Kogas 10-May-11 Hanjin Ras Laffan 138,214 60,952 2.93 Qatar Kogas 10-May-11 Fraiha 210,100 92,654 4.45 Qatar Kogas 11-May-11 British Sapphire 155,000 60,858 2.93 Trinidad BP/Kogas 12-May-11 Hyundai Greenpia 125,000 55,125 2.65 Malaysia Kogas 16-May-11 Hanjin Pyeong Taek 138,366 61,019 2.93 Indonesia Kogas 20-May-11 Umm Al Amad 210,100 84,849 4.08 Qatar Kogas 25-May-11 SK Stellar 138,395 61,032 2.93 Qatar Kogas Totals For May 2011 853,454 41.03
04-Jun-11 British Emerald 155,000 52,768 2.54 Trinidad BP/Kogas 05-Jun-11 Woodside Donaldson 165,500 72,986 3.51 Equatorial Guinea Kogas 07-Jun-11 Abdelkader 177,000 58,000 2.79 Indonesia Kogas 08-Jun-11 SK Splendor 138,370 60,792 2.92 Oman Kogas 10-Jun-11 Y.K.Sovereign 127,125 58,915 2.83 Malaysia Kogas 16-Jun-11 Hyundai Aquapia 137,415 60,600 2.91 Indonesia Kogas 21-Jun-11 Abdelkader 177,000 58,000 2.79 Indonesia Kogas 22-Jun-11 SK Sunrise 138,270 59,913 2.88 Qatar Kogas 23-Jun-11 GDF Suez Point Fortin 154,200 68,002 3.27 Yemen GDF Suez/Kogas 28-Jun-11 SK Stellar 138,395 59,967 2.88 Qatar Kogas 30-Jun-11 STX Kolt 145,700 64,254 3.09 Yemen Kogas Totals For June 2011 674,197 32.41
03-Jul-11 Methane Becki Anne 170,000 54,799 2.63 Trinidad BG/Kogas 06-Jul-11 K.Acacia 138,017 60,865 2.93 Oman Kogas 09-Jul-11 Hyundai Ecopia 145,000 63,945 3.07 Yemen Kogas 14-Jul-11 Hanjin Ras Laffan 138,214 60,952 2.93 Qatar Kogas 16-Jul-11 K.Jasmine 145,700 63,534 3.05 Russia Kogas 20-Jul-11 Abdelkader 177,000 58,000 2.79 Indonesia Kogas 23-Jul-11 Hyundai Technopia 137,415 60,600 2.91 Qatar Kogas 23-Jul-11 Hyundai Aquapia 137,415 60,600 2.91 Indonesia Kogas 25-Jul-11 Y.K.Sovereign 127,125 56,423 2.71 Malaysia Kogas Totals For July 2011 539,718 25.95
03-Aug-11 Abdelkader 177,000 58,000 2.79 Indonesia Kogas 04-Aug-11 Golar Arctic 140,500 60,858 2.93 Trinidad BP/Kogas 05-Aug-11 Hyundai Greenpia 125,000 36,156 1.74 Malaysia Kogas 09-Aug-11 K.Acacia 138,017 60,865 2.93 Oman Kogas 09-Aug-11 Hanjin Pyeong Taek 138,366 61,019 2.93 Indonesia Kogas 10-Aug-11 SK Summit 135,230 59,636 2.87 Qatar Kogas 13-Aug-11 Fraiha 210,100 92,654 4.45 Qatar Kogas 15-Aug-11 Tangguh Sago 155,000 68,355 3.29 Indonesia Tangguh/BP 18-Aug-11 Hanjin Ras Laffan 138,214 60,952 2.93 Qatar Kogas 20-Aug-11 Puteri Nilam Satu 137,489 60,633 2.91 Malaysia Malaysia LNG/Kogas 21-Aug-11 Neo Energy 146,735 64,710 3.11 Yemen Kogas 23-Aug-11 K.Freesia 138,015 60,865 2.93 Qatar Kogas 24-Aug-11 Umm Al Amad 210,100 92,654 4.45 Qatar Kogas 27-Aug-11 Hanjin Pyeong Taek 138,366 61,019 2.93 Indonesia Kogas Totals For August 2011 898,376 43.19
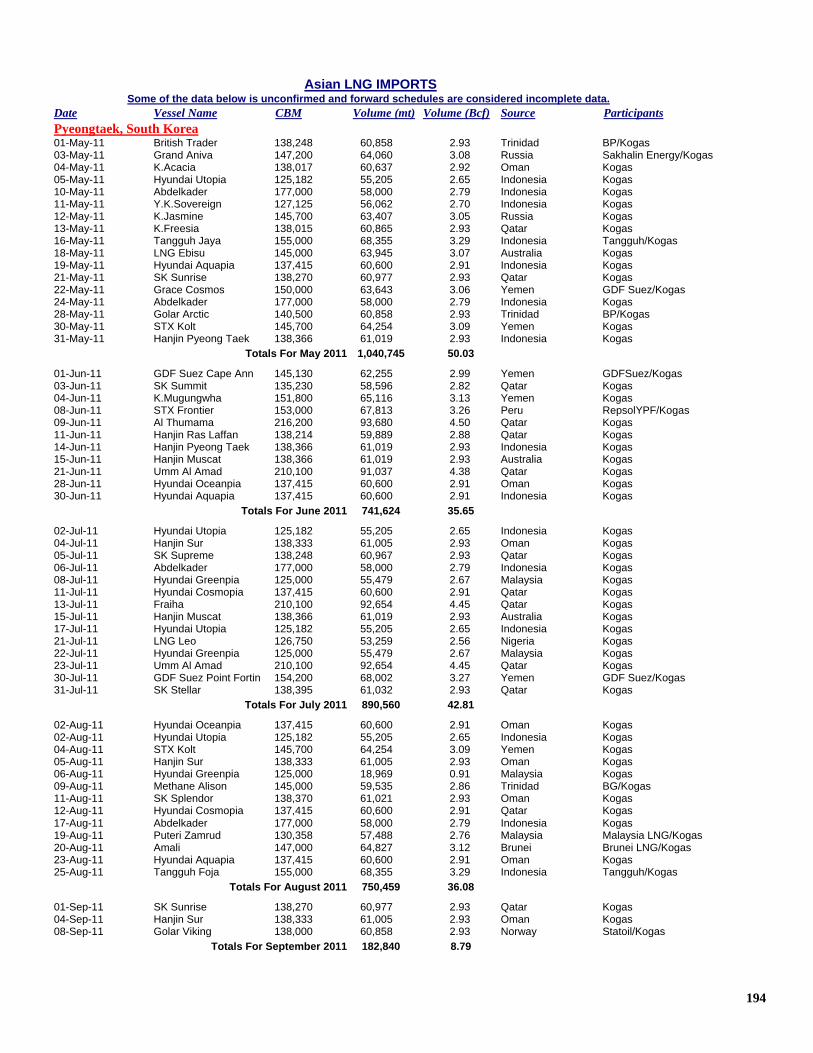
194
Asian LNG IMPORTS Some of the data below is unconfirmed and forward schedules are considered incomplete data. Date Vessel Name CBM Volume (mt) Volume (Bcf) Source Participants Pyeongtaek, South Korea 01-May-11 British Trader 138,248 60,858 2.93 Trinidad BP/Kogas 03-May-11 Grand Aniva 147,200 64,060 3.08 Russia Sakhalin Energy/Kogas 04-May-11 K.Acacia 138,017 60,637 2.92 Oman Kogas 05-May-11 Hyundai Utopia 125,182 55,205 2.65 Indonesia Kogas 10-May-11 Abdelkader 177,000 58,000 2.79 Indonesia Kogas 11-May-11 Y.K.Sovereign 127,125 56,062 2.70 Indonesia Kogas 12-May-11 K.Jasmine 145,700 63,407 3.05 Russia Kogas 13-May-11 K.Freesia 138,015 60,865 2.93 Qatar Kogas 16-May-11 Tangguh Jaya 155,000 68,355 3.29 Indonesia Tangguh/Kogas 18-May-11 LNG Ebisu 145,000 63,945 3.07 Australia Kogas 19-May-11 Hyundai Aquapia 137,415 60,600 2.91 Indonesia Kogas 21-May-11 SK Sunrise 138,270 60,977 2.93 Qatar Kogas 22-May-11 Grace Cosmos 150,000 63,643 3.06 Yemen GDF Suez/Kogas 24-May-11 Abdelkader 177,000 58,000 2.79 Indonesia Kogas 28-May-11 Golar Arctic 140,500 60,858 2.93 Trinidad BP/Kogas 30-May-11 STX Kolt 145,700 64,254 3.09 Yemen Kogas 31-May-11 Hanjin Pyeong Taek 138,366 61,019 2.93 Indonesia Kogas Totals For May 2011 1,040,745 50.03
01-Jun-11 GDF Suez Cape Ann 145,130 62,255 2.99 Yemen GDFSuez/Kogas 03-Jun-11 SK Summit 135,230 58,596 2.82 Qatar Kogas 04-Jun-11 K.Mugungwha 151,800 65,116 3.13 Yemen Kogas 08-Jun-11 STX Frontier 153,000 67,813 3.26 Peru RepsolYPF/Kogas 09-Jun-11 Al Thumama 216,200 93,680 4.50 Qatar Kogas 11-Jun-11 Hanjin Ras Laffan 138,214 59,889 2.88 Qatar Kogas 14-Jun-11 Hanjin Pyeong Taek 138,366 61,019 2.93 Indonesia Kogas 15-Jun-11 Hanjin Muscat 138,366 61,019 2.93 Australia Kogas 21-Jun-11 Umm Al Amad 210,100 91,037 4.38 Qatar Kogas 28-Jun-11 Hyundai Oceanpia 137,415 60,600 2.91 Oman Kogas 30-Jun-11 Hyundai Aquapia 137,415 60,600 2.91 Indonesia Kogas Totals For June 2011 741,624 35.65
02-Jul-11 Hyundai Utopia 125,182 55,205 2.65 Indonesia Kogas 04-Jul-11 Hanjin Sur 138,333 61,005 2.93 Oman Kogas 05-Jul-11 SK Supreme 138,248 60,967 2.93 Qatar Kogas 06-Jul-11 Abdelkader 177,000 58,000 2.79 Indonesia Kogas 08-Jul-11 Hyundai Greenpia 125,000 55,479 2.67 Malaysia Kogas 11-Jul-11 Hyundai Cosmopia 137,415 60,600 2.91 Qatar Kogas 13-Jul-11 Fraiha 210,100 92,654 4.45 Qatar Kogas 15-Jul-11 Hanjin Muscat 138,366 61,019 2.93 Australia Kogas 17-Jul-11 Hyundai Utopia 125,182 55,205 2.65 Indonesia Kogas 21-Jul-11 LNG Leo 126,750 53,259 2.56 Nigeria Kogas 22-Jul-11 Hyundai Greenpia 125,000 55,479 2.67 Malaysia Kogas 23-Jul-11 Umm Al Amad 210,100 92,654 4.45 Qatar Kogas 30-Jul-11 GDF Suez Point Fortin 154,200 68,002 3.27 Yemen GDF Suez/Kogas 31-Jul-11 SK Stellar 138,395 61,032 2.93 Qatar Kogas Totals For July 2011 890,560 42.81
02-Aug-11 Hyundai Oceanpia 137,415 60,600 2.91 Oman Kogas 02-Aug-11 Hyundai Utopia 125,182 55,205 2.65 Indonesia Kogas 04-Aug-11 STX Kolt 145,700 64,254 3.09 Yemen Kogas 05-Aug-11 Hanjin Sur 138,333 61,005 2.93 Oman Kogas 06-Aug-11 Hyundai Greenpia 125,000 18,969 0.91 Malaysia Kogas 09-Aug-11 Methane Alison 145,000 59,535 2.86 Trinidad BG/Kogas 11-Aug-11 SK Splendor 138,370 61,021 2.93 Oman Kogas 12-Aug-11 Hyundai Cosmopia 137,415 60,600 2.91 Qatar Kogas 17-Aug-11 Abdelkader 177,000 58,000 2.79 Indonesia Kogas 19-Aug-11 Puteri Zamrud 130,358 57,488 2.76 Malaysia Malaysia LNG/Kogas 20-Aug-11 Amali 147,000 64,827 3.12 Brunei Brunei LNG/Kogas 23-Aug-11 Hyundai Aquapia 137,415 60,600 2.91 Oman Kogas 25-Aug-11 Tangguh Foja 155,000 68,355 3.29 Indonesia Tangguh/Kogas Totals For August 2011 750,459 36.08
01-Sep-11 SK Sunrise 138,270 60,977 2.93 Qatar Kogas 04-Sep-11 Hanjin Sur 138,333 61,005 2.93 Oman Kogas 08-Sep-11 Golar Viking 138,000 60,858 2.93 Norway Statoil/Kogas Totals For September 2011 182,840 8.79
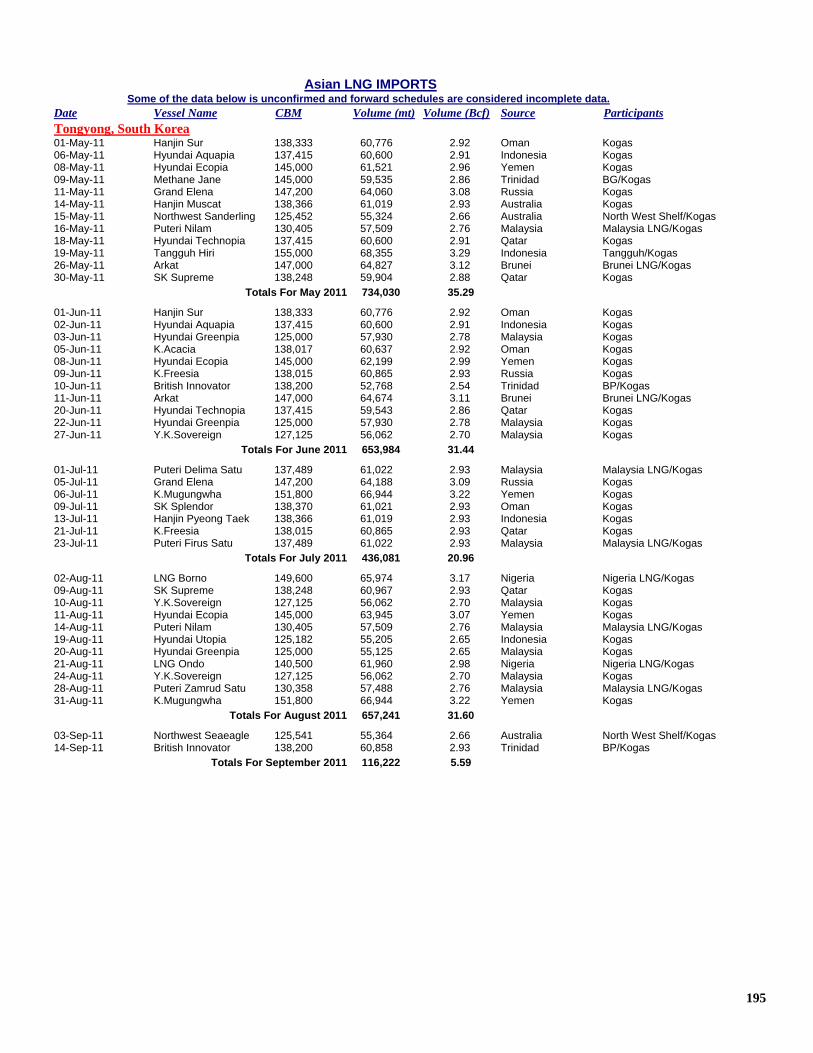
195
Asian LNG IMPORTS Some of the data below is unconfirmed and forward schedules are considered incomplete data. Date Vessel Name CBM Volume (mt) Volume (Bcf) Source Participants Tongyong, South Korea 01-May-11 Hanjin Sur 138,333 60,776 2.92 Oman Kogas 06-May-11 Hyundai Aquapia 137,415 60,600 2.91 Indonesia Kogas 08-May-11 Hyundai Ecopia 145,000 61,521 2.96 Yemen Kogas 09-May-11 Methane Jane 145,000 59,535 2.86 Trinidad BG/Kogas 11-May-11 Grand Elena 147,200 64,060 3.08 Russia Kogas 14-May-11 Hanjin Muscat 138,366 61,019 2.93 Australia Kogas 15-May-11 Northwest Sanderling 125,452 55,324 2.66 Australia North West Shelf/Kogas 16-May-11 Puteri Nilam 130,405 57,509 2.76 Malaysia Malaysia LNG/Kogas 18-May-11 Hyundai Technopia 137,415 60,600 2.91 Qatar Kogas 19-May-11 Tangguh Hiri 155,000 68,355 3.29 Indonesia Tangguh/Kogas 26-May-11 Arkat 147,000 64,827 3.12 Brunei Brunei LNG/Kogas 30-May-11 SK Supreme 138,248 59,904 2.88 Qatar Kogas Totals For May 2011 734,030 35.29
01-Jun-11 Hanjin Sur 138,333 60,776 2.92 Oman Kogas 02-Jun-11 Hyundai Aquapia 137,415 60,600 2.91 Indonesia Kogas 03-Jun-11 Hyundai Greenpia 125,000 57,930 2.78 Malaysia Kogas 05-Jun-11 K.Acacia 138,017 60,637 2.92 Oman Kogas 08-Jun-11 Hyundai Ecopia 145,000 62,199 2.99 Yemen Kogas 09-Jun-11 K.Freesia 138,015 60,865 2.93 Russia Kogas 10-Jun-11 British Innovator 138,200 52,768 2.54 Trinidad BP/Kogas 11-Jun-11 Arkat 147,000 64,674 3.11 Brunei Brunei LNG/Kogas 20-Jun-11 Hyundai Technopia 137,415 59,543 2.86 Qatar Kogas 22-Jun-11 Hyundai Greenpia 125,000 57,930 2.78 Malaysia Kogas 27-Jun-11 Y.K.Sovereign 127,125 56,062 2.70 Malaysia Kogas Totals For June 2011 653,984 31.44
01-Jul-11 Puteri Delima Satu 137,489 61,022 2.93 Malaysia Malaysia LNG/Kogas 05-Jul-11 Grand Elena 147,200 64,188 3.09 Russia Kogas 06-Jul-11 K.Mugungwha 151,800 66,944 3.22 Yemen Kogas 09-Jul-11 SK Splendor 138,370 61,021 2.93 Oman Kogas 13-Jul-11 Hanjin Pyeong Taek 138,366 61,019 2.93 Indonesia Kogas 21-Jul-11 K.Freesia 138,015 60,865 2.93 Qatar Kogas 23-Jul-11 Puteri Firus Satu 137,489 61,022 2.93 Malaysia Malaysia LNG/Kogas Totals For July 2011 436,081 20.96
02-Aug-11 LNG Borno 149,600 65,974 3.17 Nigeria Nigeria LNG/Kogas 09-Aug-11 SK Supreme 138,248 60,967 2.93 Qatar Kogas 10-Aug-11 Y.K.Sovereign 127,125 56,062 2.70 Malaysia Kogas 11-Aug-11 Hyundai Ecopia 145,000 63,945 3.07 Yemen Kogas 14-Aug-11 Puteri Nilam 130,405 57,509 2.76 Malaysia Malaysia LNG/Kogas 19-Aug-11 Hyundai Utopia 125,182 55,205 2.65 Indonesia Kogas 20-Aug-11 Hyundai Greenpia 125,000 55,125 2.65 Malaysia Kogas 21-Aug-11 LNG Ondo 140,500 61,960 2.98 Nigeria Nigeria LNG/Kogas 24-Aug-11 Y.K.Sovereign 127,125 56,062 2.70 Malaysia Kogas 28-Aug-11 Puteri Zamrud Satu 130,358 57,488 2.76 Malaysia Malaysia LNG/Kogas 31-Aug-11 K.Mugungwha 151,800 66,944 3.22 Yemen Kogas Totals For August 2011 657,241 31.60
03-Sep-11 Northwest Seaeagle 125,541 55,364 2.66 Australia North West Shelf/Kogas 14-Sep-11 British Innovator 138,200 60,858 2.93 Trinidad BP/Kogas Totals For September 2011 116,222 5.59

196
Waterborne Energy, Inc.
2323 S. Shepherd Dr. Suite 1010 Houston, Texas
77019 713/526-1555 www.waterbornelng.com
26 Aug 2011
Vol. 8, Week 33
Taiwan

197
Asian LNG IMPORTS Some of the data below is unconfirmed and forward schedules are considered incomplete data. Date Vessel Name CBM Volume (mt) Volume (Bcf) Source Participants Kaohsiung, Taiwan 03-May-11 Golar Mazo 135,225 61,428 2.95 Indonesia Pertamina/CPC 05-May-11 Puteri Zamrud 130,358 56,760 2.73 Malaysia Malaysia LNG/CPC 08-May-11 Gaslog Savannah 155,000 63,008 3.03 Equatorial Guinea BG/CPC 10-May-11 Puteri Delima 130,405 56,780 2.73 Malaysia Malaysia LNG/CPC 13-May-11 Golar Mazo 135,225 61,428 2.95 Indonesia Pertamina/CPC 18-May-11 Simaisma 145,700 63,532 3.05 Qatar Rasgas/CPC 18-May-11 British Diamond 155,000 62,800 3.02 Australia BP/CPC 20-May-11 Puteri Firus 130,358 56,760 2.73 Malaysia Malaysia LNG/CPC 23-May-11 Golar Mazo 135,225 61,428 2.95 Indonesia Pertamina/CPC 26-May-11 Puteri Nilam 130,405 56,780 2.73 Malaysia Malaysia LNG/CPC 27-May-11 K.Freesia 138,015 59,420 2.86 Russia CPC 30-May-11 Grand Elena 147,200 63,374 3.05 Russia Sakhalin-2/CPC Totals For May 2011 723,498 34.78
01-Jun-11 Golar Mazo 135,225 61,550 2.96 Indonesia Pertamina/CPC 03-Jun-11 Puteri Mutiara Satu 138,000 61,214 2.94 Malaysia Malaysia LNG/CPC 08-Jun-11 Seri Begawan 152,300 61,208 2.94 Egypt BG/CPC 10-Jun-11 Puteri Zamrud Satu 138,000 61,214 2.94 Malaysia Malaysia LNG/CPC 11-Jun-11 Puteri Firus Satu 137,489 60,988 2.93 Malaysia Malaysia LNG/CPC 12-Jun-11 Golar Mazo 135,225 61,550 2.96 Indonesia Pertamina/CPC 16-Jun-11 Puteri Firus 130,358 57,824 2.78 Malaysia Malaysia LNG/CPC 18-Jun-11 Trinity Arrow 154,000 59,988 2.88 Peru RepsolYPF/CPC 21-Jun-11 Golar Mazo 135,225 61,550 2.96 Indonesia Pertamina/CPC 23-Jun-11 Al Deebel 145,000 63,500 3.05 Qatar Rasgas/CPC 25-Jun-11 Puteri Nilam Satu 137,489 60,988 2.93 Malaysia Malaysia LNG/CPC 27-Jun-11 LNG Oyo 145,000 60,200 2.89 Nigeria Nigeria LNG/CPC 30-Jun-11 Golar Mazo 135,225 61,550 2.96 Indonesia Pertamina/CPC Totals For June 2011 793,324 38.14
03-Jul-11 Seri Bakti 145,000 63,945 3.07 Egypt CPC 04-Jul-11 Puteri Delima 130,405 57,509 2.76 Malaysia Malaysia LNG/CPC 06-Jul-11 British Diamond 155,000 68,355 3.29 Nigeria BP/CPC 08-Jul-11 Al Jassasiya 145,700 64,254 3.09 Qatar Rasgas/CPC 09-Jul-11 Methane Rita Andrea 145,000 63,945 3.07 Equatorial Guinea BG/CPC 12-Jul-11 Golar Mazo 135,225 59,634 2.87 Indonesia Pertamina/CPC 13-Jul-11 Neo Energy 146,735 64,710 3.11 Egypt BG/CPC 14-Jul-11 Puteri Mutiara Satu 138,000 60,858 2.93 Malaysia Malaysia LNG/CPC 16-Jul-11 Puteri Intan 130,405 57,509 2.76 Malaysia Malaysia LNG/CPC 21-Jul-11 Al Deebel 145,000 63,945 3.07 Qatar Rasgas/CPC 22-Jul-11 Golar Mazo 135,225 59,634 2.87 Indonesia Pertamina/CPC 25-Jul-11 Seri Balhaf 152,000 67,032 3.22 Yemen Yemen LNG/CPC 26-Jul-11 LNG Benue 145,000 63,945 3.07 Nigeria Nigeria LNG/CPC 28-Jul-11 Puteri Nilam 130,405 57,509 2.76 Malaysia Malaysia LNG/CPC 31-Jul-11 Golar Mazo 135,225 59,634 2.87 Indonesia Pertamina/CPC Totals For July 2011 932,418 44.83
01-Aug-11 Maersk Qatar 145,000 63,945 3.07 Qatar Rasgas/CPC 02-Aug-11 Seri Begawan 152,300 67,164 3.23 Equatorial Guinea CPC 06-Aug-11 LNG Ogun 145,000 63,945 3.07 Nigeria Nigeria LNG/CPC 08-Aug-11 Puteri Nilam Satu 137,489 60,633 2.91 Malaysia Malaysia LNG/CPC 10-Aug-11 Al Thakhira 145,000 63,945 3.07 Qatar Rasgas/CPC 11-Aug-11 Golar Mazo 135,225 59,634 2.87 Indonesia Pertamina/CPC 15-Aug-11 Grace Acacia 141,000 62,181 2.99 Qatar Rasgas/CPC 15-Aug-11 Puteri Delima Satu 137,489 60,633 2.91 Malaysia Malaysia LNG/CPC 16-Aug-11 LNG Lokoja 144,000 63,504 3.05 Nigeria Nigeria LNG/CPC 20-Aug-11 Seri Bakti 145,000 63,945 3.07 Equatorial Guinea BG/CPC 23-Aug-11 Tangguh Towuti 145,700 64,254 3.09 Indonesia Tangguh/CPC 24-Aug-11 Puteri Delima Satu 137,489 60,633 2.91 Malaysia Malaysia LNG/CPC 26-Aug-11 Puteri Intan 130,405 57,509 2.76 Malaysia Malaysia LNG/CPC 27-Aug-11 Golar Mazo 135,225 59,634 2.87 Indonesia Pertamina/CPC 29-Aug-11 Maersk Qatar 145,000 63,945 3.07 Qatar Rasgas/CPC Totals For August 2011 935,504 44.97
03-Sep-11 Methane Mickie Harper 170,000 74,970 3.60 Egypt BG/CPC Totals For September 2011 74,970 3.60

198
Asian LNG IMPORTS Some of the data below is unconfirmed and forward schedules are considered incomplete data. Date Vessel Name CBM Volume (mt) Volume (Bcf) Source Participants Taichung, Taiwan 03-May-11 Taitar No. 2 145,000 63,532 3.05 Qatar CPC 12-May-11 Taitar No. 3 145,000 63,532 3.05 Qatar CPC 17-May-11 Taitar No. 4 145,000 63,532 3.05 Qatar CPC 23-May-11 Taitar No. 1 145,000 63,532 3.05 Qatar CPC 30-May-11 Taitar No. 2 145,000 63,945 3.07 Qatar CPC Totals For May 2011 318,073 15.29
09-Jun-11 Taitar No. 3 145,000 63,500 3.05 Qatar CPC 13-Jun-11 Taitar No. 4 145,000 63,500 3.05 Qatar CPC 19-Jun-11 Taitar No. 1 145,000 63,500 3.05 Qatar CPC 28-Jun-11 Taitar No. 2 145,000 63,500 3.05 Qatar CPC Totals For June 2011 254,000 12.21
07-Jul-11 Taitar No. 3 145,000 63,945 3.07 Qatar CPC 10-Jul-11 Taitar No. 4 145,000 63,945 3.07 Qatar CPC 18-Jul-11 Taitar No. 1 145,000 63,945 3.07 Qatar CPC 25-Jul-11 Taitar No. 2 145,000 63,945 3.07 Qatar CPC Totals For July 2011 255,780 12.30
03-Aug-11 Taitar No. 3 145,000 63,945 3.07 Qatar CPC 08-Aug-11 Taitar No. 4 145,000 63,945 3.07 Qatar CPC 14-Aug-11 Taitar No. 1 145,000 63,945 3.07 Qatar CPC 20-Aug-11 Taitar No. 2 145,000 63,945 3.07 Qatar CPC 22-Aug-11 Fuwairit 138,200 60,946 2.93 Qatar Rasgas/CPC 30-Aug-11 Taitar No. 3 145,000 63,945 3.07 Qatar CPC Totals For August 2011 380,671 18.30
03-Sep-11 Taitar No. 4 145,000 63,945 3.07 Qatar CPC Totals For September 2011 63,945 3.07
199
Waterborne Energy, Inc.
2323 S. Shepherd Dr. Suite 1010 Houston, Texas
77019 713/526-1555 www.waterbornelng.com
26 Aug 2011
Vol. 8, Week 33
Kuwait

200
Asian LNG IMPORTS Some of the data below is unconfirmed and forward schedules are considered incomplete data. Date Vessel Name CBM Volume (mt) Volume (Bcf) Source Participants Mina Al Ahmadi, Kuwait 04-May-11 LNG Akwa Ibom 141,000 62,181 2.99 Nigeria Nigeria LNG/KPC 09-May-11 Arctic Princess 145,000 63,945 3.07 Malaysia Petronas/KPC 15-May-11 Methane Alison 145,000 63,945 3.07 Malaysia BG/KPC 19-May-11 Excelsior 138,000 60,858 2.93 Nigeria Excelerate/KPC 27-May-11 Expedient 150,900 66,547 3.20 Qatar Qatargas 4/Shell/KPC Totals For May 2011 317,476 15.26
01-Jun-11 LNG Imo 138,000 49,923 2.40 Nigeria Nigeria LNG/KPC 04-Jun-11 Gallina 137,001 60,402 2.90 Australia Shell/KPC 10-Jun-11 Arctic Princess 145,000 63,945 3.07 Malaysia Petronas/KPC 15-Jun-11 Arctic Lady 145,000 63,945 3.07 Australia Total/KPC 20-Jun-11 Expedient 150,900 66,547 3.20 Qatar Qatargas 4/Shell/KPC 26-Jun-11 Golar Viking 138,000 60,858 2.93 Qatar KPC 30-Jun-11 LNG Bayelsa 137,500 60,638 2.92 Nigeria Nigeria LNG/KPC Totals For June 2011 426,258 20.49
08-Jul-11 Explorer 150,900 62,404 3.00 Qatar Excelerate Energy/KPC 12-Jul-11 Seri Amanah 145,709 64,258 3.09 Malaysia Petronas/Vitol/KPC 19-Jul-11 Explorer 150,900 66,547 3.20 Qatar Excelerate Energy/KPC 25-Jul-11 Neva River 145,000 49,923 2.40 Egypt KPC 28-Jul-11 Clean Power 149,700 62,404 3.00 Qatar Shell/KPC Totals For July 2011 305,536 14.69
02-Aug-11 LNG River Niger 144,000 49,923 2.40 Nigeria Nigeria LNG/KPC 06-Aug-11 Golar Maria 138,000 60,858 2.93 Qatar KPC 12-Aug-11 Neva River 145,000 62,404 3.00 Qatar KPC 16-Aug-11 Muscat LNG 145,494 64,163 3.08 Qatar Shell/KPC 23-Aug-11 Explorer 150,900 66,547 3.20 Qatar Excelerate Energy/KPC Totals For August 2011 303,895 14.61
04-Sep-11 LNG Enugu 144,000 59,844 2.88 Nigeria Nigeria LNG/KPC 06-Sep-11 British Ruby 155,000 60,858 2.93 Trinidad BP/KPC Totals For September 2011 120,702 5.81

201
Waterborne Energy, Inc.
2323 S. Shepherd Dr. Suite 1010 Houston, Texas
77019 713/526-1555 www.waterbornelng.com
26 Aug 2011
Vol. 8, Week 33
Dubai

202
Asian LNG IMPORTS Some of the data below is unconfirmed and forward schedules are considered incomplete data. Date Vessel Name CBM Volume (mt) Volume (Bcf) Source Participants Dubai, Dubai 03-May-11 Gallina 136,967 60,402 2.90 Australia Shell/DUSUP 08-May-11 Clean Power 149,700 66,018 3.17 Qatar Shell/DUSUP 17-May-11 Clean Power 149,700 66,018 3.17 Qatar Shell/DUSUP 31-May-11 Trinity Glory 154,000 67,914 3.27 Trinidad Shell/DUSUP Totals For May 2011 260,352 12.51
10-Jun-11 Expedient 150,900 66,547 3.20 Qatar Qatargas 4/Shell/DUSUP 16-Jun-11 Excalibur 138,000 60,858 2.93 Malaysia DUSUP 23-Jun-11 Excelerate 138,000 60,858 2.93 Qatar Excelerate Energy/DUSUP Totals For June 2011 188,263 9.06
07-Jul-11 Clean Power 149,700 66,018 3.17 Qatar Shell/DUSUP 16-Jul-11 Expedient 150,900 66,547 3.20 Qatar Qatargas 4/Shell/DUSUP 31-Jul-11 Gallina 136,967 60,858 2.93 Trinidad Shell/DUSUP Totals For July 2011 193,423 9.30
08-Aug-11 Clean Power 149,700 66,018 3.17 Qatar Shell/DUSUP Totals For August 2011 66,018 3.17

203
Waterborne Energy, Inc.
2323 S. Shepherd Dr. Suite 1010 Houston, Texas
77019 713/526-1555 www.waterbornelng.com
26 Aug 2011
Vol. 8, Week 33
Thailand

204
Asian LNG IMPORTS Some of the data below is unconfirmed and forward schedules are considered incomplete data. Date Vessel Name CBM Volume (mt) Volume (Bcf) Source Participants Map Ta Phut, Thailand 31-May-11 Golar Viking 138,000 58,889 2.83 Qatar Qatargas/PTT Totals For May 2011 58,889 2.83
26-Jun-11 Grace Barleria 141,000 62,370 3.00 Russia Sakhalin 2/PTT 30-Jun-11 Al Sheehaniya 210,100 65,801 3.16 Qatar PTT Totals For June 2011 128,171 6.16
18-Jul-11 Tangguh Sago 155,000 68,355 3.29 Indonesia Pertamina/PTT 28-Jul-11 Barcelona Knutsen 177,000 76,294 3.67 Peru RepsolYPF/PTT Totals For July 2011 144,649 6.96
01-Aug-11 Expedient 150,900 66,547 3.20 Qatar PTT 11-Aug-11 Duhail 210,100 92,654 4.45 Qatar PTT 25-Aug-11 Clean Energy 149,700 66,018 3.17 Nigeria BG/PTT Totals For August 2011 225,219 10.82

205
Waterborne Energy, Inc.
2323 S. Shepherd Dr. Suite 1010 Houston, Texas
77019 713/526-1555 www.waterbornelng.com
Methodology The Asian Waterborne LNG Report tracks the flow of all LNG vessels calling on Asian LNG receiving ports. The LNG import schedules typically reflect a four-month rolling view. Summary totals are derived directly from the shipping schedules. Monthly “by country” totals are reconciled with governmental statistics as they are released. Some Japanese LNG import terminals are combined due to their close proximity and common purchasers. Buyers and sellers are noted under the “Participants” column when they can be identified, though this information is not always directly confirmed. The (CBM) column is to reference vessel capacity only and not actual volume carried onboard a particular vessel. Actual liquefied natural gas volumes are listed in billions of cubic feet (BCF) and metric tons (MT). Heat content is based on an average of various port specifications. Current and forward month vessel schedules are considered incomplete and are subject to change. Prior to December 2005 monthly total data has been sourced from various governmental sources. Disclaimer Waterborne Energy, Inc. makes no warranties as to the accuracy of any information provided in this or any other of its publications, or the results obtained from its use. Copyright Reproduction and/or retransmission of any type by any means whatsoever without the prior written consent from the publisher, Waterborne Energy, Inc., is strictly prohibited. Failure to respect copyright could result in loss of access to The Asian Waterborne LNG Report. Copyright © 2011 Waterborne Energy, Inc.

206