A49NCY POP DEVCLOPMCNT FOR BILIOGRAPHIC … · SUPPLEMENTARY NOTES (Sponeoring Od nlxation. ... 963...
21
A49NCY POP INTEINATIONAL DEVCLOPMCNT FOR AiT;9 USE ONLY WASHINGTO . O.C. a0 ,2 BILIOGRAPHIC INPUT SHEET a t A. PNIMARf L CLAWS . 1. SUBJECT Agriculture AE 70-0000-G704 FICATION a. *IECONOARV '-- Distribution and marketing--Korea Rep. Z. TITLE AND SUNTITLE Analysis of alternative purchase prices for rice in the Republic of Korea 3. AUTHOR(S| (101) Grains Policy Task Force 4. DOCUMENT DATE 5. NUMBER OF PAGES 6. ARC NUMBER . 1974 I 2 0p. ^PC 7. REFERENCE ORGANIZATION NAME AND ADDRE.S5 Mich. State 8. SUPPLEMENTARY NOTES (Sponeoring Od nlxation. Publishers, Avallabillty) 9. ABSTRACT 10 CONTROL NUMBER Il. PRICE OF DOCUMENT PN-AAB-792 12. DESCRIPTORS 13. PROJECT NUMNER Korea Rep. Prices 14. CONTRACT NUMBER Rice CRD-2975 Rpm IS. TYPE OF DOCUMENT AID 11*01 (4-,.1
Transcript of A49NCY POP DEVCLOPMCNT FOR BILIOGRAPHIC … · SUPPLEMENTARY NOTES (Sponeoring Od nlxation. ... 963...
A49NCY POP INTEINATIONAL DEVCLOPMCNT FOR AiT9 USE ONLYWASHINGTO OC a0 2BILIOGRAPHIC INPUT SHEET at
A PNIMARf LCLAWS1 SUBJECT Agriculture AE 70-0000-G704
FICATION aIECONOARV
-- Distribution and marketing--Korea RepZ TITLE AND SUNTITLE
Analysis of alternative purchase prices for rice in the Republic of Korea
3 AUTHOR(S|
(101) Grains Policy Task Force
4 DOCUMENT DATE 5 NUMBER OF PAGES 6 ARC NUMBER 1974 I 20p ^PC7 REFERENCE ORGANIZATION NAME AND ADDRES5
MichState
8 SUPPLEMENTARY NOTES (Sponeoring Od nlxation Publishers Avallabillty)
9 ABSTRACT
10 CONTROL NUMBER Il PRICE OF DOCUMENT
PN-AAB-792
12 DESCRIPTORS
13 PROJECT NUMNER Korea RepPrices
14 CONTRACT NUMBER Rice
CRD-2975 Rpm IS TYPE OF DOCUMENT
AID 1101 (4-1
C c 75- a)
Analvsis of Alternative Purchase Prices for Rice
in the
Republic of Korea
by
Grains Policy Task Force
iembers Dr Kim Don9 Hi - NAEI -3r Chun Soon Pyo - NAEki I )r i-oon Pal Yon9 - Dpoundl
SShin ieun Ho shy)r Kim Sar9 Gee - NAZI r IKim Yong Woolt )r ilansum Fred - Consultant irLee iai Soo - Consultant )r Tei~en Lloyd - Consultant vir Gibson Forrest - Consultant
16 September 1974
--
Effects of Alternative Rice Purchase Prices
(RY 1975)
Establishing a annual purchase price for rice
is accomplished only after considering the tradeoffs
of its impacts on several key economic variables
Those effects of most importance are inflation the
trade deficit farm income cost to the government
in terms of the GMSA deficit and achievement of the
policy of self-sufficiency in food grains
To aid the ROK Government inchoosing an approshy
priate purchase price the Grains Policy Task Force
estimated the impacts of four alternative purchase
prices on these and additional variables The
results are presented in Tables I 2 and 3 Explanashy
tion of the tabulated results and assumptions
essential to the analysis conclusions and policy
recommendations complete the paper
Analytical yIodel
The model used to generate Tables I and 2 is
expanded version of the generaliied front end model
used by the Grains Policy Task Force during June and
July 1274
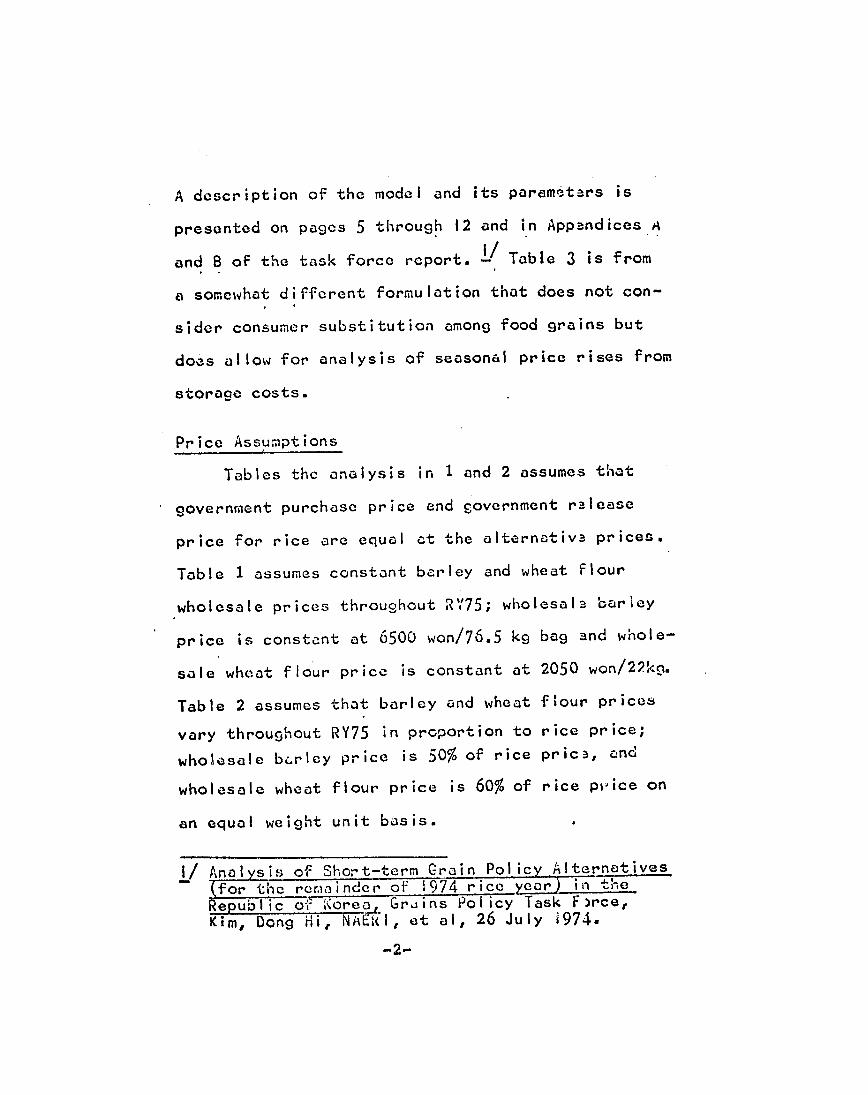
A description of the model and its paramr-tars is
presented on pages 5 through 12 and in Appendices A
and 8 oF the task force report Table 3 is from
a somewhat different formulation that does not conshy
sider consumer substitution among food grains but
does allow for analysis of seasonal price rises from
storage costs
Price Assumptions
Tables the analysis in 1 and 2 assumes that
government purchase price and covernment ralease
price for rice are equal at the alternativB prices
Table I assumes constant barley and wheat Flour
wholesale prices throughout Rsect75 wholesala bariey
price is constant at 6500 won765 k9 bag and wholeshy
sale wheat flour price is constant at 2050 won22kO
Table 2 assumes that barley and wheat flour prices
vary throughout RY75 in proportion to rice price
is 50 of rice prica andwholesale bLrley price
is 60 of rice piice onwholesale wheat flour price
an equal weight unit basis
I Analysis of Short-term Grain Policy Alternatives (for the remainder of 1974 rice-yea in the Republic ol 1orea Grains Policy Task F)rce Kim Dong Hi NMERI et al 26 July i974
-2shy
These prices for the fojr alternative government
purchase prices are given below
Altornative Govt - - - Wholesale price - -
Purchase Price Rice (W8Oke) Barley Wheat Flour
(VW765kg) (W22kq)
133(0 7344 2534 15970 7636 2635 16500 7889 2723 17065 8159 2816
Both tables assume the current dual price policy for
birley will continue in RY75 Farm price for barley
i assumed to be 25 above the wholesale price
Ferm prices for wheat flour are assumed to be 10
higher than wholesale price The government subsidy
be-se for wheat flour is assumed to be 2790 won22kg
bcg Government subsidies are not paiJ at wholesale
wheat flour prices above this level
Establishing Alternative Purchase Prices
As a justification for establishing a higher
purchase price and as guidelines for the amount of
increase the following comparisons are available
-3shy
(1) [he index of prices paid by farmers has
risen by 338 percent from the First six
months period of 1973 to the first six
months period of 1974 (Estimating the
index for the last half of 1974 provides
an increase of 345 percent for calender
year 1974 compared to 1973) one altershy
native rice purchase price might be set
equal to the change in this index to reflect
changing production costs in agriculture
or higher if additional production incentive
is desired
(2) The wholesale price index has risen by
394 percent from the first six months of
1973 to the first six months of 1974
(Estimating the index for the last half of
1974 provides an increase of 424 percent
for calender year 1974 compared to 1973)
One alternative rice purchase price might
be set equal to the change in this index
as a measure of overall inflation in the
economy
-4-
(3) The average free market selling price in
the seven major producing areas for rice
during the month of August 1974 was
13952 W an increase of 407 percent ovur
August 1973 At this same rate of
increase the November-December 1974
average price would be 14573 If the
government is to be successful in purchasing
grain on a freely operating market its
purchase price should be equal to or
greater than the prevailing market price
in the fall of 1974
(4) From country comparisons the Korean purshy
chase price in 1973 was 11377 W the
Japanese purchase price was 22700 W and
the US price was 14420 W The 1974
price in Japan is 27960 W and the US
price is 18270 W Although country comshy
parisons may not be valid because of
different cost structures th~se figures
are useful to show the magnitudes of yearshy
to-year changes
Based on these changes it seemed appropriate
to consider rice purchase prices that were 35 40
45 and to percent greater than in 1973 dsing the
a base the1973 purchase price of 11377 W as
1974alternatives considered for the analysis for
ware 15360 15970 16500 and 17065 r
-6shy
Table 1 Dffects of Alternative Government Purchase Prices for Rice(flY75) Assuming Constant Barley and TWhoat Flour Prices
--- Gove(ment P rchaso Price for Actual Ri ce--won80kg--
RY73 35 percent 40 porcont45 percent SO porcon15360 15970 16500 17065 -arm won)Incomoe(bil 4691 6536 6764 6988 7228Average Fr Income( 100wonIHI) 193 245 255 263 272RY7 Rice Production(10001 ) 3957 -222 4270 4311 4334
Consurer Price Index( 1970= 100) 1308 1683 1698 1711 1725Consumer Exponditure on Grains(woicap) 20669 29744 30464 31 M2 31732 Govt Share of Rice Reguir6ments(1IC0o0) 900 994 9S2 916Govt fLcrestic Rice Furchaso(1000iT) 451 534
830 50 545 50Rico Imports( 10 0OMT) 439 6 412 3717creign E-cha-ngo Costs(rail won)
330 102565 92081 82315 74222 65967
Chnn-e in GSARice Account(I-il won) - - 14627 - 1062S - 7769 - 5287Total Account( 14il von) - - 70002 - 66976 - 64943 - 63342
Tot al Grain ConsuInpt iou( 1000MT) 7098 6$81 6978 6977 6976Rico ( 10 00 T) 4362 3849 3800 3759 3718Barley( I 000 11T) 1773 1729 1753 1774 1796heat ( 1 0 001ITi) 963 1403 142S 1444 1463
For Ca-ita Grain uuu Lon Rural Tot al(kqcipyr) 221 209 209 209 209Rice 115 133 132 101 100Barley 76 66 66 67 67Theat 30 39 40 41 41Urban Total 197 197 197 197 197Ricoe 132 118 117 115 114Barley 35 37 38 39 40S Ghat 0 42 42 43 44
7aolesao Barly Prico=sDOy S5 Vaholosalo Vhoat F1lour Price = 20S0 22kg
Table 2 Effects of Alternative Government Purchase Prices for Rice (RY 75)
Assuming Flexiblity- in Barley and IThoat Flour PricoeK
bullCovrnment Purchase Price for Ricewon8Okg
Actual 35 pcrcent 40 percent 45 percent SO percemt RY 73 15360 15970 16500 17065
I-income (bil won) 4C91 6506 6764 6983 7228 --rage Farm Income (1000 wonHII) 193 245 255 263 272
- 75 Rice Production 3957 4222 4270 4311 4334
-znsumar Price Index (19 70 = 100) 1308 1683 1698 1711 1725 3um3r -pon-iture on Grains(woncap) 20669 31834 33180 34353 35607
- vt sh-re of Rice Ro-quiremento(1000MT) 900 1266 1299 1326 1355--vt oestic Rice urchaeo(1000 4T) 451 485 476 468 460 ce Imni orts (100014T) 439 781 823 858 895
EreiLn 102965 164561 1M1639 179021Exchango Cost(mil won) 136219 n in G S A 0 licc Account (rmilwon) - - 20171 - 14592 - 9226 - 2993
Total ccount (milwon) - - 49974 - 40212 - 31219 - 22272
- - a rain Cosu-pvion (1000MT) 7098 7023 7033 7046 7058 ic ( 1000 MT) 4362 4165 4211 4247 4283
a-ey (1000 1T) 1773 1604 1582 1559 1536(0001 L) 963 1244 1242 1241 1239
C-r-C zpitaGrain Consunpion(Icapyr) Ruir-al Total 221 210 211 212 212
a 115 114 116 118 119 5a rl ey 76 61 60 59 58 oea t 30 35 35 35 35
Urban Total 197 198 198 198 193 li c e 132 126 127 127 127
~a r 1y 35 35 34 34 34 Ae a t 30 37 37 37 37
7-olesale Barley Price = 50 GQoVt Rice Purchase Price Wholosale Mheat Flour Price = 60 Gov t Rice Purchase Price
Explanation of Tables I and 2
Farm Income Value of RY74 rice production is
deflated by 22 to account for expected farm loss
nonhuman consumption and production estimate error
Average prices received by farmers are assumed equal
to the alternative government purchase prices
Average Form Income This line is calculated
directly from the line above Assumptions arz that
farm population in RY75 is 15525000 with six
persons par farm household
75 Rice Production This line is calculated
based on a supply elasticity estimate of 28 base
year production is set at the RY73 level of 4212
thousand MT Base year prices are set t 11377
won80c9 Deflated prices (deflated by the index of
farm prices paid) are used in this calculation
Consumer Expenditure on Grains (woncap) This
line gives the values of grain consumed per capita
by urban population (rural consumption is assumed
satisfied by on farm production) It is the sum of
per capita consumption times price of rice barley
and wheat flour
-9shy
Government share of Rice Requirements This
is the sum of government rice purchases and rice
imports and represents the total quantity of grain
avcilalle to the 9ovcrnment for price stabilization
purposes
Government RNice Purchases Government share of
domestic mcrketed rice supply in RY75 is assumed to
be constant at 30 percent Domestic marketed rice
supply is the difference between deflated procuction
and estimated form consumption
Rice Imports Rice imports are-clculated as
the residual between deflated domestic production
and totcal rice requireents for RY75
Foreign Exchnoe Costus This line reflects the
cost of rice imports calcuklted at 500 dollars
(200000 won) per metric ton
Change in GSA The changes in the G- SA from
rice oper-tions -nd the total change in th3 GiSA from
rice barley and wheat operations are given on these
two lines Storge costs of 22000 woniT er year
assumed both for domestic purchases and importsare
Mean storage period is assumed to be 6 months with
no changes in carryovers
-10shy
price system is assurieds mentioned above the dual
for barley and wheat flour subsidy base is assumed
at 2790 won22kg
Total Grain Consumption These lines represent
the total of estimated rural and urban rice barley
and wheat consumption Per capita consumption
estimates for rice barley and wheat are made by
demand models for rural and urban populations Per
capita consumption estimates are then multiplied by
rural and urban populations and added together to
generate these lines
Per Capita Grain Consumption These lines
depict the actual results yielded from the respective
and urban demand models used for this axurciserural
when the four alternative Governmentpurchase prices
were specified
-I Ishy
Tamp~blo 3 ypOt zticv f of Rico PurchaaEs Pricos
Whon Govorront t1urchiao Roaponoo aramotor io 15
Variablo Importu Import Timing Gov Otor UuoL PVt Stor Usod
oarrydvor
cone B-ponditure
Farm Income
GGv So Coot
PVt StOA Coz Gov Stov rro1it
Pvt Stor Credit
Gov Stor Credit
Pvt Stor Crodit
Total Stor CrdOt
Total Rico COna
Min Cons Price
Max Cons Price
Mlin OPI
Max CPI
ForeiGn Exchango Cost
AVg Releaseo Price
Uniteto360 1 000 mT a ntt1 1 000 MT 1 000 MT 1 000 MT
Billion 17on
Billioa WJo
13illion on BilliOn Won 13il-On Won
Lillion Von
Billion fon
Dil7ion [On
BilliOn on
1000 MTYr
71onO K
Won80 Kg
1970=100 1970=100
MilliOn
Dollars
VOnB0 Kg
Avorago
urchasea35
Prico40
(Won8O45 Kg) 50
1orcont Porcont Porcont Porcont 15930 165G0 17065
5397 5197 499 7 479 8 102 03 104 105
691 9 7285 7653 801 9 2301 2320 2341 2361
6223 6994 7170 7648
7705 7922 8135 8343
6301 6521 6741 6959
1648 1808 1975 2149
3046 3175 3308 34 45 762 1048 1337 1630
-2622 -2905 -3202 -3511
1388 1514 1645 1781
3200 3260 3315 3367
3945 4063 4179 4292
3928 3908 888 3868
14616 1513 15640 16152
17984 18600 1 208 19816
1665 1678 1690 1702 1747 1762 1776 1791
2802 2720 263 1 -2532
16997 17590- 1879 187655
Aseunos Domand Elasicity is 34 t 20900 VA 0 Kg and 3500QD=Jo
-12shy
Assumptions used in Thigens INTERTEiIPORAL PR ICE EWUjlLIRlUiiI mWEO L
as Used in the RY1975 Purchase Price Analysis
The Demand equation is assumcd to be linear with the
elasticity 34 at 20000W80ko and 350000 MTionb
The annual harvest is assumed to be 4344000 iviT
The sum oF farm marketing and statistical losses is assumed to be 22
The interest rate is assumed to be 18 per annum
The wvrehouse cost is 460 i4TAA onth
Import prices are assumed to be $500Ton
Prices variy during the year from the minimum at harvest to the imOaximum at the end of the year The miniru- market price is below the Averacje Purchase Price
Government is assumed to purchase 18750 tons of Grain for every 00 14180ks the market price is from the targetted threshold price The government pays the prevailing maret price for these purchases rather than a single purchase price
The threshold prices were assumed to be 650 W80k9 higher than the Average Purchase Price
The average release price is the simple average CF the threshold price and the maximum market price within thie year Government sales take place both above and below this price
The weight of rice in the price index is 1404 and the 1970 base price for rice is 5784 VI8Okg The index of nonrice prices is assumed to be 1525 with a 1970 base of 100
13shy
Total government purchases from the domnestic market equals the overnment Storage Used
Government Storoqe Costs is the interest plus storaqe ChcE-s incurred by the government on the government purchases
Government Storace Profit is the net change in the GMSA for the year
Government Stor--c Credit is the amount of short term financing (within the year) required by G1SA
Consumption dcpcrds on the level of prices as reflected by the demand equation
Imports repesent the shortfall between productionand consumption plus losses
Consumer Expenditure is the value of total rice consumption at mark+et prices including both urban and rural consumption
Farm income is oross value oF rice production at the market prices The value of non-storogemarketing costs such as transportotion costs need to ba subtracted from this to arrive at the value to the former I would suggest about a 20margin for these costs
-14
Conc lusions
1 Farm Income As expected gross farm income
(value of the rice harvest) rises with higher purshy
chase prices It should be remembered however that
(I) the estimate is nominal income that does not
reflect the expected inflation in 1975 and (2)
production is based on normal weather and production
conditions It higher gross farm income to thu
Rural Sector is the policy objective it can be
accompl ished with h jlher rice prices But it is
difficult -toraisc per -Farr income in this manner
becausiu farm sales arc small
2 Import requircments Given the projected
estimates of production and consumption import
requirements decl ine from the 1973 level when barl
and wheat prices do not changce Allowing for a 22
percent loss in production figures in tabla I rice
imports decline from 460 thousand IT to a low of 371
thousand wiT at a purchase price of 16500 d The
decline in import needs reflects a lower rate of
consumption at higher price levels
-15shy
Table 2 demonstrates an important point for
Korean grains pol icy When barley and wheat price
changes are considered sirultaneously with rice
price changes rice import needs rise instead of
decline Because substitution occurs between the
grains as relative prices change rice consumption
is at much higher levels It therefore seems much
more realistic to consider food grains prices
together rather than each in isolation
3 Chane in GSA In a similar manner t is
diFficult to obtain a stazic analysis of the change
in rice price alone on the Gi4SA Estimates of
the total deficit are much higher in Table I than in
Table UI becGuse additions to the deficit account
-ccrue under present barley and wheat programs It
should be noted that in both tables the deficit in
the GPSA decl ines as purchase price rises This
occurs primarily because the loss per ton on imports
is declining under the assumption that release price
equals purchase price At prices qreater than 16000
a net addition actually accrues to the Gi4SA from
imports
-16shy
4 Inflation Higher purchase prices are
reflected in rises in the index of consumer prices
Higher purchase prices directly contribute to the
rate of inflation throueh increased cost to consumers
and throuoh the deficit financing of the GMSA account
itself (If the release price is set above the
purchase price a surplus in the account will accrue
ond partially offset the first effect)
5 Government storc needs Utilization of
the storage modelTble III permits an estimatc of
overnment storage capacity needed At the hither
purchase prices government will need more storaSe
than is presently available At the same time
government will hove sufficient quantities of grain
onhand to have a significant impact on market prices
Task Force Recommendat ions
1 Because of the substitution between wheat
barley and rice in consumer diets it is not a
rational policy to decide one price in isolation from
the others This analysis clearly depicts the intershy
dependence in consumption and distorts conclusions
regarding-import needs consumption and the GMSA
account when a static analysis is followed
-17shy
It is much more loGical for the ROK Government
to establ ish a grains policy that recognizes that
-producers and consumers adjust to relative as well
as absolute prices This requires the simultaneous
setting of purchase prices for all three major food
grains
2 In making future decisions on tha purchase
price consideration should be given to a purchase
price that rises during the season to reflect
The resultsinterest charses and storage costs
in the storage model Table Ill more nearly approshy
ximate economic reality by including thasa costs
Providing for a pattern of rising inter-yiar purchase
prices will offer incentives for farmers to store
grains on farm and release them more in line With
market needs rather than selling a high proportion
at time of harvcst Such a policy would also
recognize the existance of a black market in grains
steps to combat it by paying lUgimateand would take
sectorstorage costs to the private and public
3 More consideration needs to be given to
the inflationary effect of the GiviSA deficit
-18shy
As long as the deficit grows such as occurs when the
purchzse price exceeds the release price there is
an indirect effect equilivalent to government deficit
financing In this circumstance the direct effect
on inflation of higher rice prices and indirect effect
of deficit financing operate in the same direction
However when the release price rises above the
purcbase price there will be a surplus in the GSA
(fro rice alone) and the effects will tend to be
offsetting The suggestion is that consideration be
given to both effects when establishing the relative
levels of release and purchase prices
-19shy
C c 75- a)
Analvsis of Alternative Purchase Prices for Rice
in the
Republic of Korea
by
Grains Policy Task Force
iembers Dr Kim Don9 Hi - NAEI -3r Chun Soon Pyo - NAEki I )r i-oon Pal Yon9 - Dpoundl
SShin ieun Ho shy)r Kim Sar9 Gee - NAZI r IKim Yong Woolt )r ilansum Fred - Consultant irLee iai Soo - Consultant )r Tei~en Lloyd - Consultant vir Gibson Forrest - Consultant
16 September 1974
--
Effects of Alternative Rice Purchase Prices
(RY 1975)
Establishing a annual purchase price for rice
is accomplished only after considering the tradeoffs
of its impacts on several key economic variables
Those effects of most importance are inflation the
trade deficit farm income cost to the government
in terms of the GMSA deficit and achievement of the
policy of self-sufficiency in food grains
To aid the ROK Government inchoosing an approshy
priate purchase price the Grains Policy Task Force
estimated the impacts of four alternative purchase
prices on these and additional variables The
results are presented in Tables I 2 and 3 Explanashy
tion of the tabulated results and assumptions
essential to the analysis conclusions and policy
recommendations complete the paper
Analytical yIodel
The model used to generate Tables I and 2 is
expanded version of the generaliied front end model
used by the Grains Policy Task Force during June and
July 1274
A description of the model and its paramr-tars is
presented on pages 5 through 12 and in Appendices A
and 8 oF the task force report Table 3 is from
a somewhat different formulation that does not conshy
sider consumer substitution among food grains but
does allow for analysis of seasonal price rises from
storage costs
Price Assumptions
Tables the analysis in 1 and 2 assumes that
government purchase price and covernment ralease
price for rice are equal at the alternativB prices
Table I assumes constant barley and wheat Flour
wholesale prices throughout Rsect75 wholesala bariey
price is constant at 6500 won765 k9 bag and wholeshy
sale wheat flour price is constant at 2050 won22kO
Table 2 assumes that barley and wheat flour prices
vary throughout RY75 in proportion to rice price
is 50 of rice prica andwholesale bLrley price
is 60 of rice piice onwholesale wheat flour price
an equal weight unit basis
I Analysis of Short-term Grain Policy Alternatives (for the remainder of 1974 rice-yea in the Republic ol 1orea Grains Policy Task F)rce Kim Dong Hi NMERI et al 26 July i974
-2shy
These prices for the fojr alternative government
purchase prices are given below
Altornative Govt - - - Wholesale price - -
Purchase Price Rice (W8Oke) Barley Wheat Flour
(VW765kg) (W22kq)
133(0 7344 2534 15970 7636 2635 16500 7889 2723 17065 8159 2816
Both tables assume the current dual price policy for
birley will continue in RY75 Farm price for barley
i assumed to be 25 above the wholesale price
Ferm prices for wheat flour are assumed to be 10
higher than wholesale price The government subsidy
be-se for wheat flour is assumed to be 2790 won22kg
bcg Government subsidies are not paiJ at wholesale
wheat flour prices above this level
Establishing Alternative Purchase Prices
As a justification for establishing a higher
purchase price and as guidelines for the amount of
increase the following comparisons are available
-3shy
(1) [he index of prices paid by farmers has
risen by 338 percent from the First six
months period of 1973 to the first six
months period of 1974 (Estimating the
index for the last half of 1974 provides
an increase of 345 percent for calender
year 1974 compared to 1973) one altershy
native rice purchase price might be set
equal to the change in this index to reflect
changing production costs in agriculture
or higher if additional production incentive
is desired
(2) The wholesale price index has risen by
394 percent from the first six months of
1973 to the first six months of 1974
(Estimating the index for the last half of
1974 provides an increase of 424 percent
for calender year 1974 compared to 1973)
One alternative rice purchase price might
be set equal to the change in this index
as a measure of overall inflation in the
economy
-4-
(3) The average free market selling price in
the seven major producing areas for rice
during the month of August 1974 was
13952 W an increase of 407 percent ovur
August 1973 At this same rate of
increase the November-December 1974
average price would be 14573 If the
government is to be successful in purchasing
grain on a freely operating market its
purchase price should be equal to or
greater than the prevailing market price
in the fall of 1974
(4) From country comparisons the Korean purshy
chase price in 1973 was 11377 W the
Japanese purchase price was 22700 W and
the US price was 14420 W The 1974
price in Japan is 27960 W and the US
price is 18270 W Although country comshy
parisons may not be valid because of
different cost structures th~se figures
are useful to show the magnitudes of yearshy
to-year changes
Based on these changes it seemed appropriate
to consider rice purchase prices that were 35 40
45 and to percent greater than in 1973 dsing the
a base the1973 purchase price of 11377 W as
1974alternatives considered for the analysis for
ware 15360 15970 16500 and 17065 r
-6shy
Table 1 Dffects of Alternative Government Purchase Prices for Rice(flY75) Assuming Constant Barley and TWhoat Flour Prices
--- Gove(ment P rchaso Price for Actual Ri ce--won80kg--
RY73 35 percent 40 porcont45 percent SO porcon15360 15970 16500 17065 -arm won)Incomoe(bil 4691 6536 6764 6988 7228Average Fr Income( 100wonIHI) 193 245 255 263 272RY7 Rice Production(10001 ) 3957 -222 4270 4311 4334
Consurer Price Index( 1970= 100) 1308 1683 1698 1711 1725Consumer Exponditure on Grains(woicap) 20669 29744 30464 31 M2 31732 Govt Share of Rice Reguir6ments(1IC0o0) 900 994 9S2 916Govt fLcrestic Rice Furchaso(1000iT) 451 534
830 50 545 50Rico Imports( 10 0OMT) 439 6 412 3717creign E-cha-ngo Costs(rail won)
330 102565 92081 82315 74222 65967
Chnn-e in GSARice Account(I-il won) - - 14627 - 1062S - 7769 - 5287Total Account( 14il von) - - 70002 - 66976 - 64943 - 63342
Tot al Grain ConsuInpt iou( 1000MT) 7098 6$81 6978 6977 6976Rico ( 10 00 T) 4362 3849 3800 3759 3718Barley( I 000 11T) 1773 1729 1753 1774 1796heat ( 1 0 001ITi) 963 1403 142S 1444 1463
For Ca-ita Grain uuu Lon Rural Tot al(kqcipyr) 221 209 209 209 209Rice 115 133 132 101 100Barley 76 66 66 67 67Theat 30 39 40 41 41Urban Total 197 197 197 197 197Ricoe 132 118 117 115 114Barley 35 37 38 39 40S Ghat 0 42 42 43 44
7aolesao Barly Prico=sDOy S5 Vaholosalo Vhoat F1lour Price = 20S0 22kg
Table 2 Effects of Alternative Government Purchase Prices for Rice (RY 75)
Assuming Flexiblity- in Barley and IThoat Flour PricoeK
bullCovrnment Purchase Price for Ricewon8Okg
Actual 35 pcrcent 40 percent 45 percent SO percemt RY 73 15360 15970 16500 17065
I-income (bil won) 4C91 6506 6764 6983 7228 --rage Farm Income (1000 wonHII) 193 245 255 263 272
- 75 Rice Production 3957 4222 4270 4311 4334
-znsumar Price Index (19 70 = 100) 1308 1683 1698 1711 1725 3um3r -pon-iture on Grains(woncap) 20669 31834 33180 34353 35607
- vt sh-re of Rice Ro-quiremento(1000MT) 900 1266 1299 1326 1355--vt oestic Rice urchaeo(1000 4T) 451 485 476 468 460 ce Imni orts (100014T) 439 781 823 858 895
EreiLn 102965 164561 1M1639 179021Exchango Cost(mil won) 136219 n in G S A 0 licc Account (rmilwon) - - 20171 - 14592 - 9226 - 2993
Total ccount (milwon) - - 49974 - 40212 - 31219 - 22272
- - a rain Cosu-pvion (1000MT) 7098 7023 7033 7046 7058 ic ( 1000 MT) 4362 4165 4211 4247 4283
a-ey (1000 1T) 1773 1604 1582 1559 1536(0001 L) 963 1244 1242 1241 1239
C-r-C zpitaGrain Consunpion(Icapyr) Ruir-al Total 221 210 211 212 212
a 115 114 116 118 119 5a rl ey 76 61 60 59 58 oea t 30 35 35 35 35
Urban Total 197 198 198 198 193 li c e 132 126 127 127 127
~a r 1y 35 35 34 34 34 Ae a t 30 37 37 37 37
7-olesale Barley Price = 50 GQoVt Rice Purchase Price Wholosale Mheat Flour Price = 60 Gov t Rice Purchase Price
Explanation of Tables I and 2
Farm Income Value of RY74 rice production is
deflated by 22 to account for expected farm loss
nonhuman consumption and production estimate error
Average prices received by farmers are assumed equal
to the alternative government purchase prices
Average Form Income This line is calculated
directly from the line above Assumptions arz that
farm population in RY75 is 15525000 with six
persons par farm household
75 Rice Production This line is calculated
based on a supply elasticity estimate of 28 base
year production is set at the RY73 level of 4212
thousand MT Base year prices are set t 11377
won80c9 Deflated prices (deflated by the index of
farm prices paid) are used in this calculation
Consumer Expenditure on Grains (woncap) This
line gives the values of grain consumed per capita
by urban population (rural consumption is assumed
satisfied by on farm production) It is the sum of
per capita consumption times price of rice barley
and wheat flour
-9shy
Government share of Rice Requirements This
is the sum of government rice purchases and rice
imports and represents the total quantity of grain
avcilalle to the 9ovcrnment for price stabilization
purposes
Government RNice Purchases Government share of
domestic mcrketed rice supply in RY75 is assumed to
be constant at 30 percent Domestic marketed rice
supply is the difference between deflated procuction
and estimated form consumption
Rice Imports Rice imports are-clculated as
the residual between deflated domestic production
and totcal rice requireents for RY75
Foreign Exchnoe Costus This line reflects the
cost of rice imports calcuklted at 500 dollars
(200000 won) per metric ton
Change in GSA The changes in the G- SA from
rice oper-tions -nd the total change in th3 GiSA from
rice barley and wheat operations are given on these
two lines Storge costs of 22000 woniT er year
assumed both for domestic purchases and importsare
Mean storage period is assumed to be 6 months with
no changes in carryovers
-10shy
price system is assurieds mentioned above the dual
for barley and wheat flour subsidy base is assumed
at 2790 won22kg
Total Grain Consumption These lines represent
the total of estimated rural and urban rice barley
and wheat consumption Per capita consumption
estimates for rice barley and wheat are made by
demand models for rural and urban populations Per
capita consumption estimates are then multiplied by
rural and urban populations and added together to
generate these lines
Per Capita Grain Consumption These lines
depict the actual results yielded from the respective
and urban demand models used for this axurciserural
when the four alternative Governmentpurchase prices
were specified
-I Ishy
Tamp~blo 3 ypOt zticv f of Rico PurchaaEs Pricos
Whon Govorront t1urchiao Roaponoo aramotor io 15
Variablo Importu Import Timing Gov Otor UuoL PVt Stor Usod
oarrydvor
cone B-ponditure
Farm Income
GGv So Coot
PVt StOA Coz Gov Stov rro1it
Pvt Stor Credit
Gov Stor Credit
Pvt Stor Crodit
Total Stor CrdOt
Total Rico COna
Min Cons Price
Max Cons Price
Mlin OPI
Max CPI
ForeiGn Exchango Cost
AVg Releaseo Price
Uniteto360 1 000 mT a ntt1 1 000 MT 1 000 MT 1 000 MT
Billion 17on
Billioa WJo
13illion on BilliOn Won 13il-On Won
Lillion Von
Billion fon
Dil7ion [On
BilliOn on
1000 MTYr
71onO K
Won80 Kg
1970=100 1970=100
MilliOn
Dollars
VOnB0 Kg
Avorago
urchasea35
Prico40
(Won8O45 Kg) 50
1orcont Porcont Porcont Porcont 15930 165G0 17065
5397 5197 499 7 479 8 102 03 104 105
691 9 7285 7653 801 9 2301 2320 2341 2361
6223 6994 7170 7648
7705 7922 8135 8343
6301 6521 6741 6959
1648 1808 1975 2149
3046 3175 3308 34 45 762 1048 1337 1630
-2622 -2905 -3202 -3511
1388 1514 1645 1781
3200 3260 3315 3367
3945 4063 4179 4292
3928 3908 888 3868
14616 1513 15640 16152
17984 18600 1 208 19816
1665 1678 1690 1702 1747 1762 1776 1791
2802 2720 263 1 -2532
16997 17590- 1879 187655
Aseunos Domand Elasicity is 34 t 20900 VA 0 Kg and 3500QD=Jo
-12shy
Assumptions used in Thigens INTERTEiIPORAL PR ICE EWUjlLIRlUiiI mWEO L
as Used in the RY1975 Purchase Price Analysis
The Demand equation is assumcd to be linear with the
elasticity 34 at 20000W80ko and 350000 MTionb
The annual harvest is assumed to be 4344000 iviT
The sum oF farm marketing and statistical losses is assumed to be 22
The interest rate is assumed to be 18 per annum
The wvrehouse cost is 460 i4TAA onth
Import prices are assumed to be $500Ton
Prices variy during the year from the minimum at harvest to the imOaximum at the end of the year The miniru- market price is below the Averacje Purchase Price
Government is assumed to purchase 18750 tons of Grain for every 00 14180ks the market price is from the targetted threshold price The government pays the prevailing maret price for these purchases rather than a single purchase price
The threshold prices were assumed to be 650 W80k9 higher than the Average Purchase Price
The average release price is the simple average CF the threshold price and the maximum market price within thie year Government sales take place both above and below this price
The weight of rice in the price index is 1404 and the 1970 base price for rice is 5784 VI8Okg The index of nonrice prices is assumed to be 1525 with a 1970 base of 100
13shy
Total government purchases from the domnestic market equals the overnment Storage Used
Government Storoqe Costs is the interest plus storaqe ChcE-s incurred by the government on the government purchases
Government Storace Profit is the net change in the GMSA for the year
Government Stor--c Credit is the amount of short term financing (within the year) required by G1SA
Consumption dcpcrds on the level of prices as reflected by the demand equation
Imports repesent the shortfall between productionand consumption plus losses
Consumer Expenditure is the value of total rice consumption at mark+et prices including both urban and rural consumption
Farm income is oross value oF rice production at the market prices The value of non-storogemarketing costs such as transportotion costs need to ba subtracted from this to arrive at the value to the former I would suggest about a 20margin for these costs
-14
Conc lusions
1 Farm Income As expected gross farm income
(value of the rice harvest) rises with higher purshy
chase prices It should be remembered however that
(I) the estimate is nominal income that does not
reflect the expected inflation in 1975 and (2)
production is based on normal weather and production
conditions It higher gross farm income to thu
Rural Sector is the policy objective it can be
accompl ished with h jlher rice prices But it is
difficult -toraisc per -Farr income in this manner
becausiu farm sales arc small
2 Import requircments Given the projected
estimates of production and consumption import
requirements decl ine from the 1973 level when barl
and wheat prices do not changce Allowing for a 22
percent loss in production figures in tabla I rice
imports decline from 460 thousand IT to a low of 371
thousand wiT at a purchase price of 16500 d The
decline in import needs reflects a lower rate of
consumption at higher price levels
-15shy
Table 2 demonstrates an important point for
Korean grains pol icy When barley and wheat price
changes are considered sirultaneously with rice
price changes rice import needs rise instead of
decline Because substitution occurs between the
grains as relative prices change rice consumption
is at much higher levels It therefore seems much
more realistic to consider food grains prices
together rather than each in isolation
3 Chane in GSA In a similar manner t is
diFficult to obtain a stazic analysis of the change
in rice price alone on the Gi4SA Estimates of
the total deficit are much higher in Table I than in
Table UI becGuse additions to the deficit account
-ccrue under present barley and wheat programs It
should be noted that in both tables the deficit in
the GPSA decl ines as purchase price rises This
occurs primarily because the loss per ton on imports
is declining under the assumption that release price
equals purchase price At prices qreater than 16000
a net addition actually accrues to the Gi4SA from
imports
-16shy
4 Inflation Higher purchase prices are
reflected in rises in the index of consumer prices
Higher purchase prices directly contribute to the
rate of inflation throueh increased cost to consumers
and throuoh the deficit financing of the GMSA account
itself (If the release price is set above the
purchase price a surplus in the account will accrue
ond partially offset the first effect)
5 Government storc needs Utilization of
the storage modelTble III permits an estimatc of
overnment storage capacity needed At the hither
purchase prices government will need more storaSe
than is presently available At the same time
government will hove sufficient quantities of grain
onhand to have a significant impact on market prices
Task Force Recommendat ions
1 Because of the substitution between wheat
barley and rice in consumer diets it is not a
rational policy to decide one price in isolation from
the others This analysis clearly depicts the intershy
dependence in consumption and distorts conclusions
regarding-import needs consumption and the GMSA
account when a static analysis is followed
-17shy
It is much more loGical for the ROK Government
to establ ish a grains policy that recognizes that
-producers and consumers adjust to relative as well
as absolute prices This requires the simultaneous
setting of purchase prices for all three major food
grains
2 In making future decisions on tha purchase
price consideration should be given to a purchase
price that rises during the season to reflect
The resultsinterest charses and storage costs
in the storage model Table Ill more nearly approshy
ximate economic reality by including thasa costs
Providing for a pattern of rising inter-yiar purchase
prices will offer incentives for farmers to store
grains on farm and release them more in line With
market needs rather than selling a high proportion
at time of harvcst Such a policy would also
recognize the existance of a black market in grains
steps to combat it by paying lUgimateand would take
sectorstorage costs to the private and public
3 More consideration needs to be given to
the inflationary effect of the GiviSA deficit
-18shy
As long as the deficit grows such as occurs when the
purchzse price exceeds the release price there is
an indirect effect equilivalent to government deficit
financing In this circumstance the direct effect
on inflation of higher rice prices and indirect effect
of deficit financing operate in the same direction
However when the release price rises above the
purcbase price there will be a surplus in the GSA
(fro rice alone) and the effects will tend to be
offsetting The suggestion is that consideration be
given to both effects when establishing the relative
levels of release and purchase prices
-19shy
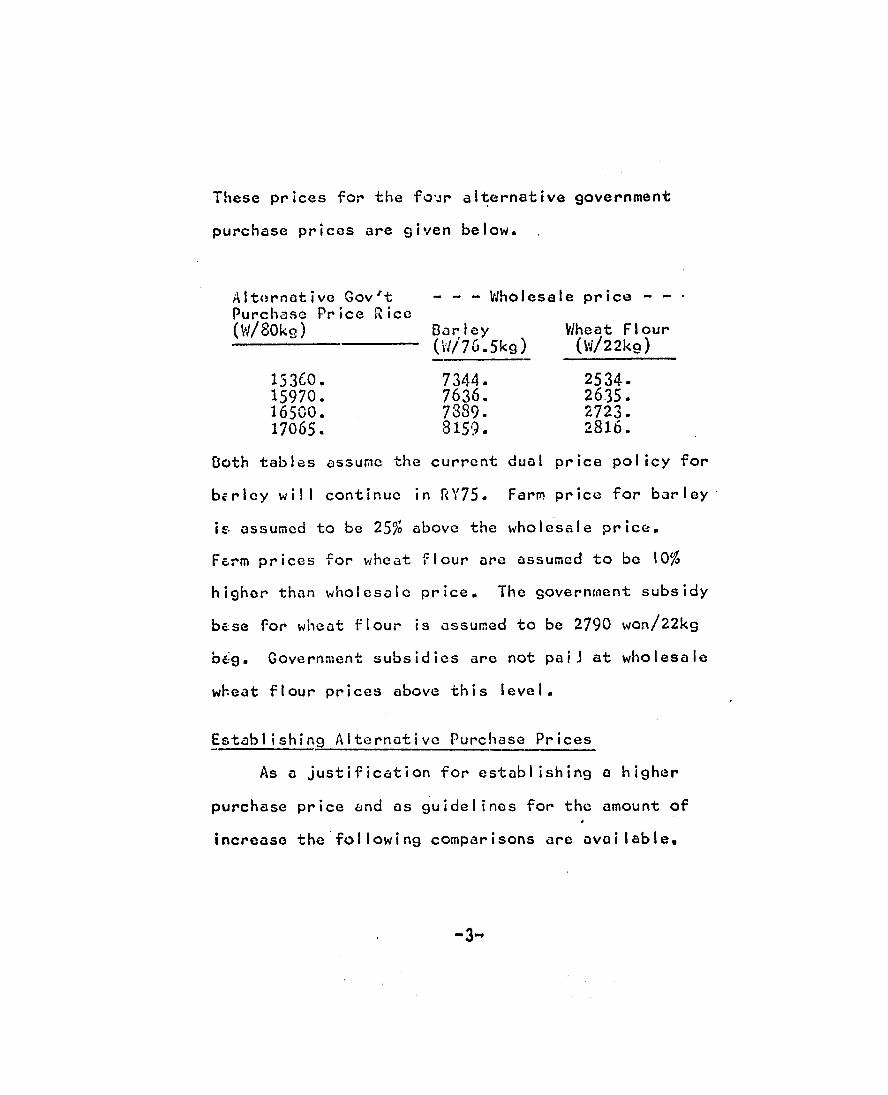
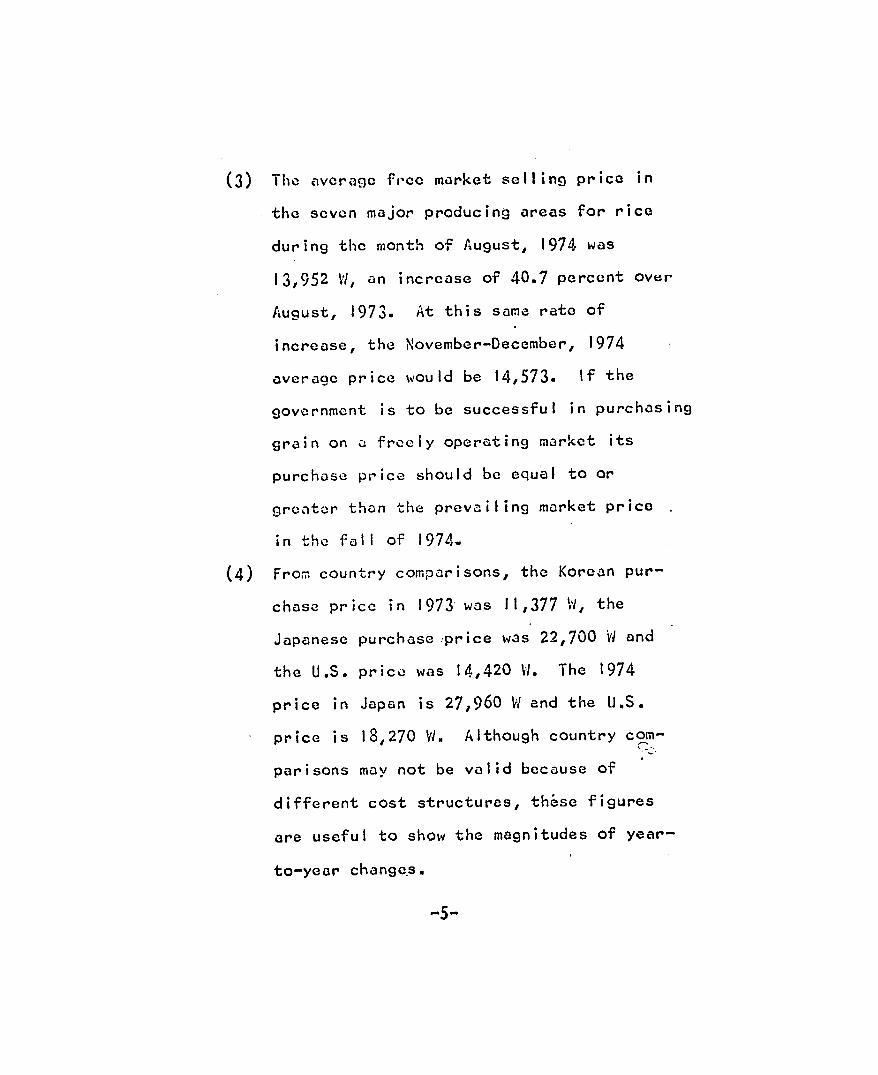
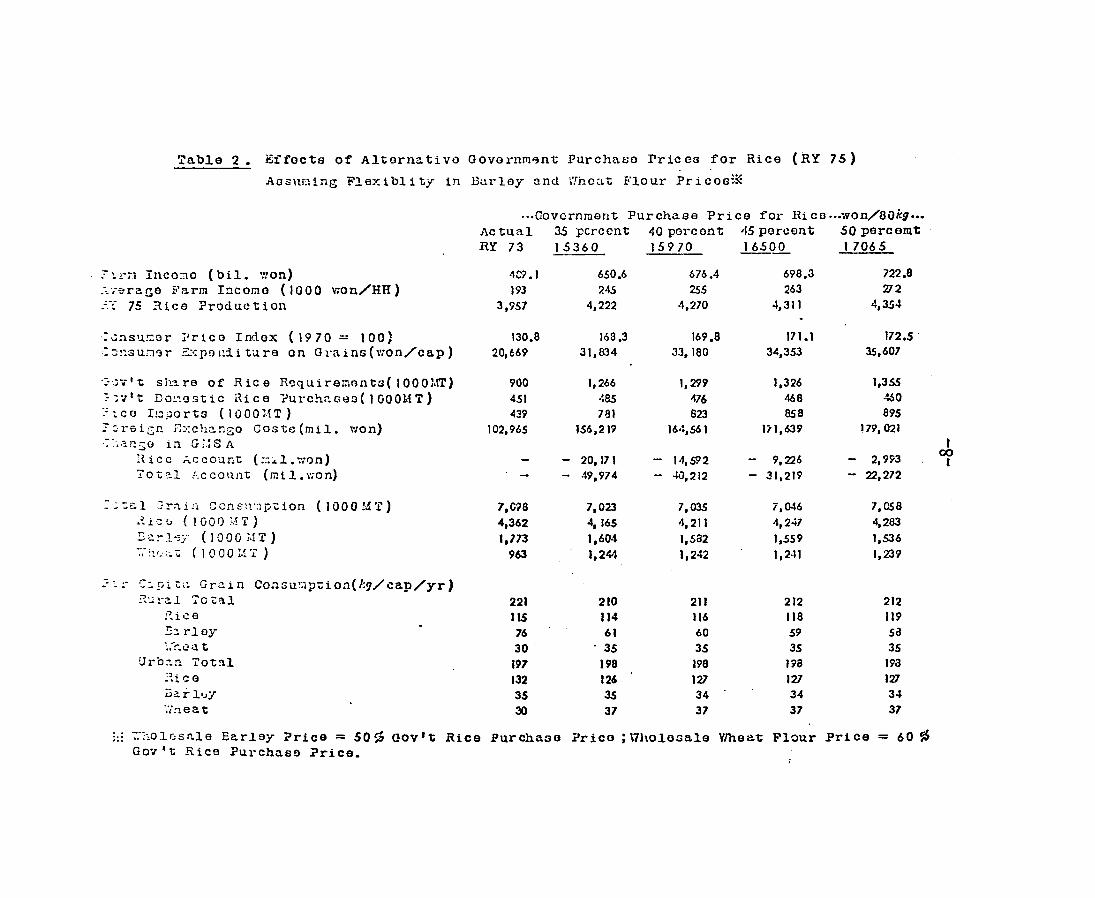
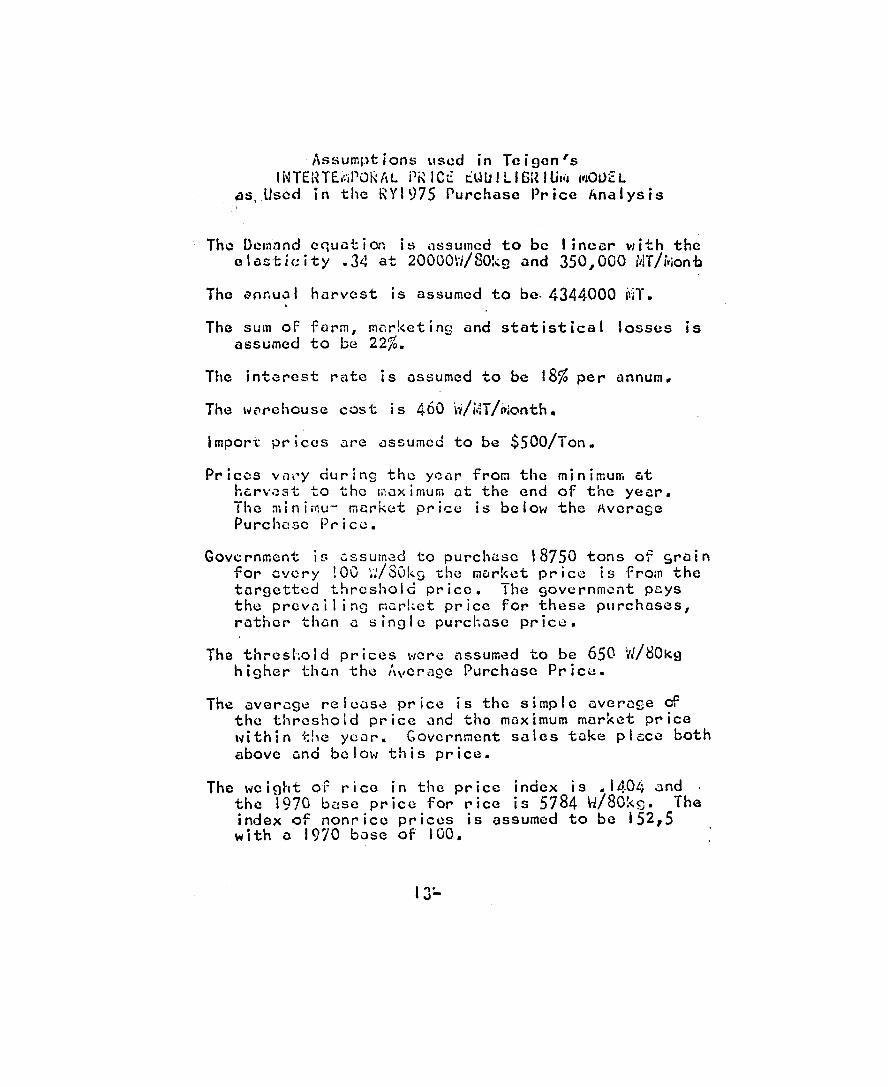