A4 Odeon & UCI Finco plc - Amazon S3 · the solicitation of an offer to buy securities in odeon....
26
Odeon & UCI Finco plc FY 2013 Investor Presentation 20 March 2014
Transcript of A4 Odeon & UCI Finco plc - Amazon S3 · the solicitation of an offer to buy securities in odeon....
A4 FORMAT
Please don’t
change page set
up to A3, print to
A3 paper and fit
to scale
41
170
224
253
208
48
198
96
127
182
143
2
Odeon & UCI Finco plc
FY 2013 Investor Presentation
20 March 2014

A4 FORMAT
Please don’t
change page set
up to A3, print to
A3 paper and fit
to scale
41
170
224
253
208
48
198
96
127
182
143
2
Disclaimer
DISCLAIMER
THIS DOCUMENT HAS BEEN PREPARED BY ODEON & UCI FINCO PLC (“ODEON”). BY REVIEWING THIS
DOCUMENT OR PARTICIPATING IN THE CONFERENCE CALL THAT PRESENTS IT, YOU AGREE TO BE BOUND
BY THE FOLLOWING CONDITIONS.
THIS DOCUMENT IS FOR INFORMATION PURPOSES ONLY AND DOES NOT CONSTITUTE AN OFFER TO SELL OR
THE SOLICITATION OF AN OFFER TO BUY SECURITIES IN ODEON. FURTHERMORE, IT DOES NOT CONSTITUTE
A RECOMMENDATION BY ODEON OR ANY OTHER PARTY TO SELL OR BUY SECURITIES IN ODEON OR ANY
OTHER SECURITIES. ALL WRITTEN OR ORAL FORWARD-LOOKING STATEMENTS ATTRIBUTABLE TO ODEON
OR PERSONS ACTING ON THEIR BEHALF ARE QUALIFIED IN THEIR ENTIRETY BY THESE CAUTIONARY
STATEMENTS.
Unaudited Information
This document contains financial information regarding ODEON and its fellow subsidiaries (the “Group”). Such financial
information may not have been audited, reviewed or verified by any independent accounting firm. The inclusion of such
financial information in this document or any related presentation should not be regarded as a representation or warranty
by ODEON, any of its respective affiliates, advisors or representatives or any other person as to the accuracy or
completeness of such information’s portrayal of the financial condition or results of operations by the Group.
Non-GAAP information
We have presented certain non-GAAP information in this document. As used in this document, this information includes
‘‘EBITDA’’, which represents earnings before interest, tax, depreciation, amortisation, exceptional items and strategic
costs. Our management believes that EBITDA is meaningful for investors because it provides an analysis of our
operating results, profitability and ability to service debt and because EBITDA is used by our chief operating decision
makers to track our business evolution, establish operational and strategic targets and make important business
decisions. In addition, we believe that EBITDA is a measure commonly used by investors and other interested parties in
our industry.
2

A4 FORMAT
Please don’t
change page set
up to A3, print to
A3 paper and fit
to scale
41
170
224
253
208
48
198
96
127
182
143
2
Forward-Looking Statements
Forward-Looking Statements
This document includes forward-looking statements. When used in this document, the words “anticipate”,
“believe”, “estimate”, “forecast”, “expect”, “intend”, “plan” and “project” and similar expressions, as they relate to
ODEON, its management or third parties, identify forward-looking statements. Forward-looking statements
include statements regarding ODEON’s business strategy, financial condition, results of operations, and market
data, as well as any other statements that are not historical facts. These statements reflect beliefs of ODEON’s
management, as well as assumptions made by its management and information currently available to ODEON.
Although ODEON believes that these beliefs and assumptions are reasonable, the statements are subject to
numerous factors, risks and uncertainties that could cause actual outcomes and results to be materially different
from those projected. These factors, risks and uncertainties expressly qualify all subsequent oral and written
forward-looking statements attributable to ODEON or persons acting on its behalf.
3

A4 FORMAT
Please don’t
change page set
up to A3, print to
A3 paper and fit
to scale
41
170
224
253
208
48
198
96
127
182
143
2
Contents
Highlights
EBITDA
Markets, Films and 3D
KPIs, Margins and Costs
Spain
Cash Flow, Net Debt and Leverage
2013 Activity Highlights
Current Trading and Outlook
4

A4 FORMAT
Please don’t
change page set
up to A3, print to
A3 paper and fit
to scale
41
170
224
253
208
48
198
96
127
182
143
2
Highlights
5
Q4 EBITDA was £33.2m, our second highest quarter on record.
- Operating costs Like For Like were reduced, particular progress in Spain.
- Gross profit margin improved.
- Group market share for the year has remained broadly stable.
- Good local content in Italy and Germany
- But did not match the exceptional Q4 2012 with Skyfall in the UK and Germany and Impossible
in Spain.
Good progress to position the business for volume recovery.
Strong finish to year did not fully compensate for weaker quarters mid-year.
Markets down 5% for the year overall.
- Very hot summer.
- Weaker slate.
- Spain.
Strong working capital release of £37m in the quarter. Net Debt was reduced by £108m, repaying the
revolver and leaving cash on balance sheet of £40m at year end.
PropCo asset disposals progressed well and expected to be completed by end Q1.

A4 FORMAT
Please don’t
change page set
up to A3, print to
A3 paper and fit
to scale
41
170
224
253
208
48
198
96
127
182
143
2
0.0
10.0
20.0
30.0
40.0
50.0
60.0
2009 2010 2011 2012 2013
£m
Q1 Q2 Q3 Q4
Quarterly EBITDA
6
Long hot
summer,
depressed
Spain
Avatar
Skyfall & prior year
one off (£9m)
Olympics
& Euros
Q4 2013 EBITDA was our second highest earning quarter on record.
£9m

A4 FORMAT
Please don’t
change page set
up to A3, print to
A3 paper and fit
to scale
41
170
224
253
208
48
198
96
127
182
143
2
Total Market by Major Territory
7 (1) Average of all our territories’ market attendances, weighted on our 2012 attendances.
Q4 2013 Variance FY 2013 Variance
Odeon UCI
Attendance
FY Growth %
UK Market Attendance (k) 40,350 (19.1%) 165,540 (4.0%)
Germany Market Attendance (k) 40,265 (5.6%) 129,675 (4.0%)
Italy Market Attendance (k) 37,020 10.1% 106,007 5.9%
Spain Market Attendance (k) 22,889 (19.5%) 79,712 (15.3%)
Average Weighted Market(1) incl. Spain (11.2%) (4.8%) (2.9%)
Average Weighted Market(1) excl. Spain (8.8%) (1.6%) (0.4%)
Q4 market attendance(1) was 11% below 2012, largely due to the strength of last year’s
blockbuster Skyfall, especially in UK and Germany, and The Impossible in Spain. The Italian
market was ahead of Q4 2012 as Sole A Catinelle played, the biggest film in Italy since
Titanic in 1998, and F**k Ju Gohte played well in Germany.
Full Year market attendance(1) was down 5% overall. Italy was up, UK and Germany down,
Spain significantly so. Excluding Spain, Full Year market attendance(1) was down 2%.
Group attendance for the year performed better than the market, including and excluding
Spain.
Full Year Attendance Growth Ahead of Market in Spain and Italy

A4 FORMAT
Please don’t
change page set
up to A3, print to
A3 paper and fit
to scale
41
170
224
253
208
48
198
96
127
182
143
2
Top Films Q4
8
2012 2013 % change
Q4 Actual
(GBO £m)
Q4 Actual
(GBO £m)
Skyfall 100 Hunger Games: Catching Fire 32
Hobbit: An Unexpected Journey
(2D&3D) 37
Hobbit: The Desolation Of Smaug
(2D&3D) 32
Twilight Saga: Breaking Dawn - Part 2 35 Gravity (2D&3D) 27
Taken 2 24 Frozen (2D&3D) 26
Madagascar 3: Europe's Most Wanted
(2D&3D) 22 Thor: The Dark World (2D&3D) 20
Top 5 Total 219 Top 5 Total 137 (37%)
Total Market 357 Total Market 296 (17%)
In UK & Ireland, Skyfall
dominated the market in
Q4 2012, dwarfing this
year’s winner, The
Hunger Games: Catching
Fire. This year’s
instalment of The Hobbit
was weaker than last
year’s.
In Germany, although the
local and top title of Q4
2013, F**k Ju Gohte,
played very strongly, it fell
short of the success of
Skyfall last year.
Q4 Actual
(Adm m)
Q4 Actual
(Adm m)
Skyfall 7.2 F**k Ju Göhte 5.5 Hobbit: An Unexpected Journey
(2D&3D) 4.3
Hobbit: The Desolation Of Smaug
(2D&3D) 4.4
Madagascar 3: Europe's Most Wanted
(2D&3D) 3.8 Hunger Games: Catching Fire 3.4
Twilight Saga: Breaking Dawn - Part 2 3.4 Frozen (2D&3D) 3.3 Hotel Transylvania (2D&3D) 1.1 Thor: The Dark World (2D&3D) 1.4 Top 5 Total 19.9 Top 5 Total 18.1 (9%)
Total Market 42.6 Total Market 40.3 (6%)
UK & Ireland
Germany
Local titles in red

A4 FORMAT
Please don’t
change page set
up to A3, print to
A3 paper and fit
to scale
41
170
224
253
208
48
198
96
127
182
143
2
Top Films Q4 (cont.)
9
In Italy, the top film
this year in Q4
was the record
breaking local title,
Sole A Catinelle,
which drew the
strongest
audiences since
Titanic in 1998.
In Spain, the Top
2 films of last year,
The Impossible,
and Twilight were
screened in Q4.
There was a lack
of comparable
blockbusters this
year. Local titles in red
Q4 Actual
(Adm m)
Q4 Actual
(Adm m)
The Impossible 5.9 Hobbit: The Desolation Of Smaug
(2D&3D) 1.9
Twilight Saga: Breaking Dawn - Part 2 3.2 Frozen (2D&3D) 1.9
Hobbit: An Unexpected Journey
(2D&3D) 2.2 Hunger Games: Catching Fire 1.6
Hotel Transylvania (2D&3D) 1.7 Gravity (2D&3D) 1.2
Skyfall 1.5 Thor: The Dark World (2D&3D) 1.0
Top 5 Total 14.5 Top 5 Total 7.7 (47%)
Total Market 28.4 Total Market 22.9 (19%)
2012 2013
%
change Q4 Actual
(Adm m)
Q4 Actual
(Adm m)
Twilight Saga: Breaking Dawn - Part 2 3.1 Sole A Catinelle 8.7 Ice Age 4: Continental Drift (2D&3D) 2.6 Despicable me 2 (2D&3) 2.6
Skyfall 2.1 Frozen (2D&3D) 1.9 Ted 1.8
Hobbit: The Desolation Of Smaug
(2D&3D) 1.6
Hobbit: An Unexpected Journey
(2D&3D) 1.8 Colpi Du Fortuna 1.4
Top 5 Total 11.4 Top 5 Total 16.2 +42%
Total Market 33.6 Total Market 37.0 +10%
Spain
Italy

A4 FORMAT
Please don’t
change page set
up to A3, print to
A3 paper and fit
to scale
41
170
224
253
208
48
198
96
127
182
143
2 18%
22%
26%
21%
10%
31%
17%
13%
20%
25%
13%
24%
0%
5%
10%
15%
20%
25%
30%
35%
Q1 Q2 Q3 Q42011 2012 2013
3D Quarterly Performance
3D represented 24% of the UK & Ireland market BOR, higher than Q4 last year when 2D product dominated
(Skyfall, Twilight).
There were more 3D titles on release in Q4 this year and four of the Top 5 films were 3D, only two last year.
Gravity played particularly well in 3D.
Avengers
Titanic
Harry
Potter 7.2
UK
& I
rela
nd M
ark
et
3D
BO
R a
s %
of
Tota
l B
OR
2013 included more 3D films than in 2012 10
UK & Ireland Market 3D Box Office Revenue (BOR) as a percentage of Total BOR
Tangled
Skyfall
Twilight
In 2D
Iron man 3,
Man of Steel
Ice Age 4
Spiderman
Tin Tin
Lion King 3D
Life of Pi
The Hobbit
Gravity
Frozen
Thor

A4 FORMAT
Please don’t
change page set
up to A3, print to
A3 paper and fit
to scale
41
170
224
253
208
48
198
96
127
182
143
2
107.8 110.0101.6 98.4 94.2
79.7
0
20
40
60
80
100
120
2008 2009 2010 2011 2012 2013
129.4146.3
126.6 129.6 135.1 129.7
020406080
100120140160
2008 2009 2010 2011 2012 2013
111.0 109.0120.6
112.1
100.1106.0
0
20
40
60
80
100
120
140
2008 2009 2010 2011 2012 2013
162.5172.9 168.8 172.1 172.5 165.5
0
50
100
150
200
2008 2009 2010 2011 2012 2013
Full Year Market Attendance
2013 was the weakest of four of the previous five years in the UK and Italy.
2013 was weaker than the previous five years in Spain.
11
Territory Market attendances were below their recent averages
UK 2008 – 2013 Market
Germany 2008 – 2013 Market Italy 2008 – 2013 Market
Spain 2008 – 2013 Market
6 year average 6 year average
6 year average 6 year average

A4 FORMAT
Please don’t
change page set
up to A3, print to
A3 paper and fit
to scale
41
170
224
253
208
48
198
96
127
182
143
2
17.4%
18.0%
18.5%
18.9%
18.2%
18.4%18.5%
18.6%
18.4% 18.4%
16.5%
17.0%
17.5%
18.0%
18.5%
19.0%
Q1 Q2 Q3 Q4 Full Year
2012 2013
Group Average Market Share
12
Full Year market share broadly stable
Market share(1) in Q4 did not compare to the strong performance achieved last year, particularly
on Skyfall. Our estate tends to perform better on blockbusters and with higher levels of market
attendance. Nevertheless, market share(1) increased marginally year on year.
(1) Weighted average of all our territories’ attendance market shares.
Mark
et share
(1)
Group Weighted Average Market Share(1)

A4 FORMAT
Please don’t
change page set
up to A3, print to
A3 paper and fit
to scale
41
170
224
253
208
48
198
96
127
182
143
2
Revenue was down more than attendance, mostly because of a fall in screen advertising and advanced booking fees
compared to the strong income surrounding Skyfall last year.
ATP in Q4 was below last year due to promotional activity. Favourable 3D in the UK came from the strength of Gravity, which
also boosted IMAX premia, whilst overlength film product and associated premia took Germany’s ATP ahead.
RPH in Q4 was ahead of prior year. UK and Germany were up from the continuing benefit of initiatives. Spain and Italy
continued to suffer from restrained consumer spend, exacerbated by the strong box office promotions which attracted more
value-conscious guests.
Other revenue(2) was down mostly because last year saw strong Screen Advertising and booking fees around the Skyfall
release and digital related revenue (VPFs) before external funding was completed.
Q4 and Full Year 2013 KPIs
13
QUARTER 4 FULL YEAR
LIKE-FOR-LIKE TOTAL ESTATE LIKE-FOR-LIKE TOTAL ESTATE
Q4
2013
Variance
from 2012
Fav/(Adv)
Q4
2013
Variance
from 2012
Fav/(Adv)
Full Year
2013
Variance
from 2012
Fav/(Adv)
Full Year
2013
Variance
from 2012
Fav/(Adv)
Paid Attendance (m) 22.4 (13.2%) 23.0 (12.1%) 77.8 (4.5%) 80.0 (2.9%)
Average Ticket Price(1)
(£) 5.93 (2.3%) 5.95 (2.7%) 5.99 (2.3%) 6.00 (2.7%)
Retail Revenue per head(1)
(£) 1.96 0.9% 1.97 1.0% 2.03 1.8% 2.04 2.1%
Other Revenue(1,2)
(£m) 19.5 (11.2%) 20.3 (10.2 %) 61.4 (8.7%) 64.0 (7.3%)
Group Revenue(1)
(£m) 196.7 (15.1%) 202.3 (14.3%) 685.5 (6.3%) 706.7 (4.8%)
(1) Based on constant FX rates.
(2) Including screen advertising

A4 FORMAT
Please don’t
change page set
up to A3, print to
A3 paper and fit
to scale
41
170
224
253
208
48
198
96
127
182
143
2 Gross profit margin(1) in Q4 was higher than last year, mostly from lower film hire.
Operating costs were tightly controlled. Excluding the prior year one-off rent benefit, Full Year like-for-like was 2.1%
favourable. Savings came in particular from staff costs and rent:
- Comparable rent costs in Spain and Italy were below last year, despite inflationary pressure, following landlord
negotiations.
- Staff cost savings from the digital transition across the Group were £5.3m. Savings will continue through to the
2014 run rate, in particular in the UK, following the implementation of the next phase of efficiencies from the digital
transition which commenced in Q4.
EBITDA margin decreased in Q4 due to the lower volume on a partly fixed cost base. Full Year also decreased, but
excluding the prior year one-off credit to rent, EBITDA margin was in line with 2012 because of strong focus on cost
savings.
2013 Q4 and Full Year Margins & Costs
14 (1) Based on constant FX rates.
(2) Based on historic FX rates.
QUARTER 4 FULL YEAR
LIKE-FOR-LIKE TOTAL ESTATE LIKE-FOR-LIKE TOTAL ESTATE
Q4
2013
Variance from
2012
Fav/(Adv)
Q4
2013
Variance from
2012
Fav/(Adv)
Full Year
2013
Variance
from 2012
Fav/(Adv)
Full Year
2013
Variance
from 2012
Fav/(Adv)
Group Revenue(1)
(£m) 196.7 (15.1%) 202.3 (14.3%) 685.5 (6.3%) 706.7 (4.8%)
Gross Profit(1)
(£m) 127.4 (11.9%) 131.1 (11.0%) 442.9 (5.2%) 457.0 (3.7%)
Gross Profit Margin (%) 64.7% 2.4% pts 64.8% 2.4%pts 64.6% 0.7%pts 64.7% 0.7%pts
Operating Costs(1)
(£m) (95.5) (4.1%) (97.9) (5.3%) (376.8) 0.6% (387.8) (1.3%)
EBITDA (1)
(£m) 31.9 (39.7%) 33.2 (38.9%) 66.0 (25.2%) 69.2 (24.5%)
EBITDA Margin (%) 16.2% (6.3% pts) 16.4% (6.3%pts) 9.6% (2.3%pts) 9.8% (2.4% pts)
EBITDA (2)
(£m) 31.9 (38.9%) 33.2 (38.1%) 66.0 (24.5%) 69.2 (23.8%)

A4 FORMAT
Please don’t
change page set
up to A3, print to
A3 paper and fit
to scale
41
170
224
253
208
48
198
96
127
182
143
2
Cost Savings
Costs were managed tightly last year, and efficiencies improved, with
significant savings achieved against what would have been incurred if
no action had been taken.
2014 will benefit from the flow through of run rate savings as well as
new savings targeted.
Group Employment costs
- Digital savings resulted in over £5m incremental savings in 2013 with a
further £2m run rate benefit in 2014.
- Staff cost savings in Spain in 2013 of £3m and elsewhere £1m, and a
further £1m run rate savings to come in 2014.
Group Operating Costs and Support Office
- £6m lower than 2012 inflated.
Group Rent
- A mixture of long and short term agreements resulted in savings in 2013 of
over £4m with a further £2m run rate savings to come in 2014.
- Additional reductions are targeted in 2014.
15
Note: The above charts are based on LFL costs, with 2012 rent
adjusted for £9m PY landlord contribution . Inflationary increases
of 2% assumed.
122115
9
2
9095
100105110115120125130
2012 Infl. increase
Saving 2013
£m
Group Employment Costs
136 133
63
90
100
110
120
130
140
150
2012 Infl. increase
Saving 2013
£m
Group Operating/ Support Office Costs
130 129
43
9095
100105110115120125130135
2012 Infl. increase
Saving 2013
£m
Group Rent

A4 FORMAT
Please don’t
change page set
up to A3, print to
A3 paper and fit
to scale
41
170
224
253
208
48
198
96
127
182
143
2
Excluding Spain, attendance was in line with
2012, from increased share in markets down
2%.
ATP was lower than last year because of a
lower 3D proportion and promotional activity,
but RPH was ahead.
EBITDA was 9% behind last year, due to one
off credits in 2012.
Excluding Spain and also the prior year one-
off benefit to rent (adjustment of landlord
contribution accounting), EBITDA was 2%
down.
EBITDA margin was 11.9%, (1.0%) pts lower
than 2012, or in line with 2012 when the prior
year one-off benefit is also excluded.
Group Highlights Excluding Spain
16
Full Year YoY
% Growth Group
Group
excl.
Spain
Group excl.
Spain and
2012 one-
off
Attendance (3%) - -
ATP(1) (3%) (2%) (2%)
RPH(1) +2% +3% +3%
Other revenue
& screen ads(2) (7%) (5%) (5%)
Revenue(2) (5%) (2%) (2%)
EBITDA(3) (24%) (9%) (2%)
(1) At constant FX rates and constant territory weighting, for major territories.
(2) At constant FX rates.
(3) At historic FX rates.

A4 FORMAT
Please don’t
change page set
up to A3, print to
A3 paper and fit
to scale
41
170
224
253
208
48
198
96
127
182
143
2
7.3%
14.7% 15.4% 15.4%
20.6% 21.6%
0.0%
5.0%
10.0%
15.0%
20.0%
25.0%
2005 2009 2010 2011 2012 2013
Spain
17
Decline in the number of screens in the
Spanish market
In Spain, market attendance was down on prior year (15% full year,
19% Q4), with the impact of the September 2012 VAT increase on
ticket prices exacerbated by the weak economy and high
unemployment. Market attendance was down in Q4 due to strong
admissions in The Impossible in 2012.
Competitors’ screens have been closing, further correcting the historic
over-screening in the country.
We have been repositioning the business for lower market volumes
and to be able to capitalise on recovery from a position of strength:
– We have closed 3 loss-making cinemas.
– We have been renegotiating costs, staff cost and rent in particular, down
respectively 14% and 5% (excluding Landlord Contribution) versus prior year
for the Like-for-Like estate.
– We have continued to gain attendance market share to over 21% in 2013, the
clear #1 in the market, over 8% pts ahead of our nearest rival.
The underlying demand for cinema is still present.
In 2014, there are some early signs that the economy may be turning
(see next slide).
Attendance Market Share
Q4 Market Attendance
4,401
4,082
3,832
3,500
3,600
3,700
3,800
3,900
4,000
4,100
4,200
4,300
4,400
4,500
2005 2009 2013** Estimated
2326
28
23
0
5
10
15
20
25
30
2010 2011 2012 2013

A4 FORMAT
Please don’t
change page set
up to A3, print to
A3 paper and fit
to scale
41
170
224
253
208
48
198
96
127
182
143
2
Spain Macroeconomic Conditions
18
2013 2014
GDP (1.4%) 0.9%
Unemployment 26.4% 25.6%
CPI (%) Average 1.4% 0.5%
Source: Historic information from National Statistics Institute, forecasts from BBVA research.
Macro-economic indicators may be turning in Spain: unemployment has started to fall slightly, whilst
Retail Sales grew in Q3 and Q4. Some banks are forecasting a positive 2014.
BBVA Annual Forecast
8.3
11.3
18.0 20.1
21.6
25.0 27.2 26.3 26.0 26.0
0.0
5.0
10.0
15.0
20.0
25.0
30.0
2007 2008 2009 2010 2011 2012 Q12013
Q22013
Q32013
Q42013
%
Unemployment rate
(2.1)
(7.5)
(1.2)
(4.5)
(6.5)
(10.8) (10.8)
(6.9)
2.1
0.3
(12.0)
(10.0)
(8.0)
(6.0)
(4.0)
(2.0)
0.0
2.0
4.0
2007 2008 2009 2010 2011 2012 Q12013
Q22013
Q32013
Q42013
%
Annual Retail Sales Movement
0.6
0.3
0.0
(0.6)
(1.2)
(1.6) (1.7)
(2.1) (2.0)
(1.6)
(1.1)
(0.1)
0.9
(2.5)
(2.0)
(1.5)
(1.0)
(0.5)
0.0
0.5
1.0
1.5
%
Quarterly GDP Movement

A4 FORMAT
Please don’t
change page set
up to A3, print to
A3 paper and fit
to scale
41
170
224
253
208
48
198
96
127
182
143
2
Odeon Property Group
19
In the Q3 investor presentation we described
how Odeon Property Group had sold 16 of its
properties and used the proceeds to repay
bank debt and £13m of loans from
OUCG/OUCH, which was contributed as
equity to the bond group.
By the year end, an additional 6 properties
were sold bringing the total equity contributed
to the bond group to £27m.
The disposals resulted in £29m of finance
leases being reclassified as operating leases,
reducing net debt.
Completion on the remaining 6 properties will
be before quarter end, leading to an
anticipated further contribution to Opco of
over £16m.
A4 FORMAT
Please don’t
change page set
up to A3, print to
A3 paper and fit
to scale
41
170
224
253
208
48
198
96
127
182
143
2
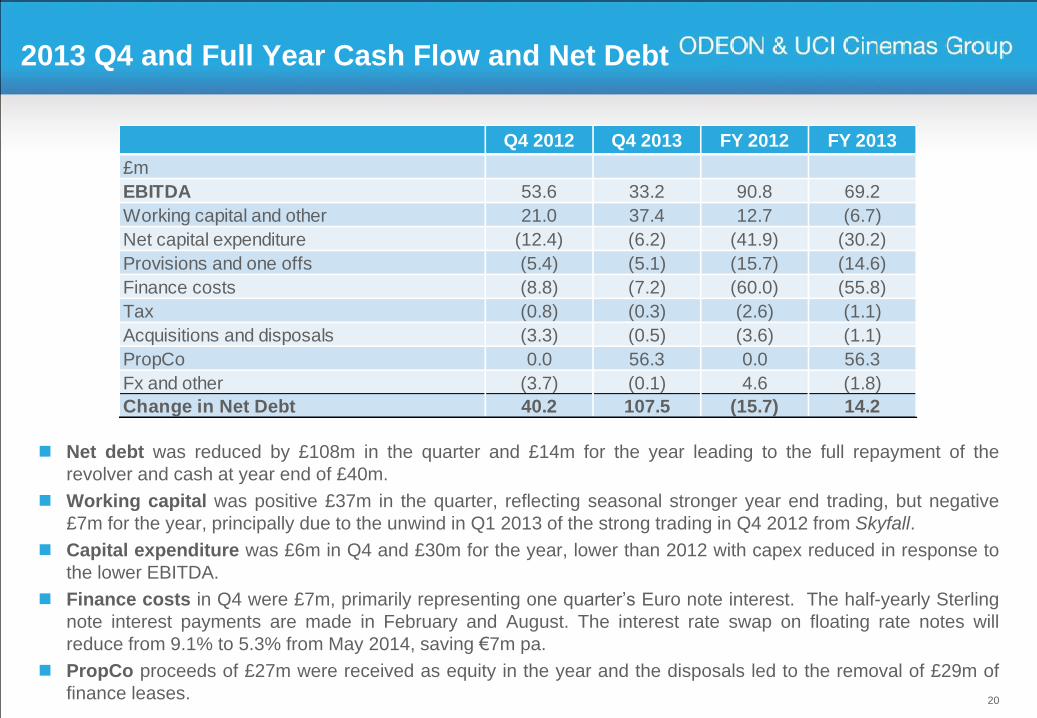
2013 Q4 and Full Year Cash Flow and Net Debt
Net debt was reduced by £108m in the quarter and £14m for the year leading to the full repayment of the
revolver and cash at year end of £40m.
Working capital was positive £37m in the quarter, reflecting seasonal stronger year end trading, but negative
£7m for the year, principally due to the unwind in Q1 2013 of the strong trading in Q4 2012 from Skyfall.
Capital expenditure was £6m in Q4 and £30m for the year, lower than 2012 with capex reduced in response to
the lower EBITDA.
Finance costs in Q4 were £7m, primarily representing one quarter’s Euro note interest. The half-yearly Sterling
note interest payments are made in February and August. The interest rate swap on floating rate notes will
reduce from 9.1% to 5.3% from May 2014, saving €7m pa.
PropCo proceeds of £27m were received as equity in the year and the disposals led to the removal of £29m of
finance leases. 20
Q4 2012 Q4 2013 FY 2012 FY 2013
£m
EBITDA 53.6 33.2 90.8 69.2
Working capital and other 21.0 37.4 12.7 (6.7)
Net capital expenditure (12.4) (6.2) (41.9) (30.2)
Provisions and one offs (5.4) (5.1) (15.7) (14.6)
Finance costs (8.8) (7.2) (60.0) (55.8)
Tax (0.8) (0.3) (2.6) (1.1)
Acquisitions and disposals (3.3) (0.5) (3.6) (1.1)
PropCo 0.0 56.3 0.0 56.3
Fx and other (3.7) (0.1) 4.6 (1.8)
Change in Net Debt 40.2 107.5 (15.7) 14.2

A4 FORMAT
Please don’t
change page set
up to A3, print to
A3 paper and fit
to scale
41
170
224
253
208
48
198
96
127
182
143
2
Debt and Leverage
LTM EBITDA decreased, as Q4 2013 EBITDA couldn’t match the record breaking last
quarter from 2012.
Cash flow was particularly strong in Q4, reducing year end net debt to £436m.
Despite the reduction in net debt, leverage increased to 6.1x due to the lower LTM
EBITDA.
21
(1) Proforma adjustments for Q4 2013 relate to Digital cost savings and new sites.
Q4 2012 Q1 2013 Q2 2013 Q3 2013 Q4 2013
LTM EBITDA £m 91 97 93 90 69
Proforma adjustments(1)
£m 6 4 3 2 3
Proforma LTM EBITDA £m 97 101 96 92 72
Net Debt £m 450 500 511 544 436
Net Debt to EBITDA 4.6x 4.9x 5.3x 5.9x 6.1x
Fixed Charge Cover 2.6x 2.7x 2.6x 2.5x 1.9x

A4 FORMAT
Please don’t
change page set
up to A3, print to
A3 paper and fit
to scale
41
170
224
253
208
48
198
96
127
182
143
2
2013 Q4 and Full Year Activity Highlights
New Sites
– In October, Trowbridge with 7 screens.
– In December, Villesse, Italy, with 7 screens.
– Earlier we opened Gualtieri in Italy (3 screens) and West Bromwich (5 screens).
– At the end of December we operated 239 cinemas with 2,191 screens.
Retail Innovation
– Lobby refurbishment at Vienna SCS, adding a coffee bar.
– Our first Coffee Republic opened during December at Glasgow Braehead.
– New Costa Coffee at Trowbridge took our total UK Costa Coffee outlets to 41.
Digital – New digital plasma screens in Germany.
State-of-the-art LED signage across 3 substantial panels onto the front of Odeon
Leicester Square.
22

A4 FORMAT
Please don’t
change page set
up to A3, print to
A3 paper and fit
to scale
41
170
224
253
208
48
198
96
127
182
143
2
Note: Based on UK slate phasing, top 5 films of each year in red.
2014 Estimated Top 20 Title Phasing
The slate seems to be evenly phased compared to previous years, and has a stronger Q3 than 2013.
2013 Top 20 2014 Top 20
Q1 Life of Pi 3D Lego 3D
Les Miserables IMAX Captain America 2: Winter Soldier 3D
Django Unchained Mr Peabody and Sherman 3D
Wreck-It Ralph 3D Muppets Most Wanted
The Croods 3D The Wolf of Wall Street
The Hobbit: An Unexpected Journey 3D IMAX 12 Years a Slave
Q2 Iron Man 3 3D IMAX The Amazing Spiderman 2 3D IMAX
Star Trek Into Darkness 3D IMAX X-Men: Days of Future Past 3D
Fast and Furious 6 Godzilla 3D IMAX
The Great Gatsby 3D Rio 2 3D
The Hangover Part III
Man of Steel IMAX
Q3 Despicable Me 2 3D How to Train Your Dragon 2 3D IMAX
Monsters University 3D Inbetweeners 2
Dawn of the Planet of the Apes 3D
Transformers 4 3D IMAX
Guardians of the Galaxy 3D IMAX
Q4 Thor: The Dark World 3D IMAX The Hunger Games: Mockingjay Part 1 IMAX
Gravity 3D IMAX The Hobbit: There and Back Again 3D IMAX
Hunger Games: Catching Fire IMAX Interstellar IMAX
Captain Phillips Paddington Bear
Frozen 3D Taken 3
The Hobbit: The Desolation of Smaug 3D IMAX
23

A4 FORMAT
Please don’t
change page set
up to A3, print to
A3 paper and fit
to scale
41
170
224
253
208
48
198
96
127
182
143
2
Current Trading and Outlook
The year has got off to a good start, with the ‘awards season’ films playing well (e.g. 12
Years A Slave, The Wolf of Wall Street and American Hustle) and, adjusting for Easter,
Q1 markets are expected to be comparable to Q1 2013.
Growth in our portfolio continues, with three sites taken over in Italy, for a small amount
of capex. We are looking at similar opportunities in Spain.
Run-rate benefits of approximately £5m of cost savings made in 2013 will flow into 2014
EBITDA. Finance costs will reduce by €7m pa from May.
A rebound in the Spanish economy would see a recovery in the cinema market, and
economic recovery across Europe is expected to see increases in revenue KPIs and
screen advertising, but we are not building these into our expectations for 2014,
because timing is uncertain. These recovery factors would be upside.
2014 film slate looks to be well balanced across the year with some good IMAX and 3D
titles, as well as local content.
24

A4 FORMAT
Please don’t
change page set
up to A3, print to
A3 paper and fit
to scale
41
170
224
253
208
48
198
96
127
182
143
2
Q&A & AOB
Any questions?
Further questions can be addressed below: – Email: [email protected]
– PR: [email protected]
– Financial PR: [email protected]
25

A4 FORMAT
Please don’t
change page set
up to A3, print to
A3 paper and fit
to scale
41
170
224
253
208
48
198
96
127
182
143
2
Films to come
26


![Roman odeon en[1]](https://static.fdocuments.us/doc/165x107/557e9f8cd8b42a1d048b535c/roman-odeon-en1.jpg)