A2A 2007 Results & 2008-2012 Plan · Luxottica 8.2 Stm 7.3 Mediaset 7.0 Terna 5.6 AEM 4.9 Parmalat...
42
A2A 2007 Results & 2008-2012 Plan Milan, April 1 st 2008 Analyst Presentation
Transcript of A2A 2007 Results & 2008-2012 Plan · Luxottica 8.2 Stm 7.3 Mediaset 7.0 Terna 5.6 AEM 4.9 Parmalat...

A2A 2007 Results & 2008-2012 Plan
Milan, April 1st 2008
Analyst Presentation
This information was prepared by A2A and it is not to be relied on by any 3rd party without A2A’s prior written consent. 2
• Strategic OverviewGiuliano Zuccoli
• Asset & Business OutlinePaolo Rossetti
• FY 2007 Results & 2008-2012 Business PlanRenato Ravanelli
• Final remarks
• Q&A
Agenda

This information was prepared by A2A and it is not to be relied on by any 3rd party without A2A’s prior written consent. 3
Creation of a new player (1st Jan 2008)
DELMI
TdE
MUNICIPALITY OF BERGAMO (2%)
MUNICIPALITY OF MILAN (27.5%)
MUNICIPALITY OF BRESCIA (27.5%)
MARKET & OTHER SHAREHOLDERS
(43%)
*As of average value of market capitalization since Jan, 1th 2008
SHAREHOLDERS
STRATEGIC PARTNERSHIPS
• Shares out: 3.1B• Mkt cap: €8.3B*• Shares out: 3.1B• Mkt cap: €8.3B*

This information was prepared by A2A and it is not to be relied on by any 3rd party without A2A’s prior written consent. 4
EN
I
90.8
Enel
45.4
Tel
ecom
32.0
Fiat
18.1
Ten
aris
16.6
Atlan
tia
12.6
Sai
pem
11.3Fi
nm
ecca
nic
a8.6
Snam
RG
8.6
A2
A
8.3
Luxo
ttic
a
8.2
Stm
7.3
Med
iase
t
7.0
Ter
na
5.6
AEM
4.9
Parm
alat
4.0
Pire
lli
3.7
Lott
om
atic
a
3.5
AS
M
3.5
Note: AEM and ASM average market capitalization values since July, 1th 2007
10°
Energy/Waste
Industrial goods/services
JAN-MAR 2008 AVERAGE MARKET CAPITALIZATION (€B) ITALY - S&P MIB, INDUSTRIAL COMPANIES
A significant player in Italy

This information was prepared by A2A and it is not to be relied on by any 3rd party without A2A’s prior written consent. 5
EdF
123.5
EN
I
90.8
E.O
n
89.3
Suez
55.5
RW
E
47.0
Enel
45.4G
dF
37.3Endes
a35.1
Veo
liaEnv.
25.7
Gas
Nat
ura
l
17.3
Cen
tric
a
15.8
A2
A
8.3
British
Ener
gy
7.6
AE
M
4.9
Dis
trig
az
3.9
AS
M
3.5
Pennon
3.0
Biffa
1.6
JAN-MAR 2008 AVERAGE MARKET CAPITALIZATION (€B) EUROPE - ENERGY/WASTE OPERATORS
A growing player in the European competition arena
Note: AEM and ASM average market capitalization values since July, 1th 2007
This information was prepared by A2A and it is not to be relied on by any 3rd party without A2A’s prior written consent. 6
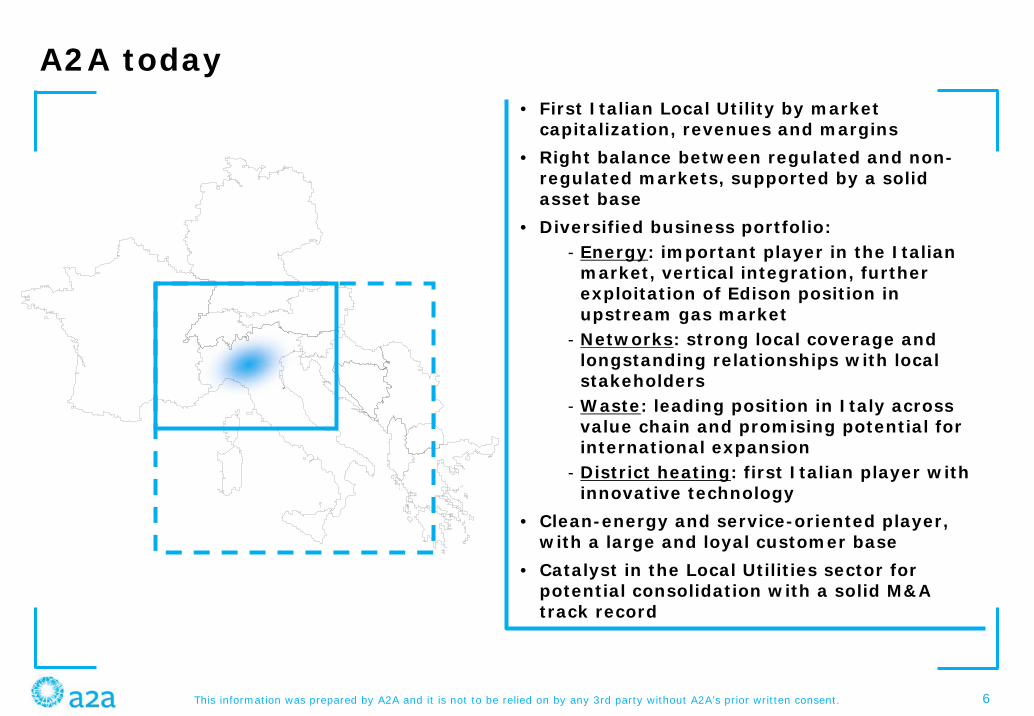
A2A today• First Italian Local Utility by market
capitalization, revenues and margins
• Right balance between regulated and non-regulated markets, supported by a solid asset base
• Diversified business portfolio:- Energy: important player in the Italian
market, vertical integration, further exploitation of Edison position in upstream gas market
- Networks: strong local coverage and longstanding relationships with local stakeholders
- Waste: leading position in Italy across value chain and promising potential for international expansion
- District heating: first Italian player with innovative technology
• Clean-energy and service-oriented player, with a large and loyal customer base
• Catalyst in the Local Utilities sector for potential consolidation with a solid M&A track record

This information was prepared by A2A and it is not to be relied on by any 3rd party without A2A’s prior written consent. 7
A2A’s focus areas
• Integration, organizational rationalisation and synergy extraction
• Industrial development in Italy and abroad
• Edison: strengthening A2A’s industrial role
• Endesa Italia: assets swap
• M&A opportunities
This information was prepared by A2A and it is not to be relied on by any 3rd party without A2A’s prior written consent. 8
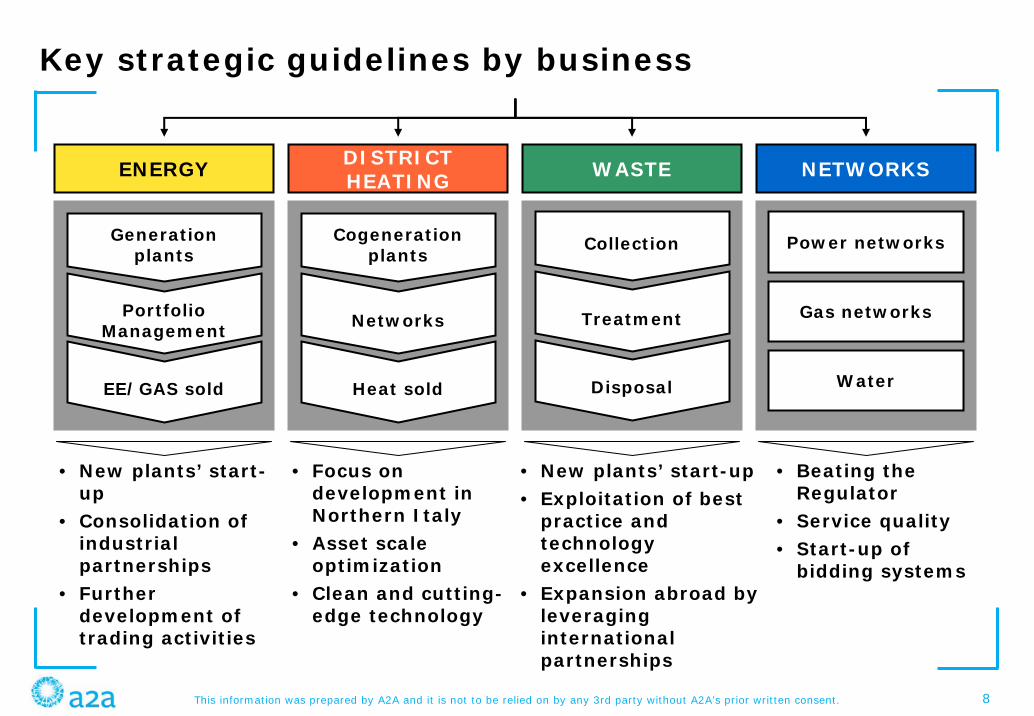
Key strategic guidelines by business
DISTRICT HEATING
Cogenerationplants
Networks
Heat sold
WASTE
Collection
Treatment
Disposal
NETWORKS
Water
Power networks
Gas networks
ENERGY
Generationplants
Portfolio Management
EE/GAS sold
• New plants’ start-up
• Consolidation of industrial partnerships
• Further development of trading activities
• Focus on development in Northern Italy
• Asset scale optimization
• Clean and cutting-edge technology
• New plants’ start-up• Exploitation of best
practice and technology excellence
• Expansion abroad by leveraging international partnerships
• Beating the Regulator
• Service quality• Start-up of
bidding systems
This information was prepared by A2A and it is not to be relied on by any 3rd party without A2A’s prior written consent. 9
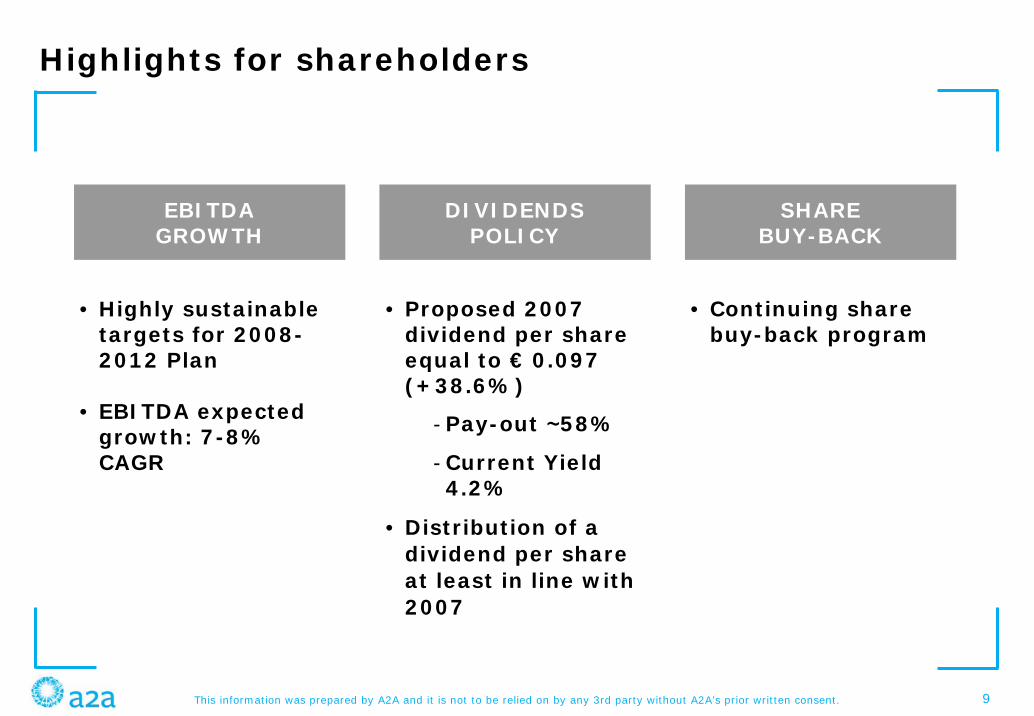
Highlights for shareholders
EBITDAGROWTH
DIVIDENDSPOLICY
SHAREBUY-BACK
• Highly sustainable targets for 2008-2012 Plan
• EBITDA expected growth: 7-8% CAGR
• Proposed 2007 dividend per share equal to € 0.097 (+38.6%)
-Pay-out ~58%
-Current Yield 4.2%
• Distribution of a dividend per share at least in line with 2007
• Continuing share buy-back program

This information was prepared by A2A and it is not to be relied on by any 3rd party without A2A’s prior written consent. 10
Agenda
• Strategic OverviewGiuliano Zuccoli
• Asset & Business OutlinePaolo Rossetti
• FY 2007 Results & 2008-2012 Business PlanRenato Ravanelli
• Final remarks
• Q&A

This information was prepared by A2A and it is not to be relied on by any 3rd party without A2A’s prior written consent. 11
First local utility in Italy by sales and margins
1,100
836
1,936
529453
322
15981 46
10,103 2,4922,583 2,863 443 4521,208Revenues (€M)
* As for Edison means the pro-quota consolidation through Delmi/TdESource: A2A pro-forma data, Annual Reports 2007
Networks21%
Waste27%
District Heating4%
Energy48%
LISTED LOCAL UTILITIES’ 2007 EBITDA (€M)
EBITDA MIX
3.7x*
This information was prepared by A2A and it is not to be relied on by any 3rd party without A2A’s prior written consent. 12
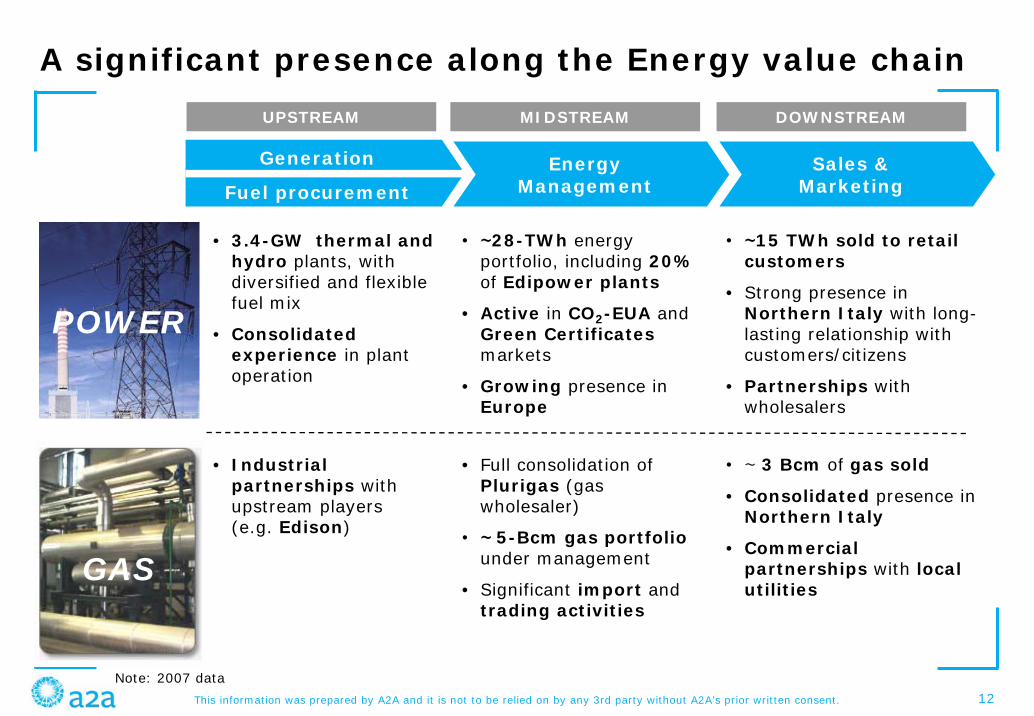
A significant presence along the Energy value chain
EnergyManagement
Sales &Marketing
UPSTREAM MIDSTREAM DOWNSTREAM
• 3.4-GW thermal and hydro plants, with diversified and flexible fuel mix
• Consolidated experience in plant operation
• ~15 TWh sold to retail customers
• Strong presence in Northern Italy with long-lasting relationship with customers/citizens
• Partnerships with wholesalers
• Industrial partnerships with upstream players (e.g. Edison)
• Full consolidation of Plurigas (gas wholesaler)
• ~ 5-Bcm gas portfoliounder management
• Significant import and trading activities
• ~ 3 Bcm of gas sold
• Consolidated presence in Northern Italy
• Commercial partnerships with local utilities
GAS
Note: 2007 data
Generation
Fuel procurement
POWER
• ~28-TWh energy portfolio, including 20%of Edipower plants
• Active in CO2-EUA and Green Certificates markets
• Growing presence inEurope

This information was prepared by A2A and it is not to be relied on by any 3rd party without A2A’s prior written consent. 13
•Cassano d’Adda•Ponti sul Mincio•Chivasso•Turbigo•Piacenza•Sermide•Brindisi•San Filippo del Mela•Gissi •Scandale
•Braulio•Stazzona •Lovero•Grosio•Grosotto•Premadio•5 plants close to BS•Mese•Udine•Tusciano
Hydroelectric plants:
Thermoelectricplants
GW 0.9
GW 2.5
Hydro 28%
Oil 7%
Coal 3%
CCGT 62%
An important role in generation
GW 3.4
A2A’s ASSETS: GENERATION PORTFOLIO
* A2A pro-quota directly dispatchedNote: 20% of Edipower included, Gissi: starting operations in 2008, Edison capacity 12.5GW
A2A’s ASSETS: GEOGRAPHIC PRESENCE
Italy’s second independent generation company, considering cocontrolling stake of Edison
Scandale under construction
Gissi start up 2008

This information was prepared by A2A and it is not to be relied on by any 3rd party without A2A’s prior written consent. 14
Italian leading player along district heating chain
Networks Heat soldCogeneration Plants
•5 major plants in Northern Italy
•Significant assets base:
- Thermal installed capacity: ~ MWt800
- Electric installed capacity: ~ MWe180
•Technology excellence centre
•First player in Italy:
- TWh 1.5 of heat sold
•Network: km 710
•Strong presence in the Northern Italy
MI BS
BG
NO
Lamarmora
Goltara
Famagosta
Novara (starting operations in 2008)
Tecnocity
Centrale Nord
Carnovali
Bovezzo
Canavese (start up operations at the end
2007)
NovateMilanese
Note: 2007 data

This information was prepared by A2A and it is not to be relied on by any 3rd party without A2A’s prior written consent. 1515
Major national player in waste sector
MI
BS
TO
Corteolona
MontanasoLombardo
Cavriana
Cavaglià
Giussago
Lacchiarella
Filago
Comacchio
Cavernago
Bas Power
Brescia
Montichiari
Gerenzano
Muggiano
MI-Silla 2
Maserati Light
BG
Villafalletto
ITS® (Intelligent Transfer Stations) –MBT (Mechanical Biological Treatm.)
WTE (Waste to Energy)
Landfill and biogas
Waste collection area
Other (waste treatment, glass)
Vespia
Barengo
Waste revenues (~ €800M)
• Waste treated: Mton 3.0
• Waste collected: Mton 1.4
• Energy produced:TWhe 1.2; TWht 0.6
Note: 2007 data
Calcinato
Buffalora

This information was prepared by A2A and it is not to be relied on by any 3rd party without A2A’s prior written consent. 16
A major presence in regulated businesses
POWER:
• # Clients: ~ M 1.1
• Distributed volumes: ~ TWh 12.0
• Power distribution networks: ~ km 15,000
• Power transmission networks: ~ Km 180
GAS:
• # Clients: M 1.2
• Distributed volumes: ~ Bcm 2*
• Distribution network: ~ Km 8,000
WATER:
• # Inhabitants: ~ K 940
• Water distribution: ~ Mcm 88; network: ~ Km 5,000
• Purification: ~ Mcm 66
• Sewage: ~ Mcm 55; network: ~ Km 2,400
* Included volumes sold to clients directly connected to transport grid
This information was prepared by A2A and it is not to be relied on by any 3rd party without A2A’s prior written consent. 17
Agenda
• Strategic OverviewGiuliano Zuccoli
• Asset & Business OutlinePaolo Rossetti
• FY 2007 Results & 2008-2012 Business PlanRenato Ravanelli
• Final remarks
• Q&A

This information was prepared by A2A and it is not to be relied on by any 3rd party without A2A’s prior written consent. 18
Group 2007 Pro-forma figures
20062007
Sales
YoY %
EBITDA
EBIT
Group net income
€M data
NFP
NFP/EBITDA
ROI*
9,54010,103 +5.9%
1,8131,936 +6.8%
9831,134 +15.4%
535521 -2.6%
3.22 x
5,8435,771 -72
1.06 x0.89 x
8.7%9.2%
NFP/EQUITY
2.98 x
20062007 Δ
* Capital invested as of 31/12 (whereas Invested capital = Equity + NFP)

This information was prepared by A2A and it is not to be relied on by any 3rd party without A2A’s prior written consent. 19
2007 Pro-forma figures – TdE/Edison cons.d at equity
*Includes ~ €900M for Edison stake acquisition; ** Capital invested as of 31/12 (whereas Invested capital = Equity + NFP) Note: Group Equity: net of minorities
20062007
Sales
YoY %
EBITDA
EBIT
Group net income(of w. Delmi/TdE contribut.)
€M data
NFP*
NFP/EBITDA
ROI**
4,9925,724 +14.7%
1,0301,100 +6.8%
645712 +10.4%
53564
52172
-2.6%
3,0613,732 +671
0.88 x0.96 x
8.5%8.2%
NFP/GROUP EQUITY
2.97 x3.39 x
20062007 Δ

This information was prepared by A2A and it is not to be relied on by any 3rd party without A2A’s prior written consent. 20
21%
27%
4%
48%
2006-2007 Pro-forma EBITDA breakdown
ENERGY
DISTRICT HEATING
WASTE
NETWORKS
CORPORATE & OTHER SERVICES
TOTAL
EBITDA2006
EBITDA2007
Δ€M data EBITDA BREAKDOWN 2007
546
48
310
244
-48
62
259
226
-33
+30
-14
+51
+18
-15
+701,100
516
1,030
Note: TdE/Edison excluded

This information was prepared by A2A and it is not to be relied on by any 3rd party without A2A’s prior written consent. 21
2006NFP
proforma
3,061
Cashfrom
currentactivities
-377
Capex
480
M&Aactivities
330
Changein
netequity
-93
246
2007NFP
3,647 85
2007NFP
proforma
3,732
Ordinarydividends
Extra-ordinarydividends
2006-2007 Pro-forma NFP bridge
2006-2007 NFP BRIDGE (€M) KEY FACTS
TdE/Edison
5,8435,771
• Development CAPEX: Gissi and Scandale, cogeneration plants
• One-off equity investments:
- Ecodeco’s acquisition (64%)
- Edipower put option
• Share buy-back
* 2006 pro-forma NFP, equal to €3,146M, includes extra-ordinary dividends
+ 671
This information was prepared by A2A and it is not to be relied on by any 3rd party without A2A’s prior written consent. 22
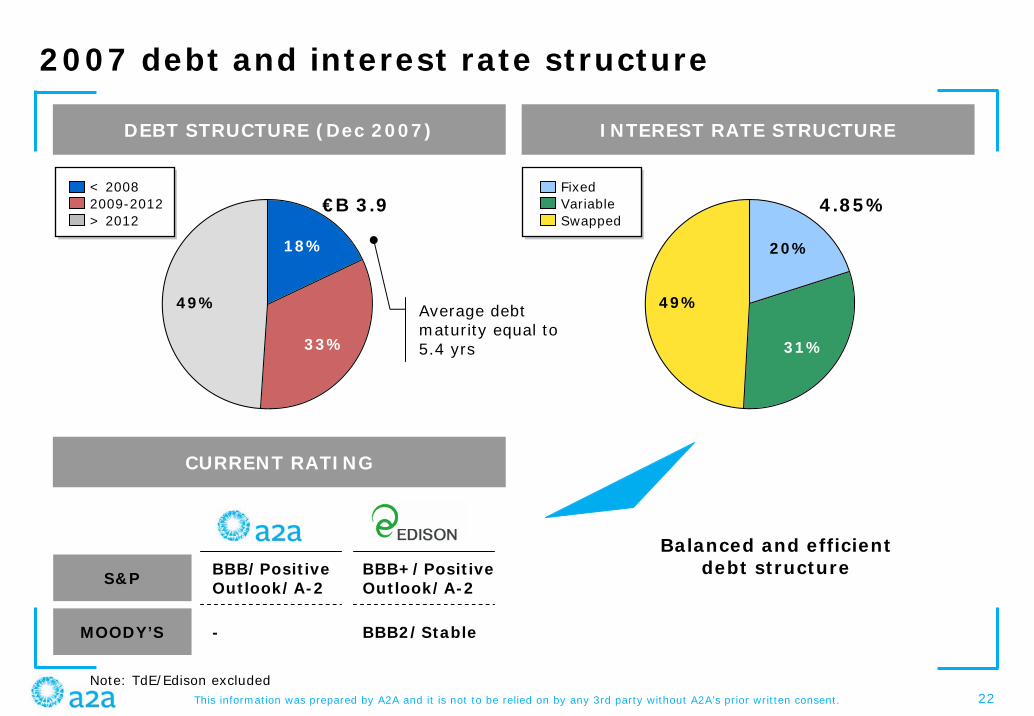
2007 debt and interest rate structure
INTEREST RATE STRUCTUREDEBT STRUCTURE (Dec 2007)
49%
33%
18%
< 20082009-2012> 2012
FixedVariableSwapped
€B 3.9
Average debt maturity equal to 5.4 yrs
4.85%
Balanced and efficient debt structureBBB/Positive
Outlook/A-2BBB+/Positive Outlook/A-2
- BBB2/Stable
S&P
MOODY’S
CURRENT RATING
49%
31%
20%
Note: TdE/Edison excluded

This information was prepared by A2A and it is not to be relied on by any 3rd party without A2A’s prior written consent. 23
2007
1.1
2012
1.6
Industrial Plan – EBITDA target (TdE/Edison excl.)
2007-2012 EBITDA TARGET (€B)
7.5% CAGR
EBITDA BREAKDOWN
Networks21%
Waste27%
District Heating4%
Energy48%
2007
2012
Energy 54%
Networks 18%
Waste 20%
District Heating 8%
Synergies: ~ €110M estimated in 2012, of which 64% development synergies and 36% efficiency gains
This information was prepared by A2A and it is not to be relied on by any 3rd party without A2A’s prior written consent. 24
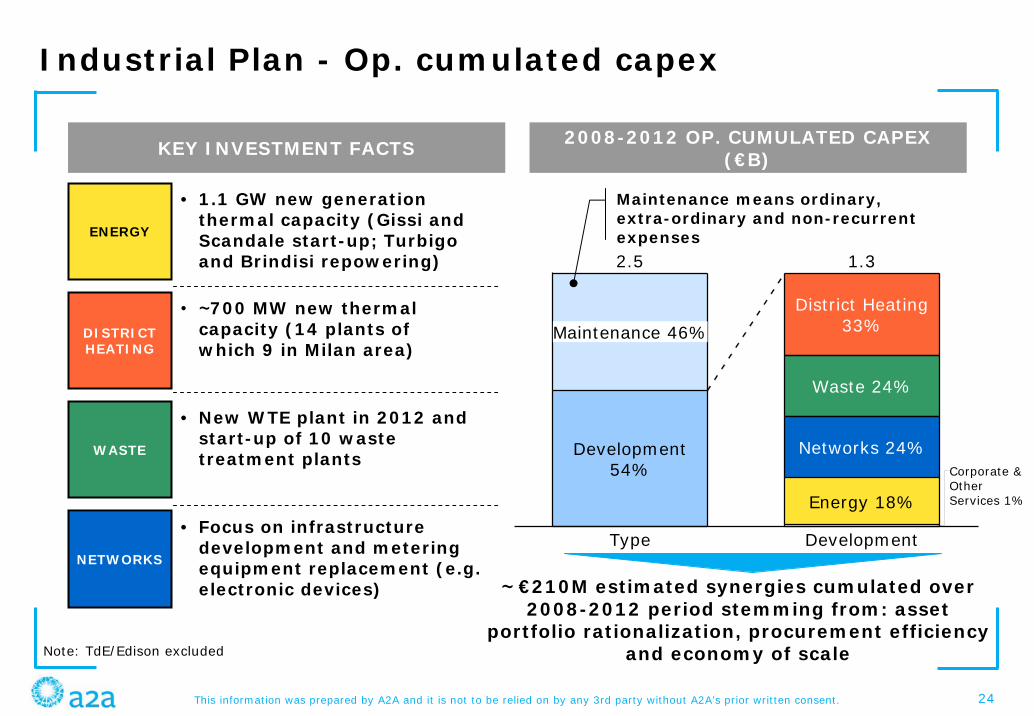
Type
Maintenance 46%
Development54%
2.5
Development
District Heating33%
Waste 24%
Networks 24%
Energy 18%
1.3
Corporate &OtherServices 1%
KEY INVESTMENT FACTS
Industrial Plan - Op. cumulated capex
2008-2012 OP. CUMULATED CAPEX (€B)
ENERGY
DISTRICTHEATING
WASTE
NETWORKS
• 1.1 GW new generation thermal capacity (Gissi and Scandale start-up; Turbigoand Brindisi repowering)
• ~700 MW new thermal capacity (14 plants of which 9 in Milan area)
• New WTE plant in 2012 and start-up of 10 waste treatment plants
• Focus on infrastructure development and metering equipment replacement (e.g. electronic devices) ~ €210M estimated synergies cumulated over
2008-2012 period stemming from: asset portfolio rationalization, procurement efficiency
and economy of scale
Maintenance means ordinary, extra-ordinary and non-recurrent expenses
Note: TdE/Edison excluded
This information was prepared by A2A and it is not to be relied on by any 3rd party without A2A’s prior written consent. 25
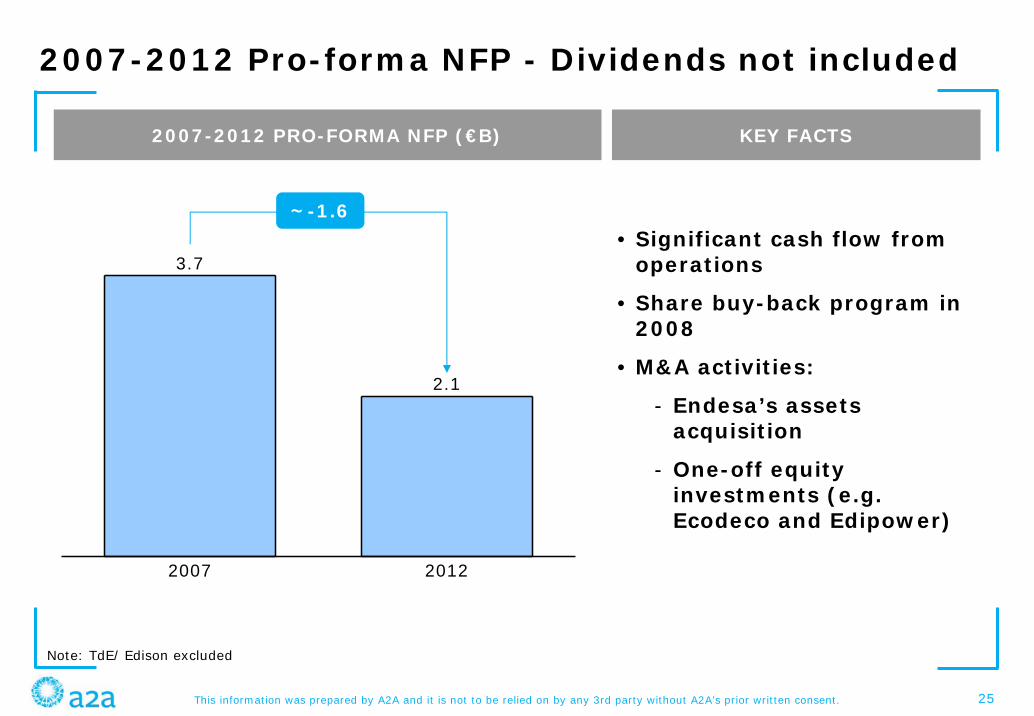
2007
3.7
2012
2.1
2007-2012 Pro-forma NFP - Dividends not included
2007-2012 PRO-FORMA NFP (€B) KEY FACTS
• Significant cash flow from operations
• Share buy-back program in 2008
• M&A activities:
- Endesa’s assets acquisition
- One-off equity investments (e.g. Ecodeco and Edipower)
Note: TdE/ Edison excluded
~ -1.6
This information was prepared by A2A and it is not to be relied on by any 3rd party without A2A’s prior written consent. 26
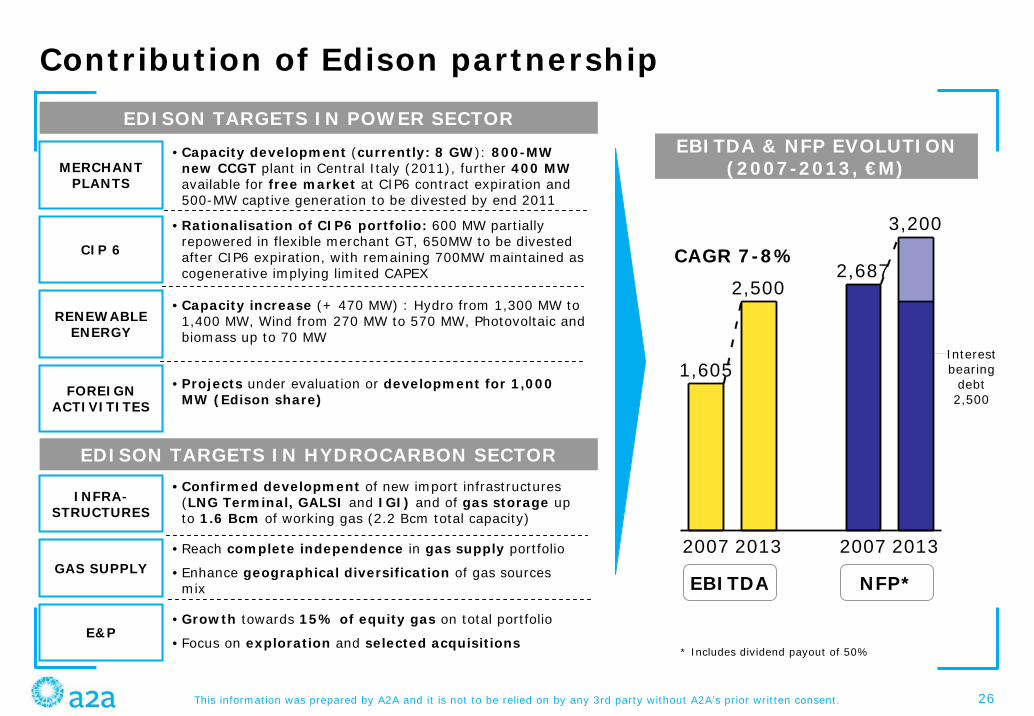
EDISON TARGETS IN POWER SECTOR
2007
1,605
2013
2,500
2007
2,687
2013
3,200
Interestbearing
debt2,500
Contribution of Edison partnership
EBITDA & NFP EVOLUTION(2007-2013, €M)
EBITDA NFP*
CAGR 7-8%
EDISON TARGETS IN HYDROCARBON SECTOR
MERCHANT PLANTS
CIP 6
RENEWABLEENERGY
FOREIGN ACTIVITITES
INFRA-STRUCTURES
GAS SUPPLY
E&P
•Capacity development (currently: 8 GW): 800-MW new CCGT plant in Central Italy (2011), further 400 MWavailable for free market at CIP6 contract expiration and 500-MW captive generation to be divested by end 2011
•Rationalisation of CIP6 portfolio: 600 MW partially repowered in flexible merchant GT, 650MW to be divested after CIP6 expiration, with remaining 700MW maintained as cogenerative implying limited CAPEX
•Capacity increase (+ 470 MW) : Hydro from 1,300 MW to 1,400 MW, Wind from 270 MW to 570 MW, Photovoltaic and biomass up to 70 MW
•Projects under evaluation or development for 1,000 MW (Edison share)
•Confirmed development of new import infrastructures (LNG Terminal, GALSI and IGI) and of gas storage up to 1.6 Bcm of working gas (2.2 Bcm total capacity)
•Reach complete independence in gas supply portfolio
•Enhance geographical diversification of gas sources mix
•Growth towards 15% of equity gas on total portfolio
•Focus on exploration and selected acquisitions* Includes dividend payout of 50%
This information was prepared by A2A and it is not to be relied on by any 3rd party without A2A’s prior written consent. 27
Agenda
• Strategic OverviewGiuliano Zuccoli
• Asset & Business OutlinePaolo Rossetti
• FY 2007 Results & 2008-2012 Business PlanRenato Ravanelli
• Final remarks
• Q&A
This information was prepared by A2A and it is not to be relied on by any 3rd party without A2A’s prior written consent. 28
Disclaimer
This document has been prepared by A2A solely for the use at investors and analysts meetings.
This document does not constitute an offer or invitation to purchase or subscribe any shares and neither it nor any part of it shall form the basis of or be relied upon in connection with any contract or commitment whatsoever.
2006 and 2007 pro-forma numbers are recalculated, analysed and reclassified in this document were not approved by A2A’s Board of Directors, nor do they correspond to any documentary evidence, book and accounting record.
Some information contained herein and other material discussed at the meetings may include forward looking information based on A2A’s current beliefs and expectations. These statements are based on current plans, estimates, projections, and projects and therefore you should not place undue reliance on them.
Forward looking statements involve inherent risks and uncertainties. We caution you that a number of important factors could cause actual results to differ materially from those contained in any forward looking statement. Such factors include, but are not limited to: changes in global economic business, changes in the price of certain commodities including electricity, gas and coal, the competitive market and regulatory factors.
Moreover, forward looking statements are current only at the date they are made.
This information was prepared by A2A and it is not to be relied on by any 3rd party without A2A’s prior written consent. 29
Appendix
• Details by business
- 2006-2007 Results
- Industrial Plan
This information was prepared by A2A and it is not to be relied on by any 3rd party without A2A’s prior written consent. 30
2006
516
2007
546
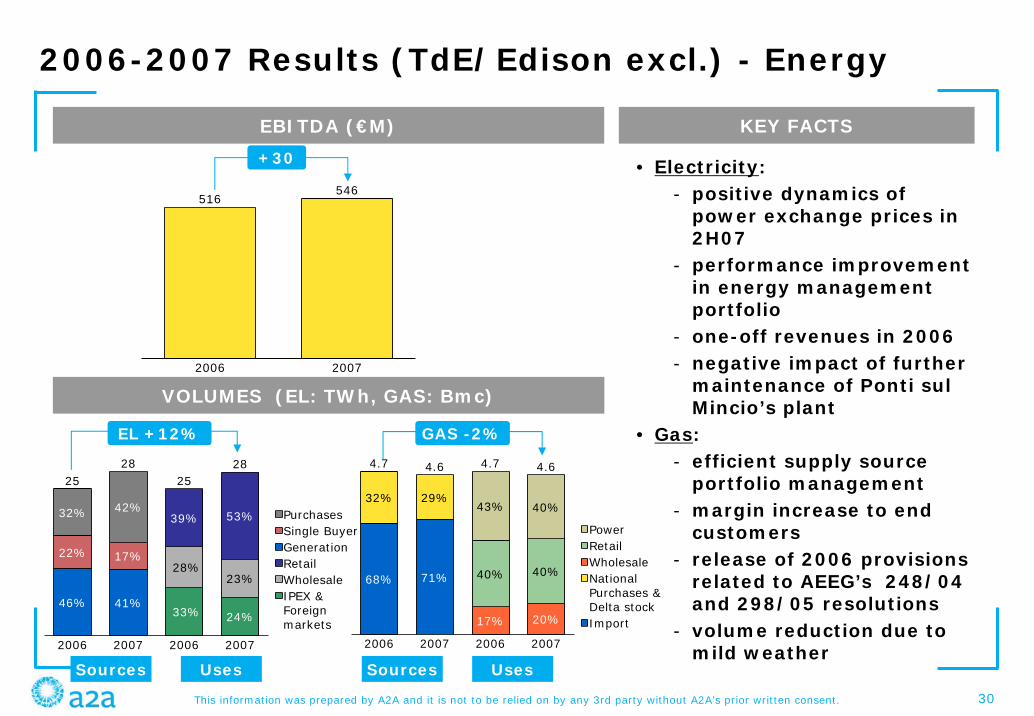
2006-2007 Results (TdE/Edison excl.) - Energy
KEY FACTSEBITDA (€M)
VOLUMES (EL: TWh, GAS: Bmc)
• Electricity: - positive dynamics of
power exchange prices in 2H07
- performance improvement in energy management portfolio
- one-off revenues in 2006 - negative impact of further
maintenance of Ponti sulMincio’s plant
• Gas: - efficient supply source
portfolio management- margin increase to end
customers - release of 2006 provisions
related to AEEG’s 248/04 and 298/05 resolutions
- volume reduction due to mild weather
+30
2006
46%
22%
32%
25
2007
41%
17%
42%
28
2006
33%
28%
39%
25
2007
24%
23%
53%
28
IPEX &Foreignmarkets
WholesaleRetailGenerationSingle BuyerPurchases
2006
32%
68%
4.7
2007
29%
71%
4.6
2006
43%
40%
17%
4.7
2007
40%
40%
20%
4.6
Import
NationalPurchases &Delta stock
WholesaleRetail Power
EL +12% GAS -2%
Sources UsesSources Uses

This information was prepared by A2A and it is not to be relied on by any 3rd party without A2A’s prior written consent. 31
2006
62
2007
48
2006-2007 Results - District heating
• Negative impact on EBITDA mainly from volume reduction due to exceptional mild weather (1H07)
• Increasing margins in Energy Services and Facility Management
KEY FACTSEBITDA (€M)
HEAT VOLUMES (TWh)
- 14
2006
1.6
2007
1.5
BS
MI
BG
Active District Heating area
- 5%
Note: TdE/Edison excluded
This information was prepared by A2A and it is not to be relied on by any 3rd party without A2A’s prior written consent. 32
2006
259
2007
310
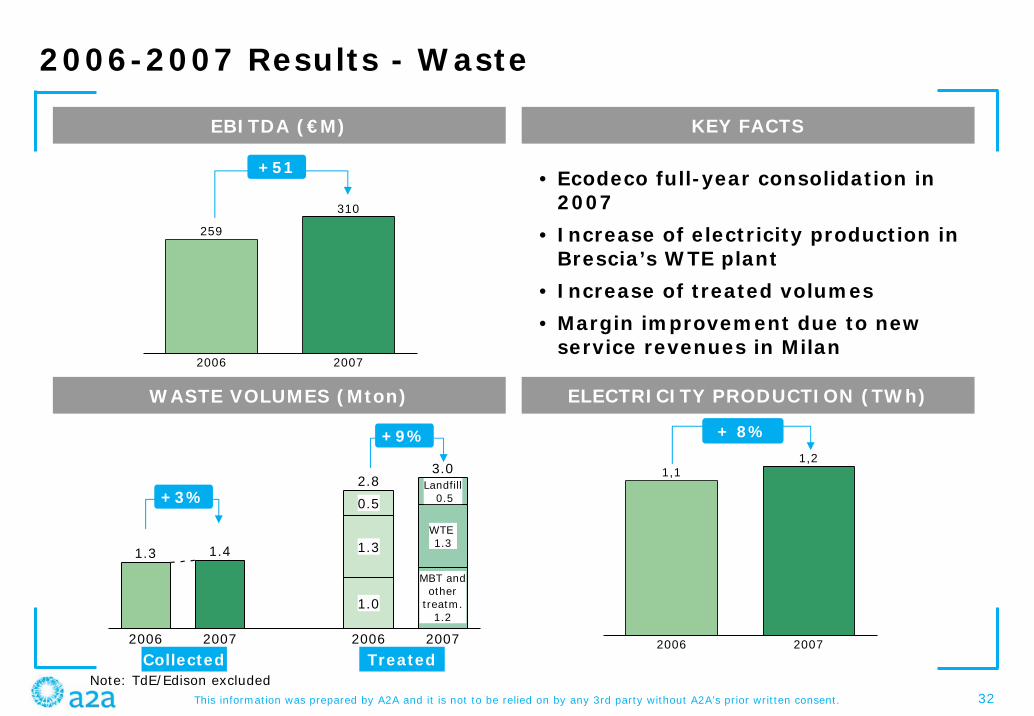
2006-2007 Results - Waste
KEY FACTSEBITDA (€M)
ELECTRICITY PRODUCTION (TWh)WASTE VOLUMES (Mton)
• Ecodeco full-year consolidation in 2007
• Increase of electricity production in Brescia’s WTE plant
• Increase of treated volumes
• Margin improvement due to new service revenues in Milan
2006
1.3
2007
1.4
2006
0.5
1.3
1.0
2.8
2007
Landfill 0.5
WTE 1.3
3.0
MBT andother
treatm.1.2
Collected Treated
+3%
+9%
2006
1,1
2007
1,2
+ 8%
+51
Note: TdE/Edison excluded
This information was prepared by A2A and it is not to be relied on by any 3rd party without A2A’s prior written consent. 33
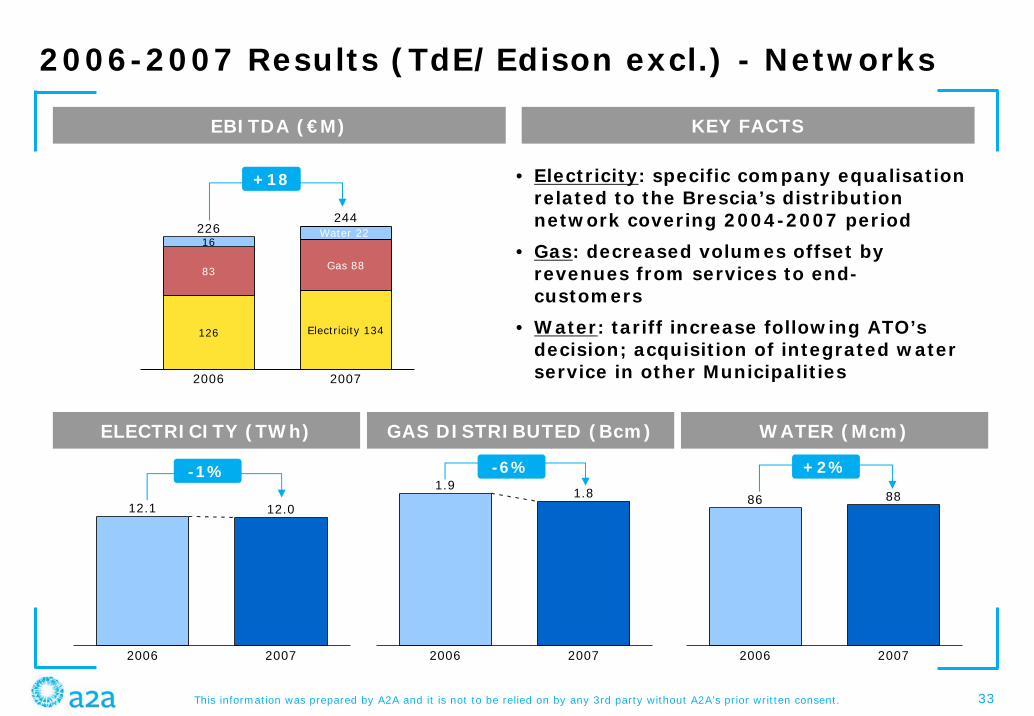
2006-2007 Results (TdE/Edison excl.) - Networks
KEY FACTSEBITDA (€M)
2006
126
83
16226
2007
Electricity 134
Gas 88
244Water 22
+18 • Electricity: specific company equalisation related to the Brescia’s distribution network covering 2004-2007 period
• Gas: decreased volumes offset by revenues from services to end-customers
• Water: tariff increase following ATO’sdecision; acquisition of integrated water service in other Municipalities
2006
12.1
2007
12.0
ELECTRICITY (TWh)
2006
86
2007
88
2006
1.9
2007
1.8
GAS DISTRIBUTED (Bcm) WATER (Mcm)
-1% -6% +2%
This information was prepared by A2A and it is not to be relied on by any 3rd party without A2A’s prior written consent. 34
Appendix
• Details by business
- 2006-2007 Results
- Industrial Plan
This information was prepared by A2A and it is not to be relied on by any 3rd party without A2A’s prior written consent. 35
Sources
42%
17%
41%
28
Uses
53%
23%
24%
28
Sources
29%
5%
66%
33
Uses
60%
11%
29%
33
GenerationSingle BuyerPurchases
IPEX & Foreignmarkets
WholesaleRetail
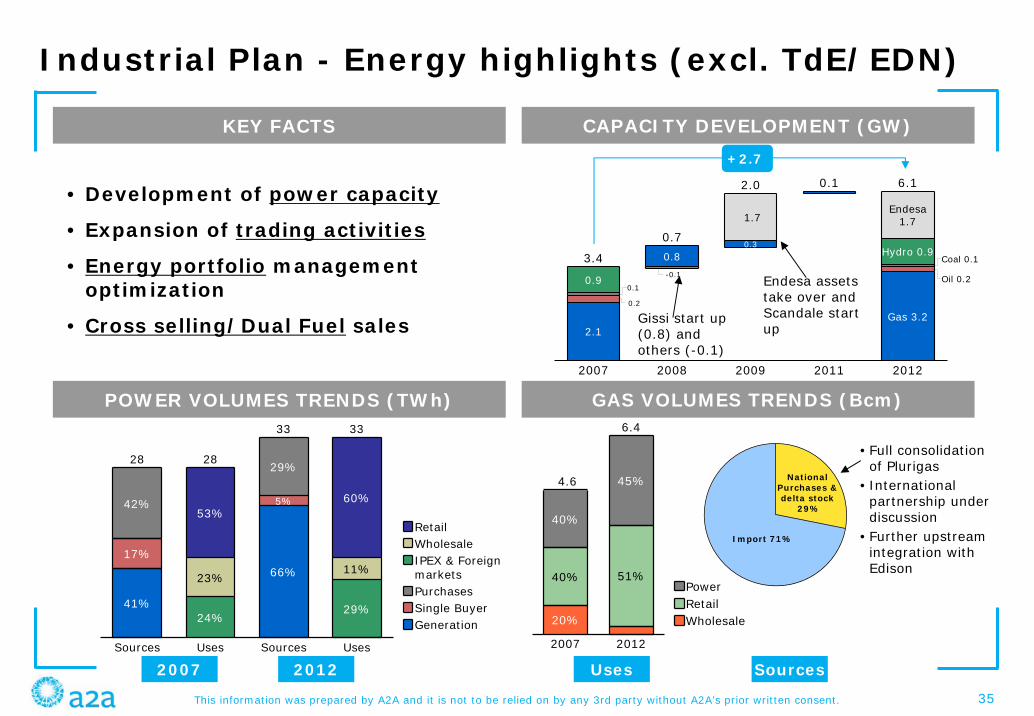
Industrial Plan - Energy highlights (excl. TdE/EDN)
2007
20%
40%
40%
4.6
2012
51%
45%
6.4
WholesaleRetailPower
2007
0.9
2.1
3.4
2008
0.8
0.7
2009
1.7
0.3
2.0
2011
0.1
2012
Endesa1.7
Hydro 0.9
Gas 3.2
6.1
0.1
0.2
-0.1
Coal 0.1
Oil 0.2
CAPACITY DEVELOPMENT (GW)KEY FACTS
GAS VOLUMES TRENDS (Bcm)POWER VOLUMES TRENDS (TWh)
+2.7
2007 2012
• Development of power capacity
• Expansion of trading activities
• Energy portfolio management optimization
• Cross selling/Dual Fuel sales Gissi start up (0.8) and others (-0.1)
Endesa assets take over and Scandale start up
Import 71%
National Purchases & delta stock
29%
Uses Sources
•Full consolidation of Plurigas
• International partnership under discussion
•Further upstream integration with Edison

This information was prepared by A2A and it is not to be relied on by any 3rd party without A2A’s prior written consent. 36
Trading activities on foreign power markets
FRANCE:•Load balancing RTE (2003)
•Powernext Day-Ahead (2004)
•Powernext continuous trading (2007)
•Powernext future (2008)
GERMANY:•Load balancing RWE, EnBW (2006)
•EEX Day-Ahead, EEX Future (2006)
•EEX continuous trading (2007)
AUSTRIA:•Import/export
GREECE:•Import/Export Desmie•Desmie: application for A2A to be finalized
SWITZERLAND:•Import/export
SLOVENIA:•Import/export
Focus on energy risk management: maximizing value from energy portfolio
activities within acceptable risk limit
This information was prepared by A2A and it is not to be relied on by any 3rd party without A2A’s prior written consent. 37
-3.000
-2.000
-1.000
0
1.000kton
15
20
25€/ton
2008 2009 2010 2011 2012
Net position
Price
-800
-600
-400
-200
0
200GWh
90
95
100
105
110€/MWh
2008 2009 2010 2011 2012
Net position
Price
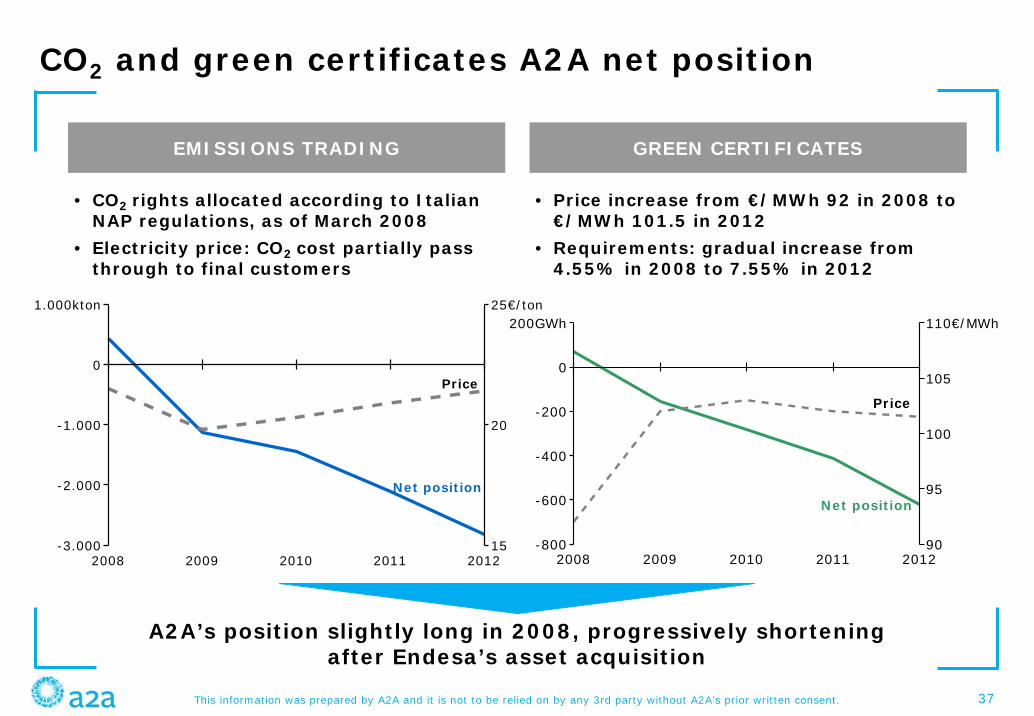
CO2 and green certificates A2A net position
EMISSIONS TRADING GREEN CERTIFICATES
• CO2 rights allocated according to Italian NAP regulations, as of March 2008
• Electricity price: CO2 cost partially pass through to final customers
• Price increase from €/MWh 92 in 2008 to €/MWh 101.5 in 2012
• Requirements: gradual increase from 4.55% in 2008 to 7.55% in 2012
A2A’s position slightly long in 2008, progressively shortening after Endesa’s asset acquisition
This information was prepared by A2A and it is not to be relied on by any 3rd party without A2A’s prior written consent. 38
2007
1.5
2012
3.1
Heat pump
Coal
Natural Gas
Biomass
Oil
ElectricityCommercial
Residential
Industrial
Thermal Storage
Centralized Heating
and Cooling Plant
Distr. Infr.
2007
0.8
2012
1.5
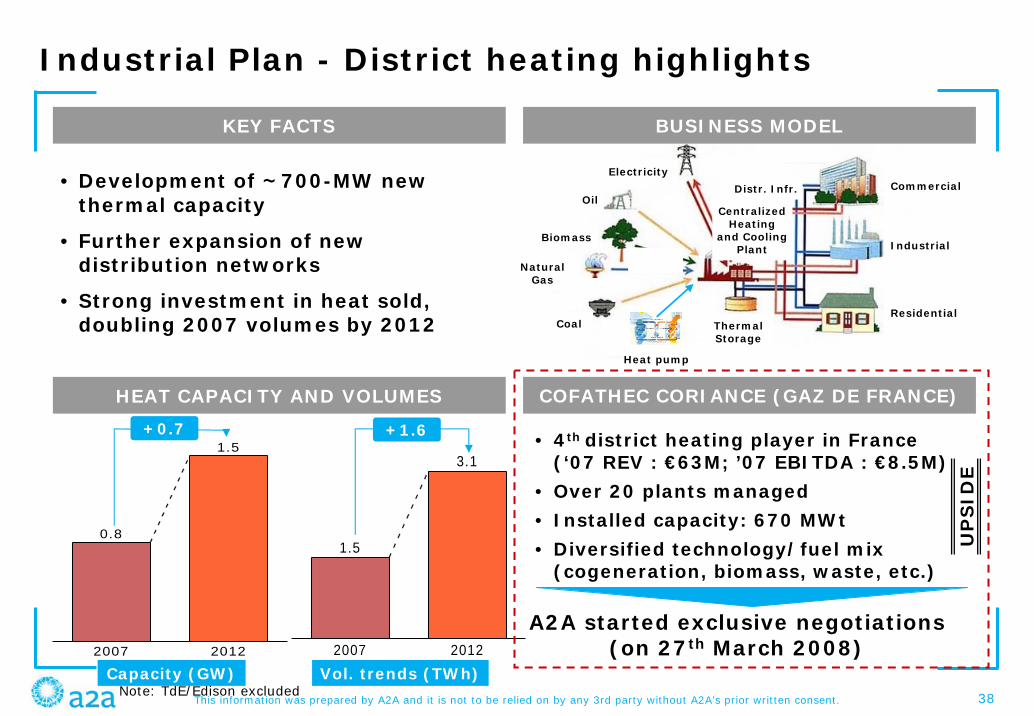
Industrial Plan - District heating highlights
KEY FACTS
HEAT CAPACITY AND VOLUMES
• Development of ~ 700-MW new thermal capacity
• Further expansion of new distribution networks
• Strong investment in heat sold, doubling 2007 volumes by 2012
Capacity (GW) Vol. trends (TWh)
• 4th district heating player in France (‘07 REV : €63M; ’07 EBITDA : €8.5M)
• Over 20 plants managed
• Installed capacity: 670 MWt
• Diversified technology/fuel mix (cogeneration, biomass, waste, etc.)
A2A started exclusive negotiations (on 27th March 2008)
+0.7 +1.6
BUSINESS MODEL
COFATHEC CORIANCE (GAZ DE FRANCE)
UP
SID
E
Note: TdE/Edison excluded
This information was prepared by A2A and it is not to be relied on by any 3rd party without A2A’s prior written consent. 39
2007
1.4
2012
1.5
2007
3.0
2012
4.1
2007
1.2
2012
1.4
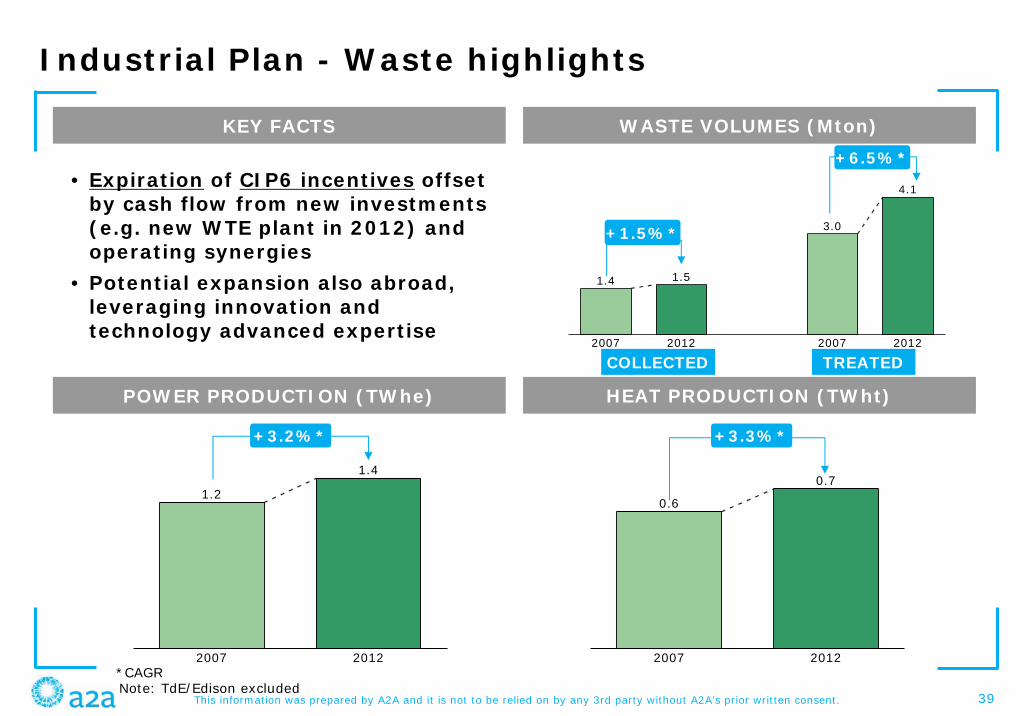
Industrial Plan - Waste highlights
WASTE VOLUMES (Mton)KEY FACTS
HEAT PRODUCTION (TWht)POWER PRODUCTION (TWhe)
2007
0.6
2012
0.7
• Expiration of CIP6 incentives offset by cash flow from new investments (e.g. new WTE plant in 2012) and operating synergies
• Potential expansion also abroad, leveraging innovation and technology advanced expertise
+3.2%* +3.3%*
COLLECTED TREATED
+1.5%*
+6.5%*
*CAGRNote: TdE/Edison excluded
This information was prepared by A2A and it is not to be relied on by any 3rd party without A2A’s prior written consent. 40
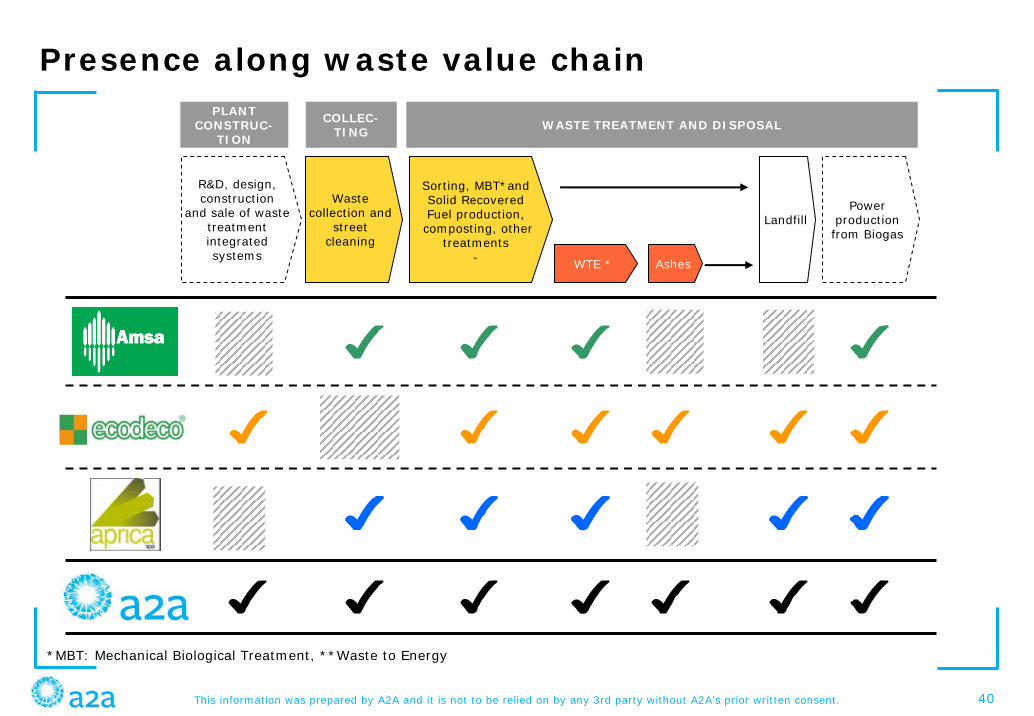
Presence along waste value chain
R&D, design, construction
and sale of waste treatment integrated systems
Power production from Biogas
Sorting, MBT*and Solid Recovered Fuel production,composting, other
treatments-
Waste collection and
street cleaning
AshesWTE *
Landfill
PLANT CONSTRUC-
TIONWASTE TREATMENT AND DISPOSALCOLLEC-
TING
*MBT: Mechanical Biological Treatment, **Waste to Energy

This information was prepared by A2A and it is not to be relied on by any 3rd party without A2A’s prior written consent. 41
Waste business expansion leveraging innovation
• USA: partnerships under discussion to develop new plants based on innovative A2A systems
UK:• 2 contracts signed in partnership with
Shanks (i.e. ELWA*, Dumfries & Galloway**) implying 3 MBT plants already completed and operative
• Further several bids underway leveraging innovative A2A expertise
Greece: active in several bids
Spain: •1 contract signed (i.e. Castellon)
•Active in several bids
*East London West Authority (25 yrs contract to treat East London waste)**South West Scotland
This information was prepared by A2A and it is not to be relied on by any 3rd party without A2A’s prior written consent. 42
2007
12.0
2012
12.7
ELECTRICITY (TWh)
2007
88
2012
91
2007
1.8
2012
2.6
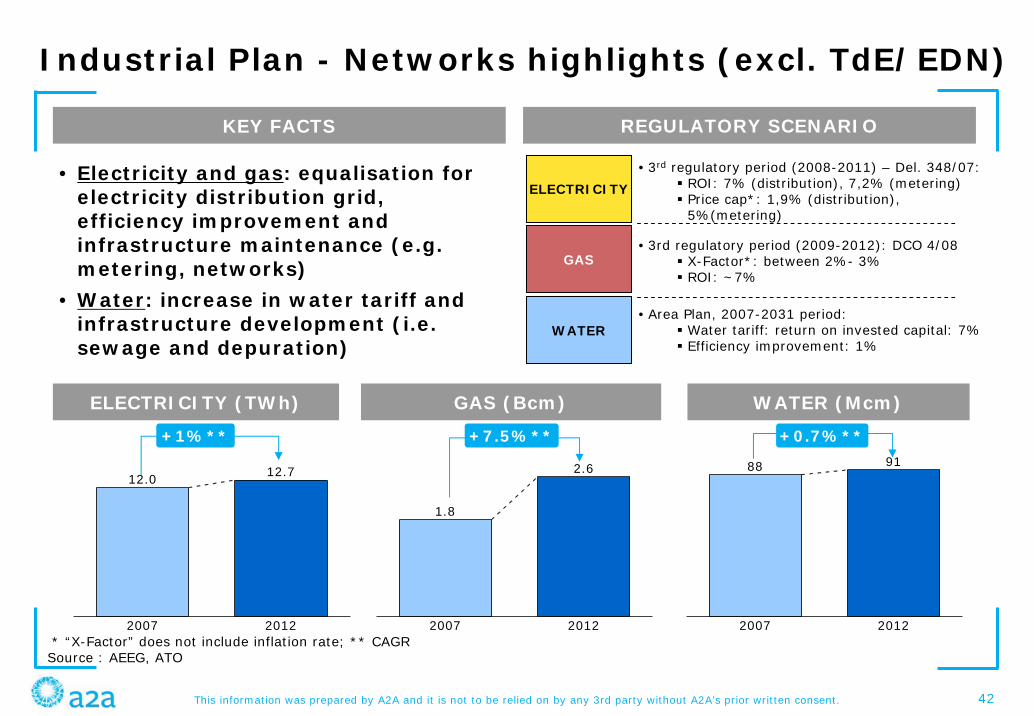
Industrial Plan - Networks highlights (excl. TdE/EDN)
REGULATORY SCENARIOKEY FACTS
ELECTRICITY
• 3rd regulatory period (2008-2011) – Del. 348/07: ROI: 7% (distribution), 7,2% (metering)Price cap*: 1,9% (distribution), 5%(metering)
WATER
GAS• 3rd regulatory period (2009-2012): DCO 4/08
X-Factor*: between 2%- 3%ROI: ~7%
• Area Plan, 2007-2031 period: Water tariff: return on invested capital: 7%Efficiency improvement: 1%
* “X-Factor” does not include inflation rate; ** CAGR Source : AEEG, ATO
GAS (Bcm) WATER (Mcm)
• Electricity and gas: equalisation for electricity distribution grid, efficiency improvement and infrastructure maintenance (e.g. metering, networks)
• Water: increase in water tariff and infrastructure development (i.e. sewage and depuration)
+1%** +7.5%** +0.7%**