A2 Economics PowerPoint Briefings 2007 tutor2u ™ tutor2u ™ Economies of Scale Long Run...
40
A2 Economics PowerPoint Briefings 2007 PowerPoint Briefings 2007 tutor2u tutor2u ™ ™ Economies of Scale Long Run Production and Costs
-
Upload
warren-peters -
Category
Documents
-
view
220 -
download
2
Transcript of A2 Economics PowerPoint Briefings 2007 tutor2u ™ tutor2u ™ Economies of Scale Long Run...
A2 EconomicsPowerPoint Briefings 2007PowerPoint Briefings 2007
tutor2ututor2u™™
Economies of ScaleLong Run Production
and Costs

tutor2ututor2u™™
In the Long Run
• In the long-run
• “But this long run is a misleading guide to current affairs. In the long run we are all dead. Economists set themselves too easy, too useless a task if in tempestuous seasons they can only tell us that when the storm is long past the ocean is flat again.”
• John Maynard Keynes, 1936

tutor2ututor2u™™
Long Run Costs
• Economies of scale are not relevant in the short run production function
• Economies of scale are the cost advantages that a business can exploit by expanding their scale of production in the long run. The effect of economies of scale is to reduce the long run average costs of production over a range of output.

tutor2ututor2u™™
Long Run Returns to Scale
Long Run Output (Units)
Total Costs (£s) Long Run Average Cost (£ per unit)
1000 12000 12
2000 20000 10
5000 45000 9
10000 80000 8
20000 144000 7.2
50000 330000 6.6
100000 640000 6.4
500000 3000000 6

tutor2ututor2u™™
Returns to Scale – Work out the total cost for each scale of production
Factor Inputs Production Costs
(K) (La) (L) (Q) (TC) (TC/Q)
Capital Land Labour Output Total Cost
Average Cost
Scale A 5 3 4 100
Scale B 10 6 8 300
Scale C 15 9 12 500
Costs: Assume the cost of each unit of capital = £600, Land = £80 and Labour = £200

tutor2ututor2u™™
Now calculate average cost for each scale
Factor Inputs Production Costs
(K) (La) (L) (Q) (TC) (TC/Q)
Capital Land Labour Output Total Cost
Average Cost
Scale A 5 3 4 100 3256
Scale B 10 6 8 300 6512
Scale C 15 9 12 500 9768
Costs: Assume the cost of each unit of capital = £600, Land = £80 and Labour = £200

tutor2ututor2u™™
Measuring the Returns to Scale
Factor Inputs Production Costs
(K) (La) (L) (Q) (TC) (TC/Q)
Capital Land Labour Output Total Cost
Average Cost
Scale A 5 3 4 100 3256 32.6
Scale B 10 6 8 300 6512 21.7
Scale C 15 9 12 500 9768 19.5
Costs: Assume the cost of each unit of capital = £600, Land = £80 and Labour = £200

tutor2ututor2u™™
The Long Run Average Cost Curve
• The LRAC curve or ‘envelope curve’ is drawn on the assumption of their being an infinite number of plant sizes – hence its smooth appearance
• If LRAC is falling when output is increasing then the firm is experiencing economies of scale
• When LRAC rises, the firm experiences diseconomies of scale
• If LRAC is constant, then the firm is experiencing constant returns to scale

tutor2ututor2u™™
Drawing the Long Run Average Cost Curve
Output
Cost per unit AC1
AC2 AC3

tutor2ututor2u™™
Drawing the Long Run Average Cost Curve
Output
Cost per unit AC1
AC2 AC3
LRAC

tutor2ututor2u™™
Drawing the Long Run Average Cost Curve
Output
Cost per unit AC1
AC2 AC3
LRAC
Q1 Q2 Q3

tutor2ututor2u™™
The LRAC as a cost boundary
Output
Cost per unit
LRAC
Attainable costs per
unit

tutor2ututor2u™™
Cost advantages of economies of scale
0
20
40
60
80
100
120
140
0 1 2 3 4 5 6 7 8 9 10
Output
Co
sts
(£)
AC1AC2
AC3

tutor2ututor2u™™
Scale economies – higher output
0
20
40
60
80
100
120
140
0 1 2 3 4 5 6 7 8 9 10
Output
Co
sts
(£)
AC1AC2
AC3
MC1

tutor2ututor2u™™
Scale economies – higher output
0
20
40
60
80
100
120
140
0 1 2 3 4 5 6 7 8 9 10
Output
Co
sts
(£)
AC1AC2
AC3
MC1
MC3

tutor2ututor2u™™
Scale economies – higher output
0
20
40
60
80
100
120
140
0 1 2 3 4 5 6 7 8 9 10
Output
Co
sts
(£)
AC1AC2
AC3
AR
MR
MC1
MC3

tutor2ututor2u™™
Scale economies – higher output
0
20
40
60
80
100
120
140
0 1 2 3 4 5 6 7 8 9 10
Output
Co
sts
(£)
AC1AC2
AC3
AR
MR
MC1
MC3
tutor2ututor2u™™
Scale economies – higher output
0
20
40
60
80
100
120
140
0 1 2 3 4 5 6 7 8 9 10
Output
Co
sts
(£)
AC1AC2
AC3
AR
MR
MC1
MC3

tutor2ututor2u™™
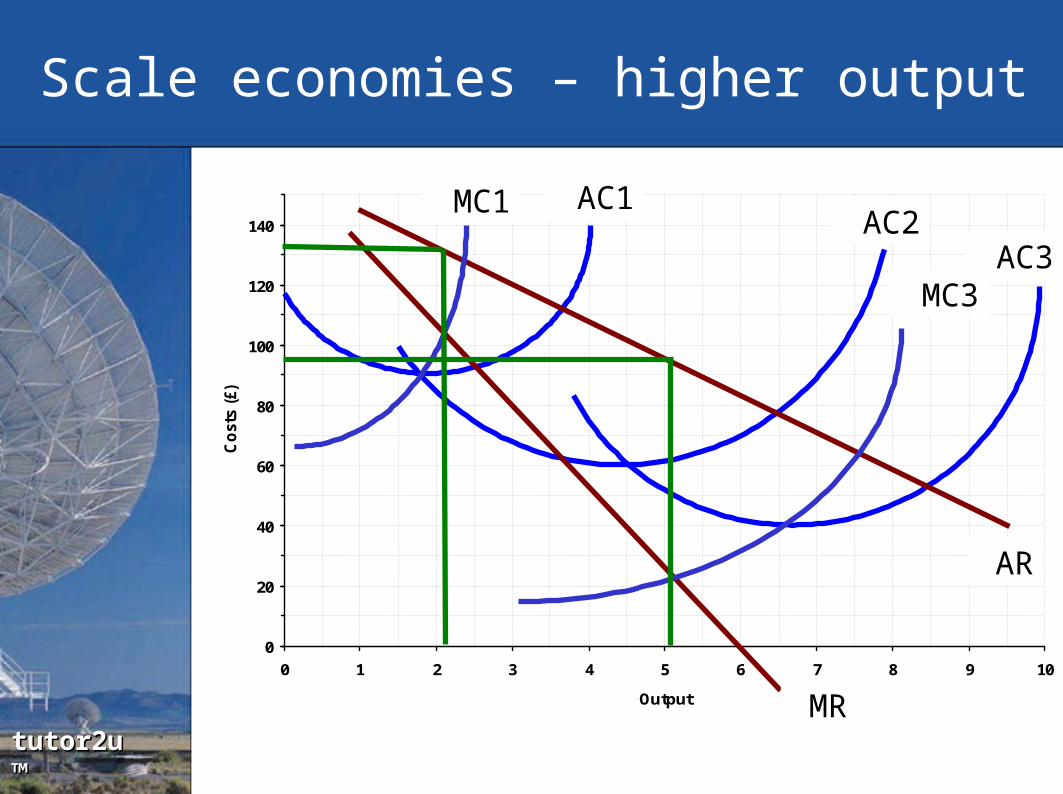
Scale economies – higher profit
0
20
40
60
80
100
120
140
0 1 2 3 4 5 6 7 8 9 10
Output
Co
sts
(£)
AC1AC2
AC3
AR
MR
MC1
MC3

tutor2ututor2u™™
Internal Economies of Scale
• Internal economies of scale arise from the internal growth of a business as it expands the scale of its operations
• External economies of scale result from the expansion of the industry as a whole of which the business is a member

tutor2ututor2u™™
Technical Economies of Scale
• Expensive capital inputs: Large-scale businesses can afford to invest in expensive and specialist capital machinery
• Specialisation of the workforce: Within larger firms there is the possibility of splitting complex production processes into separate tasks to boost factor productivity
• The law of increased dimensions or the “container principle
• Learning by doing: The unit (average) costs of production typically decline in real terms as a result of production experience

tutor2ututor2u™™
Exploiting Size and Scale

tutor2ututor2u™™
The container principle

tutor2ututor2u™™
Scale economies in printing
• Advances in printing technology and the use of huge printing presses have driven down the costs of publishing
• Print on demand increases the elasticity of supply for many publishing businesses

tutor2ututor2u™™
Marketing Economies of Scale
• A large firm can spread its advertising and marketing budget over a much larger output
• It can purchase its factor inputs in bulk at negotiated discounted prices if it has monopsony (buying) power in the market

tutor2ututor2u™™
Managerial Economies of Scale
• This is a form of division of labour
• For example, large-scale manufacturers employ specialists to supervise production systems
• Increased investment in human resources and the use of specialist equipment, such as networked computers can improve communication

tutor2ututor2u™™
Financial Economies of Scale
• Larger firms are usually rated by the financial markets to be more ‘credit worthy’ and have access to credit facilities, with favourable rates of borrowing
• Businesses quoted on the stock market can normally raise fresh money (extra financial capital) more cheaply through the sale (issue) of equities to the capital market
• Larger companies are also likely to pay a lower rate of interest on new company bonds because of a better credit rating.
tutor2ututor2u™™
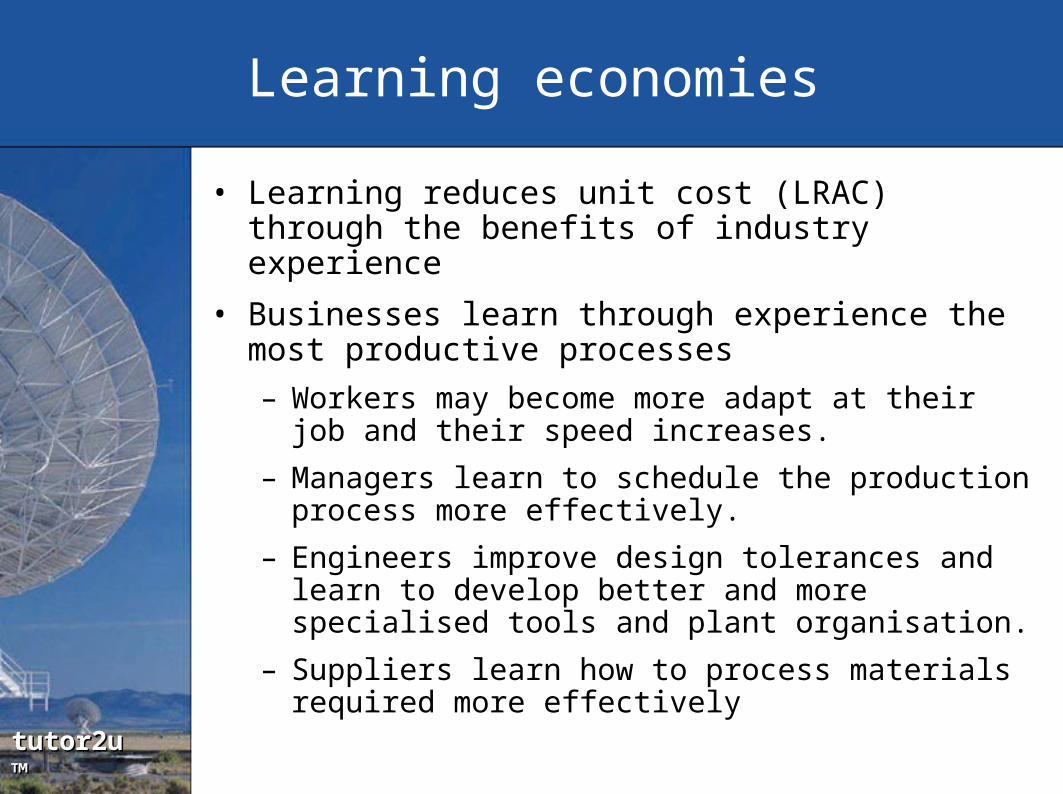
Learning economies
• Learning reduces unit cost (LRAC) through the benefits of industry experience
• Businesses learn through experience the most productive processes
– Workers may become more adapt at their job and their speed increases.
– Managers learn to schedule the production process more effectively.
– Engineers improve design tolerances and learn to develop better and more specialised tools and plant organisation.
– Suppliers learn how to process materials required more effectively

tutor2ututor2u™™
Learning Economies
Output
Cost(per unit
of output)
LRAC1
B
Economies of Scale
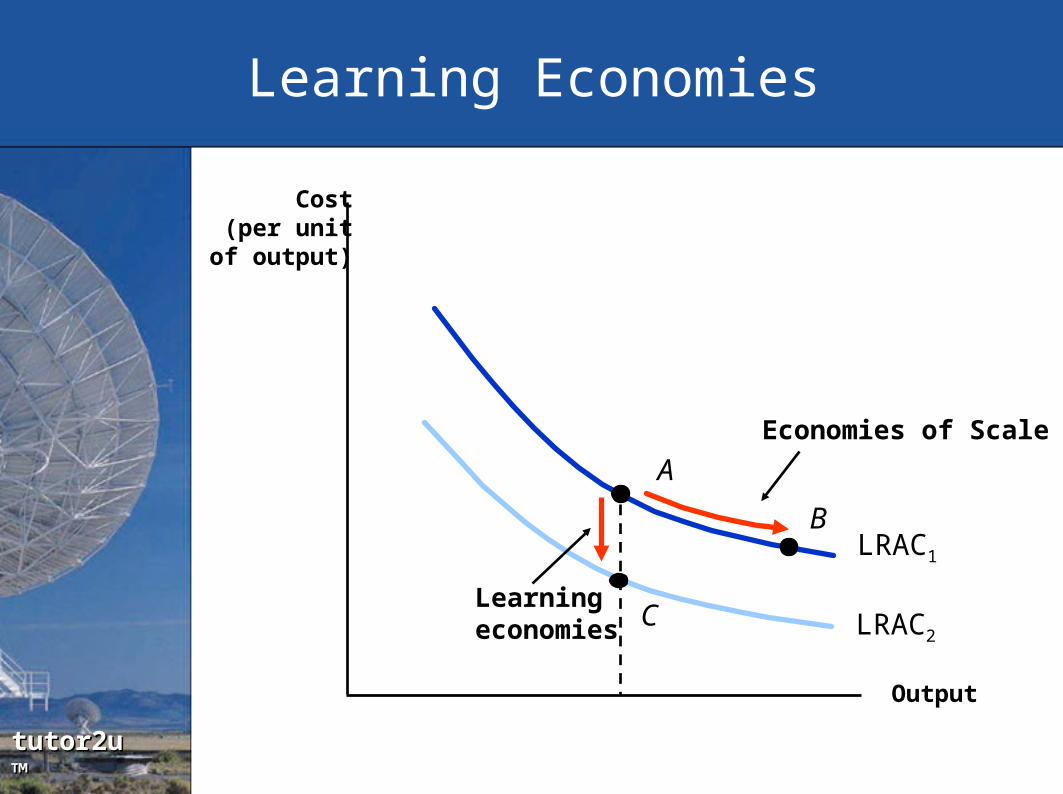
tutor2ututor2u™™
Learning Economies
Output
Cost(per unit
of output)
LRAC1
B
Economies of Scale
A
LRAC2
Learning economies C
tutor2ututor2u™™
Network Economies of Scale
• Some networks and services have huge potential for economies of scale
• As they are more widely used (or adopted), they become more valuable to the business that provides them
• The classic examples are the expansion of a common language, a common currency, online auctions and air transport networks
• The marginal cost of adding one more user to the network is close to zero, but the resulting financial benefits may be huge

tutor2ututor2u™™
Network economies in aviation
• Consider a long haul flight from Sydney to London or Amsterdam
• Virtually every city in Europe is just a short connecting flight away
• Networks allow consumers to move quickly between many different centres of population
• Network economies also important for producers – their production and distribution systems need to be in easy reach of both their suppliers and their customers

tutor2ututor2u™™
Single routes
5 Aircraft
A B
C D
E F
G H
I J
5 Routes

tutor2ututor2u™™
5 Aircraft – 55 connections
AB
C
D
E
F
G
H
I
J
5 Aircraft
55 Connections

tutor2ututor2u™™
2 Networks and an Alliance
AB
C
D
E
F
G
H
I
JA
B
C
D
E
F
G
H
I
J
2 Networks / Alliances
= 210 Connections

tutor2ututor2u™™
The Minimum Efficient Scale
• The minimum efficient scale (MES) is the long run output where a business fully exploits the available internal economies of scale
• It corresponds to the minimum point of the long run average total cost curve
• This is also the output where a business achieves productive efficiency
• The minimum efficient scale will vary from industry to industry

tutor2ututor2u™™
External Economies of Scale
• When the long-term expansion of an industry leads to the development of ancillary services which benefit all or the majority of suppliers in the industry
– A labour force skilled in the crafts of the industry
– Components suppliers re-locate close to production centres – reducing transportation costs
– Concentration of the food processing industry around ports
– Trade magazines in which all firms can advertise cheaply and disseminate information
– Development research capabilities in local universities
• External economies partially explain the tendency for firms to cluster geographically

tutor2ututor2u™™
Economies of Scope
• Economies of scope occur where it is cheaper to produce a range of products rather than specialize in just a handful of products.
• A company’s management structure, administration systems and marketing departments are capable of carrying out these functions for more than one product
• Expanding the product range to exploit the value of existing brands is a good way of exploiting economies of scope.

tutor2ututor2u™™
Different shaped LRAC curves
Output
AC
LRAC1
LRAC2
U-Shaped LAC: average costs decline over low levels of output, but increase
at higher levels of output
L-Shaped LAC: Average costs declining over all levels of output.

tutor2ututor2u™™
Causes of Diseconomies
• Control – costs and limitations of monitoring productivity and the quality of output from thousands of employees in big corporations – possible stakeholder conflicts
• Co-ordination - difficult to co-ordinate complicated production processes across several plants in different locations and countries
• Co-operation - workers in large firms may feel a sense of alienation and subsequent loss of morale. Possible failures of human resource management