A17/2c - Volume 2c: Technical Report: Ground …...A17/2c - Volume 2c: Technical Report: Ground...
163
A17/2c - Volume 2c: Technical Report: Ground Investigation Transport and Works Act 1992 Boston Barrier Order
Transcript of A17/2c - Volume 2c: Technical Report: Ground …...A17/2c - Volume 2c: Technical Report: Ground...
A17/2c - Volume 2c: Technical Report: Ground Investigation
Transport and Works Act 1992
Boston Barrier Order

We are the Environment Agency. We protect and improve the environment.
Acting to reduce the impacts of a changing climate on people and wildlife is at the heart of everything we do.
We reduce the risks to people, properties and businesses from flooding and coastal erosion.
We protect and improve the quality of water, making sure there is enough for people, businesses, agriculture and the environment. Our work helps to ensure people can enjoy the water environment through angling and navigation.
We look after land quality, promote sustainable land management and help protect and enhance wildlife habitats. And we work closely with businesses to help them comply with environmental regulations.
We can’t do this alone. We work with government, local councils, businesses, civil society groups and communities to make our environment a better place for people and wildlife.
Published by:
Environment Agency Horizon House, Deanery Road, Bristol BS1 5AH Email: [email protected] www.gov.uk/environment-agency
© Environment Agency 2014
All rights reserved. This document may be reproduced with prior permission of the Environment Agency.
Further copies of this report are available from our publications catalogue: www.gov.uk/government/publications
or our National Customer Contact Centre: T: 03708 506506
Email: [email protected].
A17/2c - Volume 2c: Technical Report: Ground Investigation Report iii
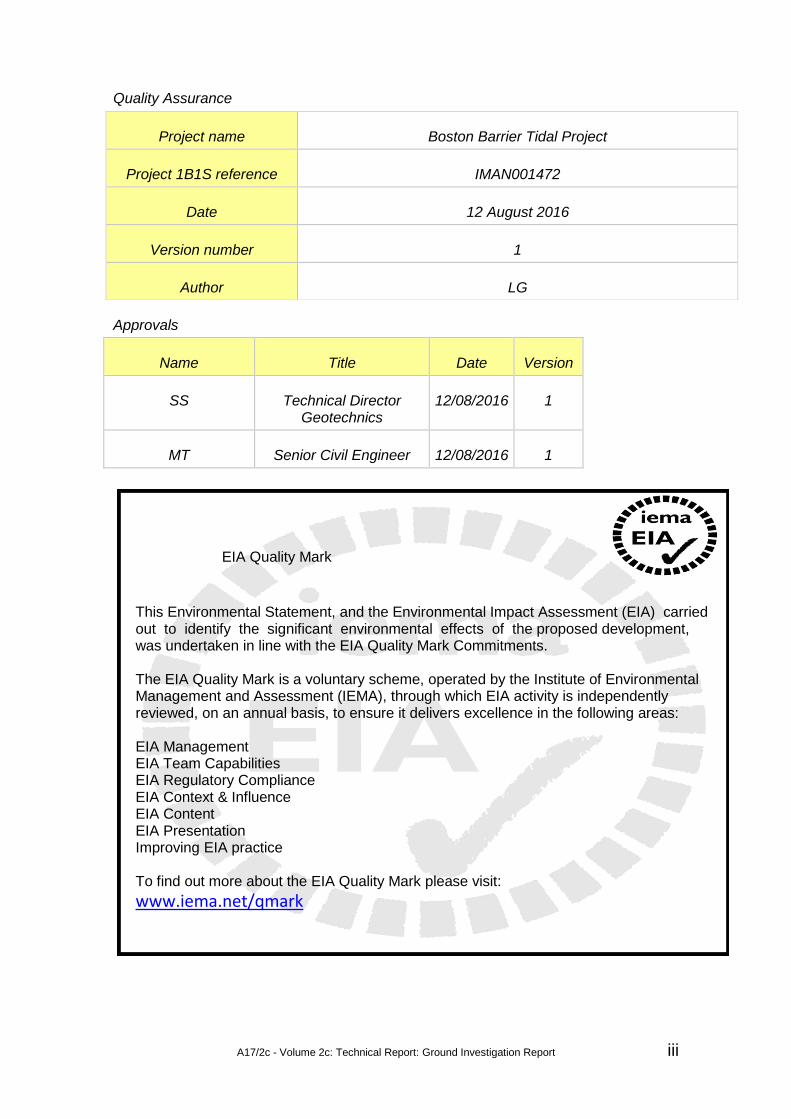
Quality Assurance
Approvals
Name Title Date Version
SS Technical Director Geotechnics
12/08/2016 1
MT Senior Civil Engineer 12/08/2016 1
Project name Boston Barrier Tidal Project
Project 1B1S reference IMAN001472
Date 12 August 2016
Version number 1
Author LG
EIA Quality Mark
This Environmental Statement, and the Environmental Impact Assessment (EIA) carried out to identify the significant environmental effects of the proposed development, was undertaken in line with the EIA Quality Mark Commitments. The EIA Quality Mark is a voluntary scheme, operated by the Institute of Environmental Management and Assessment (IEMA), through which EIA activity is independently reviewed, on an annual basis, to ensure it delivers excellence in the following areas: EIA Management EIA Team Capabilities EIA Regulatory Compliance EIA Context & Influence EIA Content EIA Presentation Improving EIA practice To find out more about the EIA Quality Mark please visit:
www.iema.net/qmark

A17/2c - Volume 2c: Technical Report: Ground Investigation Report iv
This page has been left intentionally blank.
Boston Barrier
Ground Investigation Report
February 2015
Environment Agency

335092 WCD WAM 01 A
pims/339200 Boston Barrier TWAO/Products/Design Products/GI/GIR
07 February 2015
Boston Barrier
Ground Investigation Report
Boston Barrier
Ground Investigation Report
February 2015
Environment Agency
Kingfisher House Goldhay Way Orton Goldhay Peterborough PE2 5ZR
Mott MacDonald, Demeter House, Station Road, Cambridge CB1 2RS, United Kingdom
T +44 (0)1223 463500 F +44 (0)1223 461007 W www.mottmac.com

335092/WCD/WAM/01/A 07 February 2015 pims/339200 Boston Barrier TWAO/Products/Design Products/GI/GIR
Boston Barrier Ground Investigation Report
Revision Date Originator Checker Approver Description
01 16 February 2015 L Griffith S Solera M Taylor First Draft for Comment
02 24 February 2015 L Griffith S Solera M Taylor Updated issue
Issue and revision record
Information Class: Standard
This document is issued for the party which commissioned it and for specific purposes connected with the above-captioned project only. It should not be relied upon by any other party or used for any other purpose.
We accept no responsibility for the consequences of this document being relied upon by any other party, or being used for any other purpose, or containing any error or omission which is due to an error or omission in data supplied to us by other parties.
This document contains confidential information and proprietary intellectual property. It should not be shown to other parties without consent from us and from the party which commissioned it.

335092/WCD/WAM/01/A 07 February 2015 pims/339200 Boston Barrier TWAO/Products/Design Products/GI/GIR
Boston Barrier Ground Investigation Report
Chapter Title Page
Executive Summary i
1 Introduction 1
1.1 Background __________________________________________________________________________ 1 1.2 Objectives ___________________________________________________________________________ 1 1.3 Scope of Work _______________________________________________________________________ 2 1.4 Sources of Information _________________________________________________________________ 2 1.5 Parties Involved ______________________________________________________________________ 2 1.6 Limitation and Responsibilities for Information ______________________________________________ 3
2 Environmental Setting 5
2.1 Site Location and Design Details _________________________________________________________ 5 2.2 Topography __________________________________________________________________________ 7 2.3 Hydrology ___________________________________________________________________________ 8 2.4 Historical Maps _______________________________________________________________________ 8 2.5 Geological Information ________________________________________________________________ 10 2.6 Hydrogeology and Groundwater ________________________________________________________ 11 2.7 Potential Contamination _______________________________________________________________ 11
3 Ground Investigation Field and Laboratory Results 13
3.1 General ____________________________________________________________________________ 13 3.2 Ground Investigation Rationale _________________________________________________________ 13 3.3 Fieldwork __________________________________________________________________________ 13 3.4 Standards __________________________________________________________________________ 14 3.5 Service Inspection ___________________________________________________________________ 14 3.6 Investigation Techniques ______________________________________________________________ 15 3.7 In-situ Testing _______________________________________________________________________ 17 3.8 Sampling ___________________________________________________________________________ 17 3.9 Installations and Monitoring ____________________________________________________________ 18 3.10 Laboratory Testing ___________________________________________________________________ 18
4 Summary of Fieldwork Ground Conditions 21
4.1 Services ___________________________________________________________________________ 21 4.2 Structural Elements __________________________________________________________________ 22 4.3 Voids ______________________________________________________________________________ 23 4.4 Condition of the Lock _________________________________________________________________ 25 4.5 Summary of Strata Encountered ________________________________________________________ 26 4.6 Geological Cross Sections _____________________________________________________________ 28 4.7 Evidence of Contamination ____________________________________________________________ 29
5 Ground Conditions and Geotechnical Properties 31
Contents
335092/WCD/WAM/01/A 07 February 2015 pims/339200 Boston Barrier TWAO/Products/Design Products/GI/GIR
Boston Barrier Ground Investigation Report
5.1 Data Set ___________________________________________________________________________ 31 5.2 Definition of Parameters _______________________________________________________________ 32 5.3 Classification and SPT Data ____________________________________________________________ 35 5.4 Total Stress Data ____________________________________________________________________ 46 5.5 Effective Stress Results _______________________________________________________________ 52 5.6 Stiffness ___________________________________________________________________________ 55 5.7 Concrete Aggressivity Results __________________________________________________________ 56 5.8 Permeability Results __________________________________________________________________ 57 5.9 Groundwater Monitoring Results ________________________________________________________ 58 5.10 Summary of Parameters ______________________________________________________________ 62
6 Phase II Contaminated Land Assessment 63
6.1 Methodology ________________________________________________________________________ 63 6.2 Risks associated with commercial/ industrial proposed end use. _______________________________ 63 6.3 Soil Laboratory Results _______________________________________________________________ 65 6.4 Groundwater Laboratory Results ________________________________________________________ 68 6.5 Ground gas monitoring ________________________________________________________________ 70 6.6 Discussion of the Phase II Contamination Results __________________________________________ 71
7 Risk Register 78
8 Conclusions 81
8.1 Geology and Groundwater _____________________________________________________________ 81 8.2 General Geotechnical Profile ___________________________________________________________ 81 8.3 Geotechnical Parameters ______________________________________________________________ 81 8.4 Buried Structures ____________________________________________________________________ 81 8.5 Contamination_______________________________________________________________________ 81 8.6 Voids ______________________________________________________________________________ 82
9 Bibliography 83
Appendices 86
Appendix A. Location Plan _______________________________________________________________________ 87 Appendix B. Historical Information _________________________________________________________________ 88 Appendix C. Fieldwork Reports ____________________________________________________________________ 92 Appendix D. Geological Cross Sections _____________________________________________________________ 94 Appendix E. Parameter Plots _____________________________________________________________________ 95 Appendix F. Concrete Aggressivity Results __________________________________________________________ 98 Appendix G. Groundwater Results ________________________________________________________________ 102 Appendix H. Contamination Results _______________________________________________________________ 105 Appendix I. Contamination Risk Assessment Methodology ____________________________________________ 106 I.1 General ___________________________________________________________________________ 106 I.2 Classification of Risk ________________________________________________________________ 106 Appendix J. Conceptual Site Model _______________________________________________________________ 108

335092/WCD/WAM/01/A 07 February 2015 pims/339200 Boston Barrier TWAO/Products/Design Products/GI/GIR
Boston Barrier Ground Investigation Report
Appendix K. Effective Stress Shearbox Plots ________________________________________________________ 110 Appendix L. Tidal Variation of Groundwater in Alluvium on Left Bank ____________________________________ 112

i 335092/WCD/WAM/01/A 07 February 2015 pims/339200 Boston Barrier TWAO/Products/Design Products/GI/GIR
Boston Barrier Ground Investigation Report
Mott MacDonald has been appointed by the Environment Agency (EA) to provide design services under
the Lot 3 WEM framework.
The town of Boston has historically been subject to flooding, particularly from the sea. In December 2013,
the area was hit by severe floods. The existing standard of protection at Boston is to a 1 in 50 (2%) chance
of flooding each year with the standard of protection at Boston determined by the condition of these
defences. The risk of tidal flooding is greater than the risk of fluvial flooding.
Mott MacDonald has been commissioned to progress the outline design to a preliminary design in order to
inform the environmental impact assessment which is key deliverable for the TWAO (Transport Works Act
Order). At the time of writing this report the preliminary design developed by Mott MacDonald has yet to be
formally approved by the Environment Agency, so the design considered is the outline design in the PAR
document [1].
Two phases of ground investigation were undertaken prior to Mott MacDonald’s engagement, one is 2010
by Soil Engineering [2] and one is 2012 by WYG Environment [3]. The third phase of ground investigation
was scoped by Halcrow Jacob Alliance (HJA) to identify and reduce the risks specifically associated with
the design proposed in the PAR [1]. The investigation was undertaken between September and November
2014 by WYG Environment [4]. Mott MacDonald has been commissioned by the Environment Agency to
assess the ground investigation contractors technical aspects of the tenders; supervise the ground
investigation and interpret the results of the ground investigation. The data gathered from all three phases
of investigation are summarised and presented in this Ground Investigation Report (GIR).
The results of the recent ground investigation carried out in the Port of Boston and along the Right
Embankment of the River Witham confirmed the geology presented in historical boreholes and previous
phases of ground investigation.
The geology typically comprised Made Ground overlying Alluvium which in turn overlies Glacial Till
deposits. In previous phases of ground investigation, Kimmeridge Clay has been identified within
boreholes.
The ground water on the Left embankment is tidally influenced and the range of this fluctuation is up to
3.5m during spring tides with the Alluvium being more sensitive to this than the Made Ground or the Glacial
Till. The groundwater is typically between 0.0 and 3.5m AOD, in relation to the ground level which is
typically 5.5mAOD. On the Right Embankment the groundwater is consistently approximately 3.0mAOD
(ground level is 6.4mAOD) and shows negligible influence from tides.
The list of uncharted buried structures within the Port of Boston is extensive. There is high risk of
encountering unchartered services. The tie-in anchors have been exposed in the Maud Foster to the wet
dock lock area. However, further work is required to identify the all the tie in anchors between the Knuckle
and the Barrier.
The key contamination risks on the site have arisen in the area of the historical slipway, within the Knuckle
and along the access road. It is recommended that gas protection measures be used for the proposed
control building and there is ongoing risk that asbestos may be present on the site.
Executive Summary
Boston Barrier Ground Investigation Report
335092/WCD/WAM/01/A 07 February 2015 pims/339200 Boston Barrier TWAO/Products/Design Products/GI/GIR
1
1.1 Background
Mott MacDonald has been appointed by the Environment Agency (EA) to provide design services under
the Lot 3 WEM framework.
The town of Boston has historically been subject to flooding, particularly from the sea. In December 2013,
the area was hit by severe floods from a tidal surge event. The existing standard of protection at Boston is
to a 1 in 50 (2%) chance of flooding each year with the standard of protection determined by the condition
of these defences.
The Boston Combined Strategy (BCS) comprises of a number of phases of work to reduce the risk to
people and the environment from tidal flooding and provide a safe and attractive navigation link to the
proposed Fens Waterways Link. Phase 3 of the BCS is to deliver a tidal barrier with the option to manage
water levels upstream of the barrier.
An outline design has been developed by HJA for the production of the Boston Barrage Barrier Works
Project Appraisal Report [1] prepared by the EA.
Mott MacDonald has been commissioned to progress the outline design to a preliminary design in order to
inform the environmental impact assessment which is key deliverable for the TWAO (Transport Works Act
Order). At the time of writing this report the preliminary design developed by Mott MacDonald has yet to be
formally approved by the Environment Agency, so the design considered is the outline design in the PAR
document [1].
The ground conditions will play a significant role in the costs and risks to the scheme. It is therefore
important to evaluate all the data available to identify and reduce these risks.
Two phases of ground investigation were undertaken prior to Mott MacDonald’s engagement; the first was
delivered in 2010 by Soil Engineering [2] and the second was delivered in 2012 by WYG Environment [3].
A third phase of ground investigation was scoped by HJA to identify and reduce the risks specifically
associated with the design proposed in the PAR [1]. This third investigation was undertaken between
September and November 2014 by WYG Environment [4]. Mott MacDonald has been commissioned by
the Environment Agency to assess the ground investigation contractor’s technical aspects of the tenders;
supervise the ground investigation and interpret the results of the ground investigation. The data gathered
from all three phases of investigation are summarised and presented in this Ground Investigation Report
(GIR).
1.2 Objectives
The intrusive ground investigations were undertaken by specialist contractors to provide factual information
on the geotechnical, geo-environmental and groundwater conditions along the proposed alignment of the
flood wall and within the River Witham. The results of the phase 3 investigation are reported in the Factual
Ground Investigation Report [4].
1 Introduction
Boston Barrier Ground Investigation Report
335092/WCD/WAM/01/A 07 February 2015 pims/339200 Boston Barrier TWAO/Products/Design Products/GI/GIR
2
The objectives of this report are to:
summarise the geotechnical and geo-environmental information gathered from all three phases of
ground investigation,
identify and describe risks associated with the ground and groundwater conditions, and
provide Phase II contaminated land risk assessment based on the PAR outline design, as per CIRIA
Report C552 [5].
This report must be read in conjunction with the Factual Reports for the three phases by Soil Engineering
[2] and WYG Environmental [3] [4].
1.3 Scope of Work
The scope of the works undertaken by Mott MacDonald geotechnical team on this project is as follows:
Review the ground investigation scope of works produced by HJA [6]
Review and advise on the technical aspects of the GI contractor tenders
Provide full time supervision for the investigation
Review and comment on the GI contractors Factual Report
Provide a ground investigation report on the ground conditions.
The following items are outside the scope of this work:
Asbestos guidance
Geotechnical design parameters.
1.4 Sources of Information
The information in this report has been taken from the following sources:
Factual information from three phases of ground investigations [2] [3] [4]
Published geological maps and memoirs [7] [8] [9]
An Envirocheck report purchased for the site [10]
1.5 Parties Involved
The client is:
Environment Agency
Kingfisher House
Goldhay Way
Orton Goldhay
Peterborough
PE2 5ZR
The phase 1 ground investigation contractor was:
Soil Engineering
Boston Barrier Ground Investigation Report
335092/WCD/WAM/01/A 07 February 2015 pims/339200 Boston Barrier TWAO/Products/Design Products/GI/GIR
3
Parkside Lane
Dewsbury Road
Leeds
LS11 5SX
The phase 2 ground investigation contractor was:
WYG Environment
100 St John Street
London
EC1M 4EH
The phase 3 ground investigation contractor was:
WYG Environment
Geneva Building
Lake View Drive
Sherwood Business Park
Annesley
Nottinghamshire
NG15 0ED
The current consultant/designer is:
Mott MacDonald
Demeter House
Cambridge
CB1 2RS
The previous consultant/designer was:
HJA
Endever House
Cygnet Park
Peterborough
PE7 8FD
1.6 Limitation and Responsibilities for Information
This document is issued for the party which commissioned it and for specific purposes connected with the
above- captioned project only. It should not be relied upon by any other party or used for any other
purpose.

Boston Barrier Ground Investigation Report
335092/WCD/WAM/01/A 07 February 2015 pims/339200 Boston Barrier TWAO/Products/Design Products/GI/GIR
4
We accept no responsibility for the consequences of this document being relied upon by any other party, or
being used for any other purpose, or containing any error or omission which is due to an error or omission
in data supplied to us by other parties. This document contains confidential information and proprietary
intellectual property. It should not be shown to other parties without consent from Mott MacDonald Ltd and
from the party which commissioned it.
To the extent that this document is based on information supplied by other parties, Mott MacDonald Ltd
accepts no liability for any loss or damage suffered by the client stemming from any conclusions based on
data supplied by parties other than Mott MacDonald Ltd and used by Mott MacDonald Ltd in preparing this
report.
To the extent that this document is based on information obtained in previous or recent ground
investigations, persons using or relying on it should recognise that any such investigation can examine
only a fraction of the subsurface conditions. In any ground investigation there remains a risk that pockets
or “hot-spots” of contamination or other hazards may not be identified, because investigations are
necessarily based on sampling at localised points. Certain indicators or evidence of hazardous substances
or conditions may have been outside the portion of the subsurface investigated or monitored, and thus may
not have been identified or their full significance appreciated.
Whilst the presence of asbestos, toxic mould or unexploded ordnance (UXO) identified during previous
ground investigation and analysis can be presented, no assessment has been included herein. A specialist
contractor must be appointed to address the potential issues and advise on risk or remedial measures.

Boston Barrier Ground Investigation Report
335092/WCD/WAM/01/A 07 February 2015 pims/339200 Boston Barrier TWAO/Products/Design Products/GI/GIR
5
2.1 Site Location and Design Details
The site is located in Boston, Lincolnshire. The proposed flood wall alignment goes through the Port of
Boston Estate, crosses the River Witham at the barrier location and travels down the embankment
opposite the Port Estate which is referred to as the Right Embankment. Figure 2.1 shows the general
arrangement of the scheme. A more detailed schematic, IMAN001472-POB-011 can be found in Appendix
A. Existing quay walls along the port include masonry, concrete and sheetpile walls. No obvious
accelerated low water corrosion was evidence on the sheetpile walls, but this was outside the scope of the
investigation.
Figure 2.1: Boston Barrier Site Location Plan
Source: [1]
The works have been divided into package orders, all of which are addressed in this report. Figure 2.2
shows the location of the package orders.
Figure 2.2: Location of package orders
2 Environmental Setting
Knuckle Barrier Location The Haven
South Forty Foot
Drain
Boston Barrier Ground Investigation Report
335092/WCD/WAM/01/A 07 February 2015 pims/339200 Boston Barrier TWAO/Products/Design Products/GI/GIR
6
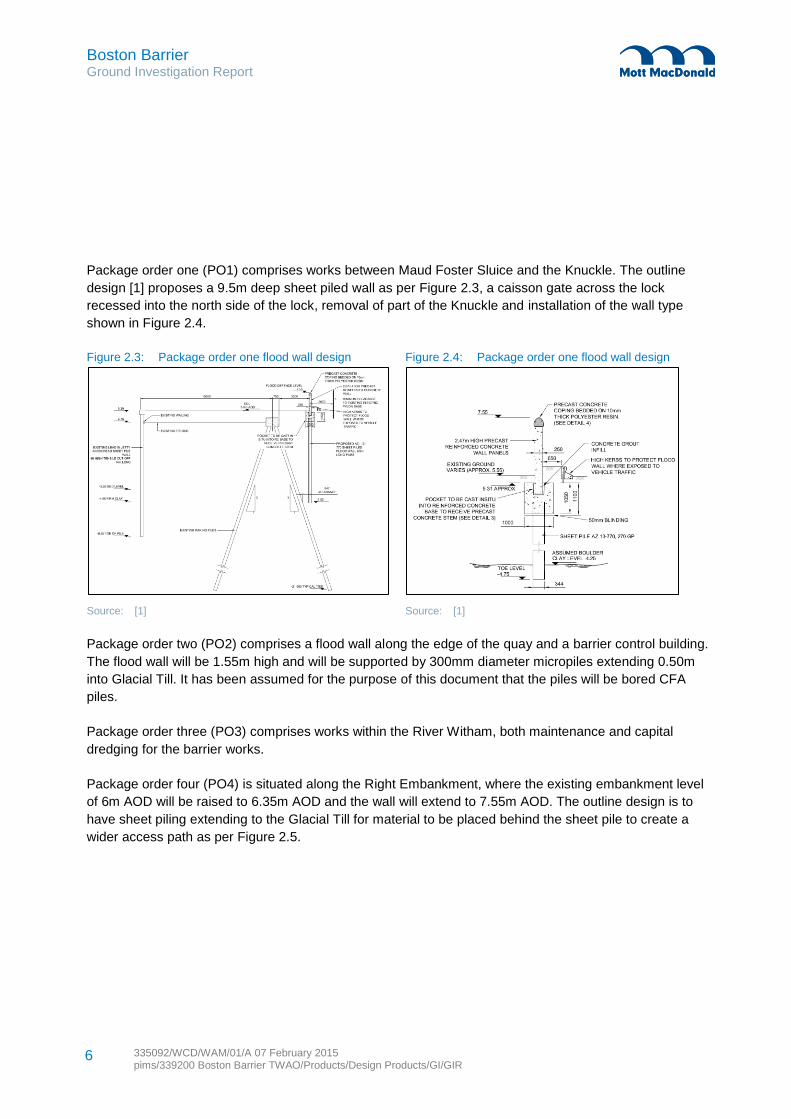
Package order one (PO1) comprises works between Maud Foster Sluice and the Knuckle. The outline
design [1] proposes a 9.5m deep sheet piled wall as per Figure 2.3, a caisson gate across the lock
recessed into the north side of the lock, removal of part of the Knuckle and installation of the wall type
shown in Figure 2.4.
Figure 2.3: Package order one flood wall design Figure 2.4: Package order one flood wall design
Source: [1] Source: [1]
Package order two (PO2) comprises a flood wall along the edge of the quay and a barrier control building.
The flood wall will be 1.55m high and will be supported by 300mm diameter micropiles extending 0.50m
into Glacial Till. It has been assumed for the purpose of this document that the piles will be bored CFA
piles.
Package order three (PO3) comprises works within the River Witham, both maintenance and capital
dredging for the barrier works.
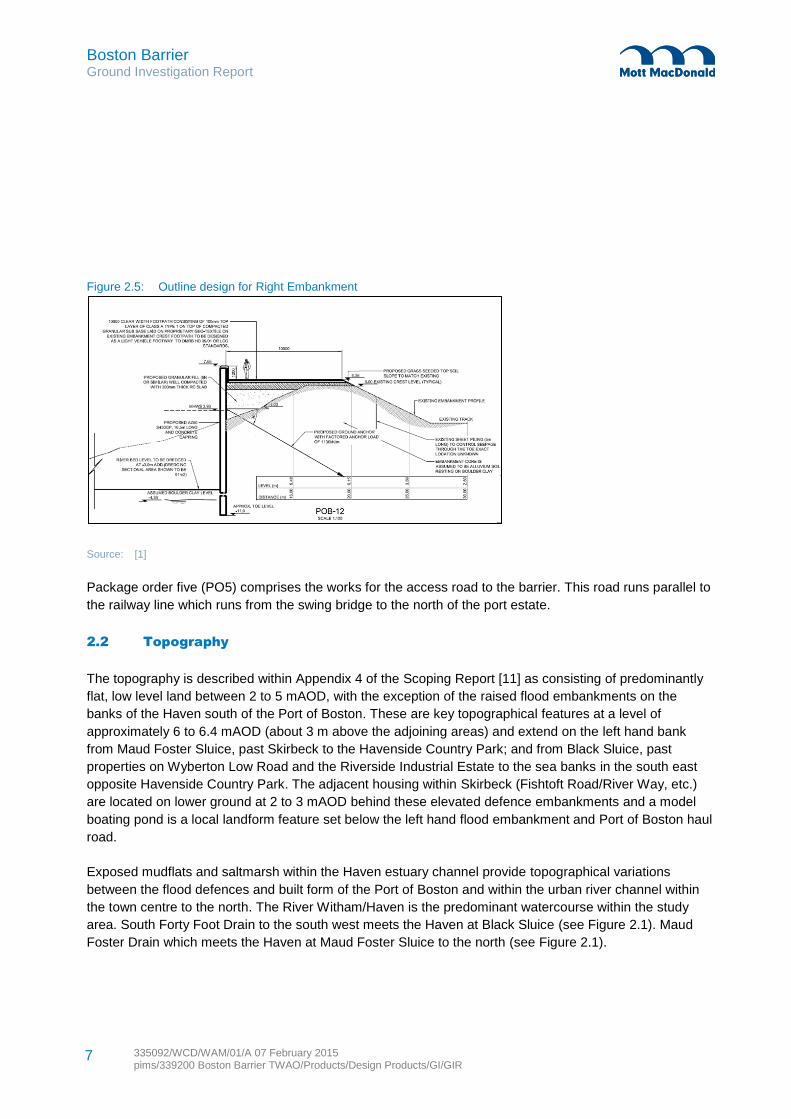
Package order four (PO4) is situated along the Right Embankment, where the existing embankment level
of 6m AOD will be raised to 6.35m AOD and the wall will extend to 7.55m AOD. The outline design is to
have sheet piling extending to the Glacial Till for material to be placed behind the sheet pile to create a
wider access path as per Figure 2.5.
Boston Barrier Ground Investigation Report
335092/WCD/WAM/01/A 07 February 2015 pims/339200 Boston Barrier TWAO/Products/Design Products/GI/GIR
7
Figure 2.5: Outline design for Right Embankment
Source: [1]
Package order five (PO5) comprises the works for the access road to the barrier. This road runs parallel to
the railway line which runs from the swing bridge to the north of the port estate.
2.2 Topography
The topography is described within Appendix 4 of the Scoping Report [11] as consisting of predominantly
flat, low level land between 2 to 5 mAOD, with the exception of the raised flood embankments on the
banks of the Haven south of the Port of Boston. These are key topographical features at a level of
approximately 6 to 6.4 mAOD (about 3 m above the adjoining areas) and extend on the left hand bank
from Maud Foster Sluice, past Skirbeck to the Havenside Country Park; and from Black Sluice, past
properties on Wyberton Low Road and the Riverside Industrial Estate to the sea banks in the south east
opposite Havenside Country Park. The adjacent housing within Skirbeck (Fishtoft Road/River Way, etc.)
are located on lower ground at 2 to 3 mAOD behind these elevated defence embankments and a model
boating pond is a local landform feature set below the left hand flood embankment and Port of Boston haul
road.
Exposed mudflats and saltmarsh within the Haven estuary channel provide topographical variations
between the flood defences and built form of the Port of Boston and within the urban river channel within
the town centre to the north. The River Witham/Haven is the predominant watercourse within the study
area. South Forty Foot Drain to the south west meets the Haven at Black Sluice (see Figure 2.1). Maud
Foster Drain which meets the Haven at Maud Foster Sluice to the north (see Figure 2.1).
Boston Barrier Ground Investigation Report
335092/WCD/WAM/01/A 07 February 2015 pims/339200 Boston Barrier TWAO/Products/Design Products/GI/GIR
8
2.3 Hydrology
The River Witham is a tidal river which flows through the site, which in turn is named The Haven in the
area in front of the Port of Boston. The Envirocheck Report [10] designates the entire area as liable to
‘extreme flooding from rivers or sea without defences (Zone 2)’. Existing flood defences are identified as
running along the Right Embankment up to and across the Black Sluice. On the left hand side the flood
defences run from the swing bridge across the Port of Boston to the Wet Dock and on to the Maud Foster
Sluice. The report also shows that there are no areas on the site benefitting from the existing flood
defences.
The South Forty Foot Drain flows into the River Witham through the Black Sluice which is located to the
upstream of the proposed barrier location. Downstream of the barrier location the Maud Foster Drain flows
into the River Witham through the Maud Foster Sluice, although these drains are not especially linked to
the tidal flooding.
The scoping report for the Boston Combined Scheme [11] states that the high water spring tides are higher
than the ground level around the site which leads to tidal flooding. The risk of tidal flooding is far greater
than the risk of fluvial flooding.
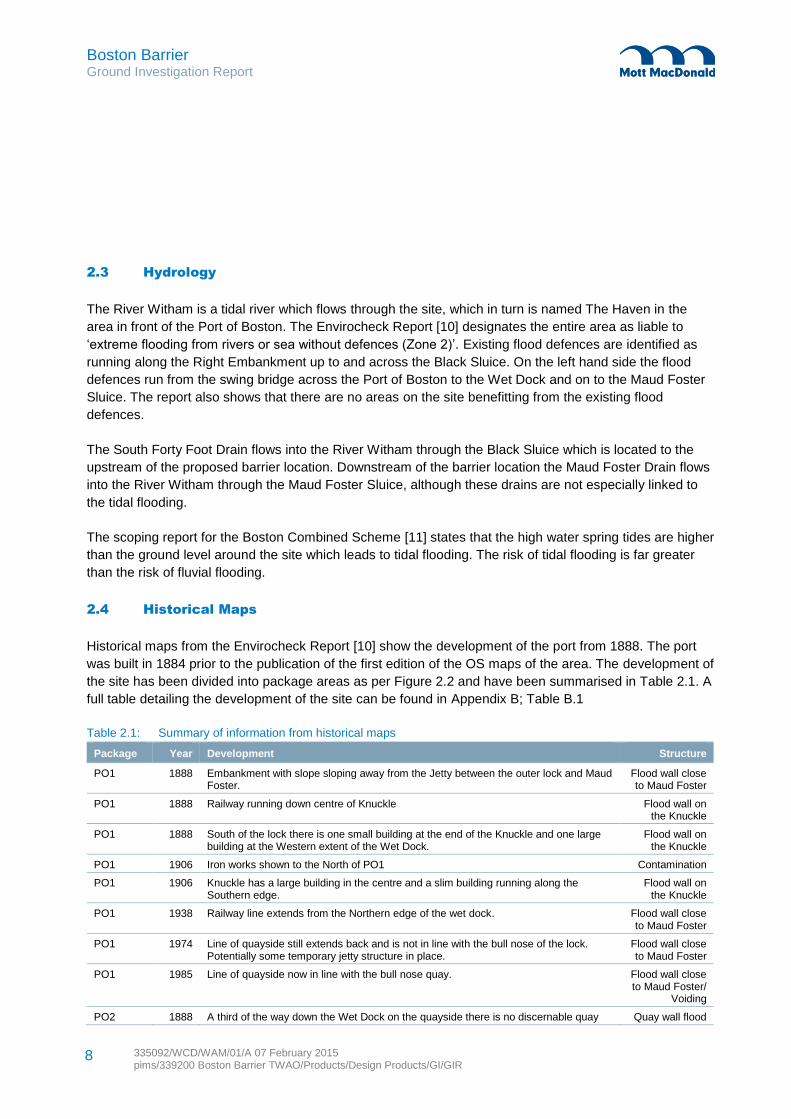
2.4 Historical Maps
Historical maps from the Envirocheck Report [10] show the development of the port from 1888. The port
was built in 1884 prior to the publication of the first edition of the OS maps of the area. The development of
the site has been divided into package areas as per Figure 2.2 and have been summarised in Table 2.1. A
full table detailing the development of the site can be found in Appendix B; Table B.1
Table 2.1: Summary of information from historical maps
Package Year Development Structure
PO1 1888 Embankment with slope sloping away from the Jetty between the outer lock and Maud Foster.
Flood wall close to Maud Foster
PO1 1888 Railway running down centre of Knuckle Flood wall on the Knuckle
PO1 1888 South of the lock there is one small building at the end of the Knuckle and one large building at the Western extent of the Wet Dock.
Flood wall on the Knuckle
PO1 1906 Iron works shown to the North of PO1 Contamination
PO1 1906 Knuckle has a large building in the centre and a slim building running along the Southern edge.
Flood wall on the Knuckle
PO1 1938 Railway line extends from the Northern edge of the wet dock. Flood wall close to Maud Foster
PO1 1974 Line of quayside still extends back and is not in line with the bull nose of the lock. Potentially some temporary jetty structure in place.
Flood wall close to Maud Foster
PO1 1985 Line of quayside now in line with the bull nose quay. Flood wall close to Maud Foster/
Voiding
PO2 1888 A third of the way down the Wet Dock on the quayside there is no discernable quay Quay wall flood
Boston Barrier Ground Investigation Report
335092/WCD/WAM/01/A 07 February 2015 pims/339200 Boston Barrier TWAO/Products/Design Products/GI/GIR
9
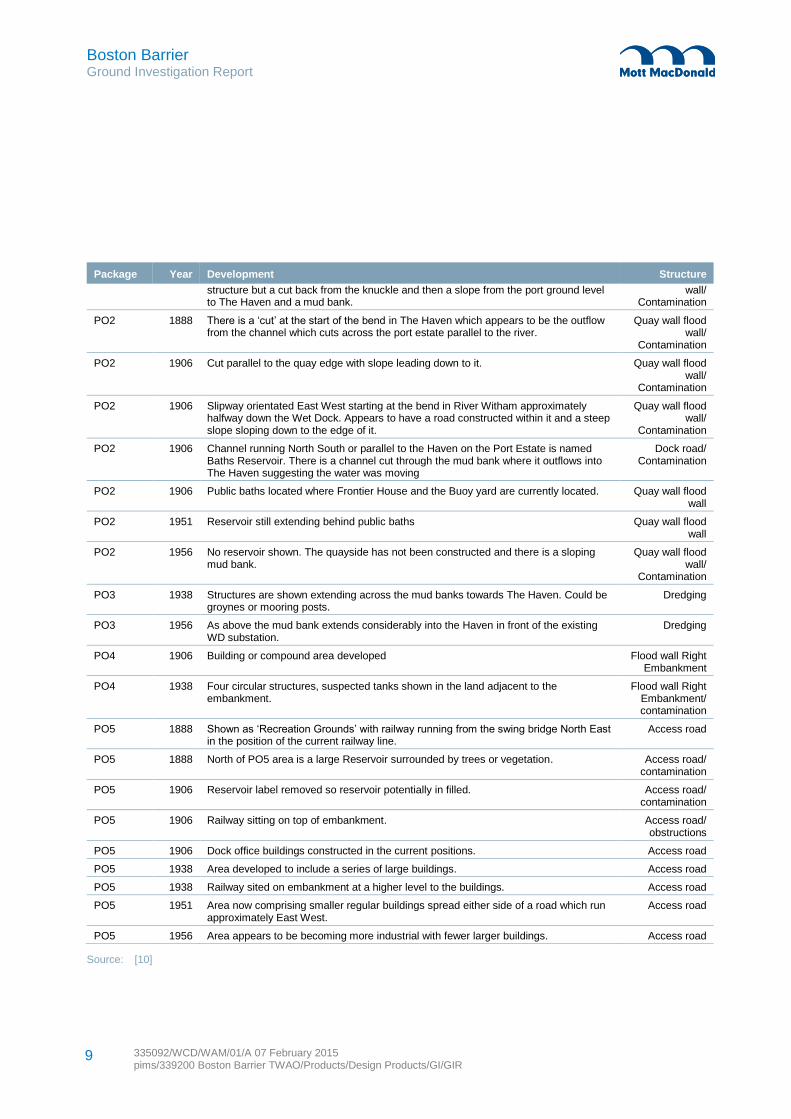
Package Year Development Structure
structure but a cut back from the knuckle and then a slope from the port ground level to The Haven and a mud bank.
wall/ Contamination
PO2 1888 There is a ‘cut’ at the start of the bend in The Haven which appears to be the outflow from the channel which cuts across the port estate parallel to the river.
Quay wall flood wall/
Contamination
PO2 1906 Cut parallel to the quay edge with slope leading down to it. Quay wall flood wall/
Contamination
PO2 1906 Slipway orientated East West starting at the bend in River Witham approximately halfway down the Wet Dock. Appears to have a road constructed within it and a steep slope sloping down to the edge of it.
Quay wall flood wall/
Contamination
PO2 1906 Channel running North South or parallel to the Haven on the Port Estate is named Baths Reservoir. There is a channel cut through the mud bank where it outflows into The Haven suggesting the water was moving
Dock road/ Contamination
PO2 1906 Public baths located where Frontier House and the Buoy yard are currently located. Quay wall flood wall
PO2 1951 Reservoir still extending behind public baths Quay wall flood wall
PO2 1956 No reservoir shown. The quayside has not been constructed and there is a sloping mud bank.
Quay wall flood wall/
Contamination
PO3 1938 Structures are shown extending across the mud banks towards The Haven. Could be groynes or mooring posts.
Dredging
PO3 1956 As above the mud bank extends considerably into the Haven in front of the existing WD substation.
Dredging
PO4 1906 Building or compound area developed Flood wall Right Embankment
PO4 1938 Four circular structures, suspected tanks shown in the land adjacent to the embankment.
Flood wall Right Embankment/ contamination
PO5 1888 Shown as ‘Recreation Grounds’ with railway running from the swing bridge North East in the position of the current railway line.
Access road
PO5 1888 North of PO5 area is a large Reservoir surrounded by trees or vegetation. Access road/ contamination
PO5 1906 Reservoir label removed so reservoir potentially in filled. Access road/ contamination
PO5 1906 Railway sitting on top of embankment. Access road/ obstructions
PO5 1906 Dock office buildings constructed in the current positions. Access road
PO5 1938 Area developed to include a series of large buildings. Access road
PO5 1938 Railway sited on embankment at a higher level to the buildings. Access road
PO5 1951 Area now comprising smaller regular buildings spread either side of a road which run approximately East West.
Access road
PO5 1956 Area appears to be becoming more industrial with fewer larger buildings. Access road
Source: [10]
Boston Barrier Ground Investigation Report
335092/WCD/WAM/01/A 07 February 2015 pims/339200 Boston Barrier TWAO/Products/Design Products/GI/GIR
10
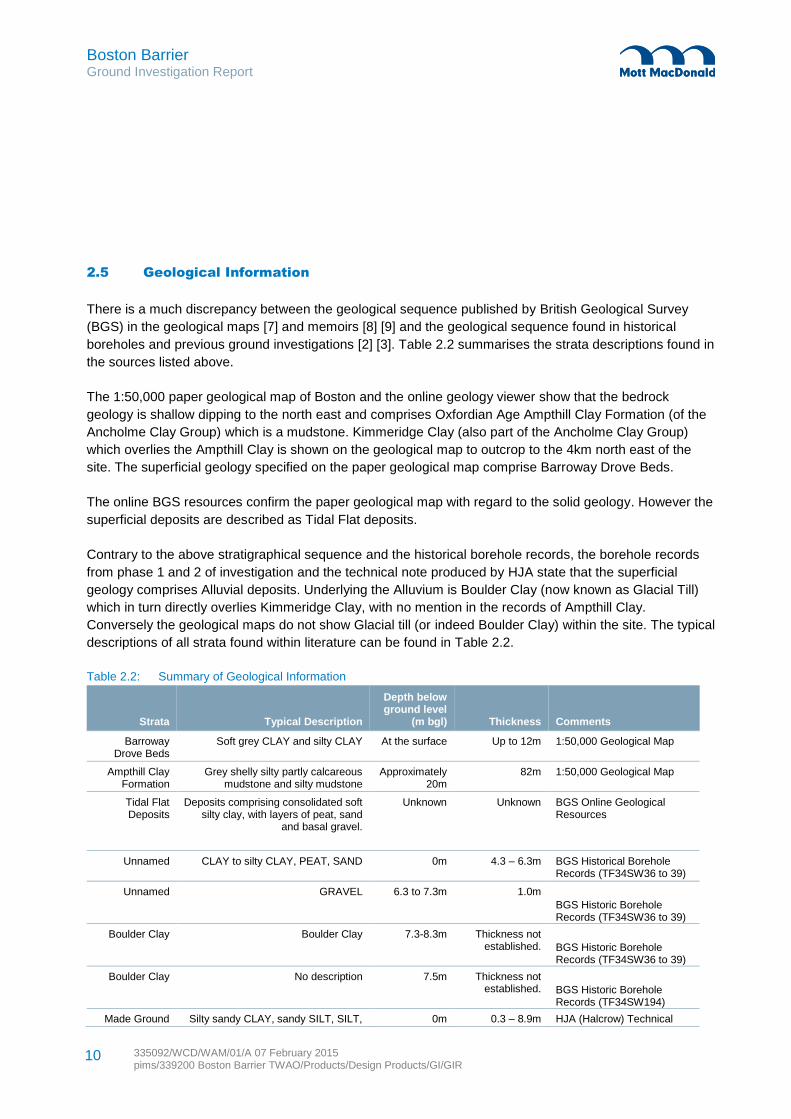
2.5 Geological Information
There is a much discrepancy between the geological sequence published by British Geological Survey
(BGS) in the geological maps [7] and memoirs [8] [9] and the geological sequence found in historical
boreholes and previous ground investigations [2] [3]. Table 2.2 summarises the strata descriptions found in
the sources listed above.
The 1:50,000 paper geological map of Boston and the online geology viewer show that the bedrock
geology is shallow dipping to the north east and comprises Oxfordian Age Ampthill Clay Formation (of the
Ancholme Clay Group) which is a mudstone. Kimmeridge Clay (also part of the Ancholme Clay Group)
which overlies the Ampthill Clay is shown on the geological map to outcrop to the 4km north east of the
site. The superficial geology specified on the paper geological map comprise Barroway Drove Beds.
The online BGS resources confirm the paper geological map with regard to the solid geology. However the
superficial deposits are described as Tidal Flat deposits.
Contrary to the above stratigraphical sequence and the historical borehole records, the borehole records
from phase 1 and 2 of investigation and the technical note produced by HJA state that the superficial
geology comprises Alluvial deposits. Underlying the Alluvium is Boulder Clay (now known as Glacial Till)
which in turn directly overlies Kimmeridge Clay, with no mention in the records of Ampthill Clay.
Conversely the geological maps do not show Glacial till (or indeed Boulder Clay) within the site. The typical
descriptions of all strata found within literature can be found in Table 2.2.
Table 2.2: Summary of Geological Information
Strata Typical Description
Depth below ground level
(m bgl) Thickness Comments
Barroway Drove Beds
Soft grey CLAY and silty CLAY At the surface Up to 12m 1:50,000 Geological Map
Ampthill Clay Formation
Grey shelly silty partly calcareous mudstone and silty mudstone
Approximately 20m
82m 1:50,000 Geological Map
Tidal Flat Deposits
Deposits comprising consolidated soft silty clay, with layers of peat, sand
and basal gravel.
Unknown Unknown BGS Online Geological Resources
Unnamed CLAY to silty CLAY, PEAT, SAND 0m 4.3 – 6.3m BGS Historical Borehole Records (TF34SW36 to 39)
Unnamed GRAVEL 6.3 to 7.3m 1.0m
BGS Historic Borehole Records (TF34SW36 to 39)
Boulder Clay Boulder Clay 7.3-8.3m Thickness not established. BGS Historic Borehole
Records (TF34SW36 to 39)
Boulder Clay No description 7.5m Thickness not established. BGS Historic Borehole
Records (TF34SW194)
Made Ground Silty sandy CLAY, sandy SILT, SILT, 0m 0.3 – 8.9m HJA (Halcrow) Technical
Boston Barrier Ground Investigation Report
335092/WCD/WAM/01/A 07 February 2015 pims/339200 Boston Barrier TWAO/Products/Design Products/GI/GIR
11
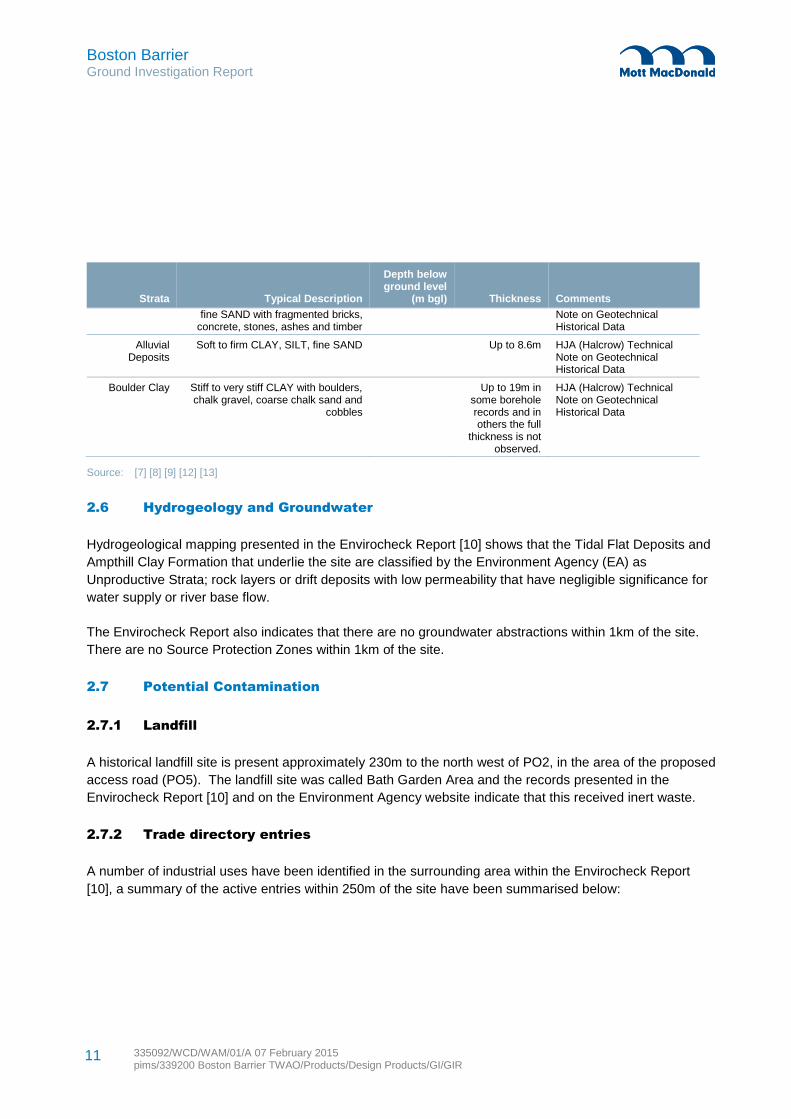
Strata Typical Description
Depth below ground level
(m bgl) Thickness Comments
fine SAND with fragmented bricks, concrete, stones, ashes and timber
Note on Geotechnical Historical Data
Alluvial Deposits
Soft to firm CLAY, SILT, fine SAND Up to 8.6m HJA (Halcrow) Technical Note on Geotechnical Historical Data
Boulder Clay Stiff to very stiff CLAY with boulders, chalk gravel, coarse chalk sand and
cobbles
Up to 19m in some borehole records and in others the full
thickness is not observed.
HJA (Halcrow) Technical Note on Geotechnical Historical Data
Source: [7] [8] [9] [12] [13]
2.6 Hydrogeology and Groundwater
Hydrogeological mapping presented in the Envirocheck Report [10] shows that the Tidal Flat Deposits and
Ampthill Clay Formation that underlie the site are classified by the Environment Agency (EA) as
Unproductive Strata; rock layers or drift deposits with low permeability that have negligible significance for
water supply or river base flow.
The Envirocheck Report also indicates that there are no groundwater abstractions within 1km of the site.
There are no Source Protection Zones within 1km of the site.
2.7 Potential Contamination
2.7.1 Landfill
A historical landfill site is present approximately 230m to the north west of PO2, in the area of the proposed
access road (PO5). The landfill site was called Bath Garden Area and the records presented in the
Envirocheck Report [10] and on the Environment Agency website indicate that this received inert waste.
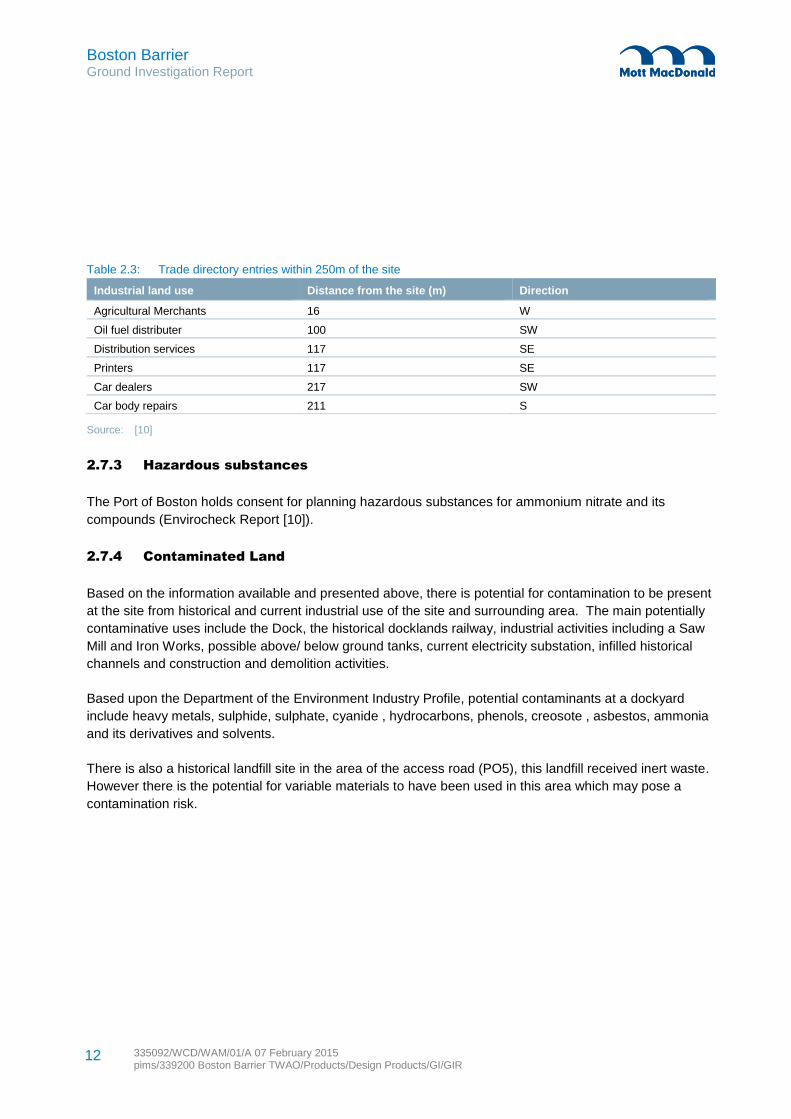
2.7.2 Trade directory entries
A number of industrial uses have been identified in the surrounding area within the Envirocheck Report
[10], a summary of the active entries within 250m of the site have been summarised below:
Boston Barrier Ground Investigation Report
335092/WCD/WAM/01/A 07 February 2015 pims/339200 Boston Barrier TWAO/Products/Design Products/GI/GIR
12
Table 2.3: Trade directory entries within 250m of the site
Industrial land use Distance from the site (m) Direction
Agricultural Merchants 16 W
Oil fuel distributer 100 SW
Distribution services 117 SE
Printers 117 SE
Car dealers 217 SW
Car body repairs 211 S
Source: [10]
2.7.3 Hazardous substances
The Port of Boston holds consent for planning hazardous substances for ammonium nitrate and its
compounds (Envirocheck Report [10]).
2.7.4 Contaminated Land
Based on the information available and presented above, there is potential for contamination to be present
at the site from historical and current industrial use of the site and surrounding area. The main potentially
contaminative uses include the Dock, the historical docklands railway, industrial activities including a Saw
Mill and Iron Works, possible above/ below ground tanks, current electricity substation, infilled historical
channels and construction and demolition activities.
Based upon the Department of the Environment Industry Profile, potential contaminants at a dockyard
include heavy metals, sulphide, sulphate, cyanide , hydrocarbons, phenols, creosote , asbestos, ammonia
and its derivatives and solvents.
There is also a historical landfill site in the area of the access road (PO5), this landfill received inert waste.
However there is the potential for variable materials to have been used in this area which may pose a
contamination risk.
Boston Barrier Ground Investigation Report
335092/WCD/WAM/01/A 07 February 2015 pims/339200 Boston Barrier TWAO/Products/Design Products/GI/GIR
13
3.1 General
This section will summarise the phase 3 investigation completed by WYG Environment between 5th
September and 11th November 2014 which was supervised by Mott MacDonald. Details of the ground
investigations carried out as phase 1 and phase 2 is not covered in this section. For details of the fieldwork
undertaken as part of phases 1 and 2 the respective Factual Reports should be consulted [2] [3].
The exploratory hole location plan is presented in Appendix A, drawing IMAN001472-MM-GEO-DR-001
and on plans included in the Contractors Factual Report [4].
Geotechnical and geo-environmental laboratory testing schedules were completed by Mott MacDonald
during and on completion of the fieldwork. The final laboratory schedule was issued to the laboratory on
20th November 2014.
3.2 Ground Investigation Rationale
The phase 3 ground investigation was designed and scheduled by HJA, to provide sufficient information to
complete the Transport and Works Act Order (TWAO) and the Environmental Statement and to provide a
level of detail appropriate to enable a competitive design and build competition to be held [6].
The cable percussive boreholes were positioned to provide a suitable coverage of the flood wall alignment
down to the anticipated pile cut off, which is specified as within the Glacial Till in the outline design. Shored
trial pits were positioned target the existing tie in anchors which were located approximately on historic
plans of the Port of Boston. Non shored trial pits were located to provide coverage of the proposed access
road and the Fisherman’s Quay development.
The overwater sediment sampling works carried out in PO3 were located in positions supplied by the
Marine Management Organisation (MMO) in consultation with the Centre for Environment, Fisheries and
Aquaculture Science (CEFAS). These samples were tested for contaminants in order to inform a decision
on a dredging and disposal licence for the capital and maintenance dredging works required as part of the
barrier construction. The laboratory scheduling and testing of these samples was completed by CEFAS
and the results were passed directly to the Client and the MMO, and did not appear in the Ground
Investigation Report by WYG [4].
3.3 Fieldwork
The number of each type of intrusive investigation technique is summarised in Table 3.1 divided into
package orders.
3 Ground Investigation Field and Laboratory Results
Boston Barrier Ground Investigation Report
335092/WCD/WAM/01/A 07 February 2015 pims/339200 Boston Barrier TWAO/Products/Design Products/GI/GIR
14
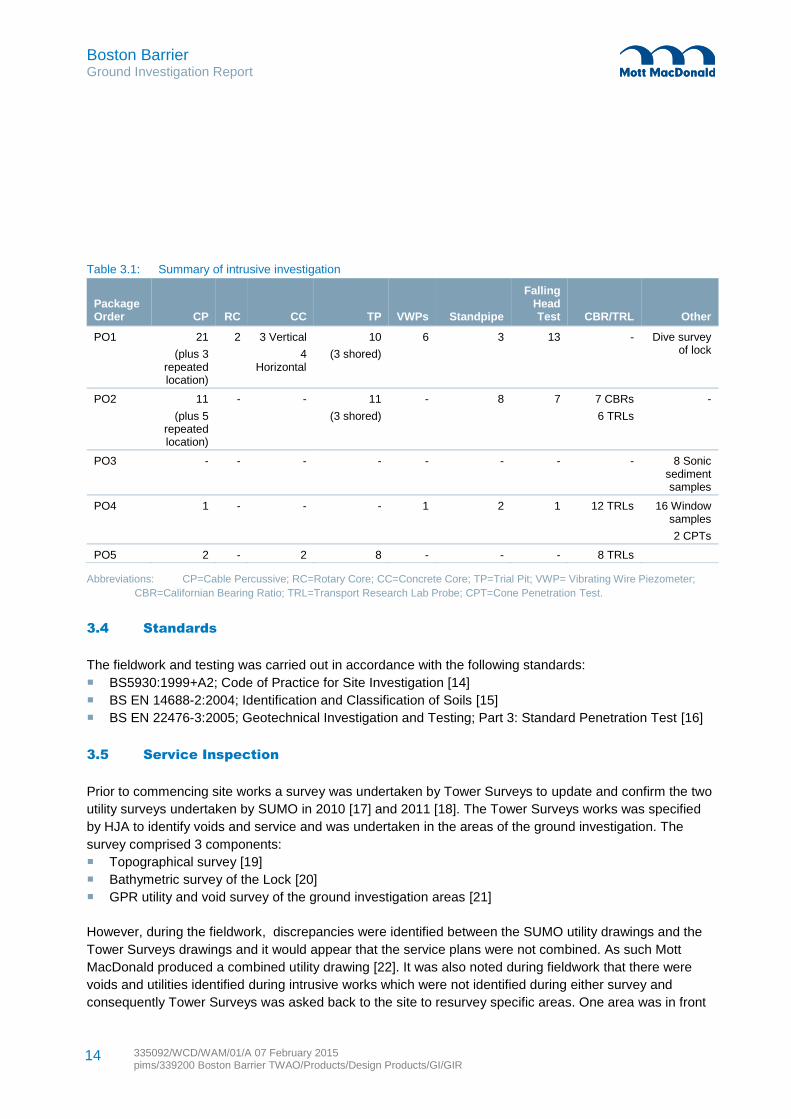
Table 3.1: Summary of intrusive investigation
Package Order CP RC CC TP VWPs Standpipe
Falling Head Test CBR/TRL Other
PO1 21
(plus 3 repeated location)
2 3 Vertical
4 Horizontal
10
(3 shored)
6 3 13 - Dive survey of lock
PO2 11
(plus 5 repeated location)
- - 11
(3 shored)
- 8 7 7 CBRs
6 TRLs
-
PO3 - - - - - - - - 8 Sonic sediment samples
PO4 1 - - - 1 2 1 12 TRLs 16 Window samples
2 CPTs
PO5 2 - 2 8 - - - 8 TRLs
Abbreviations: CP=Cable Percussive; RC=Rotary Core; CC=Concrete Core; TP=Trial Pit; VWP= Vibrating Wire Piezometer;
CBR=Californian Bearing Ratio; TRL=Transport Research Lab Probe; CPT=Cone Penetration Test.
3.4 Standards
The fieldwork and testing was carried out in accordance with the following standards:
BS5930:1999+A2; Code of Practice for Site Investigation [14]
BS EN 14688-2:2004; Identification and Classification of Soils [15]
BS EN 22476-3:2005; Geotechnical Investigation and Testing; Part 3: Standard Penetration Test [16]
3.5 Service Inspection
Prior to commencing site works a survey was undertaken by Tower Surveys to update and confirm the two
utility surveys undertaken by SUMO in 2010 [17] and 2011 [18]. The Tower Surveys works was specified
by HJA to identify voids and service and was undertaken in the areas of the ground investigation. The
survey comprised 3 components:
Topographical survey [19]
Bathymetric survey of the Lock [20]
GPR utility and void survey of the ground investigation areas [21]
However, during the fieldwork, discrepancies were identified between the SUMO utility drawings and the
Tower Surveys drawings and it would appear that the service plans were not combined. As such Mott
MacDonald produced a combined utility drawing [22]. It was also noted during fieldwork that there were
voids and utilities identified during intrusive works which were not identified during either survey and
consequently Tower Surveys was asked back to the site to resurvey specific areas. One area was in front
Boston Barrier Ground Investigation Report
335092/WCD/WAM/01/A 07 February 2015 pims/339200 Boston Barrier TWAO/Products/Design Products/GI/GIR
15
of the Customs house building where a void was found and the other was on the right bank where a power
cable was identified using the CAT scan.
Due to the dense services identified in the GPR survey in the Port of Boston and the size required for a
trial pit to be suitable for man-entry the position of each trial pit was excavated using a vacuum excavator
down to 1.2m. This technique was faster than hand digging and reduced the risk of service strikes.
The position of each borehole scanned with a cable avoidance tool (CAT) prior to excavating a hand dug
or vacuum excavated inspection pit to 1.2m or 1.5m respectively. The base of the pit was also scanned
using the CAT prior to commencing drilling.
3.6 Investigation Techniques
3.6.1 Cable Percussive Boreholes
A total of 43 cable percussive holes of nominal 150mm diameter were advanced through the subsurface
strata using cable percussive techniques to depths from 7.5m to 25m below ground level (bgl). Prior to
commencement a hand dug inspection pit was dug to 1.2m bgl. In 10 of the locations the inspection pit
was completed using a vacuum excavation tool to 1.5m bgl. The material recovered was logged and
sampled by a WYG Engineer at the time of drilling. The descriptions can be found within the borehole logs
in volume 2 of the Factual Report [4].
3.6.2 Rotary Boreholes
A total of 2 rotary core holes were drilled close to the northern side of the entrance to the lock using rotary
wire line techniques. The boreholes were drilled using a Commachio GEO205 and recirculated water flush.
3.6.3 Window Sample Boreholes
A total of 16 window sample boreholes were completed on the site, all along the Right Embankment within
PO4. The boreholes ranged in depth from 0.7m to 10.45m bgl. SPTs and sampling was carried out within
these holes as described in section 3.7. This technique was used instead of the planned CPTs due to the
proximity of services (see section 3.6.6).
3.6.4 Concrete Cores
Both vertical and horizontal cores were undertaken in the wet dock lock, using a bolt on hydraulic rotary
drill rig, producing cores of a nominal 70mm diameter. The 4 horizontal cores were undertaken from either
a crane basket or the dive boat at intervals specified by the on-site Mott MacDonald supervisor along the
southern wall of the lock. The depth drilled ranged from 0.8 to 2.0m. The 3 vertical cores within the lock
were drilled underwater with the same rig operated by personnel from Northern Divers. The original scope
[6] envisaged these cores being taken from a work boat. However, it was not possible to securely position
the work boat within the lock so for health and safety reasons the methodology was changed.
Boston Barrier Ground Investigation Report
335092/WCD/WAM/01/A 07 February 2015 pims/339200 Boston Barrier TWAO/Products/Design Products/GI/GIR
16
3.6.5 Trial Pits and Trenches
There were 29 trial pits were excavated to depth between 1.1m and 5.0m bgl within PO1, PO2 and PO5.
Of the 29 total, 15 were required to determine structural elements such as tie in anchors and 14 were
required to assess ground conditions. Of the 15 required to identify buried structures 6 were scheduled to
be suitable for man-entry. This required a larger excavation and for shoring to be placed within the
excavation. A WYG Engineer who has completed confined spaces training entered the pit to describe and
sketch any structural elements encountered. The sketches can be found within volume 3, Appendix I of the
Factual Report [4].
3.6.6 CPT Investigation
A total of 2 CPTs were undertaken along the Right Embankment (PO4) to a depth of 10m bgl. The tests
were carried out using a 20T capacity hydraulic penetrometer which was mounted onto a tracked rig.
The original scope [6] specified 16 CPT along the Right Embankment although due to safety concerns
regarding the proximity of services 14 were removed from the programme and replaced with window
samples.
The tests were carried out in accordance with BS EN 22476-1:2012 [16], BS EN 1997-2:2007 [23] and BS
EN 14688-1:2002 [15] using a 7.5T capacity piezoelectric cone with pore water measurement (CPTU).
3.6.7 CBR Tests and TRL Probes
7 CBRs and 26 TRL probes tests were carried out to assess the conditions where roads and hard standing
are required in the outline design. This comprised PO2 and PO5 areas.
3.6.8 Sediment Sampling
Sediment sampling within the River Witham was required for contaminant testing as per MMO and CEFAS
recommendation eight samples were taken using a sonic rig mounted to the stern of the spud leg work
boat, ‘The Fosser’. 50mm samples were obtained to depths between 1.5 and 3.0m. These samples were
logged and sub sampled by a WYG Engineer on board The Fosser prior to being frozen and dispatched to
the CEFAS laboratory in Lowestoft.
3.6.9 Road Cores
2 road cores were taken using a hand held rotary core rig to obtain samples 190mm diameter. The road
was cored to the top of the sub base and the sub base material was excavated and logged using the
vacuum excavator.
Boston Barrier Ground Investigation Report
335092/WCD/WAM/01/A 07 February 2015 pims/339200 Boston Barrier TWAO/Products/Design Products/GI/GIR
17
3.7 In-situ Testing
3.7.1 Standard Penetration Test
During advancement of the cable percussive and window sample boreholes, SPTs were taken at intervals
of 1.0m down to 5.0m into the Glacial Till and then at intervals 2.0m due to frequent refusal of the SPT
within the Glacial Till. The tests were undertaken in accordance with BS EN 22476-3 [16]. A total of 414
SPTs were undertaken across the site.
3.7.2 Falling Head Permeability Test
A total of 30 falling head tests were carried out during the ground investigation. 29 were undertaken during
the advancement of the cable percussive boreholes and 1 was undertaken in a window sample borehole
on the Right Embankment. The water level was raised to the base of the casing leaving a test zone of
typically 1.0m. The water level was then recorded using a level logger and the permeability rates then
calculated by WYG Environment.
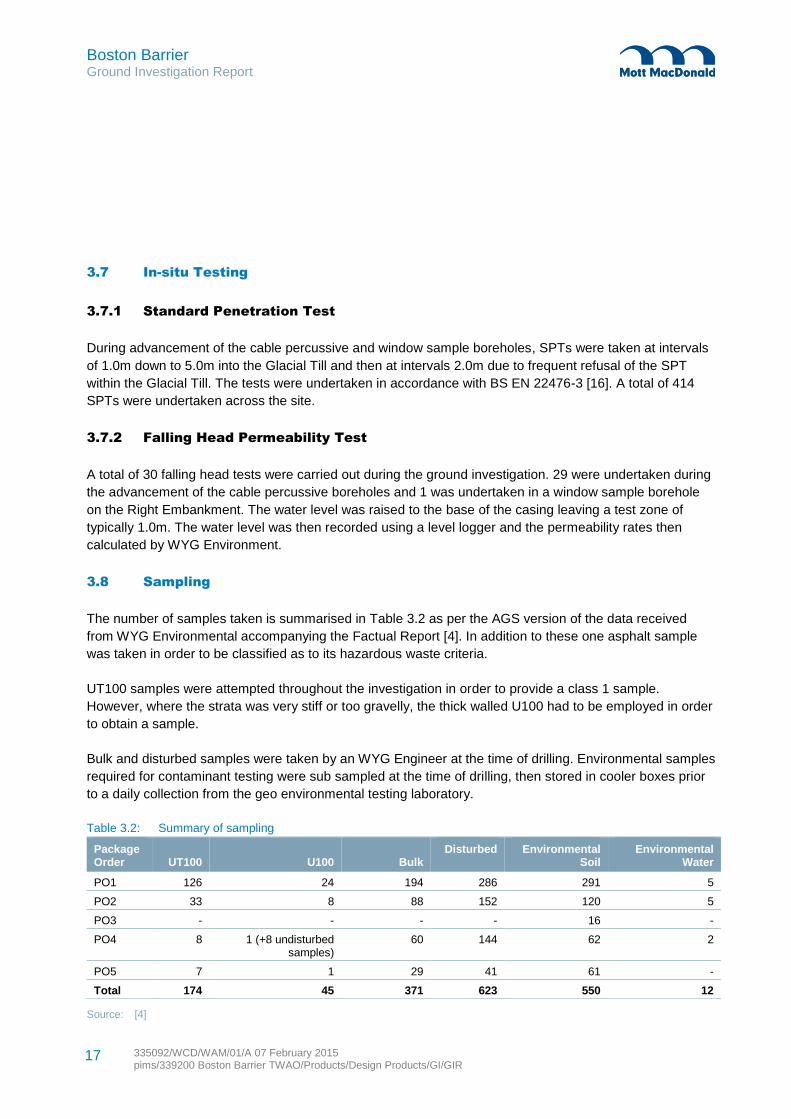
3.8 Sampling
The number of samples taken is summarised in Table 3.2 as per the AGS version of the data received
from WYG Environmental accompanying the Factual Report [4]. In addition to these one asphalt sample
was taken in order to be classified as to its hazardous waste criteria.
UT100 samples were attempted throughout the investigation in order to provide a class 1 sample.
However, where the strata was very stiff or too gravelly, the thick walled U100 had to be employed in order
to obtain a sample.
Bulk and disturbed samples were taken by an WYG Engineer at the time of drilling. Environmental samples
required for contaminant testing were sub sampled at the time of drilling, then stored in cooler boxes prior
to a daily collection from the geo environmental testing laboratory.
Table 3.2: Summary of sampling
Package Order UT100 U100 Bulk
Disturbed Environmental Soil
Environmental Water
PO1 126 24 194 286 291 5
PO2 33 8 88 152 120 5
PO3 - - - - 16 -
PO4 8 1 (+8 undisturbed samples)
60 144 62 2
PO5 7 1 29 41 61 -
Total 174 45 371 623 550 12
Source: [4]
Boston Barrier Ground Investigation Report
335092/WCD/WAM/01/A 07 February 2015 pims/339200 Boston Barrier TWAO/Products/Design Products/GI/GIR
18
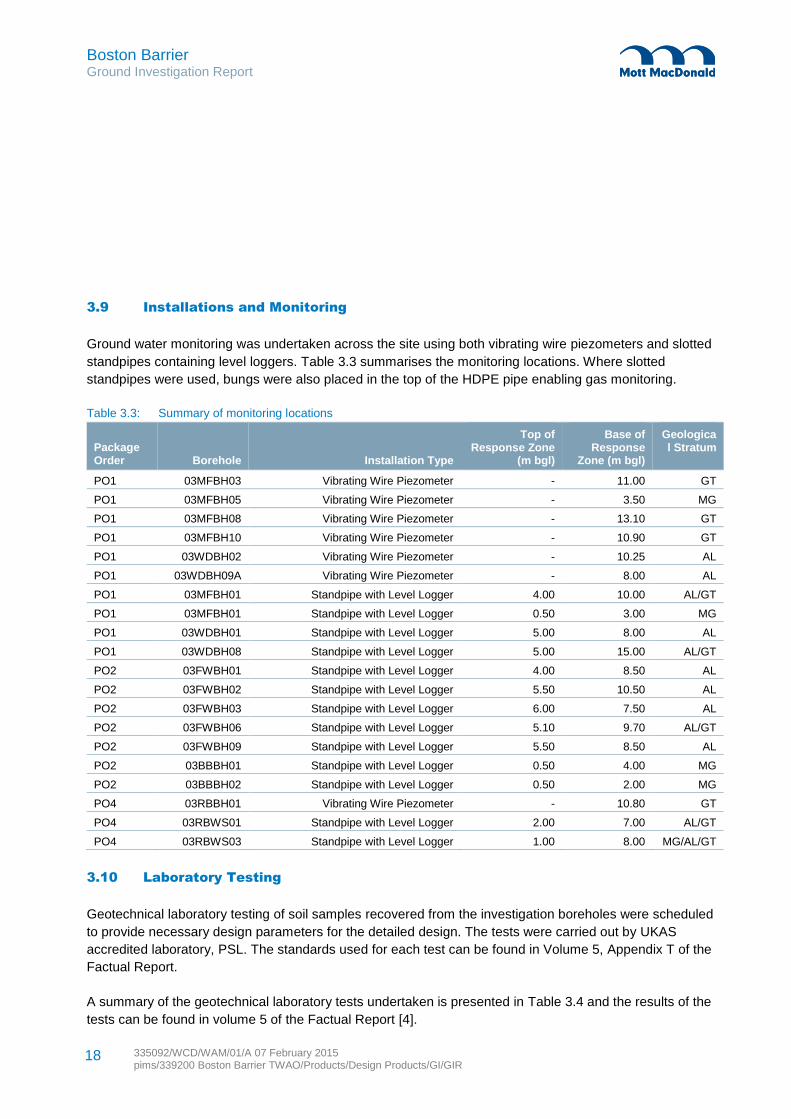
3.9 Installations and Monitoring
Ground water monitoring was undertaken across the site using both vibrating wire piezometers and slotted
standpipes containing level loggers. Table 3.3 summarises the monitoring locations. Where slotted
standpipes were used, bungs were also placed in the top of the HDPE pipe enabling gas monitoring.
Table 3.3: Summary of monitoring locations
Package Order Borehole Installation Type
Top of Response Zone
(m bgl)
Base of Response
Zone (m bgl)
Geological Stratum
PO1 03MFBH03 Vibrating Wire Piezometer - 11.00 GT
PO1 03MFBH05 Vibrating Wire Piezometer - 3.50 MG
PO1 03MFBH08 Vibrating Wire Piezometer - 13.10 GT
PO1 03MFBH10 Vibrating Wire Piezometer - 10.90 GT
PO1 03WDBH02 Vibrating Wire Piezometer - 10.25 AL
PO1 03WDBH09A Vibrating Wire Piezometer - 8.00 AL
PO1 03MFBH01 Standpipe with Level Logger 4.00 10.00 AL/GT
PO1 03MFBH01 Standpipe with Level Logger 0.50 3.00 MG
PO1 03WDBH01 Standpipe with Level Logger 5.00 8.00 AL
PO1 03WDBH08 Standpipe with Level Logger 5.00 15.00 AL/GT
PO2 03FWBH01 Standpipe with Level Logger 4.00 8.50 AL
PO2 03FWBH02 Standpipe with Level Logger 5.50 10.50 AL
PO2 03FWBH03 Standpipe with Level Logger 6.00 7.50 AL
PO2 03FWBH06 Standpipe with Level Logger 5.10 9.70 AL/GT
PO2 03FWBH09 Standpipe with Level Logger 5.50 8.50 AL
PO2 03BBBH01 Standpipe with Level Logger 0.50 4.00 MG
PO2 03BBBH02 Standpipe with Level Logger 0.50 2.00 MG
PO4 03RBBH01 Vibrating Wire Piezometer - 10.80 GT
PO4 03RBWS01 Standpipe with Level Logger 2.00 7.00 AL/GT
PO4 03RBWS03 Standpipe with Level Logger 1.00 8.00 MG/AL/GT
3.10 Laboratory Testing
Geotechnical laboratory testing of soil samples recovered from the investigation boreholes were scheduled
to provide necessary design parameters for the detailed design. The tests were carried out by UKAS
accredited laboratory, PSL. The standards used for each test can be found in Volume 5, Appendix T of the
Factual Report.
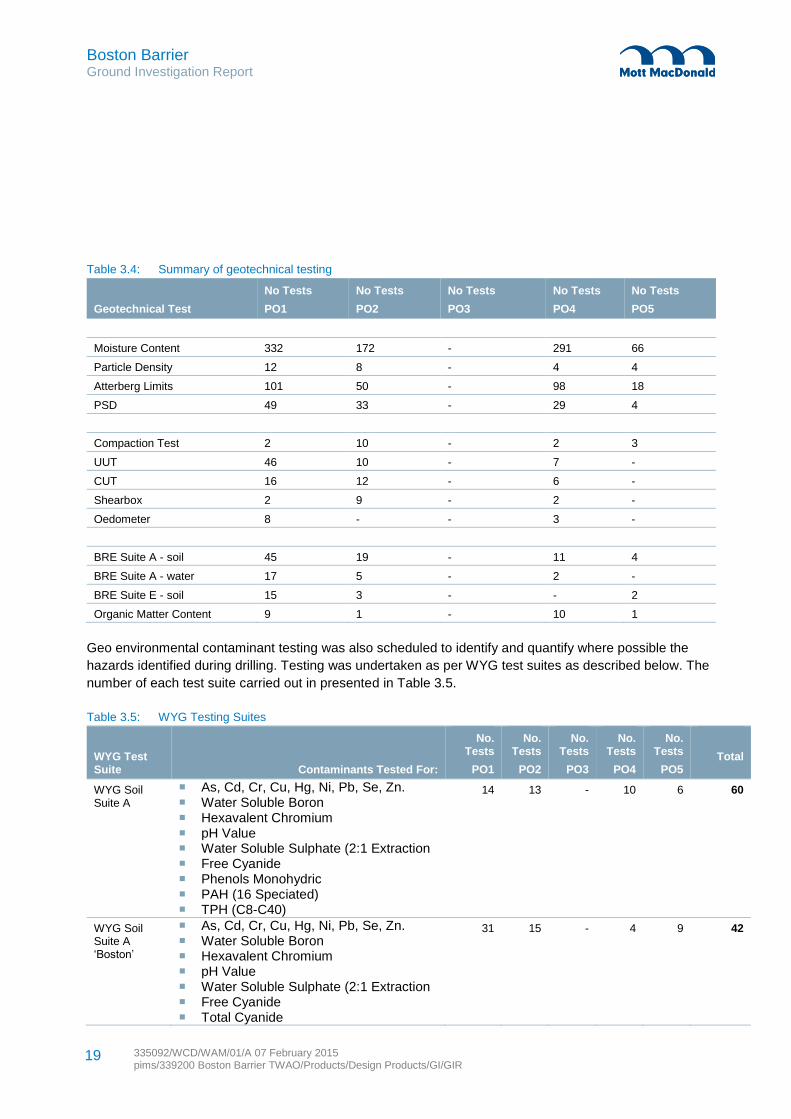
A summary of the geotechnical laboratory tests undertaken is presented in Table 3.4 and the results of the
tests can be found in volume 5 of the Factual Report [4].
Boston Barrier Ground Investigation Report
335092/WCD/WAM/01/A 07 February 2015 pims/339200 Boston Barrier TWAO/Products/Design Products/GI/GIR
19
Table 3.4: Summary of geotechnical testing
Geotechnical Test
No Tests
PO1
No Tests
PO2
No Tests
PO3
No Tests
PO4
No Tests
PO5
Moisture Content 332 172 - 291 66
Particle Density 12 8 - 4 4
Atterberg Limits 101 50 - 98 18
PSD 49 33 - 29 4
Compaction Test 2 10 - 2 3
UUT 46 10 - 7 -
CUT 16 12 - 6 -
Shearbox 2 9 - 2 -
Oedometer 8 - - 3 -
BRE Suite A - soil 45 19 - 11 4
BRE Suite A - water 17 5 - 2 -
BRE Suite E - soil 15 3 - - 2
Organic Matter Content 9 1 - 10 1
Geo environmental contaminant testing was also scheduled to identify and quantify where possible the
hazards identified during drilling. Testing was undertaken as per WYG test suites as described below. The
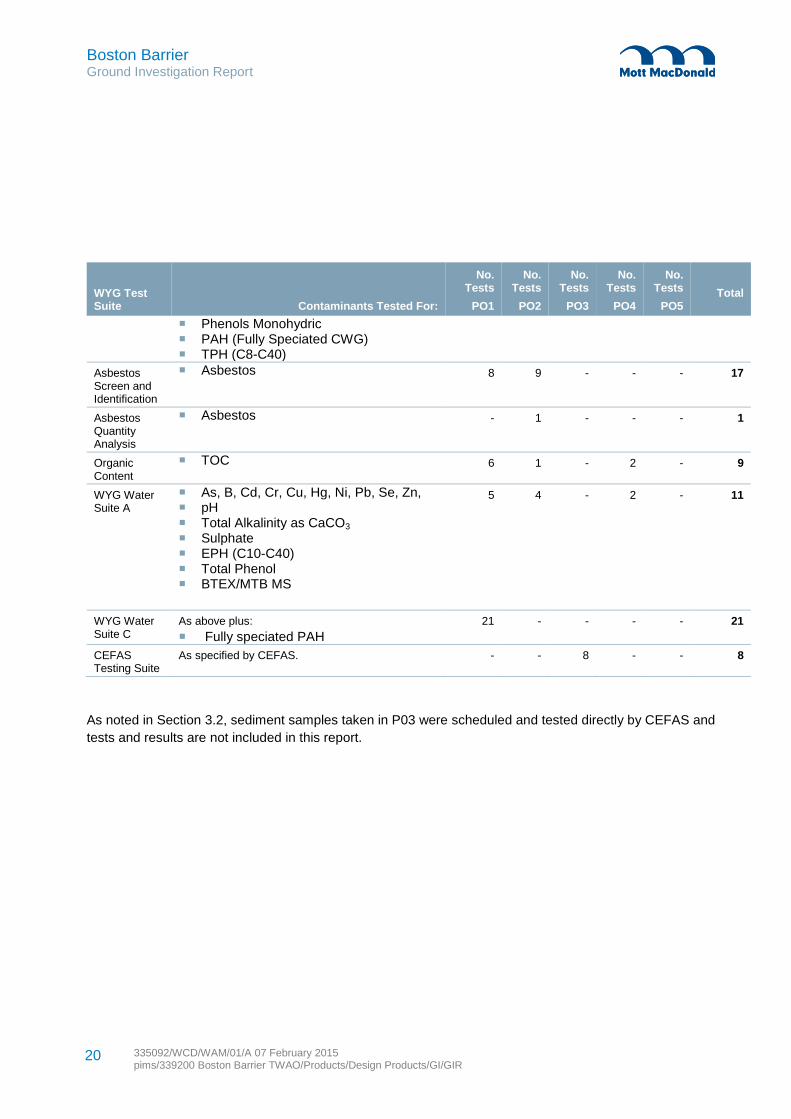
number of each test suite carried out in presented in Table 3.5.
Table 3.5: WYG Testing Suites
WYG Test Suite Contaminants Tested For:
No. Tests
PO1
No. Tests
PO2
No. Tests
PO3
No. Tests
PO4
No. Tests
PO5
Total
WYG Soil Suite A
As, Cd, Cr, Cu, Hg, Ni, Pb, Se, Zn. Water Soluble Boron Hexavalent Chromium pH Value Water Soluble Sulphate (2:1 Extraction Free Cyanide Phenols Monohydric PAH (16 Speciated) TPH (C8-C40)
14 13 - 10 6 60
WYG Soil Suite A ‘Boston’
As, Cd, Cr, Cu, Hg, Ni, Pb, Se, Zn. Water Soluble Boron Hexavalent Chromium pH Value Water Soluble Sulphate (2:1 Extraction Free Cyanide Total Cyanide
31 15 - 4 9 42
Boston Barrier Ground Investigation Report
335092/WCD/WAM/01/A 07 February 2015 pims/339200 Boston Barrier TWAO/Products/Design Products/GI/GIR
20
WYG Test Suite Contaminants Tested For:
No. Tests
PO1
No. Tests
PO2
No. Tests
PO3
No. Tests
PO4
No. Tests
PO5
Total
Phenols Monohydric PAH (Fully Speciated CWG) TPH (C8-C40)
Asbestos Screen and Identification
Asbestos 8 9 - - - 17
Asbestos Quantity Analysis
Asbestos - 1 - - - 1
Organic Content
TOC 6 1 - 2 - 9
WYG Water Suite A
As, B, Cd, Cr, Cu, Hg, Ni, Pb, Se, Zn, pH Total Alkalinity as CaCO3 Sulphate EPH (C10-C40) Total Phenol BTEX/MTB MS
5 4 - 2 - 11
WYG Water Suite C
As above plus:
Fully speciated PAH
21 - - - - 21
CEFAS Testing Suite
As specified by CEFAS. - - 8 - - 8
As noted in Section 3.2, sediment samples taken in P03 were scheduled and tested directly by CEFAS and
tests and results are not included in this report.
Boston Barrier Ground Investigation Report
335092/WCD/WAM/01/A 07 February 2015 pims/339200 Boston Barrier TWAO/Products/Design Products/GI/GIR
21
4.1 Services
4.1.1 Service Strikes
Despite precautions as specified in section 3.5, some uncharted services were damaged during fieldwork
operations. The strikes can be attributed to a number of causes as specified below:
Conflicting information on SUMO [17] [18] and Tower Surveys [19] utilities plans,
Historical service plans kept by PoB not incorporated into service plans,
Utility survey completed by Tower Surveys not being completed at the time of designing the GI.
After the strikes changes in procedure were implemented as specified below:
Mott MacDonald produced a service plan which combined the SUMO and Tower Surveys information,
The EA requested that borehole inspection pit (as well the trial pit inspection pits) were excavated
using the vacuum excavator instead of hand digging.
WYG completed incident forms for the service strikes; these are included in Appendix C.
The EA requested that WYG produce a report on the effectiveness and practicalities of using vacuum
excavation on borehole locations [24].
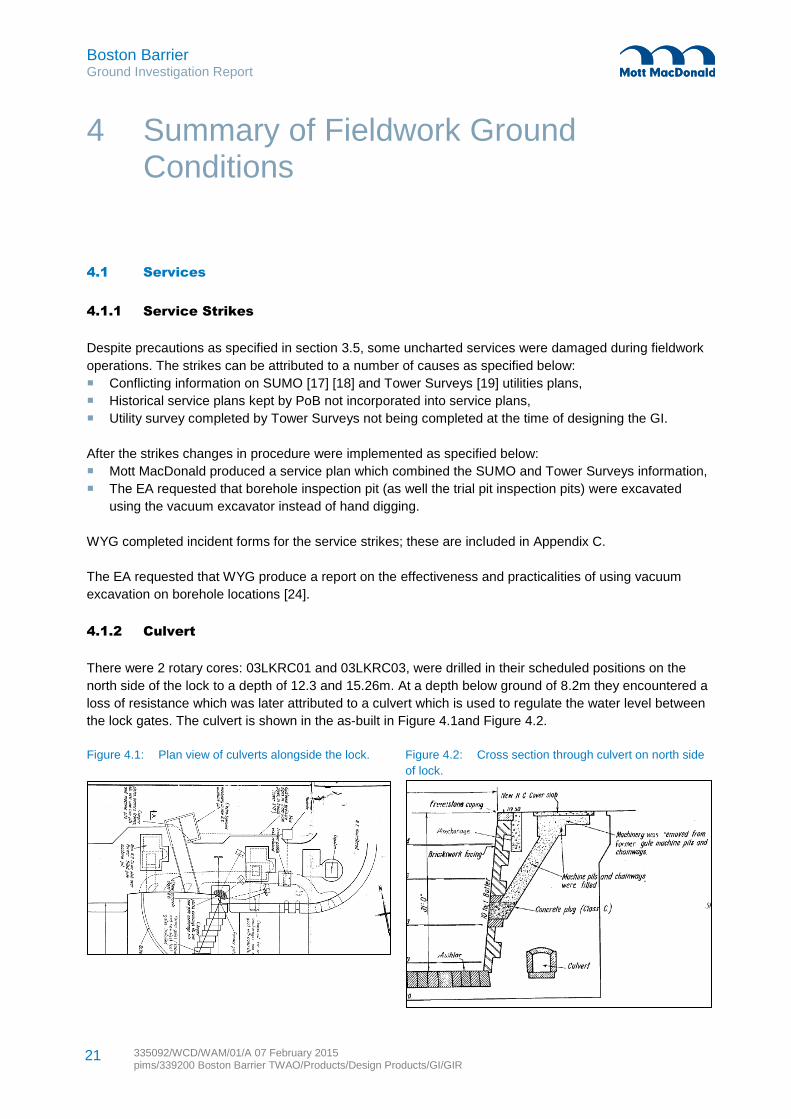
4.1.2 Culvert
There were 2 rotary cores: 03LKRC01 and 03LKRC03, were drilled in their scheduled positions on the
north side of the lock to a depth of 12.3 and 15.26m. At a depth below ground of 8.2m they encountered a
loss of resistance which was later attributed to a culvert which is used to regulate the water level between
the lock gates. The culvert is shown in the as-built in Figure 4.1and Figure 4.2.
Figure 4.1: Plan view of culverts alongside the lock. Figure 4.2: Cross section through culvert on north side
of lock.
4 Summary of Fieldwork Ground Conditions
Boston Barrier Ground Investigation Report
335092/WCD/WAM/01/A 07 February 2015 pims/339200 Boston Barrier TWAO/Products/Design Products/GI/GIR
22
The culvert damage has been repaired and reinstated as per the details in section 3.4 of the WYG Factual
Report [4].
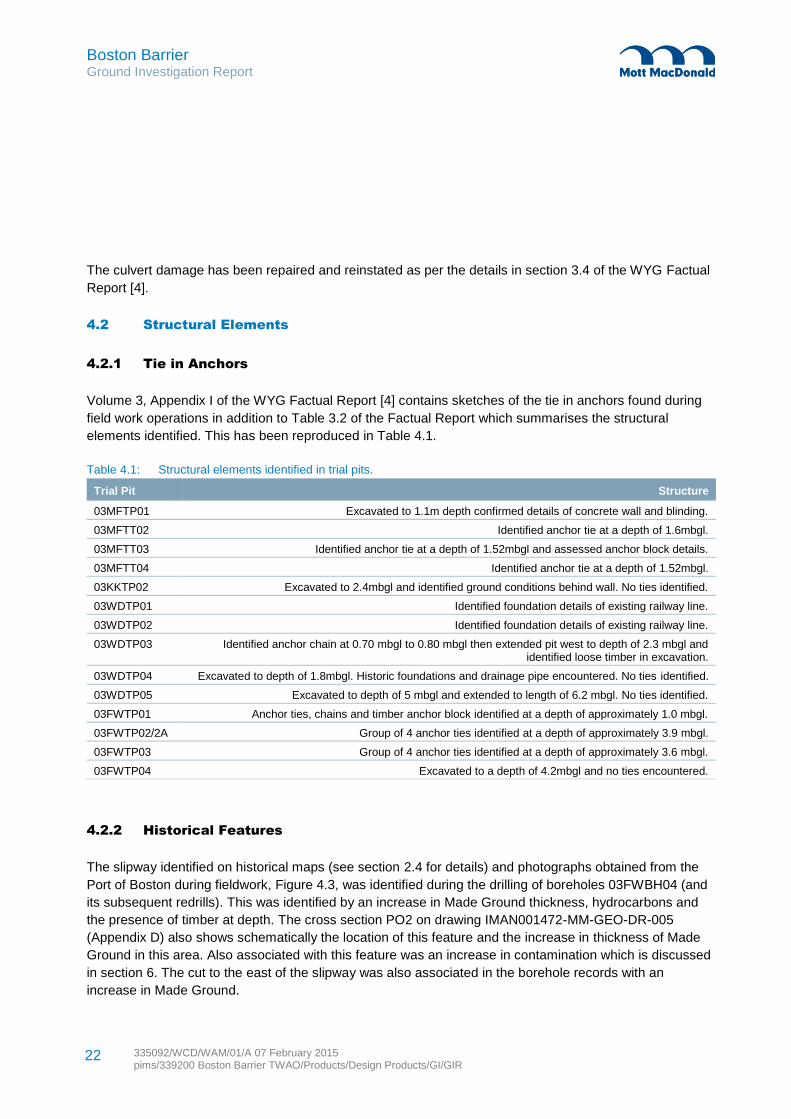
4.2 Structural Elements
4.2.1 Tie in Anchors
Volume 3, Appendix I of the WYG Factual Report [4] contains sketches of the tie in anchors found during
field work operations in addition to Table 3.2 of the Factual Report which summarises the structural
elements identified. This has been reproduced in Table 4.1.
Table 4.1: Structural elements identified in trial pits.
Trial Pit Structure
03MFTP01 Excavated to 1.1m depth confirmed details of concrete wall and blinding.
03MFTT02 Identified anchor tie at a depth of 1.6mbgl.
03MFTT03 Identified anchor tie at a depth of 1.52mbgl and assessed anchor block details.
03MFTT04 Identified anchor tie at a depth of 1.52mbgl.
03KKTP02 Excavated to 2.4mbgl and identified ground conditions behind wall. No ties identified.
03WDTP01 Identified foundation details of existing railway line.
03WDTP02 Identified foundation details of existing railway line.
03WDTP03 Identified anchor chain at 0.70 mbgl to 0.80 mbgl then extended pit west to depth of 2.3 mbgl and identified loose timber in excavation.
03WDTP04 Excavated to depth of 1.8mbgl. Historic foundations and drainage pipe encountered. No ties identified.
03WDTP05 Excavated to depth of 5 mbgl and extended to length of 6.2 mbgl. No ties identified.
03FWTP01 Anchor ties, chains and timber anchor block identified at a depth of approximately 1.0 mbgl.
03FWTP02/2A Group of 4 anchor ties identified at a depth of approximately 3.9 mbgl.
03FWTP03 Group of 4 anchor ties identified at a depth of approximately 3.6 mbgl.
03FWTP04 Excavated to a depth of 4.2mbgl and no ties encountered.
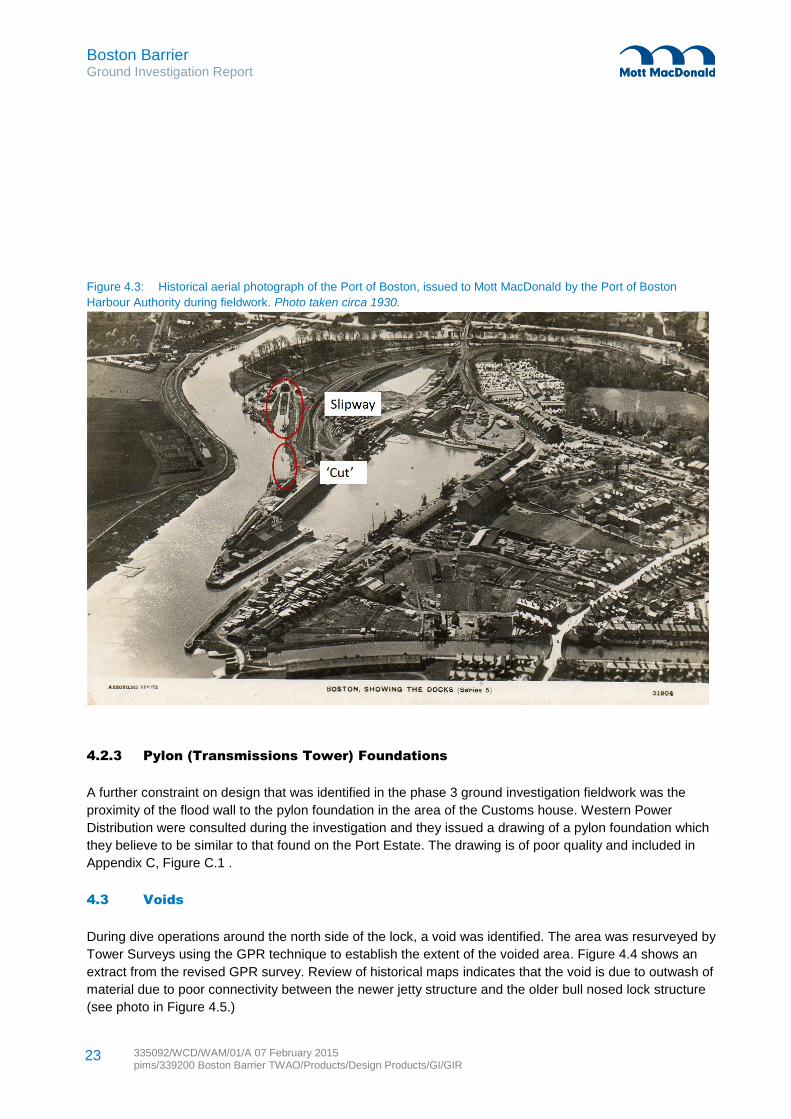
4.2.2 Historical Features
The slipway identified on historical maps (see section 2.4 for details) and photographs obtained from the
Port of Boston during fieldwork, Figure 4.3, was identified during the drilling of boreholes 03FWBH04 (and
its subsequent redrills). This was identified by an increase in Made Ground thickness, hydrocarbons and
the presence of timber at depth. The cross section PO2 on drawing IMAN001472-MM-GEO-DR-005
(Appendix D) also shows schematically the location of this feature and the increase in thickness of Made
Ground in this area. Also associated with this feature was an increase in contamination which is discussed
in section 6. The cut to the east of the slipway was also associated in the borehole records with an
increase in Made Ground.
Boston Barrier Ground Investigation Report
335092/WCD/WAM/01/A 07 February 2015 pims/339200 Boston Barrier TWAO/Products/Design Products/GI/GIR
23
Figure 4.3: Historical aerial photograph of the Port of Boston, issued to Mott MacDonald by the Port of Boston
Harbour Authority during fieldwork. Photo taken circa 1930.
4.2.3 Pylon (Transmissions Tower) Foundations
A further constraint on design that was identified in the phase 3 ground investigation fieldwork was the
proximity of the flood wall to the pylon foundation in the area of the Customs house. Western Power
Distribution were consulted during the investigation and they issued a drawing of a pylon foundation which
they believe to be similar to that found on the Port Estate. The drawing is of poor quality and included in
Appendix C, Figure C.1 .
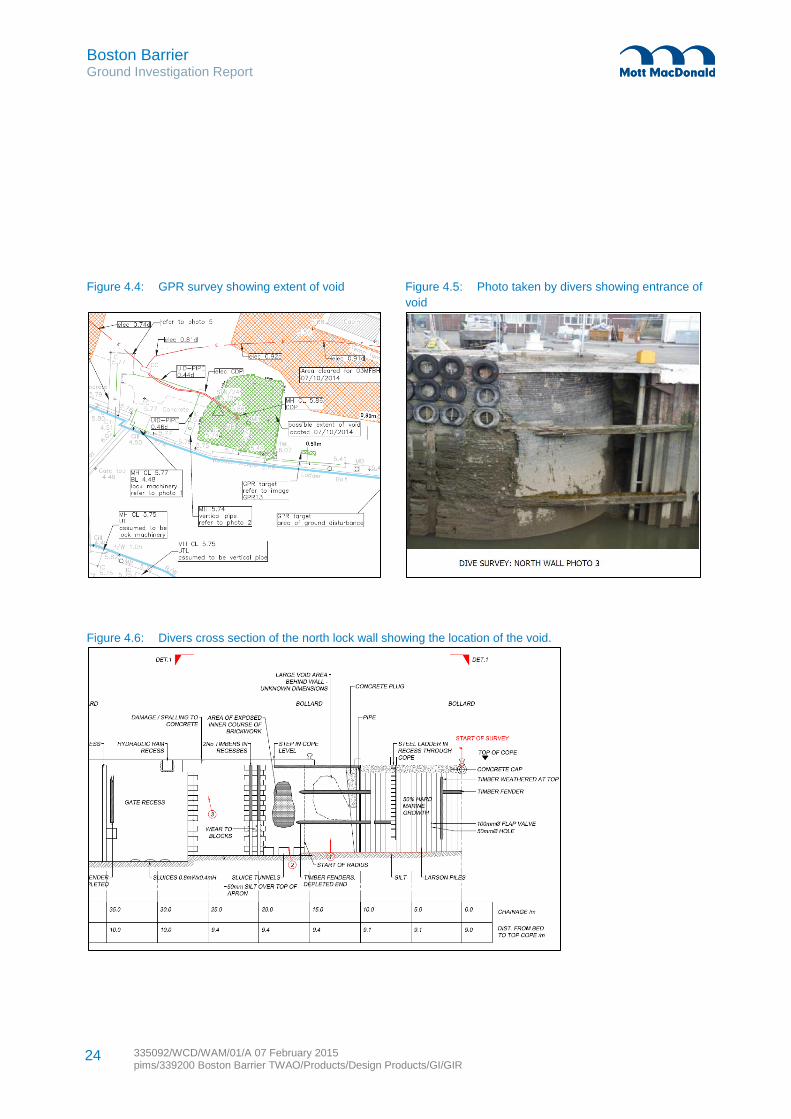
4.3 Voids
During dive operations around the north side of the lock, a void was identified. The area was resurveyed by
Tower Surveys using the GPR technique to establish the extent of the voided area. Figure 4.4 shows an
extract from the revised GPR survey. Review of historical maps indicates that the void is due to outwash of
material due to poor connectivity between the newer jetty structure and the older bull nosed lock structure
(see photo in Figure 4.5.)
Boston Barrier Ground Investigation Report
335092/WCD/WAM/01/A 07 February 2015 pims/339200 Boston Barrier TWAO/Products/Design Products/GI/GIR
24
Figure 4.4: GPR survey showing extent of void Figure 4.5: Photo taken by divers showing entrance of
void
Figure 4.6: Divers cross section of the north lock wall showing the location of the void.
Boston Barrier Ground Investigation Report
335092/WCD/WAM/01/A 07 February 2015 pims/339200 Boston Barrier TWAO/Products/Design Products/GI/GIR
25
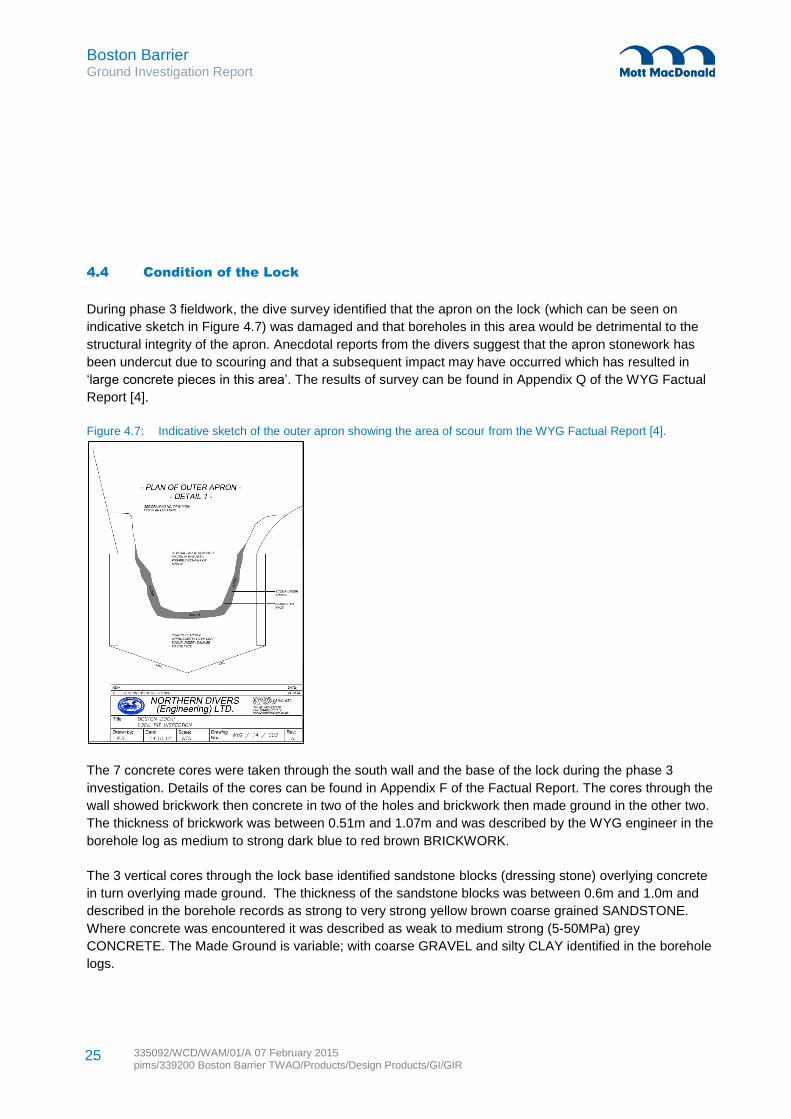
4.4 Condition of the Lock
During phase 3 fieldwork, the dive survey identified that the apron on the lock (which can be seen on
indicative sketch in Figure 4.7) was damaged and that boreholes in this area would be detrimental to the
structural integrity of the apron. Anecdotal reports from the divers suggest that the apron stonework has
been undercut due to scouring and that a subsequent impact may have occurred which has resulted in
‘large concrete pieces in this area’. The results of survey can be found in Appendix Q of the WYG Factual
Report [4].
Figure 4.7: Indicative sketch of the outer apron showing the area of scour from the WYG Factual Report [4].
The 7 concrete cores were taken through the south wall and the base of the lock during the phase 3
investigation. Details of the cores can be found in Appendix F of the Factual Report. The cores through the
wall showed brickwork then concrete in two of the holes and brickwork then made ground in the other two.
The thickness of brickwork was between 0.51m and 1.07m and was described by the WYG engineer in the
borehole log as medium to strong dark blue to red brown BRICKWORK.
The 3 vertical cores through the lock base identified sandstone blocks (dressing stone) overlying concrete
in turn overlying made ground. The thickness of the sandstone blocks was between 0.6m and 1.0m and
described in the borehole records as strong to very strong yellow brown coarse grained SANDSTONE.
Where concrete was encountered it was described as weak to medium strong (5-50MPa) grey
CONCRETE. The Made Ground is variable; with coarse GRAVEL and silty CLAY identified in the borehole
logs.
Boston Barrier Ground Investigation Report
335092/WCD/WAM/01/A 07 February 2015 pims/339200 Boston Barrier TWAO/Products/Design Products/GI/GIR
26
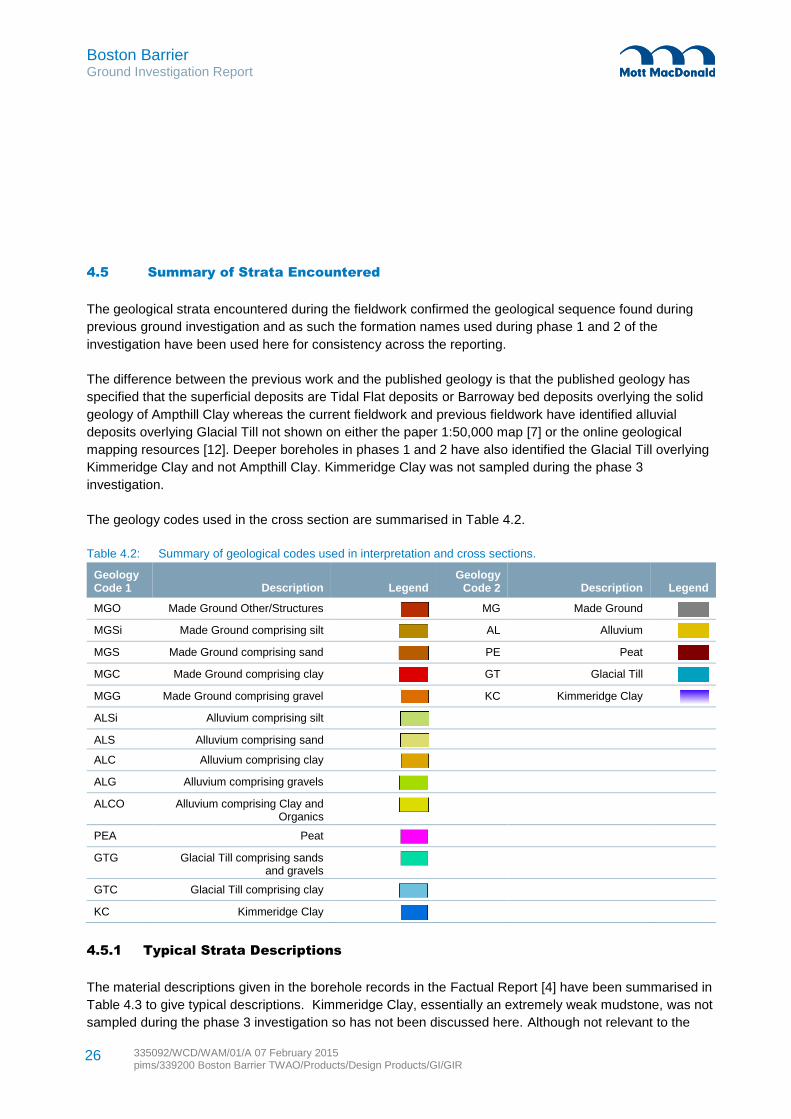
4.5 Summary of Strata Encountered
The geological strata encountered during the fieldwork confirmed the geological sequence found during
previous ground investigation and as such the formation names used during phase 1 and 2 of the
investigation have been used here for consistency across the reporting.
The difference between the previous work and the published geology is that the published geology has
specified that the superficial deposits are Tidal Flat deposits or Barroway bed deposits overlying the solid
geology of Ampthill Clay whereas the current fieldwork and previous fieldwork have identified alluvial
deposits overlying Glacial Till not shown on either the paper 1:50,000 map [7] or the online geological
mapping resources [12]. Deeper boreholes in phases 1 and 2 have also identified the Glacial Till overlying
Kimmeridge Clay and not Ampthill Clay. Kimmeridge Clay was not sampled during the phase 3
investigation.
The geology codes used in the cross section are summarised in Table 4.2.
Table 4.2: Summary of geological codes used in interpretation and cross sections.
Geology Code 1 Description Legend
Geology Code 2 Description Legend
MGO Made Ground Other/Structures
MG Made Ground
MGSi Made Ground comprising silt
AL Alluvium
MGS Made Ground comprising sand
PE Peat
MGC Made Ground comprising clay
GT Glacial Till
MGG Made Ground comprising gravel KC Kimmeridge Clay
ALSi Alluvium comprising silt
ALS Alluvium comprising sand
ALC Alluvium comprising clay
ALG Alluvium comprising gravels
ALCO Alluvium comprising Clay and Organics
PEA Peat
GTG Glacial Till comprising sands and gravels
GTC Glacial Till comprising clay
KC Kimmeridge Clay
4.5.1 Typical Strata Descriptions
The material descriptions given in the borehole records in the Factual Report [4] have been summarised in
Table 4.3 to give typical descriptions. Kimmeridge Clay, essentially an extremely weak mudstone, was not
sampled during the phase 3 investigation so has not been discussed here. Although not relevant to the
Boston Barrier Ground Investigation Report
335092/WCD/WAM/01/A 07 February 2015 pims/339200 Boston Barrier TWAO/Products/Design Products/GI/GIR
27
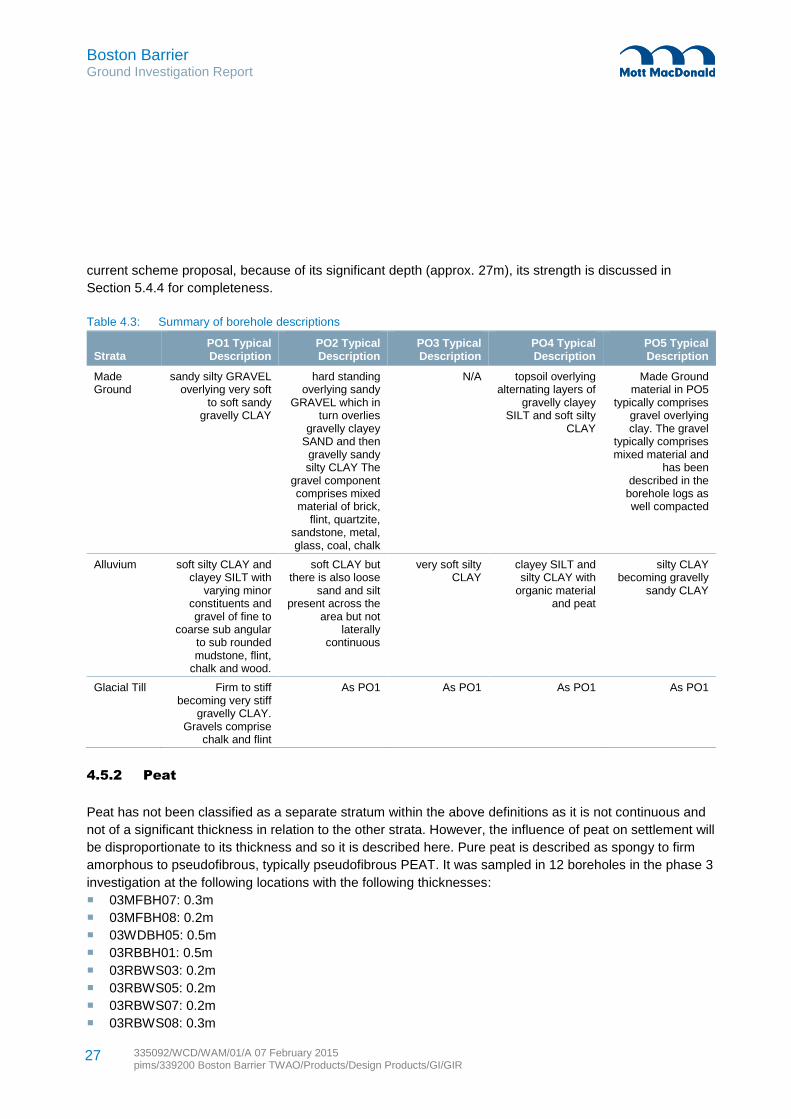
current scheme proposal, because of its significant depth (approx. 27m), its strength is discussed in
Section 5.4.4 for completeness.
Table 4.3: Summary of borehole descriptions
Strata PO1 Typical Description
PO2 Typical Description
PO3 Typical Description
PO4 Typical Description
PO5 Typical Description
Made Ground
sandy silty GRAVEL overlying very soft
to soft sandy gravelly CLAY
hard standing overlying sandy
GRAVEL which in turn overlies
gravelly clayey SAND and then gravelly sandy silty CLAY The
gravel component comprises mixed material of brick,
flint, quartzite, sandstone, metal, glass, coal, chalk
N/A topsoil overlying alternating layers of
gravelly clayey SILT and soft silty
CLAY
Made Ground material in PO5
typically comprises gravel overlying clay. The gravel
typically comprises mixed material and
has been described in the
borehole logs as well compacted
Alluvium soft silty CLAY and clayey SILT with
varying minor constituents and gravel of fine to
coarse sub angular to sub rounded mudstone, flint,
chalk and wood.
soft CLAY but there is also loose
sand and silt present across the
area but not laterally
continuous
very soft silty CLAY
clayey SILT and silty CLAY with
organic material and peat
silty CLAY becoming gravelly
sandy CLAY
Glacial Till Firm to stiff becoming very stiff
gravelly CLAY. Gravels comprise
chalk and flint
As PO1 As PO1 As PO1 As PO1
4.5.2 Peat
Peat has not been classified as a separate stratum within the above definitions as it is not continuous and
not of a significant thickness in relation to the other strata. However, the influence of peat on settlement will
be disproportionate to its thickness and so it is described here. Pure peat is described as spongy to firm
amorphous to pseudofibrous, typically pseudofibrous PEAT. It was sampled in 12 boreholes in the phase 3
investigation at the following locations with the following thicknesses:
03MFBH07: 0.3m
03MFBH08: 0.2m
03WDBH05: 0.5m
03RBBH01: 0.5m
03RBWS03: 0.2m
03RBWS05: 0.2m
03RBWS07: 0.2m
03RBWS08: 0.3m
Boston Barrier Ground Investigation Report
335092/WCD/WAM/01/A 07 February 2015 pims/339200 Boston Barrier TWAO/Products/Design Products/GI/GIR
28
03RBWS09: 0.4m
03RBWS14: 0.1m
03RBWS17: 0.1m.
As the list shows, it is typically found along the Right Embankment with a typical thickness of 0.2m.
However, the peat layer is not continuous here and forms pockets or lenses. Cross section PO4 (1-2) in
Appendix D shows this visually.
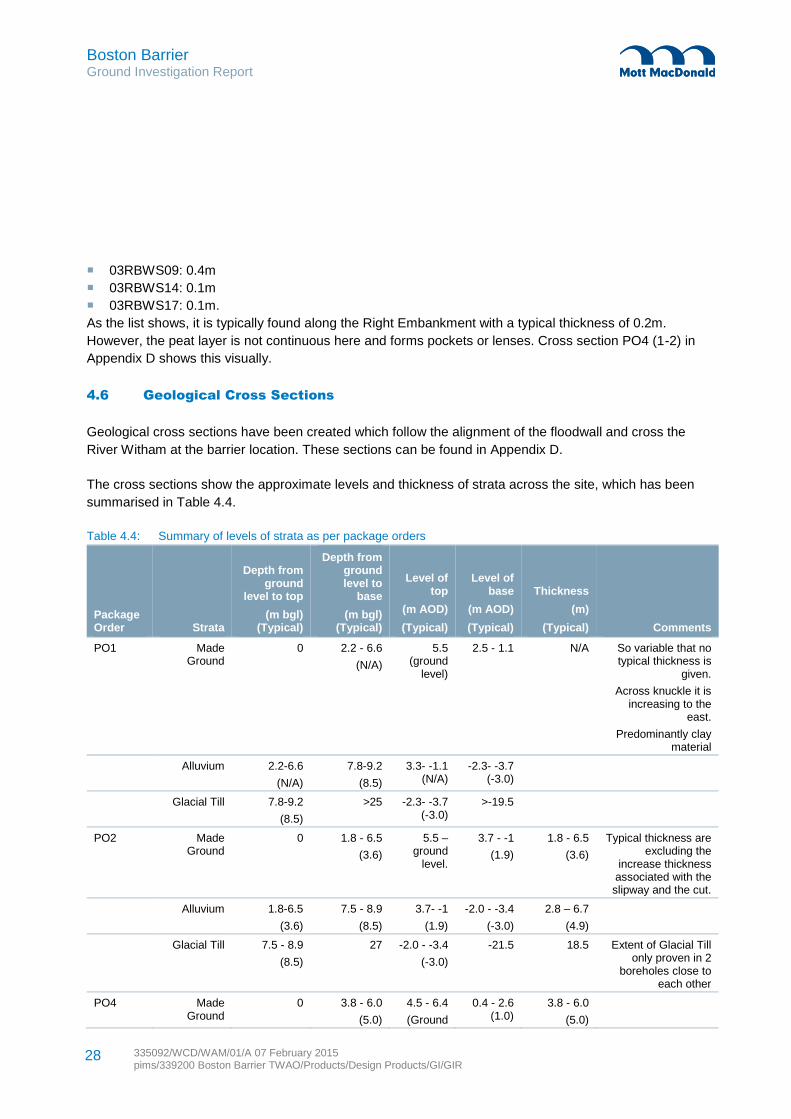
4.6 Geological Cross Sections
Geological cross sections have been created which follow the alignment of the floodwall and cross the
River Witham at the barrier location. These sections can be found in Appendix D.
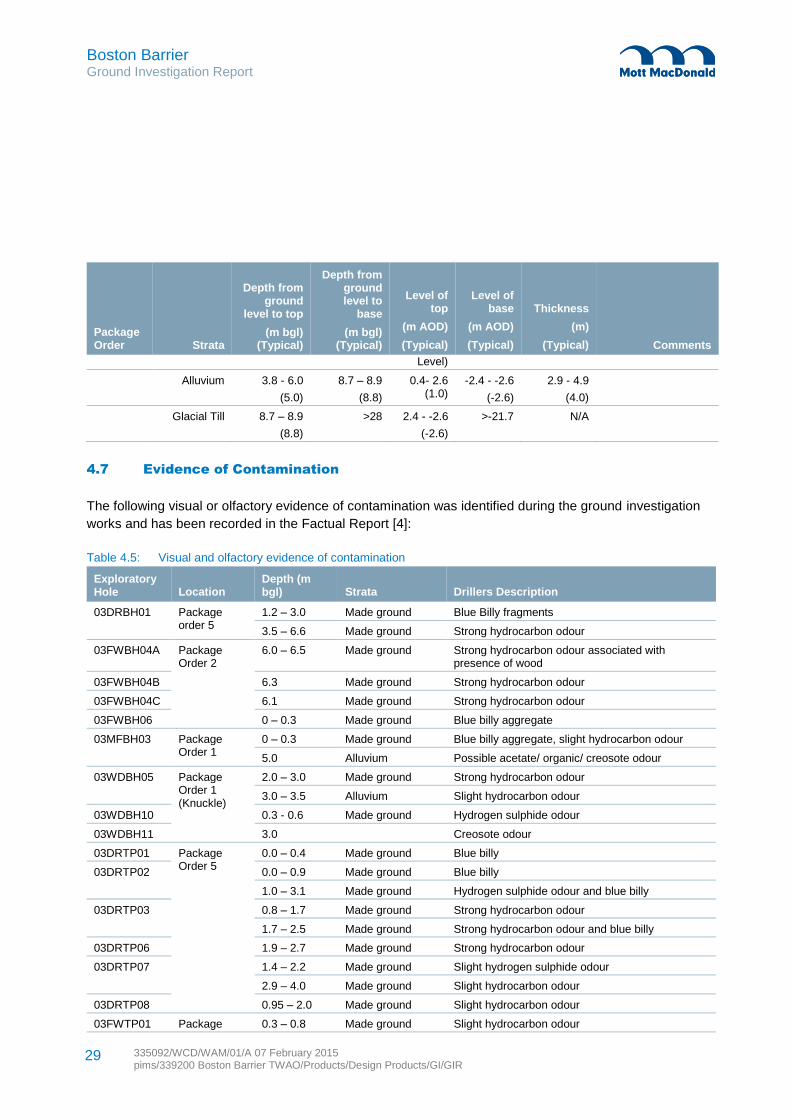
The cross sections show the approximate levels and thickness of strata across the site, which has been
summarised in Table 4.4.
Table 4.4: Summary of levels of strata as per package orders
Package Order Strata
Depth from ground
level to top
(m bgl) (Typical)
Depth from ground level to
base
(m bgl) (Typical)
Level of top
(m AOD)
(Typical)
Level of base
(m AOD)
(Typical)
Thickness
(m)
(Typical) Comments
PO1 Made Ground
0 2.2 - 6.6
(N/A)
5.5 (ground
level)
2.5 - 1.1 N/A So variable that no typical thickness is
given.
Across knuckle it is increasing to the
east.
Predominantly clay material
Alluvium 2.2-6.6
(N/A)
7.8-9.2
(8.5)
3.3- -1.1 (N/A)
-2.3- -3.7 (-3.0)
Glacial Till 7.8-9.2
(8.5)
>25 -2.3- -3.7 (-3.0)
>-19.5
PO2 Made Ground
0 1.8 - 6.5
(3.6)
5.5 – ground
level.
3.7 - -1
(1.9)
1.8 - 6.5
(3.6)
Typical thickness are excluding the
increase thickness associated with the slipway and the cut.
Alluvium 1.8-6.5
(3.6)
7.5 - 8.9
(8.5)
3.7- -1
(1.9)
-2.0 - -3.4
(-3.0)
2.8 – 6.7
(4.9)
Glacial Till 7.5 - 8.9
(8.5)
27 -2.0 - -3.4
(-3.0)
-21.5 18.5 Extent of Glacial Till only proven in 2
boreholes close to each other
PO4 Made Ground
0 3.8 - 6.0
(5.0)
4.5 - 6.4
(Ground
0.4 - 2.6 (1.0)
3.8 - 6.0
(5.0)
Boston Barrier Ground Investigation Report
335092/WCD/WAM/01/A 07 February 2015 pims/339200 Boston Barrier TWAO/Products/Design Products/GI/GIR
29
Package Order Strata
Depth from ground
level to top
(m bgl) (Typical)
Depth from ground level to
base
(m bgl) (Typical)
Level of top
(m AOD)
(Typical)
Level of base
(m AOD)
(Typical)
Thickness
(m)
(Typical) Comments
Level)
Alluvium 3.8 - 6.0
(5.0)
8.7 – 8.9
(8.8)
0.4- 2.6 (1.0)
-2.4 - -2.6
(-2.6)
2.9 - 4.9
(4.0)
Glacial Till 8.7 – 8.9
(8.8)
>28 2.4 - -2.6
(-2.6)
>-21.7 N/A
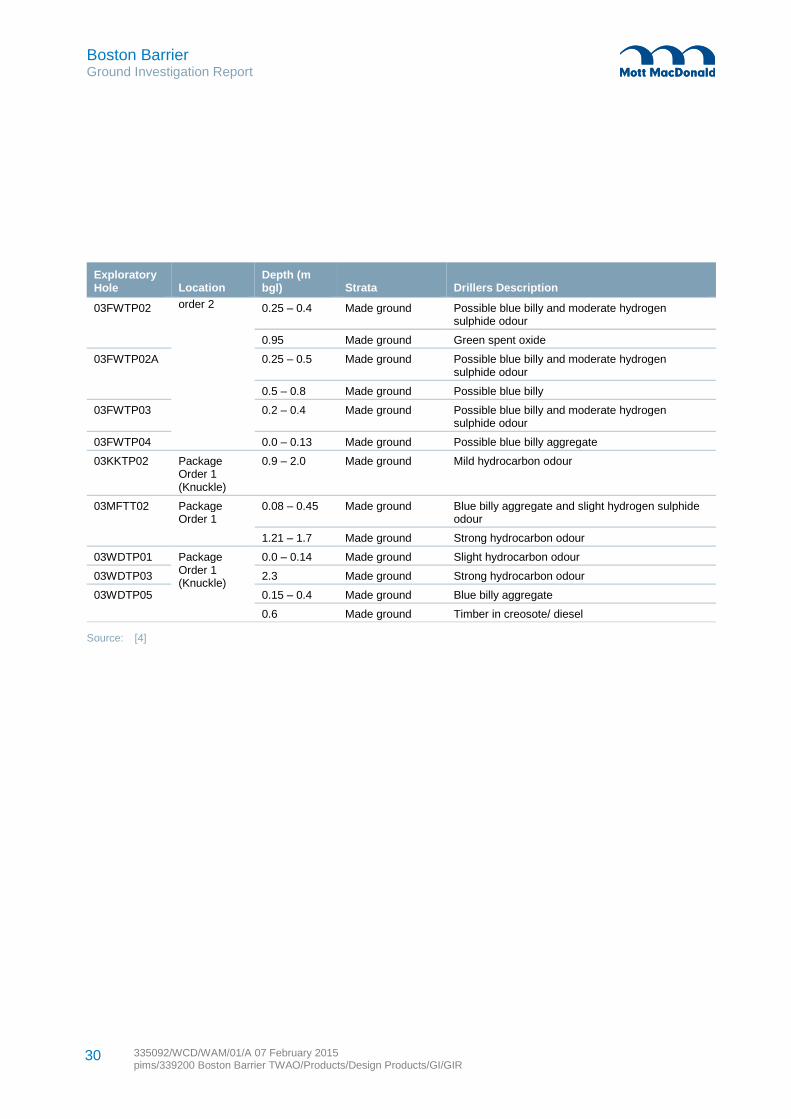
4.7 Evidence of Contamination
The following visual or olfactory evidence of contamination was identified during the ground investigation
works and has been recorded in the Factual Report [4]:
Table 4.5: Visual and olfactory evidence of contamination
Exploratory Hole Location
Depth (m bgl) Strata Drillers Description
03DRBH01 Package order 5
1.2 – 3.0 Made ground Blue Billy fragments
3.5 – 6.6 Made ground Strong hydrocarbon odour
03FWBH04A Package Order 2
6.0 – 6.5 Made ground Strong hydrocarbon odour associated with presence of wood
03FWBH04B 6.3 Made ground Strong hydrocarbon odour
03FWBH04C 6.1 Made ground Strong hydrocarbon odour
03FWBH06 0 – 0.3 Made ground Blue billy aggregate
03MFBH03 Package Order 1
0 – 0.3 Made ground Blue billy aggregate, slight hydrocarbon odour
5.0 Alluvium Possible acetate/ organic/ creosote odour
03WDBH05 Package Order 1 (Knuckle)
2.0 – 3.0 Made ground Strong hydrocarbon odour
3.0 – 3.5 Alluvium Slight hydrocarbon odour
03WDBH10 0.3 - 0.6 Made ground Hydrogen sulphide odour
03WDBH11 3.0 Creosote odour
03DRTP01 Package Order 5
0.0 – 0.4 Made ground Blue billy
03DRTP02 0.0 – 0.9 Made ground Blue billy
1.0 – 3.1 Made ground Hydrogen sulphide odour and blue billy
03DRTP03 0.8 – 1.7 Made ground Strong hydrocarbon odour
1.7 – 2.5 Made ground Strong hydrocarbon odour and blue billy
03DRTP06 1.9 – 2.7 Made ground Strong hydrocarbon odour
03DRTP07 1.4 – 2.2 Made ground Slight hydrogen sulphide odour
2.9 – 4.0 Made ground Slight hydrocarbon odour
03DRTP08 0.95 – 2.0 Made ground Slight hydrocarbon odour
03FWTP01 Package 0.3 – 0.8 Made ground Slight hydrocarbon odour
Boston Barrier Ground Investigation Report
335092/WCD/WAM/01/A 07 February 2015 pims/339200 Boston Barrier TWAO/Products/Design Products/GI/GIR
30
Exploratory Hole Location
Depth (m bgl) Strata Drillers Description
03FWTP02 order 2 0.25 – 0.4 Made ground Possible blue billy and moderate hydrogen sulphide odour
0.95 Made ground Green spent oxide
03FWTP02A 0.25 – 0.5 Made ground Possible blue billy and moderate hydrogen sulphide odour
0.5 – 0.8 Made ground Possible blue billy
03FWTP03 0.2 – 0.4 Made ground Possible blue billy and moderate hydrogen sulphide odour
03FWTP04 0.0 – 0.13 Made ground Possible blue billy aggregate
03KKTP02 Package Order 1 (Knuckle)
0.9 – 2.0 Made ground Mild hydrocarbon odour
03MFTT02 Package Order 1
0.08 – 0.45 Made ground Blue billy aggregate and slight hydrogen sulphide odour
1.21 – 1.7 Made ground Strong hydrocarbon odour
03WDTP01 Package Order 1 (Knuckle)
0.0 – 0.14 Made ground Slight hydrocarbon odour
03WDTP03 2.3 Made ground Strong hydrocarbon odour
03WDTP05 0.15 – 0.4 Made ground Blue billy aggregate
0.6 Made ground Timber in creosote/ diesel
Source: [4]
Boston Barrier Ground Investigation Report
335092/WCD/WAM/01/A 07 February 2015 pims/339200 Boston Barrier TWAO/Products/Design Products/GI/GIR
31
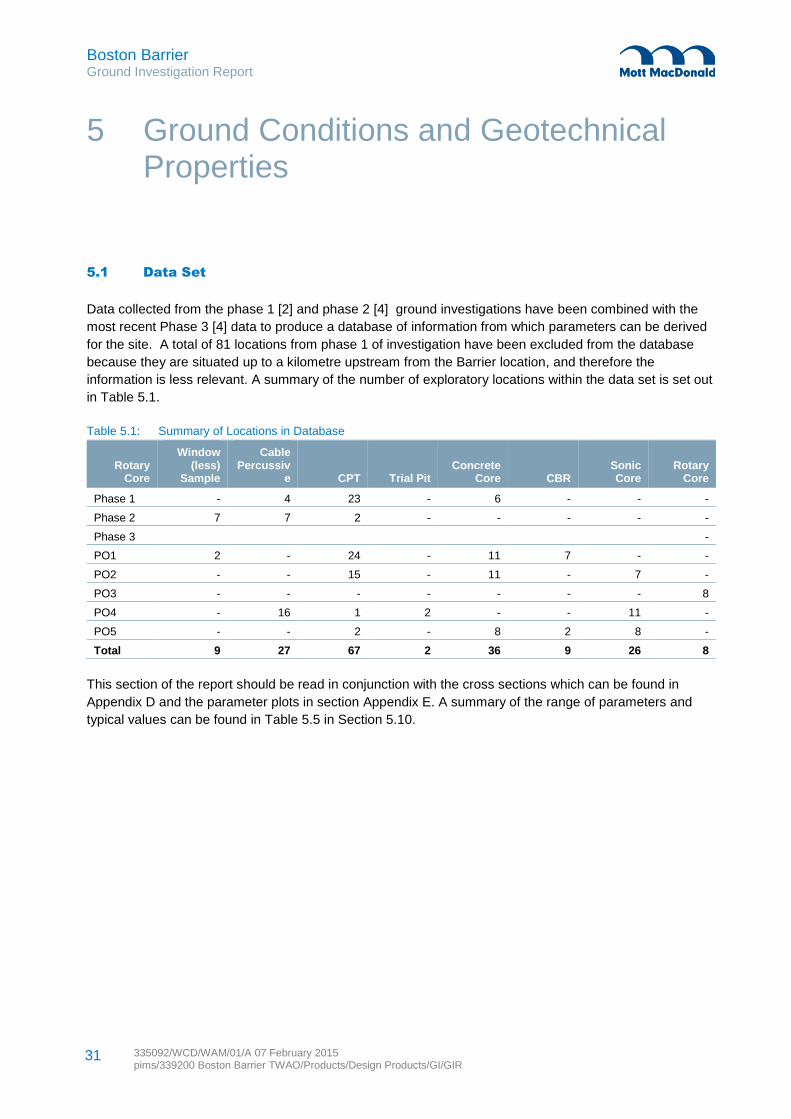
5.1 Data Set
Data collected from the phase 1 [2] and phase 2 [4] ground investigations have been combined with the
most recent Phase 3 [4] data to produce a database of information from which parameters can be derived
for the site. A total of 81 locations from phase 1 of investigation have been excluded from the database
because they are situated up to a kilometre upstream from the Barrier location, and therefore the
information is less relevant. A summary of the number of exploratory locations within the data set is set out
in Table 5.1.
Table 5.1: Summary of Locations in Database
Rotary Core
Window (less)
Sample
Cable Percussiv
e CPT Trial Pit Concrete
Core CBR Sonic Core
Rotary Core
Phase 1 - 4 23 - 6 - - -
Phase 2 7 7 2 - - - - -
Phase 3 -
PO1 2 - 24 - 11 7 - -
PO2 - - 15 - 11 - 7 -
PO3 - - - - - - - 8
PO4 - 16 1 2 - - 11 -
PO5 - - 2 - 8 2 8 -
Total 9 27 67 2 36 9 26 8
This section of the report should be read in conjunction with the cross sections which can be found in
Appendix D and the parameter plots in section Appendix E. A summary of the range of parameters and
typical values can be found in Table 5.5 in Section 5.10.
5 Ground Conditions and Geotechnical Properties
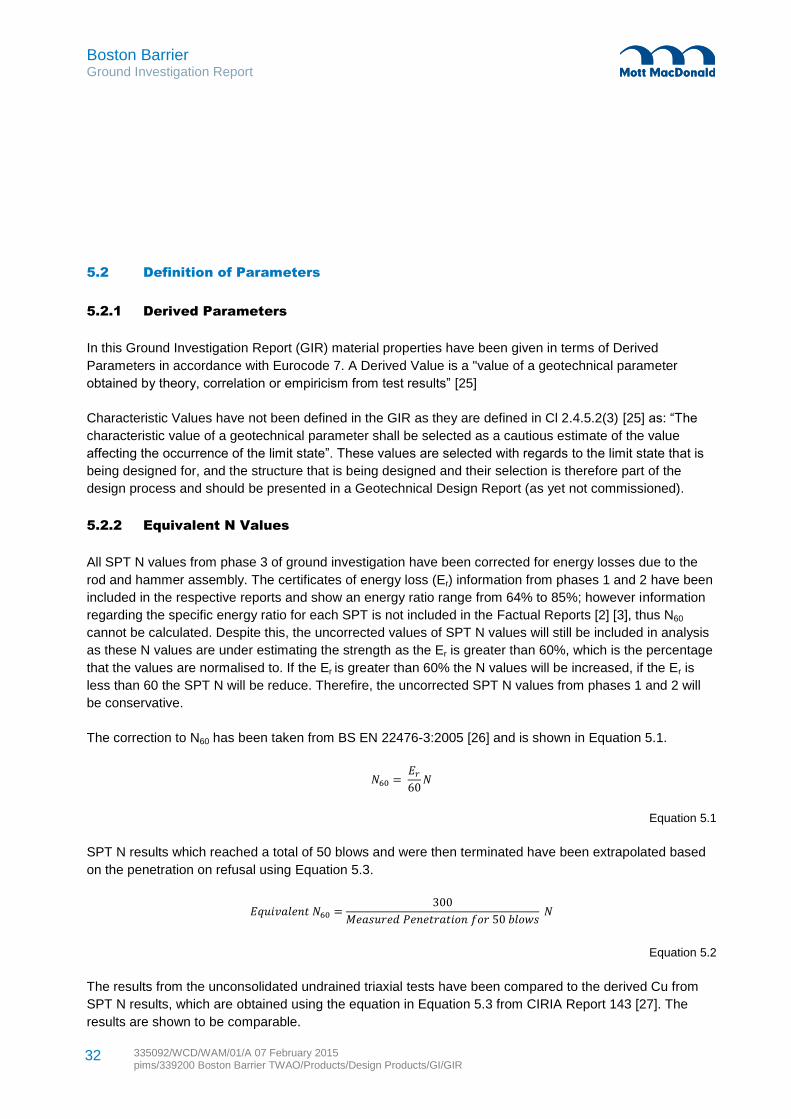
Boston Barrier Ground Investigation Report
335092/WCD/WAM/01/A 07 February 2015 pims/339200 Boston Barrier TWAO/Products/Design Products/GI/GIR
32
5.2 Definition of Parameters
5.2.1 Derived Parameters
In this Ground Investigation Report (GIR) material properties have been given in terms of Derived
Parameters in accordance with Eurocode 7. A Derived Value is a "value of a geotechnical parameter
obtained by theory, correlation or empiricism from test results” [25]
Characteristic Values have not been defined in the GIR as they are defined in Cl 2.4.5.2(3) [25] as: “The
characteristic value of a geotechnical parameter shall be selected as a cautious estimate of the value
affecting the occurrence of the limit state”. These values are selected with regards to the limit state that is
being designed for, and the structure that is being designed and their selection is therefore part of the
design process and should be presented in a Geotechnical Design Report (as yet not commissioned).
5.2.2 Equivalent N Values
All SPT N values from phase 3 of ground investigation have been corrected for energy losses due to the
rod and hammer assembly. The certificates of energy loss (Er) information from phases 1 and 2 have been
included in the respective reports and show an energy ratio range from 64% to 85%; however information
regarding the specific energy ratio for each SPT is not included in the Factual Reports [2] [3], thus N60
cannot be calculated. Despite this, the uncorrected values of SPT N values will still be included in analysis
as these N values are under estimating the strength as the Er is greater than 60%, which is the percentage
that the values are normalised to. If the Er is greater than 60% the N values will be increased, if the Er is
less than 60 the SPT N will be reduce. Therefire, the uncorrected SPT N values from phases 1 and 2 will
be conservative.
The correction to N60 has been taken from BS EN 22476-3:2005 [26] and is shown in Equation 5.1.
𝑁60 = 𝐸𝑟
60𝑁
Equation 5.1
SPT N results which reached a total of 50 blows and were then terminated have been extrapolated based
on the penetration on refusal using Equation 5.3.
𝐸𝑞𝑢𝑖𝑣𝑎𝑙𝑒𝑛𝑡 𝑁60 =300
𝑀𝑒𝑎𝑠𝑢𝑟𝑒𝑑 𝑃𝑒𝑛𝑒𝑡𝑟𝑎𝑡𝑖𝑜𝑛 𝑓𝑜𝑟 50 𝑏𝑙𝑜𝑤𝑠 𝑁
Equation 5.2
The results from the unconsolidated undrained triaxial tests have been compared to the derived Cu from
SPT N results, which are obtained using the equation in Equation 5.3 from CIRIA Report 143 [27]. The
results are shown to be comparable.
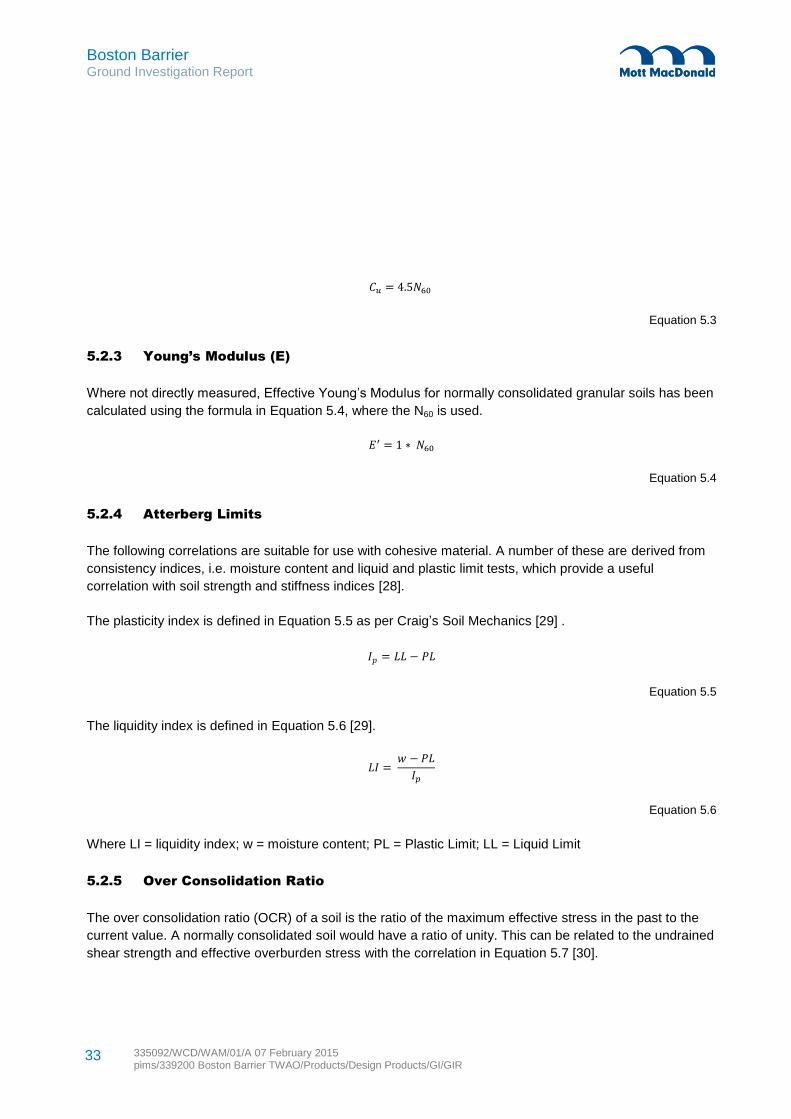
Boston Barrier Ground Investigation Report
335092/WCD/WAM/01/A 07 February 2015 pims/339200 Boston Barrier TWAO/Products/Design Products/GI/GIR
33
𝐶𝑢 = 4.5𝑁60
Equation 5.3
5.2.3 Young’s Modulus (E)
Where not directly measured, Effective Young’s Modulus for normally consolidated granular soils has been
calculated using the formula in Equation 5.4, where the N60 is used.
𝐸′ = 1 ∗ 𝑁60
Equation 5.4
5.2.4 Atterberg Limits
The following correlations are suitable for use with cohesive material. A number of these are derived from
consistency indices, i.e. moisture content and liquid and plastic limit tests, which provide a useful
correlation with soil strength and stiffness indices [28].
The plasticity index is defined in Equation 5.5 as per Craig’s Soil Mechanics [29] .
𝐼𝑝 = 𝐿𝐿 − 𝑃𝐿
Equation 5.5
The liquidity index is defined in Equation 5.6 [29].
𝐿𝐼 = 𝑤 − 𝑃𝐿
𝐼𝑝
Equation 5.6
Where LI = liquidity index; w = moisture content; PL = Plastic Limit; LL = Liquid Limit
5.2.5 Over Consolidation Ratio
The over consolidation ratio (OCR) of a soil is the ratio of the maximum effective stress in the past to the
current value. A normally consolidated soil would have a ratio of unity. This can be related to the undrained
shear strength and effective overburden stress with the correlation in Equation 5.7 [30].
Boston Barrier Ground Investigation Report
335092/WCD/WAM/01/A 07 February 2015 pims/339200 Boston Barrier TWAO/Products/Design Products/GI/GIR
34
𝑂𝐶𝑅 = (
𝐶𝑢
𝜎′𝑣)
0.25∗ 1.25
Equation 5.7
Typical values for OCR are given in Table 5.2 [31]
Table 5.2: Over consolidation Ratios
Soil Type OCR
Lightly consolidated 1
Normally consolidated 1.5-3
Heavily consolidated >4
5.2.6 Effective Angle of Friction
Effective angle of friction has been calculated based on Equation 5.8 in from Barnes, 2000 [31]. Effective
apparent cohesive has been assumed as C’=0 as a cautious estimate of the soil conditions. The effective
stress parameters of σ1’and σ3’measured in consolidated undrained triaxial tests have been used to
produce P’Q’ plots from which φ’ can be derived using Equation 5.8 where θ is the angle of the slope of the
P’Q’ plot.
∅′ = sin−1 tan 𝜃
Equation 5.8
And
𝑃′ =1
2(𝜎′
1 + 𝜎′3)
𝑄′ =1
2(𝜎′
1 − 𝜎′3)
Equations 5.9 + 5.10
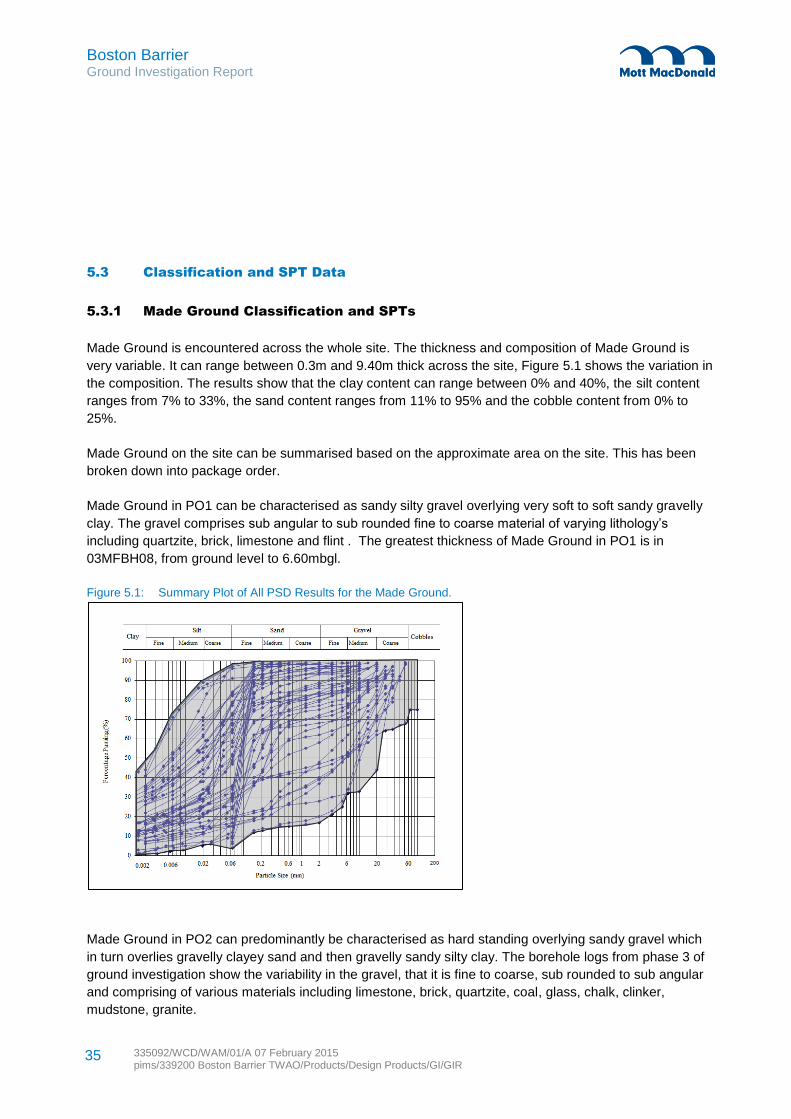
Boston Barrier Ground Investigation Report
335092/WCD/WAM/01/A 07 February 2015 pims/339200 Boston Barrier TWAO/Products/Design Products/GI/GIR
35
5.3 Classification and SPT Data
5.3.1 Made Ground Classification and SPTs
Made Ground is encountered across the whole site. The thickness and composition of Made Ground is
very variable. It can range between 0.3m and 9.40m thick across the site, Figure 5.1 shows the variation in
the composition. The results show that the clay content can range between 0% and 40%, the silt content
ranges from 7% to 33%, the sand content ranges from 11% to 95% and the cobble content from 0% to
25%.
Made Ground on the site can be summarised based on the approximate area on the site. This has been
broken down into package order.
Made Ground in PO1 can be characterised as sandy silty gravel overlying very soft to soft sandy gravelly
clay. The gravel comprises sub angular to sub rounded fine to coarse material of varying lithology’s
including quartzite, brick, limestone and flint . The greatest thickness of Made Ground in PO1 is in
03MFBH08, from ground level to 6.60mbgl.
Figure 5.1: Summary Plot of All PSD Results for the Made Ground.
Made Ground in PO2 can predominantly be characterised as hard standing overlying sandy gravel which
in turn overlies gravelly clayey sand and then gravelly sandy silty clay. The borehole logs from phase 3 of
ground investigation show the variability in the gravel, that it is fine to coarse, sub rounded to sub angular
and comprising of various materials including limestone, brick, quartzite, coal, glass, chalk, clinker,
mudstone, granite.
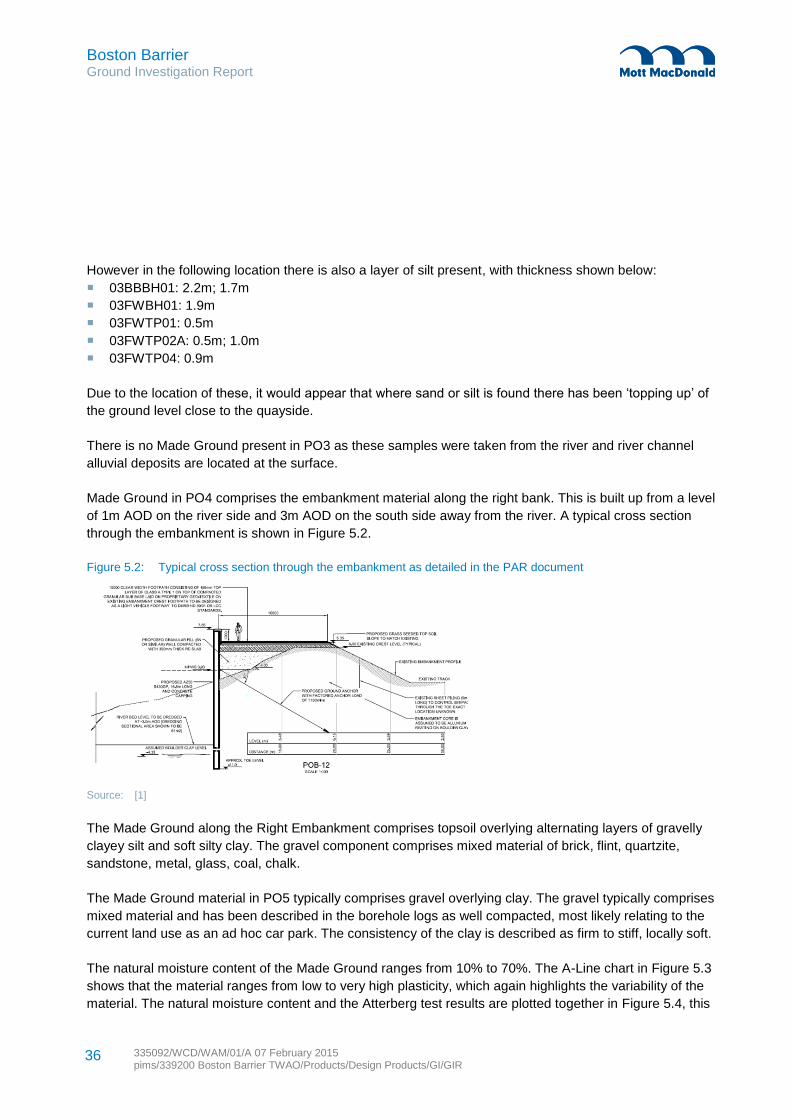
Boston Barrier Ground Investigation Report
335092/WCD/WAM/01/A 07 February 2015 pims/339200 Boston Barrier TWAO/Products/Design Products/GI/GIR
36
However in the following location there is also a layer of silt present, with thickness shown below:
03BBBH01: 2.2m; 1.7m
03FWBH01: 1.9m
03FWTP01: 0.5m
03FWTP02A: 0.5m; 1.0m
03FWTP04: 0.9m
Due to the location of these, it would appear that where sand or silt is found there has been ‘topping up’ of
the ground level close to the quayside.
There is no Made Ground present in PO3 as these samples were taken from the river and river channel
alluvial deposits are located at the surface.
Made Ground in PO4 comprises the embankment material along the right bank. This is built up from a level
of 1m AOD on the river side and 3m AOD on the south side away from the river. A typical cross section
through the embankment is shown in Figure 5.2.
Figure 5.2: Typical cross section through the embankment as detailed in the PAR document
Source: [1]
The Made Ground along the Right Embankment comprises topsoil overlying alternating layers of gravelly
clayey silt and soft silty clay. The gravel component comprises mixed material of brick, flint, quartzite,
sandstone, metal, glass, coal, chalk.
The Made Ground material in PO5 typically comprises gravel overlying clay. The gravel typically comprises
mixed material and has been described in the borehole logs as well compacted, most likely relating to the
current land use as an ad hoc car park. The consistency of the clay is described as firm to stiff, locally soft.
The natural moisture content of the Made Ground ranges from 10% to 70%. The A-Line chart in Figure 5.3
shows that the material ranges from low to very high plasticity, which again highlights the variability of the
material. The natural moisture content and the Atterberg test results are plotted together in Figure 5.4, this
Boston Barrier Ground Investigation Report
335092/WCD/WAM/01/A 07 February 2015 pims/339200 Boston Barrier TWAO/Products/Design Products/GI/GIR
37
shows that there is no correlation between plasticity and depth and that the range in liquid limit is from 27%
to 81% and the plastic limit is from 12% to 35%.
The SPT plots (Appendix E; Table E.1) within the Made Ground show no increase in equivalent SPT N
with depth. The N60 values are typically low, ranging from 1 to 30, with 90% of N60 values less than 10
regardless of the material type.

38 335092/WCD/WAM/01/A 07 February 2015 pims/339200 Boston Barrier TWAO/Products/Design Products/GI/GIR
Boston Barrier Ground Investigation Report
Figure 5.3: Plasticity chart for the cohesive Made Ground material Figure 5.4: Liquid and Plastic Limits plotted with natural moisture content for the
cohesive Made Ground.
Source: GI Data Source: GI Data
CL
ML
MI
MHCI
CH MV
CV
CE
ME
0
10
20
30
40
50
60
70
0 10 20 30 40 50 60 70 80 90 100 110 120
Pla
sti
cit
y I
nd
ex(%
)
Liquid Limit (%)
0
1
2
3
4
5
6
7
0 10 20 30 40 50 60 70 80 90
De
pth
(m
)
Moisture Content (%)
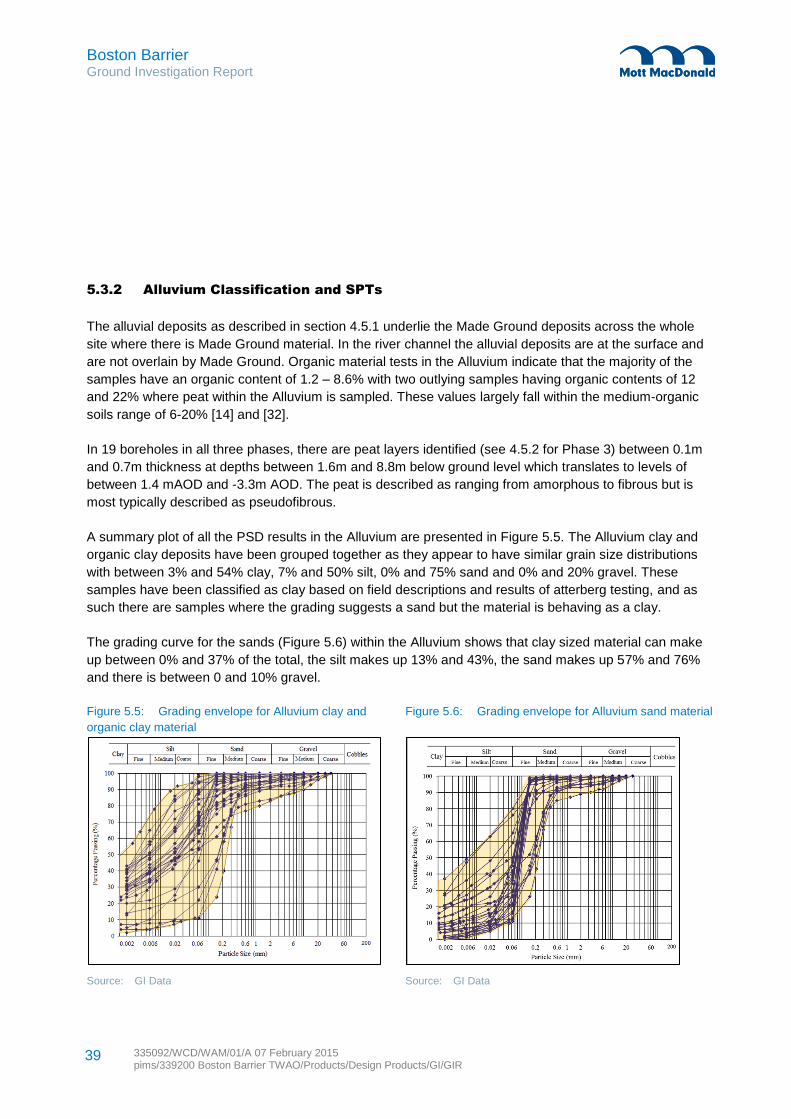
Boston Barrier Ground Investigation Report
335092/WCD/WAM/01/A 07 February 2015 pims/339200 Boston Barrier TWAO/Products/Design Products/GI/GIR
39
5.3.2 Alluvium Classification and SPTs
The alluvial deposits as described in section 4.5.1 underlie the Made Ground deposits across the whole
site where there is Made Ground material. In the river channel the alluvial deposits are at the surface and
are not overlain by Made Ground. Organic material tests in the Alluvium indicate that the majority of the
samples have an organic content of 1.2 – 8.6% with two outlying samples having organic contents of 12
and 22% where peat within the Alluvium is sampled. These values largely fall within the medium-organic
soils range of 6-20% [14] and [32].
In 19 boreholes in all three phases, there are peat layers identified (see 4.5.2 for Phase 3) between 0.1m
and 0.7m thickness at depths between 1.6m and 8.8m below ground level which translates to levels of
between 1.4 mAOD and -3.3m AOD. The peat is described as ranging from amorphous to fibrous but is
most typically described as pseudofibrous.
A summary plot of all the PSD results in the Alluvium are presented in Figure 5.5. The Alluvium clay and
organic clay deposits have been grouped together as they appear to have similar grain size distributions
with between 3% and 54% clay, 7% and 50% silt, 0% and 75% sand and 0% and 20% gravel. These
samples have been classified as clay based on field descriptions and results of atterberg testing, and as
such there are samples where the grading suggests a sand but the material is behaving as a clay.
The grading curve for the sands (Figure 5.6) within the Alluvium shows that clay sized material can make
up between 0% and 37% of the total, the silt makes up 13% and 43%, the sand makes up 57% and 76%
and there is between 0 and 10% gravel.
Figure 5.5: Grading envelope for Alluvium clay and
organic clay material
Figure 5.6: Grading envelope for Alluvium sand material
Source: GI Data Source: GI Data
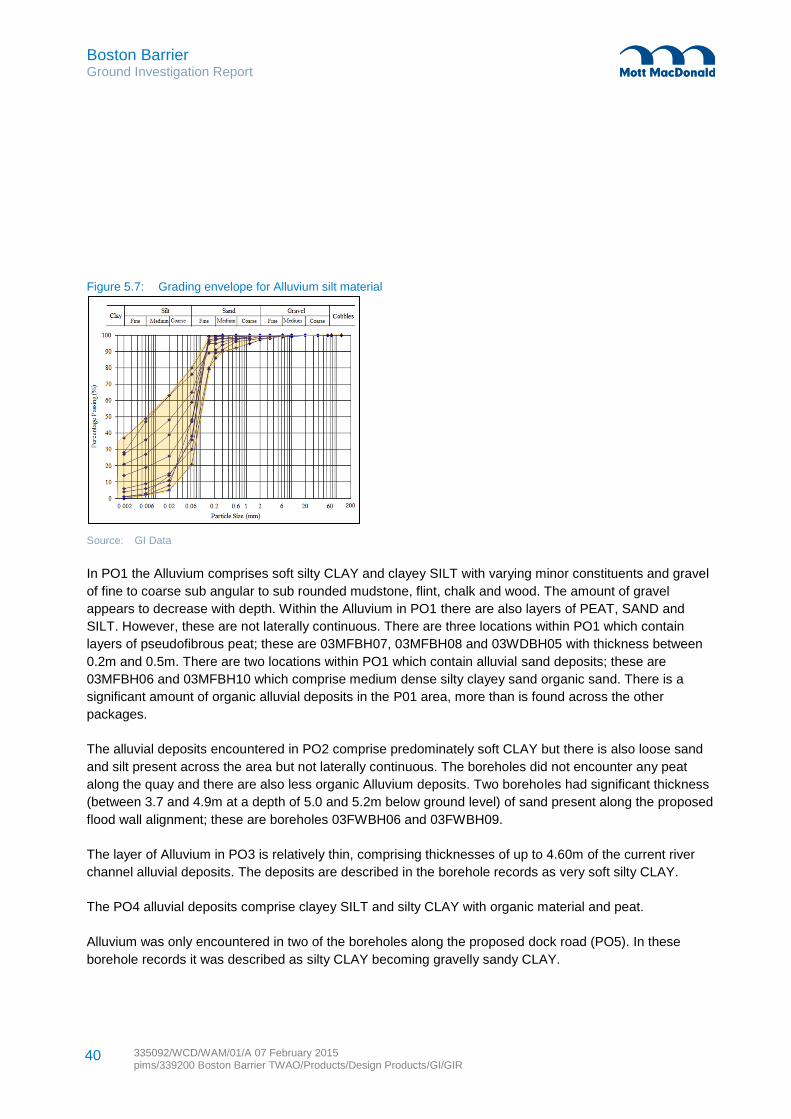
Boston Barrier Ground Investigation Report
335092/WCD/WAM/01/A 07 February 2015 pims/339200 Boston Barrier TWAO/Products/Design Products/GI/GIR
40
Figure 5.7: Grading envelope for Alluvium silt material
Source: GI Data
In PO1 the Alluvium comprises soft silty CLAY and clayey SILT with varying minor constituents and gravel
of fine to coarse sub angular to sub rounded mudstone, flint, chalk and wood. The amount of gravel
appears to decrease with depth. Within the Alluvium in PO1 there are also layers of PEAT, SAND and
SILT. However, these are not laterally continuous. There are three locations within PO1 which contain
layers of pseudofibrous peat; these are 03MFBH07, 03MFBH08 and 03WDBH05 with thickness between
0.2m and 0.5m. There are two locations within PO1 which contain alluvial sand deposits; these are
03MFBH06 and 03MFBH10 which comprise medium dense silty clayey sand organic sand. There is a
significant amount of organic alluvial deposits in the P01 area, more than is found across the other
packages.
The alluvial deposits encountered in PO2 comprise predominately soft CLAY but there is also loose sand
and silt present across the area but not laterally continuous. The boreholes did not encounter any peat
along the quay and there are also less organic Alluvium deposits. Two boreholes had significant thickness
(between 3.7 and 4.9m at a depth of 5.0 and 5.2m below ground level) of sand present along the proposed
flood wall alignment; these are boreholes 03FWBH06 and 03FWBH09.
The layer of Alluvium in PO3 is relatively thin, comprising thicknesses of up to 4.60m of the current river
channel alluvial deposits. The deposits are described in the borehole records as very soft silty CLAY.
The PO4 alluvial deposits comprise clayey SILT and silty CLAY with organic material and peat.
Alluvium was only encountered in two of the boreholes along the proposed dock road (PO5). In these
borehole records it was described as silty CLAY becoming gravelly sandy CLAY.

Boston Barrier Ground Investigation Report
335092/WCD/WAM/01/A 07 February 2015 pims/339200 Boston Barrier TWAO/Products/Design Products/GI/GIR
41
The natural moisture content for all the alluvial material across the site typically ranges from 16% to 61%.
However, as Figure 5.8 shows, there as three values which exceed 61%. These are associated with
alluvial deposits with organic content or peat which due to its structure holds greater moisture.
The plasticity chart for the cohesive alluvial material (Figure 5.9) shows that as with the Made Ground
material there is a large variation in the plasticity of the cohesive alluvial deposits with samples tested
typically ranging from intermediate to high plasticity. There are some outlier/anomalous results which show
low and extremely high plasticity.
SPTs undertaken in the alluvial deposits show N60 values do not increase with depth from surface (bgl) or
with decrease in level (mAOD)(Appendix E; Table E.1). The typical range in N60 for Alluvium clay and
organic Alluvium clay is between 1 and 15. There are a few values higher than this but the borehole logs
show that these are associated with occasional gravels. The sand deposits with the Alluvium show a
greater range of values of N60, typically between 6 and 30.
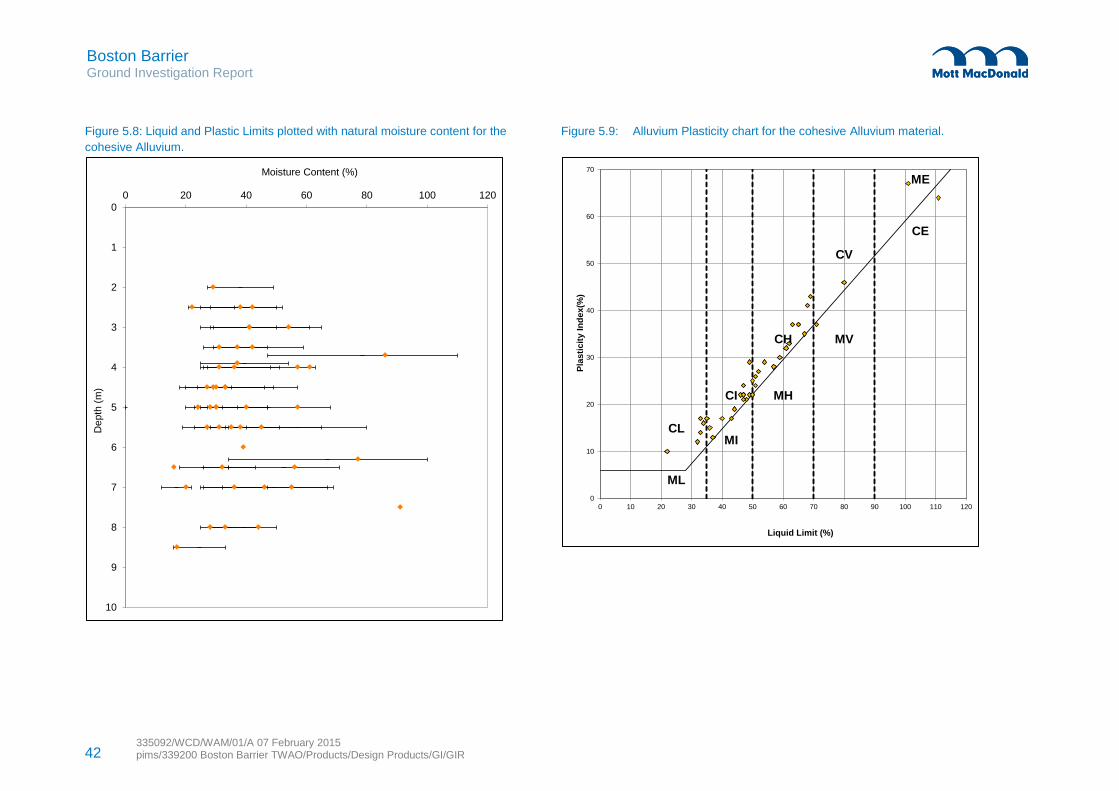
42 335092/WCD/WAM/01/A 07 February 2015 pims/339200 Boston Barrier TWAO/Products/Design Products/GI/GIR
Boston Barrier Ground Investigation Report
Figure 5.8: Liquid and Plastic Limits plotted with natural moisture content for the
cohesive Alluvium.
Figure 5.9: Alluvium Plasticity chart for the cohesive Alluvium material.
0
1
2
3
4
5
6
7
8
9
10
0 20 40 60 80 100 120
De
pth
(m
)
Moisture Content (%)
CL
ML
MI
MHCI
CH MV
CV
CE
ME
0
10
20
30
40
50
60
70
0 10 20 30 40 50 60 70 80 90 100 110 120
Pla
sti
cit
y I
nd
ex(%
)
Liquid Limit (%)
Boston Barrier Ground Investigation Report
335092/WCD/WAM/01/A 07 February 2015 pims/339200 Boston Barrier TWAO/Products/Design Products/GI/GIR
43
5.3.3 Glacial Till Classification and SPTs
The Glacial Till is not shown to be present in the BGS online or paper mapping. However, historic
boreholes and previous phases of ground investigation has identified deposits at depth consistent with the
material found within phase 3 ground investigation.
Glacial Till was encountered at depths between -2 mAOD and -4mAOD and was proven to have a
maximum thickness of 16.75m at BRC07 and a minimum thickness of 13.85m at BRC05. The ground
investigation has indicated that the elevation of the top of the Glacial Till seems relatively uniform across
the site.
Typically there is a layer between 1.5m and 1.6m thick of medium dense to dense sands and gravel
overlying the firm to stiff gravelly clay, which has been classified as granular Glacial Till. The Glacial Till
clay is relatively consistently described at firm to still gravelly clay occasionally with minor constituents of
silt or sand. The gravels typically comprise flints and chalk.
The description of the Glacial Till across the site is fairly consistent. The material is assumed to be over
consolidated. Therefore, the classification in the report has been made site wide and not specifically for
each package order as with the Made Ground and the Alluvium. In addition, due to the variation in the
ground levels at which the strata has been encountered across the site, the geotechnical properties of the
till are in relation to level (mAOD) rather than depth (m bgl).
The grain size distributions in Figure 5.10 for the glacial sands and gravels show that the deposits have
little clay and silt component, between 0% and 10%; and 12% and 17% respectively. The percentage of
sand is between 31% and 68% and the percentage of gravel is between 5% and 44%. This contrasts with
the high percentages of clays and silts in the clay deposits as shown in Figure 5.11. The percentage of
clay is between 10% and 43%, silt is between 15% and 40%, sand comprises between 10% and 23% and
gravels make up 5% and 35%. Cobbles have also been identified in three PSD samples.
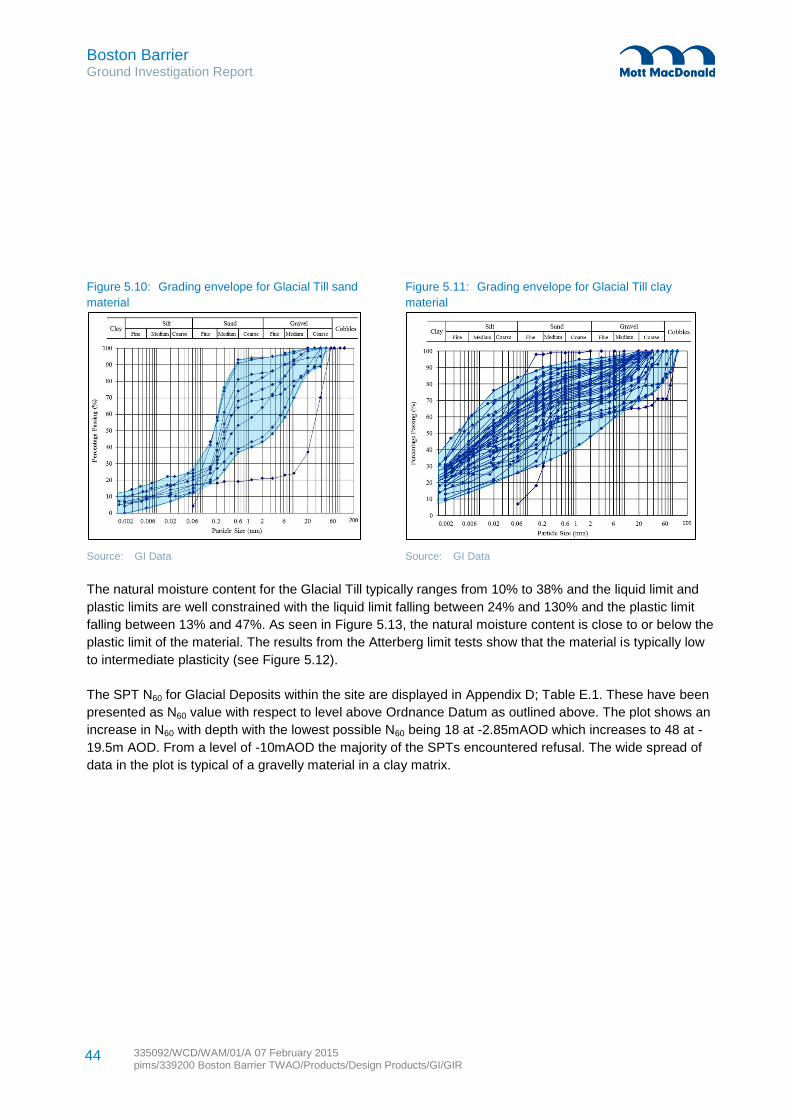
Boston Barrier Ground Investigation Report
335092/WCD/WAM/01/A 07 February 2015 pims/339200 Boston Barrier TWAO/Products/Design Products/GI/GIR
44
Figure 5.10: Grading envelope for Glacial Till sand
material
Figure 5.11: Grading envelope for Glacial Till clay
material
Source: GI Data Source: GI Data
The natural moisture content for the Glacial Till typically ranges from 10% to 38% and the liquid limit and
plastic limits are well constrained with the liquid limit falling between 24% and 130% and the plastic limit
falling between 13% and 47%. As seen in Figure 5.13, the natural moisture content is close to or below the
plastic limit of the material. The results from the Atterberg limit tests show that the material is typically low
to intermediate plasticity (see Figure 5.12).
The SPT N60 for Glacial Deposits within the site are displayed in Appendix D; Table E.1. These have been
presented as N60 value with respect to level above Ordnance Datum as outlined above. The plot shows an
increase in N60 with depth with the lowest possible N60 being 18 at -2.85mAOD which increases to 48 at -
19.5m AOD. From a level of -10mAOD the majority of the SPTs encountered refusal. The wide spread of
data in the plot is typical of a gravelly material in a clay matrix.
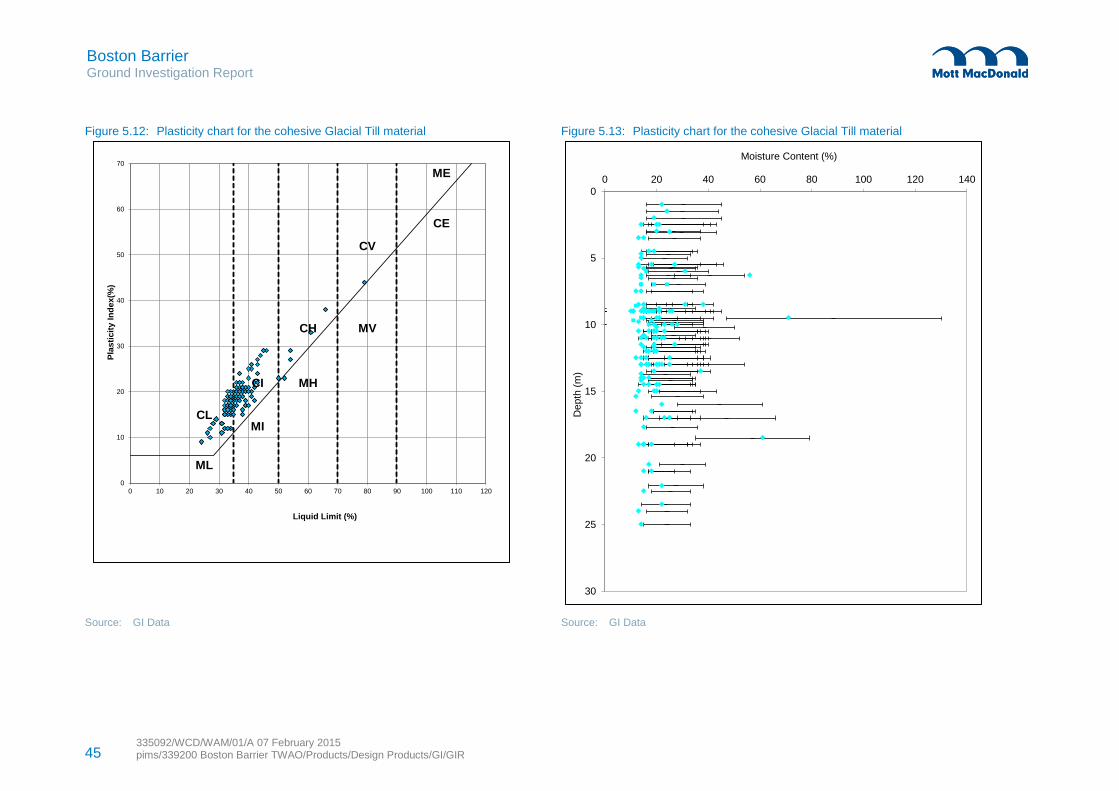
45 335092/WCD/WAM/01/A 07 February 2015 pims/339200 Boston Barrier TWAO/Products/Design Products/GI/GIR
Boston Barrier Ground Investigation Report
Figure 5.12: Plasticity chart for the cohesive Glacial Till material Figure 5.13: Plasticity chart for the cohesive Glacial Till material
Source: GI Data Source: GI Data
CL
ML
MI
MHCI
CH MV
CV
CE
ME
0
10
20
30
40
50
60
70
0 10 20 30 40 50 60 70 80 90 100 110 120
Pla
sti
cit
y I
nd
ex(%
)
Liquid Limit (%)
0
5
10
15
20
25
30
0 20 40 60 80 100 120 140
De
pth
(m
)
Moisture Content (%)
Boston Barrier Ground Investigation Report
335092/WCD/WAM/01/A 07 February 2015 pims/339200 Boston Barrier TWAO/Products/Design Products/GI/GIR
46
5.4 Total Stress Data
Due to the variability in the Made Ground results (refer to Figure 5.14 for the range of strength values
across the whole site), the results have been split into the various package orders. However, for the
Alluvium and Glacial Till deposits the degree of variability was less so a global plot for these deposits has
been used instead.
5.4.1 Made Ground Total Stress
In PO1 20 UUT tests have been undertaken in the Made Ground at depths between 1.5m and 6m bgl,
which when plotted against depth (refer to Appendix E) appear to show a decrease in strength with depth
with cu remaining constant from approximately 3m bgl. The range of cu in the top 3m is 25kPa to 81kPa,
the range from 3 to 6m below ground level is 4kPa to 48kPa.
There are 3 UUT tests located in the Right Embankment (PO4) give cu values of 41kPa to 103kPa.
There are 2 UUT tests undertaken in the made ground in PO5, these give cu values of 7 and 36kPa.
As discussed previously, the Made Ground is extremely variable in composition, plasticity and strength and
as such, any parameters which are required for design need to based on borehole data from the proximity
of the location of the structure and generalisations are difficult across the site or indeed an package order.
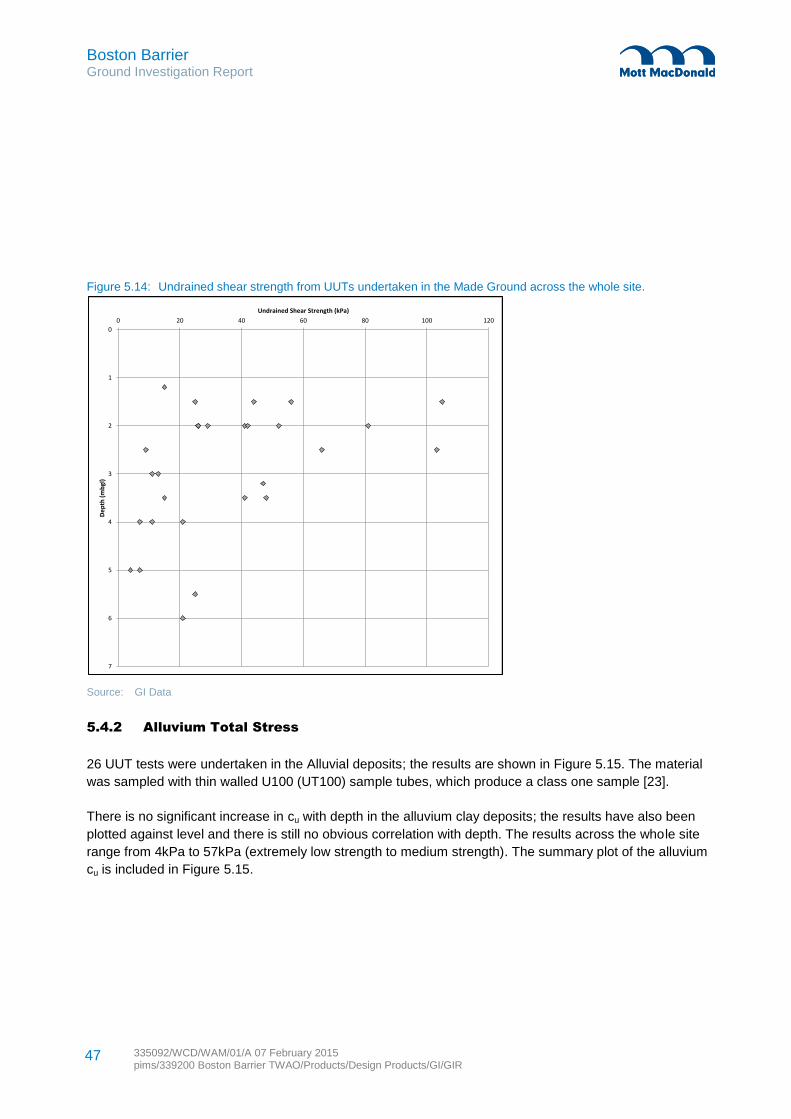
Boston Barrier Ground Investigation Report
335092/WCD/WAM/01/A 07 February 2015 pims/339200 Boston Barrier TWAO/Products/Design Products/GI/GIR
47
Figure 5.14: Undrained shear strength from UUTs undertaken in the Made Ground across the whole site.
Source: GI Data
5.4.2 Alluvium Total Stress
26 UUT tests were undertaken in the Alluvial deposits; the results are shown in Figure 5.15. The material
was sampled with thin walled U100 (UT100) sample tubes, which produce a class one sample [23].
There is no significant increase in cu with depth in the alluvium clay deposits; the results have also been
plotted against level and there is still no obvious correlation with depth. The results across the whole site
range from 4kPa to 57kPa (extremely low strength to medium strength). The summary plot of the alluvium
cu is included in Figure 5.15.
0
1
2
3
4
5
6
7
0 20 40 60 80 100 120
De
pth
(m
bgl
)
Undrained Shear Strength (kPa)
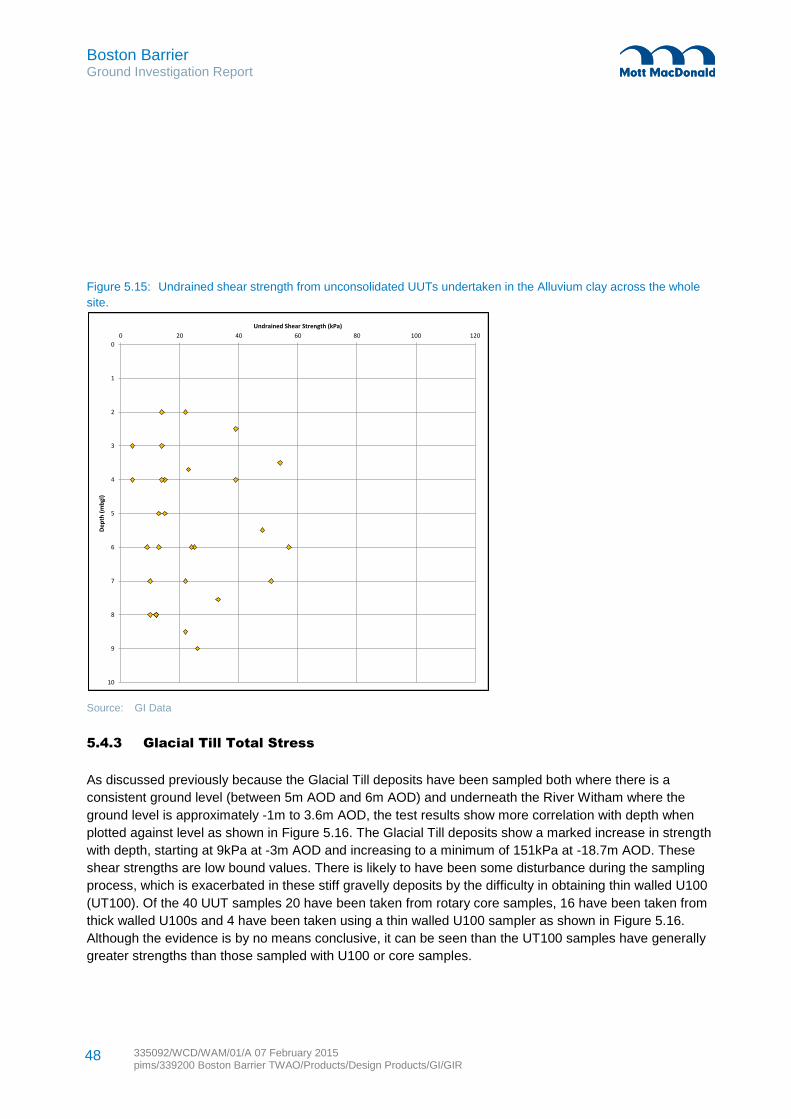
Boston Barrier Ground Investigation Report
335092/WCD/WAM/01/A 07 February 2015 pims/339200 Boston Barrier TWAO/Products/Design Products/GI/GIR
48
Figure 5.15: Undrained shear strength from unconsolidated UUTs undertaken in the Alluvium clay across the whole
site.
Source: GI Data
5.4.3 Glacial Till Total Stress
As discussed previously because the Glacial Till deposits have been sampled both where there is a
consistent ground level (between 5m AOD and 6m AOD) and underneath the River Witham where the
ground level is approximately -1m to 3.6m AOD, the test results show more correlation with depth when
plotted against level as shown in Figure 5.16. The Glacial Till deposits show a marked increase in strength
with depth, starting at 9kPa at -3m AOD and increasing to a minimum of 151kPa at -18.7m AOD. These
shear strengths are low bound values. There is likely to have been some disturbance during the sampling
process, which is exacerbated in these stiff gravelly deposits by the difficulty in obtaining thin walled U100
(UT100). Of the 40 UUT samples 20 have been taken from rotary core samples, 16 have been taken from
thick walled U100s and 4 have been taken using a thin walled U100 sampler as shown in Figure 5.16.
Although the evidence is by no means conclusive, it can be seen than the UT100 samples have generally
greater strengths than those sampled with U100 or core samples.
0
1
2
3
4
5
6
7
8
9
10
0 20 40 60 80 100 120
De
pth
(m
bgl
)
Undrained Shear Strength (kPa)
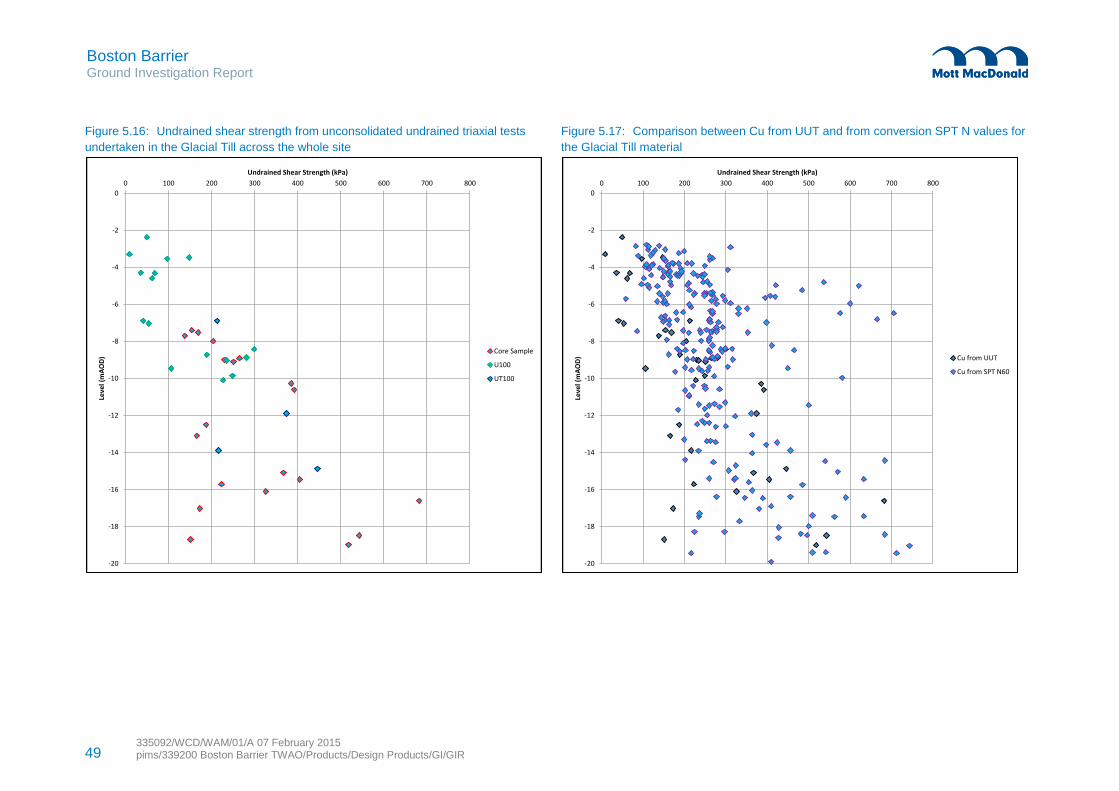
49 335092/WCD/WAM/01/A 07 February 2015 pims/339200 Boston Barrier TWAO/Products/Design Products/GI/GIR
Boston Barrier Ground Investigation Report
Figure 5.16: Undrained shear strength from unconsolidated undrained triaxial tests
undertaken in the Glacial Till across the whole site
Figure 5.17: Comparison between Cu from UUT and from conversion SPT N values for
the Glacial Till material
-20
-18
-16
-14
-12
-10
-8
-6
-4
-2
0
0 100 200 300 400 500 600 700 800
Leve
l (m
AO
D)
Undrained Shear Strength (kPa)
Core Sample
U100
UT100
-20
-18
-16
-14
-12
-10
-8
-6
-4
-2
0
0 100 200 300 400 500 600 700 800
Leve
l (m
AO
D)
Undrained Shear Strength (kPa)
Cu from UUT
Cu from SPT N60
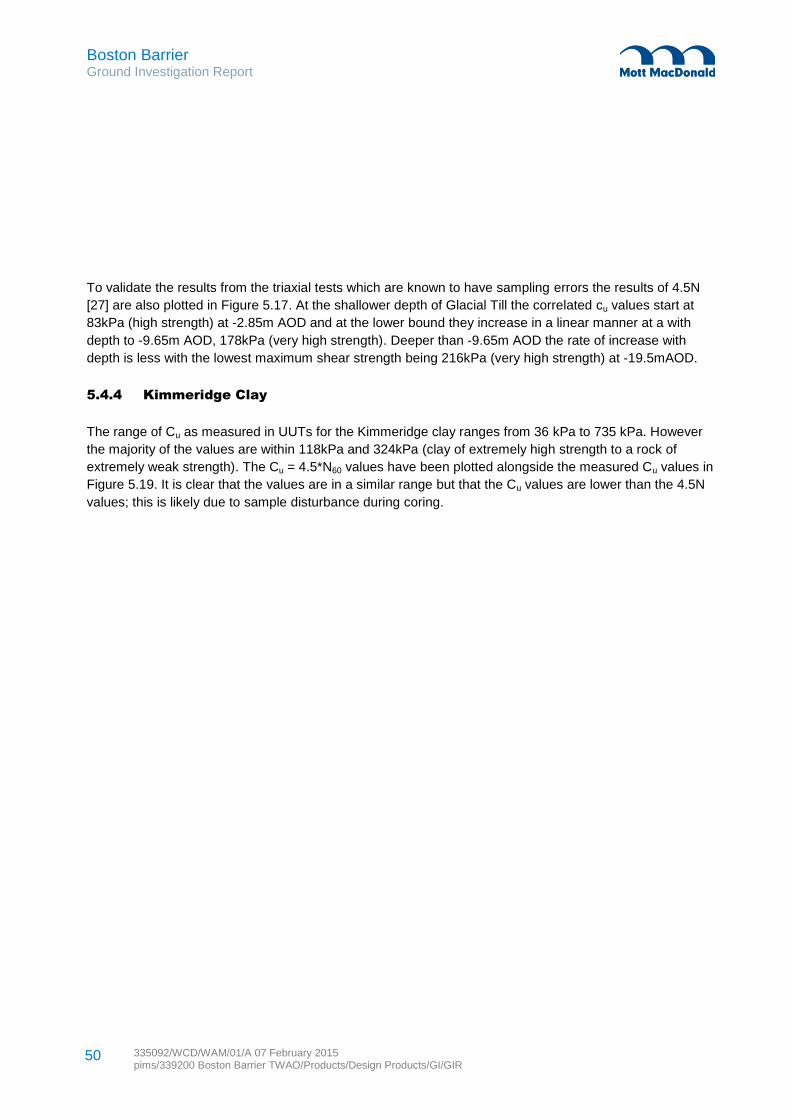
Boston Barrier Ground Investigation Report
335092/WCD/WAM/01/A 07 February 2015 pims/339200 Boston Barrier TWAO/Products/Design Products/GI/GIR
50
To validate the results from the triaxial tests which are known to have sampling errors the results of 4.5N
[27] are also plotted in Figure 5.17. At the shallower depth of Glacial Till the correlated cu values start at
83kPa (high strength) at -2.85m AOD and at the lower bound they increase in a linear manner at a with
depth to -9.65m AOD, 178kPa (very high strength). Deeper than -9.65m AOD the rate of increase with
depth is less with the lowest maximum shear strength being 216kPa (very high strength) at -19.5mAOD.
5.4.4 Kimmeridge Clay
The range of Cu as measured in UUTs for the Kimmeridge clay ranges from 36 kPa to 735 kPa. However
the majority of the values are within 118kPa and 324kPa (clay of extremely high strength to a rock of
extremely weak strength). The Cu = 4.5*N60 values have been plotted alongside the measured Cu values in
Figure 5.19. It is clear that the values are in a similar range but that the Cu values are lower than the 4.5N
values; this is likely due to sample disturbance during coring.
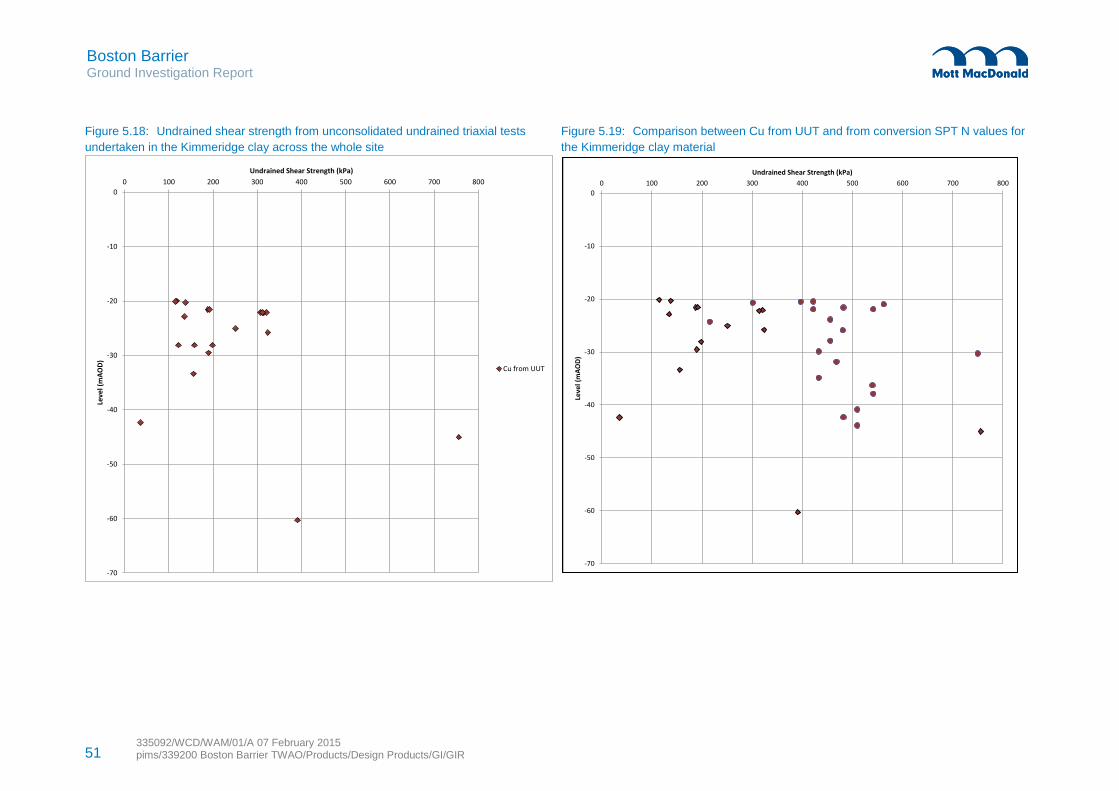
51 335092/WCD/WAM/01/A 07 February 2015 pims/339200 Boston Barrier TWAO/Products/Design Products/GI/GIR
Boston Barrier Ground Investigation Report
Figure 5.18: Undrained shear strength from unconsolidated undrained triaxial tests
undertaken in the Kimmeridge clay across the whole site
Figure 5.19: Comparison between Cu from UUT and from conversion SPT N values for
the Kimmeridge clay material
-70
-60
-50
-40
-30
-20
-10
0
0 100 200 300 400 500 600 700 800
Leve
l (m
AO
D)
Undrained Shear Strength (kPa)
Cu from UUT
-70
-60
-50
-40
-30
-20
-10
0
0 100 200 300 400 500 600 700 800
Leve
l (m
AO
D)
Undrained Shear Strength (kPa)
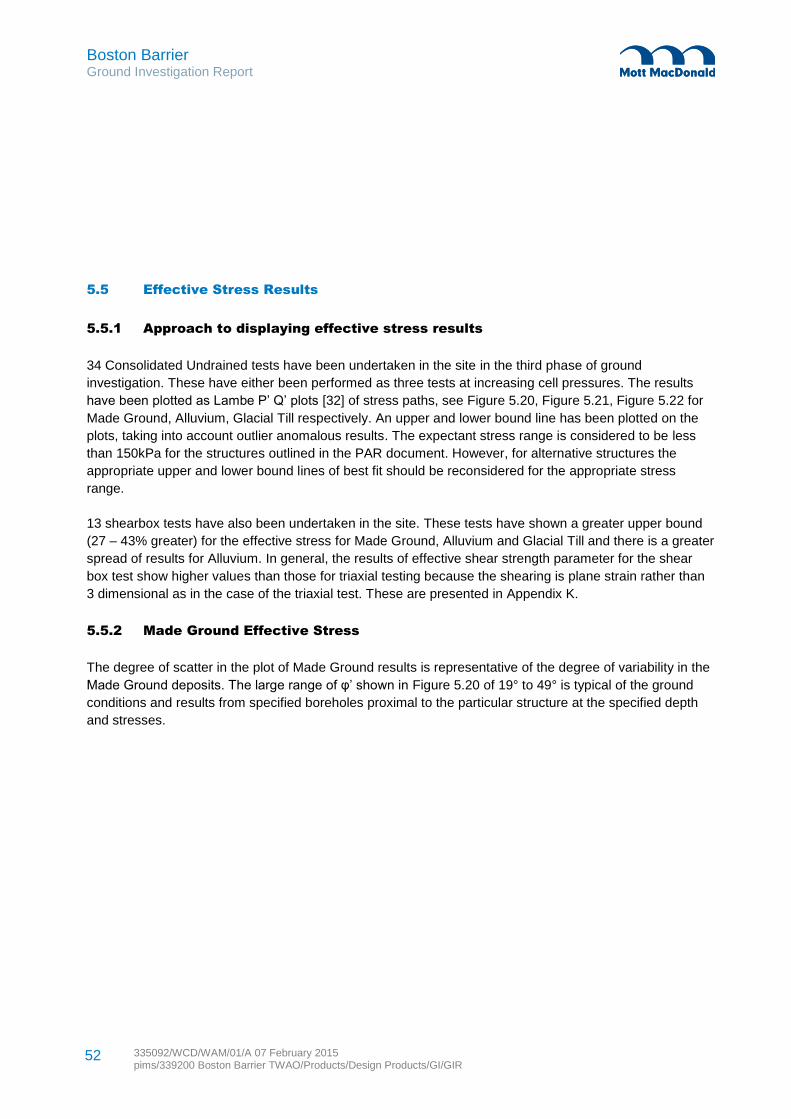
Boston Barrier Ground Investigation Report
335092/WCD/WAM/01/A 07 February 2015 pims/339200 Boston Barrier TWAO/Products/Design Products/GI/GIR
52
5.5 Effective Stress Results
5.5.1 Approach to displaying effective stress results
34 Consolidated Undrained tests have been undertaken in the site in the third phase of ground
investigation. These have either been performed as three tests at increasing cell pressures. The results
have been plotted as Lambe P’ Q’ plots [32] of stress paths, see Figure 5.20, Figure 5.21, Figure 5.22 for
Made Ground, Alluvium, Glacial Till respectively. An upper and lower bound line has been plotted on the
plots, taking into account outlier anomalous results. The expectant stress range is considered to be less
than 150kPa for the structures outlined in the PAR document. However, for alternative structures the
appropriate upper and lower bound lines of best fit should be reconsidered for the appropriate stress
range.
13 shearbox tests have also been undertaken in the site. These tests have shown a greater upper bound
(27 – 43% greater) for the effective stress for Made Ground, Alluvium and Glacial Till and there is a greater
spread of results for Alluvium. In general, the results of effective shear strength parameter for the shear
box test show higher values than those for triaxial testing because the shearing is plane strain rather than
3 dimensional as in the case of the triaxial test. These are presented in Appendix K.
5.5.2 Made Ground Effective Stress
The degree of scatter in the plot of Made Ground results is representative of the degree of variability in the
Made Ground deposits. The large range of φ’ shown in Figure 5.20 of 19° to 49° is typical of the ground
conditions and results from specified boreholes proximal to the particular structure at the specified depth
and stresses.
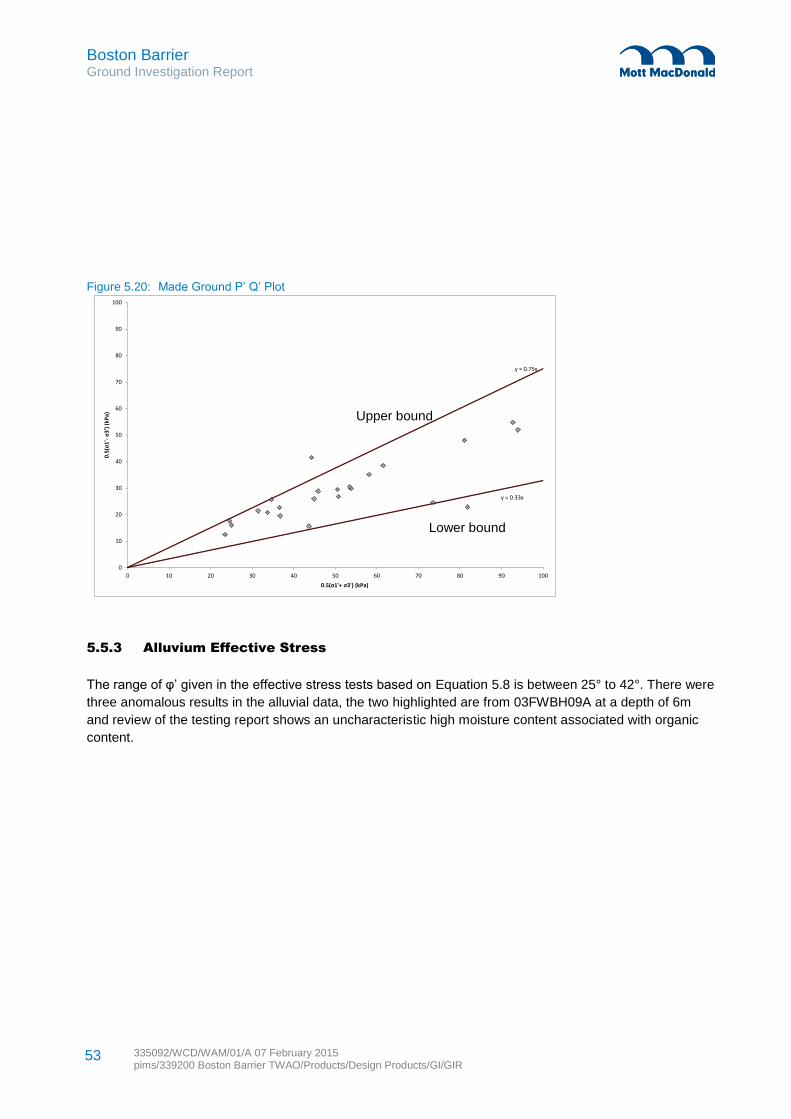
Boston Barrier Ground Investigation Report
335092/WCD/WAM/01/A 07 February 2015 pims/339200 Boston Barrier TWAO/Products/Design Products/GI/GIR
53
Figure 5.20: Made Ground P’ Q’ Plot
5.5.3 Alluvium Effective Stress
The range of φ’ given in the effective stress tests based on Equation 5.8 is between 25° to 42°. There were
three anomalous results in the alluvial data, the two highlighted are from 03FWBH09A at a depth of 6m
and review of the testing report shows an uncharacteristic high moisture content associated with organic
content.
y = 0.33x
y = 0.75x
0
10
20
30
40
50
60
70
80
90
100
0 10 20 30 40 50 60 70 80 90 100
0.5(σ1'-σ3')
(kP
a)
0.5(σ1'+ σ3') (kPa)
Upper bound
Lower bound
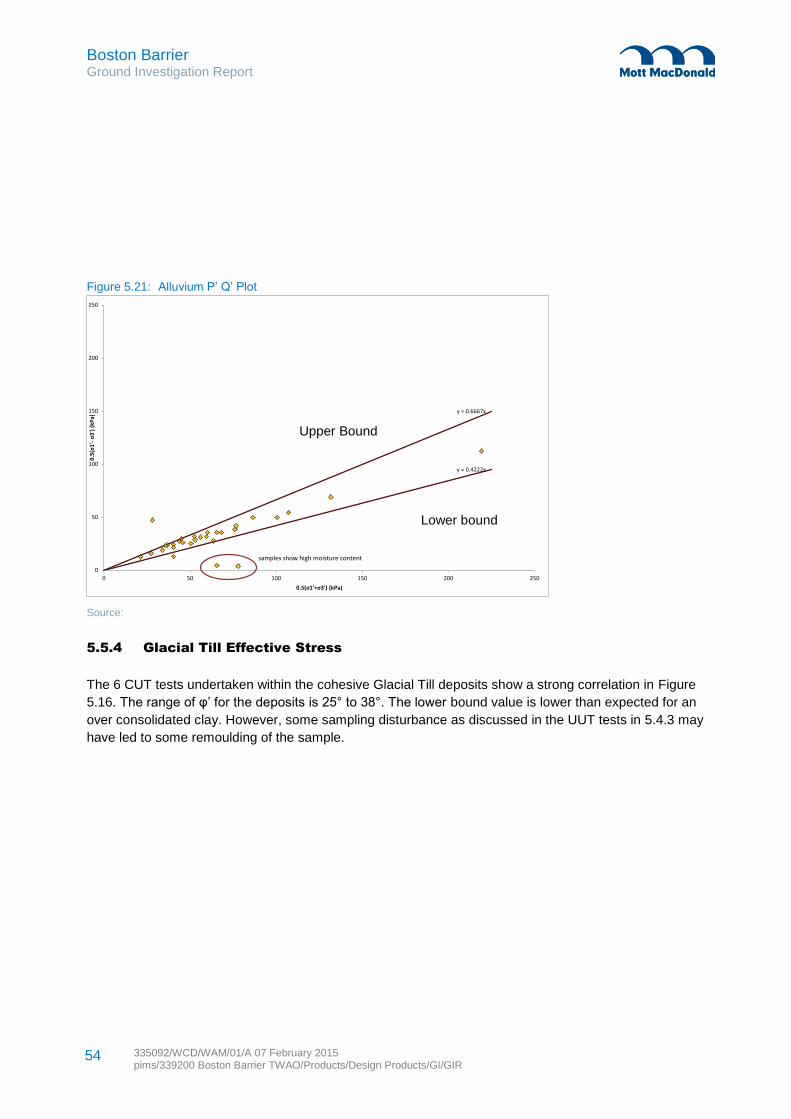
Boston Barrier Ground Investigation Report
335092/WCD/WAM/01/A 07 February 2015 pims/339200 Boston Barrier TWAO/Products/Design Products/GI/GIR
54
Figure 5.21: Alluvium P’ Q’ Plot
Source:
5.5.4 Glacial Till Effective Stress
The 6 CUT tests undertaken within the cohesive Glacial Till deposits show a strong correlation in Figure
5.16. The range of φ’ for the deposits is 25° to 38°. The lower bound value is lower than expected for an
over consolidated clay. However, some sampling disturbance as discussed in the UUT tests in 5.4.3 may
have led to some remoulding of the sample.
y = 0.4222x
y = 0.6667x
0
50
100
150
200
250
0 50 100 150 200 250
0.5(σ1'-σ3')
(kP
a)
0.5(σ1'+σ3') (kPa)
samples show high moisture content
Upper Bound
Lower bound
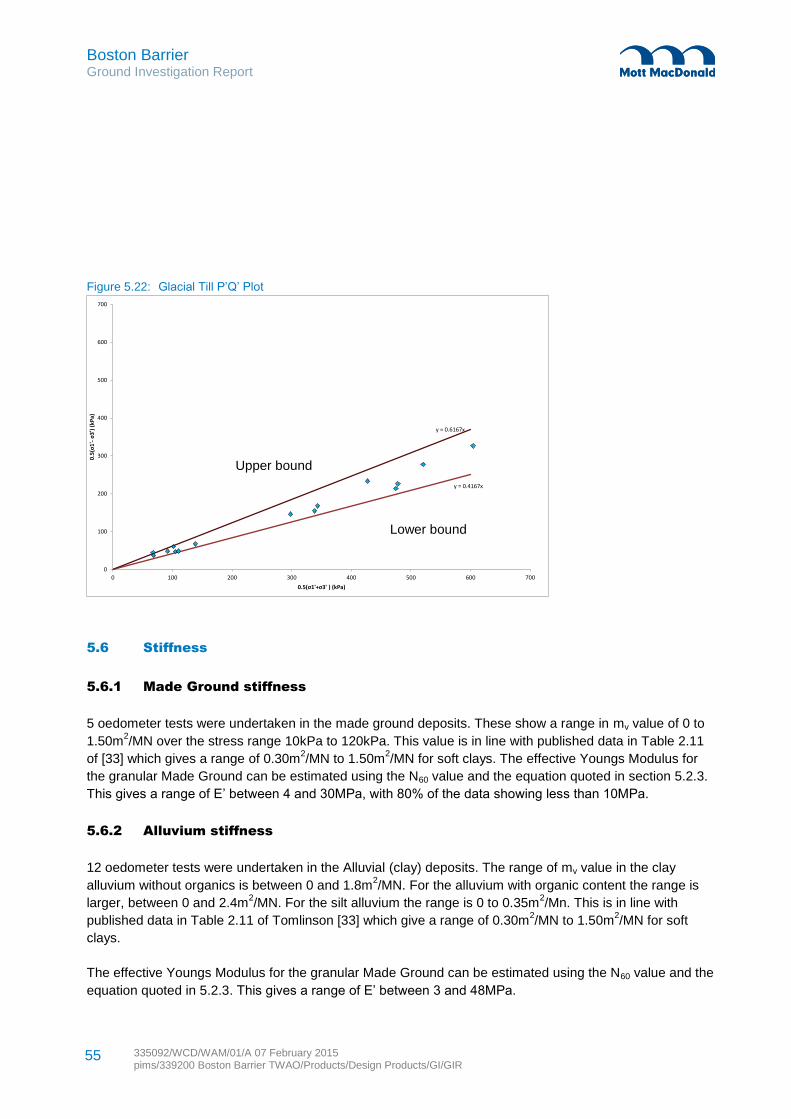
Boston Barrier Ground Investigation Report
335092/WCD/WAM/01/A 07 February 2015 pims/339200 Boston Barrier TWAO/Products/Design Products/GI/GIR
55
Figure 5.22: Glacial Till P’Q’ Plot
5.6 Stiffness
5.6.1 Made Ground stiffness
5 oedometer tests were undertaken in the made ground deposits. These show a range in mv value of 0 to
1.50m2/MN over the stress range 10kPa to 120kPa. This value is in line with published data in Table 2.11
of [33] which gives a range of 0.30m2/MN to 1.50m
2/MN for soft clays. The effective Youngs Modulus for
the granular Made Ground can be estimated using the N60 value and the equation quoted in section 5.2.3.
This gives a range of E’ between 4 and 30MPa, with 80% of the data showing less than 10MPa.
5.6.2 Alluvium stiffness
12 oedometer tests were undertaken in the Alluvial (clay) deposits. The range of mv value in the clay
alluvium without organics is between 0 and 1.8m2/MN. For the alluvium with organic content the range is
larger, between 0 and 2.4m2/MN. For the silt alluvium the range is 0 to 0.35m
2/Mn. This is in line with
published data in Table 2.11 of Tomlinson [33] which give a range of 0.30m2/MN to 1.50m
2/MN for soft
clays.
The effective Youngs Modulus for the granular Made Ground can be estimated using the N60 value and the
equation quoted in 5.2.3. This gives a range of E’ between 3 and 48MPa.
y = 0.4167x
y = 0.6167x
0
100
200
300
400
500
600
700
0 100 200 300 400 500 600 700
0.5(σ1'-σ3')
(kP
a)
0.5(σ1'+σ3' ) (kPa)
Upper bound
Lower bound
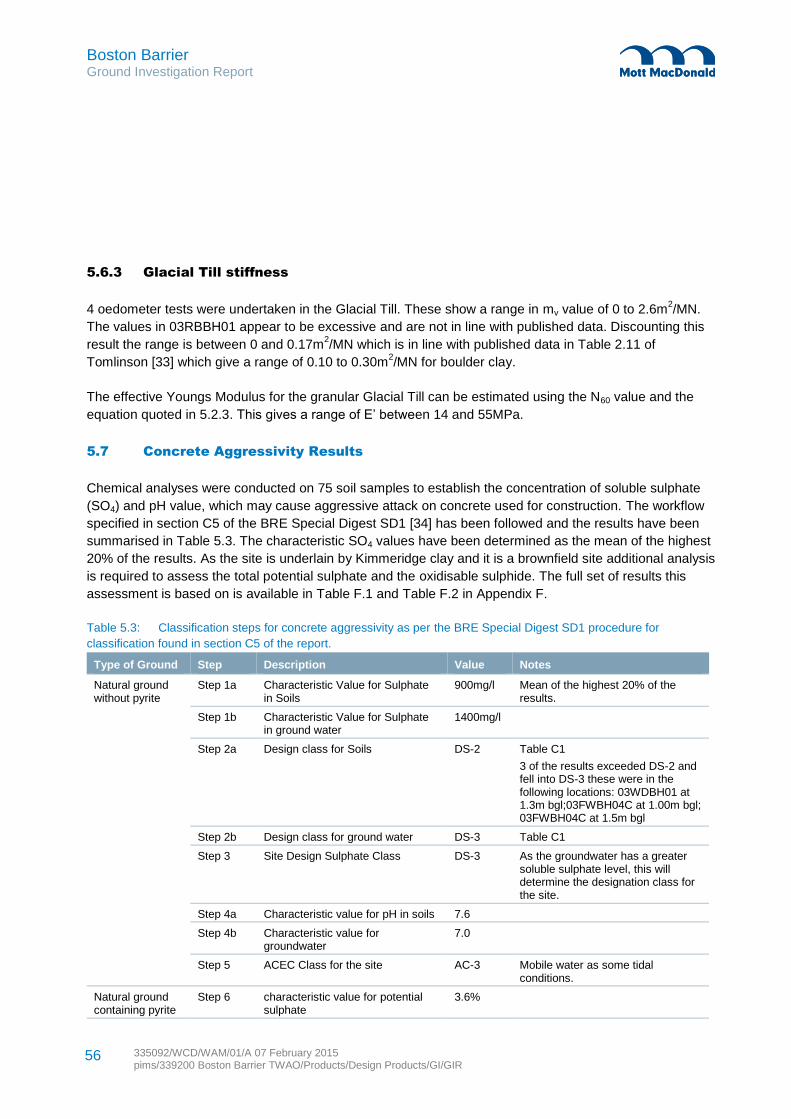
Boston Barrier Ground Investigation Report
335092/WCD/WAM/01/A 07 February 2015 pims/339200 Boston Barrier TWAO/Products/Design Products/GI/GIR
56
5.6.3 Glacial Till stiffness
4 oedometer tests were undertaken in the Glacial Till. These show a range in mv value of 0 to 2.6m2/MN.
The values in 03RBBH01 appear to be excessive and are not in line with published data. Discounting this
result the range is between 0 and 0.17m2/MN which is in line with published data in Table 2.11 of
Tomlinson [33] which give a range of 0.10 to 0.30m2/MN for boulder clay.
The effective Youngs Modulus for the granular Glacial Till can be estimated using the N60 value and the
equation quoted in 5.2.3. This gives a range of E’ between 14 and 55MPa.
5.7 Concrete Aggressivity Results
Chemical analyses were conducted on 75 soil samples to establish the concentration of soluble sulphate
(SO4) and pH value, which may cause aggressive attack on concrete used for construction. The workflow
specified in section C5 of the BRE Special Digest SD1 [34] has been followed and the results have been
summarised in Table 5.3. The characteristic SO4 values have been determined as the mean of the highest
20% of the results. As the site is underlain by Kimmeridge clay and it is a brownfield site additional analysis
is required to assess the total potential sulphate and the oxidisable sulphide. The full set of results this
assessment is based on is available in Table F.1 and Table F.2 in Appendix F.
Table 5.3: Classification steps for concrete aggressivity as per the BRE Special Digest SD1 procedure for
classification found in section C5 of the report.
Type of Ground Step Description Value Notes
Natural ground without pyrite
Step 1a Characteristic Value for Sulphate in Soils
900mg/l Mean of the highest 20% of the results.
Step 1b Characteristic Value for Sulphate in ground water
1400mg/l
Step 2a Design class for Soils DS-2 Table C1
3 of the results exceeded DS-2 and fell into DS-3 these were in the following locations: 03WDBH01 at 1.3m bgl;03FWBH04C at 1.00m bgl; 03FWBH04C at 1.5m bgl
Step 2b Design class for ground water DS-3 Table C1
Step 3 Site Design Sulphate Class DS-3 As the groundwater has a greater soluble sulphate level, this will determine the designation class for the site.
Step 4a Characteristic value for pH in soils 7.6
Step 4b Characteristic value for groundwater
7.0
Step 5 ACEC Class for the site AC-3 Mobile water as some tidal conditions.
Natural ground containing pyrite
Step 6 characteristic value for potential sulphate
3.6%
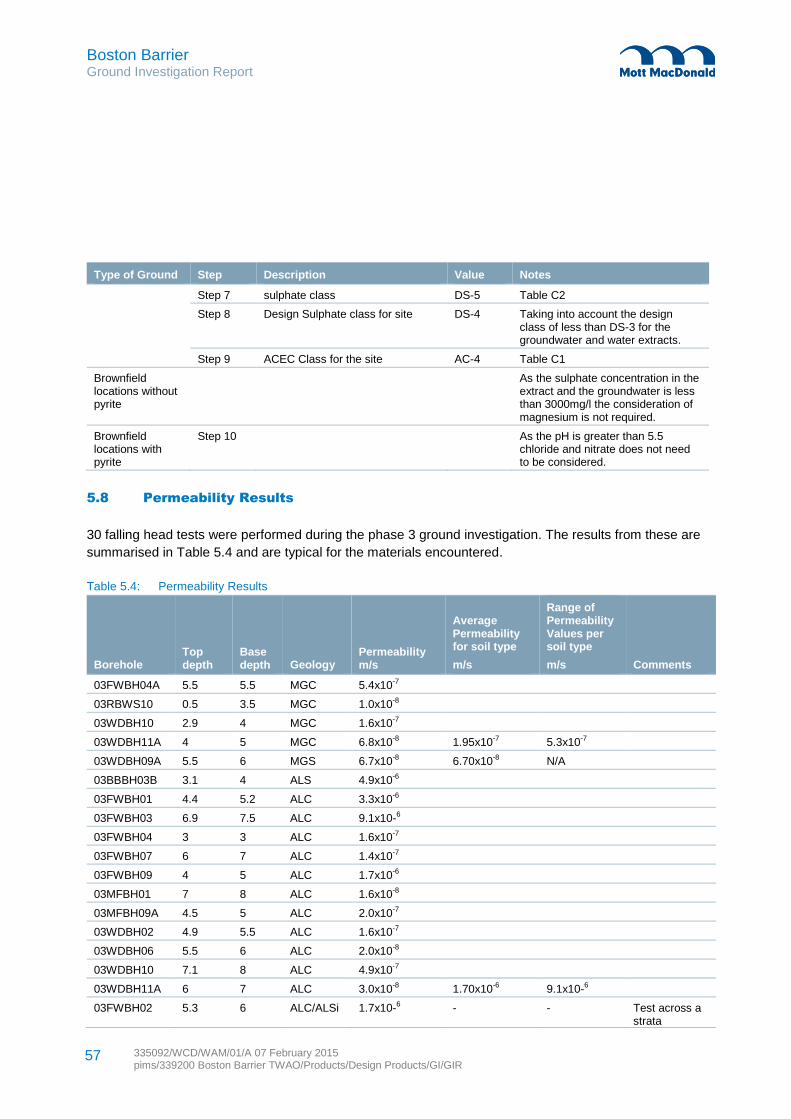
Boston Barrier Ground Investigation Report
335092/WCD/WAM/01/A 07 February 2015 pims/339200 Boston Barrier TWAO/Products/Design Products/GI/GIR
57
Type of Ground Step Description Value Notes
Step 7 sulphate class DS-5 Table C2
Step 8 Design Sulphate class for site DS-4 Taking into account the design class of less than DS-3 for the groundwater and water extracts.
Step 9 ACEC Class for the site AC-4 Table C1
Brownfield locations without pyrite
As the sulphate concentration in the extract and the groundwater is less than 3000mg/l the consideration of magnesium is not required.
Brownfield locations with pyrite
Step 10 As the pH is greater than 5.5 chloride and nitrate does not need to be considered.
5.8 Permeability Results
30 falling head tests were performed during the phase 3 ground investigation. The results from these are
summarised in Table 5.4 and are typical for the materials encountered.
Table 5.4: Permeability Results
Borehole Top depth
Base depth Geology
Permeability m/s
Average Permeability for soil type
m/s
Range of Permeability Values per soil type
m/s Comments
03FWBH04A 5.5 5.5 MGC 5.4x10⁻⁷
03RBWS10 0.5 3.5 MGC 1.0x10⁻⁸
03WDBH10 2.9 4 MGC 1.6x10⁻⁷
03WDBH11A 4 5 MGC 6.8x10⁻⁸ 1.95x10⁻⁷ 5.3x10⁻⁷
03WDBH09A 5.5 6 MGS 6.7x10⁻⁸ 6.70x10⁻⁸ N/A
03BBBH03B 3.1 4 ALS 4.9x10⁻⁶
03FWBH01 4.4 5.2 ALC 3.3x10⁻⁶
03FWBH03 6.9 7.5 ALC 9.1x10⁻⁶
03FWBH04 3 3 ALC 1.6x10⁻⁷
03FWBH07 6 7 ALC 1.4x10⁻⁷
03FWBH09 4 5 ALC 1.7x10⁻⁶
03MFBH01 7 8 ALC 1.6x10⁻⁸
03MFBH09A 4.5 5 ALC 2.0x10⁻⁷
03WDBH02 4.9 5.5 ALC 1.6x10⁻⁷
03WDBH06 5.5 6 ALC 2.0x10⁻⁸
03WDBH10 7.1 8 ALC 4.9x10⁻⁷
03WDBH11A 6 7 ALC 3.0x10⁻⁸ 1.70x10⁻⁶ 9.1x10⁻⁶
03FWBH02 5.3 6 ALC/ALSi 1.7x10⁻⁶ - - Test across a strata
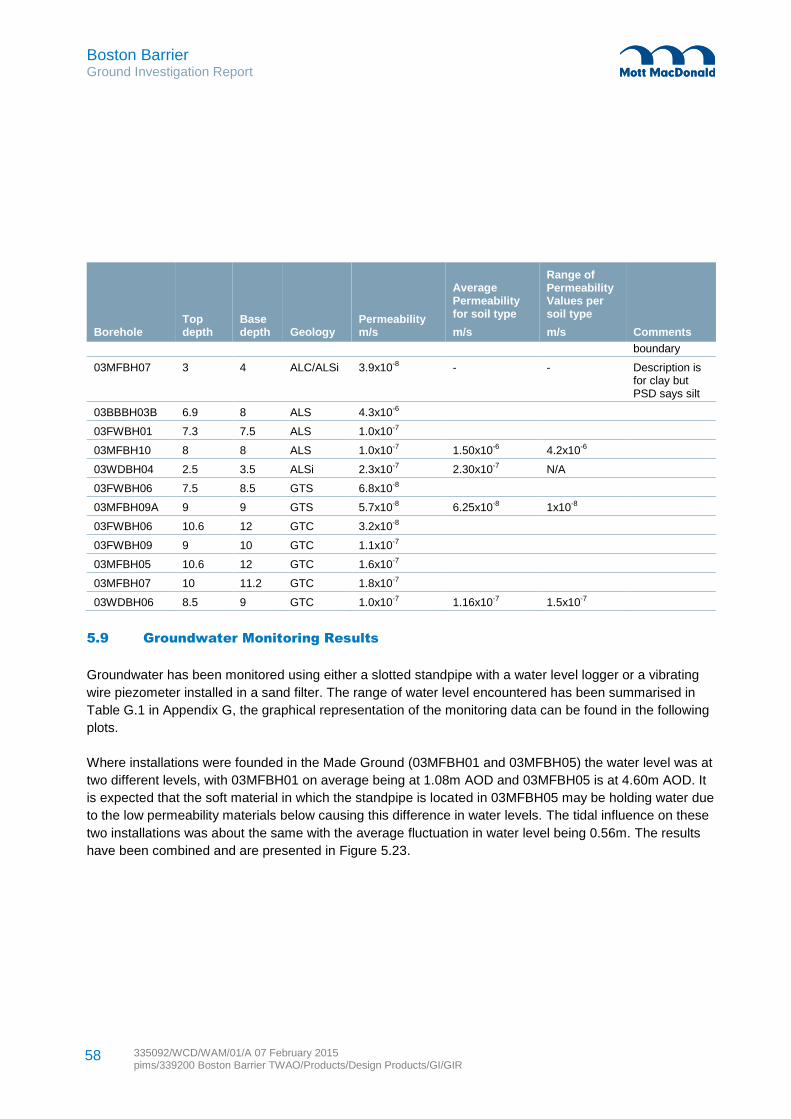
Boston Barrier Ground Investigation Report
335092/WCD/WAM/01/A 07 February 2015 pims/339200 Boston Barrier TWAO/Products/Design Products/GI/GIR
58
Borehole Top depth
Base depth Geology
Permeability m/s
Average Permeability for soil type
m/s
Range of Permeability Values per soil type
m/s Comments
boundary
03MFBH07 3 4 ALC/ALSi 3.9x10⁻⁸ - - Description is for clay but PSD says silt
03BBBH03B 6.9 8 ALS 4.3x10⁻⁶
03FWBH01 7.3 7.5 ALS 1.0x10⁻⁷
03MFBH10 8 8 ALS 1.0x10⁻⁷ 1.50x10⁻⁶ 4.2x10⁻⁶
03WDBH04 2.5 3.5 ALSi 2.3x10⁻⁷ 2.30x10⁻⁷ N/A
03FWBH06 7.5 8.5 GTS 6.8x10⁻⁸
03MFBH09A 9 9 GTS 5.7x10⁻⁸ 6.25x10⁻⁸ 1x10⁻⁸
03FWBH06 10.6 12 GTC 3.2x10⁻⁸
03FWBH09 9 10 GTC 1.1x10⁻⁷
03MFBH05 10.6 12 GTC 1.6x10⁻⁷
03MFBH07 10 11.2 GTC 1.8x10⁻⁷
03WDBH06 8.5 9 GTC 1.0x10⁻⁷ 1.16x10⁻⁷ 1.5x10⁻⁷
5.9 Groundwater Monitoring Results
Groundwater has been monitored using either a slotted standpipe with a water level logger or a vibrating
wire piezometer installed in a sand filter. The range of water level encountered has been summarised in
Table G.1 in Appendix G, the graphical representation of the monitoring data can be found in the following
plots.
Where installations were founded in the Made Ground (03MFBH01 and 03MFBH05) the water level was at
two different levels, with 03MFBH01 on average being at 1.08m AOD and 03MFBH05 is at 4.60m AOD. It
is expected that the soft material in which the standpipe is located in 03MFBH05 may be holding water due
to the low permeability materials below causing this difference in water levels. The tidal influence on these
two installations was about the same with the average fluctuation in water level being 0.56m. The results
have been combined and are presented in Figure 5.23.
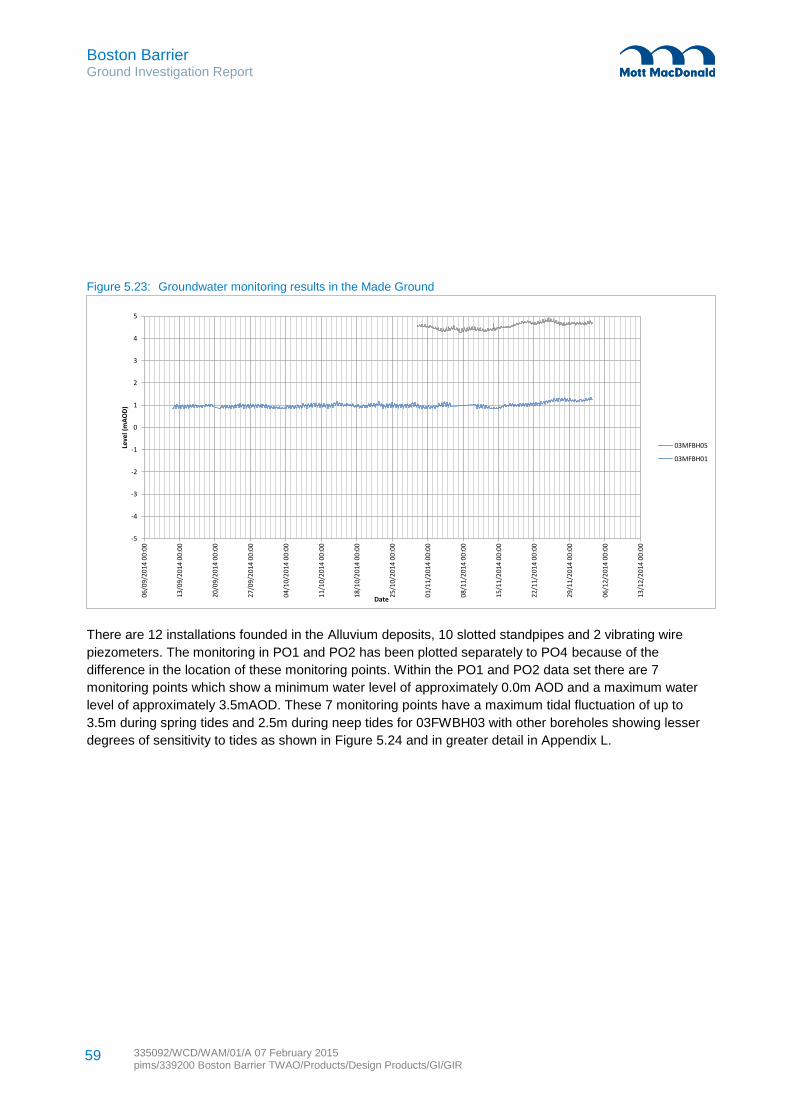
Boston Barrier Ground Investigation Report
335092/WCD/WAM/01/A 07 February 2015 pims/339200 Boston Barrier TWAO/Products/Design Products/GI/GIR
59
Figure 5.23: Groundwater monitoring results in the Made Ground
There are 12 installations founded in the Alluvium deposits, 10 slotted standpipes and 2 vibrating wire
piezometers. The monitoring in PO1 and PO2 has been plotted separately to PO4 because of the
difference in the location of these monitoring points. Within the PO1 and PO2 data set there are 7
monitoring points which show a minimum water level of approximately 0.0m AOD and a maximum water
level of approximately 3.5mAOD. These 7 monitoring points have a maximum tidal fluctuation of up to
3.5m during spring tides and 2.5m during neep tides for 03FWBH03 with other boreholes showing lesser
degrees of sensitivity to tides as shown in Figure 5.24 and in greater detail in Appendix L.
-5
-4
-3
-2
-1
0
1
2
3
4
5
06
/09
/20
14
00
:00
13
/09
/20
14
00
:00
20
/09
/20
14
00
:00
27
/09
/20
14
00
:00
04
/10
/20
14
00
:00
11
/10
/20
14
00
:00
18
/10
/20
14
00
:00
25
/10
/20
14
00
:00
01
/11
/20
14
00
:00
08
/11
/20
14
00
:00
15
/11
/20
14
00
:00
22
/11
/20
14
00
:00
29
/11
/20
14
00
:00
06
/12
/20
14
00
:00
13
/12
/20
14
00
:00
Leve
l (m
AO
D)
Date
03MFBH05
03MFBH01
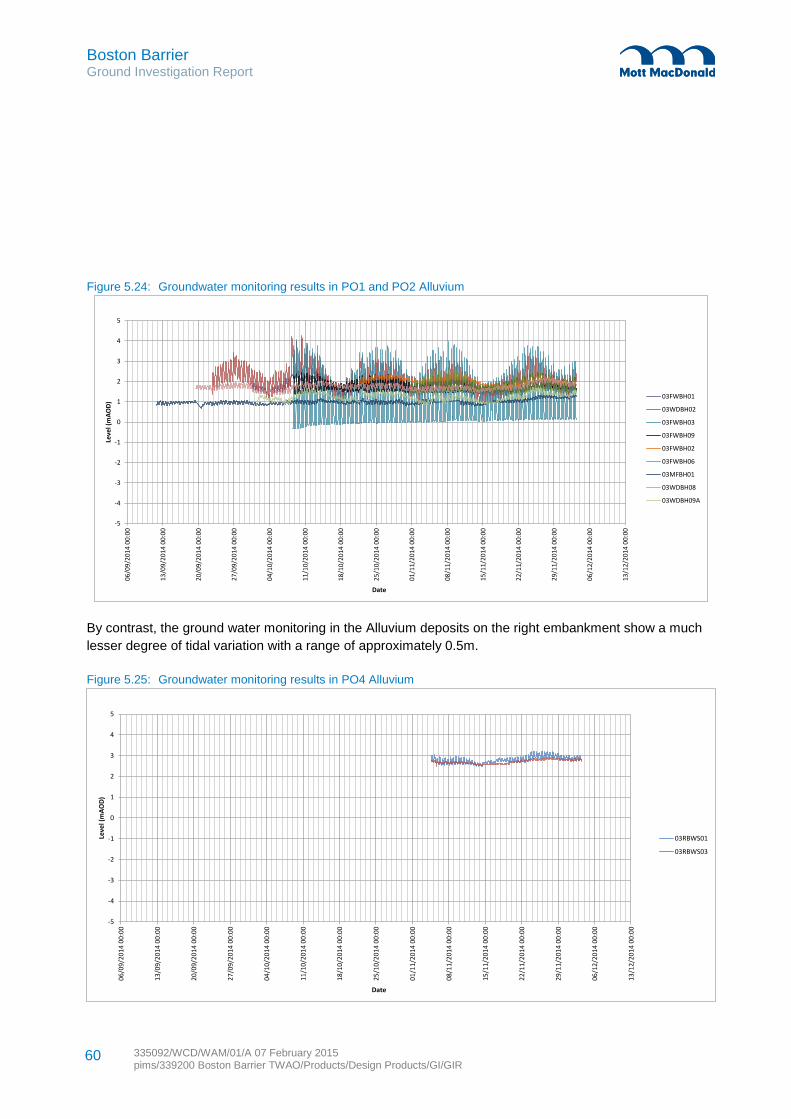
Boston Barrier Ground Investigation Report
335092/WCD/WAM/01/A 07 February 2015 pims/339200 Boston Barrier TWAO/Products/Design Products/GI/GIR
60
Figure 5.24: Groundwater monitoring results in PO1 and PO2 Alluvium
By contrast, the ground water monitoring in the Alluvium deposits on the right embankment show a much
lesser degree of tidal variation with a range of approximately 0.5m.
Figure 5.25: Groundwater monitoring results in PO4 Alluvium
-5
-4
-3
-2
-1
0
1
2
3
4
5
06
/09
/20
14
00
:00
13
/09
/20
14
00
:00
20
/09
/20
14
00
:00
27
/09
/20
14
00
:00
04
/10
/20
14
00
:00
11
/10
/20
14
00
:00
18
/10
/20
14
00
:00
25
/10
/20
14
00
:00
01
/11
/20
14
00
:00
08
/11
/20
14
00
:00
15
/11
/20
14
00
:00
22
/11
/20
14
00
:00
29
/11
/20
14
00
:00
06
/12
/20
14
00
:00
13
/12
/20
14
00
:00
Leve
l (m
AO
D)
Date
03FWBH01
03WDBH02
03FWBH03
03FWBH09
03FWBH02
03FWBH06
03MFBH01
03WDBH08
03WDBH09A
-5
-4
-3
-2
-1
0
1
2
3
4
5
06
/09
/20
14
00
:00
13
/09
/20
14
00
:00
20
/09
/20
14
00
:00
27
/09
/20
14
00
:00
04
/10
/20
14
00
:00
11
/10
/20
14
00
:00
18
/10
/20
14
00
:00
25
/10
/20
14
00
:00
01
/11
/20
14
00
:00
08
/11
/20
14
00
:00
15
/11
/20
14
00
:00
22
/11
/20
14
00
:00
29
/11
/20
14
00
:00
06
/12
/20
14
00
:00
13
/12
/20
14
00
:00
Leve
l (m
AO
D)
Date
03RBWS01
03RBWS03
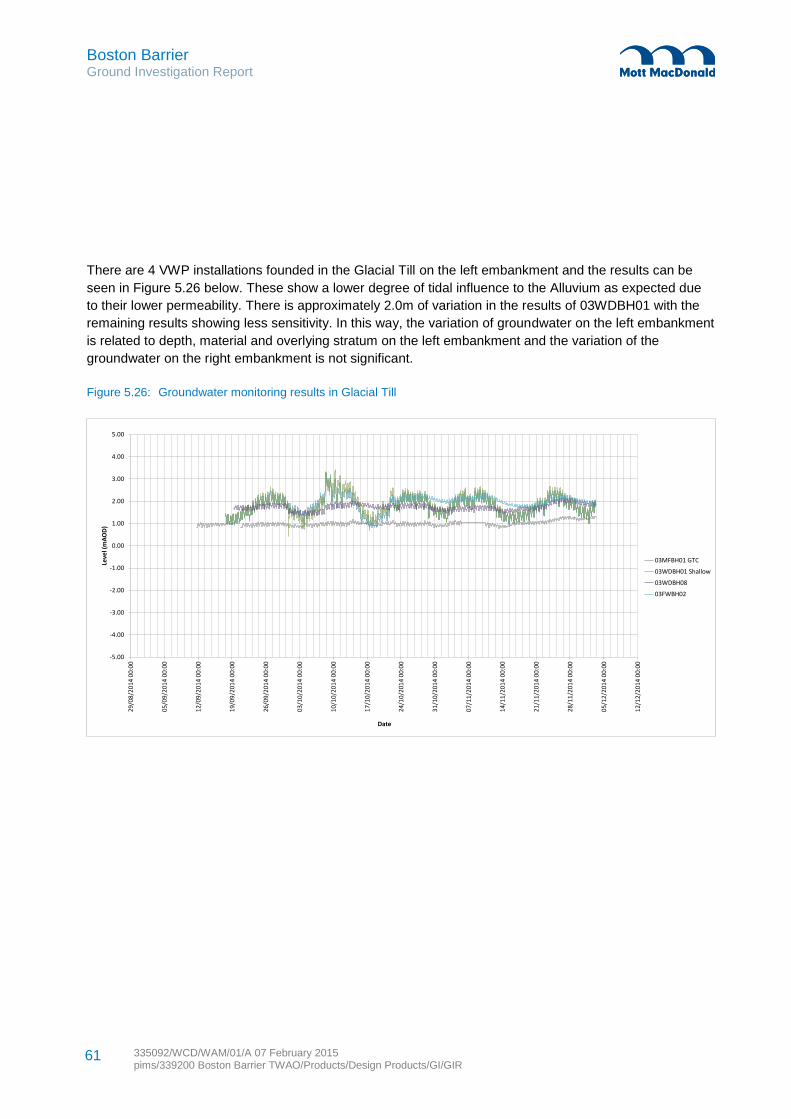
Boston Barrier Ground Investigation Report
335092/WCD/WAM/01/A 07 February 2015 pims/339200 Boston Barrier TWAO/Products/Design Products/GI/GIR
61
There are 4 VWP installations founded in the Glacial Till on the left embankment and the results can be
seen in Figure 5.26 below. These show a lower degree of tidal influence to the Alluvium as expected due
to their lower permeability. There is approximately 2.0m of variation in the results of 03WDBH01 with the
remaining results showing less sensitivity. In this way, the variation of groundwater on the left embankment
is related to depth, material and overlying stratum on the left embankment and the variation of the
groundwater on the right embankment is not significant.
Figure 5.26: Groundwater monitoring results in Glacial Till
-5.00
-4.00
-3.00
-2.00
-1.00
0.00
1.00
2.00
3.00
4.00
5.00
29
/08
/20
14
00
:00
05
/09
/20
14
00
:00
12
/09
/20
14
00
:00
19
/09
/20
14
00
:00
26
/09
/20
14
00
:00
03
/10
/20
14
00
:00
10
/10
/20
14
00
:00
17
/10
/20
14
00
:00
24
/10
/20
14
00
:00
31
/10
/20
14
00
:00
07
/11
/20
14
00
:00
14
/11
/20
14
00
:00
21
/11
/20
14
00
:00
28
/11
/20
14
00
:00
05
/12
/20
14
00
:00
12
/12
/20
14
00
:00
Leve
l (m
AO
D)
Date
03MFBH01 GTC
03WDBH01 Shallow
03WDBH08
03FWBH02
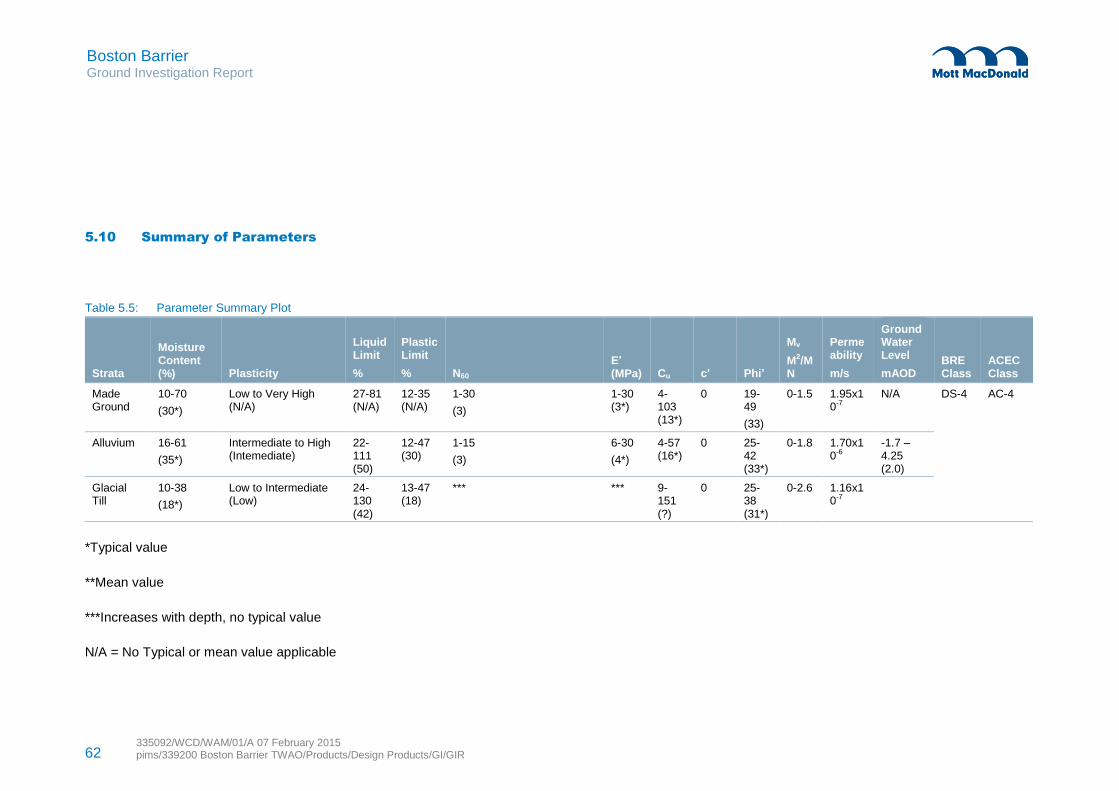
62 335092/WCD/WAM/01/A 07 February 2015 pims/339200 Boston Barrier TWAO/Products/Design Products/GI/GIR
Boston Barrier Ground Investigation Report
5.10 Summary of Parameters
Table 5.5: Parameter Summary Plot
Strata
Moisture Content (%) Plasticity
Liquid Limit
%
Plastic Limit
% N60 E’ (MPa) Cu c’ Phi’
Mv
M2/MN
Permeability
m/s
Ground Water Level
mAOD BRE Class
ACEC Class
Made Ground
10-70
(30*)
Low to Very High (N/A)
27-81 (N/A)
12-35 (N/A)
1-30
(3)
1-30 (3*)
4-103 (13*)
0 19-49
(33)
0-1.5 1.95x10⁻⁷
N/A DS-4 AC-4
Alluvium 16-61
(35*)
Intermediate to High (Intemediate)
22-111 (50)
12-47 (30)
1-15
(3)
6-30
(4*)
4-57 (16*)
0 25-42 (33*)
0-1.8 1.70x10⁻⁶
-1.7 – 4.25 (2.0)
Glacial Till
10-38
(18*)
Low to Intermediate (Low)
24-130 (42)
13-47 (18)
*** *** 9-151 (?)
0 25-38 (31*)
0-2.6 1.16x10⁻⁷
*Typical value
**Mean value
***Increases with depth, no typical value
N/A = No Typical or mean value applicable
Boston Barrier Ground Investigation Report
335092/WCD/WAM/01/A 07 February 2015 pims/339200 Boston Barrier TWAO/Products/Design Products/GI/GIR
63
6.1 Methodology
6.1.1 Scope of Ground Investigation
The strategy for the Phase II assessment of potential land contamination adopted in this report is based on
current guidance documents, in particular CIRIA Report C552 [5] which adopts the following approach:
Phase II Contaminated Land Risk Assessment: This involves intrusive ground investigation, in-situ
measurements, soil sampling and testing, and risk assessment involving data analysis, and the processes
of risk estimation and risk evaluation. Where the results of this phase indicate that areas of land
contamination are present that constitute unacceptable risks, consideration may then to be given to the
most appropriate means to minimise and manage these risks. Such means may be either physical, (e.g.
remediation of the land or containment of contaminants) and/or contractual (e.g. legal agreements to
apportion liability as part of property leases or sales). However, if significant uncertainties remain, they
may also include the requirement to better define the nature and scale of the risk(s) though further
investigation.
Potential sources of ground contamination have been identified above as heavy metals, sulphide, sulphate,
cyanide, hydrocarbons, phenols, creosote, ammonia and its derivatives, asbestos and solvents. The main
pollutant linkage at the site relating to human health is considered to be construction workers in direct
contact with potential contamination in the near surface soils and groundwater. The strata underlying the
site are designated as Unproductive Strata by the Environment Agency and therefore not considered a
sensitive receptor. Similarly, there is unlikely to be a groundwater pathway owing to the absence of mobile
groundwater.
6.2 Risks associated with commercial/ industrial proposed end use.
6.2.1 Standards Employed
The definition of ‘contaminated land’ and the regulatory background to the Phase II assessment
methodology is provided in Appendix I.
6.2.2 Contaminant Concentration Guideline Values
As a first stage of assessment, to address the potential risks to human health, the results of the analytical
testing on soil samples have been compared to currently available Contaminated Land Exposure
Assessment (CLEA) Soil Guideline Values (SGVs), published by the Environment Agency in Science
Report SC050021 (EA, 2009), where available. For the proposed development at the Boston Barrier, the
SGVs relating to commercial/ industrial end-uses have been applied as appropriate screening criteria to
inform this generic quantitative risk assessment.
6 Phase II Contaminated Land Assessment
Boston Barrier Ground Investigation Report
335092/WCD/WAM/01/A 07 February 2015 pims/339200 Boston Barrier TWAO/Products/Design Products/GI/GIR
64
For substances for which CLEA SGV values are not published, the results have been assessed using a
variety of guidance in accordance with current practice and these are presented below in order of
hierarchy:
i. Soil Guideline Values (SGV), published by the EA (EA, 2009)
ii. Land Quality Management (LQM)/ Chartered Institute of Environmental Health (CIEH) Generic
Assessment Criteria (GACs) 2nd
Edition (LQM, 2009)
iii. Withdrawn SGV, published by the EA in the Contaminated Land Exposure Assessment (CLEA)
guidance (DEFRA, 2002)
iv. Contaminated Land Applications in Real Environments (CL:AIRE) Soil Generic Assessment
Criteria (CL:AIRE, 2009).
Risks to the aqueous environment (groundwater and surface water) are generally assessed in the UK by
reference to the Environment Agency’s Remedial Targets Methodology (EA, 2006). This allows remedial
target concentrations for leachate extracts and groundwater to be derived for selected contaminants. The
methodology is a tiered approach, with a remedial target being derived at the end of each tier, which would
provide sufficient protection of controlled water resources. Although there is considered to be no
groundwater source, pathway or receptor, there is potential for intrusive works to mobilise contaminants
bound to soil matrix that could migrate into the surface water feature(s) via surface water run-off
The Environmental Permitting Regulations (2010) aim to protect groundwater from pollution by controlling
the inputs of potentially harmful and polluting substances. The Regulations implement the Water
Framework Directive (2000/60/EC) and the Groundwater Directive on the Protection of Groundwater
against Pollution and Deterioration (2006/118/EC). Substances controlled under these Regulations fall into
two lists:
Hazardous substances (H) are the most toxic and must be prevented from entering groundwater.
Non-hazardous pollutants (NH) are less toxic but could be harmful to groundwater, and the entry of
these substances into groundwater must be limited.
A hazardous substance is considered to be non-compliant if a concentration exceeding the EA’s Minimum
Reporting Value (MRV) or, where there is no published MRV the laboratory Method Detection Limit (MDL),
is found in groundwater.
Non-hazardous pollutants can be discharged to groundwater under a permit, but must not cause pollution.
The concentration level which is considered to cause pollution depends on the use of the receptor. For
surface water receptors, a non-hazardous pollutant is considered to be non-compliant if the concentration
exceeds the Environmental Quality Standard (EQS).
For the Boston Barrier site, the most significant receptor is considered to be the River Haven as there is no
groundwater source, pathway or receptor. Therefore the EQS values have been used for comparison in
the first instance, with consideration of drinking water standards (DWS) where no EQS are available.
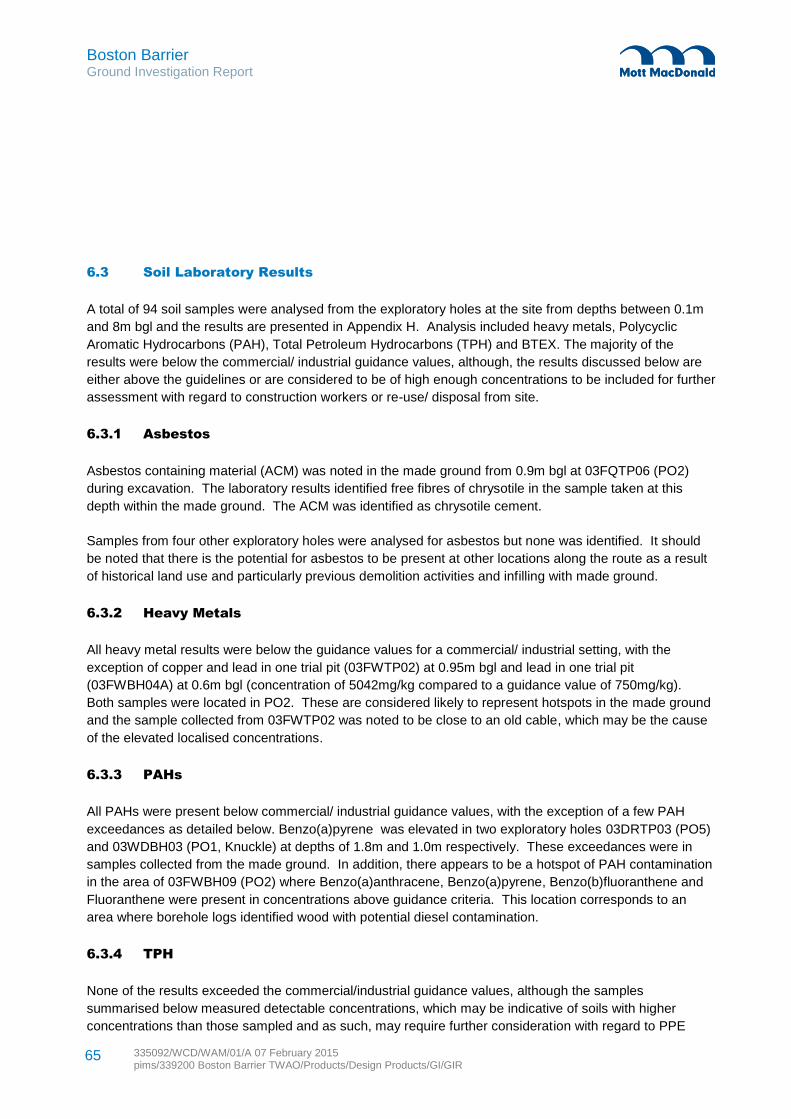
Boston Barrier Ground Investigation Report
335092/WCD/WAM/01/A 07 February 2015 pims/339200 Boston Barrier TWAO/Products/Design Products/GI/GIR
65
6.3 Soil Laboratory Results
A total of 94 soil samples were analysed from the exploratory holes at the site from depths between 0.1m
and 8m bgl and the results are presented in Appendix H. Analysis included heavy metals, Polycyclic
Aromatic Hydrocarbons (PAH), Total Petroleum Hydrocarbons (TPH) and BTEX. The majority of the
results were below the commercial/ industrial guidance values, although, the results discussed below are
either above the guidelines or are considered to be of high enough concentrations to be included for further
assessment with regard to construction workers or re-use/ disposal from site.
6.3.1 Asbestos
Asbestos containing material (ACM) was noted in the made ground from 0.9m bgl at 03FQTP06 (PO2)
during excavation. The laboratory results identified free fibres of chrysotile in the sample taken at this
depth within the made ground. The ACM was identified as chrysotile cement.
Samples from four other exploratory holes were analysed for asbestos but none was identified. It should
be noted that there is the potential for asbestos to be present at other locations along the route as a result
of historical land use and particularly previous demolition activities and infilling with made ground.
6.3.2 Heavy Metals
All heavy metal results were below the guidance values for a commercial/ industrial setting, with the
exception of copper and lead in one trial pit (03FWTP02) at 0.95m bgl and lead in one trial pit
(03FWBH04A) at 0.6m bgl (concentration of 5042mg/kg compared to a guidance value of 750mg/kg).
Both samples were located in PO2. These are considered likely to represent hotspots in the made ground
and the sample collected from 03FWTP02 was noted to be close to an old cable, which may be the cause
of the elevated localised concentrations.
6.3.3 PAHs
All PAHs were present below commercial/ industrial guidance values, with the exception of a few PAH
exceedances as detailed below. Benzo(a)pyrene was elevated in two exploratory holes 03DRTP03 (PO5)
and 03WDBH03 (PO1, Knuckle) at depths of 1.8m and 1.0m respectively. These exceedances were in
samples collected from the made ground. In addition, there appears to be a hotspot of PAH contamination
in the area of 03FWBH09 (PO2) where Benzo(a)anthracene, Benzo(a)pyrene, Benzo(b)fluoranthene and
Fluoranthene were present in concentrations above guidance criteria. This location corresponds to an
area where borehole logs identified wood with potential diesel contamination.
6.3.4 TPH
None of the results exceeded the commercial/industrial guidance values, although the samples
summarised below measured detectable concentrations, which may be indicative of soils with higher
concentrations than those sampled and as such, may require further consideration with regard to PPE
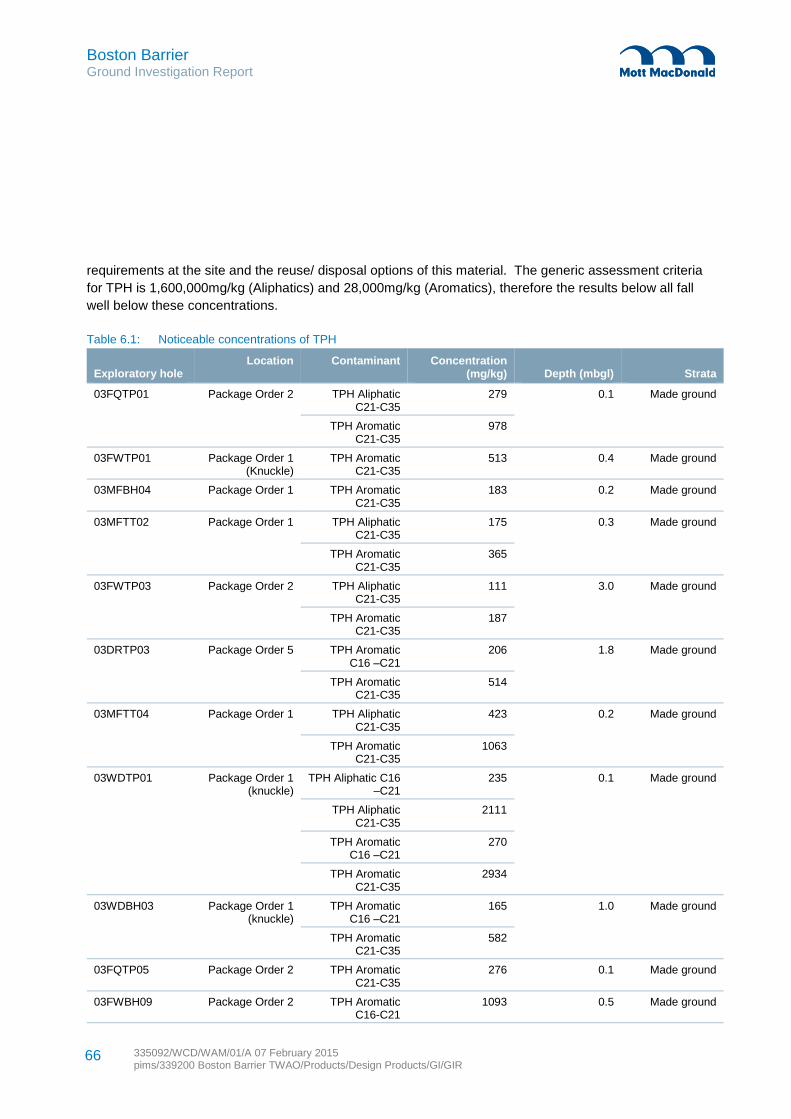
Boston Barrier Ground Investigation Report
335092/WCD/WAM/01/A 07 February 2015 pims/339200 Boston Barrier TWAO/Products/Design Products/GI/GIR
66
requirements at the site and the reuse/ disposal options of this material. The generic assessment criteria
for TPH is 1,600,000mg/kg (Aliphatics) and 28,000mg/kg (Aromatics), therefore the results below all fall
well below these concentrations.
Table 6.1: Noticeable concentrations of TPH
Exploratory hole Location Contaminant Concentration
(mg/kg) Depth (mbgl) Strata
03FQTP01 Package Order 2 TPH Aliphatic C21-C35
279 0.1 Made ground
TPH Aromatic C21-C35
978
03FWTP01 Package Order 1 (Knuckle)
TPH Aromatic C21-C35
513 0.4 Made ground
03MFBH04 Package Order 1 TPH Aromatic C21-C35
183 0.2 Made ground
03MFTT02 Package Order 1 TPH Aliphatic C21-C35
175 0.3 Made ground
TPH Aromatic C21-C35
365
03FWTP03 Package Order 2 TPH Aliphatic C21-C35
111 3.0 Made ground
TPH Aromatic C21-C35
187
03DRTP03 Package Order 5 TPH Aromatic C16 –C21
206 1.8 Made ground
TPH Aromatic C21-C35
514
03MFTT04 Package Order 1 TPH Aliphatic C21-C35
423 0.2 Made ground
TPH Aromatic C21-C35
1063
03WDTP01 Package Order 1 (knuckle)
TPH Aliphatic C16 –C21
235 0.1 Made ground
TPH Aliphatic C21-C35
2111
TPH Aromatic C16 –C21
270
TPH Aromatic C21-C35
2934
03WDBH03 Package Order 1 (knuckle)
TPH Aromatic C16 –C21
165 1.0 Made ground
TPH Aromatic C21-C35
582
03FQTP05 Package Order 2 TPH Aromatic C21-C35
276 0.1 Made ground
03FWBH09 Package Order 2 TPH Aromatic C16-C21
1093 0.5 Made ground
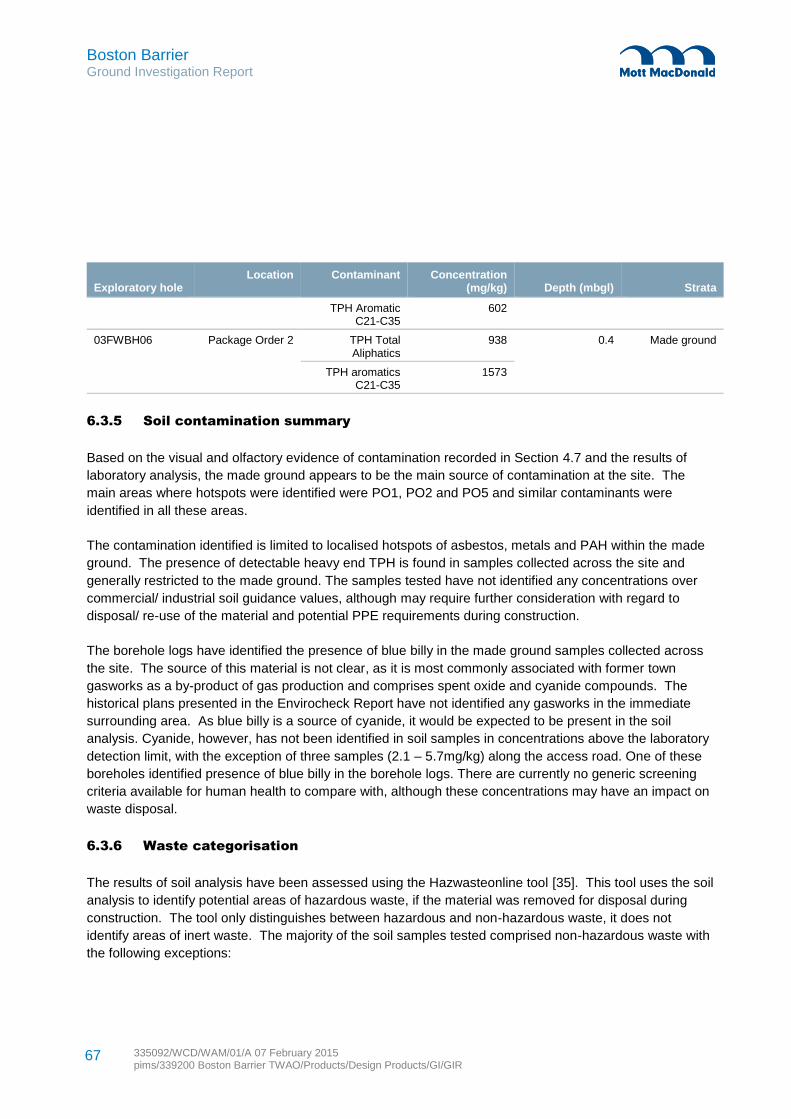
Boston Barrier Ground Investigation Report
335092/WCD/WAM/01/A 07 February 2015 pims/339200 Boston Barrier TWAO/Products/Design Products/GI/GIR
67
Exploratory hole Location Contaminant Concentration
(mg/kg) Depth (mbgl) Strata
TPH Aromatic C21-C35
602
03FWBH06 Package Order 2 TPH Total Aliphatics
938 0.4 Made ground
TPH aromatics C21-C35
1573
6.3.5 Soil contamination summary
Based on the visual and olfactory evidence of contamination recorded in Section 4.7 and the results of
laboratory analysis, the made ground appears to be the main source of contamination at the site. The
main areas where hotspots were identified were PO1, PO2 and PO5 and similar contaminants were
identified in all these areas.
The contamination identified is limited to localised hotspots of asbestos, metals and PAH within the made
ground. The presence of detectable heavy end TPH is found in samples collected across the site and
generally restricted to the made ground. The samples tested have not identified any concentrations over
commercial/ industrial soil guidance values, although may require further consideration with regard to
disposal/ re-use of the material and potential PPE requirements during construction.
The borehole logs have identified the presence of blue billy in the made ground samples collected across
the site. The source of this material is not clear, as it is most commonly associated with former town
gasworks as a by-product of gas production and comprises spent oxide and cyanide compounds. The
historical plans presented in the Envirocheck Report have not identified any gasworks in the immediate
surrounding area. As blue billy is a source of cyanide, it would be expected to be present in the soil
analysis. Cyanide, however, has not been identified in soil samples in concentrations above the laboratory
detection limit, with the exception of three samples (2.1 – 5.7mg/kg) along the access road. One of these
boreholes identified presence of blue billy in the borehole logs. There are currently no generic screening
criteria available for human health to compare with, although these concentrations may have an impact on
waste disposal.
6.3.6 Waste categorisation
The results of soil analysis have been assessed using the Hazwasteonline tool [35]. This tool uses the soil
analysis to identify potential areas of hazardous waste, if the material was removed for disposal during
construction. The tool only distinguishes between hazardous and non-hazardous waste, it does not
identify areas of inert waste. The majority of the soil samples tested comprised non-hazardous waste with
the following exceptions:
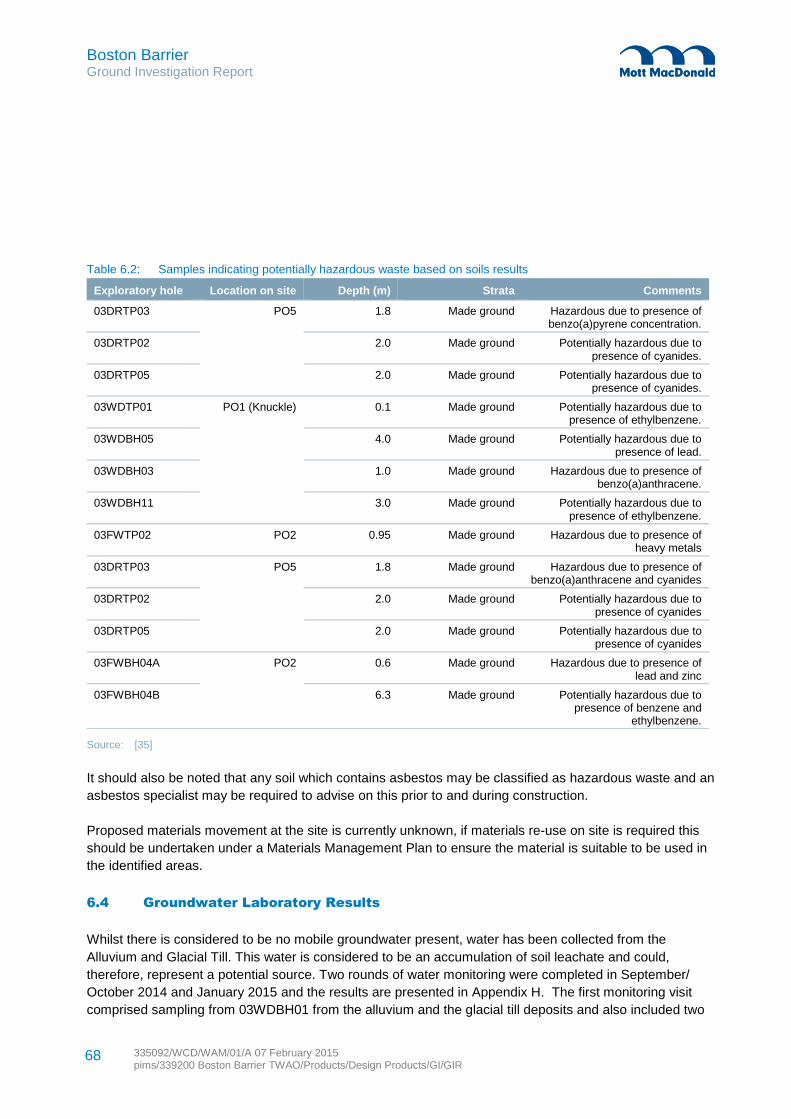
Boston Barrier Ground Investigation Report
335092/WCD/WAM/01/A 07 February 2015 pims/339200 Boston Barrier TWAO/Products/Design Products/GI/GIR
68
Table 6.2: Samples indicating potentially hazardous waste based on soils results
Exploratory hole Location on site Depth (m) Strata Comments
03DRTP03 PO5 1.8 Made ground Hazardous due to presence of benzo(a)pyrene concentration.
03DRTP02 2.0 Made ground Potentially hazardous due to presence of cyanides.
03DRTP05 2.0 Made ground Potentially hazardous due to presence of cyanides.
03WDTP01 PO1 (Knuckle) 0.1 Made ground Potentially hazardous due to presence of ethylbenzene.
03WDBH05 4.0 Made ground Potentially hazardous due to presence of lead.
03WDBH03 1.0 Made ground Hazardous due to presence of benzo(a)anthracene.
03WDBH11 3.0 Made ground Potentially hazardous due to presence of ethylbenzene.
03FWTP02 PO2 0.95 Made ground Hazardous due to presence of heavy metals
03DRTP03 PO5 1.8 Made ground Hazardous due to presence of benzo(a)anthracene and cyanides
03DRTP02 2.0 Made ground Potentially hazardous due to presence of cyanides
03DRTP05 2.0 Made ground Potentially hazardous due to presence of cyanides
03FWBH04A PO2 0.6 Made ground Hazardous due to presence of lead and zinc
03FWBH04B 6.3 Made ground Potentially hazardous due to presence of benzene and
ethylbenzene.
Source: [35]
It should also be noted that any soil which contains asbestos may be classified as hazardous waste and an
asbestos specialist may be required to advise on this prior to and during construction.
Proposed materials movement at the site is currently unknown, if materials re-use on site is required this
should be undertaken under a Materials Management Plan to ensure the material is suitable to be used in
the identified areas.
6.4 Groundwater Laboratory Results
Whilst there is considered to be no mobile groundwater present, water has been collected from the
Alluvium and Glacial Till. This water is considered to be an accumulation of soil leachate and could,
therefore, represent a potential source. Two rounds of water monitoring were completed in September/
October 2014 and January 2015 and the results are presented in Appendix H. The first monitoring visit
comprised sampling from 03WDBH01 from the alluvium and the glacial till deposits and also included two
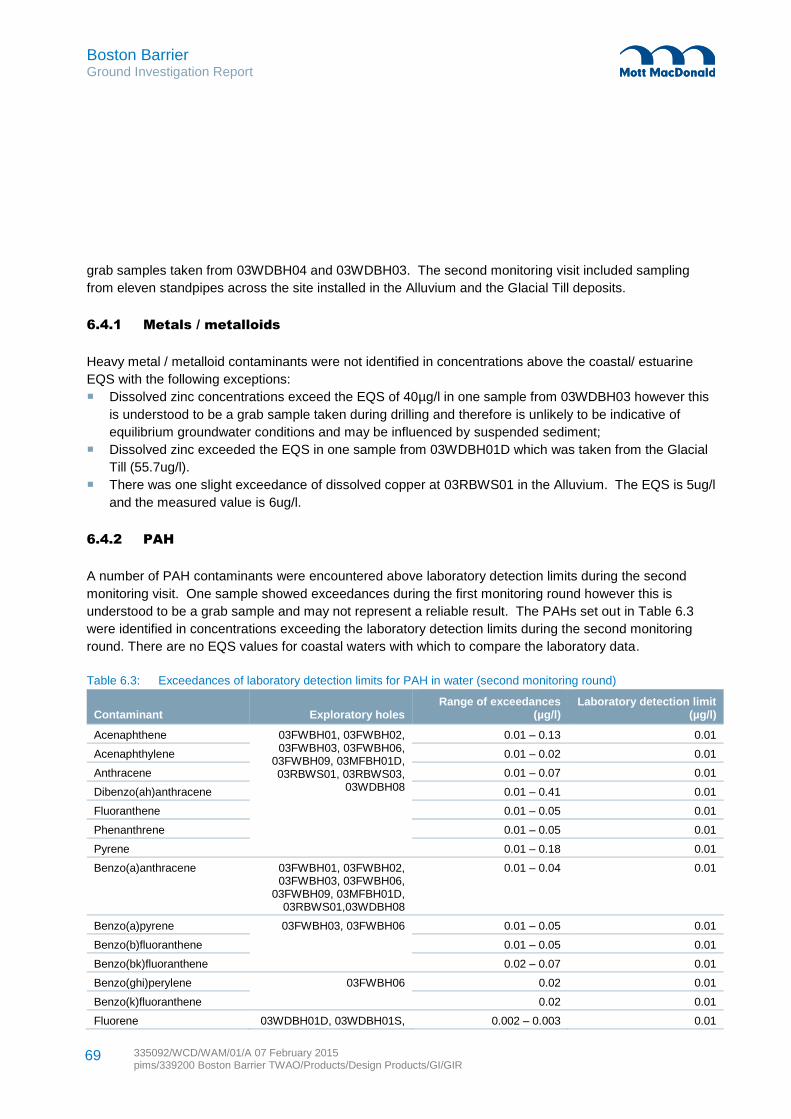
Boston Barrier Ground Investigation Report
335092/WCD/WAM/01/A 07 February 2015 pims/339200 Boston Barrier TWAO/Products/Design Products/GI/GIR
69
grab samples taken from 03WDBH04 and 03WDBH03. The second monitoring visit included sampling
from eleven standpipes across the site installed in the Alluvium and the Glacial Till deposits.
6.4.1 Metals / metalloids
Heavy metal / metalloid contaminants were not identified in concentrations above the coastal/ estuarine
EQS with the following exceptions:
Dissolved zinc concentrations exceed the EQS of 40µg/l in one sample from 03WDBH03 however this
is understood to be a grab sample taken during drilling and therefore is unlikely to be indicative of
equilibrium groundwater conditions and may be influenced by suspended sediment;
Dissolved zinc exceeded the EQS in one sample from 03WDBH01D which was taken from the Glacial
Till (55.7ug/l).
There was one slight exceedance of dissolved copper at 03RBWS01 in the Alluvium. The EQS is 5ug/l
and the measured value is 6ug/l.
6.4.2 PAH
A number of PAH contaminants were encountered above laboratory detection limits during the second
monitoring visit. One sample showed exceedances during the first monitoring round however this is
understood to be a grab sample and may not represent a reliable result. The PAHs set out in Table 6.3
were identified in concentrations exceeding the laboratory detection limits during the second monitoring
round. There are no EQS values for coastal waters with which to compare the laboratory data.
Table 6.3: Exceedances of laboratory detection limits for PAH in water (second monitoring round)
Contaminant Exploratory holes Range of exceedances
(µg/l) Laboratory detection limit
(µg/l)
Acenaphthene 03FWBH01, 03FWBH02, 03FWBH03, 03FWBH06,
03FWBH09, 03MFBH01D, 03RBWS01, 03RBWS03,
03WDBH08
0.01 – 0.13 0.01
Acenaphthylene 0.01 – 0.02 0.01
Anthracene 0.01 – 0.07 0.01
Dibenzo(ah)anthracene 0.01 – 0.41 0.01
Fluoranthene 0.01 – 0.05 0.01
Phenanthrene 0.01 – 0.05 0.01
Pyrene 0.01 – 0.18 0.01
Benzo(a)anthracene 03FWBH01, 03FWBH02, 03FWBH03, 03FWBH06,
03FWBH09, 03MFBH01D, 03RBWS01,03WDBH08
0.01 – 0.04 0.01
Benzo(a)pyrene 03FWBH03, 03FWBH06 0.01 – 0.05 0.01
Benzo(b)fluoranthene 0.01 – 0.05 0.01
Benzo(bk)fluoranthene 0.02 – 0.07 0.01
Benzo(ghi)perylene 03FWBH06 0.02 0.01
Benzo(k)fluoranthene 0.02 0.01
Fluorene 03WDBH01D, 03WDBH01S, 0.002 – 0.003 0.01
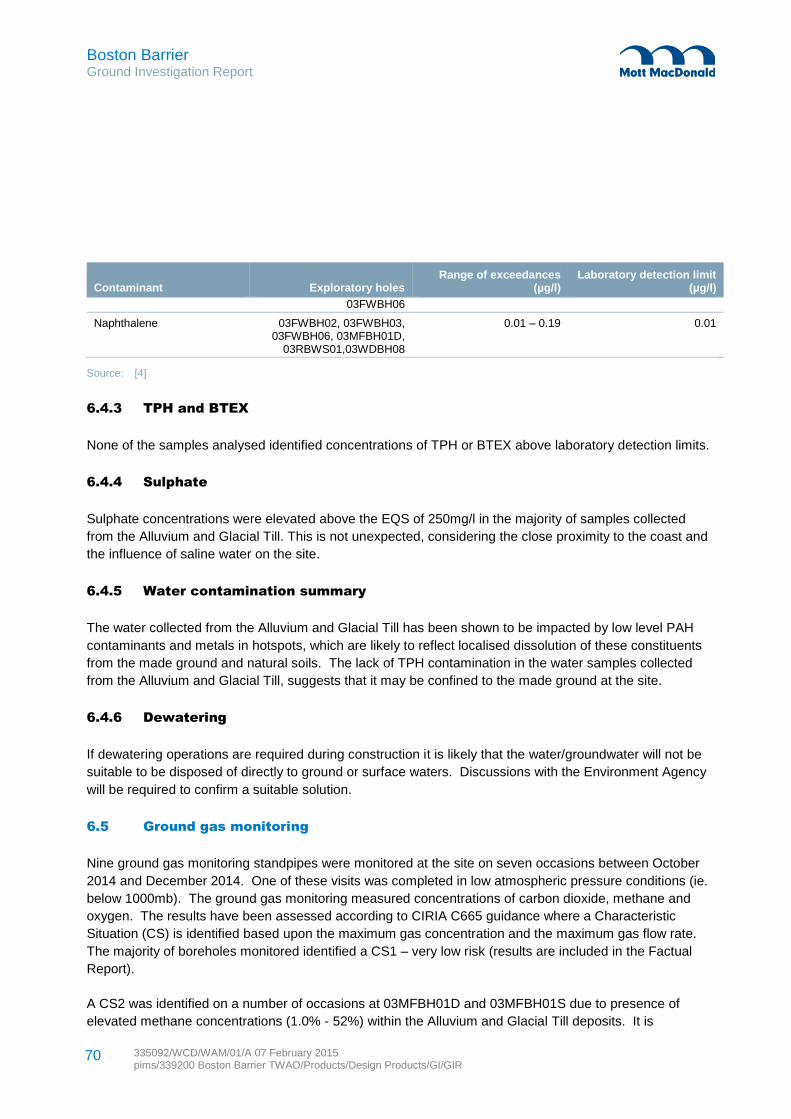
Boston Barrier Ground Investigation Report
335092/WCD/WAM/01/A 07 February 2015 pims/339200 Boston Barrier TWAO/Products/Design Products/GI/GIR
70
Contaminant Exploratory holes Range of exceedances
(µg/l) Laboratory detection limit
(µg/l)
03FWBH06
Naphthalene 03FWBH02, 03FWBH03, 03FWBH06, 03MFBH01D,
03RBWS01,03WDBH08
0.01 – 0.19 0.01
Source: [4]
6.4.3 TPH and BTEX
None of the samples analysed identified concentrations of TPH or BTEX above laboratory detection limits.
6.4.4 Sulphate
Sulphate concentrations were elevated above the EQS of 250mg/l in the majority of samples collected
from the Alluvium and Glacial Till. This is not unexpected, considering the close proximity to the coast and
the influence of saline water on the site.
6.4.5 Water contamination summary
The water collected from the Alluvium and Glacial Till has been shown to be impacted by low level PAH
contaminants and metals in hotspots, which are likely to reflect localised dissolution of these constituents
from the made ground and natural soils. The lack of TPH contamination in the water samples collected
from the Alluvium and Glacial Till, suggests that it may be confined to the made ground at the site.
6.4.6 Dewatering
If dewatering operations are required during construction it is likely that the water/groundwater will not be
suitable to be disposed of directly to ground or surface waters. Discussions with the Environment Agency
will be required to confirm a suitable solution.
6.5 Ground gas monitoring
Nine ground gas monitoring standpipes were monitored at the site on seven occasions between October
2014 and December 2014. One of these visits was completed in low atmospheric pressure conditions (ie.
below 1000mb). The ground gas monitoring measured concentrations of carbon dioxide, methane and
oxygen. The results have been assessed according to CIRIA C665 guidance where a Characteristic
Situation (CS) is identified based upon the maximum gas concentration and the maximum gas flow rate.
The majority of boreholes monitored identified a CS1 – very low risk (results are included in the Factual
Report).
A CS2 was identified on a number of occasions at 03MFBH01D and 03MFBH01S due to presence of
elevated methane concentrations (1.0% - 52%) within the Alluvium and Glacial Till deposits. It is
Boston Barrier Ground Investigation Report
335092/WCD/WAM/01/A 07 February 2015 pims/339200 Boston Barrier TWAO/Products/Design Products/GI/GIR
71
considered likely that this is due to the presence of peat deposits within the alluvial materials. This location
is in PO1 and the contractor should take the presence of methane into account in their risk assessments to
ensure appropriate personal protective equipment (PPE) is used particularly in excavations. A CS2 was
also identified at 03BBBH01 in the made ground on two occasions due to elevated concentrations of
carbon dioxide (5.4 – 6.7%). This borehole targeted the area of the proposed control building and
therefore the results suggest that gas protection measures will be required in this building. Gas protection
measures should be designed in accordance with CIRIA C665.
6.6 Discussion of the Phase II Contamination Results
6.6.1 Phase II Contamination Results in Context
Based upon the visual and olfactory evidence of contamination recorded in Section 4.7 and the results of
laboratory analysis, the made ground appears to be the main source of contamination at the site. The
contamination identified is limited to localised hotspots of asbestos, metals and PAH within the made
ground. Presence of TPH is noted to be widespread across the site at low concentrations marginally
above detection, and generally restricted to the made ground, the samples tested have not identified any
concentrations over commercial/ industrial soil guidance values, although these detectable concentrations
may have an influence on the disposal/ re-use of the material and potential PPE requirements during
construction.
Hotspots have been identified in soils from PO1, PO2 and PO5 and generally comprise similar
contaminants. The hotspots identified within PO5 may be related to the historical landfill in the area.
The borehole logs have identified the presence of blue billy in the made ground across the site, the source
of this material is not clear as it is a by-product of gasworks sites. The historical plans presented in the
Envirocheck Report have not identified any gasworks in the immediate surrounding area. Blue billy is a
waste product of former gasworks and a source of cyanide. Despite this, cyanide was not identified in the
majority of soil samples in concentrations above the laboratory detection limit, with the exception of three
samples (2.1 – 5.7mg/kg), only one of which was in an area recorded as having blue billy present.
The water in the Alluvium and Glacial Till has been shown to be impacted by low level PAH contaminants
and metals in hotspots. The lack of TPH contamination in the groundwater suggests that it is likely to be
confined to the made ground soil at the site.
Ground gas monitoring has identified elevated concentrations of methane in PO1 and elevated
concentrations of carbon dioxide in PO2 in the area of the proposed control building. The control building
is likely to require gas protection measures to mitigate this risk.
6.6.2 Revised Conceptual Site Model
A key element of the Risk Assessment is the development of a conceptual site model (CSM) which may be
refined or revised as more information and understanding is obtained through the risk assessment
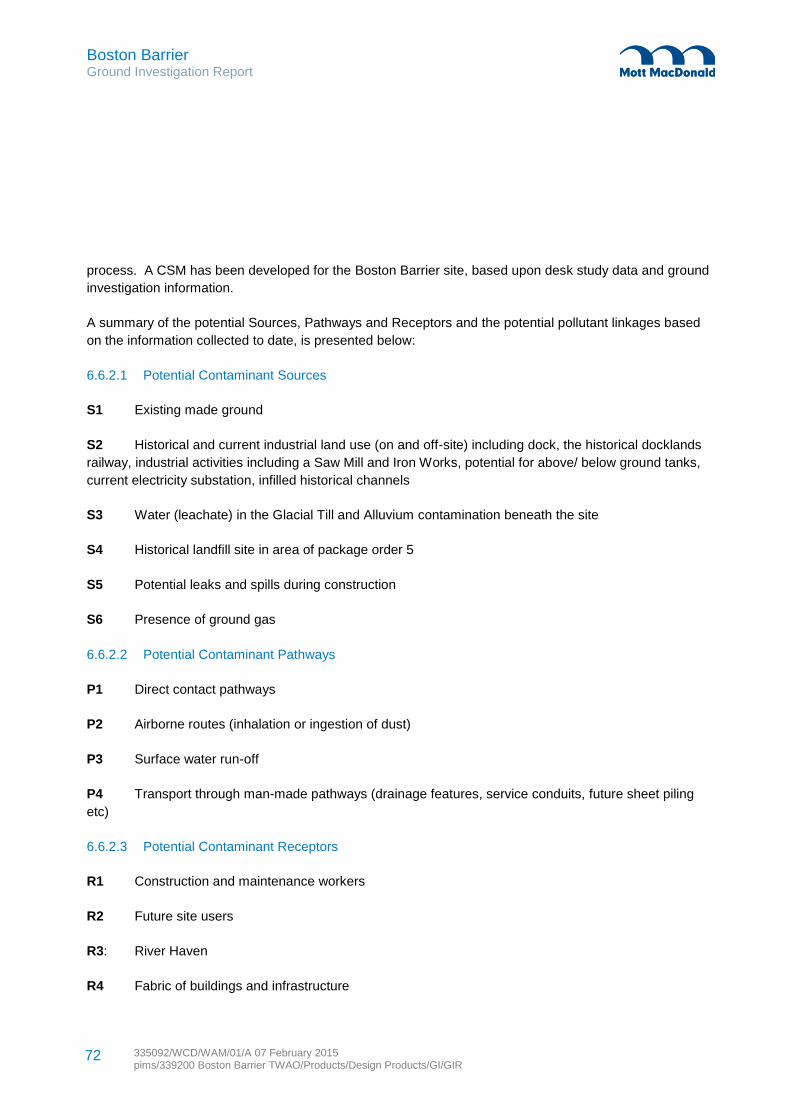
Boston Barrier Ground Investigation Report
335092/WCD/WAM/01/A 07 February 2015 pims/339200 Boston Barrier TWAO/Products/Design Products/GI/GIR
72
process. A CSM has been developed for the Boston Barrier site, based upon desk study data and ground
investigation information.
A summary of the potential Sources, Pathways and Receptors and the potential pollutant linkages based
on the information collected to date, is presented below:
6.6.2.1 Potential Contaminant Sources
S1 Existing made ground
S2 Historical and current industrial land use (on and off-site) including dock, the historical docklands
railway, industrial activities including a Saw Mill and Iron Works, potential for above/ below ground tanks,
current electricity substation, infilled historical channels
S3 Water (leachate) in the Glacial Till and Alluvium contamination beneath the site
S4 Historical landfill site in area of package order 5
S5 Potential leaks and spills during construction
S6 Presence of ground gas
6.6.2.2 Potential Contaminant Pathways
P1 Direct contact pathways
P2 Airborne routes (inhalation or ingestion of dust)
P3 Surface water run-off
P4 Transport through man-made pathways (drainage features, service conduits, future sheet piling
etc)
6.6.2.3 Potential Contaminant Receptors
R1 Construction and maintenance workers
R2 Future site users
R3: River Haven
R4 Fabric of buildings and infrastructure
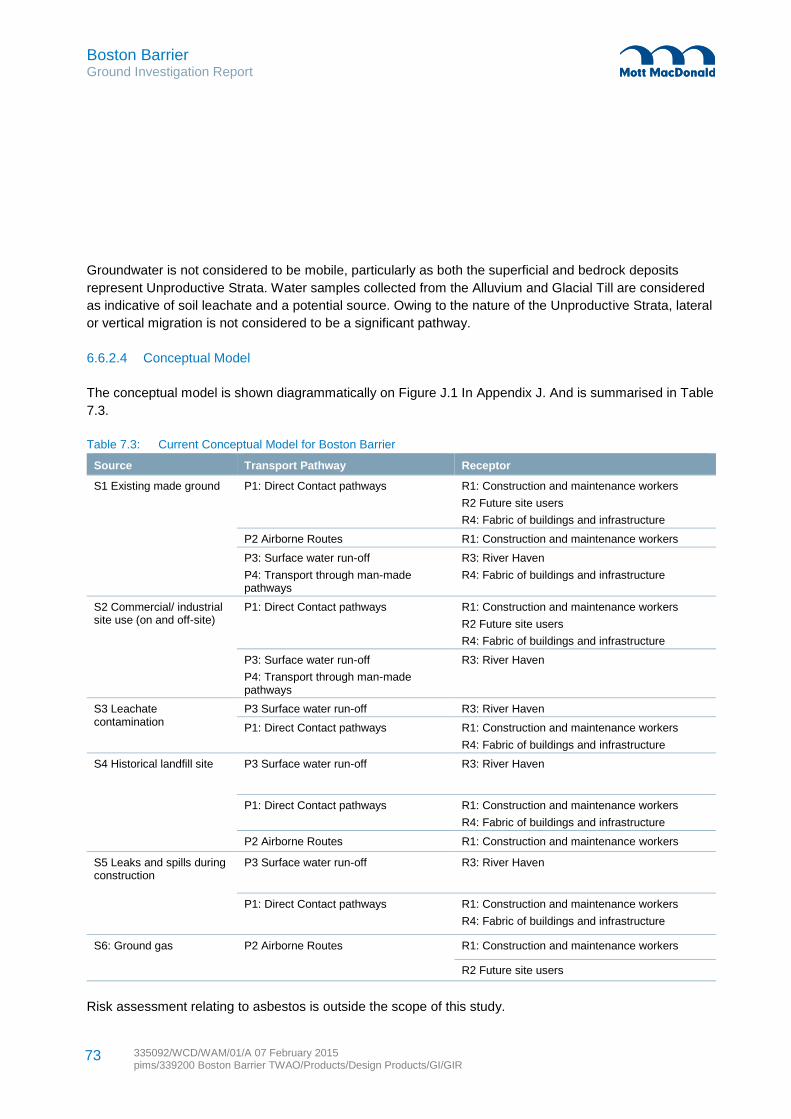
Boston Barrier Ground Investigation Report
335092/WCD/WAM/01/A 07 February 2015 pims/339200 Boston Barrier TWAO/Products/Design Products/GI/GIR
73
Groundwater is not considered to be mobile, particularly as both the superficial and bedrock deposits
represent Unproductive Strata. Water samples collected from the Alluvium and Glacial Till are considered
as indicative of soil leachate and a potential source. Owing to the nature of the Unproductive Strata, lateral
or vertical migration is not considered to be a significant pathway.
6.6.2.4 Conceptual Model
The conceptual model is shown diagrammatically on Figure J.1 In Appendix J. And is summarised in Table
7.3.
Table 7.3: Current Conceptual Model for Boston Barrier
Source Transport Pathway Receptor
S1 Existing made ground
P1: Direct Contact pathways
R1: Construction and maintenance workers
R2 Future site users
R4: Fabric of buildings and infrastructure
P2 Airborne Routes R1: Construction and maintenance workers
P3: Surface water run-off
P4: Transport through man-made pathways
R3: River Haven
R4: Fabric of buildings and infrastructure
S2 Commercial/ industrial site use (on and off-site)
P1: Direct Contact pathways R1: Construction and maintenance workers
R2 Future site users
R4: Fabric of buildings and infrastructure
P3: Surface water run-off
P4: Transport through man-made pathways
R3: River Haven
S3 Leachate contamination
P3 Surface water run-off R3: River Haven
P1: Direct Contact pathways R1: Construction and maintenance workers
R4: Fabric of buildings and infrastructure
S4 Historical landfill site P3 Surface water run-off R3: River Haven
P1: Direct Contact pathways R1: Construction and maintenance workers
R4: Fabric of buildings and infrastructure
P2 Airborne Routes R1: Construction and maintenance workers
S5 Leaks and spills during construction
P3 Surface water run-off R3: River Haven
P1: Direct Contact pathways R1: Construction and maintenance workers
R4: Fabric of buildings and infrastructure
S6: Ground gas P2 Airborne Routes R1: Construction and maintenance workers
R2 Future site users
Risk assessment relating to asbestos is outside the scope of this study.
Boston Barrier Ground Investigation Report
335092/WCD/WAM/01/A 07 February 2015 pims/339200 Boston Barrier TWAO/Products/Design Products/GI/GIR
74
6.6.3 Construction Details
An overview of the outline design is included in section 2.1, the key elements of which are:
Sheet piling down to -11mAOD on the Right Embankment (PO4) which is within the Glacial Till.
Mini piling down to -4.24m AOD with the PoB, again into the Glacial Till (PO1 and PO2)
A barrier control building proximal to the barrier (PO2)
Removal of some the Knuckle (PO1).
It is understood from the above that the ground surface will remain hardstanding following construction.
The control building is likely to be piled due to the ground conditions to a depth of -4mAOD.
Plans relating to the proposed development considered for this report can be found in the PAR [1] .
6.6.4 Qualitative Risk Assessment
The risks have been evaluated using the criteria in Appendix G; I.2 (Risk Categorisation tables).
Summarises the potential risks at the site, using CIRIA guidance, based on results from the soil and
groundwater monitoring and using the identified sources, pathways and receptors.
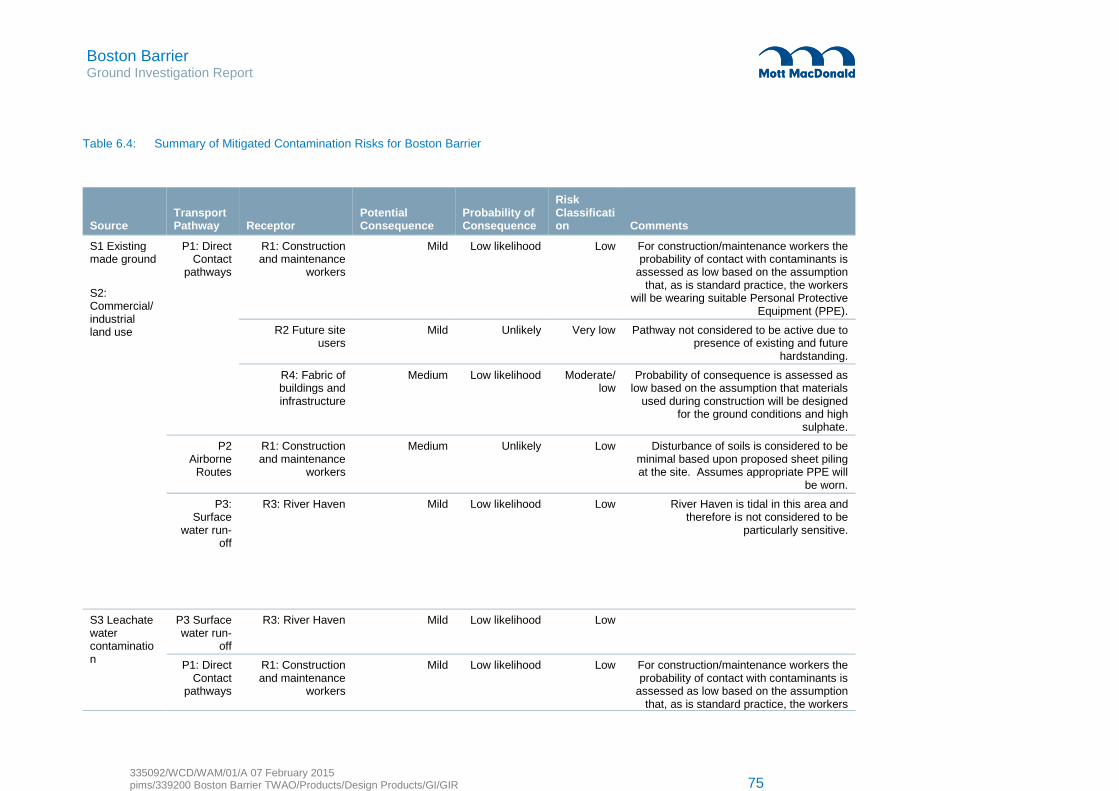
Boston Barrier Ground Investigation Report
335092/WCD/WAM/01/A 07 February 2015 pims/339200 Boston Barrier TWAO/Products/Design Products/GI/GIR 75
Table 6.4: Summary of Mitigated Contamination Risks for Boston Barrier
Source Transport Pathway Receptor
Potential Consequence
Probability of Consequence
Risk Classification Comments
S1 Existing made ground
S2: Commercial/ industrial land use
P1: Direct Contact
pathways
R1: Construction and maintenance
workers
Mild Low likelihood Low For construction/maintenance workers the probability of contact with contaminants is
assessed as low based on the assumption that, as is standard practice, the workers
will be wearing suitable Personal Protective Equipment (PPE).
R2 Future site users
Mild Unlikely Very low Pathway not considered to be active due to presence of existing and future
hardstanding.
R4: Fabric of buildings and infrastructure
Medium Low likelihood Moderate/ low
Probability of consequence is assessed as low based on the assumption that materials
used during construction will be designed for the ground conditions and high
sulphate.
P2 Airborne
Routes
R1: Construction and maintenance
workers
Medium Unlikely Low Disturbance of soils is considered to be minimal based upon proposed sheet piling at the site. Assumes appropriate PPE will
be worn.
P3: Surface
water run-off
R3: River Haven
Mild
Low likelihood
Low
River Haven is tidal in this area and therefore is not considered to be
particularly sensitive.
S3 Leachate water contamination
P3 Surface water run-
off
R3: River Haven
Mild
Low likelihood
Low
P1: Direct Contact
pathways
R1: Construction and maintenance
workers
Mild Low likelihood Low For construction/maintenance workers the probability of contact with contaminants is
assessed as low based on the assumption that, as is standard practice, the workers
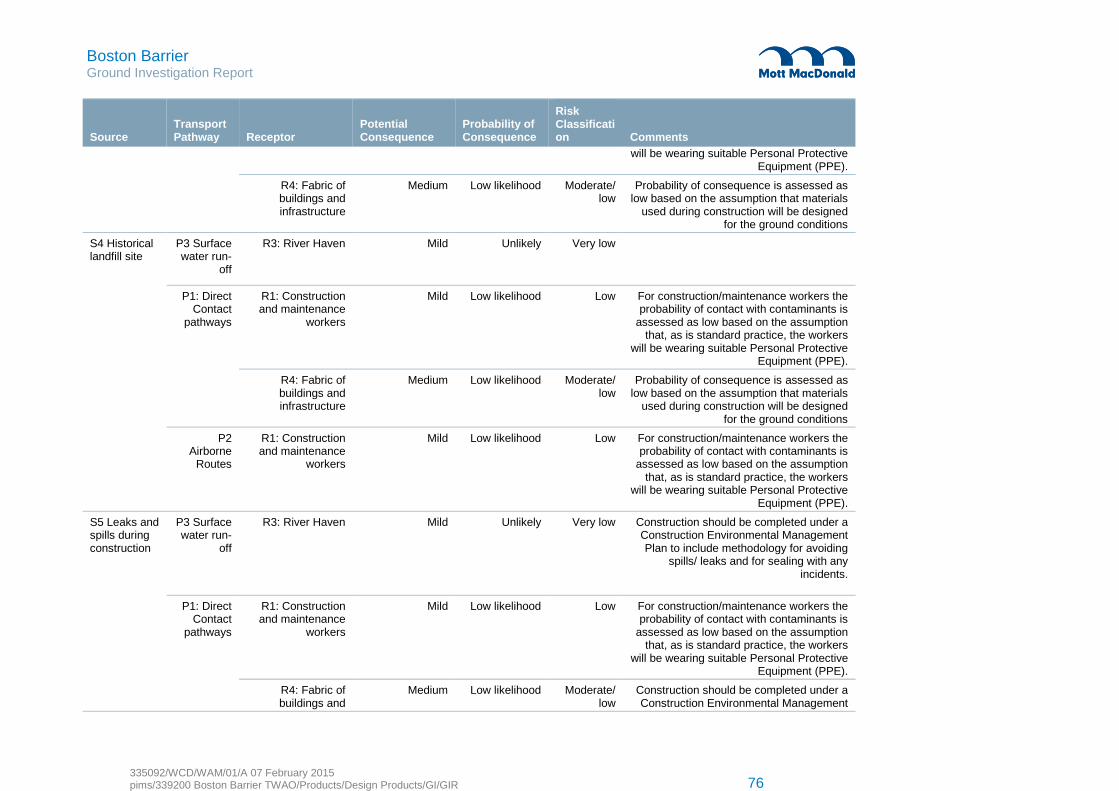
Boston Barrier Ground Investigation Report
335092/WCD/WAM/01/A 07 February 2015 pims/339200 Boston Barrier TWAO/Products/Design Products/GI/GIR 76
Source Transport Pathway Receptor
Potential Consequence
Probability of Consequence
Risk Classification Comments
will be wearing suitable Personal Protective Equipment (PPE).
R4: Fabric of buildings and infrastructure
Medium Low likelihood Moderate/ low
Probability of consequence is assessed as low based on the assumption that materials
used during construction will be designed for the ground conditions
S4 Historical landfill site
P3 Surface water run-
off
R3: River Haven Mild Unlikely Very low
P1: Direct Contact
pathways
R1: Construction and maintenance
workers
Mild Low likelihood Low For construction/maintenance workers the probability of contact with contaminants is
assessed as low based on the assumption that, as is standard practice, the workers
will be wearing suitable Personal Protective Equipment (PPE).
R4: Fabric of buildings and infrastructure
Medium Low likelihood Moderate/ low
Probability of consequence is assessed as low based on the assumption that materials
used during construction will be designed for the ground conditions
P2 Airborne
Routes
R1: Construction and maintenance
workers
Mild Low likelihood Low For construction/maintenance workers the probability of contact with contaminants is
assessed as low based on the assumption that, as is standard practice, the workers
will be wearing suitable Personal Protective Equipment (PPE).
S5 Leaks and spills during construction
P3 Surface water run-
off
R3: River Haven
Mild
Unlikely
Very low
Construction should be completed under a Construction Environmental Management Plan to include methodology for avoiding
spills/ leaks and for sealing with any incidents.
P1: Direct Contact
pathways
R1: Construction and maintenance
workers
Mild Low likelihood Low For construction/maintenance workers the probability of contact with contaminants is
assessed as low based on the assumption that, as is standard practice, the workers
will be wearing suitable Personal Protective Equipment (PPE).
R4: Fabric of buildings and
Medium Low likelihood Moderate/ low
Construction should be completed under a Construction Environmental Management
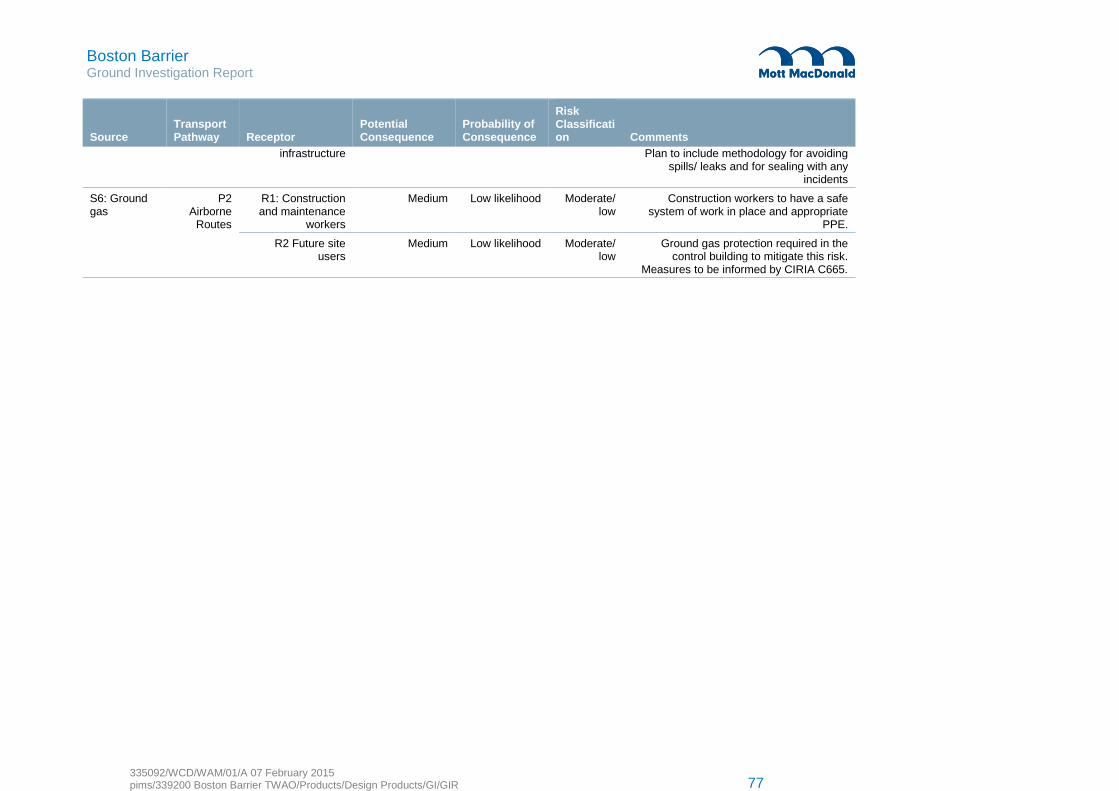
Boston Barrier Ground Investigation Report
335092/WCD/WAM/01/A 07 February 2015 pims/339200 Boston Barrier TWAO/Products/Design Products/GI/GIR 77
Source Transport Pathway Receptor
Potential Consequence
Probability of Consequence
Risk Classification Comments
infrastructure Plan to include methodology for avoiding spills/ leaks and for sealing with any
incidents
S6: Ground gas
P2 Airborne
Routes
R1: Construction and maintenance
workers
Medium Low likelihood Moderate/ low
Construction workers to have a safe system of work in place and appropriate
PPE.
R2 Future site users
Medium Low likelihood Moderate/ low
Ground gas protection required in the control building to mitigate this risk.
Measures to be informed by CIRIA C665.

Boston Barrier Ground Investigation Report
335092/WCD/WAM/01/A 07 February 2015 pims/339200 Boston Barrier TWAO/Products/Design Products/GI/GIR
78
7 Risk Register
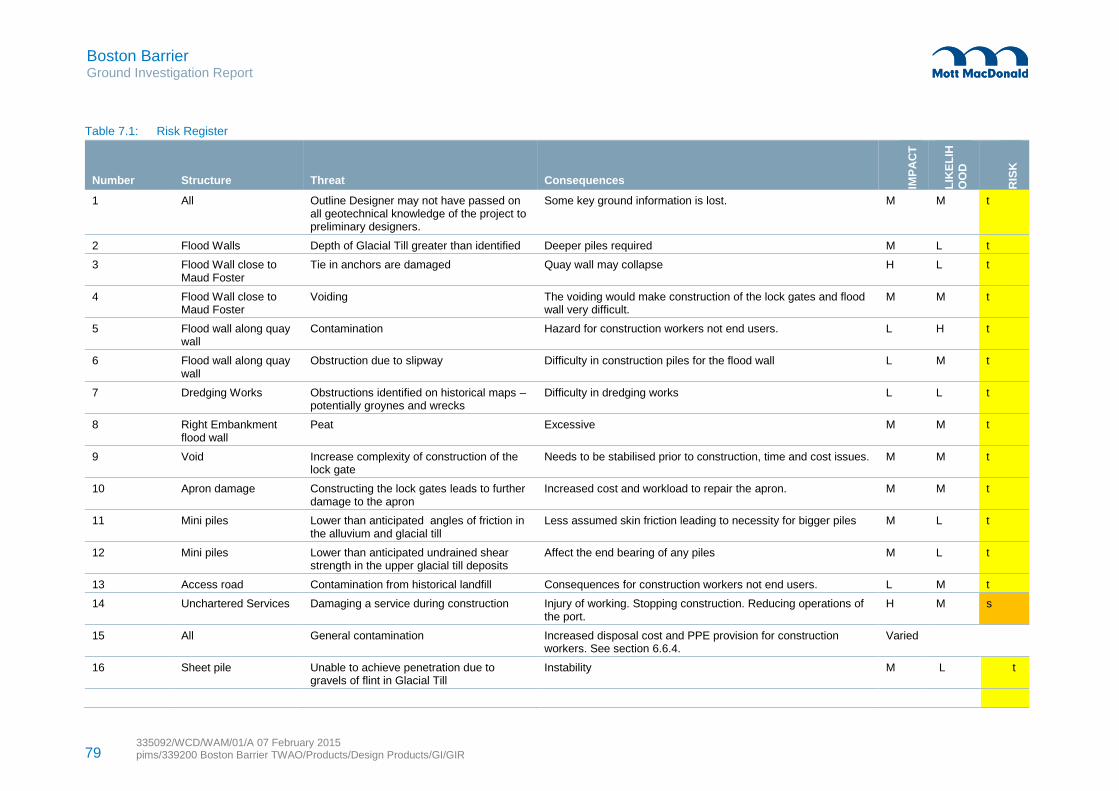
79 335092/WCD/WAM/01/A 07 February 2015 pims/339200 Boston Barrier TWAO/Products/Design Products/GI/GIR
Boston Barrier Ground Investigation Report
Table 7.1: Risk Register
Number Structure Threat Consequences IMP
AC
T
LIK
EL
IH
OO
D
RIS
K
1 All Outline Designer may not have passed on all geotechnical knowledge of the project to preliminary designers.
Some key ground information is lost. M M t
2 Flood Walls Depth of Glacial Till greater than identified Deeper piles required M L t
3 Flood Wall close to Maud Foster
Tie in anchors are damaged Quay wall may collapse H L t
4 Flood Wall close to Maud Foster
Voiding The voiding would make construction of the lock gates and flood wall very difficult.
M M t
5 Flood wall along quay wall
Contamination Hazard for construction workers not end users. L H t
6 Flood wall along quay wall
Obstruction due to slipway Difficulty in construction piles for the flood wall L M t
7 Dredging Works Obstructions identified on historical maps – potentially groynes and wrecks
Difficulty in dredging works L L t
8 Right Embankment flood wall
Peat Excessive M M t
9 Void Increase complexity of construction of the lock gate
Needs to be stabilised prior to construction, time and cost issues. M M t
10 Apron damage Constructing the lock gates leads to further damage to the apron
Increased cost and workload to repair the apron. M M t
11 Mini piles Lower than anticipated angles of friction in the alluvium and glacial till
Less assumed skin friction leading to necessity for bigger piles M L t
12 Mini piles Lower than anticipated undrained shear strength in the upper glacial till deposits
Affect the end bearing of any piles M L t
13 Access road Contamination from historical landfill Consequences for construction workers not end users. L M t
14 Unchartered Services Damaging a service during construction Injury of working. Stopping construction. Reducing operations of the port.
H M s
15 All General contamination Increased disposal cost and PPE provision for construction workers. See section 6.6.4.
Varied
16 Sheet pile Unable to achieve penetration due to gravels of flint in Glacial Till
Instability M L t
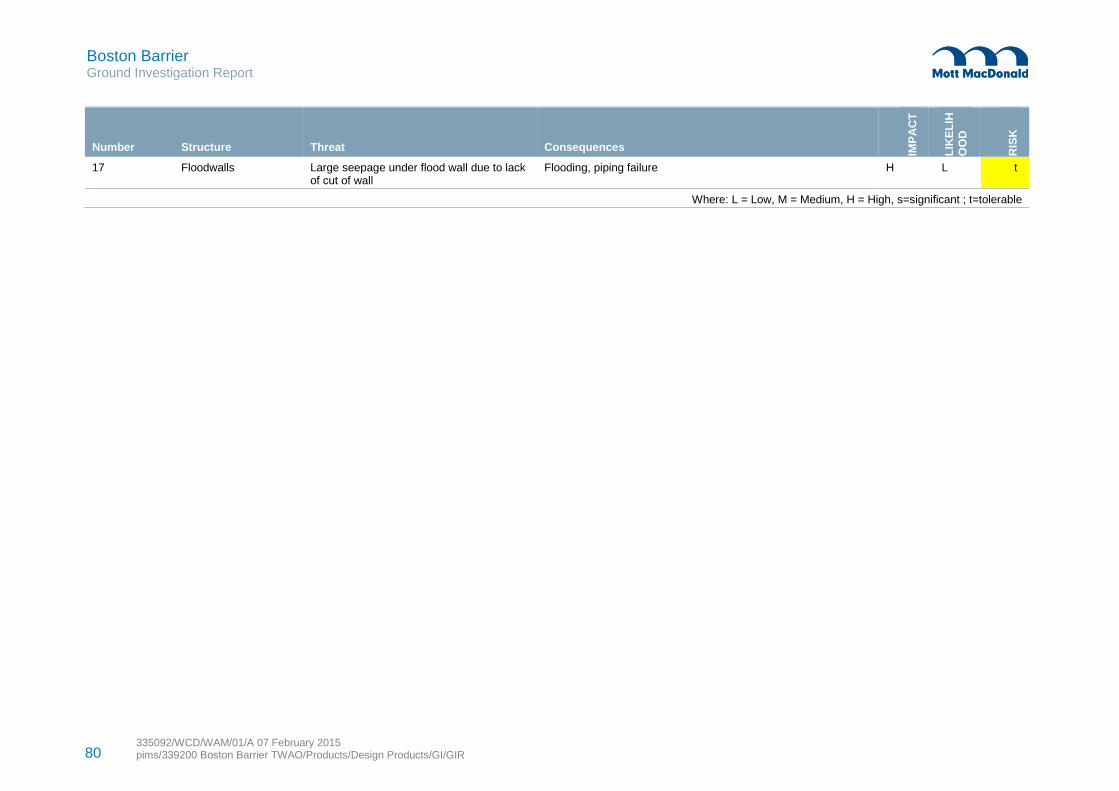
80 335092/WCD/WAM/01/A 07 February 2015 pims/339200 Boston Barrier TWAO/Products/Design Products/GI/GIR
Boston Barrier Ground Investigation Report
Number Structure Threat Consequences
IMP
AC
T
LIK
EL
IH
OO
D
RIS
K
17 Floodwalls Large seepage under flood wall due to lack of cut of wall
Flooding, piping failure H L t
Where: L = Low, M = Medium, H = High, s=significant ; t=tolerable
Boston Barrier Ground Investigation Report
335092/WCD/WAM/01/A 07 February 2015 pims/339200 Boston Barrier TWAO/Products/Design Products/GI/GIR
81
8.1 Geology and Groundwater
The results of the recent ground investigation in the Port of Boston and along the Right Embankment
confirmed the geology presented in historical boreholes and previous phases of ground investigation.
The geology typically comprised Made Ground overlying Alluvium which in turn overlies Glacial Till
deposits. In previous phases of ground investigation Kimmeridge Clay has been identified within
boreholes.
The ground water on the Left Embankment appears to be tidally influenced by the tides with a maximum
range of fluctuation of up to 3.5m (0mAOD to 3.5mAOD). The ground water within the Alluvium is more
sensitive to tidal fluctuations than the Made Ground or the Glacial Till which leads to a significant risk of
flooding behind or piping failure of the left bank flood walls due to their lack of cut-off. On the Right
Embankment, the same extent of tidal influence is not seen and the groundwater is consistently around
3.0m AOD.
8.2 General Geotechnical Profile
Throughout the site, the characteristic geotechnical profile can be summarised as varying depths of highly
variable made ground overlying varying thicknesses of Alluvium, overlying Glacial Till. The Glacial Till can
be found at a consistent level and is less variable in its geotechnical parameters, although the top 1.5m to
2m of the Glacial Till is either weathered or reworked such that the strength is lower. However, it quickly
becomes stiff to hard.
8.3 Geotechnical Parameters
This report has identified ranges of geotechnical parameters likely to be found within each package order
although it has been noted that there is a high degree of variability in both the Made Ground and the
Alluvium deposits. The Glacial Till shows slightly more consistent parameters. A summary of typical values
can be found in Section 5.10.
8.4 Buried Structures
The list of uncharted buried structures within the Port of Boston is extensive. There is high risk of
encountering unchartered services. The tie-in anchors have been exposed in the Maud Foster to the Lock
area; however further work is required to identify the entire tie in anchors between the Knuckle and the
Fisherman’s Quay. It is recommended that further investigation during the Design and Build stage of the
project be undertaken to minimise this risk.
8.5 Contamination
The key contamination risks on the site have arisen in the area of the historical slipway, within the Knuckle
and along the access road. These risks generally comprise hotspots of asbestos and metals within the
8 Conclusions
Boston Barrier Ground Investigation Report
335092/WCD/WAM/01/A 07 February 2015 pims/339200 Boston Barrier TWAO/Products/Design Products/GI/GIR
82
made ground and more widespread presence of TPH. It is possible that asbestos is present in other areas
of the site which have not been subject to testing. It is recommended that further investigation during the
Design and Build stage of the project be undertaken to minimise this risk, in particular to confirm the extent
of hydrocarbons in the Knuckle area if this section of the existing works is to be demolished as part of the
proposed works, and the presence of asbestos side wide.
A number of the soil samples tested would represent hazardous waste if removal from site was required,
this may represent an increased cost to the development. If re-use on-site is proposed additional testing
and risk assessment is recommended.
If dewatering operations are required during construction it is likely that the water/groundwater will not be
suitable to be disposed of directly to ground or surface waters. Discussions with the Environment Agency
will be required to confirm a suitable solution.
Based on ground gas monitoring it is recommended to use gas protection measures for the control
building.
Risks are generally considered to be low based on the assumptions set out in Table 6.3.
8.6 Voids
A void was found during the phase 3 investigation as the result of outwash of material on the north side of
the lock between the old bull nose and the straight edged quay. No other voids were found during the
investigation.
Boston Barrier Ground Investigation Report
335092/WCD/WAM/01/A 07 February 2015 pims/339200 Boston Barrier TWAO/Products/Design Products/GI/GIR
83
[1] Environment Agency, “Project Appraisal Repor for Boston Barrage Barrier Works,” 2013.
[2] Soil Engineering, “Ground Investigation at Boston Barrier and Haven Works - Phase 1 GI,” 2010.
[3] WYG Environment, “Boston Barrier Phase 2 Ground Investigation,” 2012.
[4] WYG Environment, “Boston Barrier Phase 3 Final Factual Ground Investigation Report,” 2015.
[5] D. J. Rudland, R. M. Lancefield and P. N. Mayell, “CIRIA C552: Contaminated Land Risk Assessment:
A guide to Good Practise,” CIRIA, London, 2001.
[6] Environement Agency , “Boston Barrier Phase 3 Ground Investigation Schedules,” June 2014.
[7] British Geological Survey, Boston Sheet 128 Solid and Drift Edition 1:50000 Geological Map, NERC,
1995.
[8] British Geological Survey, Geology of the country around kings lynn and the wash, NERC, 1994.
[9] Institute of Geological Sciences , British Regional Geology Eastern England from the Tees to the
Wash 2nd Edition, NERC, 1980.
[10] Envirocheck, “Envirocheck Report National Grid Reference: 533190, 342920,” December 2014.
[11] Environment Agency , “Boston Barrier Order Scoping Report (IMAN001472-BBOSR-ES-101),” 2011.
[12] British Geological Survey, “Geology of Britain viewer,” 2015. [Online]. Available:
http://mapapps.bgs.ac.uk/geologyofbritain/home.html. [Accessed 2 February 2015].
[13] Halcrow, “Boston Barrier and Haven Works Project; Geotechnical Interpretation of Historical Data;
WNBHBW/WHBHAV001,” 3 December 2009.
[14] British Standard; BS5930:1999+A2, “Code of Practise for Site Investigation,” 2010.
[15] European Normalised British Standard; BS EN 14688-2:2004, “Identification and Classification of
Soils,” 2004.
[16] European Normalised British Standard; BS22476-3:2005, “Geotechnical Investigation and Testing;
Part 3: Standard Penetration Test,” 2005.
9 Bibliography
Boston Barrier Ground Investigation Report
335092/WCD/WAM/01/A 07 February 2015 pims/339200 Boston Barrier TWAO/Products/Design Products/GI/GIR
84
[17] SUMO Services Ltd., “Utilities and Topograpical Details Haven Works - Site 6; Job Number:
SOR001054; Drawing Number: SOR001054-01_RevA,” March 2010.
[18] SUMO Services Ltd., “Boston GPR Surveys; Job Number: SOR0002840,” September 2011.
[19] Tower Surveys Ltd., “Port of Boston Topographical Survey as of 14/03/14; Job Number: R-S8433,”
March 2014.
[20] Storm Geomatics, “Port of Boston Bathymetric Survey; Job Number: 14TS11241/45,” June 2014.
[21] Tower Surveys Ltd., “Port of Boston GPR Survey; Job Number R-S8433,” May 2014.
[22] Mott MacDonald, “Boston Barrier Scheme Phase 3 Ground Investigation Services and Borehole
Locations; Drawing Number: IMAN001472-MM-3GI-001 to 005,” October 2014.
[23] European Normalised British Standard; BS EN 1997-2:2007, “Geotechnical Design; Part 2: Ground
Investigation and Testing,” 2010.
[24] WYG Environment, “Vacuum Excavation Inspection Pit Trial Report; Job number: A081319-1,”
November 2014.
[25] British Standards, Eurocode 7: Geotechnical design — Part 1: General rules (BS EN 1997-1:2004),
2004.
[26] British Standard Institute, “British Standard; BS EN ISO 22476-3:2005; Geotechnical Investigation and
Testing Part 3: standard Penetration Test,” 2007.
[27] Clayton, CI, “The Standard Penetration Test (SPT): Method and Use, CIRIA Report 143,” CIRIA,
London, 1995.
[28] British Standards; BS 8002:1994, “Code of practice for Earth retaining structures,” 2001.
[29] R. Craig, Craig's Soil Mechanics, 7th ed., Abingdon: Spon Press, 2004.
[30] C. C. Ladd, R. Foote, K. Ishihara, F. Schlosser and H. G. Poulus, “Stress Deformation and Strength
Characteristics,” Proceedings Ninth International Conference on Soil Mechanics and Foundation
Engineering, 1977.
[31] G. Barnes, Soil Mechanics Principles and Practice, Palgrave MacMillan, 2000.
Boston Barrier Ground Investigation Report
335092/WCD/WAM/01/A 07 February 2015 pims/339200 Boston Barrier TWAO/Products/Design Products/GI/GIR
85
[32] J. Harlén and W. Wolski, Embankments on Organic Soils, Elsevier, 1996.
[33] W. T. Lambe and R. V. Whitman, Soil Mechanics, SI Version, India: John Wiley & Sons, 1979.
[34] M. Tomlinson, Foundation Design and Construction, 7th ed., Harlow: Pearson Education Ltd, 2001, p.
49.
[35] BRE, Concrete in aggressive ground, 3rd ed., Watford: BRE Bookshop, 2005.
[36] One Touch Data, “http://www.onetouchdata.com/,” 2012. [Online]. Available:
http://www.onetouchdata.com/. [Accessed 4 February 2015].
[37] CIRIA, “STANDARD PENETRATION TEST,” in Shaft friction of CFA Shaft friction of CFA, Project
Report 86, London, CIRIA, 2003, p. 37.
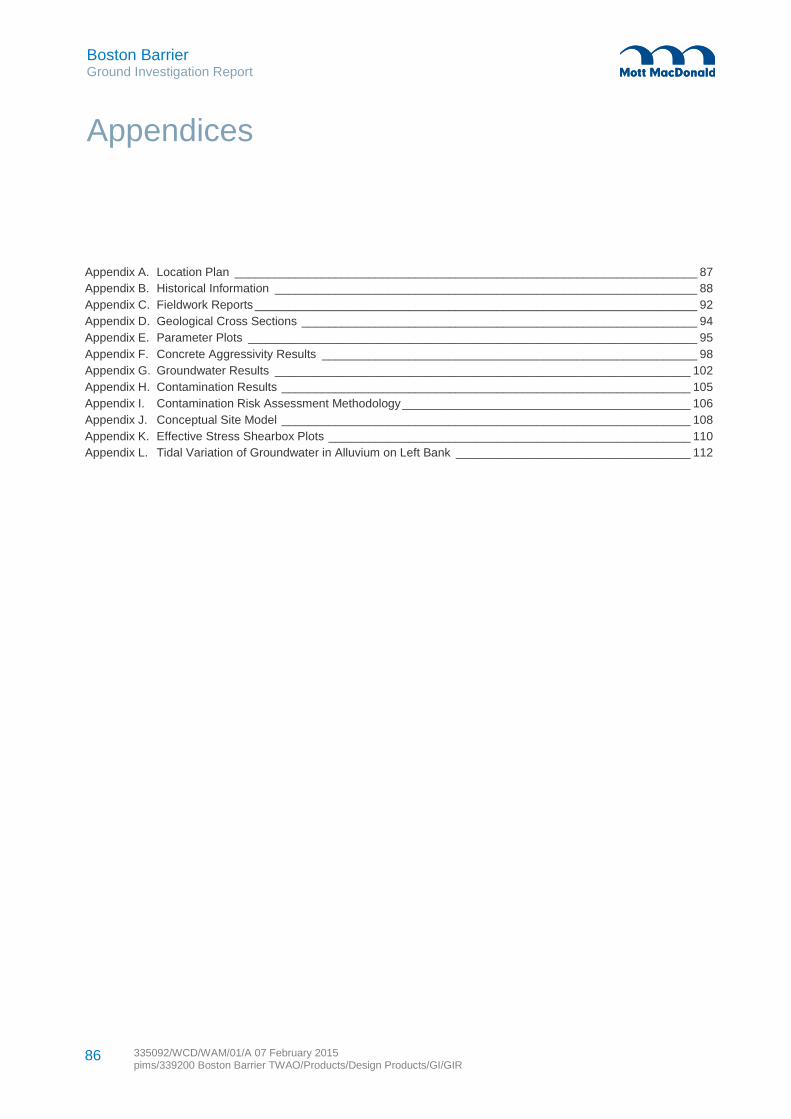
Boston Barrier Ground Investigation Report
335092/WCD/WAM/01/A 07 February 2015 pims/339200 Boston Barrier TWAO/Products/Design Products/GI/GIR
86
Appendices
Appendix A. Location Plan _____________________________________________________________________ 87 Appendix B. Historical Information _______________________________________________________________ 88 Appendix C. Fieldwork Reports __________________________________________________________________ 92 Appendix D. Geological Cross Sections ___________________________________________________________ 94 Appendix E. Parameter Plots ___________________________________________________________________ 95 Appendix F. Concrete Aggressivity Results ________________________________________________________ 98 Appendix G. Groundwater Results ______________________________________________________________ 102 Appendix H. Contamination Results _____________________________________________________________ 105 Appendix I. Contamination Risk Assessment Methodology ___________________________________________ 106 Appendix J. Conceptual Site Model _____________________________________________________________ 108 Appendix K. Effective Stress Shearbox Plots ______________________________________________________ 110 Appendix L. Tidal Variation of Groundwater in Alluvium on Left Bank ___________________________________ 112

Boston Barrier Ground Investigation Report
335092/WCD/WAM/01/A 07 February 2015 pims/339200 Boston Barrier TWAO/Products/Design Products/GI/GIR
87
Appendix A. Location Plan
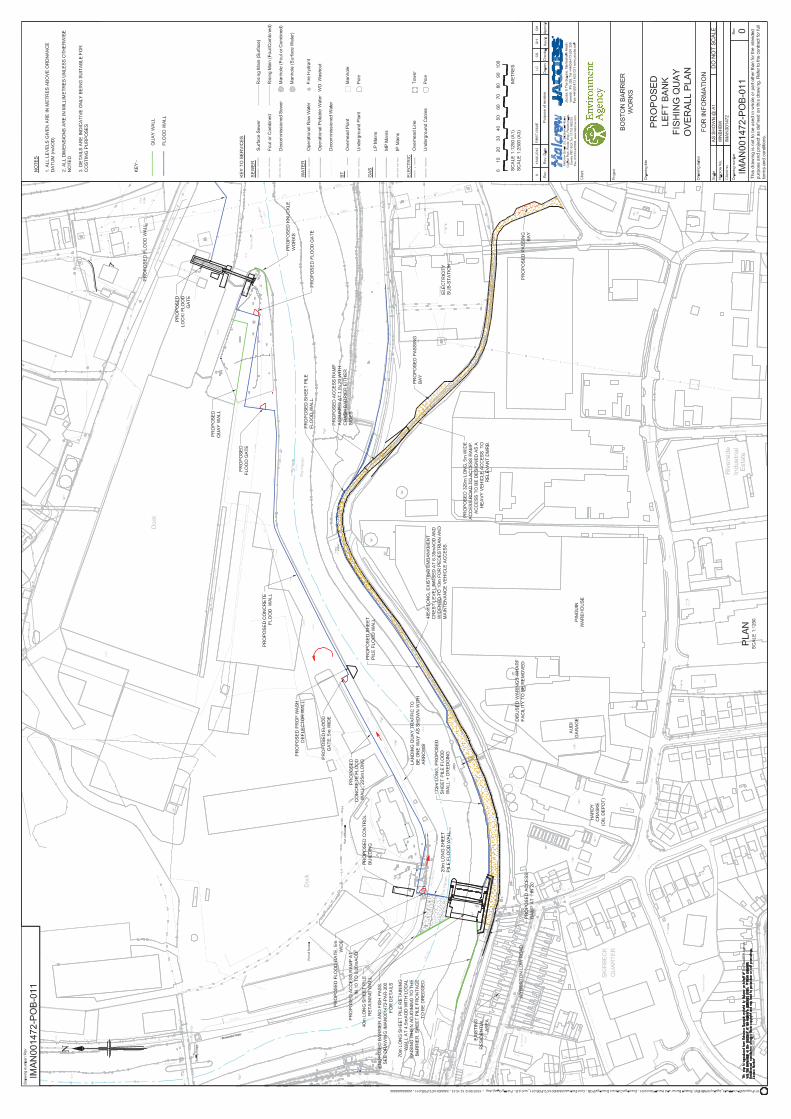
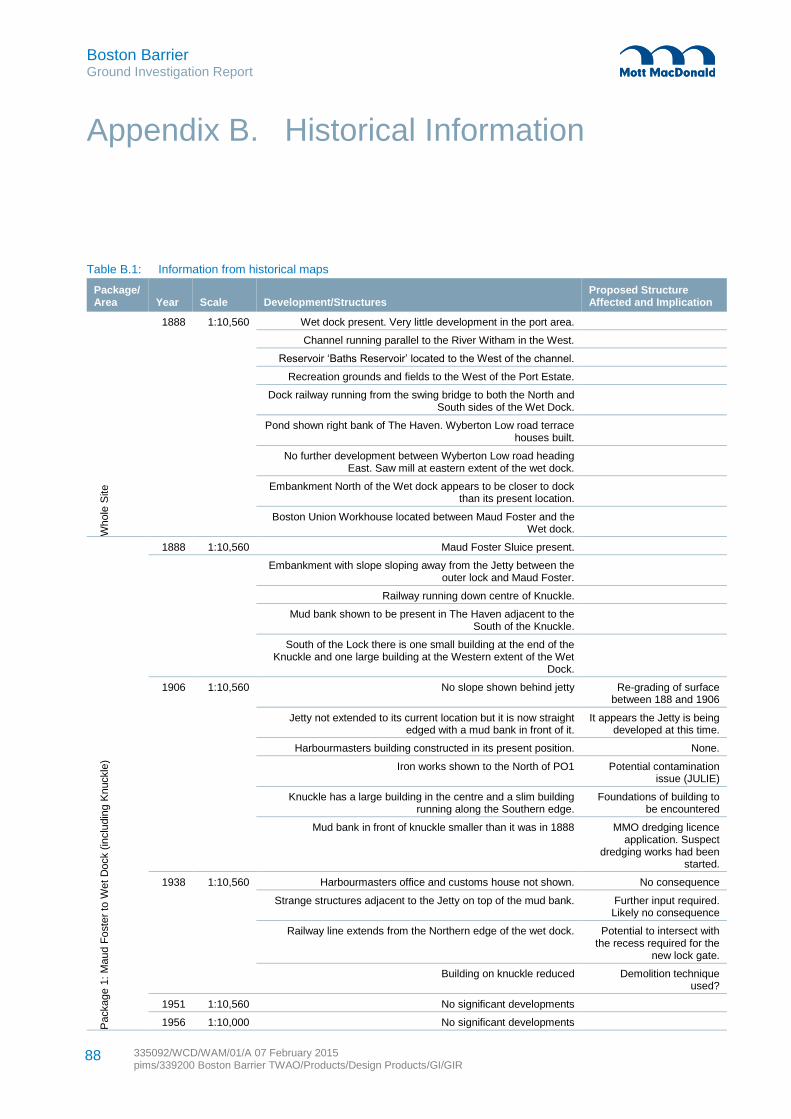
Boston Barrier Ground Investigation Report
335092/WCD/WAM/01/A 07 February 2015 pims/339200 Boston Barrier TWAO/Products/Design Products/GI/GIR
88
Table B.1: Information from historical maps
Package/Area Year Scale Development/Structures
Proposed Structure Affected and Implication
Whole
Site
1888 1:10,560 Wet dock present. Very little development in the port area.
Channel running parallel to the River Witham in the West.
Reservoir ‘Baths Reservoir’ located to the West of the channel.
Recreation grounds and fields to the West of the Port Estate.
Dock railway running from the swing bridge to both the North and South sides of the Wet Dock.
Pond shown right bank of The Haven. Wyberton Low road terrace houses built.
No further development between Wyberton Low road heading East. Saw mill at eastern extent of the wet dock.
Embankment North of the Wet dock appears to be closer to dock than its present location.
Boston Union Workhouse located between Maud Foster and the Wet dock.
Package 1
: M
aud F
oste
r to
Wet D
ock (
inclu
din
g K
nuckle
)
1888 1:10,560 Maud Foster Sluice present.
Embankment with slope sloping away from the Jetty between the outer lock and Maud Foster.
Railway running down centre of Knuckle.
Mud bank shown to be present in The Haven adjacent to the South of the Knuckle.
South of the Lock there is one small building at the end of the Knuckle and one large building at the Western extent of the Wet
Dock.
1906 1:10,560 No slope shown behind jetty Re-grading of surface between 188 and 1906
Jetty not extended to its current location but it is now straight edged with a mud bank in front of it.
It appears the Jetty is being developed at this time.
Harbourmasters building constructed in its present position. None.
Iron works shown to the North of PO1 Potential contamination issue (JULIE)
Knuckle has a large building in the centre and a slim building running along the Southern edge.
Foundations of building to be encountered
Mud bank in front of knuckle smaller than it was in 1888 MMO dredging licence application. Suspect
dredging works had been started.
1938 1:10,560 Harbourmasters office and customs house not shown. No consequence
Strange structures adjacent to the Jetty on top of the mud bank. Further input required. Likely no consequence
Railway line extends from the Northern edge of the wet dock. Potential to intersect with the recess required for the
new lock gate.
Building on knuckle reduced Demolition technique used?
1951 1:10,560 No significant developments
1956 1:10,000 No significant developments
Appendix B. Historical Information
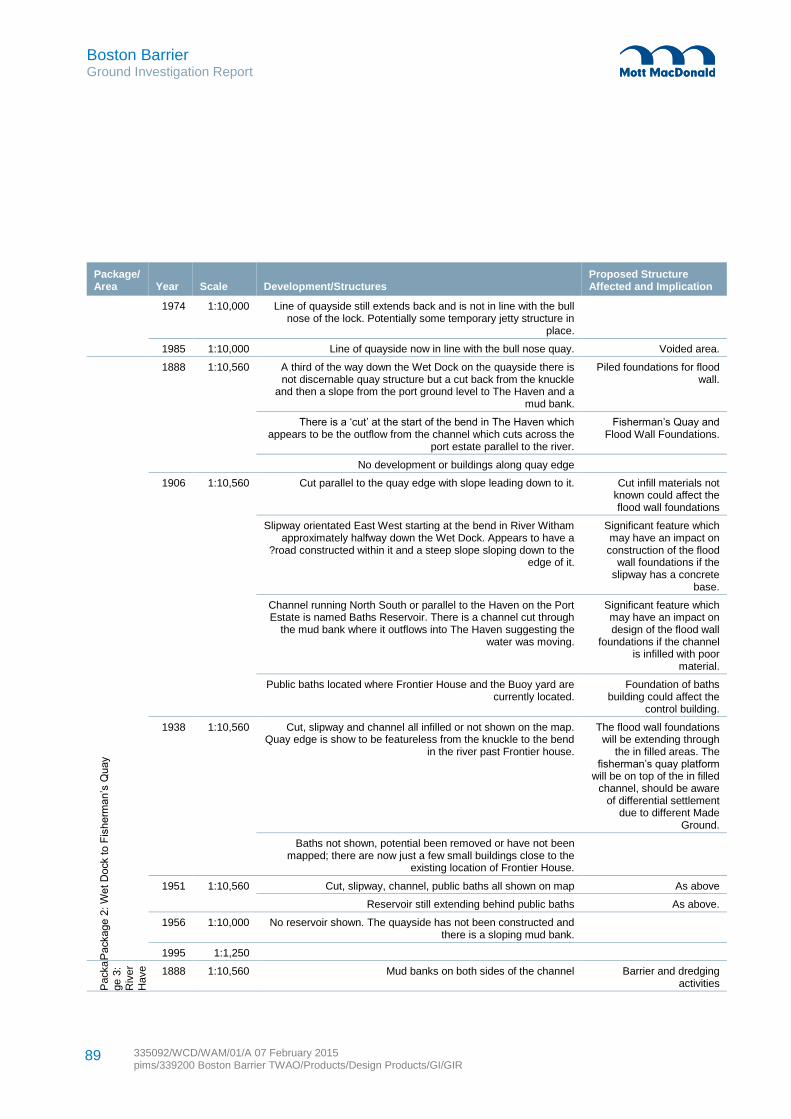
Boston Barrier Ground Investigation Report
335092/WCD/WAM/01/A 07 February 2015 pims/339200 Boston Barrier TWAO/Products/Design Products/GI/GIR
89
Package/Area Year Scale Development/Structures
Proposed Structure Affected and Implication
1974 1:10,000 Line of quayside still extends back and is not in line with the bull nose of the lock. Potentially some temporary jetty structure in
place.
1985 1:10,000 Line of quayside now in line with the bull nose quay. Voided area.
Package 2
: W
et D
ock to F
isherm
an’s
Quay
1888 1:10,560 A third of the way down the Wet Dock on the quayside there is not discernable quay structure but a cut back from the knuckle
and then a slope from the port ground level to The Haven and a mud bank.
Piled foundations for flood wall.
There is a ‘cut’ at the start of the bend in The Haven which appears to be the outflow from the channel which cuts across the
port estate parallel to the river.
Fisherman’s Quay and Flood Wall Foundations.
No development or buildings along quay edge
1906 1:10,560 Cut parallel to the quay edge with slope leading down to it. Cut infill materials not known could affect the flood wall foundations
Slipway orientated East West starting at the bend in River Witham approximately halfway down the Wet Dock. Appears to have a
?road constructed within it and a steep slope sloping down to the edge of it.
Significant feature which may have an impact on construction of the flood
wall foundations if the slipway has a concrete
base.
Channel running North South or parallel to the Haven on the Port Estate is named Baths Reservoir. There is a channel cut through
the mud bank where it outflows into The Haven suggesting the water was moving.
Significant feature which may have an impact on design of the flood wall
foundations if the channel is infilled with poor
material.
Public baths located where Frontier House and the Buoy yard are currently located.
Foundation of baths building could affect the
control building.
1938 1:10,560 Cut, slipway and channel all infilled or not shown on the map. Quay edge is show to be featureless from the knuckle to the bend
in the river past Frontier house.
The flood wall foundations will be extending through
the in filled areas. The fisherman’s quay platform
will be on top of the in filled channel, should be aware
of differential settlement due to different Made
Ground.
Baths not shown, potential been removed or have not been mapped; there are now just a few small buildings close to the
existing location of Frontier House.
1951 1:10,560 Cut, slipway, channel, public baths all shown on map As above
Reservoir still extending behind public baths As above.
1956 1:10,000 No reservoir shown. The quayside has not been constructed and there is a sloping mud bank.
1995 1:1,250
Packa
ge 3
:
Riv
er
Have
n
1888 1:10,560 Mud banks on both sides of the channel Barrier and dredging activities
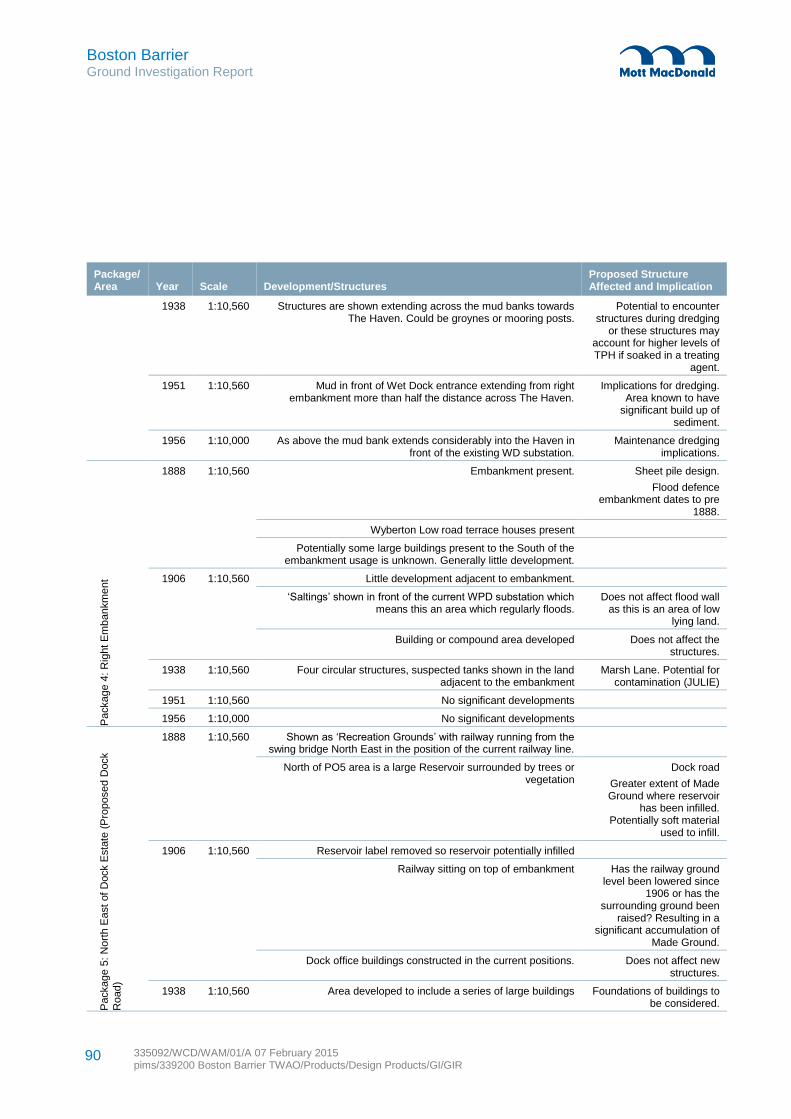
Boston Barrier Ground Investigation Report
335092/WCD/WAM/01/A 07 February 2015 pims/339200 Boston Barrier TWAO/Products/Design Products/GI/GIR
90
Package/Area Year Scale Development/Structures
Proposed Structure Affected and Implication
1938 1:10,560 Structures are shown extending across the mud banks towards The Haven. Could be groynes or mooring posts.
Potential to encounter structures during dredging
or these structures may account for higher levels of TPH if soaked in a treating
agent.
1951 1:10,560 Mud in front of Wet Dock entrance extending from right embankment more than half the distance across The Haven.
Implications for dredging. Area known to have
significant build up of sediment.
1956 1:10,000 As above the mud bank extends considerably into the Haven in front of the existing WD substation.
Maintenance dredging implications.
Package 4
: R
ight E
mb
ankm
ent
1888 1:10,560 Embankment present. Sheet pile design.
Flood defence embankment dates to pre
1888.
Wyberton Low road terrace houses present
Potentially some large buildings present to the South of the embankment usage is unknown. Generally little development.
1906 1:10,560 Little development adjacent to embankment.
‘Saltings’ shown in front of the current WPD substation which means this an area which regularly floods.
Does not affect flood wall as this is an area of low
lying land.
Building or compound area developed Does not affect the structures.
1938 1:10,560 Four circular structures, suspected tanks shown in the land adjacent to the embankment
Marsh Lane. Potential for contamination (JULIE)
1951 1:10,560 No significant developments
1956 1:10,000 No significant developments
Package 5
: N
ort
h E
ast
of
Dock E
sta
te (
Pro
posed D
ock
Road)
1888 1:10,560 Shown as ‘Recreation Grounds’ with railway running from the swing bridge North East in the position of the current railway line.
North of PO5 area is a large Reservoir surrounded by trees or vegetation
Dock road
Greater extent of Made Ground where reservoir
has been infilled. Potentially soft material
used to infill.
1906 1:10,560 Reservoir label removed so reservoir potentially infilled
Railway sitting on top of embankment Has the railway ground level been lowered since
1906 or has the surrounding ground been
raised? Resulting in a significant accumulation of
Made Ground.
Dock office buildings constructed in the current positions. Does not affect new structures.
1938 1:10,560 Area developed to include a series of large buildings Foundations of buildings to be considered.
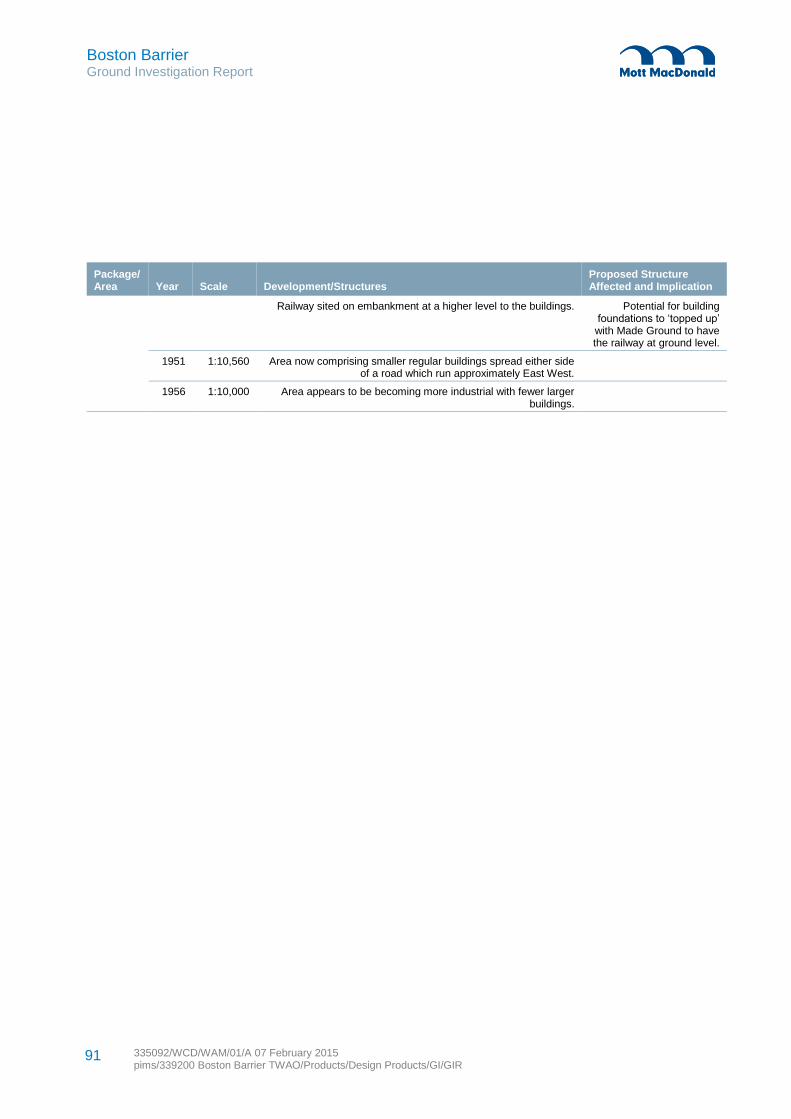
Boston Barrier Ground Investigation Report
335092/WCD/WAM/01/A 07 February 2015 pims/339200 Boston Barrier TWAO/Products/Design Products/GI/GIR
91
Package/Area Year Scale Development/Structures
Proposed Structure Affected and Implication
Railway sited on embankment at a higher level to the buildings. Potential for building foundations to ‘topped up’ with Made Ground to have the railway at ground level.
1951 1:10,560 Area now comprising smaller regular buildings spread either side of a road which run approximately East West.
1956 1:10,000 Area appears to be becoming more industrial with fewer larger buildings.
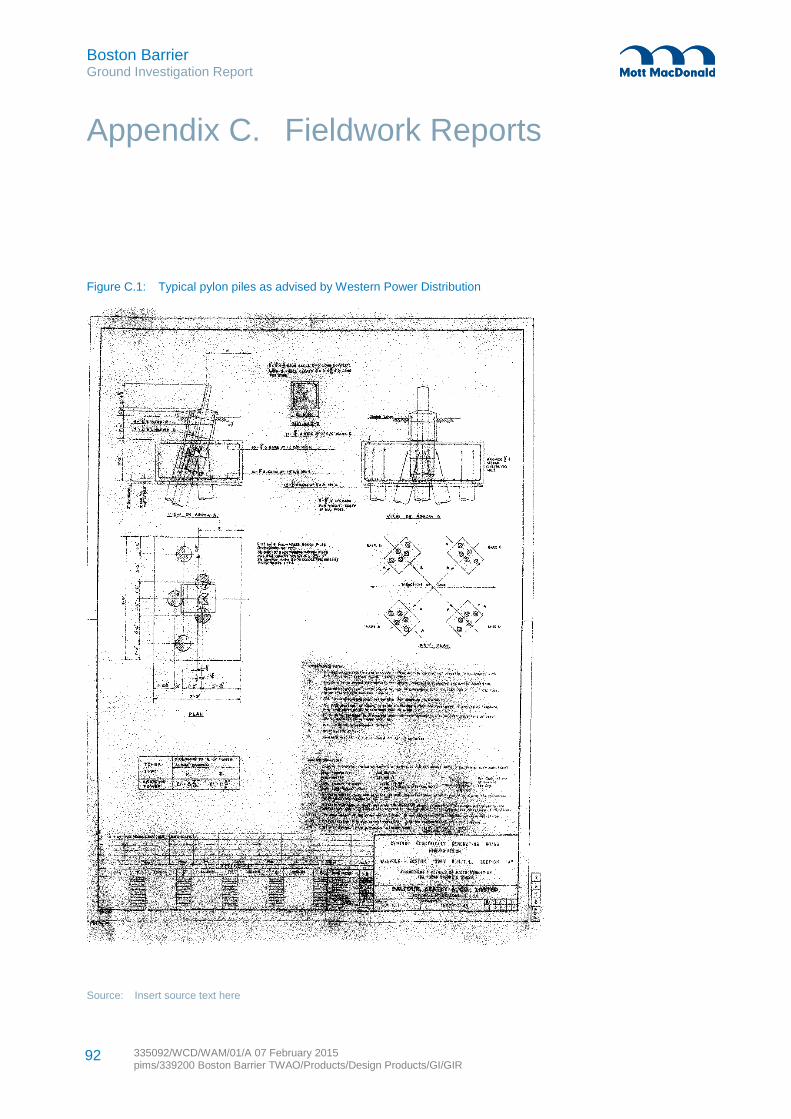
Boston Barrier Ground Investigation Report
335092/WCD/WAM/01/A 07 February 2015 pims/339200 Boston Barrier TWAO/Products/Design Products/GI/GIR
92
Figure C.1: Typical pylon piles as advised by Western Power Distribution
Source: Insert source text here
Appendix C. Fieldwork Reports

Boston Barrier Ground Investigation Report
335092/WCD/WAM/01/A 07 February 2015 pims/339200 Boston Barrier TWAO/Products/Design Products/GI/GIR
93
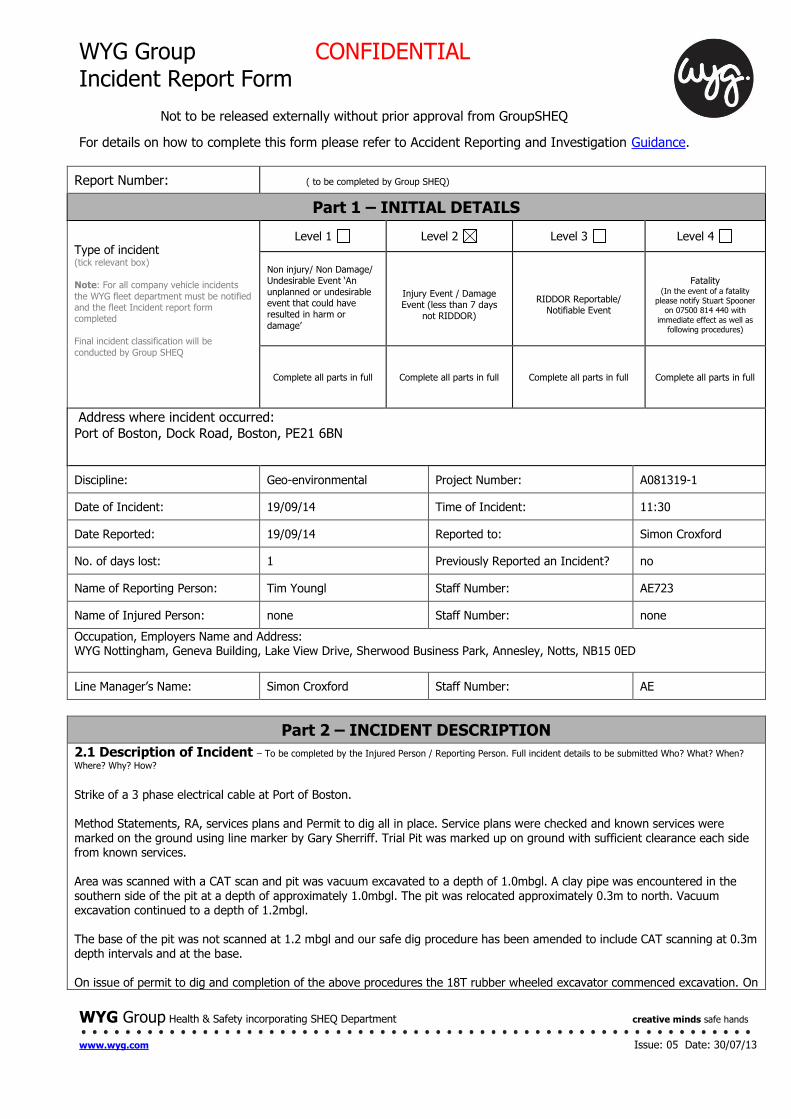
WYG Group CONFIDENTIAL Incident Report Form
Not to be released externally without prior approval from GroupSHEQ
WYG Group Health & Safety incorporating SHEQ Department creative minds safe hands
www.wyg.com Issue: 05 Date: 30/07/13
For details on how to complete this form please refer to Accident Reporting and Investigation Guidance.
Report Number: ( to be completed by Group SHEQ)
Part 1 – INITIAL DETAILS
Type of incident (tick relevant box)
Note: For all company vehicle incidents
the WYG fleet department must be notified and the fleet Incident report form completed
Final incident classification will be
conducted by Group SHEQ
Level 1 Level 2 Level 3 Level 4
Non injury/ Non Damage/ Undesirable Event ‘An
unplanned or undesirable event that could have resulted in harm or
damage’
Injury Event / Damage Event (less than 7 days
not RIDDOR)
RIDDOR Reportable/ Notifiable Event
Fatality
(In the event of a fatality please notify Stuart Spooner
on 07500 814 440 with
immediate effect as well as following procedures)
Complete all parts in full Complete all parts in full Complete all parts in full Complete all parts in full
Address where incident occurred:
Port of Boston, Dock Road, Boston, PE21 6BN
Discipline: Geo-environmental Project Number: A081319-1
Date of Incident: 19/09/14 Time of Incident: 11:30
Date Reported: 19/09/14 Reported to: Simon Croxford
No. of days lost: 1 Previously Reported an Incident? no
Name of Reporting Person: Tim Youngl Staff Number: AE723
Name of Injured Person: none Staff Number: none
Occupation, Employers Name and Address: WYG Nottingham, Geneva Building, Lake View Drive, Sherwood Business Park, Annesley, Notts, NB15 0ED
Line Manager’s Name: Simon Croxford Staff Number: AE
Part 2 – INCIDENT DESCRIPTION
2.1 Description of Incident – To be completed by the Injured Person / Reporting Person. Full incident details to be submitted Who? What? When?
Where? Why? How?
Strike of a 3 phase electrical cable at Port of Boston. Method Statements, RA, services plans and Permit to dig all in place. Service plans were checked and known services were marked on the ground using line marker by Gary Sherriff. Trial Pit was marked up on ground with sufficient clearance each side from known services. Area was scanned with a CAT scan and pit was vacuum excavated to a depth of 1.0mbgl. A clay pipe was encountered in the southern side of the pit at a depth of approximately 1.0mbgl. The pit was relocated approximately 0.3m to north. Vacuum excavation continued to a depth of 1.2mbgl. The base of the pit was not scanned at 1.2 mbgl and our safe dig procedure has been amended to include CAT scanning at 0.3m depth intervals and at the base. On issue of permit to dig and completion of the above procedures the 18T rubber wheeled excavator commenced excavation. On
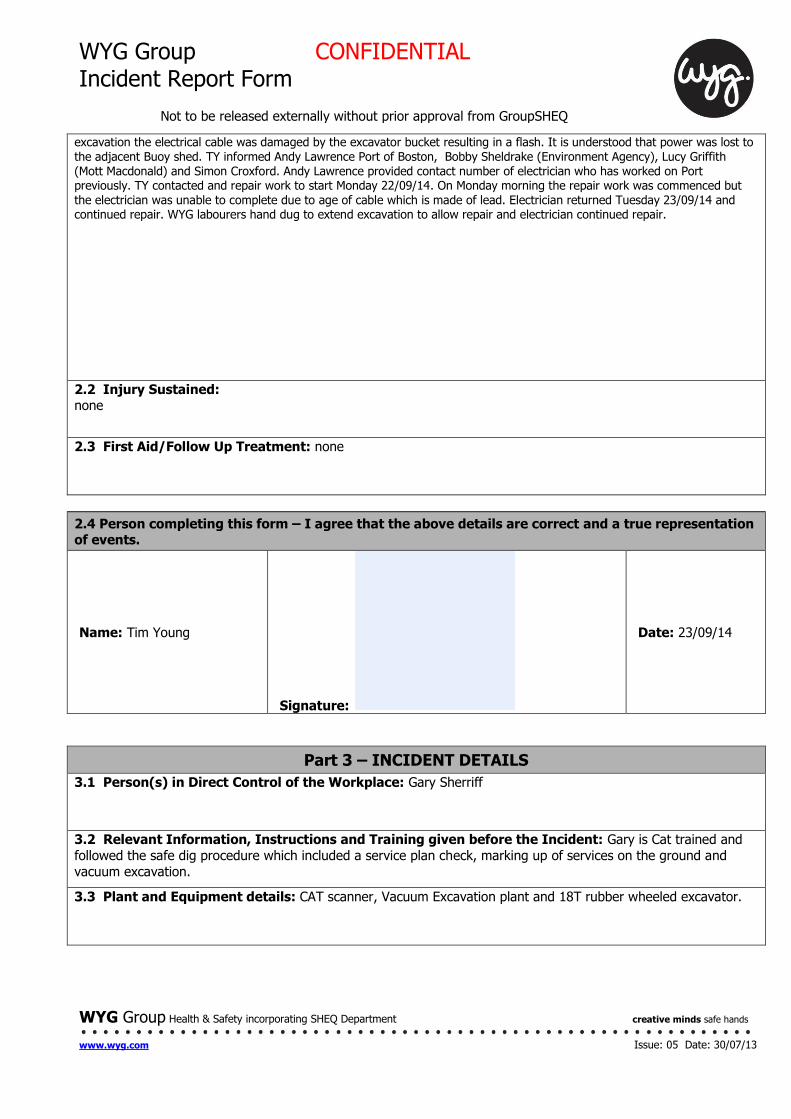
WYG Group CONFIDENTIAL Incident Report Form
Not to be released externally without prior approval from GroupSHEQ
WYG Group Health & Safety incorporating SHEQ Department creative minds safe hands
www.wyg.com Issue: 05 Date: 30/07/13
excavation the electrical cable was damaged by the excavator bucket resulting in a flash. It is understood that power was lost to the adjacent Buoy shed. TY informed Andy Lawrence Port of Boston, Bobby Sheldrake (Environment Agency), Lucy Griffith (Mott Macdonald) and Simon Croxford. Andy Lawrence provided contact number of electrician who has worked on Port previously. TY contacted and repair work to start Monday 22/09/14. On Monday morning the repair work was commenced but the electrician was unable to complete due to age of cable which is made of lead. Electrician returned Tuesday 23/09/14 and continued repair. WYG labourers hand dug to extend excavation to allow repair and electrician continued repair.
2.2 Injury Sustained: none
2.3 First Aid/Follow Up Treatment: none
2.4 Person completing this form – I agree that the above details are correct and a true representation of events.
Name: Tim Young
Signature:
Date: 23/09/14
Part 3 – INCIDENT DETAILS
3.1 Person(s) in Direct Control of the Workplace: Gary Sherriff
3.2 Relevant Information, Instructions and Training given before the Incident: Gary is Cat trained and
followed the safe dig procedure which included a service plan check, marking up of services on the ground and
vacuum excavation.
3.3 Plant and Equipment details: CAT scanner, Vacuum Excavation plant and 18T rubber wheeled excavator.

WYG Group CONFIDENTIAL Incident Report Form
Not to be released externally without prior approval from GroupSHEQ
WYG Group Health & Safety incorporating SHEQ Department creative minds safe hands
www.wyg.com Issue: 05 Date: 30/07/13
3.4a Servicing and Maintenance Records: CAT Scanner Calibration - attached (include reference number and attach copies to this report)
3.4b Details and copies of Inspections, Thorough Examinations, Test Records: N/A (Include reference number and attach copies to this report)
3.5 Details of Protective Clothing and Equipment: N/A
3.6 Statement of Witness Names and Reference Numbers: N/A
3.7 Photographic Reference Numbers: (include file path of where photographs are stored) TBC
3.8 Relevant Documentation: (Indicate as applicable)
Project Specific Safety Plan: Completed : Yes Briefed : Yes
Available on Site Yes Followed : Yes
Risk Assessments: Completed : Yes Briefed : Yes
Available on Site : Yes Followed : Yes
Method Statements: Completed : Yes Briefed : Yes
Available on Site : Yes Followed : Yes
Permits to Work: Completed : Yes Followed : Yes
Available on Site : Yes Briefed : Yes
3.9 Attachments: Indicate as applicable
Risk Assessments: Yes Method Statements: Yes
Project Specific Safety Plan: Yes Record of Site Induction: Yes
Record of Activity Briefing: No Photographs: Yes
Injured Parties and/or Statement of Witness: N/A External Accident Book/Form: N/A
Part 4 – INCIDENT CAUSATION ANALYSIS
4.1 Type of Event/Injury Associated with:
Moving Object Manual Handling
Moving Vehicle Exposure to Fire
Moving Machinery Exposure to Explosion
Fall From Height Hit Fixed Object
Fall on the Same Level Injured by an Animal
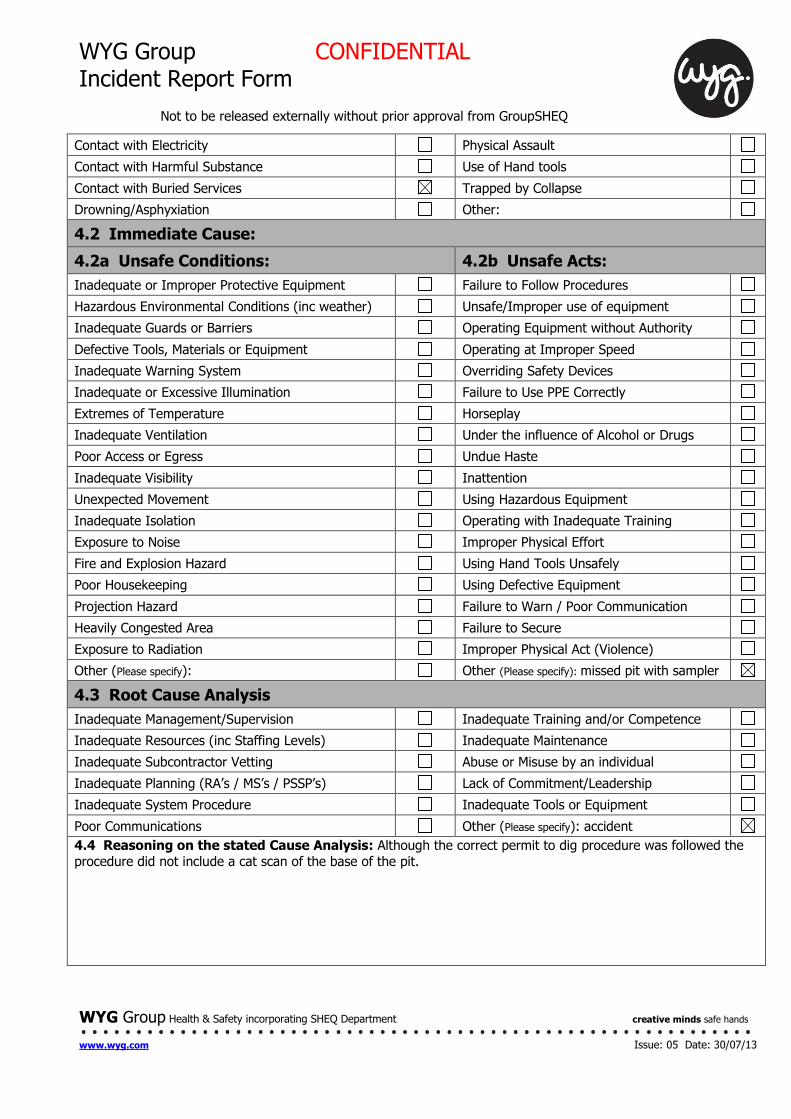
WYG Group CONFIDENTIAL Incident Report Form
Not to be released externally without prior approval from GroupSHEQ
WYG Group Health & Safety incorporating SHEQ Department creative minds safe hands
www.wyg.com Issue: 05 Date: 30/07/13
Contact with Electricity Physical Assault
Contact with Harmful Substance Use of Hand tools
Contact with Buried Services Trapped by Collapse
Drowning/Asphyxiation Other:
4.2 Immediate Cause:
4.2a Unsafe Conditions: 4.2b Unsafe Acts:
Inadequate or Improper Protective Equipment Failure to Follow Procedures
Hazardous Environmental Conditions (inc weather) Unsafe/Improper use of equipment
Inadequate Guards or Barriers Operating Equipment without Authority
Defective Tools, Materials or Equipment Operating at Improper Speed
Inadequate Warning System Overriding Safety Devices
Inadequate or Excessive Illumination Failure to Use PPE Correctly
Extremes of Temperature Horseplay
Inadequate Ventilation Under the influence of Alcohol or Drugs
Poor Access or Egress Undue Haste
Inadequate Visibility Inattention
Unexpected Movement Using Hazardous Equipment
Inadequate Isolation Operating with Inadequate Training
Exposure to Noise Improper Physical Effort
Fire and Explosion Hazard Using Hand Tools Unsafely
Poor Housekeeping Using Defective Equipment
Projection Hazard Failure to Warn / Poor Communication
Heavily Congested Area Failure to Secure
Exposure to Radiation Improper Physical Act (Violence)
Other (Please specify): Other (Please specify): missed pit with sampler
4.3 Root Cause Analysis
Inadequate Management/Supervision Inadequate Training and/or Competence
Inadequate Resources (inc Staffing Levels) Inadequate Maintenance
Inadequate Subcontractor Vetting Abuse or Misuse by an individual
Inadequate Planning (RA’s / MS’s / PSSP’s) Lack of Commitment/Leadership
Inadequate System Procedure Inadequate Tools or Equipment
Poor Communications Other (Please specify): accident
4.4 Reasoning on the stated Cause Analysis: Although the correct permit to dig procedure was followed the
procedure did not include a cat scan of the base of the pit.
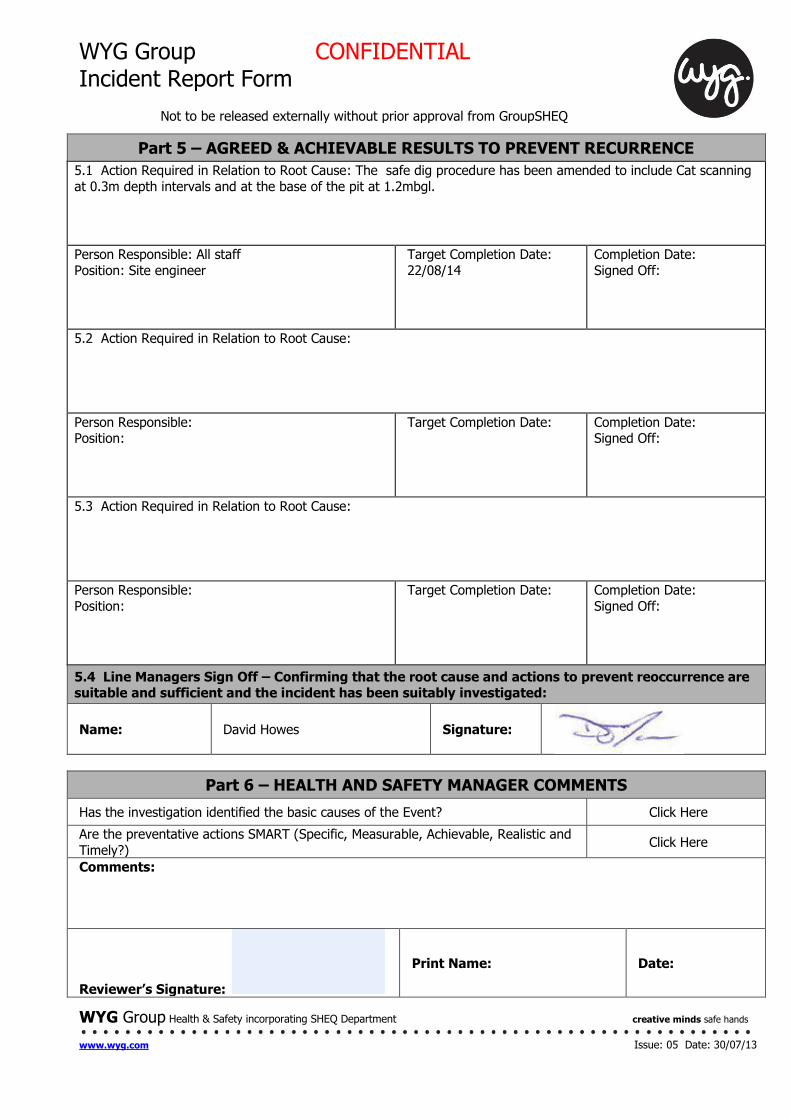
WYG Group CONFIDENTIAL Incident Report Form
Not to be released externally without prior approval from GroupSHEQ
WYG Group Health & Safety incorporating SHEQ Department creative minds safe hands
www.wyg.com Issue: 05 Date: 30/07/13
Part 5 – AGREED & ACHIEVABLE RESULTS TO PREVENT RECURRENCE
5.1 Action Required in Relation to Root Cause: The safe dig procedure has been amended to include Cat scanning
at 0.3m depth intervals and at the base of the pit at 1.2mbgl.
Person Responsible: All staff
Position: Site engineer
Target Completion Date:
22/08/14
Completion Date:
Signed Off:
5.2 Action Required in Relation to Root Cause:
Person Responsible: Position:
Target Completion Date:
Completion Date: Signed Off:
5.3 Action Required in Relation to Root Cause:
Person Responsible:
Position:
Target Completion Date:
Completion Date:
Signed Off:
5.4 Line Managers Sign Off – Confirming that the root cause and actions to prevent reoccurrence are suitable and sufficient and the incident has been suitably investigated:
Name: David Howes Signature:
Part 6 – HEALTH AND SAFETY MANAGER COMMENTS
Has the investigation identified the basic causes of the Event? Click Here
Are the preventative actions SMART (Specific, Measurable, Achievable, Realistic and
Timely?) Click Here
Comments:
Reviewer’s Signature:
Print Name: Date:
WYG Group CONFIDENTIAL Incident Report Form
Not to be released externally without prior approval from GroupSHEQ
WYG Group Health & Safety incorporating SHEQ Department creative minds safe hands
www.wyg.com Issue: 05 Date: 30/07/13
Circulation Required: Click Here Date Issued:
Reason:
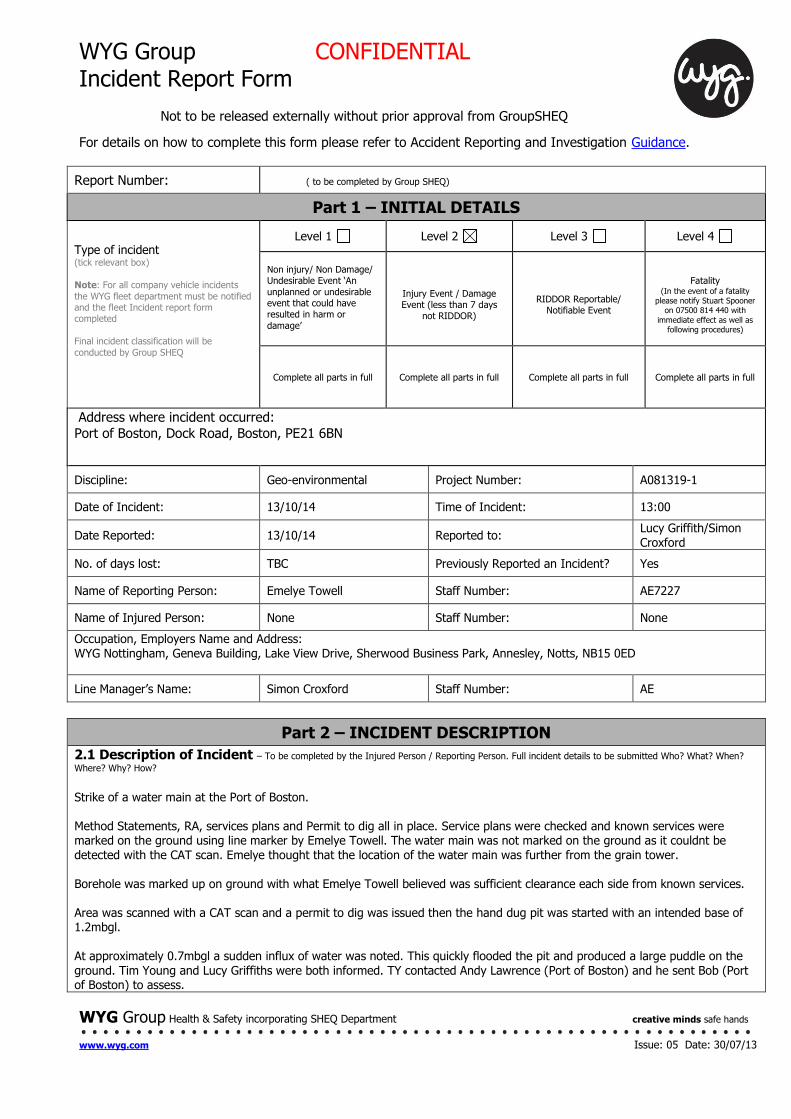
WYG Group CONFIDENTIAL Incident Report Form
Not to be released externally without prior approval from GroupSHEQ
WYG Group Health & Safety incorporating SHEQ Department creative minds safe hands
www.wyg.com Issue: 05 Date: 30/07/13
For details on how to complete this form please refer to Accident Reporting and Investigation Guidance.
Report Number: ( to be completed by Group SHEQ)
Part 1 – INITIAL DETAILS
Type of incident (tick relevant box)
Note: For all company vehicle incidents
the WYG fleet department must be notified and the fleet Incident report form completed
Final incident classification will be
conducted by Group SHEQ
Level 1 Level 2 Level 3 Level 4
Non injury/ Non Damage/ Undesirable Event ‘An
unplanned or undesirable event that could have resulted in harm or
damage’
Injury Event / Damage Event (less than 7 days
not RIDDOR)
RIDDOR Reportable/ Notifiable Event
Fatality
(In the event of a fatality please notify Stuart Spooner
on 07500 814 440 with
immediate effect as well as following procedures)
Complete all parts in full Complete all parts in full Complete all parts in full Complete all parts in full
Address where incident occurred:
Port of Boston, Dock Road, Boston, PE21 6BN
Discipline: Geo-environmental Project Number: A081319-1
Date of Incident: 13/10/14 Time of Incident: 13:00
Date Reported: 13/10/14 Reported to: Lucy Griffith/Simon Croxford
No. of days lost: TBC Previously Reported an Incident? Yes
Name of Reporting Person: Emelye Towell Staff Number: AE7227
Name of Injured Person: None Staff Number: None
Occupation, Employers Name and Address: WYG Nottingham, Geneva Building, Lake View Drive, Sherwood Business Park, Annesley, Notts, NB15 0ED
Line Manager’s Name: Simon Croxford Staff Number: AE
Part 2 – INCIDENT DESCRIPTION
2.1 Description of Incident – To be completed by the Injured Person / Reporting Person. Full incident details to be submitted Who? What? When?
Where? Why? How?
Strike of a water main at the Port of Boston. Method Statements, RA, services plans and Permit to dig all in place. Service plans were checked and known services were marked on the ground using line marker by Emelye Towell. The water main was not marked on the ground as it couldnt be detected with the CAT scan. Emelye thought that the location of the water main was further from the grain tower. Borehole was marked up on ground with what Emelye Towell believed was sufficient clearance each side from known services. Area was scanned with a CAT scan and a permit to dig was issued then the hand dug pit was started with an intended base of 1.2mbgl. At approximately 0.7mbgl a sudden influx of water was noted. This quickly flooded the pit and produced a large puddle on the ground. Tim Young and Lucy Griffiths were both informed. TY contacted Andy Lawrence (Port of Boston) and he sent Bob (Port of Boston) to assess.
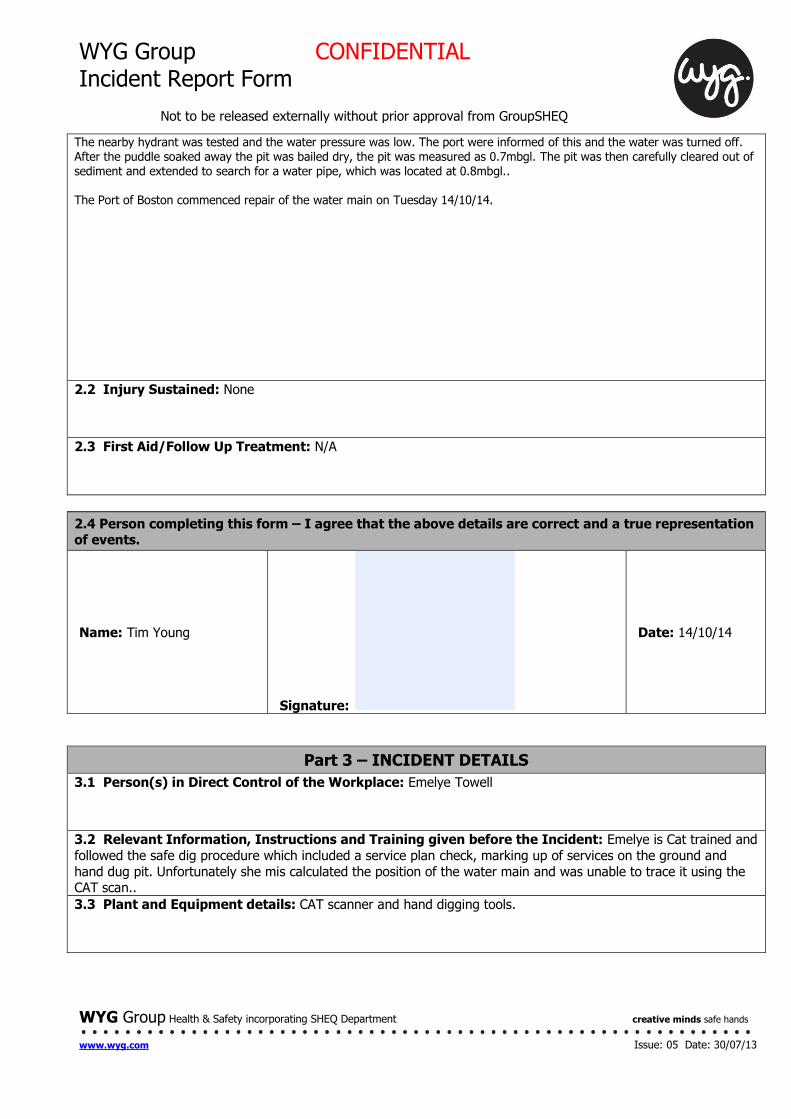
WYG Group CONFIDENTIAL Incident Report Form
Not to be released externally without prior approval from GroupSHEQ
WYG Group Health & Safety incorporating SHEQ Department creative minds safe hands
www.wyg.com Issue: 05 Date: 30/07/13
The nearby hydrant was tested and the water pressure was low. The port were informed of this and the water was turned off. After the puddle soaked away the pit was bailed dry, the pit was measured as 0.7mbgl. The pit was then carefully cleared out of sediment and extended to search for a water pipe, which was located at 0.8mbgl.. The Port of Boston commenced repair of the water main on Tuesday 14/10/14.
2.2 Injury Sustained: None
2.3 First Aid/Follow Up Treatment: N/A
2.4 Person completing this form – I agree that the above details are correct and a true representation of events.
Name: Tim Young
Signature:
Date: 14/10/14
Part 3 – INCIDENT DETAILS
3.1 Person(s) in Direct Control of the Workplace: Emelye Towell
3.2 Relevant Information, Instructions and Training given before the Incident: Emelye is Cat trained and
followed the safe dig procedure which included a service plan check, marking up of services on the ground and
hand dug pit. Unfortunately she mis calculated the position of the water main and was unable to trace it using the CAT scan..
3.3 Plant and Equipment details: CAT scanner and hand digging tools.
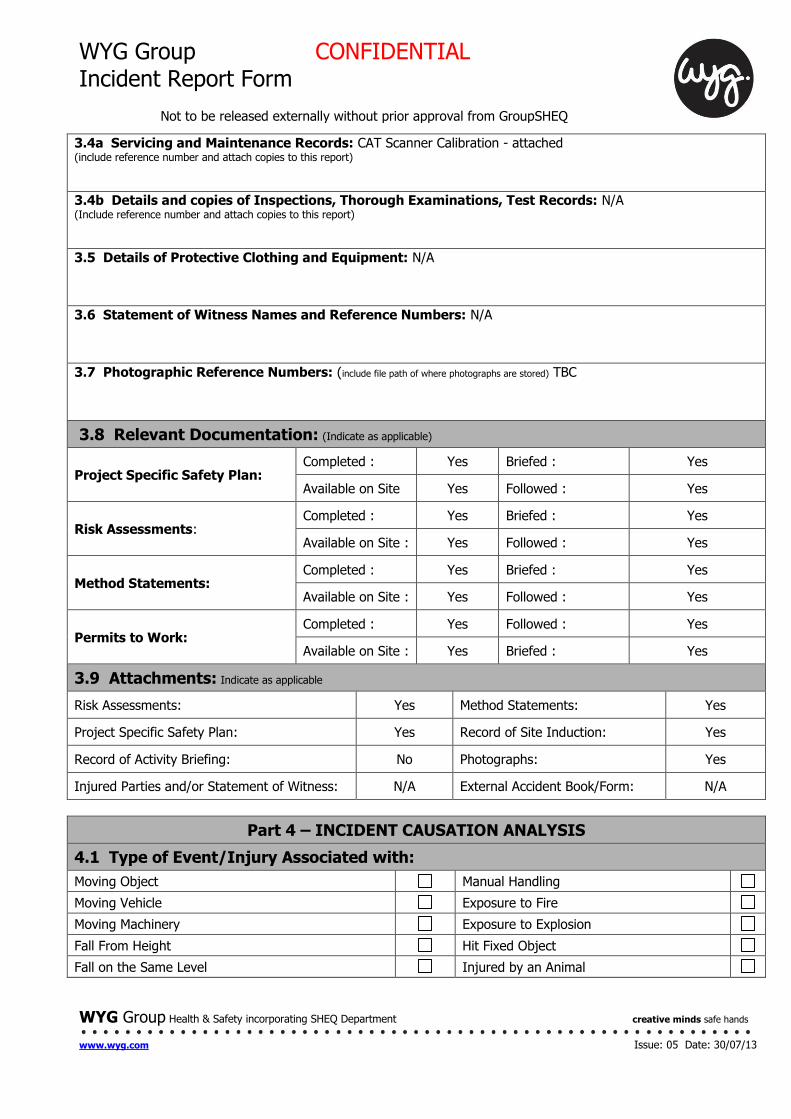
WYG Group CONFIDENTIAL Incident Report Form
Not to be released externally without prior approval from GroupSHEQ
WYG Group Health & Safety incorporating SHEQ Department creative minds safe hands
www.wyg.com Issue: 05 Date: 30/07/13
3.4a Servicing and Maintenance Records: CAT Scanner Calibration - attached (include reference number and attach copies to this report)
3.4b Details and copies of Inspections, Thorough Examinations, Test Records: N/A (Include reference number and attach copies to this report)
3.5 Details of Protective Clothing and Equipment: N/A
3.6 Statement of Witness Names and Reference Numbers: N/A
3.7 Photographic Reference Numbers: (include file path of where photographs are stored) TBC
3.8 Relevant Documentation: (Indicate as applicable)
Project Specific Safety Plan: Completed : Yes Briefed : Yes
Available on Site Yes Followed : Yes
Risk Assessments: Completed : Yes Briefed : Yes
Available on Site : Yes Followed : Yes
Method Statements: Completed : Yes Briefed : Yes
Available on Site : Yes Followed : Yes
Permits to Work: Completed : Yes Followed : Yes
Available on Site : Yes Briefed : Yes
3.9 Attachments: Indicate as applicable
Risk Assessments: Yes Method Statements: Yes
Project Specific Safety Plan: Yes Record of Site Induction: Yes
Record of Activity Briefing: No Photographs: Yes
Injured Parties and/or Statement of Witness: N/A External Accident Book/Form: N/A
Part 4 – INCIDENT CAUSATION ANALYSIS
4.1 Type of Event/Injury Associated with:
Moving Object Manual Handling
Moving Vehicle Exposure to Fire
Moving Machinery Exposure to Explosion
Fall From Height Hit Fixed Object
Fall on the Same Level Injured by an Animal
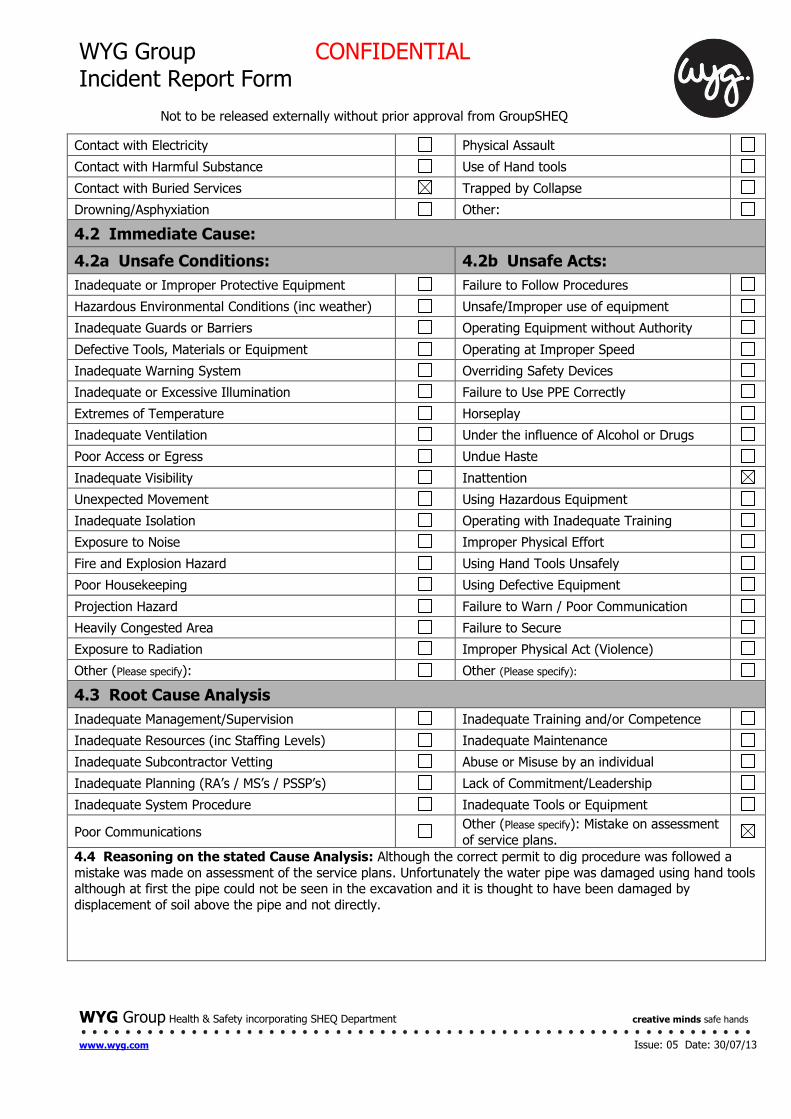
WYG Group CONFIDENTIAL Incident Report Form
Not to be released externally without prior approval from GroupSHEQ
WYG Group Health & Safety incorporating SHEQ Department creative minds safe hands
www.wyg.com Issue: 05 Date: 30/07/13
Contact with Electricity Physical Assault
Contact with Harmful Substance Use of Hand tools
Contact with Buried Services Trapped by Collapse
Drowning/Asphyxiation Other:
4.2 Immediate Cause:
4.2a Unsafe Conditions: 4.2b Unsafe Acts:
Inadequate or Improper Protective Equipment Failure to Follow Procedures
Hazardous Environmental Conditions (inc weather) Unsafe/Improper use of equipment
Inadequate Guards or Barriers Operating Equipment without Authority
Defective Tools, Materials or Equipment Operating at Improper Speed
Inadequate Warning System Overriding Safety Devices
Inadequate or Excessive Illumination Failure to Use PPE Correctly
Extremes of Temperature Horseplay
Inadequate Ventilation Under the influence of Alcohol or Drugs
Poor Access or Egress Undue Haste
Inadequate Visibility Inattention
Unexpected Movement Using Hazardous Equipment
Inadequate Isolation Operating with Inadequate Training
Exposure to Noise Improper Physical Effort
Fire and Explosion Hazard Using Hand Tools Unsafely
Poor Housekeeping Using Defective Equipment
Projection Hazard Failure to Warn / Poor Communication
Heavily Congested Area Failure to Secure
Exposure to Radiation Improper Physical Act (Violence)
Other (Please specify): Other (Please specify):
4.3 Root Cause Analysis
Inadequate Management/Supervision Inadequate Training and/or Competence
Inadequate Resources (inc Staffing Levels) Inadequate Maintenance
Inadequate Subcontractor Vetting Abuse or Misuse by an individual
Inadequate Planning (RA’s / MS’s / PSSP’s) Lack of Commitment/Leadership
Inadequate System Procedure Inadequate Tools or Equipment
Poor Communications Other (Please specify): Mistake on assessment
of service plans.
4.4 Reasoning on the stated Cause Analysis: Although the correct permit to dig procedure was followed a
mistake was made on assessment of the service plans. Unfortunately the water pipe was damaged using hand tools although at first the pipe could not be seen in the excavation and it is thought to have been damaged by
displacement of soil above the pipe and not directly.
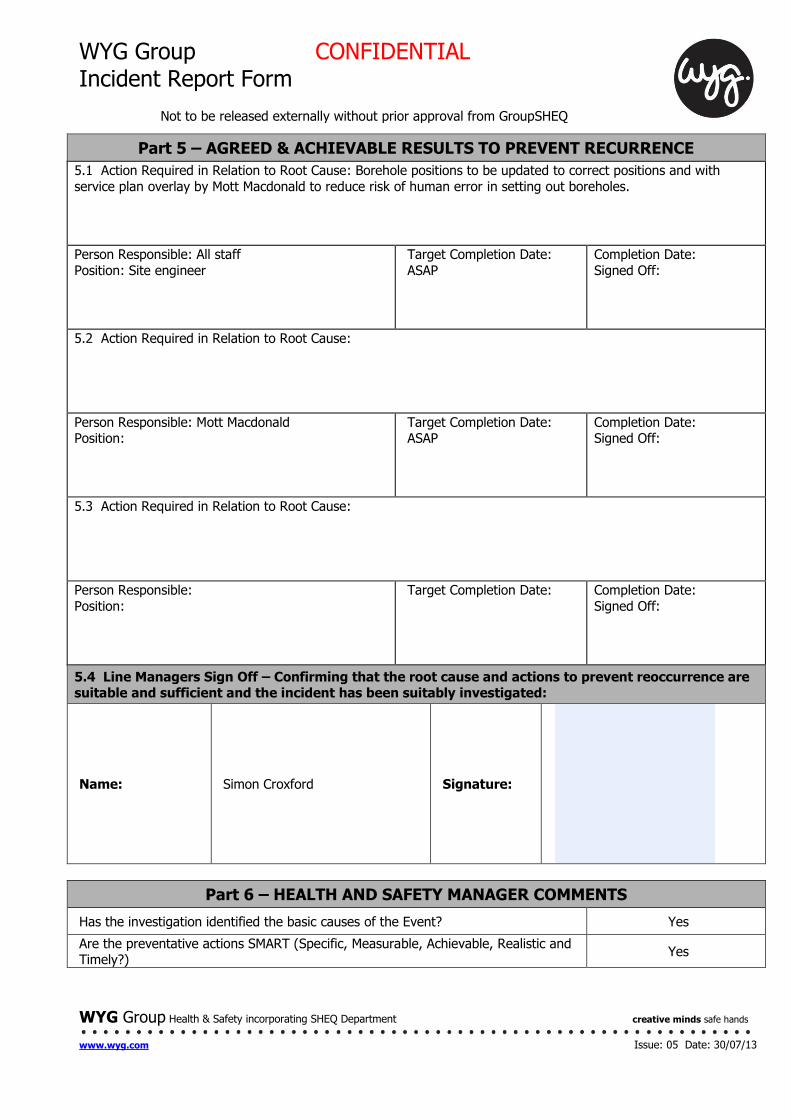
WYG Group CONFIDENTIAL Incident Report Form
Not to be released externally without prior approval from GroupSHEQ
WYG Group Health & Safety incorporating SHEQ Department creative minds safe hands
www.wyg.com Issue: 05 Date: 30/07/13
Part 5 – AGREED & ACHIEVABLE RESULTS TO PREVENT RECURRENCE
5.1 Action Required in Relation to Root Cause: Borehole positions to be updated to correct positions and with
service plan overlay by Mott Macdonald to reduce risk of human error in setting out boreholes.
Person Responsible: All staff
Position: Site engineer
Target Completion Date:
ASAP
Completion Date:
Signed Off:
5.2 Action Required in Relation to Root Cause:
Person Responsible: Mott Macdonald Position:
Target Completion Date: ASAP
Completion Date: Signed Off:
5.3 Action Required in Relation to Root Cause:
Person Responsible:
Position:
Target Completion Date:
Completion Date:
Signed Off:
5.4 Line Managers Sign Off – Confirming that the root cause and actions to prevent reoccurrence are suitable and sufficient and the incident has been suitably investigated:
Name: Simon Croxford Signature:
Part 6 – HEALTH AND SAFETY MANAGER COMMENTS
Has the investigation identified the basic causes of the Event? Yes
Are the preventative actions SMART (Specific, Measurable, Achievable, Realistic and Timely?)
Yes
WYG Group CONFIDENTIAL Incident Report Form
Not to be released externally without prior approval from GroupSHEQ
WYG Group Health & Safety incorporating SHEQ Department creative minds safe hands
www.wyg.com Issue: 05 Date: 30/07/13
Comments:
Reviewer’s Signature:
Print Name: Date:
Circulation Required: Click Here Date Issued:
Reason:
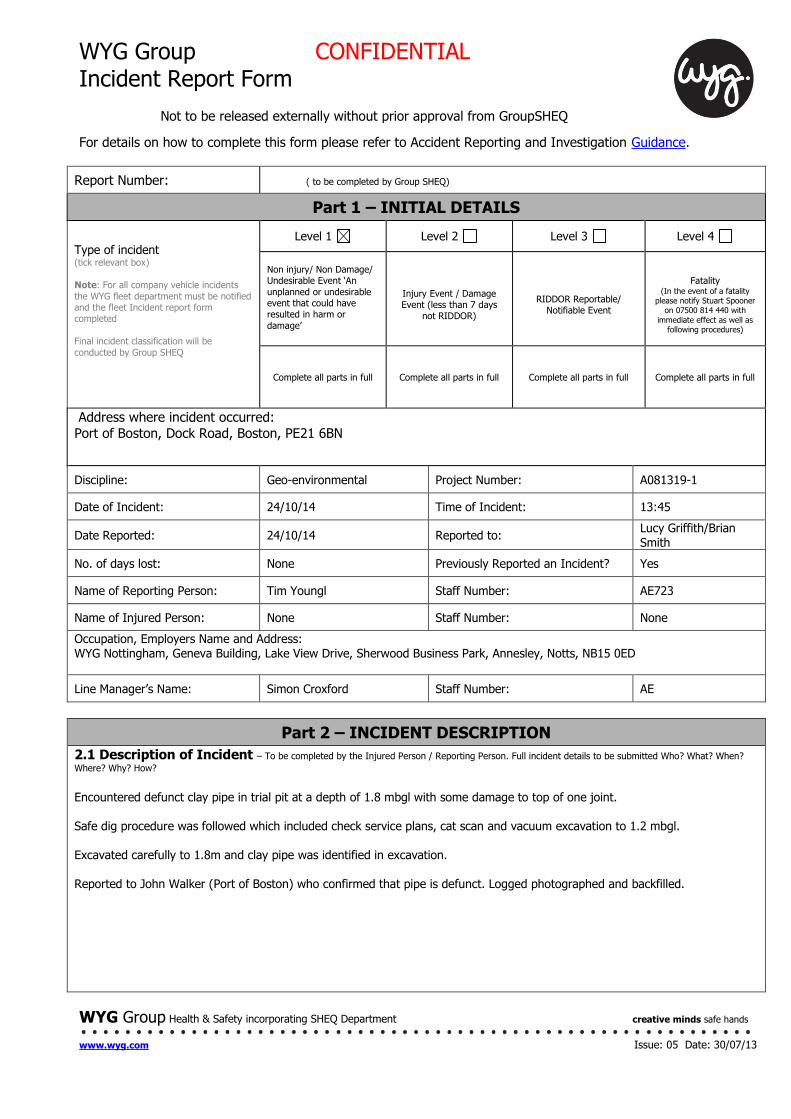
WYG Group CONFIDENTIAL Incident Report Form
Not to be released externally without prior approval from GroupSHEQ
WYG Group Health & Safety incorporating SHEQ Department creative minds safe hands
www.wyg.com Issue: 05 Date: 30/07/13
For details on how to complete this form please refer to Accident Reporting and Investigation Guidance.
Report Number: ( to be completed by Group SHEQ)
Part 1 – INITIAL DETAILS
Type of incident (tick relevant box)
Note: For all company vehicle incidents
the WYG fleet department must be notified and the fleet Incident report form completed
Final incident classification will be
conducted by Group SHEQ
Level 1 Level 2 Level 3 Level 4
Non injury/ Non Damage/ Undesirable Event ‘An
unplanned or undesirable event that could have resulted in harm or
damage’
Injury Event / Damage Event (less than 7 days
not RIDDOR)
RIDDOR Reportable/ Notifiable Event
Fatality
(In the event of a fatality please notify Stuart Spooner
on 07500 814 440 with
immediate effect as well as following procedures)
Complete all parts in full Complete all parts in full Complete all parts in full Complete all parts in full
Address where incident occurred:
Port of Boston, Dock Road, Boston, PE21 6BN
Discipline: Geo-environmental Project Number: A081319-1
Date of Incident: 24/10/14 Time of Incident: 13:45
Date Reported: 24/10/14 Reported to: Lucy Griffith/Brian Smith
No. of days lost: None Previously Reported an Incident? Yes
Name of Reporting Person: Tim Youngl Staff Number: AE723
Name of Injured Person: None Staff Number: None
Occupation, Employers Name and Address: WYG Nottingham, Geneva Building, Lake View Drive, Sherwood Business Park, Annesley, Notts, NB15 0ED
Line Manager’s Name: Simon Croxford Staff Number: AE
Part 2 – INCIDENT DESCRIPTION
2.1 Description of Incident – To be completed by the Injured Person / Reporting Person. Full incident details to be submitted Who? What? When?
Where? Why? How?
Encountered defunct clay pipe in trial pit at a depth of 1.8 mbgl with some damage to top of one joint. Safe dig procedure was followed which included check service plans, cat scan and vacuum excavation to 1.2 mbgl. Excavated carefully to 1.8m and clay pipe was identified in excavation. Reported to John Walker (Port of Boston) who confirmed that pipe is defunct. Logged photographed and backfilled.
WYG Group CONFIDENTIAL Incident Report Form
Not to be released externally without prior approval from GroupSHEQ
WYG Group Health & Safety incorporating SHEQ Department creative minds safe hands
www.wyg.com Issue: 05 Date: 30/07/13
2.2 Injury Sustained: None
2.3 First Aid/Follow Up Treatment: N/A
2.4 Person completing this form – I agree that the above details are correct and a true representation of events.
Name: Tim Young
Signature:
Date: 14/10/14
Part 3 – INCIDENT DETAILS
3.1 Person(s) in Direct Control of the Workplace: Gary Sherriff
3.2 Relevant Information, Instructions and Training given before the Incident: Gary is Cat trained and followed the safe dig procedure which included a service plan check, marking up of services on the ground and
hand dug pit. The defunct pipe was not shown on any plans and is likely associated with a building that has been demolished in the area.
3.3 Plant and Equipment details: CAT scanner, vacuum excavator and excavator.
3.4a Servicing and Maintenance Records: CAT Scanner Calibration - attached (include reference number and attach copies to this report)
3.4b Details and copies of Inspections, Thorough Examinations, Test Records: N/A (Include reference number and attach copies to this report)
3.5 Details of Protective Clothing and Equipment: N/A
3.6 Statement of Witness Names and Reference Numbers: N/A
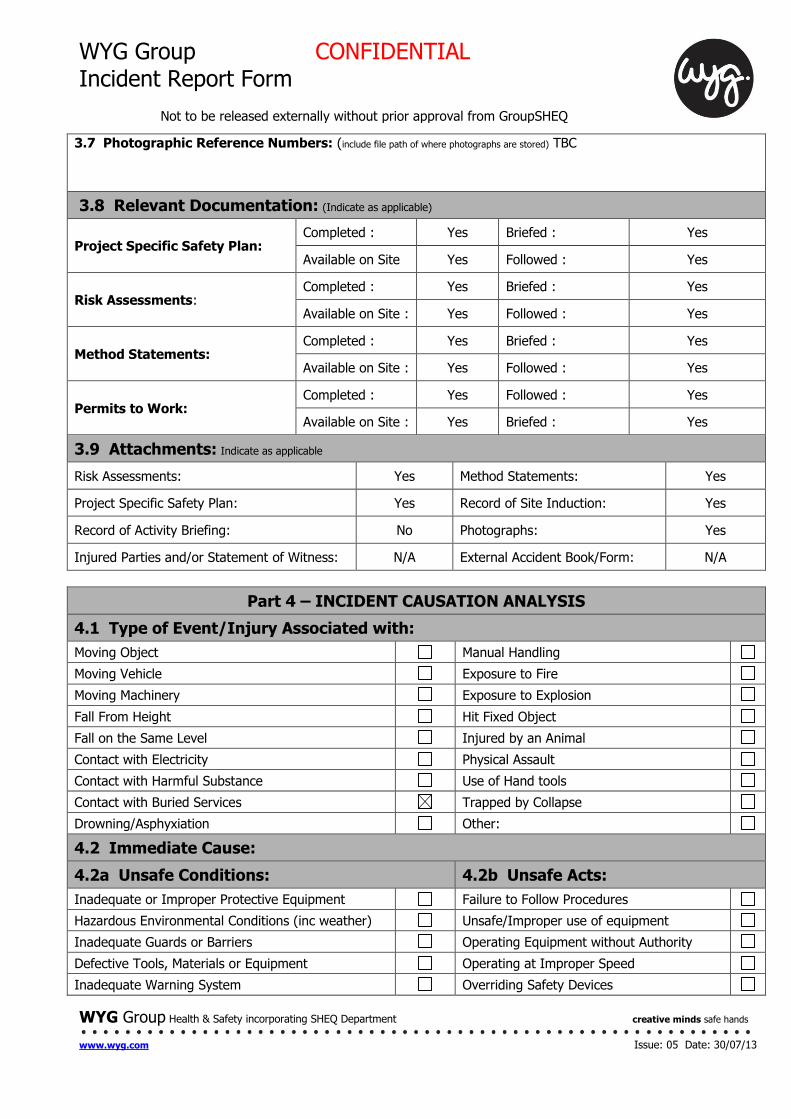
WYG Group CONFIDENTIAL Incident Report Form
Not to be released externally without prior approval from GroupSHEQ
WYG Group Health & Safety incorporating SHEQ Department creative minds safe hands
www.wyg.com Issue: 05 Date: 30/07/13
3.7 Photographic Reference Numbers: (include file path of where photographs are stored) TBC
3.8 Relevant Documentation: (Indicate as applicable)
Project Specific Safety Plan: Completed : Yes Briefed : Yes
Available on Site Yes Followed : Yes
Risk Assessments: Completed : Yes Briefed : Yes
Available on Site : Yes Followed : Yes
Method Statements: Completed : Yes Briefed : Yes
Available on Site : Yes Followed : Yes
Permits to Work: Completed : Yes Followed : Yes
Available on Site : Yes Briefed : Yes
3.9 Attachments: Indicate as applicable
Risk Assessments: Yes Method Statements: Yes
Project Specific Safety Plan: Yes Record of Site Induction: Yes
Record of Activity Briefing: No Photographs: Yes
Injured Parties and/or Statement of Witness: N/A External Accident Book/Form: N/A
Part 4 – INCIDENT CAUSATION ANALYSIS
4.1 Type of Event/Injury Associated with:
Moving Object Manual Handling
Moving Vehicle Exposure to Fire
Moving Machinery Exposure to Explosion
Fall From Height Hit Fixed Object
Fall on the Same Level Injured by an Animal
Contact with Electricity Physical Assault
Contact with Harmful Substance Use of Hand tools
Contact with Buried Services Trapped by Collapse
Drowning/Asphyxiation Other:
4.2 Immediate Cause:
4.2a Unsafe Conditions: 4.2b Unsafe Acts:
Inadequate or Improper Protective Equipment Failure to Follow Procedures
Hazardous Environmental Conditions (inc weather) Unsafe/Improper use of equipment
Inadequate Guards or Barriers Operating Equipment without Authority
Defective Tools, Materials or Equipment Operating at Improper Speed
Inadequate Warning System Overriding Safety Devices
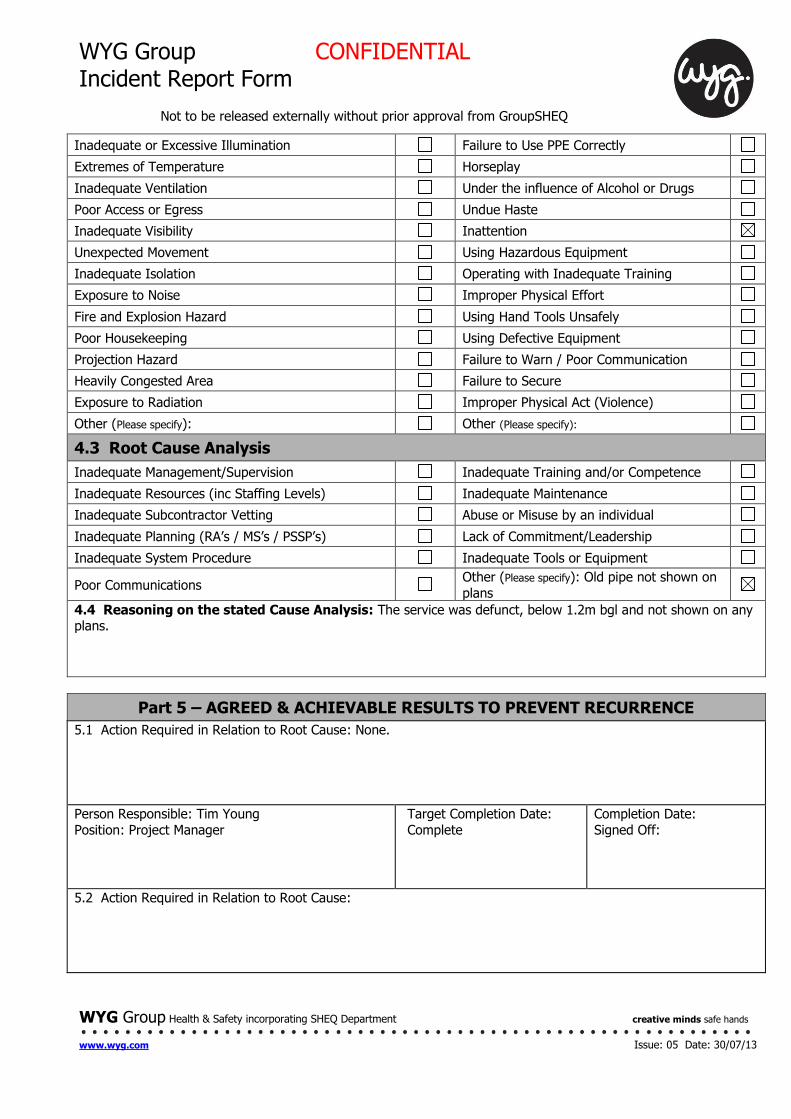
WYG Group CONFIDENTIAL Incident Report Form
Not to be released externally without prior approval from GroupSHEQ
WYG Group Health & Safety incorporating SHEQ Department creative minds safe hands
www.wyg.com Issue: 05 Date: 30/07/13
Inadequate or Excessive Illumination Failure to Use PPE Correctly
Extremes of Temperature Horseplay
Inadequate Ventilation Under the influence of Alcohol or Drugs
Poor Access or Egress Undue Haste
Inadequate Visibility Inattention
Unexpected Movement Using Hazardous Equipment
Inadequate Isolation Operating with Inadequate Training
Exposure to Noise Improper Physical Effort
Fire and Explosion Hazard Using Hand Tools Unsafely
Poor Housekeeping Using Defective Equipment
Projection Hazard Failure to Warn / Poor Communication
Heavily Congested Area Failure to Secure
Exposure to Radiation Improper Physical Act (Violence)
Other (Please specify): Other (Please specify):
4.3 Root Cause Analysis
Inadequate Management/Supervision Inadequate Training and/or Competence
Inadequate Resources (inc Staffing Levels) Inadequate Maintenance
Inadequate Subcontractor Vetting Abuse or Misuse by an individual
Inadequate Planning (RA’s / MS’s / PSSP’s) Lack of Commitment/Leadership
Inadequate System Procedure Inadequate Tools or Equipment
Poor Communications Other (Please specify): Old pipe not shown on
plans
4.4 Reasoning on the stated Cause Analysis: The service was defunct, below 1.2m bgl and not shown on any plans.
Part 5 – AGREED & ACHIEVABLE RESULTS TO PREVENT RECURRENCE
5.1 Action Required in Relation to Root Cause: None.
Person Responsible: Tim Young
Position: Project Manager
Target Completion Date:
Complete
Completion Date:
Signed Off:
5.2 Action Required in Relation to Root Cause:
WYG Group CONFIDENTIAL Incident Report Form
Not to be released externally without prior approval from GroupSHEQ
WYG Group Health & Safety incorporating SHEQ Department creative minds safe hands
www.wyg.com Issue: 05 Date: 30/07/13
Person Responsible: Position:
Target Completion Date: ASAP
Completion Date: Signed Off:
5.3 Action Required in Relation to Root Cause:
Person Responsible:
Position:
Target Completion Date:
Completion Date:
Signed Off:
5.4 Line Managers Sign Off – Confirming that the root cause and actions to prevent reoccurrence are suitable and sufficient and the incident has been suitably investigated:
Name: Simon Croxford Signature:
Part 6 – HEALTH AND SAFETY MANAGER COMMENTS
Has the investigation identified the basic causes of the Event? Yes
Are the preventative actions SMART (Specific, Measurable, Achievable, Realistic and Timely?)
Yes
Comments:
Reviewer’s Signature:
Print Name: Date:
Circulation Required: Click Here Date Issued:
Reason:

Boston Barrier Ground Investigation Report
335092/WCD/WAM/01/A 07 February 2015 pims/339200 Boston Barrier TWAO/Products/Design Products/GI/GIR
94
Appendix D. Geological Cross Sections
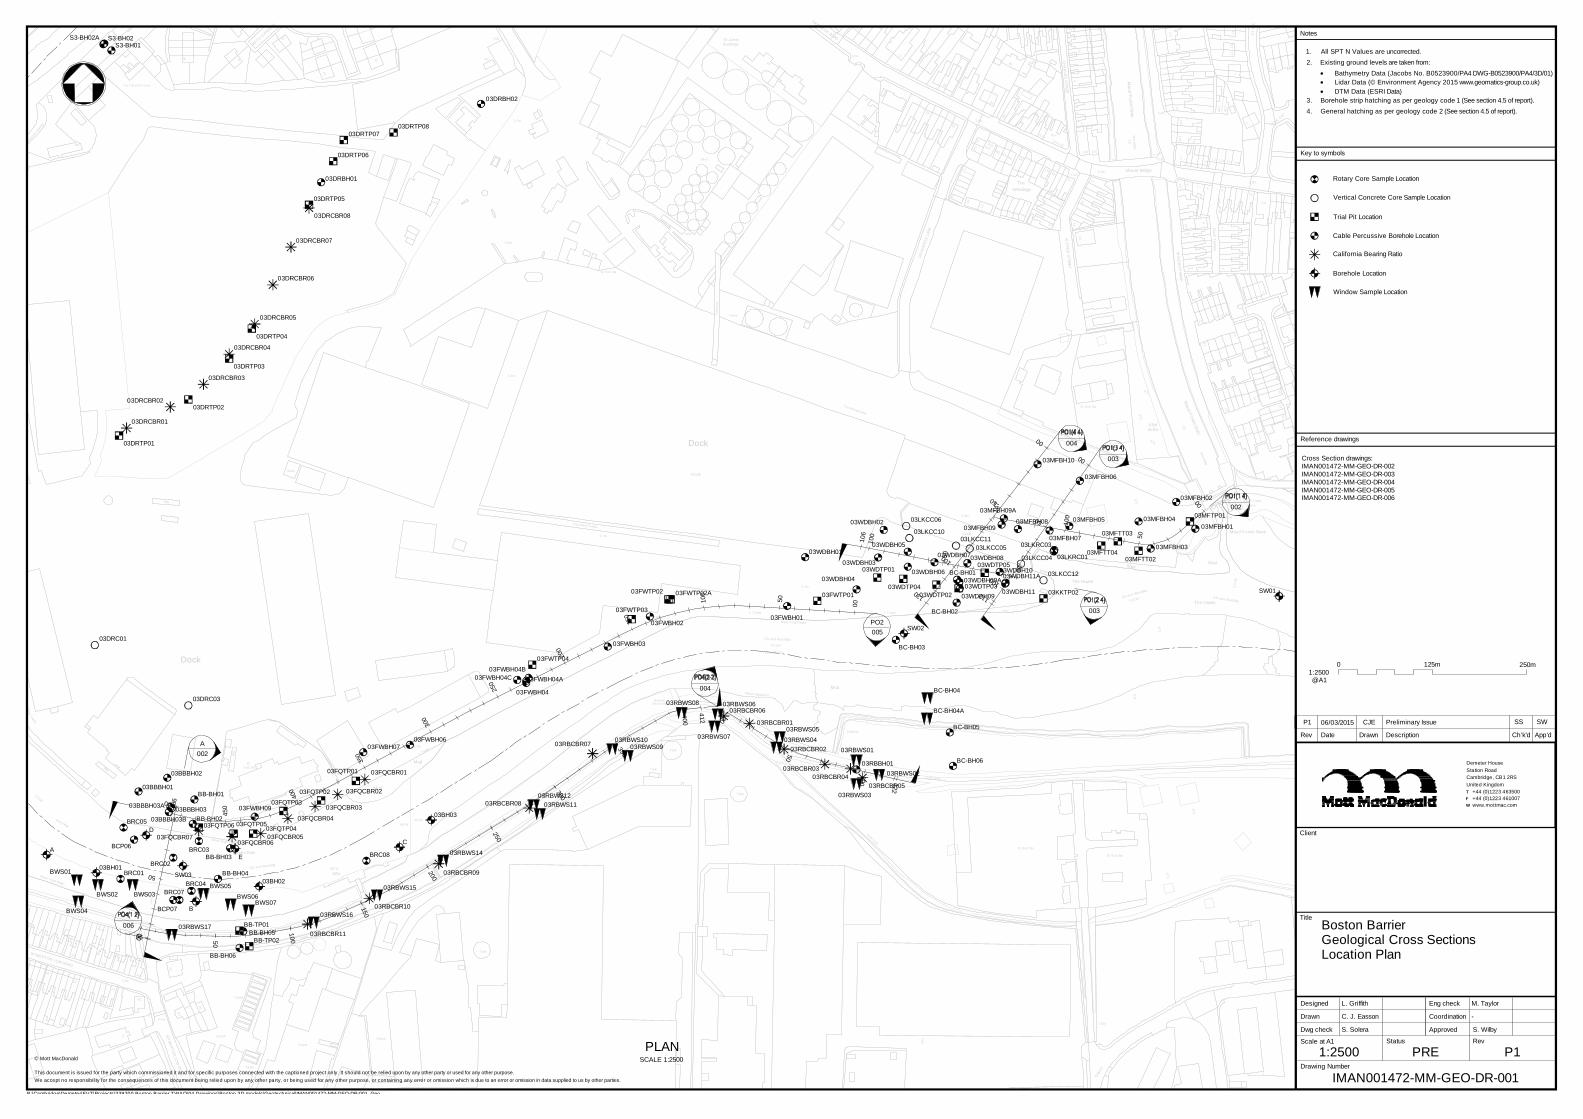
Track
59 Tanks
50
SKIRBECK
Dock
54
WB
El
Depot
34
Crane
Travell ing
35
WYBER
TON
LOW
RO
AD
Depot
Mud
Tanks
Mean High Water
14
2.4m
24
Sub Sta
Path (um)
Posts
46
60
WB
45
Mud
Depot
Mean High Water
57
WB
6 15
5.2m
14
Slopin
g mas
onry
36
BATH GARDEN
S
10
El Sub Sta
L Tower
Path (um)
Mean High Water
ETL
ETL
Tank
Mud
Mud
LEA
LAN
D
Path (um)
L Tower
5.5m
El Sub Sta
( fixed amber)
Water
Path (um)
3.0m
L Tower
Track
L Tower
Dock
ETL
L Tower
Tank
WAY
5.5m
Mud
Tank
Beacon
Mean High
Collects
Tank
81
132
2
PH
10 14
Maud Foster
1
154
140M
aud Foster Drain
WIN
DS
OR
BANK
127
142
138
12a
1a
15
12
139
11
1
15
14a
7
3.0m
11a
Dock Terrace
137
148
ST
NIC
143
The Haven
3
THE COURTY
ARD
Sluice
5
5.8m
Mud
12
ETL
37
DR
AKA
RD
S LA
NE
2.4m
Allot
The Haven
1
CH
AR
LES
STR
EET
TCB
1a
MHW
Gdns
Dock
15
Con
veyo
r
St John's
2a
PH
20
3.7m
59b
1
67
El Sub Sta
PC
ETL
11
98
WB
ALF
RE
D S
TREET
75
82
5.2m
ETL
69
18
Travel l ing Crane
59a
5.8m
3.0m
Silos
17
62
10
Lock
57b
112
6.1m
114 11657a
13
4.0m
72
16
59c
Mount Bridge
Mud
6
SKIRBECK ROAD
92
ETL
ETL
Maud Foster Drain
53
2
1
35
14
Buildings
6.1m
3.0m
Travelling Cranes
TCB
45
96
TCB
118
6.1m
94
11
El Sub Sta
120
ETL
ETL
MLW
MLW
MLW
MLW
Mast
The Old Bath House
Tanks
MLW
71
9147
The
5
61
12
Windings
1
17
1114
7
22
37
6
42
32
26
18
25
44
41
31
CCLW
Ward Bdy
ED and Ward Bdy
CCLW
Ward Bdy
CC
LW
Und
ED and Ward Bdy
ED and Ward Bdy
CD
CD
CCLW
Ward Bdy
ED and Ward Bdy
Jetty
The Haven
Haven East
Dock
Maud Foster Sluice
WYBERTON LOW ROAD
00
50
90
00
50100
150
200
250
300
350
400
45048
6
00 50
100
150
200
250
300
350
400
412 00
50
100 122
00
50
100
147
00
50
100
106
00
50
100
112
00
50
100
130
03FQCBR03
03FQCBR05
03FQCBR02
03FQCBR01
03FQCBR0703FQCBR06
03FQCBR04
03DRCBR05
03RBCBR01
03DRCBR08
03RBCBR04
03DRCBR06
03DRCBR03
03RBCBR07
03DRCBR02
03RBCBR05
03RBCBR09
03RBCBR11
03RBCBR06
03DRCBR07
03DRCBR01
03RBCBR10
03DRCBR04
03RBCBR08
03RBCBR02
03RBCBR03
03LKCC10
03LKCC0403LKCC05
03LKCC06
03LKCC12
03DRC01
03DRC03
03LKCC11
03WDBH08
03MFBH05
03BBBH03A
03FWBH03
03WDBH03
03MFBH09
03MFBH09A
03MFBH06
03FWBH04B
03FWBH01
03BBBH01
03FWBH06
03FWBH09
03MFBH10
03MFBH07
03BBBH02
03MFBH01
03FWBH04A
03FWBH04
03WDBH10
03MFBH03
03MFBH04
03WDBH0503WDBH01
03WDBH09
03FWBH07
03WDBH09A
03DRBH01
03MFBH0803WDBH02
03BBBH0303BBBH03B
03FWBH04C
03WDBH04
03RBBH01
03DRBH02
03FWBH02
03WDBH07
03WDBH06
03MFBH02
03WDBH11A
03WDBH11
BCP06
BCP07
BC-BH03
BB-BH04
BB-BH03
BB-BH05
BC-BH02
BB-BH06
BB-BH01
BB-BH02
BC-BH05
BC-BH06
BC-BH01
S3-BH02AS3-BH01
S3-BH02
03LKRC03
03LKRC01
BRC05
BRC01
BRC03
BRC07
BRC08
BRC04
BRC02
03BH02
03BH01
03BH03
C
E
D
A
B
SW01
SW03
SW02
03KKTP02
03FQTP06
03FQTP03
03FQTP01
03DRTP02
03FWTP01
03DRTP04
03FQTP05
03MFTT02
03DRTP07
03DRTP03
03DRTP06
03FWTP03
03DRTP05
03FQTP04
03FWTP02A
03FWTP04
03MFTT04
03MFTP01
03FWTP02
03FQTP02
03MFTT03
03DRTP01
03DRTP08
03WDTP0203WDTP03
03WDTP01
03WDTP04
03WDTP05
BB-TP02
BB-TP01
03RBWS12
03RBWS15
03RBWS17
03RBWS16
03RBWS09
03RBWS11
03RBWS08 03RBWS06
03RBWS0103RBWS10
03RBWS14
03RBWS03
03RBWS04
03RBWS02
03RBWS0703RBWS05
BWS06
BWS04
BWS01
BWS07BWS02
BWS05BWS03
BC-BH04
BC-BH04A
002A
006
005PO2
004
003
002
003
004
Key to symbols
App’dCh’k’dDescriptionDrawnDateRev
RevStatus
Drawing Number
Scale at A1
Eng check
Approved
Coordination
Dwg check
Drawn
Designed
Title
Notes
Client
P:\Cambridge\Demeter\EVT\Pro jects\301603 Pledges Fishpass Study\CAD\Working Drawings\Civil\2D models\EA Logo.jpg
@A1
PLANSCALE 1:2500
P:\Cambridge\Demeter\EVT\Projects\339200 Boston Barrier TWAO\04 Drawings\Boston 3D models\Geotechnical\IMAN001472-MM-GEO-DR-001_Geo
TFW
Boston BarrierGeological Cross SectionsLocation Plan
L. Griffith
C. J. Easson
S. Solera
M. Taylor
-
S. Wilby
1:2500 PRE
IMAN001472-MM-GEO-DR-001
P1
Demeter HouseStation RoadCambridge, CB1 2RSUnited Kingdom
+44 (0)1223 463500+44 (0)1223 461007www.mottmac.com
© Mott MacDonald
This document is issued for the party which commissioned it and for specific purposes connected with the captioned project only. It should not be relied upon by any other party or used for any other purpose.We accept no responsibility for the consequences of this document being relied upon by any other party, or being used for any other purpose, or containing any error or omission which is due to an error or omission in data supplied to us by other parties.
125m 250m01:2500
Reference drawings
Rotary Core Sample Location
Vertical Concrete Core Sample Location
Trial Pit Location
Cable Percussive Borehole Location
California Bearing Ratio
Borehole Location
Window Sample Location
Cross Section drawings:IMAN001472-MM-GEO-DR-002IMAN001472-MM-GEO-DR-003IMAN001472-MM-GEO-DR-004IMAN001472-MM-GEO-DR-005IMAN001472-MM-GEO-DR-006
1. All SPT N Values are uncorrected.2. Existing ground levels are taken from:
Bathymetry Data (Jacobs No. B0523900/PA4 DWG-B0523900/PA4/3D/01)Lidar Data (© Environment Agency 2015 www.geomatics-group.co.uk)DTM Data (ESRI Data)
3. Borehole strip hatching as per geology code 1 (See section 4.5 of report).4. General hatching as per geology code 2 (See section 4.5 of report).
P1 06/03/2015 CJE Preliminary Issue SS SW
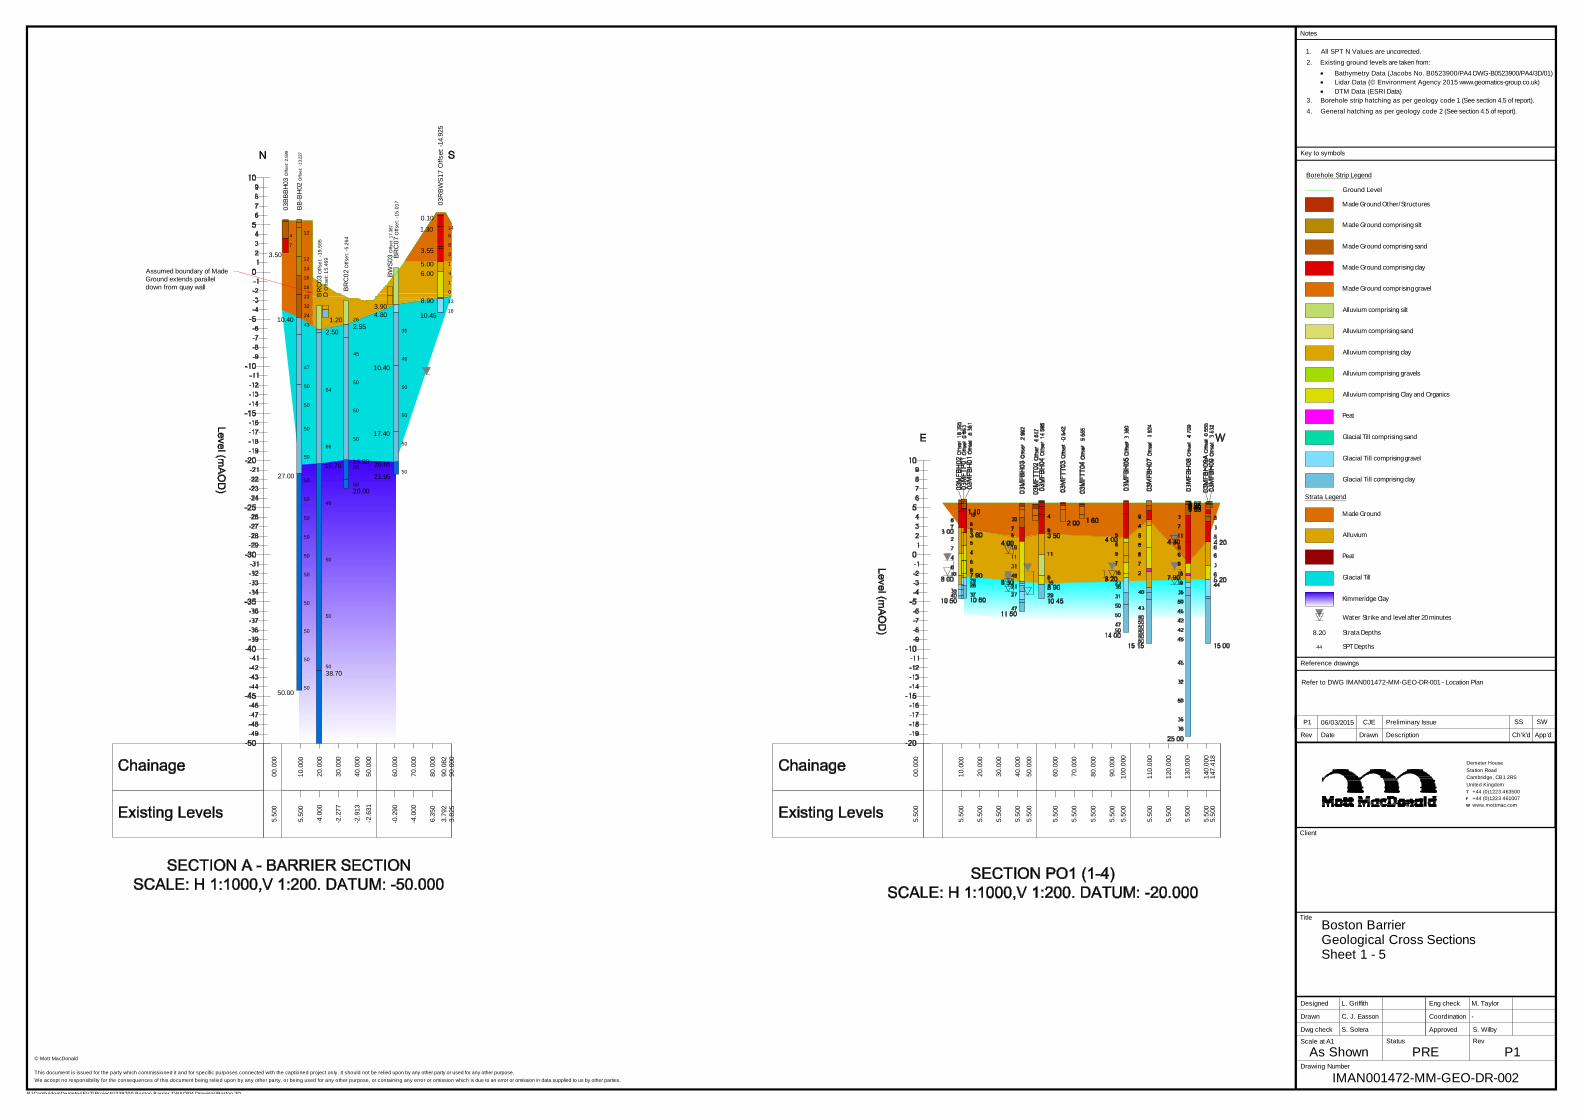
35
46
50
50
50
50
3.904.80
10.40
17.40
20.65
21.95
00.0
00
10.0
00
20.0
00
30.0
00
40.0
00
50.0
00
60.0
00
70.0
00
80.0
00
90.0
0090
.082
5.50
0
5.50
0
-4.0
00
-4.0
00
6.35
0
3.82
53.
792
48
50
50
2.50
16.70
38.70
146
3
8
1
4
1
0
13
18
0.10
1.30
3.55
6.005.00
8.90
10.45
4
7
3.50
54
1.20
66
12
12
50
14
18
16
22
32
24
43
50
47
50
50
50
50
50
50
26
50
45
50
50
50
50
50
50
50
50
50
50
50
2.55
16.90
20.00
10.40
27.00
50.00
BW
S03
Offs
et: 1
7.38
7
BRC
02O
ffset
: -5.
264
03B
BB
H03
Offs
et: 2
.599
03R
BW
S17
Offs
et: -
14.9
25
DO
ffset
: 15.
469 BR
C07
Offs
et: -
15.0
17BB
-BH
02O
ffset
: -13
.227
BRC
03O
ffset
: -19
.595
Assumed boundary of MadeGround extends paralleldown from quay wall
-2.2
77
-2.6
31
-2.9
13
-0.2
90
00.0
00
10.0
00
20.0
00
30.0
00
40.0
00
50.0
00
60.0
00
70.0
00
80.0
00
90.0
00
100.
000
110.
000
120.
000
130.
000
140.
000
147.
418
5.50
0
5.50
0
5.50
0
5.50
0
5.50
0
5.50
0
5.50
0
5.50
0
5.50
0
5.50
0
5.50
0
5.50
0
5.50
0
5.50
0
5.50
05.
500
Key to symbols
App’dCh’k’dDescriptionDrawnDateRev
RevStatus
Drawing Number
Scale at A1
Eng check
Approved
Coordination
Dwg check
Drawn
Designed
Title
Notes
Client
P:\Cambridge\Demeter\EVT\Pro jects\301603 Pledges Fishpass Study\CAD\Working Drawings\Civil\2D models\EA Logo.jpg
P:\Cambridge\Demeter\EVT\Projects\339200 Boston Barrier TWAO\04 Drawings\Boston 3D
TFW
Boston BarrierGeological Cross SectionsSheet 1 - 5
L. Griffith
C. J. Easson
S. Solera
M. Taylor
-
S. Wilby
As Shown PRE
IMAN001472-MM-GEO-DR-002
P1
Demeter HouseStation RoadCambridge, CB1 2RSUnited Kingdom
+44 (0)1223 463500+44 (0)1223 461007www.mottmac.com
© Mott MacDonald
This document is issued for the party which commissioned it and for specific purposes connected with the captioned project only. It should not be relied upon by any other party or used for any other purpose.We accept no responsibility for the consequences of this document being relied upon by any other party, or being used for any other purpose, or containing any error or omission which is due to an error or omission in data supplied to us by other parties.
Reference drawings
Ground Level
Made Ground Other/Structures
Made Ground comprising silt
Made Ground comprising sand
Made Ground comprising clay
Made Ground comprising gravel
Alluvium comprising silt
Alluvium comprising sand
Alluvium comprising clay
Alluvium comprising gravels
Alluvium comprising Clay and Organics
Peat
Glacial Till comprising sand
Glacial Till comprising gravel
Glacial Till comprising clay
Made Ground
Alluvium
Peat
Glacial Till
Kimmeridge Clay
Borehole Strip Legend
Strata Legend
Water Strike and level after 20 minutes
44
8.20 Strata Depths
SPT Depths
Refer to DWG IMAN001472-MM-GEO-DR-001 - Location Plan
1. All SPT N Values are uncorrected.2. Existing ground levels are taken from:
Bathymetry Data (Jacobs No. B0523900/PA4 DWG-B0523900/PA4/3D/01)Lidar Data (© Environment Agency 2015 www.geomatics-group.co.uk)DTM Data (ESRI Data)
3. Borehole strip hatching as per geology code 1 (See section 4.5 of report).4. General hatching as per geology code 2 (See section 4.5 of report).
P1 06/03/2015 CJE Preliminary Issue SS SW
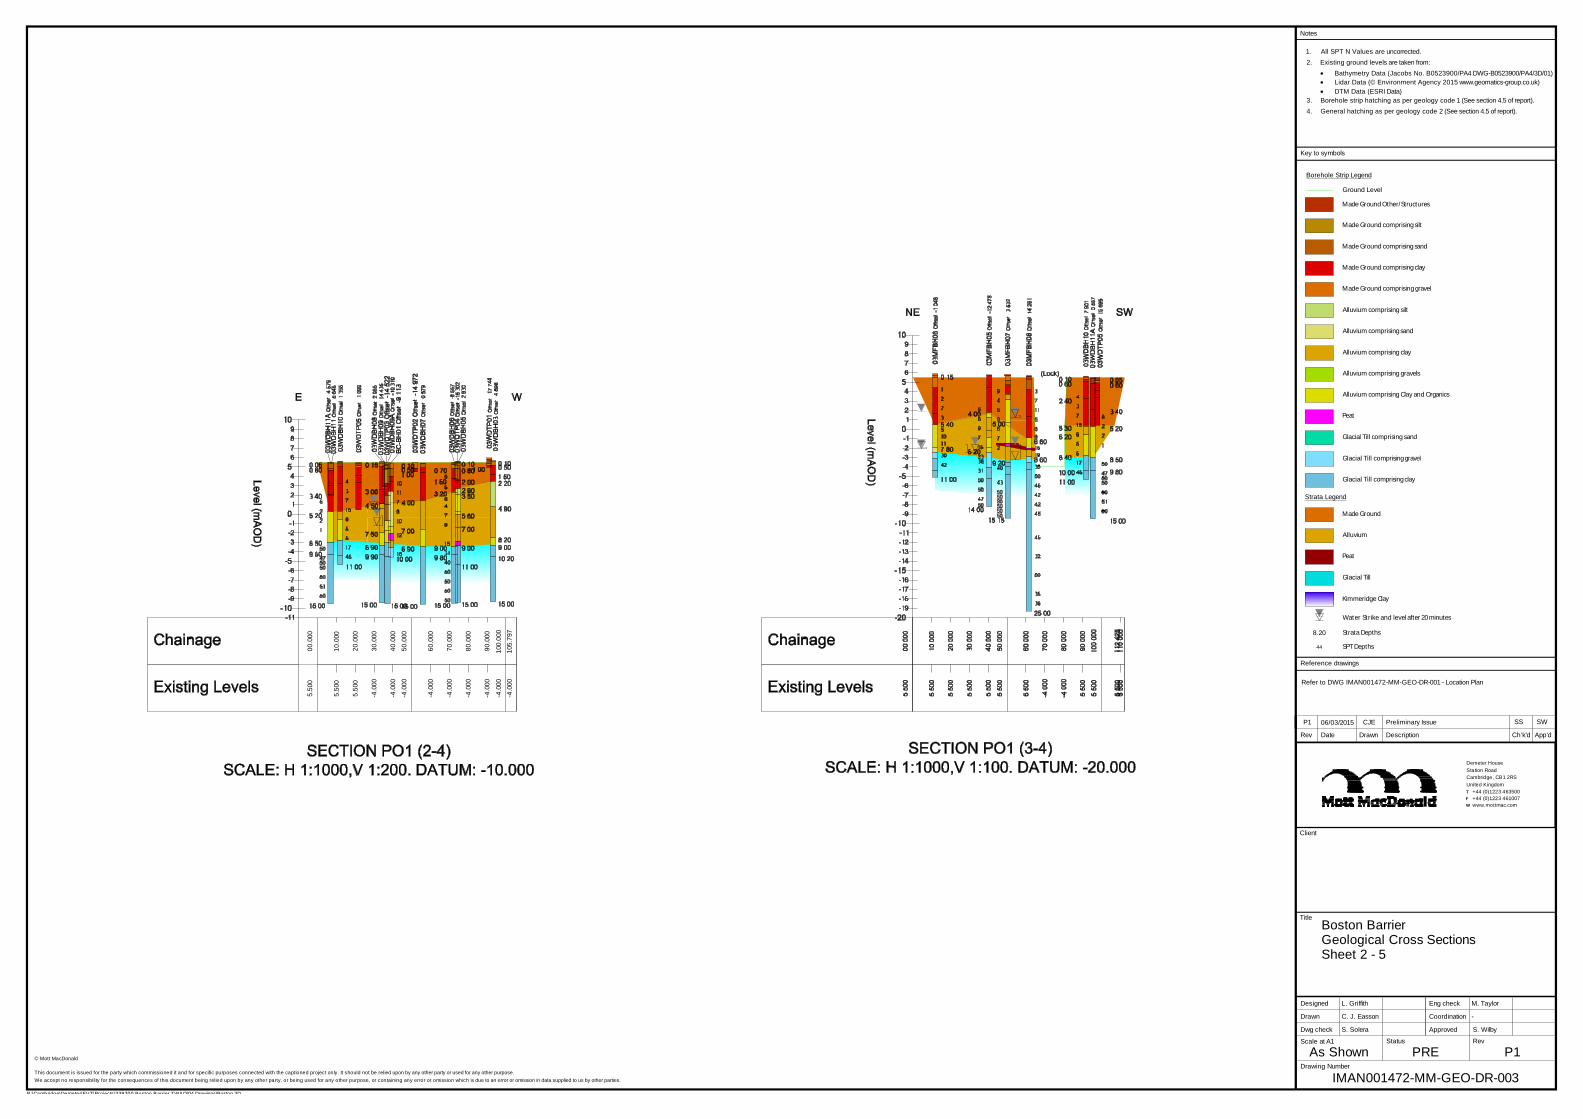
00.0
00
10.0
00
20.0
00
30.0
00
40.0
00
50.0
00
60.0
00
70.0
00
80.0
00
90.0
00
100.
000
105.
797
5.50
0
5.50
0
5.50
0
-4.0
00
-4.0
00
-4.0
00
-4.0
00
-4.0
00
-4.0
00
-4.0
00
-4.0
00-4
.000
Key to symbols
App’dCh’k’dDescriptionDrawnDateRev
RevStatus
Drawing Number
Scale at A1
Eng check
Approved
Coordination
Dwg check
Drawn
Designed
Title
Notes
Client
P:\Cambridge\Demeter\EVT\Pro jects\301603 Pledges Fishpass Study\CAD\Working Drawings\Civil\2D models\EA Logo.jpg
P:\Cambridge\Demeter\EVT\Projects\339200 Boston Barrier TWAO\04 Drawings\Boston 3D
TFW
Boston BarrierGeological Cross SectionsSheet 2 - 5
L. Griffith
C. J. Easson
S. Solera
M. Taylor
-
S. Wilby
As Shown PRE
IMAN001472-MM-GEO-DR-003
P1
Demeter HouseStation RoadCambridge, CB1 2RSUnited Kingdom
+44 (0)1223 463500+44 (0)1223 461007www.mottmac.com
© Mott MacDonald
This document is issued for the party which commissioned it and for specific purposes connected with the captioned project only. It should not be relied upon by any other party or used for any other purpose.We accept no responsibility for the consequences of this document being relied upon by any other party, or being used for any other purpose, or containing any error or omission which is due to an error or omission in data supplied to us by other parties.
Reference drawings
Ground Level
Made Ground Other/Structures
Made Ground comprising silt
Made Ground comprising sand
Made Ground comprising clay
Made Ground comprising gravel
Alluvium comprising silt
Alluvium comprising sand
Alluvium comprising clay
Alluvium comprising gravels
Alluvium comprising Clay and Organics
Peat
Glacial Till comprising sand
Glacial Till comprising gravel
Glacial Till comprising clay
Made Ground
Alluvium
Peat
Glacial Till
Kimmeridge Clay
Borehole Strip Legend
Strata Legend
Water Strike and level after 20 minutes
44
8.20 Strata Depths
SPT Depths
Refer to DWG IMAN001472-MM-GEO-DR-001 - Location Plan
1. All SPT N Values are uncorrected.2. Existing ground levels are taken from:
Bathymetry Data (Jacobs No. B0523900/PA4 DWG-B0523900/PA4/3D/01)Lidar Data (© Environment Agency 2015 www.geomatics-group.co.uk)DTM Data (ESRI Data)
3. Borehole strip hatching as per geology code 1 (See section 4.5 of report).4. General hatching as per geology code 2 (See section 4.5 of report).
P1 06/03/2015 CJE Preliminary Issue SS SW
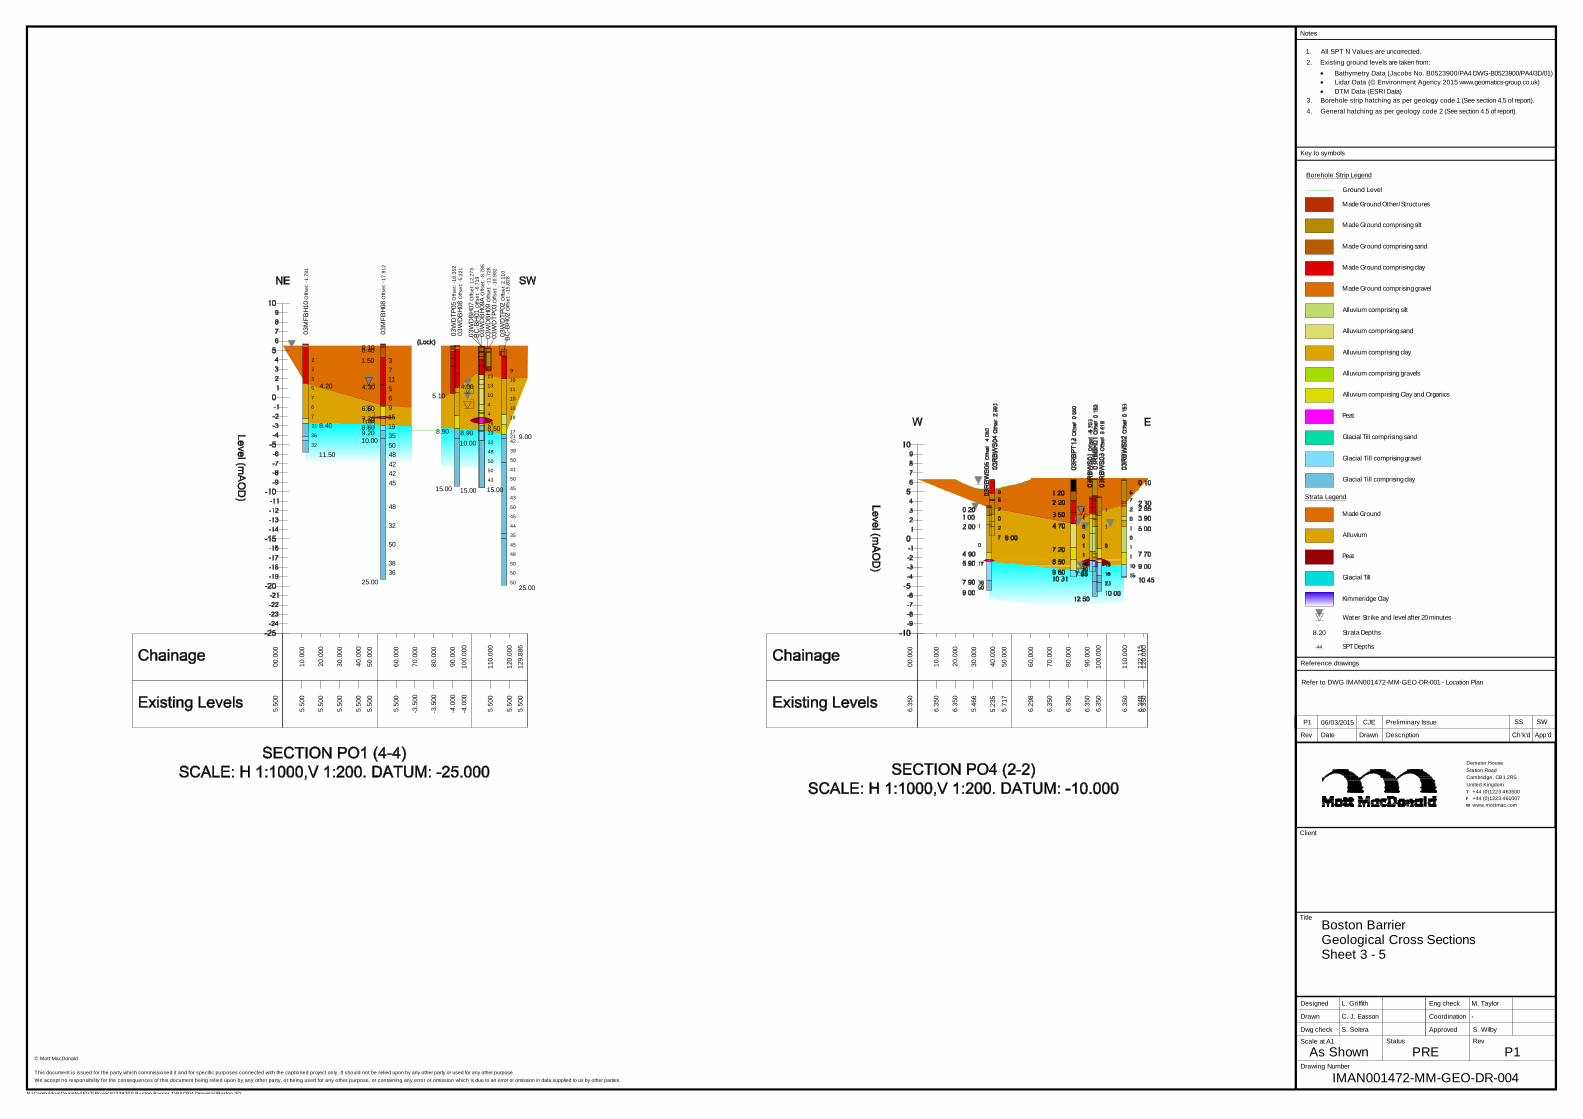
00.0
00
10.0
00
20.0
00
30.0
00
40.0
00
50.0
00
60.0
00
70.0
00
80.0
00
90.0
00
100.
000
110.
000
120.
000
129.
886
5.50
0
5.50
0
5.50
0
5.50
0
5.50
0
5.50
0
5.50
0
-3.5
00
-3.5
00
-4.0
00
-4.0
00
5.50
0
5.50
05.
500
8.90
15.00
2
2
3
5
7
6
7
21
36
32
4.20
8.40
11.50
13
13
10
4
4
26
29
32
48
50
50
43
8.50
15.00
37115691519355048424245
48
32
50
3836
0.100.401.50
4.30
6.607.707.908.609.2010.00
25.00
4.00
8.90
15.00
5.10
9
10
11
10
10
18
172142
39
50
41
50
45
43
50
45
44
35
45
48
50
50
50
9.00
25.00
10.00
03M
FBH1
0O
ffset
: -1.
781
03M
FBH0
8O
ffset
: -17
.912
03W
DTP
05O
ffset
: -18
.352
03W
DB
H08
Offs
et: -
5.32
1
BC
-BH
02O
ffset
: -15
.828
03W
DTP
02O
ffset
: 2.1
1003
WD
TP03
Offs
et: -
10.9
9203
WD
BH
09O
ffset
: -11
.728
BC
-BH
01O
ffset
: -6.
719
03W
DB
H09
AO
ffset
: -8.
785
03W
DB
H07
Offs
et: 1
2.27
3
00.0
00
10.0
00
20.0
00
30.0
00
40.0
00
50.0
00
60.0
00
70.0
00
80.0
00
90.0
00
100.
000
110.
000
120.
000
122.
115
6.35
0
6.35
0
6.35
0
5.46
6
5.23
5
5.71
7
6.29
8
6.35
0
6.35
0
6.35
0
6.35
0
6.35
0
6.35
06.
348
Key to symbols
App’dCh’k’dDescriptionDrawnDateRev
RevStatus
Drawing Number
Scale at A1
Eng check
Approved
Coordination
Dwg check
Drawn
Designed
Title
Notes
Client
P:\Cambridge\Demeter\EVT\Pro jects\301603 Pledges Fishpass Study\CAD\Working Drawings\Civil\2D models\EA Logo.jpg
P:\Cambridge\Demeter\EVT\Projects\339200 Boston Barrier TWAO\04 Drawings\Boston 3D
TFW
Boston BarrierGeological Cross SectionsSheet 3 - 5
L. Griffith
C. J. Easson
S. Solera
M. Taylor
-
S. Wilby
As Shown PRE
IMAN001472-MM-GEO-DR-004
P1
Demeter HouseStation RoadCambridge, CB1 2RSUnited Kingdom
+44 (0)1223 463500+44 (0)1223 461007www.mottmac.com
© Mott MacDonald
This document is issued for the party which commissioned it and for specific purposes connected with the captioned project only. It should not be relied upon by any other party or used for any other purpose.We accept no responsibility for the consequences of this document being relied upon by any other party, or being used for any other purpose, or containing any error or omission which is due to an error or omission in data supplied to us by other parties.
Reference drawings
Ground Level
Made Ground Other/Structures
Made Ground comprising silt
Made Ground comprising sand
Made Ground comprising clay
Made Ground comprising gravel
Alluvium comprising silt
Alluvium comprising sand
Alluvium comprising clay
Alluvium comprising gravels
Alluvium comprising Clay and Organics
Peat
Glacial Till comprising sand
Glacial Till comprising gravel
Glacial Till comprising clay
Made Ground
Alluvium
Peat
Glacial Till
Kimmeridge Clay
Borehole Strip Legend
Strata Legend
Water Strike and level after 20 minutes
44
8.20 Strata Depths
SPT Depths
Refer to DWG IMAN001472-MM-GEO-DR-001 - Location Plan
1. All SPT N Values are uncorrected.2. Existing ground levels are taken from:
Bathymetry Data (Jacobs No. B0523900/PA4 DWG-B0523900/PA4/3D/01)Lidar Data (© Environment Agency 2015 www.geomatics-group.co.uk)DTM Data (ESRI Data)
3. Borehole strip hatching as per geology code 1 (See section 4.5 of report).4. General hatching as per geology code 2 (See section 4.5 of report).
P1 06/03/2015 CJE Preliminary Issue SS SW
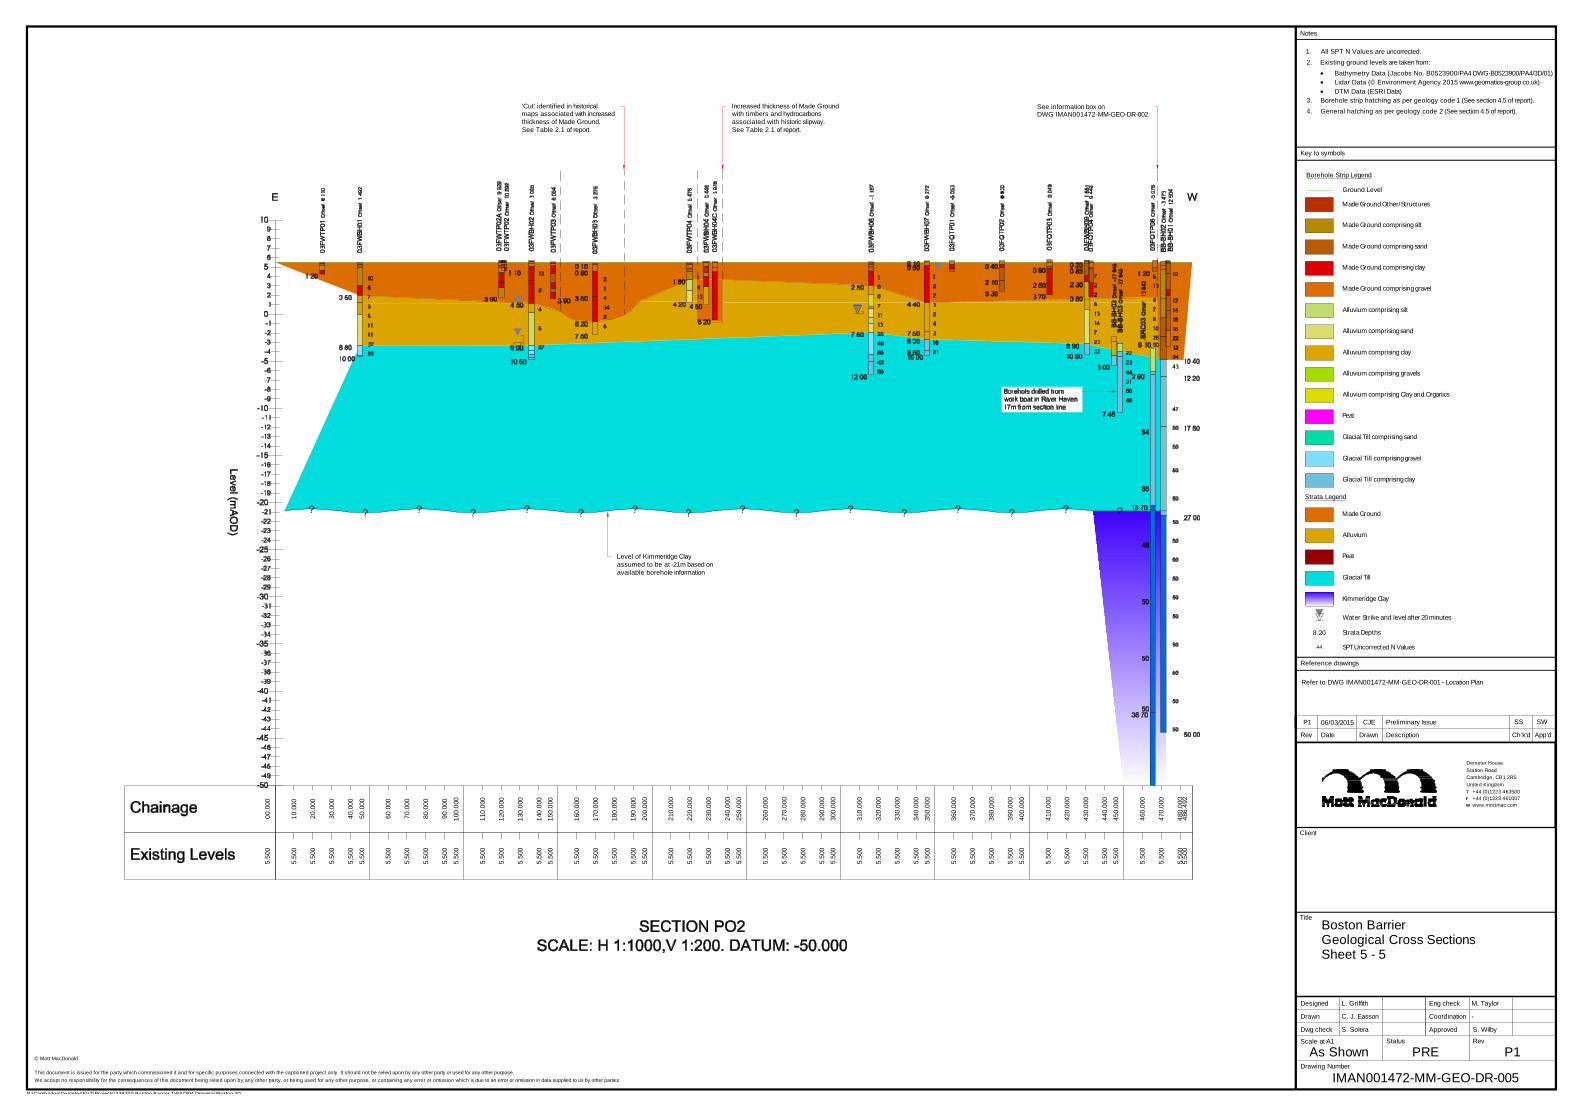
00.0
00
10.0
00
20.0
00
30.0
00
40.0
00
50.0
00
60.0
00
70.0
00
80.0
00
90.0
00
100.
000
110.
000
120.
000
130.
000
140.
000
150.
000
160.
000
170.
000
180.
000
190.
000
200.
000
210.
000
220.
000
230.
000
240.
000
250.
000
260.
000
270.
000
280.
000
290.
000
300.
000
310.
000
320.
000
330.
000
340.
000
350.
000
360.
000
370.
000
380.
000
390.
000
400.
000
410.
000
420.
000
430.
000
440.
000
450.
000
460.
000
470.
000
480.
000
486.
492
5.50
0
5.50
0
5.50
0
5.50
0
5.50
0
5.50
0
5.50
0
5.50
0
5.50
0
5.50
0
5.50
0
5.50
0
5.50
0
5.50
0
5.50
0
5.50
0
5.50
0
5.50
0
5.50
0
5.50
0
5.50
0
5.50
0
5.50
0
5.50
0
5.50
0
5.50
0
5.50
0
5.50
0
5.50
0
5.50
0
5.50
0
5.50
0
5.50
0
5.50
0
5.50
0
5.50
0
5.50
0
5.50
0
5.50
0
5.50
0
5.50
0
5.50
0
5.50
0
5.50
0
5.50
0
5.50
0
5.50
0
5.50
0
5.50
05.
500
? ? ? ? ? ? ? ? ? ? ? ? ? ? ? ?
'Cut' identified in historicalmaps associated with increasedthickness of Made Ground.See Table 2.1 of report.
Increased thickness of Made Groundwith timbers and hydrocarbonsassociated with historic slipway.See Table 2.1 of report.
See information box onDWG IMAN001472-MM-GEO-DR-002
Level of Kimmeridge Clayassumed to be at -21m based onavailable borehole information
Key to symbols
App’dCh’k’dDescriptionDrawnDateRev
RevStatus
Drawing Number
Scale at A1
Eng check
Approved
Coordination
Dwg check
Drawn
Designed
Title
Notes
Client
P:\Cambridge\Demeter\EVT\Pro jects\301603 Pledges Fishpass Study\CAD\Working Drawings\Civil\2D models\EA Logo.jpg
P1 06/03/2015 CJE Preliminary Issue SS SW
P:\Cambridge\Demeter\EVT\Projects\339200 Boston Barrier TWAO\04 Drawings\Boston 3D
TFW
Boston BarrierGeological Cross SectionsSheet 5 - 5
L. Griffith
C. J. Easson
S. Solera
M. Taylor
-
S. Wilby
As Shown PRE
IMAN001472-MM-GEO-DR-005
P1
Demeter HouseStation RoadCambridge, CB1 2RSUnited Kingdom
+44 (0)1223 463500+44 (0)1223 461007www.mottmac.com
© Mott MacDonald
This document is issued for the party which commissioned it and for specific purposes connected with the captioned project only. It should not be relied upon by any other party or used for any other purpose.We accept no responsibility for the consequences of this document being relied upon by any other party, or being used for any other purpose, or containing any error or omission which is due to an error or omission in data supplied to us by other parties.
1. All SPT N Values are uncorrected.2. Existing ground levels are taken from:
Bathymetry Data (Jacobs No. B0523900/PA4 DWG-B0523900/PA4/3D/01)Lidar Data (© Environment Agency 2015 www.geomatics-group.co.uk)DTM Data (ESRI Data)
3. Borehole strip hatching as per geology code 1 (See section 4.5 of report).4. General hatching as per geology code 2 (See section 4.5 of report).
Reference drawings
Ground Level
Made Ground Other/Structures
Made Ground comprising silt
Made Ground comprising sand
Made Ground comprising clay
Made Ground comprising gravel
Alluvium comprising silt
Alluvium comprising sand
Alluvium comprising clay
Alluvium comprising gravels
Alluvium comprising Clay and Organics
Peat
Glacial Till comprising sand
Glacial Till comprising gravel
Glacial Till comprising clay
Made Ground
Alluvium
Peat
Glacial Till
Kimmeridge Clay
Borehole Strip Legend
Strata Legend
Water Strike and level after 20 minutes
44
8.20 Strata Depths
SPT Uncorrected N Values
Refer to DWG IMAN001472-MM-GEO-DR-001 - Location Plan
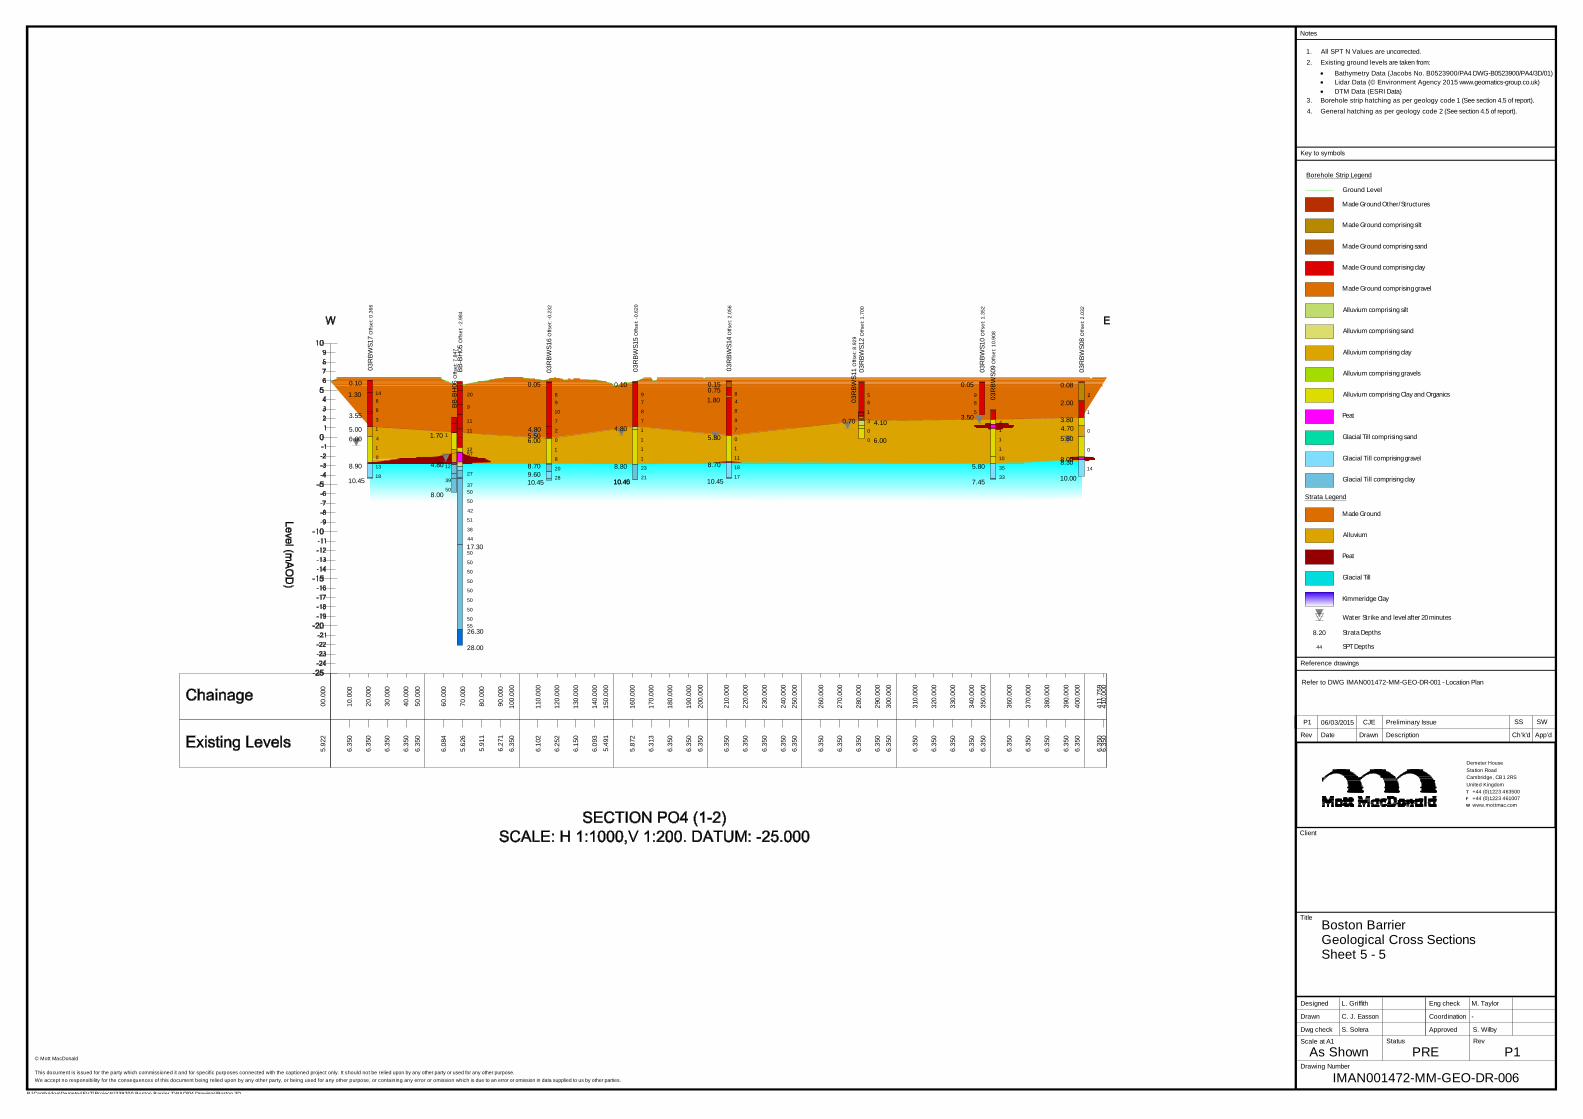
42
50
44
12
50
51
57
50
11
37
9
17.30
38
50
50
20
50
55
11
28.00
50
26.30
50
27
50
50
BB
-BH
05O
ffset
: -2.
984
4
10
7.45
1
1
1
5.8033
35
03R
BW
S09
Offs
et: 1
0.90
8
00.0
00
10.0
00
20.0
00
30.0
00
40.0
00
50.0
00
60.0
00
70.0
00
80.0
00
90.0
00
100.
000
110.
000
120.
000
130.
000
140.
000
150.
000
160.
000
170.
000
180.
000
190.
000
200.
000
210.
000
220.
000
230.
000
240.
000
250.
000
260.
000
270.
000
280.
000
290.
000
300.
000
310.
000
320.
000
330.
000
340.
000
350.
000
360.
000
370.
000
380.
000
390.
000
400.
000
410.
000
411.
759
5.92
2
6.35
0
6.35
0
6.35
0
6.35
0
6.35
0
6.08
4
5.62
6
5.91
1
6.27
1
6.35
0
6.10
2
6.25
2
6.15
0
6.09
3
5.49
1
5.87
2
6.31
3
6.35
0
6.35
0
6.35
0
6.35
0
6.35
0
6.35
0
6.35
0
6.35
0
6.35
0
6.35
0
6.35
0
6.35
0
6.35
0
6.35
0
6.35
0
6.35
0
6.35
0
6.35
0
6.35
0
6.35
0
6.35
0
6.35
0
6.35
0
6.35
06.
350
03R
BW
S17
Offs
et: 0
.366
56
1
04.10
6.00
9
7
1
1
1
23
2110.45
14
8
1
0.10
6.00
8.90
9
7
06.00
0.15
8
6
2
13
7
1
04
4.80
0.10
1
3
10.40
8.70 8.80
0
10.45
0.704.80
91.30
5.00
0
4.70
20
1.80
5.50
1
9.60
8
8
3.55
7
3
10.4518
18
10
10.45
8
53.80
0.08
8.70
28
1
0
1417
0.05
10.00
4
5.80
0.75
8.30
2
88
0
0.05
2.001
9
8.00
3.50
11
39
50
5.801.70
12
8.00
1
4.80
BB
-BH
06O
ffset
: 7.8
47
03R
BW
S12
Offs
et: 1
.700
03R
BW
S10
Offs
et: 1
.352
03R
BW
S14
Offs
et: 2
.056
03R
BW
S16
Offs
et: -
0.23
2
03R
BW
S15
Offs
et: -
0.62
0
03R
BW
S08
Offs
et: 2
.032
03R
BW
S11
Offs
et: 8
.929
Key to symbols
App’dCh’k’dDescriptionDrawnDateRev
RevStatus
Drawing Number
Scale at A1
Eng check
Approved
Coordination
Dwg check
Drawn
Designed
Title
Notes
Client
P:\Cambridge\Demeter\EVT\Pro jects\301603 Pledges Fishpass Study\CAD\Working Drawings\Civil\2D models\EA Logo.jpg
P:\Cambridge\Demeter\EVT\Projects\339200 Boston Barrier TWAO\04 Drawings\Boston 3D
TFW
Boston BarrierGeological Cross SectionsSheet 5 - 5
L. Griffith
C. J. Easson
S. Solera
M. Taylor
-
S. Wilby
As Shown PRE
IMAN001472-MM-GEO-DR-006
P1
Demeter HouseStation RoadCambridge, CB1 2RSUnited Kingdom
+44 (0)1223 463500+44 (0)1223 461007www.mottmac.com
© Mott MacDonald
This document is issued for the party which commissioned it and for specific purposes connected with the captioned project only. It should not be relied upon by any other party or used for any other purpose.We accept no responsibility for the consequences of this document being relied upon by any other party, or being used for any other purpose, or containing any error or omission which is due to an error or omission in data supplied to us by other parties.
Reference drawings
Ground Level
Made Ground Other/Structures
Made Ground comprising silt
Made Ground comprising sand
Made Ground comprising clay
Made Ground comprising gravel
Alluvium comprising silt
Alluvium comprising sand
Alluvium comprising clay
Alluvium comprising gravels
Alluvium comprising Clay and Organics
Peat
Glacial Till comprising sand
Glacial Till comprising gravel
Glacial Till comprising clay
Made Ground
Alluvium
Peat
Glacial Till
Kimmeridge Clay
Borehole Strip Legend
Strata Legend
Water Strike and level after 20 minutes
44
8.20 Strata Depths
SPT Depths
Refer to DWG IMAN001472-MM-GEO-DR-001 - Location Plan
1. All SPT N Values are uncorrected.2. Existing ground levels are taken from:
Bathymetry Data (Jacobs No. B0523900/PA4 DWG-B0523900/PA4/3D/01)Lidar Data (© Environment Agency 2015 www.geomatics-group.co.uk)DTM Data (ESRI Data)
3. Borehole strip hatching as per geology code 1 (See section 4.5 of report).4. General hatching as per geology code 2 (See section 4.5 of report).
P1 06/03/2015 CJE Preliminary Issue SS SW
Boston Barrier Ground Investigation Report
335092/WCD/WAM/01/A 07 February 2015 pims/339200 Boston Barrier TWAO/Products/Design Products/GI/GIR
95
Appendix E. Parameter Plots
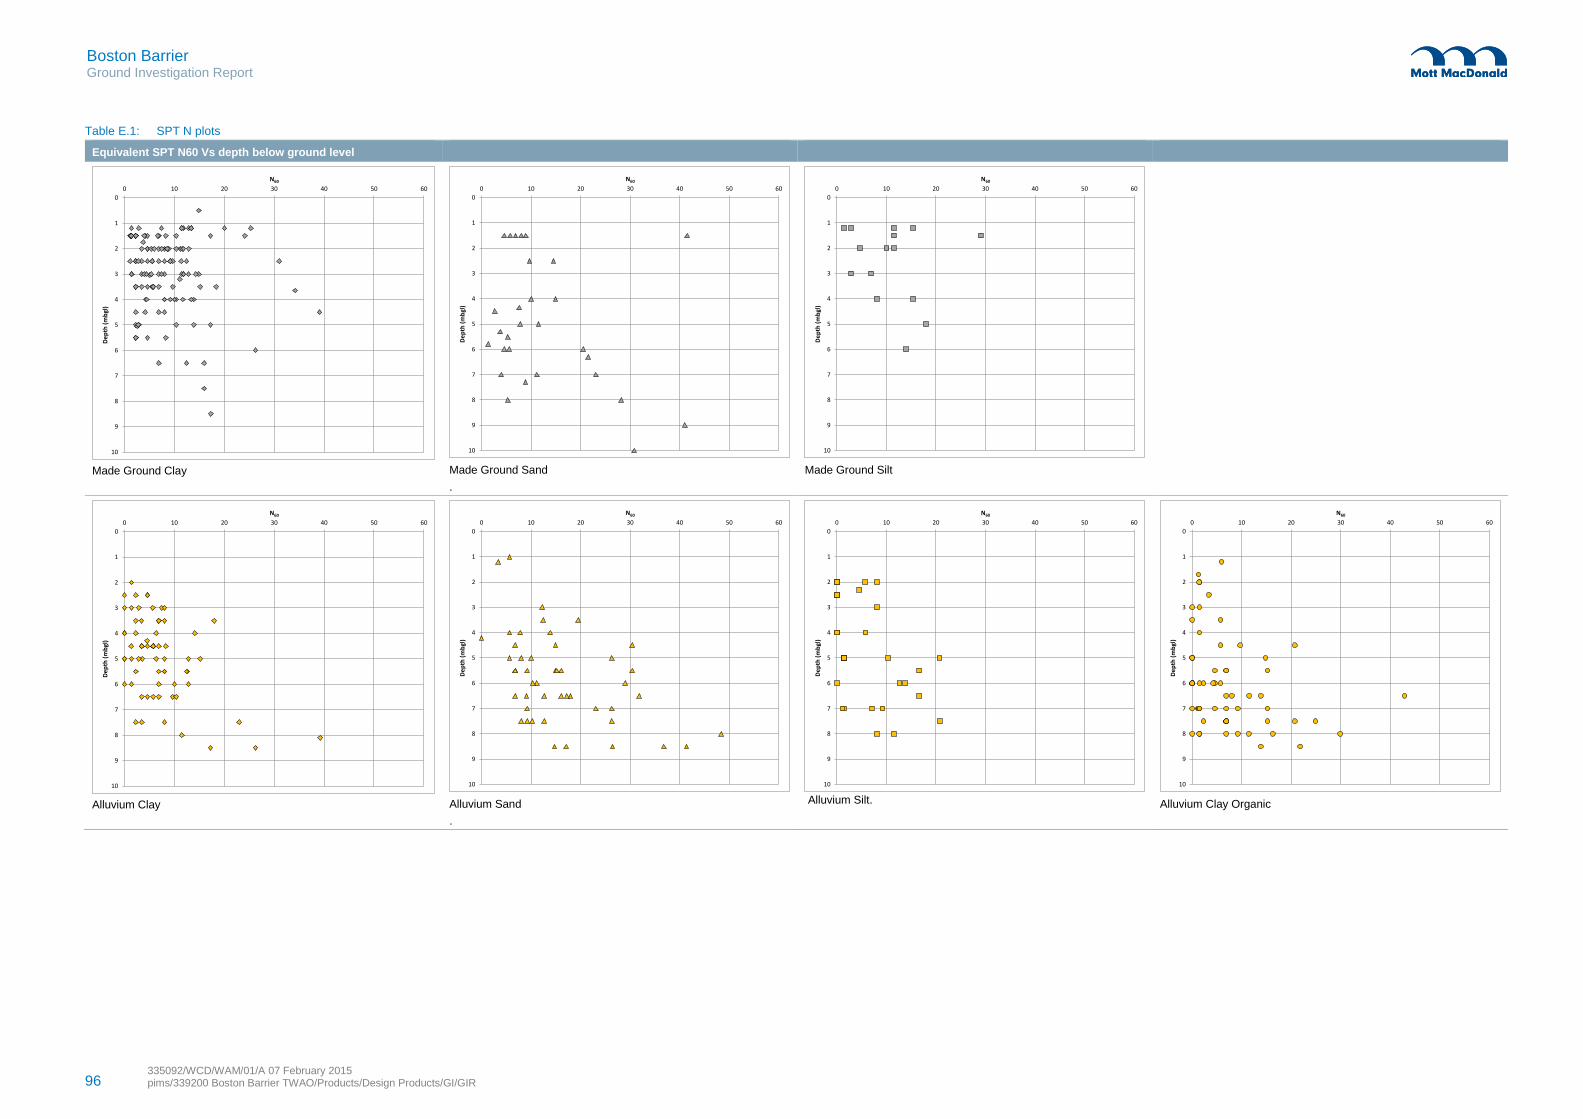
96 335092/WCD/WAM/01/A 07 February 2015 pims/339200 Boston Barrier TWAO/Products/Design Products/GI/GIR
Boston Barrier Ground Investigation Report
Table E.1: SPT N plots
Equivalent SPT N60 Vs depth below ground level
Made Ground Clay
Made Ground Sand
.
Made Ground Silt
Alluvium Clay
Alluvium Sand
.
Alluvium Silt.
Alluvium Clay Organic
0
1
2
3
4
5
6
7
8
9
10
0 10 20 30 40 50 60
De
pth
(m
bgl
)
N60
0
1
2
3
4
5
6
7
8
9
10
0 10 20 30 40 50 60
De
pth
(m
bgl
)
N60
0
1
2
3
4
5
6
7
8
9
10
0 10 20 30 40 50 60
De
pth
(m
bgl
)
N60
0
1
2
3
4
5
6
7
8
9
10
0 10 20 30 40 50 60
De
pth
(m
bgl
)
N60
0
1
2
3
4
5
6
7
8
9
10
0 10 20 30 40 50 60
De
pth
(m
bgl
)
N60
0
1
2
3
4
5
6
7
8
9
10
0 10 20 30 40 50 60
De
pth
(m
bgl
)
N60
0
1
2
3
4
5
6
7
8
9
10
0 10 20 30 40 50 60
De
pth
(m
bgl
)
N60
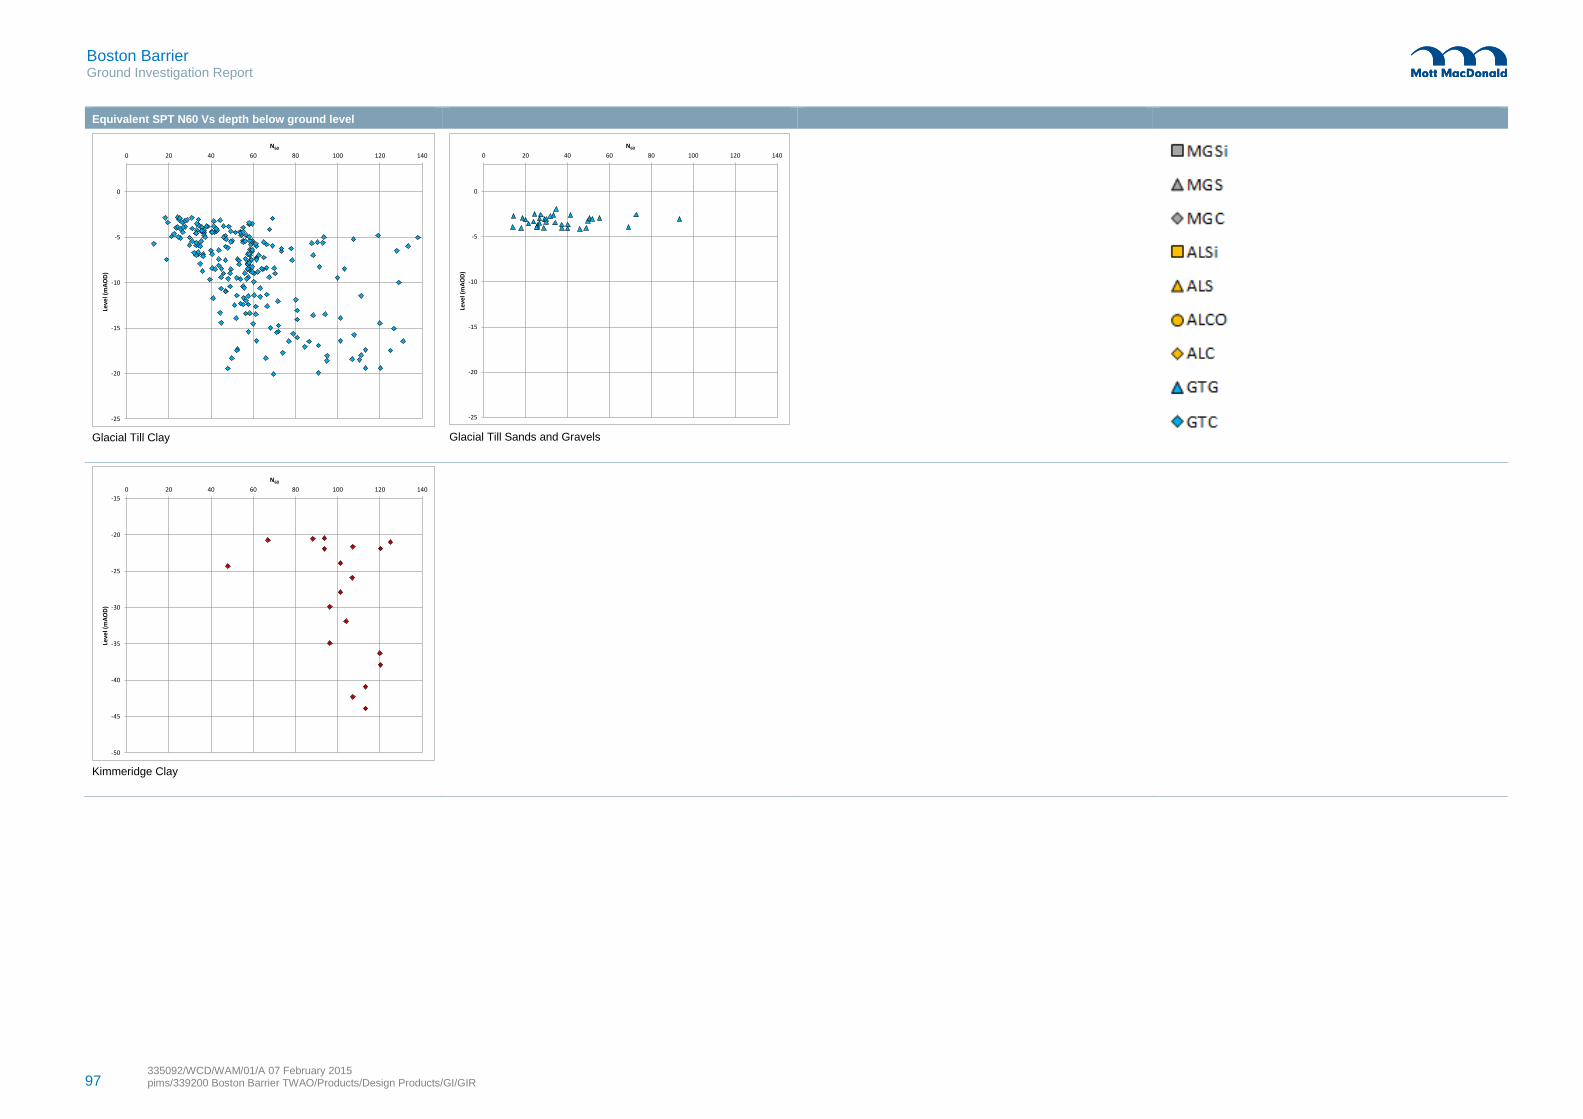
97 335092/WCD/WAM/01/A 07 February 2015 pims/339200 Boston Barrier TWAO/Products/Design Products/GI/GIR
Boston Barrier Ground Investigation Report
Equivalent SPT N60 Vs depth below ground level
Glacial Till Clay
Glacial Till Sands and Gravels
Kimmeridge Clay
-25
-20
-15
-10
-5
0
0 20 40 60 80 100 120 140
Leve
l (m
AO
D)
N60
-25
-20
-15
-10
-5
0
0 20 40 60 80 100 120 140
Leve
l (m
AO
D)
N60
-50
-45
-40
-35
-30
-25
-20
-15
0 20 40 60 80 100 120 140
Leve
l (m
AO
D)
N60
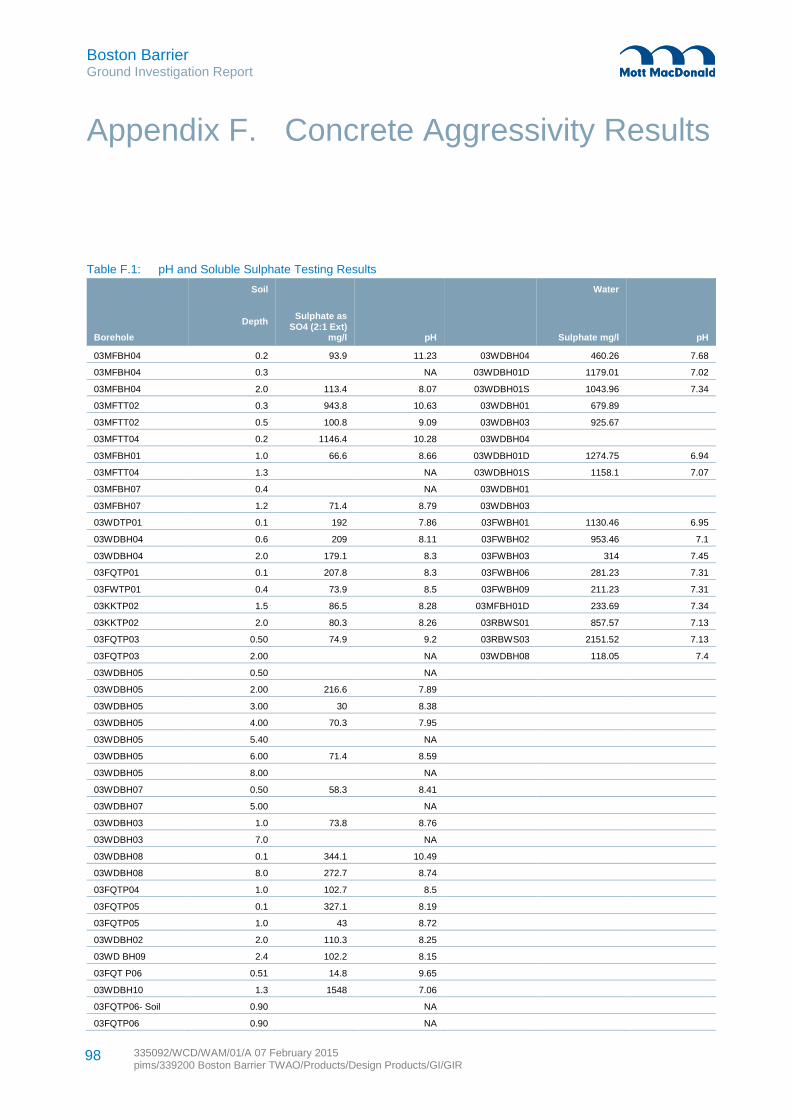
Boston Barrier Ground Investigation Report
335092/WCD/WAM/01/A 07 February 2015 pims/339200 Boston Barrier TWAO/Products/Design Products/GI/GIR
98
Table F.1: pH and Soluble Sulphate Testing Results
Borehole
Soil
Depth
Sulphate as SO4 (2:1 Ext)
mg/l pH
Water
Sulphate mg/l pH
03MFBH04 0.2 93.9 11.23 03WDBH04 460.26 7.68
03MFBH04 0.3 NA 03WDBH01D 1179.01 7.02
03MFBH04 2.0 113.4 8.07 03WDBH01S 1043.96 7.34
03MFTT02 0.3 943.8 10.63 03WDBH01 679.89
03MFTT02 0.5 100.8 9.09 03WDBH03 925.67
03MFTT04 0.2 1146.4 10.28 03WDBH04
03MFBH01 1.0 66.6 8.66 03WDBH01D 1274.75 6.94
03MFTT04 1.3 NA 03WDBH01S 1158.1 7.07
03MFBH07 0.4 NA 03WDBH01
03MFBH07 1.2 71.4 8.79 03WDBH03
03WDTP01 0.1 192 7.86 03FWBH01 1130.46 6.95
03WDBH04 0.6 209 8.11 03FWBH02 953.46 7.1
03WDBH04 2.0 179.1 8.3 03FWBH03 314 7.45
03FQTP01 0.1 207.8 8.3 03FWBH06 281.23 7.31
03FWTP01 0.4 73.9 8.5 03FWBH09 211.23 7.31
03KKTP02 1.5 86.5 8.28 03MFBH01D 233.69 7.34
03KKTP02 2.0 80.3 8.26 03RBWS01 857.57 7.13
03FQTP03 0.50 74.9 9.2 03RBWS03 2151.52 7.13
03FQTP03 2.00 NA 03WDBH08 118.05 7.4
03WDBH05 0.50 NA
03WDBH05 2.00 216.6 7.89
03WDBH05 3.00 30 8.38
03WDBH05 4.00 70.3 7.95
03WDBH05 5.40 NA
03WDBH05 6.00 71.4 8.59
03WDBH05 8.00 NA
03WDBH07 0.50 58.3 8.41
03WDBH07 5.00 NA
03WDBH03 1.0 73.8 8.76
03WDBH03 7.0 NA
03WDBH08 0.1 344.1 10.49
03WDBH08 8.0 272.7 8.74
03FQTP04 1.0 102.7 8.5
03FQTP05 0.1 327.1 8.19
03FQTP05 1.0 43 8.72
03WDBH02 2.0 110.3 8.25
03WD BH09 2.4 102.2 8.15
03FQT P06 0.51 14.8 9.65
03WDBH10 1.3 1548 7.06
03FQTP06- Soil 0.90 NA
03FQTP06 0.90 NA
Appendix F. Concrete Aggressivity Results
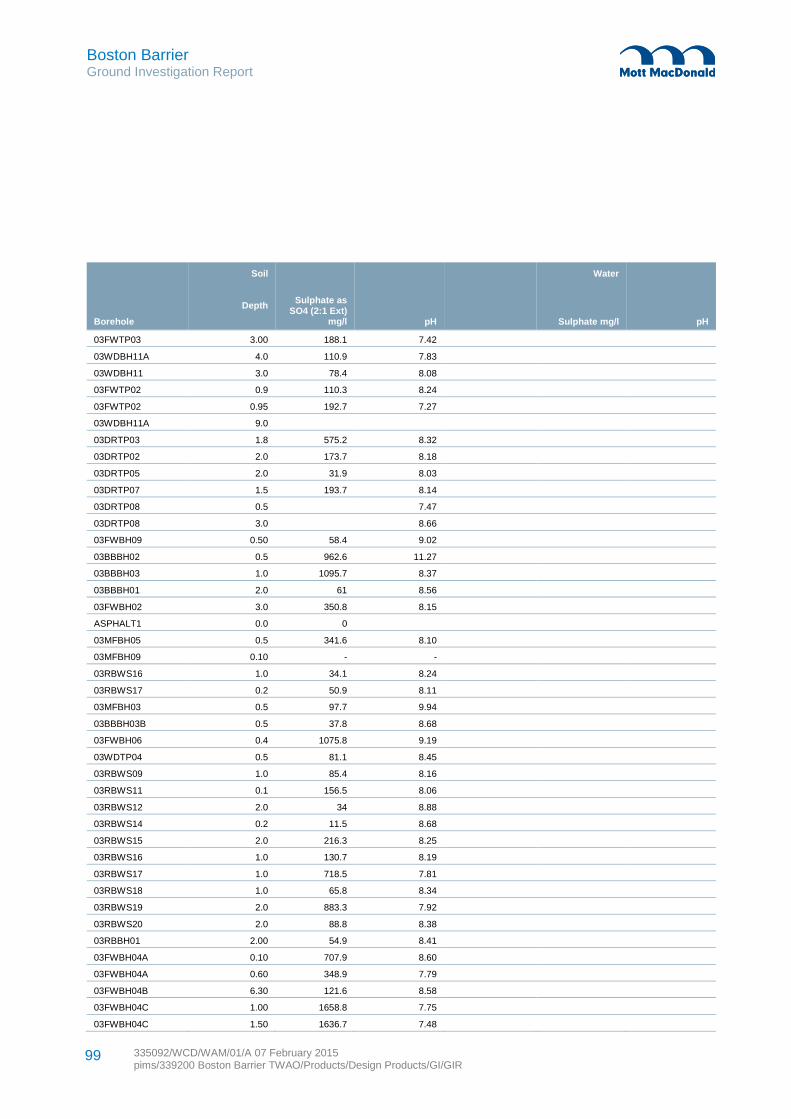
Boston Barrier Ground Investigation Report
335092/WCD/WAM/01/A 07 February 2015 pims/339200 Boston Barrier TWAO/Products/Design Products/GI/GIR
99
Borehole
Soil
Depth
Sulphate as SO4 (2:1 Ext)
mg/l pH
Water
Sulphate mg/l pH
03FWTP03 3.00 188.1 7.42
03WDBH11A 4.0 110.9 7.83
03WDBH11 3.0 78.4 8.08
03FWTP02 0.9 110.3 8.24
03FWTP02 0.95 192.7 7.27
03WDBH11A 9.0
03DRTP03 1.8 575.2 8.32
03DRTP02 2.0 173.7 8.18
03DRTP05 2.0 31.9 8.03
03DRTP07 1.5 193.7 8.14
03DRTP08 0.5 7.47
03DRTP08 3.0 8.66
03FWBH09 0.50 58.4 9.02
03BBBH02 0.5 962.6 11.27
03BBBH03 1.0 1095.7 8.37
03BBBH01 2.0 61 8.56
03FWBH02 3.0 350.8 8.15
ASPHALT1 0.0 0
03MFBH05 0.5 341.6 8.10
03MFBH09 0.10 - -
03RBWS16 1.0 34.1 8.24
03RBWS17 0.2 50.9 8.11
03MFBH03 0.5 97.7 9.94
03BBBH03B 0.5 37.8 8.68
03FWBH06 0.4 1075.8 9.19
03WDTP04 0.5 81.1 8.45
03RBWS09 1.0 85.4 8.16
03RBWS11 0.1 156.5 8.06
03RBWS12 2.0 34 8.88
03RBWS14 0.2 11.5 8.68
03RBWS15 2.0 216.3 8.25
03RBWS16 1.0 130.7 8.19
03RBWS17 1.0 718.5 7.81
03RBWS18 1.0 65.8 8.34
03RBWS19 2.0 883.3 7.92
03RBWS20 2.0 88.8 8.38
03RBBH01 2.00 54.9 8.41
03FWBH04A 0.10 707.9 8.60
03FWBH04A 0.60 348.9 7.79
03FWBH04B 6.30 121.6 8.58
03FWBH04C 1.00 1658.8 7.75
03FWBH04C 1.50 1636.7 7.48
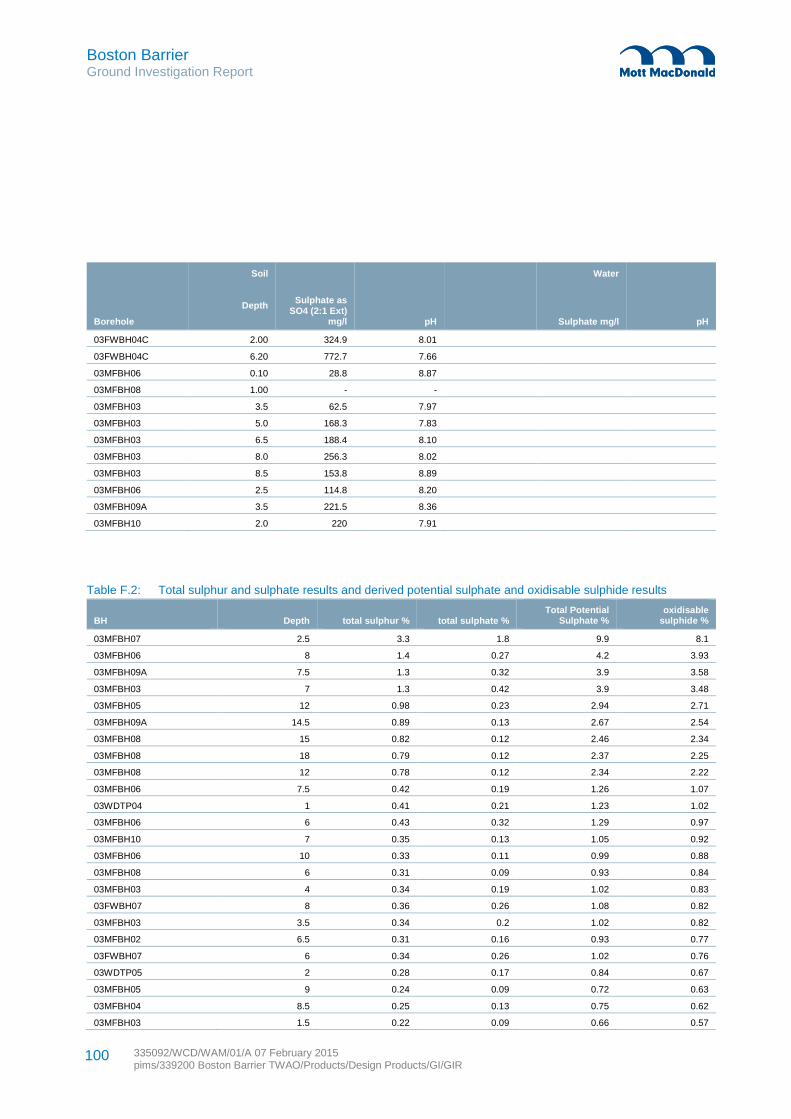
Boston Barrier Ground Investigation Report
335092/WCD/WAM/01/A 07 February 2015 pims/339200 Boston Barrier TWAO/Products/Design Products/GI/GIR
100
Borehole
Soil
Depth
Sulphate as SO4 (2:1 Ext)
mg/l pH
Water
Sulphate mg/l pH
03FWBH04C 2.00 324.9 8.01
03FWBH04C 6.20 772.7 7.66
03MFBH06 0.10 28.8 8.87
03MFBH08 1.00 - -
03MFBH03 3.5 62.5 7.97
03MFBH03 5.0 168.3 7.83
03MFBH03 6.5 188.4 8.10
03MFBH03 8.0 256.3 8.02
03MFBH03 8.5 153.8 8.89
03MFBH06 2.5 114.8 8.20
03MFBH09A 3.5 221.5 8.36
03MFBH10 2.0 220 7.91
Table F.2: Total sulphur and sulphate results and derived potential sulphate and oxidisable sulphide results
BH Depth total sulphur % total sulphate % Total Potential
Sulphate % oxidisable
sulphide %
03MFBH07 2.5 3.3 1.8 9.9 8.1
03MFBH06 8 1.4 0.27 4.2 3.93
03MFBH09A 7.5 1.3 0.32 3.9 3.58
03MFBH03 7 1.3 0.42 3.9 3.48
03MFBH05 12 0.98 0.23 2.94 2.71
03MFBH09A 14.5 0.89 0.13 2.67 2.54
03MFBH08 15 0.82 0.12 2.46 2.34
03MFBH08 18 0.79 0.12 2.37 2.25
03MFBH08 12 0.78 0.12 2.34 2.22
03MFBH06 7.5 0.42 0.19 1.26 1.07
03WDTP04 1 0.41 0.21 1.23 1.02
03MFBH06 6 0.43 0.32 1.29 0.97
03MFBH10 7 0.35 0.13 1.05 0.92
03MFBH06 10 0.33 0.11 0.99 0.88
03MFBH08 6 0.31 0.09 0.93 0.84
03MFBH03 4 0.34 0.19 1.02 0.83
03FWBH07 8 0.36 0.26 1.08 0.82
03MFBH03 3.5 0.34 0.2 1.02 0.82
03MFBH02 6.5 0.31 0.16 0.93 0.77
03FWBH07 6 0.34 0.26 1.02 0.76
03WDTP05 2 0.28 0.17 0.84 0.67
03MFBH05 9 0.24 0.09 0.72 0.63
03MFBH04 8.5 0.25 0.13 0.75 0.62
03MFBH03 1.5 0.22 0.09 0.66 0.57
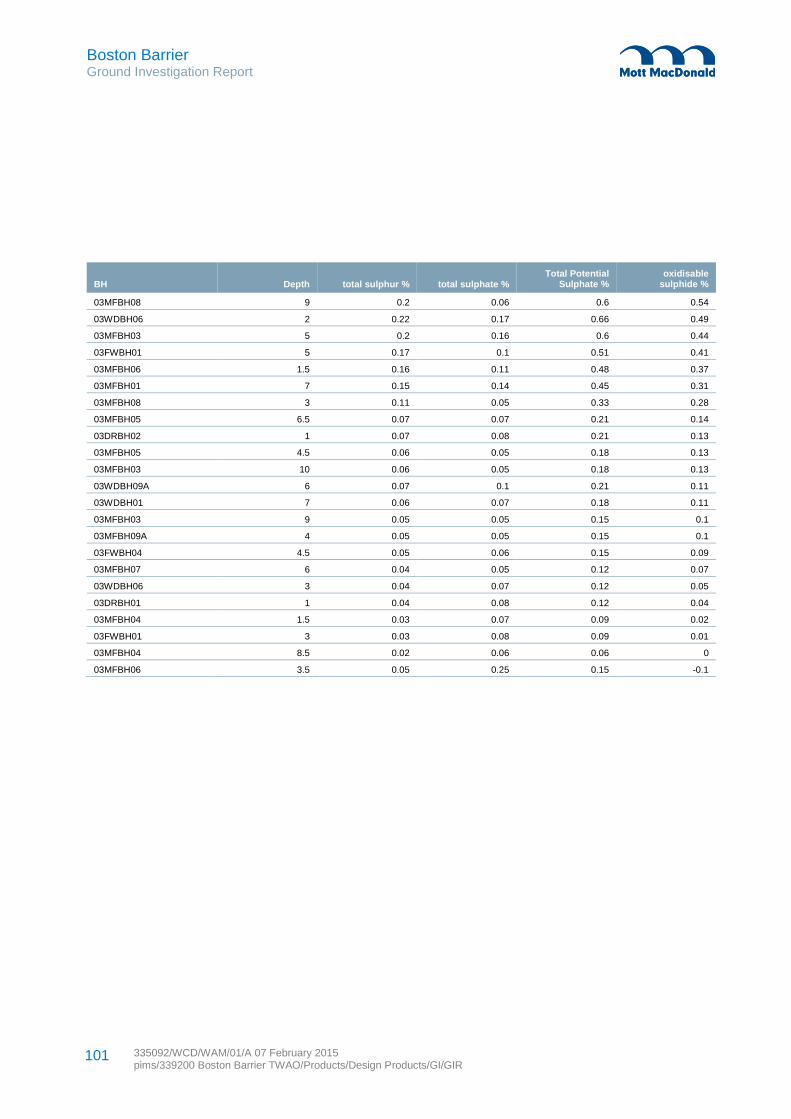
Boston Barrier Ground Investigation Report
335092/WCD/WAM/01/A 07 February 2015 pims/339200 Boston Barrier TWAO/Products/Design Products/GI/GIR
101
BH Depth total sulphur % total sulphate % Total Potential
Sulphate % oxidisable
sulphide %
03MFBH08 9 0.2 0.06 0.6 0.54
03WDBH06 2 0.22 0.17 0.66 0.49
03MFBH03 5 0.2 0.16 0.6 0.44
03FWBH01 5 0.17 0.1 0.51 0.41
03MFBH06 1.5 0.16 0.11 0.48 0.37
03MFBH01 7 0.15 0.14 0.45 0.31
03MFBH08 3 0.11 0.05 0.33 0.28
03MFBH05 6.5 0.07 0.07 0.21 0.14
03DRBH02 1 0.07 0.08 0.21 0.13
03MFBH05 4.5 0.06 0.05 0.18 0.13
03MFBH03 10 0.06 0.05 0.18 0.13
03WDBH09A 6 0.07 0.1 0.21 0.11
03WDBH01 7 0.06 0.07 0.18 0.11
03MFBH03 9 0.05 0.05 0.15 0.1
03MFBH09A 4 0.05 0.05 0.15 0.1
03FWBH04 4.5 0.05 0.06 0.15 0.09
03MFBH07 6 0.04 0.05 0.12 0.07
03WDBH06 3 0.04 0.07 0.12 0.05
03DRBH01 1 0.04 0.08 0.12 0.04
03MFBH04 1.5 0.03 0.07 0.09 0.02
03FWBH01 3 0.03 0.08 0.09 0.01
03MFBH04 8.5 0.02 0.06 0.06 0
03MFBH06 3.5 0.05 0.25 0.15 -0.1

Boston Barrier Ground Investigation Report
335092/WCD/WAM/01/A 07 February 2015 pims/339200 Boston Barrier TWAO/Products/Design Products/GI/GIR
102
Appendix G. Groundwater Results
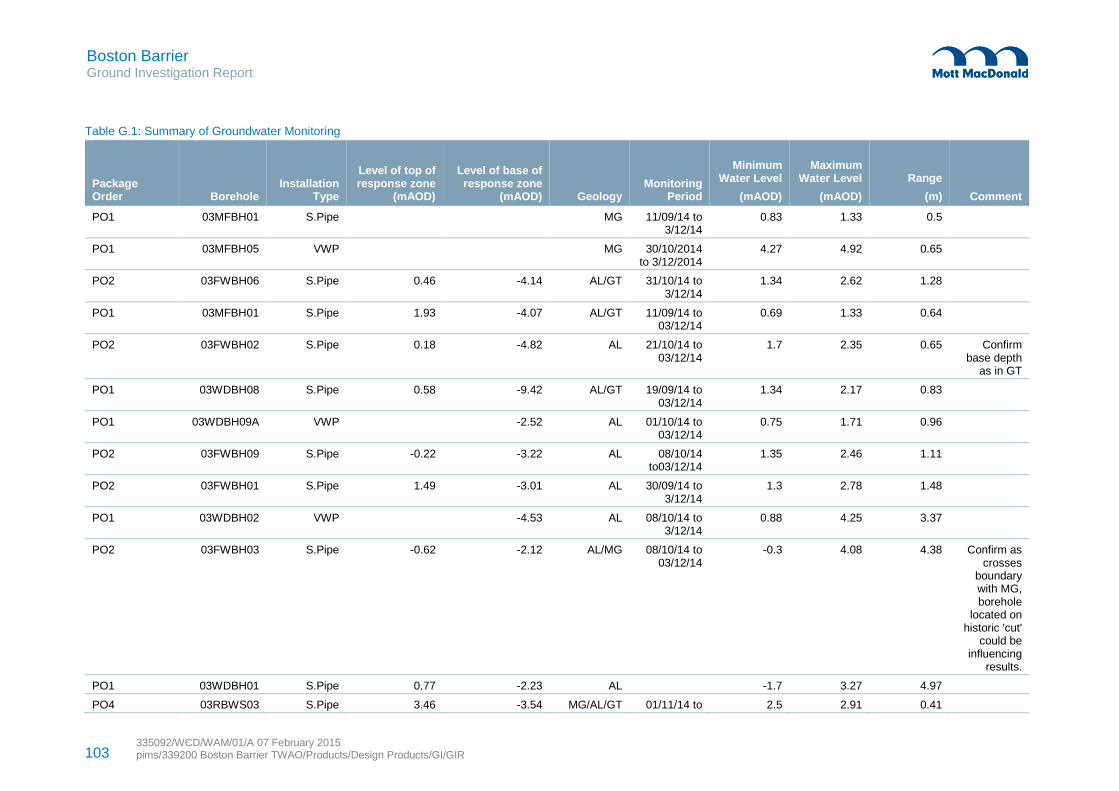
103 335092/WCD/WAM/01/A 07 February 2015 pims/339200 Boston Barrier TWAO/Products/Design Products/GI/GIR
Boston Barrier Ground Investigation Report
Table G.1: Summary of Groundwater Monitoring
Package Order Borehole
Installation Type
Level of top of response zone
(mAOD)
Level of base of response zone
(mAOD) Geology Monitoring
Period
Minimum Water Level
(mAOD)
Maximum Water Level
(mAOD)
Range
(m) Comment
PO1 03MFBH01 S.Pipe MG 11/09/14 to 3/12/14
0.83 1.33 0.5
PO1 03MFBH05 VWP MG 30/10/2014 to 3/12/2014
4.27 4.92 0.65
PO2 03FWBH06 S.Pipe 0.46 -4.14 AL/GT 31/10/14 to 3/12/14
1.34 2.62 1.28
PO1 03MFBH01 S.Pipe 1.93 -4.07 AL/GT 11/09/14 to 03/12/14
0.69 1.33 0.64
PO2 03FWBH02 S.Pipe 0.18 -4.82 AL 21/10/14 to 03/12/14
1.7 2.35 0.65 Confirm base depth
as in GT
PO1 03WDBH08 S.Pipe 0.58 -9.42 AL/GT 19/09/14 to 03/12/14
1.34 2.17 0.83
PO1 03WDBH09A VWP -2.52 AL 01/10/14 to 03/12/14
0.75 1.71 0.96
PO2 03FWBH09 S.Pipe -0.22 -3.22 AL 08/10/14 to03/12/14
1.35 2.46 1.11
PO2 03FWBH01 S.Pipe 1.49 -3.01 AL 30/09/14 to 3/12/14
1.3 2.78 1.48
PO1 03WDBH02 VWP -4.53 AL 08/10/14 to 3/12/14
0.88 4.25 3.37
PO2 03FWBH03 S.Pipe -0.62 -2.12 AL/MG 08/10/14 to 03/12/14
-0.3 4.08 4.38 Confirm as crosses
boundary with MG, borehole
located on historic 'cut'
could be influencing
results.
PO1 03WDBH01 S.Pipe 0.77 -2.23 AL -1.7 3.27 4.97
PO4 03RBWS03 S.Pipe 3.46 -3.54 MG/AL/GT 01/11/14 to 2.5 2.91 0.41
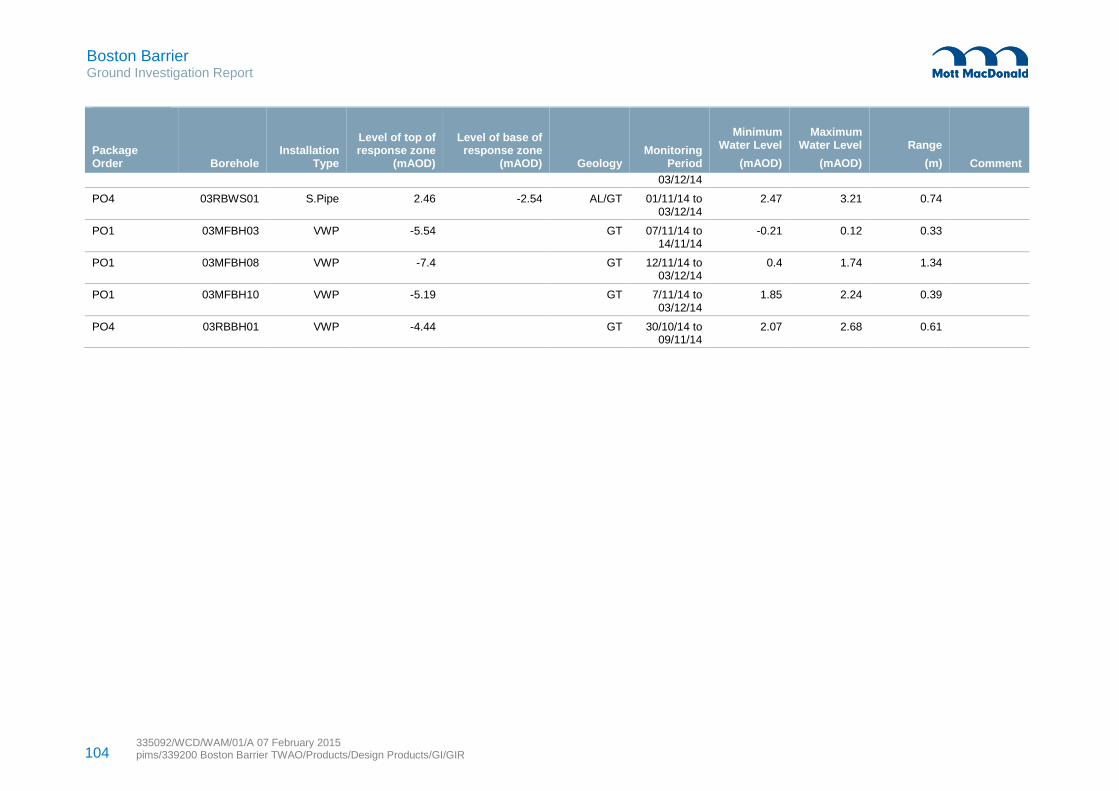
104 335092/WCD/WAM/01/A 07 February 2015 pims/339200 Boston Barrier TWAO/Products/Design Products/GI/GIR
Boston Barrier Ground Investigation Report
Package Order Borehole
Installation Type
Level of top of response zone
(mAOD)
Level of base of response zone
(mAOD) Geology Monitoring
Period
Minimum Water Level
(mAOD)
Maximum Water Level
(mAOD)
Range
(m) Comment
03/12/14
PO4 03RBWS01 S.Pipe 2.46 -2.54 AL/GT 01/11/14 to 03/12/14
2.47 3.21 0.74
PO1 03MFBH03 VWP -5.54 GT 07/11/14 to 14/11/14
-0.21 0.12 0.33
PO1 03MFBH08 VWP -7.4 GT 12/11/14 to 03/12/14
0.4 1.74 1.34
PO1 03MFBH10 VWP -5.19 GT 7/11/14 to 03/12/14
1.85 2.24 0.39
PO4 03RBBH01 VWP -4.44 GT 30/10/14 to 09/11/14
2.07 2.68 0.61
Boston Barrier Ground Investigation Report
335092/WCD/WAM/01/A 07 February 2015 pims/339200 Boston Barrier TWAO/Products/Design Products/GI/GIR
105
Appendix H. Contamination Results
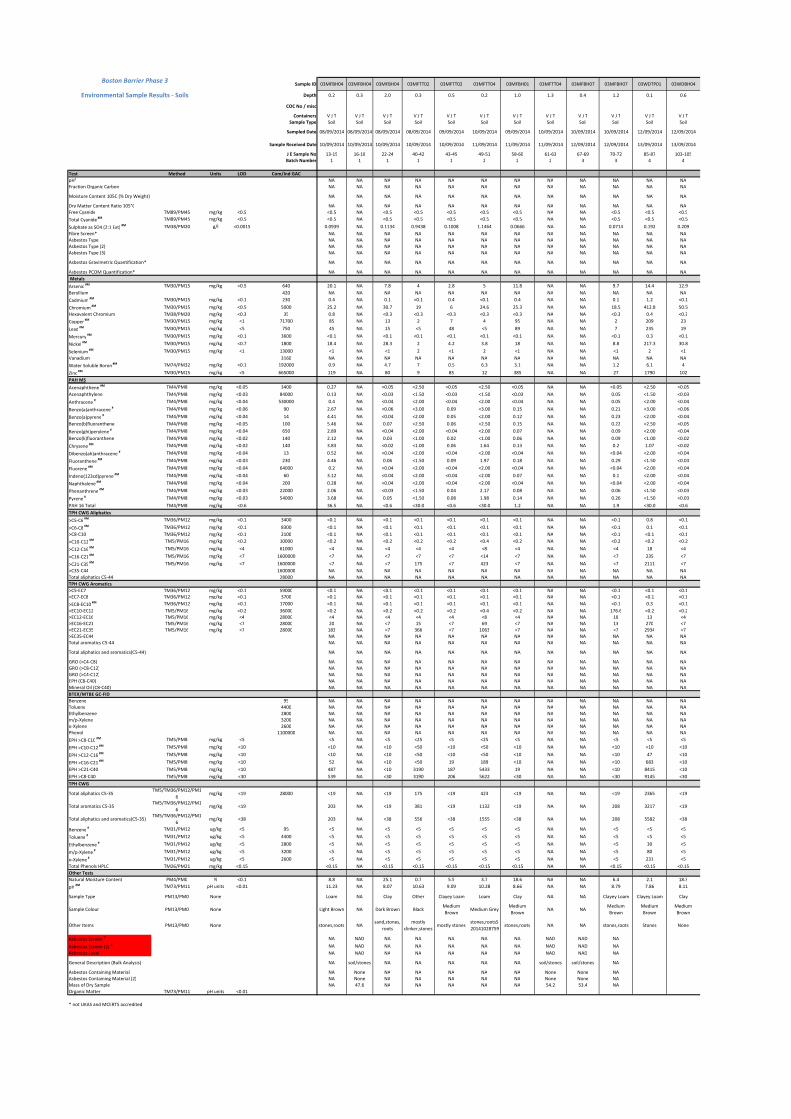
Sample ID 03MFBH04 03MFBH04 03MFBH04 03MFTT02 03MFTT02 03MFTT04 03MFBH01 03MFTT04 03MFBH07 03MFBH07 03WDTP01 03WDBH04
Depth 0.2 0.3 2.0 0.3 0.5 0.2 1.0 1.3 0.4 1.2 0.1 0.6
COC No / misc
Containers V J T V J T V J T V J T V J T V J T V J T V J T V J T V J T V J T V J T
Sample Type Soil Soil Soil Soil Soil Soil Soil Soil Soil Soil Soil Soil
Sampled Date 08/09/2014 08/09/2014 08/09/2014 08/09/2014 09/09/2014 10/09/2014 09/09/2014 10/09/2014 10/09/2014 10/09/2014 12/09/2014 12/09/2014
Sample Received Date 10/09/2014 10/09/2014 10/09/2014 10/09/2014 10/09/2014 11/09/2014 11/09/2014 11/09/2014 12/09/2014 12/09/2014 13/09/2014 13/09/2014
J E Sample No 13-15 16-18 22-24 40-42 43-45 49-51 58-60 61-63 67-69 70-72 85-87 103-105
Batch Number 1 1 1 1 1 2 2 2 3 3 4 4
Test Method Units LOD Com/Ind GAC
pH¹ NA NA NA NA NA NA NA NA NA NA NA NA
Fraction Organic Carbon NA NA NA NA NA NA NA NA NA NA NA NA
Moisture Content 105C (% Dry Weight) NA NA NA NA NA NA NA NA NA NA NA NA
Dry Matter Content Ratio 105°C NA NA NA NA NA NA NA NA NA NA NA NA
Free Cyanide TM89/PM45 mg/kg <0.5 <0.5 NA <0.5 <0.5 <0.5 <0.5 <0.5 NA NA <0.5 <0.5 <0.5
Total Cyanide #M TM89/PM45 mg/kg <0.5 <0.5 NA <0.5 <0.5 <0.5 <0.5 <0.5 NA NA <0.5 <0.5 <0.5
Sulphate as SO4 (2:1 Ext) #M TM38/PM20 g/l <0.0015 0.0939 NA 0.1134 0.9438 0.1008 1.1464 0.0666 NA NA 0.0714 0.192 0.209
Fibre Screen* NA NA NA NA NA NA NA NA NA NA NA NA
Asbestos Type NA NA NA NA NA NA NA NA NA NA NA NA
Asbestos Type (2) NA NA NA NA NA NA NA NA NA NA NA NA
Asbestos Type (3) NA NA NA NA NA NA NA NA NA NA NA NA
Asbestos Gravimetric Quantification* NA NA NA NA NA NA NA NA NA NA NA NA
Asbestos PCOM Quantification* NA NA NA NA NA NA NA NA NA NA NA NA
Metals
Arsenic #M TM30/PM15 mg/kg <0.5 640 20.1 NA 7.8 4 2.8 5 11.8 NA NA 9.7 14.4 12.9
Beryllium 420 NA NA NA NA NA NA NA NA NA NA NA NA
Cadmium #M TM30/PM15 mg/kg <0.1 230 0.4 NA 0.1 <0.1 0.4 <0.1 0.4 NA NA 0.1 1.2 <0.1
Chromium #M TM30/PM15 mg/kg <0.5 5000 25.2 NA 30.7 19 6 24.6 25.3 NA NA 18.5 412.8 50.5
Hexavalent Chromium TM38/PM20 mg/kg <0.3 35 0.8 NA <0.3 <0.3 <0.3 <0.3 <0.3 NA NA <0.3 0.4 <0.3
Copper #M TM30/PM15 mg/kg <1 71700 85 NA 13 2 7 4 95 NA NA 2 209 23
Lead #M TM30/PM15 mg/kg <5 750 45 NA 15 <5 48 <5 89 NA NA 7 235 19
Mercury #M TM30/PM15 mg/kg <0.1 3600 <0.1 NA <0.1 <0.1 <0.1 <0.1 <0.1 NA NA <0.1 0.3 <0.1
Nickel #M TM30/PM15 mg/kg <0.7 1800 18.4 NA 28.3 2 4.2 3.8 18 NA NA 8.8 217.3 30.8
Selenium #M TM30/PM15 mg/kg <1 13000 <1 NA <1 2 <1 2 <1 NA NA <1 2 <1
Vanadium 3160 NA NA NA NA NA NA NA NA NA NA NA NA
Water Soluble Boron #M TM74/PM32 mg/kg <0.1 192000 0.9 NA 4.7 7 0.5 6.3 3.1 NA NA 1.2 6.1 4
Zinc #M TM30/PM15 mg/kg <5 665000 119 NA 80 9 85 12 385 NA NA 27 1790 102
PAH MS
Acenaphthene #M TM4/PM8 mg/kg <0.05 3400 0.27 NA <0.05 <2.50 <0.05 <2.50 <0.05 NA NA <0.05 <2.50 <0.05
Acenaphthylene TM4/PM8 mg/kg <0.03 84000 0.13 NA <0.03 <1.50 <0.03 <1.50 <0.03 NA NA 0.05 <1.50 <0.03
Anthracene # TM4/PM8 mg/kg <0.04 530000 0.4 NA <0.04 <2.00 <0.04 <2.00 <0.04 NA NA 0.05 <2.00 <0.04
Benzo(a)anthracene # TM4/PM8 mg/kg <0.06 90 2.67 NA <0.06 <3.00 0.09 <3.00 0.15 NA NA 0.21 <3.00 <0.06
Benzo(a)pyrene # TM4/PM8 mg/kg <0.04 14 4.41 NA <0.04 <2.00 0.05 <2.00 0.12 NA NA 0.23 <2.00 <0.04
Benzo(b)fluoranthene TM4/PM8 mg/kg <0.05 100 5.46 NA 0.07 <2.50 0.06 <2.50 0.15 NA NA 0.22 <2.50 <0.05
Benzo(ghi)perylene # TM4/PM8 mg/kg <0.04 650 2.89 NA <0.04 <2.00 <0.04 <2.00 0.07 NA NA 0.09 <2.00 <0.04
Benzo(k)fluoranthene TM4/PM8 mg/kg <0.02 140 2.12 NA 0.03 <1.00 0.02 <1.00 0.06 NA NA 0.09 <1.00 <0.02
Chrysene #M TM4/PM8 mg/kg <0.02 140 3.83 NA <0.02 <1.00 0.06 1.64 0.13 NA NA 0.2 1.07 <0.02
Dibenzo(ah)anthracene # TM4/PM8 mg/kg <0.04 13 0.52 NA <0.04 <2.00 <0.04 <2.00 <0.04 NA NA <0.04 <2.00 <0.04
Fluoranthene #M TM4/PM8 mg/kg <0.03 230 4.46 NA 0.06 <1.50 0.09 1.97 0.18 NA NA 0.29 <1.50 <0.03
Fluorene #M TM4/PM8 mg/kg <0.04 64000 0.2 NA <0.04 <2.00 <0.04 <2.00 <0.04 NA NA <0.04 <2.00 <0.04
Indeno(123cd)pyrene #M TM4/PM8 mg/kg <0.04 60 3.12 NA <0.04 <2.00 <0.04 <2.00 0.07 NA NA 0.1 <2.00 <0.04
Naphthalene #M TM4/PM8 mg/kg <0.04 200 0.28 NA <0.04 <2.00 <0.04 <2.00 <0.04 NA NA <0.04 <2.00 <0.04
Phenanthrene #M TM4/PM8 mg/kg <0.03 22000 2.06 NA <0.03 <1.50 0.04 2.17 0.08 NA NA 0.06 <1.50 <0.03
Pyrene # TM4/PM8 mg/kg <0.03 54000 3.68 NA 0.05 <1.50 0.08 1.98 0.14 NA NA 0.26 <1.50 <0.03
PAH 16 Total TM4/PM8 mg/kg <0.6 36.5 NA <0.6 <30.0 <0.6 <30.0 1.2 NA NA 1.9 <30.0 <0.6
TPH CWG Aliphatics
>C5-C6 #M TM36/PM12 mg/kg <0.1 3400 <0.1 NA <0.1 <0.1 <0.1 <0.1 <0.1 NA NA <0.1 0.8 <0.1
>C6-C8 #M TM36/PM12 mg/kg <0.1 8300 <0.1 NA <0.1 <0.1 <0.1 <0.1 <0.1 NA NA <0.1 0.1 <0.1
>C8-C10 TM36/PM12 mg/kg <0.1 2100 <0.1 NA <0.1 <0.1 <0.1 <0.1 <0.1 NA NA <0.1 <0.1 <0.1
>C10-C12 #M TM5/PM16 mg/kg <0.2 10000 <0.2 NA <0.2 <0.2 <0.2 <0.4 <0.2 NA NA <0.2 <0.2 <0.2
>C12-C16 #M TM5/PM16 mg/kg <4 61000 <4 NA <4 <4 <4 <8 <4 NA NA <4 18 <4
>C16-C21 #M TM5/PM16 mg/kg <7 1600000 <7 NA <7 <7 <7 <14 <7 NA NA <7 235 <7
>C21-C35 #M TM5/PM16 mg/kg <7 1600000 <7 NA <7 175 <7 423 <7 NA NA <7 2111 <7
>C35-C44 1600000 NA NA NA NA NA NA NA NA NA NA NA NA
Total aliphatics C5-44 28000 NA NA NA NA NA NA NA NA NA NA NA NA
TPH CWG Aromatics
>C5-EC7 TM36/PM12 mg/kg <0.1 59000 <0.1 NA <0.1 <0.1 <0.1 <0.1 <0.1 NA NA <0.1 <0.1 <0.1
>EC7-EC8 TM36/PM12 mg/kg <0.1 3700 <0.1 NA <0.1 <0.1 <0.1 <0.1 <0.1 NA NA <0.1 <0.1 <0.1
>EC8-EC10 #M TM36/PM12 mg/kg <0.1 17000 <0.1 NA <0.1 <0.1 <0.1 <0.1 <0.1 NA NA <0.1 0.3 <0.1
>EC10-EC12 TM5/PM16 mg/kg <0.2 36000 <0.2 NA <0.2 <0.2 <0.2 <0.4 <0.2 NA NA 176.6 <0.2 <0.2
>EC12-EC16 TM5/PM16 mg/kg <4 28000 <4 NA <4 <4 <4 <8 <4 NA NA 18 13 <4
>EC16-EC21 TM5/PM16 mg/kg <7 28000 20 NA <7 15 <7 69 <7 NA NA 13 270 <7
>EC21-EC35 TM5/PM16 mg/kg <7 28000 183 NA <7 366 <7 1063 <7 NA NA <7 2934 <7
>EC35-EC44 NA NA NA NA NA NA NA NA NA NA NA NA
Total aromatics C5-44 NA NA NA NA NA NA NA NA NA NA NA NA
Total aliphatics and aromatics(C5-44) NA NA NA NA NA NA NA NA NA NA NA NA
GRO (>C4-C8) NA NA NA NA NA NA NA NA NA NA NA NA
GRO (>C8-C12) NA NA NA NA NA NA NA NA NA NA NA NA
GRO (>C4-C12) NA NA NA NA NA NA NA NA NA NA NA NA
EPH (C8-C40) NA NA NA NA NA NA NA NA NA NA NA NA
Mineral Oil (C8-C40) NA NA NA NA NA NA NA NA NA NA NA NA
BTEX/MTBE GC-FID
Benzene 95 NA NA NA NA NA NA NA NA NA NA NA NA
Toluene 4400 NA NA NA NA NA NA NA NA NA NA NA NA
Ethylbenzene 2800 NA NA NA NA NA NA NA NA NA NA NA NA
m/p-Xylene 3200 NA NA NA NA NA NA NA NA NA NA NA NA
o-Xylene 2600 NA NA NA NA NA NA NA NA NA NA NA NA
Phenol 1100000 NA NA NA NA NA NA NA NA NA NA NA NA
EPH >C8-C10 #M TM5/PM8 mg/kg <5 <5 NA <5 <25 <5 <25 <5 NA NA <5 <5 <5
EPH >C10-C12 #M TM5/PM8 mg/kg <10 <10 NA <10 <50 <10 <50 <10 NA NA <10 <10 <10
EPH >C12-C16 #M TM5/PM8 mg/kg <10 <10 NA <10 <50 <10 <50 <10 NA NA <10 47 <10
EPH >C16-C21 #M TM5/PM8 mg/kg <10 52 NA <10 <50 19 189 <10 NA NA <10 683 <10
EPH >C21-C40 TM5/PM8 mg/kg <10 487 NA <10 3190 187 5433 19 NA NA <10 8415 <10
EPH >C8-C40 TM5/PM8 mg/kg <30 539 NA <30 3190 206 5622 <30 NA NA <30 9145 <30
TPH CWG
Total aliphatics C5-35TM5/TM36/PM12/PM1
6mg/kg <19 28000 <19 NA <19 175 <19 423 <19 NA NA <19 2365 <19
Total aromatics C5-35TM5/TM36/PM12/PM1
6mg/kg <19 203 NA <19 381 <19 1132 <19 NA NA 208 3217 <19
Total aliphatics and aromatics(C5-35)TM5/TM36/PM12/PM1
6mg/kg <38 203 NA <38 556 <38 1555 <38 NA NA 208 5582 <38
Benzene # TM31/PM12 ug/kg <5 95 <5 NA <5 <5 <5 <5 <5 NA NA <5 <5 <5
Toluene # TM31/PM12 ug/kg <5 4400 <5 NA <5 <5 <5 <5 <5 NA NA <5 <5 <5
Ethylbenzene # TM31/PM12 ug/kg <5 2800 <5 NA <5 <5 <5 <5 <5 NA NA <5 30 <5
m/p-Xylene # TM31/PM12 ug/kg <5 3200 <5 NA <5 <5 <5 <5 <5 NA NA <5 80 <5
o-Xylene # TM31/PM12 ug/kg <5 2600 <5 NA <5 <5 <5 <5 <5 NA NA <5 231 <5
Total Phenols HPLC TM26/PM21 mg/kg <0.15 <0.15 NA <0.15 <0.15 <0.15 <0.15 <0.15 NA NA <0.15 <0.15 <0.15
Other Tests
Natural Moisture Content PM4/PM0 % <0.1 8.8 NA 25.1 0.7 5.5 3.7 18.6 NA NA 6.4 2.1 18.3
pH #M TM73/PM11 pH units <0.01 11.23 NA 8.07 10.63 9.09 10.28 8.66 NA NA 8.79 7.86 8.11
Sample Type PM13/PM0 None Loam NA Clay Other Clayey Loam Loam Clay NA NA Clayey Loam Clayey Loam Clay
Sample Colour PM13/PM0 None Light Brown NA Dark Brown BlackMedium
BrownMedium Grey
Medium
BrownNA NA
Medium
Brown
Medium
Brown
Medium
Brown
Other Items PM13/PM0 None stones,roots NAsand,stones,
roots
mostly
clinker,stonesmostly stones
stones,rootsS
20141028759stones,roots NA NA stones,roots Stones None
Asbestos Screen # NA NAD NA NA NA NA NA NAD NAD NA
Asbestos Screen (2) # NA NAD NA NA NA NA NA NAD NAD NA
Asbestos Level NA NAD NA NA NA NA NA NAD NAD NA
General Description (Bulk Analysis) NA soil/stones NA NA NA NA NA soil/stones soil/stones NA
Asbestos Containing Material NA None NA NA NA NA NA None None NA
Asbestos Containing Material (2) NA None NA NA NA NA NA None None NA
Mass of Dry Sample NA 47.6 NA NA NA NA NA 54.2 53.4 NA
Organic Matter TM73/PM11 pH units <0.01
* not UKAS and MCERTS accredited
Boston Barrier Phase 3
Environmental Sample Results - Soils
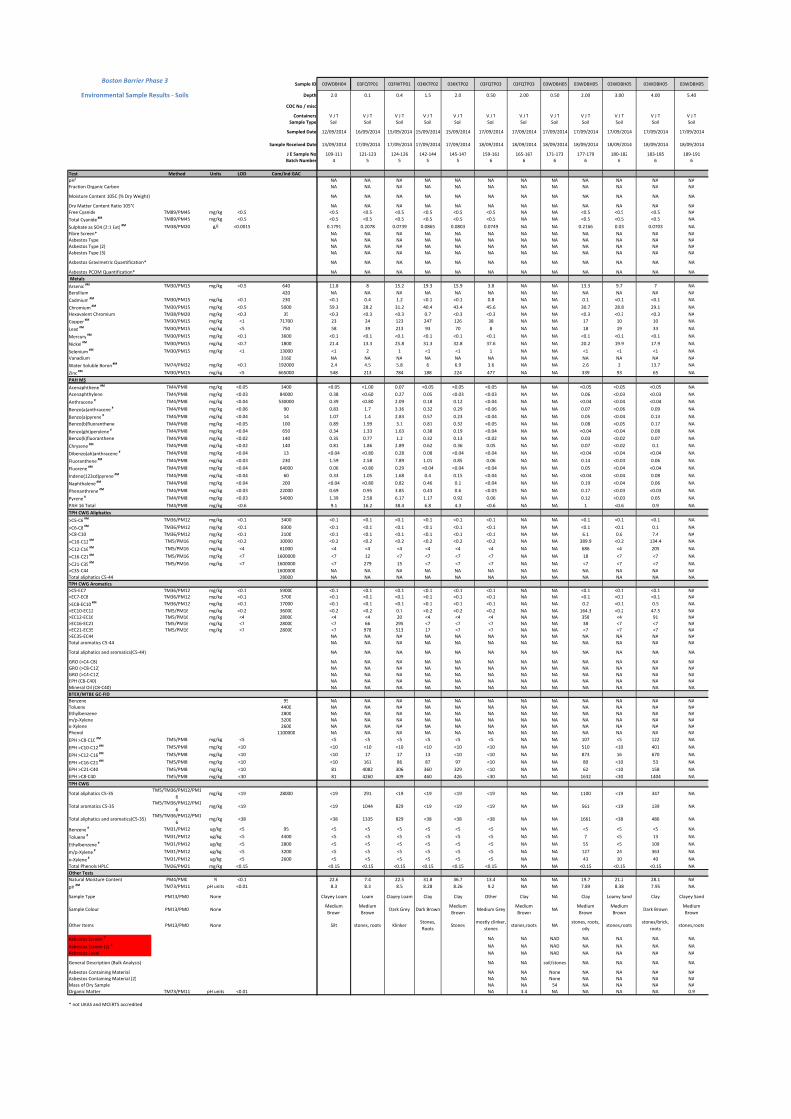
Sample ID
Depth
COC No / misc
Containers
Sample Type
Sampled Date
Sample Received Date
J E Sample No
Batch Number
Test Method Units LOD Com/Ind GAC
pH¹
Fraction Organic Carbon
Moisture Content 105C (% Dry Weight)
Dry Matter Content Ratio 105°C
Free Cyanide TM89/PM45 mg/kg <0.5
Total Cyanide #M TM89/PM45 mg/kg <0.5
Sulphate as SO4 (2:1 Ext) #M TM38/PM20 g/l <0.0015
Fibre Screen*
Asbestos Type
Asbestos Type (2)
Asbestos Type (3)
Asbestos Gravimetric Quantification*
Asbestos PCOM Quantification*
Metals
Arsenic #M TM30/PM15 mg/kg <0.5 640
Beryllium 420
Cadmium #M TM30/PM15 mg/kg <0.1 230
Chromium #M TM30/PM15 mg/kg <0.5 5000
Hexavalent Chromium TM38/PM20 mg/kg <0.3 35
Copper #M TM30/PM15 mg/kg <1 71700
Lead #M TM30/PM15 mg/kg <5 750
Mercury #M TM30/PM15 mg/kg <0.1 3600
Nickel #M TM30/PM15 mg/kg <0.7 1800
Selenium #M TM30/PM15 mg/kg <1 13000
Vanadium 3160
Water Soluble Boron #M TM74/PM32 mg/kg <0.1 192000
Zinc #M TM30/PM15 mg/kg <5 665000
PAH MS
Acenaphthene #M TM4/PM8 mg/kg <0.05 3400
Acenaphthylene TM4/PM8 mg/kg <0.03 84000
Anthracene # TM4/PM8 mg/kg <0.04 530000
Benzo(a)anthracene # TM4/PM8 mg/kg <0.06 90
Benzo(a)pyrene # TM4/PM8 mg/kg <0.04 14
Benzo(b)fluoranthene TM4/PM8 mg/kg <0.05 100
Benzo(ghi)perylene # TM4/PM8 mg/kg <0.04 650
Benzo(k)fluoranthene TM4/PM8 mg/kg <0.02 140
Chrysene #M TM4/PM8 mg/kg <0.02 140
Dibenzo(ah)anthracene # TM4/PM8 mg/kg <0.04 13
Fluoranthene #M TM4/PM8 mg/kg <0.03 230
Fluorene #M TM4/PM8 mg/kg <0.04 64000
Indeno(123cd)pyrene #M TM4/PM8 mg/kg <0.04 60
Naphthalene #M TM4/PM8 mg/kg <0.04 200
Phenanthrene #M TM4/PM8 mg/kg <0.03 22000
Pyrene # TM4/PM8 mg/kg <0.03 54000
PAH 16 Total TM4/PM8 mg/kg <0.6
TPH CWG Aliphatics
>C5-C6 #M TM36/PM12 mg/kg <0.1 3400
>C6-C8 #M TM36/PM12 mg/kg <0.1 8300
>C8-C10 TM36/PM12 mg/kg <0.1 2100
>C10-C12 #M TM5/PM16 mg/kg <0.2 10000
>C12-C16 #M TM5/PM16 mg/kg <4 61000
>C16-C21 #M TM5/PM16 mg/kg <7 1600000
>C21-C35 #M TM5/PM16 mg/kg <7 1600000
>C35-C44 1600000
Total aliphatics C5-44 28000
TPH CWG Aromatics
>C5-EC7 TM36/PM12 mg/kg <0.1 59000
>EC7-EC8 TM36/PM12 mg/kg <0.1 3700
>EC8-EC10 #M TM36/PM12 mg/kg <0.1 17000
>EC10-EC12 TM5/PM16 mg/kg <0.2 36000
>EC12-EC16 TM5/PM16 mg/kg <4 28000
>EC16-EC21 TM5/PM16 mg/kg <7 28000
>EC21-EC35 TM5/PM16 mg/kg <7 28000
>EC35-EC44
Total aromatics C5-44
Total aliphatics and aromatics(C5-44)
GRO (>C4-C8)
GRO (>C8-C12)
GRO (>C4-C12)
EPH (C8-C40)
Mineral Oil (C8-C40)
BTEX/MTBE GC-FID
Benzene 95
Toluene 4400
Ethylbenzene 2800
m/p-Xylene 3200
o-Xylene 2600
Phenol 1100000
EPH >C8-C10 #M TM5/PM8 mg/kg <5
EPH >C10-C12 #M TM5/PM8 mg/kg <10
EPH >C12-C16 #M TM5/PM8 mg/kg <10
EPH >C16-C21 #M TM5/PM8 mg/kg <10
EPH >C21-C40 TM5/PM8 mg/kg <10
EPH >C8-C40 TM5/PM8 mg/kg <30
TPH CWG
Total aliphatics C5-35TM5/TM36/PM12/PM1
6mg/kg <19 28000
Total aromatics C5-35TM5/TM36/PM12/PM1
6mg/kg <19
Total aliphatics and aromatics(C5-35)TM5/TM36/PM12/PM1
6mg/kg <38
Benzene # TM31/PM12 ug/kg <5 95
Toluene # TM31/PM12 ug/kg <5 4400
Ethylbenzene # TM31/PM12 ug/kg <5 2800
m/p-Xylene # TM31/PM12 ug/kg <5 3200
o-Xylene # TM31/PM12 ug/kg <5 2600
Total Phenols HPLC TM26/PM21 mg/kg <0.15
Other Tests
Natural Moisture Content PM4/PM0 % <0.1
pH #M TM73/PM11 pH units <0.01
Sample Type PM13/PM0 None
Sample Colour PM13/PM0 None
Other Items PM13/PM0 None
Asbestos Screen #
Asbestos Screen (2) #
Asbestos Level
General Description (Bulk Analysis)
Asbestos Containing Material
Asbestos Containing Material (2)
Mass of Dry Sample
Organic Matter TM73/PM11 pH units <0.01
* not UKAS and MCERTS accredited
Boston Barrier Phase 3
Environmental Sample Results - Soils
03WDBH04 03FQTP01 03FWTP01 03KKTP02 03KKTP02 03FQTP03 03FQTP03 03WDBH05 03WDBH05 03WDBH05 03WDBH05 03WDBH05
2.0 0.1 0.4 1.5 2.0 0.50 2.00 0.50 2.00 3.00 4.00 5.40
V J T V J T V J T V J T V J T V J T V J T V J T V J T V J T V J T V J T
Soil Soil Soil Soil Soil Soil Soil Soil Soil Soil Soil Soil
12/09/2014 16/09/2014 15/09/2014 15/09/2014 15/09/2014 17/09/2014 17/09/2014 17/09/2014 17/09/2014 17/09/2014 17/09/2014 17/09/2014
13/09/2014 17/09/2014 17/09/2014 17/09/2014 17/09/2014 18/09/2014 18/09/2014 18/09/2014 18/09/2014 18/09/2014 18/09/2014 18/09/2014
109-111 121-123 124-126 142-144 145-147 159-161 165-167 171-173 177-179 180-182 183-185 189-191
4 5 5 5 5 6 6 6 6 6 6 6
NA NA NA NA NA NA NA NA NA NA NA NA
NA NA NA NA NA NA NA NA NA NA NA NA
NA NA NA NA NA NA NA NA NA NA NA NA
NA NA NA NA NA NA NA NA NA NA NA NA
<0.5 <0.5 <0.5 <0.5 <0.5 <0.5 NA NA <0.5 <0.5 <0.5 NA
<0.5 <0.5 <0.5 <0.5 <0.5 <0.5 NA NA <0.5 <0.5 <0.5 NA
0.1791 0.2078 0.0739 0.0865 0.0803 0.0749 NA NA 0.2166 0.03 0.0703 NA
NA NA NA NA NA NA NA NA NA NA NA NA
NA NA NA NA NA NA NA NA NA NA NA NA
NA NA NA NA NA NA NA NA NA NA NA NA
NA NA NA NA NA NA NA NA NA NA NA NA
NA NA NA NA NA NA NA NA NA NA NA NA
NA NA NA NA NA NA NA NA NA NA NA NA
11.8 8 15.2 19.3 15.9 3.8 NA NA 13.3 9.7 7 NA
NA NA NA NA NA NA NA NA NA NA NA NA
<0.1 0.4 1.2 <0.1 <0.1 0.8 NA NA 0.1 <0.1 <0.1 NA
59.3 28.2 31.2 40.4 43.4 45.6 NA NA 30.7 28.8 29.1 NA
<0.3 <0.3 <0.3 0.7 <0.3 <0.3 NA NA <0.3 <0.3 <0.3 NA
23 24 123 247 126 38 NA NA 17 10 10 NA
58 39 213 93 70 8 NA NA 18 19 33 NA
<0.1 <0.1 <0.1 <0.1 <0.1 <0.1 NA NA <0.1 <0.1 <0.1 NA
21.4 13.3 25.8 31.3 32.8 37.6 NA NA 20.2 19.9 17.9 NA
<1 2 1 <1 <1 1 NA NA <1 <1 <1 NA
NA NA NA NA NA NA NA NA NA NA NA NA
2.4 4.5 5.8 6 6.9 3.6 NA NA 2.6 2 13.7 NA
548 213 784 188 224 477 NA NA 339 93 65 NA
<0.05 <1.00 0.07 <0.05 <0.05 <0.05 NA NA <0.05 <0.05 <0.05 NA
0.38 <0.60 0.27 0.05 <0.03 <0.03 NA NA 0.06 <0.03 <0.03 NA
0.39 <0.80 2.09 0.18 0.12 <0.04 NA NA <0.04 <0.04 <0.04 NA
0.83 1.7 3.36 0.32 0.29 <0.06 NA NA 0.07 <0.06 0.09 NA
1.07 1.4 2.83 0.57 0.23 <0.04 NA NA 0.05 <0.04 0.13 NA
0.89 1.99 3.1 0.81 0.32 <0.05 NA NA 0.08 <0.05 0.17 NA
0.34 1.33 1.63 0.38 0.19 <0.04 NA NA <0.04 <0.04 0.08 NA
0.35 0.77 1.2 0.32 0.13 <0.02 NA NA 0.03 <0.02 0.07 NA
0.81 1.86 2.89 0.62 0.36 0.05 NA NA 0.07 <0.02 0.1 NA
<0.04 <0.80 0.28 0.08 <0.04 <0.04 NA NA <0.04 <0.04 <0.04 NA
1.59 2.58 7.89 1.01 0.85 0.06 NA NA 0.14 <0.03 0.06 NA
0.06 <0.80 0.29 <0.04 <0.04 <0.04 NA NA 0.05 <0.04 <0.04 NA
0.33 1.05 1.68 0.4 0.15 <0.04 NA NA <0.04 <0.04 0.08 NA
<0.04 <0.80 0.82 0.46 0.1 <0.04 NA NA 0.19 <0.04 0.06 NA
0.69 0.95 3.85 0.43 0.6 <0.03 NA NA 0.17 <0.03 <0.03 NA
1.39 2.58 6.17 1.17 0.92 0.06 NA NA 0.12 <0.03 0.05 NA
9.1 16.2 38.4 6.8 4.3 <0.6 NA NA 1 <0.6 0.9 NA
<0.1 <0.1 <0.1 <0.1 <0.1 <0.1 NA NA <0.1 <0.1 <0.1 NA
<0.1 <0.1 <0.1 <0.1 <0.1 <0.1 NA NA <0.1 <0.1 0.1 NA
<0.1 <0.1 <0.1 <0.1 <0.1 <0.1 NA NA 6.1 0.6 7.4 NA
<0.2 <0.2 <0.2 <0.2 <0.2 <0.2 NA NA 389.9 <0.2 134.4 NA
<4 <4 <4 <4 <4 <4 NA NA 686 <4 205 NA
<7 12 <7 <7 <7 <7 NA NA 18 <7 <7 NA
<7 279 15 <7 <7 <7 NA NA <7 <7 <7 NA
NA NA NA NA NA NA NA NA NA NA NA NA
NA NA NA NA NA NA NA NA NA NA NA NA
<0.1 <0.1 <0.1 <0.1 <0.1 <0.1 NA NA <0.1 <0.1 <0.1 NA
<0.1 <0.1 <0.1 <0.1 <0.1 <0.1 NA NA <0.1 <0.1 <0.1 NA
<0.1 <0.1 <0.1 <0.1 <0.1 <0.1 NA NA 0.2 <0.1 0.5 NA
<0.2 <0.2 0.7 <0.2 <0.2 <0.2 NA NA 164.3 <0.2 47.5 NA
<4 <4 20 <4 <4 <4 NA NA 358 <4 91 NA
<7 66 295 <7 <7 <7 NA NA 38 <7 <7 NA
<7 978 513 17 <7 <7 NA NA <7 <7 <7 NA
NA NA NA NA NA NA NA NA NA NA NA NA
NA NA NA NA NA NA NA NA NA NA NA NA
NA NA NA NA NA NA NA NA NA NA NA NA
NA NA NA NA NA NA NA NA NA NA NA NA
NA NA NA NA NA NA NA NA NA NA NA NA
NA NA NA NA NA NA NA NA NA NA NA NA
NA NA NA NA NA NA NA NA NA NA NA NA
NA NA NA NA NA NA NA NA NA NA NA NA
NA NA NA NA NA NA NA NA NA NA NA NA
NA NA NA NA NA NA NA NA NA NA NA NA
NA NA NA NA NA NA NA NA NA NA NA NA
NA NA NA NA NA NA NA NA NA NA NA NA
NA NA NA NA NA NA NA NA NA NA NA NA
NA NA NA NA NA NA NA NA NA NA NA NA
<5 <5 <5 <5 <5 <5 NA NA 107 <5 122 NA
<10 <10 <10 <10 <10 <10 NA NA 510 <10 401 NA
<10 17 17 13 <10 <10 NA NA 873 16 670 NA
<10 161 86 87 97 <10 NA NA 80 <10 53 NA
81 4082 306 360 329 <10 NA NA 62 <10 158 NA
81 4260 409 460 426 <30 NA NA 1632 <30 1404 NA
<19 291 <19 <19 <19 <19 NA NA 1100 <19 347 NA
<19 1044 829 <19 <19 <19 NA NA 561 <19 139 NA
<38 1335 829 <38 <38 <38 NA NA 1661 <38 486 NA
<5 <5 <5 <5 <5 <5 NA NA <5 <5 <5 NA
<5 <5 <5 <5 <5 <5 NA NA 7 <5 13 NA
<5 <5 <5 <5 <5 <5 NA NA 55 <5 109 NA
<5 <5 <5 <5 <5 <5 NA NA 127 24 363 NA
<5 <5 <5 <5 <5 <5 NA NA 43 10 40 NA
<0.15 <0.15 <0.15 <0.15 <0.15 <0.15 NA NA <0.15 <0.15 <0.15 NA
22.6 7.4 22.5 31.8 36.7 13.4 NA NA 19.7 21.2 28.1 NA
8.3 8.3 8.5 8.28 8.26 9.2 NA NA 7.89 8.38 7.95 NA
Clayey Loam Loam Clayey Loam Clay Clay Other Clay NA Clay Loamy Sand Clay Clayey Sand
Medium
Brown
Medium
BrownDark Grey Dark Brown
Medium
BrownMedium Grey
Medium
BrownNA
Medium
Brown
Medium
BrownDark Brown
Medium
Brown
Silt stones, roots KlinkerStones,
RootsStones
mostly clinker,
stonesstones,roots NA
stones, roots,
oilystones,roots
stones/brick,
rootsstones,roots
NA NA NAD NA NA NA NA
NA NA NAD NA NA NA NA
NA NA NAD NA NA NA NA
NA NA soil/stones NA NA NA NA
NA NA None NA NA NA NA
NA NA None NA NA NA NA
NA NA 54 NA NA NA NA
NA 3.4 NA NA NA NA 0.9
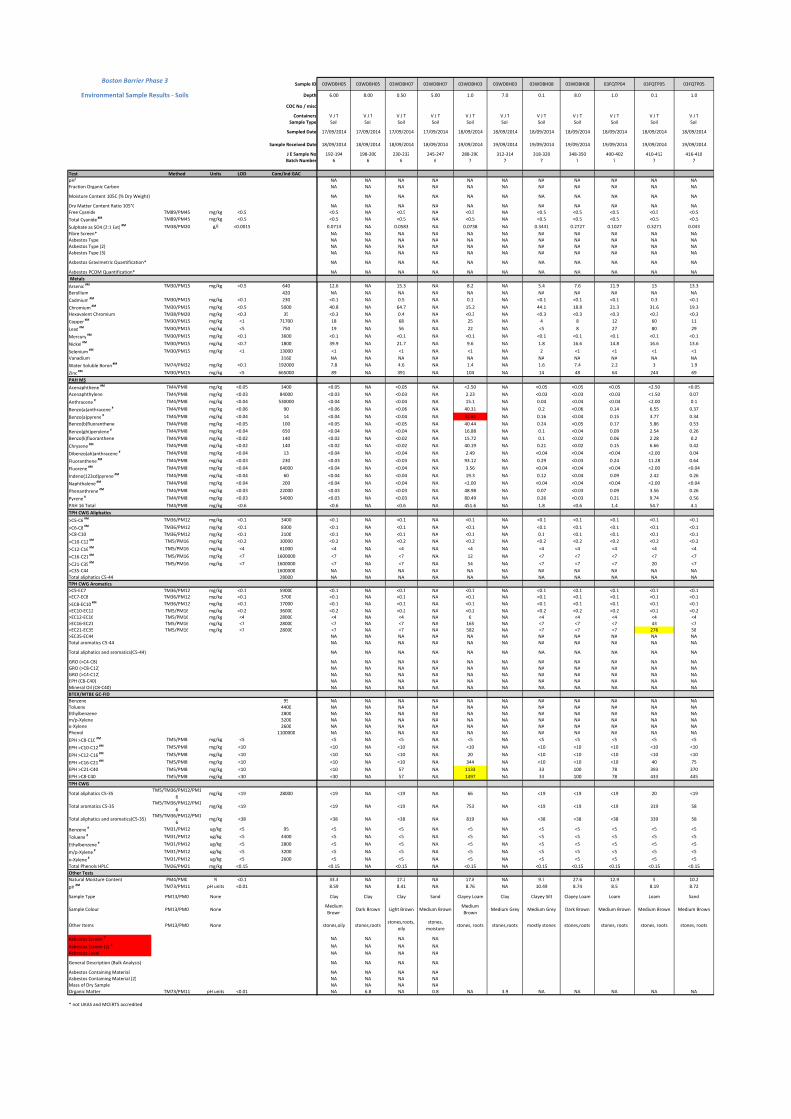
Sample ID
Depth
COC No / misc
Containers
Sample Type
Sampled Date
Sample Received Date
J E Sample No
Batch Number
Test Method Units LOD Com/Ind GAC
pH¹
Fraction Organic Carbon
Moisture Content 105C (% Dry Weight)
Dry Matter Content Ratio 105°C
Free Cyanide TM89/PM45 mg/kg <0.5
Total Cyanide #M TM89/PM45 mg/kg <0.5
Sulphate as SO4 (2:1 Ext) #M TM38/PM20 g/l <0.0015
Fibre Screen*
Asbestos Type
Asbestos Type (2)
Asbestos Type (3)
Asbestos Gravimetric Quantification*
Asbestos PCOM Quantification*
Metals
Arsenic #M TM30/PM15 mg/kg <0.5 640
Beryllium 420
Cadmium #M TM30/PM15 mg/kg <0.1 230
Chromium #M TM30/PM15 mg/kg <0.5 5000
Hexavalent Chromium TM38/PM20 mg/kg <0.3 35
Copper #M TM30/PM15 mg/kg <1 71700
Lead #M TM30/PM15 mg/kg <5 750
Mercury #M TM30/PM15 mg/kg <0.1 3600
Nickel #M TM30/PM15 mg/kg <0.7 1800
Selenium #M TM30/PM15 mg/kg <1 13000
Vanadium 3160
Water Soluble Boron #M TM74/PM32 mg/kg <0.1 192000
Zinc #M TM30/PM15 mg/kg <5 665000
PAH MS
Acenaphthene #M TM4/PM8 mg/kg <0.05 3400
Acenaphthylene TM4/PM8 mg/kg <0.03 84000
Anthracene # TM4/PM8 mg/kg <0.04 530000
Benzo(a)anthracene # TM4/PM8 mg/kg <0.06 90
Benzo(a)pyrene # TM4/PM8 mg/kg <0.04 14
Benzo(b)fluoranthene TM4/PM8 mg/kg <0.05 100
Benzo(ghi)perylene # TM4/PM8 mg/kg <0.04 650
Benzo(k)fluoranthene TM4/PM8 mg/kg <0.02 140
Chrysene #M TM4/PM8 mg/kg <0.02 140
Dibenzo(ah)anthracene # TM4/PM8 mg/kg <0.04 13
Fluoranthene #M TM4/PM8 mg/kg <0.03 230
Fluorene #M TM4/PM8 mg/kg <0.04 64000
Indeno(123cd)pyrene #M TM4/PM8 mg/kg <0.04 60
Naphthalene #M TM4/PM8 mg/kg <0.04 200
Phenanthrene #M TM4/PM8 mg/kg <0.03 22000
Pyrene # TM4/PM8 mg/kg <0.03 54000
PAH 16 Total TM4/PM8 mg/kg <0.6
TPH CWG Aliphatics
>C5-C6 #M TM36/PM12 mg/kg <0.1 3400
>C6-C8 #M TM36/PM12 mg/kg <0.1 8300
>C8-C10 TM36/PM12 mg/kg <0.1 2100
>C10-C12 #M TM5/PM16 mg/kg <0.2 10000
>C12-C16 #M TM5/PM16 mg/kg <4 61000
>C16-C21 #M TM5/PM16 mg/kg <7 1600000
>C21-C35 #M TM5/PM16 mg/kg <7 1600000
>C35-C44 1600000
Total aliphatics C5-44 28000
TPH CWG Aromatics
>C5-EC7 TM36/PM12 mg/kg <0.1 59000
>EC7-EC8 TM36/PM12 mg/kg <0.1 3700
>EC8-EC10 #M TM36/PM12 mg/kg <0.1 17000
>EC10-EC12 TM5/PM16 mg/kg <0.2 36000
>EC12-EC16 TM5/PM16 mg/kg <4 28000
>EC16-EC21 TM5/PM16 mg/kg <7 28000
>EC21-EC35 TM5/PM16 mg/kg <7 28000
>EC35-EC44
Total aromatics C5-44
Total aliphatics and aromatics(C5-44)
GRO (>C4-C8)
GRO (>C8-C12)
GRO (>C4-C12)
EPH (C8-C40)
Mineral Oil (C8-C40)
BTEX/MTBE GC-FID
Benzene 95
Toluene 4400
Ethylbenzene 2800
m/p-Xylene 3200
o-Xylene 2600
Phenol 1100000
EPH >C8-C10 #M TM5/PM8 mg/kg <5
EPH >C10-C12 #M TM5/PM8 mg/kg <10
EPH >C12-C16 #M TM5/PM8 mg/kg <10
EPH >C16-C21 #M TM5/PM8 mg/kg <10
EPH >C21-C40 TM5/PM8 mg/kg <10
EPH >C8-C40 TM5/PM8 mg/kg <30
TPH CWG
Total aliphatics C5-35TM5/TM36/PM12/PM1
6mg/kg <19 28000
Total aromatics C5-35TM5/TM36/PM12/PM1
6mg/kg <19
Total aliphatics and aromatics(C5-35)TM5/TM36/PM12/PM1
6mg/kg <38
Benzene # TM31/PM12 ug/kg <5 95
Toluene # TM31/PM12 ug/kg <5 4400
Ethylbenzene # TM31/PM12 ug/kg <5 2800
m/p-Xylene # TM31/PM12 ug/kg <5 3200
o-Xylene # TM31/PM12 ug/kg <5 2600
Total Phenols HPLC TM26/PM21 mg/kg <0.15
Other Tests
Natural Moisture Content PM4/PM0 % <0.1
pH #M TM73/PM11 pH units <0.01
Sample Type PM13/PM0 None
Sample Colour PM13/PM0 None
Other Items PM13/PM0 None
Asbestos Screen #
Asbestos Screen (2) #
Asbestos Level
General Description (Bulk Analysis)
Asbestos Containing Material
Asbestos Containing Material (2)
Mass of Dry Sample
Organic Matter TM73/PM11 pH units <0.01
* not UKAS and MCERTS accredited
Boston Barrier Phase 3
Environmental Sample Results - Soils
03WDBH05 03WDBH05 03WDBH07 03WDBH07 03WDBH03 03WDBH03 03WDBH08 03WDBH08 03FQTP04 03FQTP05 03FQTP05
6.00 8.00 0.50 5.00 1.0 7.0 0.1 8.0 1.0 0.1 1.0
V J T V J T V J T V J T V J T V J T V J T V J T V J T V J T V J T
Soil Soil Soil Soil Soil Soil Soil Soil Soil Soil Soil
17/09/2014 17/09/2014 17/09/2014 17/09/2014 18/09/2014 18/09/2014 18/09/2014 18/09/2014 18/09/2014 18/09/2014 18/09/2014
18/09/2014 18/09/2014 18/09/2014 18/09/2014 19/09/2014 19/09/2014 19/09/2014 19/09/2014 19/09/2014 19/09/2014 19/09/2014
192-194 198-200 230-232 245-247 288-290 312-314 318-320 348-350 400-402 410-412 416-418
6 6 6 6 7 7 7 7 7 7 7
NA NA NA NA NA NA NA NA NA NA NA
NA NA NA NA NA NA NA NA NA NA NA
NA NA NA NA NA NA NA NA NA NA NA
NA NA NA NA NA NA NA NA NA NA NA
<0.5 NA <0.5 NA <0.5 NA <0.5 <0.5 <0.5 <0.5 <0.5
<0.5 NA <0.5 NA <0.5 NA <0.5 <0.5 <0.5 <0.5 <0.5
0.0714 NA 0.0583 NA 0.0738 NA 0.3441 0.2727 0.1027 0.3271 0.043
NA NA NA NA NA NA NA NA NA NA NA
NA NA NA NA NA NA NA NA NA NA NA
NA NA NA NA NA NA NA NA NA NA NA
NA NA NA NA NA NA NA NA NA NA NA
NA NA NA NA NA NA NA NA NA NA NA
NA NA NA NA NA NA NA NA NA NA NA
12.6 NA 15.3 NA 8.2 NA 5.4 7.6 11.9 13 13.3
NA NA NA NA NA NA NA NA NA NA NA
<0.1 NA 0.5 NA 0.1 NA <0.1 <0.1 <0.1 0.3 <0.1
40.8 NA 64.7 NA 15.2 NA 44.1 18.8 21.3 31.6 19.3
<0.3 NA 0.4 NA <0.3 NA <0.3 <0.3 <0.3 <0.3 <0.3
18 NA 68 NA 25 NA 4 8 12 60 11
19 NA 56 NA 22 NA <5 8 27 80 29
<0.1 NA <0.1 NA <0.1 NA <0.1 <0.1 <0.1 <0.1 <0.1
39.9 NA 21.7 NA 9.6 NA 1.8 16.6 14.8 16.6 13.6
<1 NA <1 NA <1 NA 2 <1 <1 <1 <1
NA NA NA NA NA NA NA NA NA NA NA
7.8 NA 4.6 NA 1.4 NA 1.6 7.4 2.2 3 1.9
89 NA 391 NA 104 NA 14 48 64 244 69
<0.05 NA <0.05 NA <2.50 NA <0.05 <0.05 <0.05 <2.50 <0.05
<0.03 NA <0.03 NA 2.23 NA <0.03 <0.03 <0.03 <1.50 0.07
<0.04 NA <0.04 NA 15.1 NA 0.04 <0.04 <0.04 <2.00 0.1
<0.06 NA <0.06 NA 40.31 NA 0.2 <0.06 0.14 6.55 0.37
<0.04 NA <0.04 NA 32.81 NA 0.16 <0.04 0.15 3.77 0.34
<0.05 NA <0.05 NA 40.44 NA 0.24 <0.05 0.17 5.86 0.53
<0.04 NA <0.04 NA 16.88 NA 0.1 <0.04 0.09 2.54 0.26
<0.02 NA <0.02 NA 15.72 NA 0.1 <0.02 0.06 2.28 0.2
<0.02 NA <0.02 NA 40.19 NA 0.21 <0.02 0.15 6.66 0.42
<0.04 NA <0.04 NA 2.49 NA <0.04 <0.04 <0.04 <2.00 0.04
<0.03 NA <0.03 NA 93.12 NA 0.29 <0.03 0.24 11.28 0.64
<0.04 NA <0.04 NA 3.56 NA <0.04 <0.04 <0.04 <2.00 <0.04
<0.04 NA <0.04 NA 19.3 NA 0.12 <0.04 0.09 2.42 0.26
<0.04 NA <0.04 NA <2.00 NA <0.04 <0.04 <0.04 <2.00 <0.04
<0.03 NA <0.03 NA 48.98 NA 0.07 <0.03 0.09 3.56 0.26
<0.03 NA <0.03 NA 80.49 NA 0.26 <0.03 0.21 9.74 0.56
<0.6 NA <0.6 NA 451.6 NA 1.8 <0.6 1.4 54.7 4.1
<0.1 NA <0.1 NA <0.1 NA <0.1 <0.1 <0.1 <0.1 <0.1
<0.1 NA <0.1 NA <0.1 NA <0.1 <0.1 <0.1 <0.1 <0.1
<0.1 NA <0.1 NA <0.1 NA 0.1 <0.1 <0.1 <0.1 <0.1
<0.2 NA <0.2 NA <0.2 NA <0.2 <0.2 <0.2 <0.2 <0.2
<4 NA <4 NA <4 NA <4 <4 <4 <4 <4
<7 NA <7 NA 12 NA <7 <7 <7 <7 <7
<7 NA <7 NA 54 NA <7 <7 <7 20 <7
NA NA NA NA NA NA NA NA NA NA NA
NA NA NA NA NA NA NA NA NA NA NA
<0.1 NA <0.1 NA <0.1 NA <0.1 <0.1 <0.1 <0.1 <0.1
<0.1 NA <0.1 NA <0.1 NA <0.1 <0.1 <0.1 <0.1 <0.1
<0.1 NA <0.1 NA <0.1 NA <0.1 <0.1 <0.1 <0.1 <0.1
<0.2 NA <0.2 NA <0.2 NA <0.2 <0.2 <0.2 <0.2 <0.2
<4 NA <4 NA 6 NA <4 <4 <4 <4 <4
<7 NA <7 NA 165 NA <7 <7 <7 43 <7
<7 NA <7 NA 582 NA <7 <7 <7 276 58
NA NA NA NA NA NA NA NA NA NA NA
NA NA NA NA NA NA NA NA NA NA NA
NA NA NA NA NA NA NA NA NA NA NA
NA NA NA NA NA NA NA NA NA NA NA
NA NA NA NA NA NA NA NA NA NA NA
NA NA NA NA NA NA NA NA NA NA NA
NA NA NA NA NA NA NA NA NA NA NA
NA NA NA NA NA NA NA NA NA NA NA
NA NA NA NA NA NA NA NA NA NA NA
NA NA NA NA NA NA NA NA NA NA NA
NA NA NA NA NA NA NA NA NA NA NA
NA NA NA NA NA NA NA NA NA NA NA
NA NA NA NA NA NA NA NA NA NA NA
NA NA NA NA NA NA NA NA NA NA NA
<5 NA <5 NA <5 NA <5 <5 <5 <5 <5
<10 NA <10 NA <10 NA <10 <10 <10 <10 <10
<10 NA <10 NA 20 NA <10 <10 <10 <10 <10
<10 NA <10 NA 344 NA <10 <10 <10 40 75
<10 NA 57 NA 1133 NA 33 100 78 393 370
<30 NA 57 NA 1497 NA 33 100 78 433 445
<19 NA <19 NA 66 NA <19 <19 <19 20 <19
<19 NA <19 NA 753 NA <19 <19 <19 319 58
<38 NA <38 NA 819 NA <38 <38 <38 339 58
<5 NA <5 NA <5 NA <5 <5 <5 <5 <5
<5 NA <5 NA <5 NA <5 <5 <5 <5 <5
<5 NA <5 NA <5 NA <5 <5 <5 <5 <5
<5 NA <5 NA <5 NA <5 <5 <5 <5 <5
<5 NA <5 NA <5 NA <5 <5 <5 <5 <5
<0.15 NA <0.15 NA <0.15 NA <0.15 <0.15 <0.15 <0.15 <0.15
33.3 NA 17.2 NA 17.8 NA 9.7 27.6 12.9 5 10.2
8.59 NA 8.41 NA 8.76 NA 10.49 8.74 8.5 8.19 8.72
Clay Clay Clay Sand Clayey Loam Clay Clayey Silt Clayey Loam Loam Loam Sand
Medium
BrownDark Brown Light Brown Medium Brown
Medium
BrownMedium Grey Medium Grey Dark Brown Medium Brown Medium Brown Medium Brown
stones,oily stones,rootsstones,roots,
oily
stones,
moisturestones, roots stones,roots mostly stones stones,roots stones, roots stones, roots stones, roots
NA NA NA NA
NA NA NA NA
NA NA NA NA
NA NA NA NA
NA NA NA NA
NA NA NA NA
NA NA NA NA
NA 6.8 NA 0.8 NA 3.9 NA NA NA NA NA
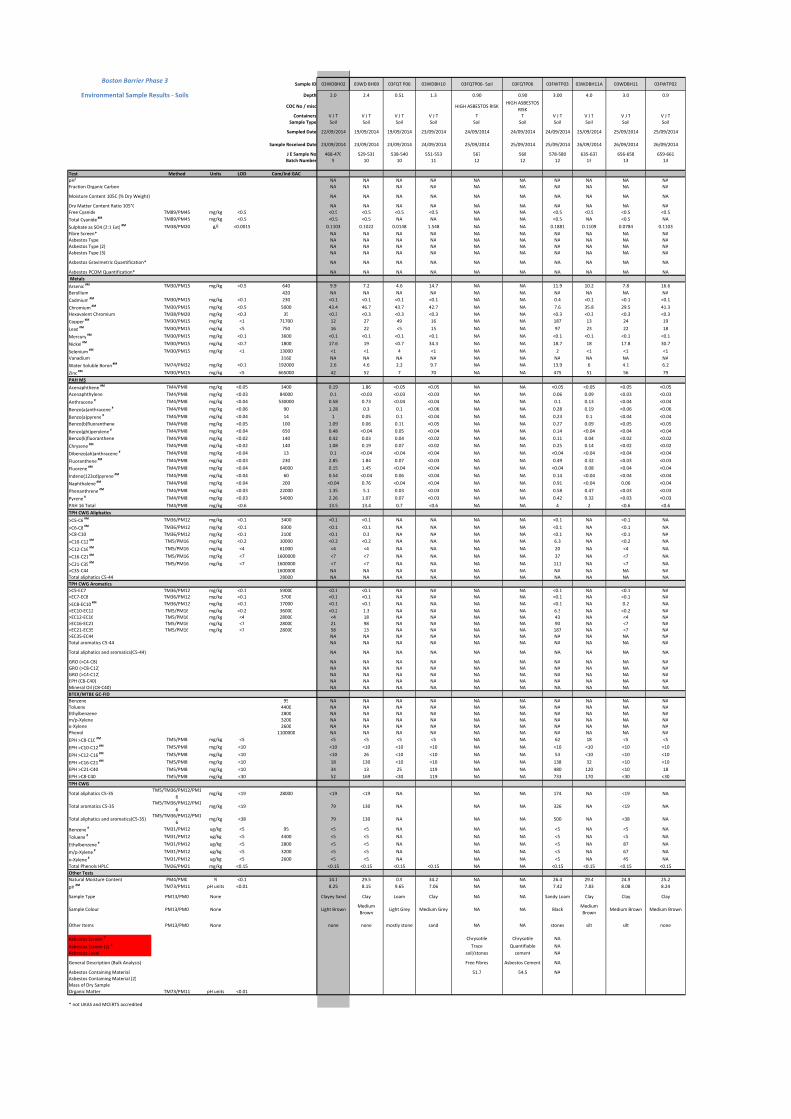
Sample ID
Depth
COC No / misc
Containers
Sample Type
Sampled Date
Sample Received Date
J E Sample No
Batch Number
Test Method Units LOD Com/Ind GAC
pH¹
Fraction Organic Carbon
Moisture Content 105C (% Dry Weight)
Dry Matter Content Ratio 105°C
Free Cyanide TM89/PM45 mg/kg <0.5
Total Cyanide #M TM89/PM45 mg/kg <0.5
Sulphate as SO4 (2:1 Ext) #M TM38/PM20 g/l <0.0015
Fibre Screen*
Asbestos Type
Asbestos Type (2)
Asbestos Type (3)
Asbestos Gravimetric Quantification*
Asbestos PCOM Quantification*
Metals
Arsenic #M TM30/PM15 mg/kg <0.5 640
Beryllium 420
Cadmium #M TM30/PM15 mg/kg <0.1 230
Chromium #M TM30/PM15 mg/kg <0.5 5000
Hexavalent Chromium TM38/PM20 mg/kg <0.3 35
Copper #M TM30/PM15 mg/kg <1 71700
Lead #M TM30/PM15 mg/kg <5 750
Mercury #M TM30/PM15 mg/kg <0.1 3600
Nickel #M TM30/PM15 mg/kg <0.7 1800
Selenium #M TM30/PM15 mg/kg <1 13000
Vanadium 3160
Water Soluble Boron #M TM74/PM32 mg/kg <0.1 192000
Zinc #M TM30/PM15 mg/kg <5 665000
PAH MS
Acenaphthene #M TM4/PM8 mg/kg <0.05 3400
Acenaphthylene TM4/PM8 mg/kg <0.03 84000
Anthracene # TM4/PM8 mg/kg <0.04 530000
Benzo(a)anthracene # TM4/PM8 mg/kg <0.06 90
Benzo(a)pyrene # TM4/PM8 mg/kg <0.04 14
Benzo(b)fluoranthene TM4/PM8 mg/kg <0.05 100
Benzo(ghi)perylene # TM4/PM8 mg/kg <0.04 650
Benzo(k)fluoranthene TM4/PM8 mg/kg <0.02 140
Chrysene #M TM4/PM8 mg/kg <0.02 140
Dibenzo(ah)anthracene # TM4/PM8 mg/kg <0.04 13
Fluoranthene #M TM4/PM8 mg/kg <0.03 230
Fluorene #M TM4/PM8 mg/kg <0.04 64000
Indeno(123cd)pyrene #M TM4/PM8 mg/kg <0.04 60
Naphthalene #M TM4/PM8 mg/kg <0.04 200
Phenanthrene #M TM4/PM8 mg/kg <0.03 22000
Pyrene # TM4/PM8 mg/kg <0.03 54000
PAH 16 Total TM4/PM8 mg/kg <0.6
TPH CWG Aliphatics
>C5-C6 #M TM36/PM12 mg/kg <0.1 3400
>C6-C8 #M TM36/PM12 mg/kg <0.1 8300
>C8-C10 TM36/PM12 mg/kg <0.1 2100
>C10-C12 #M TM5/PM16 mg/kg <0.2 10000
>C12-C16 #M TM5/PM16 mg/kg <4 61000
>C16-C21 #M TM5/PM16 mg/kg <7 1600000
>C21-C35 #M TM5/PM16 mg/kg <7 1600000
>C35-C44 1600000
Total aliphatics C5-44 28000
TPH CWG Aromatics
>C5-EC7 TM36/PM12 mg/kg <0.1 59000
>EC7-EC8 TM36/PM12 mg/kg <0.1 3700
>EC8-EC10 #M TM36/PM12 mg/kg <0.1 17000
>EC10-EC12 TM5/PM16 mg/kg <0.2 36000
>EC12-EC16 TM5/PM16 mg/kg <4 28000
>EC16-EC21 TM5/PM16 mg/kg <7 28000
>EC21-EC35 TM5/PM16 mg/kg <7 28000
>EC35-EC44
Total aromatics C5-44
Total aliphatics and aromatics(C5-44)
GRO (>C4-C8)
GRO (>C8-C12)
GRO (>C4-C12)
EPH (C8-C40)
Mineral Oil (C8-C40)
BTEX/MTBE GC-FID
Benzene 95
Toluene 4400
Ethylbenzene 2800
m/p-Xylene 3200
o-Xylene 2600
Phenol 1100000
EPH >C8-C10 #M TM5/PM8 mg/kg <5
EPH >C10-C12 #M TM5/PM8 mg/kg <10
EPH >C12-C16 #M TM5/PM8 mg/kg <10
EPH >C16-C21 #M TM5/PM8 mg/kg <10
EPH >C21-C40 TM5/PM8 mg/kg <10
EPH >C8-C40 TM5/PM8 mg/kg <30
TPH CWG
Total aliphatics C5-35TM5/TM36/PM12/PM1
6mg/kg <19 28000
Total aromatics C5-35TM5/TM36/PM12/PM1
6mg/kg <19
Total aliphatics and aromatics(C5-35)TM5/TM36/PM12/PM1
6mg/kg <38
Benzene # TM31/PM12 ug/kg <5 95
Toluene # TM31/PM12 ug/kg <5 4400
Ethylbenzene # TM31/PM12 ug/kg <5 2800
m/p-Xylene # TM31/PM12 ug/kg <5 3200
o-Xylene # TM31/PM12 ug/kg <5 2600
Total Phenols HPLC TM26/PM21 mg/kg <0.15
Other Tests
Natural Moisture Content PM4/PM0 % <0.1
pH #M TM73/PM11 pH units <0.01
Sample Type PM13/PM0 None
Sample Colour PM13/PM0 None
Other Items PM13/PM0 None
Asbestos Screen #
Asbestos Screen (2) #
Asbestos Level
General Description (Bulk Analysis)
Asbestos Containing Material
Asbestos Containing Material (2)
Mass of Dry Sample
Organic Matter TM73/PM11 pH units <0.01
* not UKAS and MCERTS accredited
Boston Barrier Phase 3
Environmental Sample Results - Soils
03WDBH02 03WD BH09 03FQT P06 03WDBH10 03FQTP06- Soil 03FQTP06 03FWTP03 03WDBH11A 03WDBH11 03FWTP02
2.0 2.4 0.51 1.3 0.90 0.90 3.00 4.0 3.0 0.9
HIGH ASBESTOS RISKHIGH ASBESTOS
RISK
V J T V J T V J T V J T T T V J T V J T V J T V J T
Soil Soil Soil Soil Soil Soil Soil Soil Soil Soil
22/09/2014 19/09/2014 19/09/2014 23/09/2014 24/09/2014 24/09/2014 24/09/2014 25/09/2014 25/09/2014 25/09/2014
23/09/2014 23/09/2014 23/09/2014 24/09/2014 25/09/2014 25/09/2014 25/09/2014 26/09/2014 26/09/2014 26/09/2014
468-470 529-531 538-540 551-553 567 568 578-580 635-637 656-658 659-661
9 10 10 11 12 12 12 13 13 13
NA NA NA NA NA NA NA NA NA NA
NA NA NA NA NA NA NA NA NA NA
NA NA NA NA NA NA NA NA NA NA
NA NA NA NA NA NA NA NA NA NA
<0.5 <0.5 <0.5 <0.5 NA NA <0.5 <0.5 <0.5 <0.5
<0.5 <0.5 NA NA NA NA <0.5 NA <0.5 NA
0.1103 0.1022 0.0148 1.548 NA NA 0.1881 0.1109 0.0784 0.1103
NA NA NA NA NA NA NA NA NA NA
NA NA NA NA NA NA NA NA NA NA
NA NA NA NA NA NA NA NA NA NA
NA NA NA NA NA NA NA NA NA NA
NA NA NA NA NA NA NA NA NA NA
NA NA NA NA NA NA NA NA NA NA
9.9 7.2 4.6 14.7 NA NA 11.9 10.2 7.8 16.6
NA NA NA NA NA NA NA NA NA NA
<0.1 <0.1 <0.1 <0.1 NA NA 0.4 <0.1 <0.1 <0.1
43.4 46.7 43.7 42.7 NA NA 7.6 35.8 29.5 41.3
<0.3 <0.3 <0.3 <0.3 NA NA <0.3 <0.3 <0.3 <0.3
12 27 49 16 NA NA 187 13 24 19
16 22 <5 15 NA NA 97 23 22 18
<0.1 <0.1 <0.1 <0.1 NA NA <0.1 <0.1 <0.1 <0.1
17.6 19 <0.7 34.3 NA NA 18.7 18 17.8 30.7
<1 <1 4 <1 NA NA 2 <1 <1 <1
NA NA NA NA NA NA NA NA NA NA
2.6 4.6 2.2 9.7 NA NA 13.9 6 4.1 6.2
42 52 7 70 NA NA 475 51 56 79
0.19 1.86 <0.05 <0.05 NA NA <0.05 <0.05 <0.05 <0.05
0.1 <0.03 <0.03 <0.03 NA NA 0.06 0.09 <0.03 <0.03
0.58 0.73 <0.04 <0.04 NA NA 0.1 0.13 <0.04 <0.04
1.28 0.3 0.1 <0.06 NA NA 0.28 0.19 <0.06 <0.06
1 0.05 0.1 <0.04 NA NA 0.23 0.1 <0.04 <0.04
1.09 0.06 0.11 <0.05 NA NA 0.27 0.09 <0.05 <0.05
0.48 <0.04 0.05 <0.04 NA NA 0.14 <0.04 <0.04 <0.04
0.42 0.03 0.04 <0.02 NA NA 0.11 0.04 <0.02 <0.02
1.08 0.19 0.07 <0.02 NA NA 0.25 0.14 <0.02 <0.02
0.1 <0.04 <0.04 <0.04 NA NA <0.04 <0.04 <0.04 <0.04
2.85 1.84 0.07 <0.03 NA NA 0.49 0.32 <0.03 <0.03
0.15 1.45 <0.04 <0.04 NA NA <0.04 0.08 <0.04 <0.04
0.54 <0.04 0.06 <0.04 NA NA 0.14 <0.04 <0.04 <0.04
<0.04 0.76 <0.04 <0.04 NA NA 0.91 <0.04 0.06 <0.04
1.35 5.1 0.03 <0.03 NA NA 0.58 0.47 <0.03 <0.03
2.26 1.07 0.07 <0.03 NA NA 0.42 0.32 <0.03 <0.03
13.5 13.4 0.7 <0.6 NA NA 4 2 <0.6 <0.6
<0.1 <0.1 NA NA NA NA <0.1 NA <0.1 NA
<0.1 <0.1 NA NA NA NA <0.1 NA <0.1 NA
<0.1 0.3 NA NA NA NA <0.1 NA <0.1 NA
<0.2 <0.2 NA NA NA NA 6.3 NA <0.2 NA
<4 <4 NA NA NA NA 20 NA <4 NA
<7 <7 NA NA NA NA 37 NA <7 NA
<7 <7 NA NA NA NA 111 NA <7 NA
NA NA NA NA NA NA NA NA NA NA
NA NA NA NA NA NA NA NA NA NA
<0.1 <0.1 NA NA NA NA <0.1 NA <0.1 NA
<0.1 <0.1 NA NA NA NA <0.1 NA <0.1 NA
<0.1 <0.1 NA NA NA NA <0.1 NA 0.2 NA
<0.2 1.3 NA NA NA NA 6.3 NA <0.2 NA
<4 18 NA NA NA NA 43 NA <4 NA
21 98 NA NA NA NA 90 NA <7 NA
58 13 NA NA NA NA 187 NA <7 NA
NA NA NA NA NA NA NA NA NA NA
NA NA NA NA NA NA NA NA NA NA
NA NA NA NA NA NA NA NA NA NA
NA NA NA NA NA NA NA NA NA NA
NA NA NA NA NA NA NA NA NA NA
NA NA NA NA NA NA NA NA NA NA
NA NA NA NA NA NA NA NA NA NA
NA NA NA NA NA NA NA NA NA NA
NA NA NA NA NA NA NA NA NA NA
NA NA NA NA NA NA NA NA NA NA
NA NA NA NA NA NA NA NA NA NA
NA NA NA NA NA NA NA NA NA NA
NA NA NA NA NA NA NA NA NA NA
NA NA NA NA NA NA NA NA NA NA
<5 <5 <5 <5 NA NA 62 18 <5 <5
<10 <10 <10 <10 NA NA <10 <10 <10 <10
<10 26 <10 <10 NA NA 53 <10 <10 <10
18 130 <10 <10 NA NA 138 32 <10 <10
34 13 25 119 NA NA 480 120 <10 18
52 169 <30 119 NA NA 733 170 <30 <30
<19 <19 NA NA NA 174 NA <19 NA
79 130 NA NA NA 326 NA <19 NA
79 130 NA NA NA 500 NA <38 NA
<5 <5 NA NA NA <5 NA <5 NA
<5 <5 NA NA NA <5 NA <5 NA
<5 <5 NA NA NA <5 NA 87 NA
<5 <5 NA NA NA <5 NA 67 NA
<5 <5 NA NA NA <5 NA 45 NA
<0.15 <0.15 <0.15 <0.15 NA NA <0.15 <0.15 <0.15 <0.15
14.1 29.5 0.9 34.2 NA NA 26.4 29.4 24.9 25.2
8.25 8.15 9.65 7.06 NA NA 7.42 7.83 8.08 8.24
Clayey Sand Clay Loam Clay NA NA Sandy Loam Clay Clay Clay
Light BrownMedium
BrownLight Grey Medium Grey NA NA Black
Medium
BrownMedium Brown Medium Brown
none none mostly stone sand NA NA stones silt silt none
Chrysotile Chrysotile NA
Trace Quantifiable NA
soil/stones cement NA
Free Fibres Asbestos Cement NA
51.7 54.5 NA
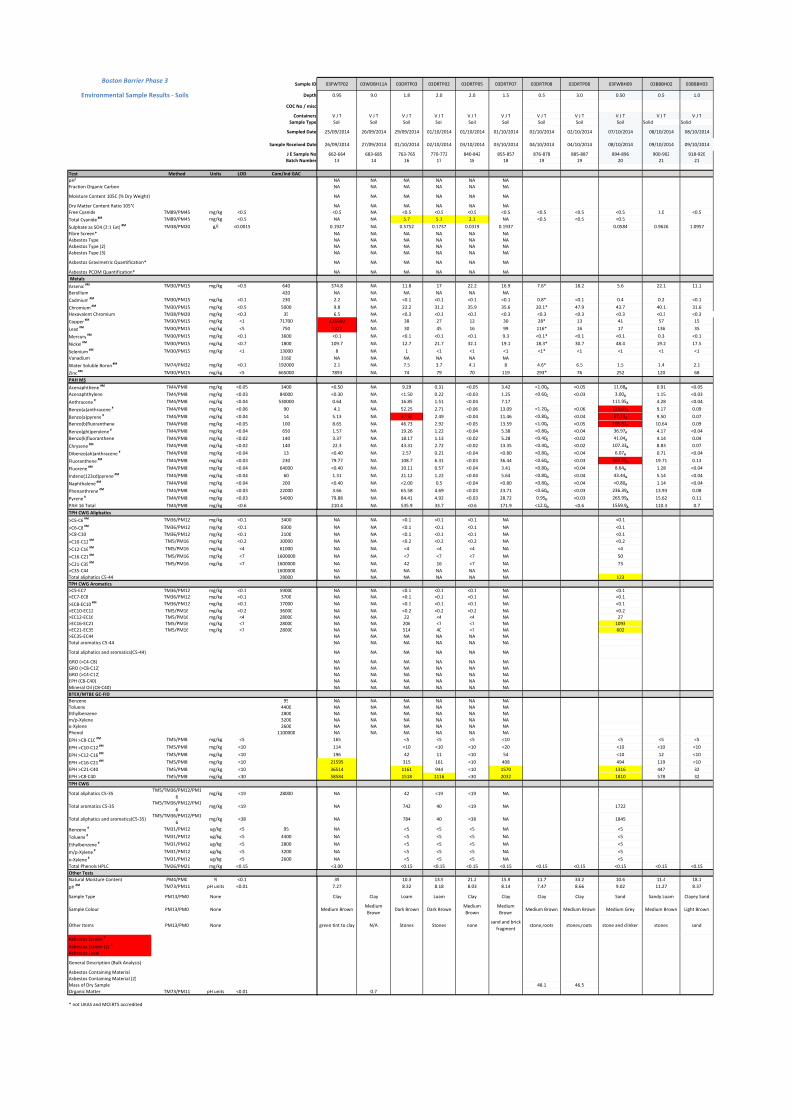
Sample ID
Depth
COC No / misc
Containers
Sample Type
Sampled Date
Sample Received Date
J E Sample No
Batch Number
Test Method Units LOD Com/Ind GAC
pH¹
Fraction Organic Carbon
Moisture Content 105C (% Dry Weight)
Dry Matter Content Ratio 105°C
Free Cyanide TM89/PM45 mg/kg <0.5
Total Cyanide #M TM89/PM45 mg/kg <0.5
Sulphate as SO4 (2:1 Ext) #M TM38/PM20 g/l <0.0015
Fibre Screen*
Asbestos Type
Asbestos Type (2)
Asbestos Type (3)
Asbestos Gravimetric Quantification*
Asbestos PCOM Quantification*
Metals
Arsenic #M TM30/PM15 mg/kg <0.5 640
Beryllium 420
Cadmium #M TM30/PM15 mg/kg <0.1 230
Chromium #M TM30/PM15 mg/kg <0.5 5000
Hexavalent Chromium TM38/PM20 mg/kg <0.3 35
Copper #M TM30/PM15 mg/kg <1 71700
Lead #M TM30/PM15 mg/kg <5 750
Mercury #M TM30/PM15 mg/kg <0.1 3600
Nickel #M TM30/PM15 mg/kg <0.7 1800
Selenium #M TM30/PM15 mg/kg <1 13000
Vanadium 3160
Water Soluble Boron #M TM74/PM32 mg/kg <0.1 192000
Zinc #M TM30/PM15 mg/kg <5 665000
PAH MS
Acenaphthene #M TM4/PM8 mg/kg <0.05 3400
Acenaphthylene TM4/PM8 mg/kg <0.03 84000
Anthracene # TM4/PM8 mg/kg <0.04 530000
Benzo(a)anthracene # TM4/PM8 mg/kg <0.06 90
Benzo(a)pyrene # TM4/PM8 mg/kg <0.04 14
Benzo(b)fluoranthene TM4/PM8 mg/kg <0.05 100
Benzo(ghi)perylene # TM4/PM8 mg/kg <0.04 650
Benzo(k)fluoranthene TM4/PM8 mg/kg <0.02 140
Chrysene #M TM4/PM8 mg/kg <0.02 140
Dibenzo(ah)anthracene # TM4/PM8 mg/kg <0.04 13
Fluoranthene #M TM4/PM8 mg/kg <0.03 230
Fluorene #M TM4/PM8 mg/kg <0.04 64000
Indeno(123cd)pyrene #M TM4/PM8 mg/kg <0.04 60
Naphthalene #M TM4/PM8 mg/kg <0.04 200
Phenanthrene #M TM4/PM8 mg/kg <0.03 22000
Pyrene # TM4/PM8 mg/kg <0.03 54000
PAH 16 Total TM4/PM8 mg/kg <0.6
TPH CWG Aliphatics
>C5-C6 #M TM36/PM12 mg/kg <0.1 3400
>C6-C8 #M TM36/PM12 mg/kg <0.1 8300
>C8-C10 TM36/PM12 mg/kg <0.1 2100
>C10-C12 #M TM5/PM16 mg/kg <0.2 10000
>C12-C16 #M TM5/PM16 mg/kg <4 61000
>C16-C21 #M TM5/PM16 mg/kg <7 1600000
>C21-C35 #M TM5/PM16 mg/kg <7 1600000
>C35-C44 1600000
Total aliphatics C5-44 28000
TPH CWG Aromatics
>C5-EC7 TM36/PM12 mg/kg <0.1 59000
>EC7-EC8 TM36/PM12 mg/kg <0.1 3700
>EC8-EC10 #M TM36/PM12 mg/kg <0.1 17000
>EC10-EC12 TM5/PM16 mg/kg <0.2 36000
>EC12-EC16 TM5/PM16 mg/kg <4 28000
>EC16-EC21 TM5/PM16 mg/kg <7 28000
>EC21-EC35 TM5/PM16 mg/kg <7 28000
>EC35-EC44
Total aromatics C5-44
Total aliphatics and aromatics(C5-44)
GRO (>C4-C8)
GRO (>C8-C12)
GRO (>C4-C12)
EPH (C8-C40)
Mineral Oil (C8-C40)
BTEX/MTBE GC-FID
Benzene 95
Toluene 4400
Ethylbenzene 2800
m/p-Xylene 3200
o-Xylene 2600
Phenol 1100000
EPH >C8-C10 #M TM5/PM8 mg/kg <5
EPH >C10-C12 #M TM5/PM8 mg/kg <10
EPH >C12-C16 #M TM5/PM8 mg/kg <10
EPH >C16-C21 #M TM5/PM8 mg/kg <10
EPH >C21-C40 TM5/PM8 mg/kg <10
EPH >C8-C40 TM5/PM8 mg/kg <30
TPH CWG
Total aliphatics C5-35TM5/TM36/PM12/PM1
6mg/kg <19 28000
Total aromatics C5-35TM5/TM36/PM12/PM1
6mg/kg <19
Total aliphatics and aromatics(C5-35)TM5/TM36/PM12/PM1
6mg/kg <38
Benzene # TM31/PM12 ug/kg <5 95
Toluene # TM31/PM12 ug/kg <5 4400
Ethylbenzene # TM31/PM12 ug/kg <5 2800
m/p-Xylene # TM31/PM12 ug/kg <5 3200
o-Xylene # TM31/PM12 ug/kg <5 2600
Total Phenols HPLC TM26/PM21 mg/kg <0.15
Other Tests
Natural Moisture Content PM4/PM0 % <0.1
pH #M TM73/PM11 pH units <0.01
Sample Type PM13/PM0 None
Sample Colour PM13/PM0 None
Other Items PM13/PM0 None
Asbestos Screen #
Asbestos Screen (2) #
Asbestos Level
General Description (Bulk Analysis)
Asbestos Containing Material
Asbestos Containing Material (2)
Mass of Dry Sample
Organic Matter TM73/PM11 pH units <0.01
* not UKAS and MCERTS accredited
Boston Barrier Phase 3
Environmental Sample Results - Soils
03FWTP02 03WDBH11A 03DRTP03 03DRTP02 03DRTP05 03DRTP07 03DRTP08 03DRTP08 03FWBH09 03BBBH02 03BBBH03
0.95 9.0 1.8 2.0 2.0 1.5 0.5 3.0 0.50 0.5 1.0
V J T V J T V J T V J T V J T V J T V J T V J T V J T V J T V J T
Soil Soil Soil Soil Soil Soil Soil Soil Soil Solid Solid
25/09/2014 26/09/2014 29/09/2014 01/10/2014 01/10/2014 01/10/2014 02/10/2014 02/10/2014 07/10/2014 08/10/2014 08/10/2014
26/09/2014 27/09/2014 01/10/2014 02/10/2014 03/10/2014 03/10/2014 04/10/2014 04/10/2014 08/10/2014 09/10/2014 09/10/2014
662-664 683-685 763-765 770-772 840-842 855-857 876-878 885-887 894-896 900-902 918-920
13 14 16 17 18 18 19 19 20 21 21
NA NA NA NA NA NA
NA NA NA NA NA NA
NA NA NA NA NA NA
NA NA NA NA NA NA
<0.5 NA <0.5 <0.5 <0.5 <0.5 <0.5 <0.5 <0.5 1.0 <0.5
NA NA 5.7 5.1 2.1 NA <0.5 <0.5 <0.5
0.1927 NA 0.5752 0.1737 0.0319 0.1937 0.0584 0.9626 1.0957
NA NA NA NA NA NA
NA NA NA NA NA NA
NA NA NA NA NA NA
NA NA NA NA NA NA
NA NA NA NA NA NA
NA NA NA NA NA NA
374.8 NA 11.8 17 22.2 16.9 7.6* 18.2 5.6 22.1 11.1
NA NA NA NA NA NA
2.2 NA <0.1 <0.1 <0.1 <0.1 0.8* <0.1 0.4 0.2 <0.1
9.8 NA 22.2 31.2 35.9 35.6 20.1* 47.9 43.7 40.1 31.6
6.5 NA <0.3 <0.3 <0.3 <0.3 <0.3 <0.3 <0.3 <0.3 <0.3
116900 NA 38 27 12 30 28* 13 41 57 15
3377 NA 30 45 16 99 116* 16 17 136 35
<0.1 NA <0.1 <0.1 <0.1 9.3 <0.1* <0.1 <0.1 0.3 <0.1
109.7 NA 12.7 21.7 32.1 19.1 18.3* 30.7 48.4 19.2 17.5
8 NA 1 <1 <1 <1 <1* <1 <1 <1 <1
NA NA NA NA NA NA
2.1 NA 7.5 3.7 4.1 8 4.6* 6.5 1.5 1.4 2.1
7893 NA 74 79 70 119 293* 76 252 120 68
<0.50 NA 9.29 0.31 <0.05 3.42 <1.00D <0.05 11.68A 0.91 <0.05
<0.30 NA <1.50 0.22 <0.03 1.25 <0.60D <0.03 3.00A 1.15 <0.03
0.64 NA 16.85 1.51 <0.04 7.17 111.95A 4.28 <0.04
4.1 NA 52.25 2.71 <0.06 13.09 <1.20D <0.06 125.03A 9.17 0.09
5.13 NA 37.52 2.49 <0.04 11.46 <0.80D <0.04 87.78A 9.50 0.07
8.65 NA 46.73 2.92 <0.05 13.59 <1.00D <0.05 105.53A 10.64 0.09
1.57 NA 19.26 1.22 <0.04 5.38 <0.80D <0.04 36.97A 4.17 <0.04
3.37 NA 18.17 1.13 <0.02 5.28 <0.40D <0.02 41.04A 4.14 0.04
22.3 NA 43.31 2.72 <0.02 13.35 <0.40D <0.02 107.33A 8.83 0.07
<0.40 NA 2.57 0.21 <0.04 <0.80 <0.80D <0.04 6.07A 0.71 <0.04
79.77 NA 108.7 6.31 <0.03 36.44 <0.60D <0.03 369.05A 19.71 0.13
<0.40 NA 10.11 0.57 <0.04 3.41 <0.80D <0.04 8.64A 1.28 <0.04
1.31 NA 21.12 1.22 <0.04 5.64 <0.80D <0.04 43.44A 5.14 <0.04
<0.40 NA <2.00 0.5 <0.04 <0.80 <0.80D <0.04 <0.80A 1.14 <0.04
3.66 NA 65.58 4.69 <0.03 23.71 <0.60D <0.03 236.39A 13.93 0.08
79.88 NA 84.41 4.92 <0.03 28.72 0.95D <0.03 265.99A 15.62 0.11
210.4 NA 535.9 33.7 <0.6 171.9 <12.0D <0.6 1559.9A 110.3 0.7
NA NA <0.1 <0.1 <0.1 NA <0.1
NA NA <0.1 <0.1 <0.1 NA <0.1
NA NA <0.1 <0.1 <0.1 NA <0.1
NA NA <0.2 <0.2 <0.2 NA <0.2
NA NA <4 <4 <4 NA <4
NA NA <7 <7 <7 NA 50
NA NA 42 16 <7 NA 73
NA NA NA NA NA NA
NA NA NA NA NA NA 123
NA NA <0.1 <0.1 <0.1 NA <0.1
NA NA <0.1 <0.1 <0.1 NA <0.1
NA NA <0.1 <0.1 <0.1 NA <0.1
NA NA <0.2 <0.2 <0.2 NA <0.2
NA NA 22 <4 <4 NA 27
NA NA 206 <7 <7 NA 1093
NA NA 514 40 <7 NA 602
NA NA NA NA NA NA
NA NA NA NA NA NA
NA NA NA NA NA NA
NA NA NA NA NA NA
NA NA NA NA NA NA
NA NA NA NA NA NA
NA NA NA NA NA NA
NA NA NA NA NA NA
NA NA NA NA NA NA
NA NA NA NA NA NA
NA NA NA NA NA NA
NA NA NA NA NA NA
NA NA NA NA NA NA
NA NA NA NA NA NA
165 <5 <5 <5 <10 <5 <5 <5
114 <10 <10 <10 <20 <10 <10 <10
196 42 11 <10 54 <10 12 <10
21595 315 161 <10 408 494 119 <10
36514 1161 944 <10 1570 1316 447 32
58584 1518 1116 <30 2032 1810 578 32
NA 42 <19 <19 NA
NA 742 40 <19 NA 1722
NA 784 40 <38 NA 1845
NA <5 <5 <5 NA <5
NA <5 <5 <5 NA <5
NA <5 <5 <5 NA <5
NA <5 <5 <5 NA <5
NA <5 <5 <5 NA <5
<3.00 <0.15 <0.15 <0.15 <0.15 <0.15 <0.15 <0.15 <0.15 <0.15
39 10.3 13.9 21.2 15.9 11.7 33.2 10.6 11.4 18.1
7.27 8.32 8.18 8.03 8.14 7.47 8.66 9.02 11.27 8.37
Clay Clay Loam Loam Clay Clay Clay Clay Sand Sandy Loam Clayey Sand
Medium BrownMedium
BrownDark Brown Dark Brown
Medium
Brown
Medium
BrownMedium Brown Medium Brown Medium Grey Medium Brown Light Brown
green tint to clay N/A Stones Stones nonesand and brick
fragmentstone,roots stones,roots stone and clinker stones sand
48.1 46.5
0.7
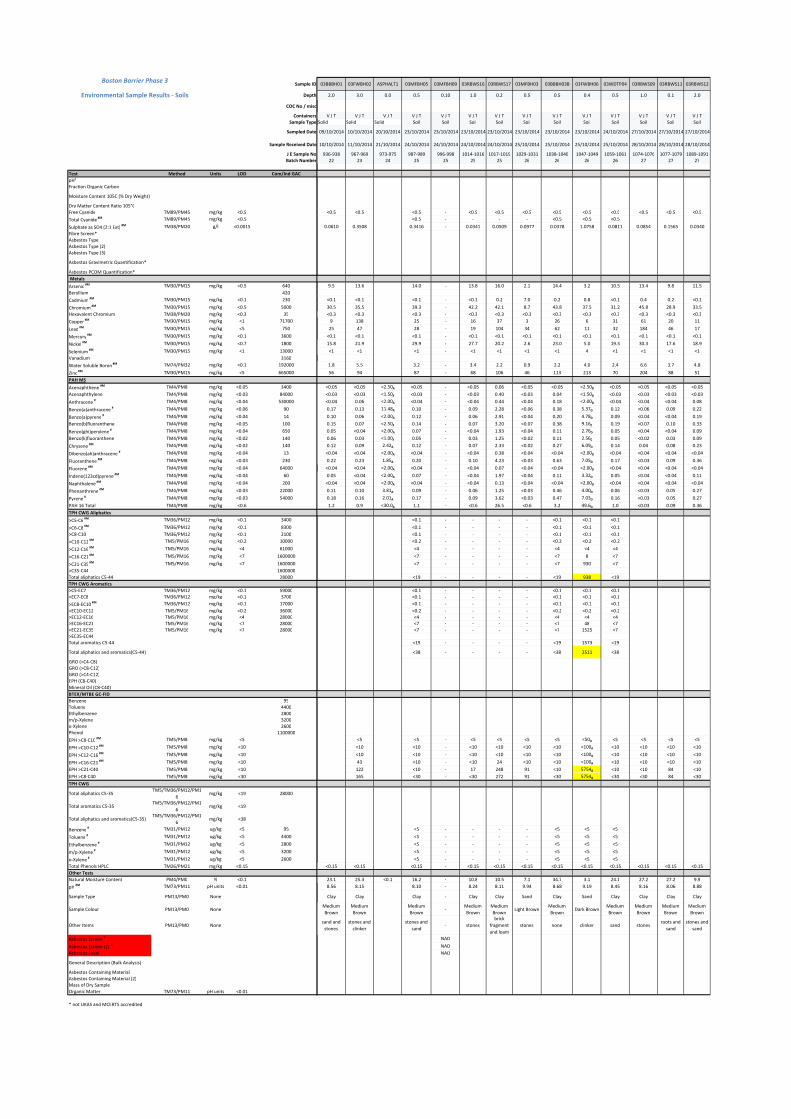
Sample ID
Depth
COC No / misc
Containers
Sample Type
Sampled Date
Sample Received Date
J E Sample No
Batch Number
Test Method Units LOD Com/Ind GAC
pH¹
Fraction Organic Carbon
Moisture Content 105C (% Dry Weight)
Dry Matter Content Ratio 105°C
Free Cyanide TM89/PM45 mg/kg <0.5
Total Cyanide #M TM89/PM45 mg/kg <0.5
Sulphate as SO4 (2:1 Ext) #M TM38/PM20 g/l <0.0015
Fibre Screen*
Asbestos Type
Asbestos Type (2)
Asbestos Type (3)
Asbestos Gravimetric Quantification*
Asbestos PCOM Quantification*
Metals
Arsenic #M TM30/PM15 mg/kg <0.5 640
Beryllium 420
Cadmium #M TM30/PM15 mg/kg <0.1 230
Chromium #M TM30/PM15 mg/kg <0.5 5000
Hexavalent Chromium TM38/PM20 mg/kg <0.3 35
Copper #M TM30/PM15 mg/kg <1 71700
Lead #M TM30/PM15 mg/kg <5 750
Mercury #M TM30/PM15 mg/kg <0.1 3600
Nickel #M TM30/PM15 mg/kg <0.7 1800
Selenium #M TM30/PM15 mg/kg <1 13000
Vanadium 3160
Water Soluble Boron #M TM74/PM32 mg/kg <0.1 192000
Zinc #M TM30/PM15 mg/kg <5 665000
PAH MS
Acenaphthene #M TM4/PM8 mg/kg <0.05 3400
Acenaphthylene TM4/PM8 mg/kg <0.03 84000
Anthracene # TM4/PM8 mg/kg <0.04 530000
Benzo(a)anthracene # TM4/PM8 mg/kg <0.06 90
Benzo(a)pyrene # TM4/PM8 mg/kg <0.04 14
Benzo(b)fluoranthene TM4/PM8 mg/kg <0.05 100
Benzo(ghi)perylene # TM4/PM8 mg/kg <0.04 650
Benzo(k)fluoranthene TM4/PM8 mg/kg <0.02 140
Chrysene #M TM4/PM8 mg/kg <0.02 140
Dibenzo(ah)anthracene # TM4/PM8 mg/kg <0.04 13
Fluoranthene #M TM4/PM8 mg/kg <0.03 230
Fluorene #M TM4/PM8 mg/kg <0.04 64000
Indeno(123cd)pyrene #M TM4/PM8 mg/kg <0.04 60
Naphthalene #M TM4/PM8 mg/kg <0.04 200
Phenanthrene #M TM4/PM8 mg/kg <0.03 22000
Pyrene # TM4/PM8 mg/kg <0.03 54000
PAH 16 Total TM4/PM8 mg/kg <0.6
TPH CWG Aliphatics
>C5-C6 #M TM36/PM12 mg/kg <0.1 3400
>C6-C8 #M TM36/PM12 mg/kg <0.1 8300
>C8-C10 TM36/PM12 mg/kg <0.1 2100
>C10-C12 #M TM5/PM16 mg/kg <0.2 10000
>C12-C16 #M TM5/PM16 mg/kg <4 61000
>C16-C21 #M TM5/PM16 mg/kg <7 1600000
>C21-C35 #M TM5/PM16 mg/kg <7 1600000
>C35-C44 1600000
Total aliphatics C5-44 28000
TPH CWG Aromatics
>C5-EC7 TM36/PM12 mg/kg <0.1 59000
>EC7-EC8 TM36/PM12 mg/kg <0.1 3700
>EC8-EC10 #M TM36/PM12 mg/kg <0.1 17000
>EC10-EC12 TM5/PM16 mg/kg <0.2 36000
>EC12-EC16 TM5/PM16 mg/kg <4 28000
>EC16-EC21 TM5/PM16 mg/kg <7 28000
>EC21-EC35 TM5/PM16 mg/kg <7 28000
>EC35-EC44
Total aromatics C5-44
Total aliphatics and aromatics(C5-44)
GRO (>C4-C8)
GRO (>C8-C12)
GRO (>C4-C12)
EPH (C8-C40)
Mineral Oil (C8-C40)
BTEX/MTBE GC-FID
Benzene 95
Toluene 4400
Ethylbenzene 2800
m/p-Xylene 3200
o-Xylene 2600
Phenol 1100000
EPH >C8-C10 #M TM5/PM8 mg/kg <5
EPH >C10-C12 #M TM5/PM8 mg/kg <10
EPH >C12-C16 #M TM5/PM8 mg/kg <10
EPH >C16-C21 #M TM5/PM8 mg/kg <10
EPH >C21-C40 TM5/PM8 mg/kg <10
EPH >C8-C40 TM5/PM8 mg/kg <30
TPH CWG
Total aliphatics C5-35TM5/TM36/PM12/PM1
6mg/kg <19 28000
Total aromatics C5-35TM5/TM36/PM12/PM1
6mg/kg <19
Total aliphatics and aromatics(C5-35)TM5/TM36/PM12/PM1
6mg/kg <38
Benzene # TM31/PM12 ug/kg <5 95
Toluene # TM31/PM12 ug/kg <5 4400
Ethylbenzene # TM31/PM12 ug/kg <5 2800
m/p-Xylene # TM31/PM12 ug/kg <5 3200
o-Xylene # TM31/PM12 ug/kg <5 2600
Total Phenols HPLC TM26/PM21 mg/kg <0.15
Other Tests
Natural Moisture Content PM4/PM0 % <0.1
pH #M TM73/PM11 pH units <0.01
Sample Type PM13/PM0 None
Sample Colour PM13/PM0 None
Other Items PM13/PM0 None
Asbestos Screen #
Asbestos Screen (2) #
Asbestos Level
General Description (Bulk Analysis)
Asbestos Containing Material
Asbestos Containing Material (2)
Mass of Dry Sample
Organic Matter TM73/PM11 pH units <0.01
* not UKAS and MCERTS accredited
Boston Barrier Phase 3
Environmental Sample Results - Soils
03BBBH01 03FWBH02 ASPHALT1 03MFBH05 03MFBH09 03RBWS16 03RBWS17 03MFBH03 03BBBH03B 03FWBH06 03WDTP04 03RBWS09 03RBWS11 03RBWS12
2.0 3.0 0.0 0.5 0.10 1.0 0.2 0.5 0.5 0.4 0.5 1.0 0.1 2.0
V J T V J T V J T V J T V J T V J T V J T V J T V J T V J T V J T V J T V J T V J T
Solid Solid Solid Soil Soil Soil Soil Soil Soil Soil Soil Soil Soil Soil
09/10/2014 10/10/2014 20/10/2014 23/10/2014 23/10/2014 23/10/2014 23/10/2014 23/10/2014 23/10/2014 23/10/2014 24/10/2014 27/10/2014 27/10/2014 27/10/2014
10/10/2014 11/10/2014 21/10/2014 24/10/2014 24/10/2014 24/10/2014 24/10/2014 25/10/2014 25/10/2014 25/10/2014 25/10/2014 28/10/2014 28/10/2014 28/10/2014
936-938 967-969 973-975 987-989 996-998 1014-1016 1017-1019 1029-1031 1038-1040 1047-1049 1059-1061 1074-1076 1077-1079 1089-1091
22 23 24 25 25 25 25 26 26 26 26 27 27 27
<0.5 <0.5 <0.5 - <0.5 <0.5 <0.5 <0.5 <0.5 <0.5 <0.5 <0.5 <0.5
<0.5 - - - - <0.5 <0.5 <0.5
0.0610 0.3508 0.3416 - 0.0341 0.0509 0.0977 0.0378 1.0758 0.0811 0.0854 0.1565 0.0340
9.5 13.6 14.0 - 13.8 16.0 2.1 14.4 3.2 10.5 13.4 9.8 11.5
<0.1 <0.1 <0.1 - <0.1 0.2 7.0 0.2 0.8 <0.1 0.4 0.2 <0.1
30.5 35.5 39.3 - 42.2 42.1 8.7 43.8 37.5 31.2 45.8 28.9 33.5
<0.3 <0.3 <0.3 - <0.3 <0.3 <0.3 <0.3 <0.3 <0.3 <0.3 <0.3 <0.3
9 138 25 - 16 37 3 26 6 31 61 20 11
25 47 28 - 19 104 34 62 11 32 184 46 17
<0.1 <0.1 <0.1 - <0.1 <0.1 <0.1 <0.1 <0.1 <0.1 <0.1 <0.1 <0.1
15.8 21.9 29.9 - 27.7 20.2 2.6 23.0 5.0 19.3 30.3 17.6 18.9
<1 <1 <1 - <1 <1 <1 <1 4 <1 <1 <1 <1
1.8 5.5 3.2 - 3.4 2.2 0.9 2.2 4.0 2.4 6.6 3.7 4.8
56 94 87 - 68 106 46 113 213 70 204 88 51
<0.05 <0.05 <2.50A <0.05 - <0.05 0.06 <0.05 <0.05 <2.50D <0.05 <0.05 <0.05 <0.05
<0.03 <0.03 <1.50A <0.03 - <0.03 0.40 <0.03 0.04 <1.50D <0.03 <0.03 <0.03 <0.03
<0.04 0.06 <2.00A <0.04 - <0.04 0.44 <0.04 0.18 <2.00D <0.04 <0.04 <0.04 0.08
0.17 0.13 11.48A 0.10 - 0.09 2.28 <0.06 0.38 5.37D 0.12 <0.06 0.09 0.22
0.10 0.06 <2.00A 0.12 - 0.06 2.91 <0.04 0.20 4.78D 0.09 <0.04 <0.04 0.19
0.15 0.07 <2.50A 0.14 - 0.07 3.20 <0.07 0.38 9.16D 0.19 <0.07 0.10 0.33
0.05 <0.04 <2.00A 0.07 - <0.04 1.93 <0.04 0.11 2.76D 0.05 <0.04 <0.04 0.09
0.06 0.03 <1.00A 0.05 - 0.03 1.25 <0.02 0.11 2.56D 0.05 <0.02 0.03 0.09
0.12 0.09 2.42A 0.12 - 0.07 2.33 <0.02 0.27 6.09D 0.14 0.04 0.08 0.23
<0.04 <0.04 <2.00A <0.04 - <0.04 0.38 <0.04 <0.04 <2.00D <0.04 <0.04 <0.04 <0.04
0.22 0.23 1.85A 0.20 - 0.10 4.23 <0.03 0.63 7.05D 0.17 <0.03 0.09 0.36
<0.04 <0.04 <2.00A <0.04 - <0.04 0.07 <0.04 <0.04 <2.00D <0.04 <0.04 <0.04 <0.04
0.05 <0.04 <2.00A 0.07 - <0.04 1.97 <0.04 0.11 3.32D 0.05 <0.04 <0.04 0.11
<0.04 <0.04 <2.00A <0.04 - <0.04 0.13 <0.04 <0.04 <2.00D <0.04 <0.04 <0.04 <0.04
0.11 0.10 3.81A 0.09 - 0.06 1.25 <0.03 0.46 4.00D 0.06 <0.03 0.05 0.27
0.18 0.16 2.01A 0.17 - 0.09 3.62 <0.03 0.47 7.03D 0.16 <0.03 0.05 0.27
1.2 0.9 <30.0A 1.1 - <0.6 26.5 <0.6 3.2 49.6D 1.0 <0.03 0.09 0.36
<0.1 - - - - <0.1 <0.1 <0.1
<0.1 - - - - <0.1 <0.1 <0.1
<0.1 - - - - <0.1 <0.1 <0.1
<0.2 - - - - <0.2 <0.2 <0.2
<4 - - - - <4 <4 <4
<7 - - - - <7 8 <7
<7 - - - - <7 930 <7
<19 - - - - <19 938 <19
<0.1 - - - - <0.1 <0.1 <0.1
<0.1 - - - - <0.1 <0.1 <0.1
<0.1 - - - - <0.1 <0.1 <0.1
<0.2 - - - - <0.2 <0.2 <0.2
<4 - - - - <4 <4 <4
<7 - - - - <7 48 <7
<7 - - - - <7 1525 <7
<19 - - - - <19 1573 <19
<38 - - - - <38 2511 <38
<5 <5 - <5 <5 <5 <5 <50A <5 <5 <5 <5
<10 <10 - <10 <10 <10 <10 <100A <10 <10 <10 <10
<10 <10 - <10 <10 <10 <10 <100A <10 <10 <10 <10
43 <10 - <10 24 <10 <10 <100A <10 <10 <10 <10
122 <10 - 17 248 91 <10 5754A <10 <10 84 <10
165 <30 - <30 272 91 <30 5754A <30 <30 84 <30
<5 - - - - <5 <5 <5
<5 - - - - <5 <5 <5
<5 - - - - <5 <5 <5
<5 - - - - <5 <5 <5
<5 - - - - <5 <5 <5
<0.15 <0.15 <0.15 - <0.15 <0.15 <0.15 <0.15 <0.15 <0.15 <0.15 <0.15 <0.15
23.1 25.3 <0.1 16.2 - 10.8 10.5 7.1 34.7 3.1 24.1 27.2 27.2 9.9
8.56 8.15 8.10 - 8.24 8.11 9.94 8.68 9.19 8.45 8.16 8.06 8.88
Clay Clay Clay - Clay Clay Sand Clay Sand Clay Clay Clay Clay
Medium
Brown
Medium
Brown
Medium
Brown-
Medium
Brown
Medium
BrownLight Brown
Medium
BrownDark Brown
Medium
Brown
Medium
Brown
Medium
Brown
Medium
Brown
sand and
stones
stones and
clinker
stones and
sand- stones
brick
fragment
and loam
stones none clinker sand stonesroots and
sand
stones and
sand
NAD
NAD
NAD
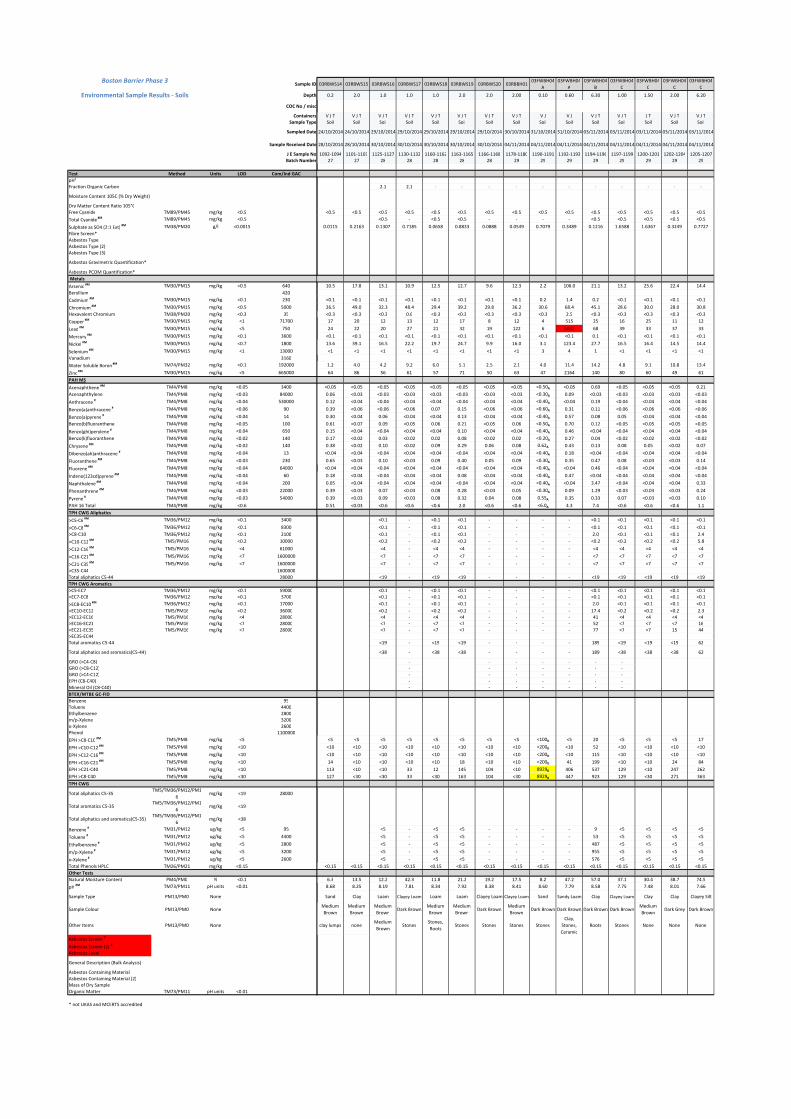
Sample ID
Depth
COC No / misc
Containers
Sample Type
Sampled Date
Sample Received Date
J E Sample No
Batch Number
Test Method Units LOD Com/Ind GAC
pH¹
Fraction Organic Carbon
Moisture Content 105C (% Dry Weight)
Dry Matter Content Ratio 105°C
Free Cyanide TM89/PM45 mg/kg <0.5
Total Cyanide #M TM89/PM45 mg/kg <0.5
Sulphate as SO4 (2:1 Ext) #M TM38/PM20 g/l <0.0015
Fibre Screen*
Asbestos Type
Asbestos Type (2)
Asbestos Type (3)
Asbestos Gravimetric Quantification*
Asbestos PCOM Quantification*
Metals
Arsenic #M TM30/PM15 mg/kg <0.5 640
Beryllium 420
Cadmium #M TM30/PM15 mg/kg <0.1 230
Chromium #M TM30/PM15 mg/kg <0.5 5000
Hexavalent Chromium TM38/PM20 mg/kg <0.3 35
Copper #M TM30/PM15 mg/kg <1 71700
Lead #M TM30/PM15 mg/kg <5 750
Mercury #M TM30/PM15 mg/kg <0.1 3600
Nickel #M TM30/PM15 mg/kg <0.7 1800
Selenium #M TM30/PM15 mg/kg <1 13000
Vanadium 3160
Water Soluble Boron #M TM74/PM32 mg/kg <0.1 192000
Zinc #M TM30/PM15 mg/kg <5 665000
PAH MS
Acenaphthene #M TM4/PM8 mg/kg <0.05 3400
Acenaphthylene TM4/PM8 mg/kg <0.03 84000
Anthracene # TM4/PM8 mg/kg <0.04 530000
Benzo(a)anthracene # TM4/PM8 mg/kg <0.06 90
Benzo(a)pyrene # TM4/PM8 mg/kg <0.04 14
Benzo(b)fluoranthene TM4/PM8 mg/kg <0.05 100
Benzo(ghi)perylene # TM4/PM8 mg/kg <0.04 650
Benzo(k)fluoranthene TM4/PM8 mg/kg <0.02 140
Chrysene #M TM4/PM8 mg/kg <0.02 140
Dibenzo(ah)anthracene # TM4/PM8 mg/kg <0.04 13
Fluoranthene #M TM4/PM8 mg/kg <0.03 230
Fluorene #M TM4/PM8 mg/kg <0.04 64000
Indeno(123cd)pyrene #M TM4/PM8 mg/kg <0.04 60
Naphthalene #M TM4/PM8 mg/kg <0.04 200
Phenanthrene #M TM4/PM8 mg/kg <0.03 22000
Pyrene # TM4/PM8 mg/kg <0.03 54000
PAH 16 Total TM4/PM8 mg/kg <0.6
TPH CWG Aliphatics
>C5-C6 #M TM36/PM12 mg/kg <0.1 3400
>C6-C8 #M TM36/PM12 mg/kg <0.1 8300
>C8-C10 TM36/PM12 mg/kg <0.1 2100
>C10-C12 #M TM5/PM16 mg/kg <0.2 10000
>C12-C16 #M TM5/PM16 mg/kg <4 61000
>C16-C21 #M TM5/PM16 mg/kg <7 1600000
>C21-C35 #M TM5/PM16 mg/kg <7 1600000
>C35-C44 1600000
Total aliphatics C5-44 28000
TPH CWG Aromatics
>C5-EC7 TM36/PM12 mg/kg <0.1 59000
>EC7-EC8 TM36/PM12 mg/kg <0.1 3700
>EC8-EC10 #M TM36/PM12 mg/kg <0.1 17000
>EC10-EC12 TM5/PM16 mg/kg <0.2 36000
>EC12-EC16 TM5/PM16 mg/kg <4 28000
>EC16-EC21 TM5/PM16 mg/kg <7 28000
>EC21-EC35 TM5/PM16 mg/kg <7 28000
>EC35-EC44
Total aromatics C5-44
Total aliphatics and aromatics(C5-44)
GRO (>C4-C8)
GRO (>C8-C12)
GRO (>C4-C12)
EPH (C8-C40)
Mineral Oil (C8-C40)
BTEX/MTBE GC-FID
Benzene 95
Toluene 4400
Ethylbenzene 2800
m/p-Xylene 3200
o-Xylene 2600
Phenol 1100000
EPH >C8-C10 #M TM5/PM8 mg/kg <5
EPH >C10-C12 #M TM5/PM8 mg/kg <10
EPH >C12-C16 #M TM5/PM8 mg/kg <10
EPH >C16-C21 #M TM5/PM8 mg/kg <10
EPH >C21-C40 TM5/PM8 mg/kg <10
EPH >C8-C40 TM5/PM8 mg/kg <30
TPH CWG
Total aliphatics C5-35TM5/TM36/PM12/PM1
6mg/kg <19 28000
Total aromatics C5-35TM5/TM36/PM12/PM1
6mg/kg <19
Total aliphatics and aromatics(C5-35)TM5/TM36/PM12/PM1
6mg/kg <38
Benzene # TM31/PM12 ug/kg <5 95
Toluene # TM31/PM12 ug/kg <5 4400
Ethylbenzene # TM31/PM12 ug/kg <5 2800
m/p-Xylene # TM31/PM12 ug/kg <5 3200
o-Xylene # TM31/PM12 ug/kg <5 2600
Total Phenols HPLC TM26/PM21 mg/kg <0.15
Other Tests
Natural Moisture Content PM4/PM0 % <0.1
pH #M TM73/PM11 pH units <0.01
Sample Type PM13/PM0 None
Sample Colour PM13/PM0 None
Other Items PM13/PM0 None
Asbestos Screen #
Asbestos Screen (2) #
Asbestos Level
General Description (Bulk Analysis)
Asbestos Containing Material
Asbestos Containing Material (2)
Mass of Dry Sample
Organic Matter TM73/PM11 pH units <0.01
* not UKAS and MCERTS accredited
Boston Barrier Phase 3
Environmental Sample Results - Soils
03RBWS14 03RBWS15 03RBWS16 03RBWS17 03RBWS18 03RBWS19 03RBWS20 03RBBH0103FWBH04
A
03FWBH04
A
03FWBH04
B
03FWBH04
C
03FWBH04
C
03FWBH04
C
03FWBH04
C
0.2 2.0 1.0 1.0 1.0 2.0 2.0 2.00 0.10 0.60 6.30 1.00 1.50 2.00 6.20
V J T V J T V J T V J T V J T V J T V J T V J T V J V J V J T V J T J T V J T V J T
Soil Soil Soil Soil Soil Soil Soil Soil Soil Soil Soil Soil Soil Soil Soil
24/10/2014 24/10/2014 29/10/2014 29/10/2014 29/10/2014 29/10/2014 29/10/2014 30/10/2014 31/10/2014 31/10/2014 03/11/2014 03/11/2014 03/11/2014 03/11/2014 03/11/2014
28/10/2014 28/10/2014 30/10/2014 30/10/2014 30/10/2014 30/10/2014 30/10/2014 04/11/2014 04/11/2014 04/11/2014 04/11/2014 04/11/2014 04/11/2014 04/11/2014 04/11/2014
1092-1094 1101-1103 1125-1127 1130-1132 1160-1162 1163-1165 1166-1168 1178-1180 1190-1191 1192-1193 1194-1196 1197-1199 1200-1201 1202-1204 1205-1207
27 27 28 28 28 28 28 29 29 29 29 29 29 29 29
2.1 2.1 - - - - - - - - - - -
<0.5 <0.5 <0.5 <0.5 <0.5 <0.5 <0.5 <0.5 <0.5 <0.5 <0.5 <0.5 <0.5 <0.5 <0.5
<0.5 - <0.5 <0.5 - - - - <0.5 <0.5 <0.5 <0.5 <0.5
0.0115 0.2163 0.1307 0.7185 0.0658 0.8833 0.0888 0.0549 0.7079 0.3489 0.1216 1.6588 1.6367 0.3249 0.7727
10.5 17.8 13.1 10.9 12.5 12.7 9.6 12.3 2.2 106.0 21.1 13.2 25.6 22.4 14.4
<0.1 <0.1 <0.1 <0.1 <0.1 <0.1 <0.1 <0.1 0.2 1.4 0.2 <0.1 <0.1 <0.1 <0.1
26.5 49.0 32.3 48.4 29.4 39.2 29.8 36.2 30.6 68.4 45.1 28.6 30.0 28.0 30.8
<0.3 <0.3 <0.3 0.6 <0.3 <0.3 <0.3 <0.3 <0.3 2.5 <0.3 <0.3 <0.3 <0.3 <0.3
17 20 12 13 12 17 8 12 4 515 25 16 25 11 12
24 22 20 27 21 32 19 122 6 5042 68 39 33 37 33
<0.1 <0.1 <0.1 <0.1 <0.1 <0.1 <0.1 <0.1 <0.1 <0.1 0.1 <0.1 <0.1 <0.1 <0.1
13.6 39.1 16.5 22.2 19.7 24.7 9.9 16.0 3.1 123.4 27.7 16.5 16.4 14.5 14.4
<1 <1 <1 <1 <1 <1 <1 <1 3 4 1 <1 <1 <1 <1
1.2 4.0 4.2 9.2 6.0 5.1 2.5 2.1 4.0 11.4 14.2 4.8 9.1 10.8 13.4
64 86 56 61 57 71 50 63 47 2164 140 80 60 49 61
<0.05 <0.05 <0.05 <0.05 <0.05 <0.05 <0.05 <0.05 <0.50A <0.05 0.69 <0.05 <0.05 <0.05 0.21
0.06 <0.03 <0.03 <0.03 <0.03 <0.03 <0.03 <0.03 <0.30A 0.09 <0.03 <0.03 <0.03 <0.03 <0.03
0.12 <0.04 <0.04 <0.04 <0.04 <0.04 <0.04 <0.04 <0.40A <0.04 0.19 <0.04 <0.04 <0.04 <0.04
0.39 <0.06 <0.06 <0.06 0.07 0.15 <0.06 <0.06 <0.60A 0.31 0.11 <0.06 <0.06 <0.06 <0.06
0.30 <0.04 0.06 <0.04 <0.04 0.13 <0.04 <0.04 <0.40A 0.57 0.08 0.05 <0.04 <0.04 <0.04
0.61 <0.07 0.09 <0.05 0.06 0.21 <0.05 0.06 <0.50A 0.70 0.12 <0.05 <0.05 <0.05 <0.05
0.15 <0.04 <0.04 <0.04 <0.04 0.10 <0.04 <0.04 <0.40A 0.46 <0.04 <0.04 <0.04 <0.04 <0.04
0.17 <0.02 0.03 <0.02 0.02 0.08 <0.02 0.02 <0.20A 0.27 0.04 <0.02 <0.02 <0.02 <0.02
0.38 <0.02 0.10 <0.02 0.09 0.29 0.06 0.08 0.62A 0.43 0.13 0.08 0.05 <0.02 0.07
<0.04 <0.04 <0.04 <0.04 <0.04 <0.04 <0.04 <0.04 <0.40A 0.18 <0.04 <0.04 <0.04 <0.04 <0.04
0.65 <0.03 0.10 <0.03 0.09 0.40 0.05 0.09 <0.30A 0.35 0.47 0.08 <0.03 <0.03 0.14
<0.04 <0.04 <0.04 <0.04 <0.04 <0.04 <0.04 <0.04 <0.40A <0.04 0.46 <0.04 <0.04 <0.04 <0.04
0.18 <0.04 <0.04 <0.04 <0.04 0.08 <0.04 <0.04 <0.40A 0.47 <0.04 <0.04 <0.04 <0.04 <0.04
0.05 <0.04 <0.04 <0.04 <0.04 <0.04 <0.04 <0.04 <0.40A <0.04 3.47 <0.04 <0.04 <0.04 0.33
0.39 <0.03 0.07 <0.03 0.08 0.28 <0.03 0.05 <0.30A 0.09 1.29 <0.03 <0.03 <0.03 0.24
0.39 <0.03 0.09 <0.03 0.08 0.32 0.04 0.08 0.55A 0.35 0.33 0.07 <0.03 <0.03 0.10
0.51 <0.03 <0.6 <0.6 <0.6 2.0 <0.6 <0.6 <6.0A 4.3 7.4 <0.6 <0.6 <0.6 1.1
<0.1 - <0.1 <0.1 - - - - <0.1 <0.1 <0.1 <0.1 <0.1
<0.1 - <0.1 <0.1 - - - - <0.1 <0.1 <0.1 <0.1 <0.1
<0.1 - <0.1 <0.1 - - - - 2.0 <0.1 <0.1 <0.1 2.4
<0.2 - <0.2 <0.2 - - - - <0.2 <0.2 <0.2 <0.2 5.8
<4 - <4 <4 - - - - <4 <4 <4 <4 <4
<7 - <7 <7 - - - - <7 <7 <7 <7 <7
<7 - <7 <7 - - - - <7 <7 <7 <7 <7
<19 - <19 <19 - - - - <19 <19 <19 <19 <19
<0.1 - <0.1 <0.1 - - - - <0.1 <0.1 <0.1 <0.1 <0.1
<0.1 - <0.1 <0.1 - - - - <0.1 <0.1 <0.1 <0.1 <0.1
<0.1 - <0.1 <0.1 - - - - 2.0 <0.1 <0.1 <0.1 <0.1
<0.2 - <0.2 <0.2 - - - - 17.4 <0.2 <0.2 <0.2 2.3
<4 - <4 <4 - - - - 41 <4 <4 <4 <4
<7 - <7 <7 - - - - 52 <7 <7 <7 16
<7 - <7 <7 - - - - 77 <7 <7 15 44
<19 - <19 <19 - - - - 189 <19 <19 <19 62
<38 - <38 <38 - - - - 189 <38 <38 <38 62
- - - - - - -
- - - - - - -
- - - - - - -
- - - - - - -
- - - - - - -
<5 <5 <5 <5 <5 <5 <5 <5 <100D <5 20 <5 <5 <5 17
<10 <10 <10 <10 <10 <10 <10 <10 <200D <10 52 <10 <10 <10 <10
<10 <10 <10 <10 <10 <10 <10 <10 <200D <10 115 <10 <10 <10 <10
14 <10 <10 <10 <10 18 <10 <10 <200D 41 199 <10 <10 24 84
113 <10 <10 33 12 145 104 <10 8929D 406 537 129 <10 247 262
127 <30 <30 33 <30 163 104 <30 8929D 447 923 129 <30 271 363
<5 - <5 <5 - - - - 9 <5 <5 <5 <5
<5 - <5 <5 - - - - 53 <5 <5 <5 <5
<5 - <5 <5 - - - - 487 <5 <5 <5 <5
<5 - <5 <5 - - - - 955 <5 <5 <5 <5
<5 - <5 <5 - - - - 576 <5 <5 <5 <5
<0.15 <0.15 <0.15 <0.15 <0.15 <0.15 <0.15 <0.15 <0.15 <0.15 <0.15 <0.15 <0.15 <0.15 <0.15
6.3 13.5 12.2 42.3 11.8 21.2 19.2 17.5 8.2 47.2 57.0 37.1 30.4 38.7 74.5
8.68 8.25 8.19 7.81 8.34 7.92 8.38 8.41 8.60 7.79 8.58 7.75 7.48 8.01 7.66
Sand Clay Loam Clayey Loam Loam Loam Clayey Loam Clayey Loam Sand Sandy Loam Clay Clayey Loam Clay Clay Clayey Silt
Medium
Brown
Medium
Brown
Medium
BrownDark Brown
Medium
Brown
Medium
BrownDark Brown
Medium
BrownDark Brown Dark Brown Dark Brown Dark Brown
Medium
BrownDark Grey Dark Brown
clay lumps noneMedium
BrownStones
Stones,
RootsStones Stones Stones Stones
Clay,
Stones,
Ceramic
Roots Stones None None None
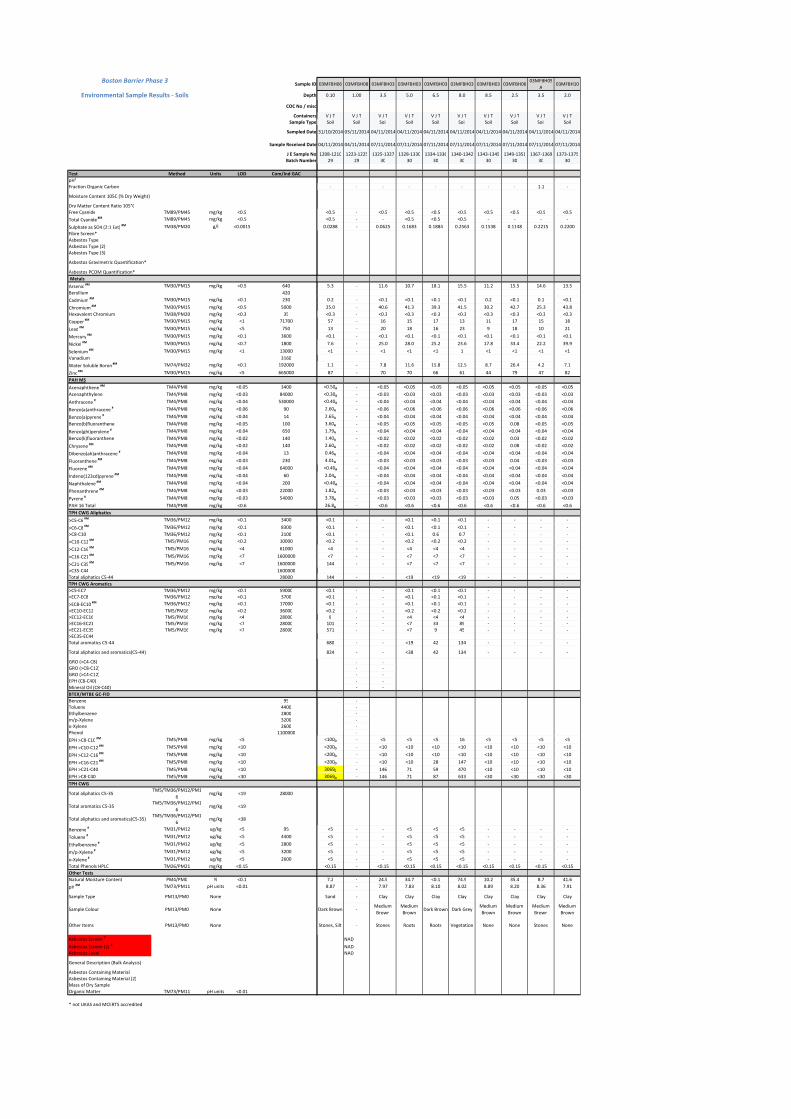
Sample ID
Depth
COC No / misc
Containers
Sample Type
Sampled Date
Sample Received Date
J E Sample No
Batch Number
Test Method Units LOD Com/Ind GAC
pH¹
Fraction Organic Carbon
Moisture Content 105C (% Dry Weight)
Dry Matter Content Ratio 105°C
Free Cyanide TM89/PM45 mg/kg <0.5
Total Cyanide #M TM89/PM45 mg/kg <0.5
Sulphate as SO4 (2:1 Ext) #M TM38/PM20 g/l <0.0015
Fibre Screen*
Asbestos Type
Asbestos Type (2)
Asbestos Type (3)
Asbestos Gravimetric Quantification*
Asbestos PCOM Quantification*
Metals
Arsenic #M TM30/PM15 mg/kg <0.5 640
Beryllium 420
Cadmium #M TM30/PM15 mg/kg <0.1 230
Chromium #M TM30/PM15 mg/kg <0.5 5000
Hexavalent Chromium TM38/PM20 mg/kg <0.3 35
Copper #M TM30/PM15 mg/kg <1 71700
Lead #M TM30/PM15 mg/kg <5 750
Mercury #M TM30/PM15 mg/kg <0.1 3600
Nickel #M TM30/PM15 mg/kg <0.7 1800
Selenium #M TM30/PM15 mg/kg <1 13000
Vanadium 3160
Water Soluble Boron #M TM74/PM32 mg/kg <0.1 192000
Zinc #M TM30/PM15 mg/kg <5 665000
PAH MS
Acenaphthene #M TM4/PM8 mg/kg <0.05 3400
Acenaphthylene TM4/PM8 mg/kg <0.03 84000
Anthracene # TM4/PM8 mg/kg <0.04 530000
Benzo(a)anthracene # TM4/PM8 mg/kg <0.06 90
Benzo(a)pyrene # TM4/PM8 mg/kg <0.04 14
Benzo(b)fluoranthene TM4/PM8 mg/kg <0.05 100
Benzo(ghi)perylene # TM4/PM8 mg/kg <0.04 650
Benzo(k)fluoranthene TM4/PM8 mg/kg <0.02 140
Chrysene #M TM4/PM8 mg/kg <0.02 140
Dibenzo(ah)anthracene # TM4/PM8 mg/kg <0.04 13
Fluoranthene #M TM4/PM8 mg/kg <0.03 230
Fluorene #M TM4/PM8 mg/kg <0.04 64000
Indeno(123cd)pyrene #M TM4/PM8 mg/kg <0.04 60
Naphthalene #M TM4/PM8 mg/kg <0.04 200
Phenanthrene #M TM4/PM8 mg/kg <0.03 22000
Pyrene # TM4/PM8 mg/kg <0.03 54000
PAH 16 Total TM4/PM8 mg/kg <0.6
TPH CWG Aliphatics
>C5-C6 #M TM36/PM12 mg/kg <0.1 3400
>C6-C8 #M TM36/PM12 mg/kg <0.1 8300
>C8-C10 TM36/PM12 mg/kg <0.1 2100
>C10-C12 #M TM5/PM16 mg/kg <0.2 10000
>C12-C16 #M TM5/PM16 mg/kg <4 61000
>C16-C21 #M TM5/PM16 mg/kg <7 1600000
>C21-C35 #M TM5/PM16 mg/kg <7 1600000
>C35-C44 1600000
Total aliphatics C5-44 28000
TPH CWG Aromatics
>C5-EC7 TM36/PM12 mg/kg <0.1 59000
>EC7-EC8 TM36/PM12 mg/kg <0.1 3700
>EC8-EC10 #M TM36/PM12 mg/kg <0.1 17000
>EC10-EC12 TM5/PM16 mg/kg <0.2 36000
>EC12-EC16 TM5/PM16 mg/kg <4 28000
>EC16-EC21 TM5/PM16 mg/kg <7 28000
>EC21-EC35 TM5/PM16 mg/kg <7 28000
>EC35-EC44
Total aromatics C5-44
Total aliphatics and aromatics(C5-44)
GRO (>C4-C8)
GRO (>C8-C12)
GRO (>C4-C12)
EPH (C8-C40)
Mineral Oil (C8-C40)
BTEX/MTBE GC-FID
Benzene 95
Toluene 4400
Ethylbenzene 2800
m/p-Xylene 3200
o-Xylene 2600
Phenol 1100000
EPH >C8-C10 #M TM5/PM8 mg/kg <5
EPH >C10-C12 #M TM5/PM8 mg/kg <10
EPH >C12-C16 #M TM5/PM8 mg/kg <10
EPH >C16-C21 #M TM5/PM8 mg/kg <10
EPH >C21-C40 TM5/PM8 mg/kg <10
EPH >C8-C40 TM5/PM8 mg/kg <30
TPH CWG
Total aliphatics C5-35TM5/TM36/PM12/PM1
6mg/kg <19 28000
Total aromatics C5-35TM5/TM36/PM12/PM1
6mg/kg <19
Total aliphatics and aromatics(C5-35)TM5/TM36/PM12/PM1
6mg/kg <38
Benzene # TM31/PM12 ug/kg <5 95
Toluene # TM31/PM12 ug/kg <5 4400
Ethylbenzene # TM31/PM12 ug/kg <5 2800
m/p-Xylene # TM31/PM12 ug/kg <5 3200
o-Xylene # TM31/PM12 ug/kg <5 2600
Total Phenols HPLC TM26/PM21 mg/kg <0.15
Other Tests
Natural Moisture Content PM4/PM0 % <0.1
pH #M TM73/PM11 pH units <0.01
Sample Type PM13/PM0 None
Sample Colour PM13/PM0 None
Other Items PM13/PM0 None
Asbestos Screen #
Asbestos Screen (2) #
Asbestos Level
General Description (Bulk Analysis)
Asbestos Containing Material
Asbestos Containing Material (2)
Mass of Dry Sample
Organic Matter TM73/PM11 pH units <0.01
* not UKAS and MCERTS accredited
Boston Barrier Phase 3
Environmental Sample Results - Soils
03MFBH06 03MFBH08 03MFBH03 03MFBH03 03MFBH03 03MFBH03 03MFBH03 03MFBH0603MFBH09
A03MFBH10
0.10 1.00 3.5 5.0 6.5 8.0 8.5 2.5 3.5 2.0
V J T V J T V J T V J T V J T V J T V J T V J T V J T V J T
Soil Soil Soil Soil Soil Soil Soil Soil Soil Soil
31/10/2014 03/11/2014 04/11/2014 04/11/2014 04/11/2014 04/11/2014 04/11/2014 04/11/2014 04/11/2014 04/11/2014
04/11/2014 04/11/2014 07/11/2014 07/11/2014 07/11/2014 07/11/2014 07/11/2014 07/11/2014 07/11/2014 07/11/2014
1208-1210 1223-1225 1325-1327 1328-1330 1334-1336 1340-1342 1343-1345 1349-1351 1367-1369 1373-1375
29 29 30 30 30 30 30 30 30 30
- - - - - - - - 1.1 -
<0.5 - <0.5 <0.5 <0.5 <0.5 <0.5 <0.5 <0.5 <0.5
<0.5 - - <0.5 <0.5 <0.5 - - - -
0.0288 - 0.0625 0.1683 0.1884 0.2563 0.1538 0.1148 0.2215 0.2200
5.3 - 11.6 10.7 18.1 15.5 11.2 15.5 14.6 13.5
0.2 - <0.1 <0.1 <0.1 <0.1 0.2 <0.1 0.1 <0.1
25.0 - 40.6 41.3 39.3 41.5 30.2 42.7 25.3 43.8
<0.3 - <0.3 <0.3 <0.3 <0.3 <0.3 <0.3 <0.3 <0.3
57 - 16 15 17 13 11 17 15 18
13 - 20 18 16 23 9 18 10 21
<0.1 - <0.1 <0.1 <0.1 <0.1 <0.1 <0.1 <0.1 <0.1
7.6 - 25.0 28.0 25.2 23.6 17.8 33.4 22.2 39.9
<1 - <1 <1 <1 1 <1 <1 <1 <1
1.1 - 7.8 11.6 15.8 12.5 8.7 26.4 4.2 7.1
87 - 70 70 66 61 44 79 47 82
<0.50A - <0.05 <0.05 <0.05 <0.05 <0.05 <0.05 <0.05 <0.05
<0.30A - <0.03 <0.03 <0.03 <0.03 <0.03 <0.03 <0.03 <0.03
<0.40A - <0.04 <0.04 <0.04 <0.04 <0.04 <0.04 <0.04 <0.04
2.60A - <0.06 <0.06 <0.06 <0.06 <0.06 <0.06 <0.06 <0.06
2.65A - <0.04 <0.04 <0.04 <0.04 <0.04 <0.04 <0.04 <0.04
3.60A - <0.05 <0.05 <0.05 <0.05 <0.05 0.08 <0.05 <0.05
1.79A - <0.04 <0.04 <0.04 <0.04 <0.04 <0.04 <0.04 <0.04
1.40A - <0.02 <0.02 <0.02 <0.02 <0.02 0.03 <0.02 <0.02
2.60A - <0.02 <0.02 <0.02 <0.02 <0.02 0.08 <0.02 <0.02
0.46A - <0.04 <0.04 <0.04 <0.04 <0.04 <0.04 <0.04 <0.04
4.01A - <0.03 <0.03 <0.03 <0.03 <0.03 0.04 <0.03 <0.03
<0.40A - <0.04 <0.04 <0.04 <0.04 <0.04 <0.04 <0.04 <0.04
2.04A - <0.04 <0.04 <0.04 <0.04 <0.04 <0.04 <0.04 <0.04
<0.40A - <0.04 <0.04 <0.04 <0.04 <0.04 <0.04 <0.04 <0.04
1.82A - <0.03 <0.03 <0.03 <0.03 <0.03 <0.03 0.03 <0.03
3.78A - <0.03 <0.03 <0.03 <0.03 <0.03 0.05 <0.03 <0.03
26.8A - <0.6 <0.6 <0.6 <0.6 <0.6 <0.6 <0.6 <0.6
<0.1 - - <0.1 <0.1 <0.1 - - - -
<0.1 - - <0.1 <0.1 <0.1 - - - -
<0.1 - - <0.1 0.6 0.7 - - - -
<0.2 - - <0.2 <0.2 <0.2 - - - -
<4 - - <4 <4 <4 - - - -
<7 - - <7 <7 <7 - - - -
144 - - <7 <7 <7 - - - -
144 - - <19 <19 <19 - - - -
<0.1 - - <0.1 <0.1 <0.1 - - - -
<0.1 - - <0.1 <0.1 <0.1 - - - -
<0.1 - - <0.1 <0.1 <0.1 - - - -
<0.2 - - <0.2 <0.2 <0.2 - - - -
8 - - <4 <4 <4 - - - -
101 - - <7 33 89 - - - -
571 - - <7 9 45 - - - -
680 - - <19 42 134 - - - -
824 - - <38 42 134 - - - -
- -
- -
- -
- -
- -
-
-
-
-
-
-
<100D - <5 <5 <5 16 <5 <5 <5 <5
<200D - <10 <10 <10 <10 <10 <10 <10 <10
<200D - <10 <10 <10 <10 <10 <10 <10 <10
<200D - <10 <10 28 147 <10 <10 <10 <10
3069D - 146 71 59 470 <10 <10 <10 <10
3069D - 146 71 87 633 <30 <30 <30 <30
<5 - - <5 <5 <5 - - - -
<5 - - <5 <5 <5 - - - -
<5 - - <5 <5 <5 - - - -
<5 - - <5 <5 <5 - - - -
<5 - - <5 <5 <5 - - - -
<0.15 - <0.15 <0.15 <0.15 <0.15 <0.15 <0.15 <0.15 <0.15
7.2 - 24.5 34.7 <0.1 74.9 10.2 35.4 8.7 41.6
8.87 - 7.97 7.83 8.10 8.02 8.89 8.20 8.36 7.91
Sand - Clay Clay Clay Clay Clay Clay Clay Clay
Dark Brown -Medium
Brown
Medium
BrownDark Brown Dark Grey
Medium
Brown
Medium
Brown
Medium
Brown
Medium
Brown
Stones, Silt - Stones Roots Roots Vegetation None None Stones None
NAD
NAD
NAD
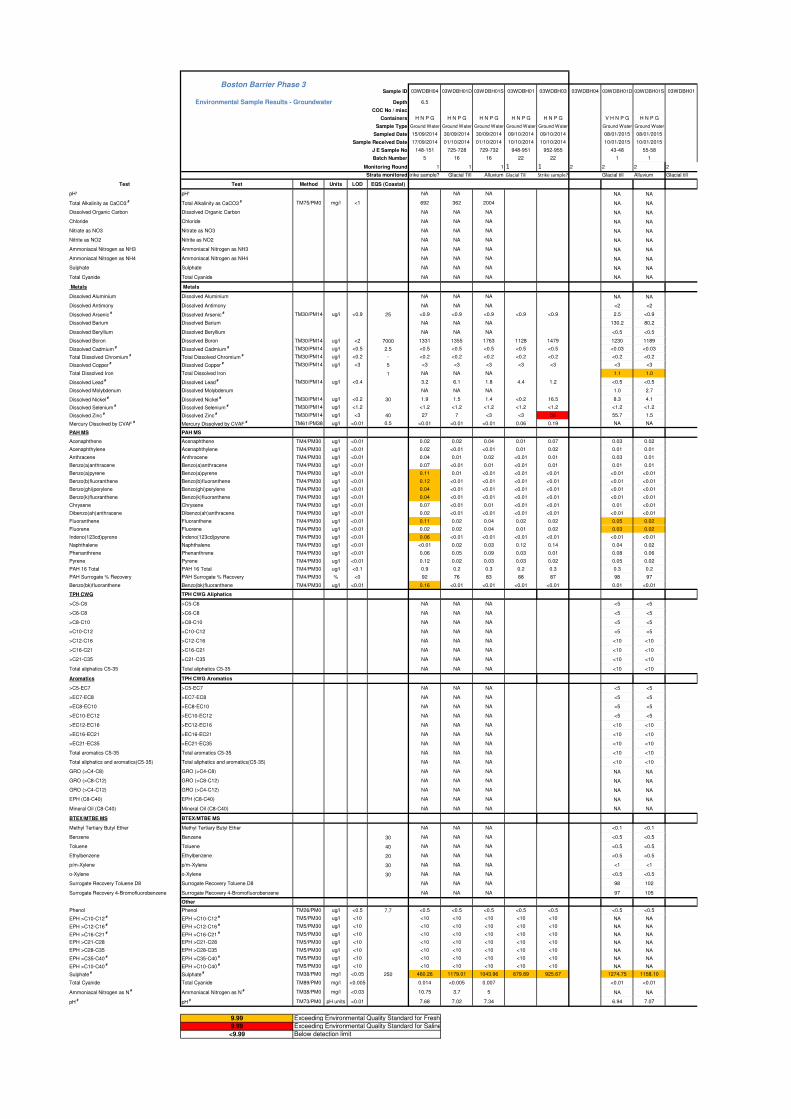
Sample ID 03WDBH04 03WDBH01D 03WDBH01S 03WDBH01 03WDBH03 03WDBH04 03WDBH01D 03WDBH01S 03WDBH01
Depth 6.5
COC No / misc
Containers H N P G H N P G H N P G H N P G H N P G V H N P G H N P G
Sample Type Ground Water Ground Water Ground Water Ground Water Ground Water Ground Water Ground Water
Sampled Date 15/09/2014 30/09/2014 30/09/2014 09/10/2014 09/10/2014 08/01/2015 08/01/2015
Sample Received Date 17/09/2014 01/10/2014 01/10/2014 10/10/2014 10/10/2014 10/01/2015 10/01/2015
J E Sample No 148-151 725-728 729-732 948-951 952-955 43-48 55-58
Batch Number 5 16 16 22 22 1 1
Monitoring Round 1 1 1 1 1 2 2 2 2
Strata monitoredStrike sample? Glacial Till Alluvium Glacial Till Strike sample? Glacial till Alluvium Glacial till
Test Test Method Units LOD EQS (Coastal)
pH¹ pH¹ NA NA NA NA NA
Total Alkalinity as CaCO3 #
Total Alkalinity as CaCO3 # TM75/PM0 mg/l <1 692 362 2004 NA NA
Dissolved Organic Carbon Dissolved Organic Carbon NA NA NA NA NA
Chloride Chloride NA NA NA NA NA
Nitrate as NO3 Nitrate as NO3 NA NA NA NA NA
Nitrite as NO2 Nitrite as NO2 NA NA NA NA NA
Ammoniacal Nitrogen as NH3 Ammoniacal Nitrogen as NH3 NA NA NA NA NA
Ammoniacal Nitrogen as NH4 Ammoniacal Nitrogen as NH4 NA NA NA NA NA
Sulphate Sulphate NA NA NA NA NA
Total Cyanide Total Cyanide NA NA NA NA NA
Metals Metals
Dissolved Aluminium Dissolved Aluminium NA NA NA NA NA
Dissolved Antimony Dissolved Antimony NA NA NA <2 <2
Dissolved Arsenic #
Dissolved Arsenic # TM30/PM14 ug/l <0.9 25 <0.9 <0.9 <0.9 <0.9 <0.9 2.5 <0.9
Dissolved Barium Dissolved Barium NA NA NA 130.2 80.2
Dissolved Beryllium Dissolved Beryllium NA NA NA <0.5 <0.5
Dissolved Boron Dissolved Boron TM30/PM14 ug/l <2 7000 1331 1355 1763 1128 1479 1230 1189
Dissolved Cadmium #
Dissolved Cadmium # TM30/PM14 ug/l <0.5 2.5 <0.5 <0.5 <0.5 <0.5 <0.5 <0.03 <0.03
Total Dissolved Chromium #
Total Dissolved Chromium # TM30/PM14 ug/l <0.2 - <0.2 <0.2 <0.2 <0.2 <0.2 <0.2 <0.2
Dissolved Copper #
Dissolved Copper # TM30/PM14 ug/l <3 5 <3 <3 <3 <3 <3 <3 <3
Total Dissolved Iron Total Dissolved Iron 1 NA NA NA 1.1 1.0
Dissolved Lead #
Dissolved Lead # TM30/PM14 ug/l <0.4 3.2 6.1 1.8 4.4 1.2 <0.5 <0.5
Dissolved Molybdenum Dissolved Molybdenum NA NA NA 1.0 2.7
Dissolved Nickel #
Dissolved Nickel # TM30/PM14 ug/l <0.2 30 1.9 1.5 1.4 <0.2 16.5 8.3 4.1
Dissolved Selenium #
Dissolved Selenium # TM30/PM14 ug/l <1.2 <1.2 <1.2 <1.2 <1.2 <1.2 <1.2 <1.2
Dissolved Zinc #
Dissolved Zinc # TM30/PM14 ug/l <3 40 27 7 <3 <3 58 55.7 1.5
Mercury Dissolved by CVAF #
Mercury Dissolved by CVAF # TM61/PM38 ug/l <0.01 0.5 <0.01 <0.01 <0.01 0.06 0.19 NA NA
PAH MS PAH MS
Acenaphthene Acenaphthene TM4/PM30 ug/l <0.01 0.02 0.02 0.04 0.01 0.07 0.03 0.02
Acenaphthylene Acenaphthylene TM4/PM30 ug/l <0.01 0.02 <0.01 <0.01 0.01 0.02 0.01 0.01
Anthracene Anthracene TM4/PM30 ug/l <0.01 0.04 0.01 0.02 <0.01 0.01 0.03 0.01
Benzo(a)anthracene Benzo(a)anthracene TM4/PM30 ug/l <0.01 0.07 <0.01 0.01 <0.01 0.01 0.01 0.01
Benzo(a)pyrene Benzo(a)pyrene TM4/PM30 ug/l <0.01 0.11 0.01 <0.01 <0.01 <0.01 <0.01 <0.01
Benzo(b)fluoranthene Benzo(b)fluoranthene TM4/PM30 ug/l <0.01 0.12 <0.01 <0.01 <0.01 <0.01 <0.01 <0.01
Benzo(ghi)perylene Benzo(ghi)perylene TM4/PM30 ug/l <0.01 0.04 <0.01 <0.01 <0.01 <0.01 <0.01 <0.01
Benzo(k)fluoranthene Benzo(k)fluoranthene TM4/PM30 ug/l <0.01 0.04 <0.01 <0.01 <0.01 <0.01 <0.01 <0.01
Chrysene Chrysene TM4/PM30 ug/l <0.01 0.07 <0.01 0.01 <0.01 <0.01 0.01 <0.01
Dibenzo(ah)anthracene Dibenzo(ah)anthracene TM4/PM30 ug/l <0.01 0.02 <0.01 <0.01 <0.01 <0.01 <0.01 <0.01
Fluoranthene Fluoranthene TM4/PM30 ug/l <0.01 0.11 0.02 0.04 0.02 0.02 0.05 0.02
Fluorene Fluorene TM4/PM30 ug/l <0.01 0.02 0.02 0.04 0.01 0.02 0.03 0.02
Indeno(123cd)pyrene Indeno(123cd)pyrene TM4/PM30 ug/l <0.01 0.06 <0.01 <0.01 <0.01 <0.01 <0.01 <0.01
Naphthalene Naphthalene TM4/PM30 ug/l <0.01 <0.01 0.02 0.03 0.12 0.14 0.04 0.02
Phenanthrene Phenanthrene TM4/PM30 ug/l <0.01 0.06 0.05 0.09 0.03 0.01 0.08 0.06
Pyrene Pyrene TM4/PM30 ug/l <0.01 0.12 0.02 0.03 0.03 0.02 0.05 0.02
PAH 16 Total PAH 16 Total TM4/PM30 ug/l <0.1 0.9 0.2 0.3 0.2 0.3 0.3 0.2
PAH Surrogate % Recovery PAH Surrogate % Recovery TM4/PM30 % <0 92 76 83 88 87 98 97
Benzo(bk)fluoranthene Benzo(bk)fluoranthene TM4/PM30 ug/l <0.01 0.16 <0.01 <0.01 <0.01 <0.01 0.01 <0.01
TPH CWG TPH CWG Aliphatics
>C5-C6 >C5-C6 NA NA NA <5 <5
>C6-C8 >C6-C8 NA NA NA <5 <5
>C8-C10 >C8-C10 NA NA NA <5 <5
>C10-C12 >C10-C12 NA NA NA <5 <5
>C12-C16 >C12-C16 NA NA NA <10 <10
>C16-C21 >C16-C21 NA NA NA <10 <10
>C21-C35 >C21-C35 NA NA NA <10 <10
Total aliphatics C5-35 Total aliphatics C5-35 NA NA NA <10 <10
Aromatics TPH CWG Aromatics
>C5-EC7 >C5-EC7 NA NA NA <5 <5
>EC7-EC8 >EC7-EC8 NA NA NA <5 <5
>EC8-EC10 >EC8-EC10 NA NA NA <5 <5
>EC10-EC12 >EC10-EC12 NA NA NA <5 <5
>EC12-EC16 >EC12-EC16 NA NA NA <10 <10
>EC16-EC21 >EC16-EC21 NA NA NA <10 <10
>EC21-EC35 >EC21-EC35 NA NA NA <10 <10
Total aromatics C5-35 Total aromatics C5-35 NA NA NA <10 <10
Total aliphatics and aromatics(C5-35) Total aliphatics and aromatics(C5-35) NA NA NA <10 <10
GRO (>C4-C8) GRO (>C4-C8) NA NA NA NA NA
GRO (>C8-C12) GRO (>C8-C12) NA NA NA NA NA
GRO (>C4-C12) GRO (>C4-C12) NA NA NA NA NA
EPH (C8-C40) EPH (C8-C40) NA NA NA NA NA
Mineral Oil (C8-C40) Mineral Oil (C8-C40) NA NA NA NA NA
BTEX/MTBE MS BTEX/MTBE MS
Methyl Tertiary Butyl Ether Methyl Tertiary Butyl Ether NA NA NA <0.1 <0.1
Benzene Benzene 30 NA NA NA <0.5 <0.5
Toluene Toluene 40 NA NA NA <0.5 <0.5
Ethylbenzene Ethylbenzene 20 NA NA NA <0.5 <0.5
p/m-Xylene p/m-Xylene 30 NA NA NA <1 <1
o-Xylene o-Xylene 30 NA NA NA <0.5 <0.5
Surrogate Recovery Toluene D8 Surrogate Recovery Toluene D8 NA NA NA 98 102
Surrogate Recovery 4-Bromofluorobenzene Surrogate Recovery 4-Bromofluorobenzene NA NA NA 97 105
Other
Phenol Phenol TM26/PM0 ug/l <0.5 7.7 <0.5 <0.5 <0.5 <0.5 <0.5 <0.5 <0.5
EPH >C10-C12 #
EPH >C10-C12 # TM5/PM30 ug/l <10 <10 <10 <10 <10 <10 NA NA
EPH >C12-C16 #
EPH >C12-C16 # TM5/PM30 ug/l <10 <10 <10 <10 <10 <10 NA NA
EPH >C16-C21 #
EPH >C16-C21 # TM5/PM30 ug/l <10 <10 <10 <10 <10 <10 NA NA
EPH >C21-C28 EPH >C21-C28 TM5/PM30 ug/l <10 <10 <10 <10 <10 <10 NA NA
EPH >C28-C35 EPH >C28-C35 TM5/PM30 ug/l <10 <10 <10 <10 <10 <10 NA NA
EPH >C35-C40 #
EPH >C35-C40 # TM5/PM30 ug/l <10 <10 <10 <10 <10 <10 NA NA
EPH >C10-C40 #
EPH >C10-C40 # TM5/PM30 ug/l <10 <10 <10 <10 <10 <10 NA NA
Sulphate #
Sulphate # TM38/PM0 mg/l <0.05 250 460.26 1179.01 1043.96 679.89 925.67 1274.75 1158.10
Total Cyanide Total Cyanide TM89/PM0 mg/l <0.005 0.014 <0.005 0.007 <0.01 <0.01
Ammoniacal Nitrogen as N #
Ammoniacal Nitrogen as N # TM38/PM0 mg/l <0.03 10.75 3.7 5 NA NA
pH #
pH # TM73/PM0 pH units <0.01 7.68 7.02 7.34 6.94 7.07
9.99
9.99
<9.99
Boston Barrier Phase 3
Exceeding Environmental Quality Standard for Fresh Waters
Exceeding Environmental Quality Standard for Saline Waters
Below detection limit
Environmental Sample Results - Groundwater
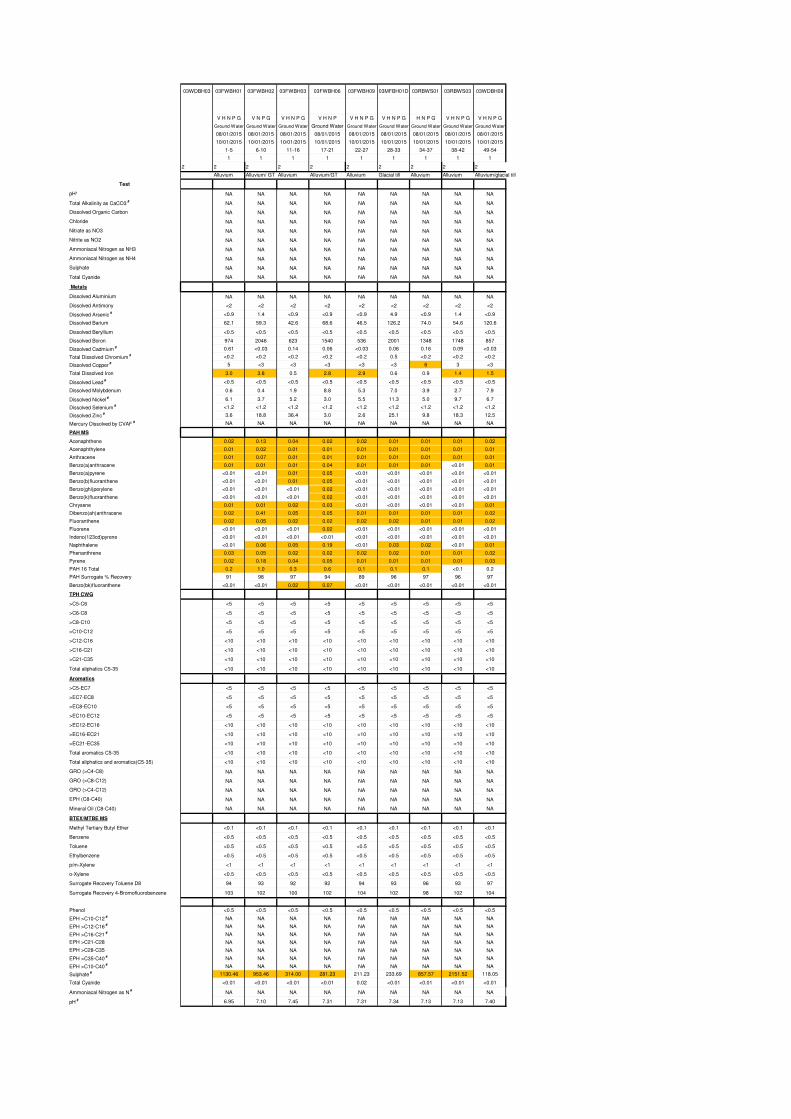
Test
pH¹
Total Alkalinity as CaCO3 #
Dissolved Organic Carbon
Chloride
Nitrate as NO3
Nitrite as NO2
Ammoniacal Nitrogen as NH3
Ammoniacal Nitrogen as NH4
Sulphate
Total Cyanide
Metals
Dissolved Aluminium
Dissolved Antimony
Dissolved Arsenic #
Dissolved Barium
Dissolved Beryllium
Dissolved Boron
Dissolved Cadmium #
Total Dissolved Chromium #
Dissolved Copper #
Total Dissolved Iron
Dissolved Lead #
Dissolved Molybdenum
Dissolved Nickel #
Dissolved Selenium #
Dissolved Zinc #
Mercury Dissolved by CVAF #
PAH MS
Acenaphthene
Acenaphthylene
Anthracene
Benzo(a)anthracene
Benzo(a)pyrene
Benzo(b)fluoranthene
Benzo(ghi)perylene
Benzo(k)fluoranthene
Chrysene
Dibenzo(ah)anthracene
Fluoranthene
Fluorene
Indeno(123cd)pyrene
Naphthalene
Phenanthrene
Pyrene
PAH 16 Total
PAH Surrogate % Recovery
Benzo(bk)fluoranthene
TPH CWG
>C5-C6
>C6-C8
>C8-C10
>C10-C12
>C12-C16
>C16-C21
>C21-C35
Total aliphatics C5-35
Aromatics
>C5-EC7
>EC7-EC8
>EC8-EC10
>EC10-EC12
>EC12-EC16
>EC16-EC21
>EC21-EC35
Total aromatics C5-35
Total aliphatics and aromatics(C5-35)
GRO (>C4-C8)
GRO (>C8-C12)
GRO (>C4-C12)
EPH (C8-C40)
Mineral Oil (C8-C40)
BTEX/MTBE MS
Methyl Tertiary Butyl Ether
Benzene
Toluene
Ethylbenzene
p/m-Xylene
o-Xylene
Surrogate Recovery Toluene D8
Surrogate Recovery 4-Bromofluorobenzene
Phenol
EPH >C10-C12 #
EPH >C12-C16 #
EPH >C16-C21 #
EPH >C21-C28
EPH >C28-C35
EPH >C35-C40 #
EPH >C10-C40 #
Sulphate #
Total Cyanide
Ammoniacal Nitrogen as N #
pH #
03WDBH03 03FWBH01 03FWBH02 03FWBH03 03FWBH06 03FWBH09 03MFBH01D 03RBWS01 03RBWS03 03WDBH08
V H N P G V N P G V H N P G V H N P V H N P G V H N P G H N P G V H N P G V H N P G
Ground Water Ground Water Ground Water Ground Water Ground Water Ground Water Ground Water Ground Water Ground Water
08/01/2015 08/01/2015 08/01/2015 08/01/2015 08/01/2015 08/01/2015 08/01/2015 08/01/2015 08/01/2015
10/01/2015 10/01/2015 10/01/2015 10/01/2015 10/01/2015 10/01/2015 10/01/2015 10/01/2015 10/01/2015
1-5 6-10 11-16 17-21 22-27 28-33 34-37 38-42 49-54
1 1 1 1 1 1 1 1 1
2 2 2 2 2 2 2 2 2 2
Alluvium Alluvium/ GT Alluvium Alluvium/GT Alluvium Glacial till Alluvium Alluvium Alluvium/glacial till
NA NA NA NA NA NA NA NA NA
NA NA NA NA NA NA NA NA NA
NA NA NA NA NA NA NA NA NA
NA NA NA NA NA NA NA NA NA
NA NA NA NA NA NA NA NA NA
NA NA NA NA NA NA NA NA NA
NA NA NA NA NA NA NA NA NA
NA NA NA NA NA NA NA NA NA
NA NA NA NA NA NA NA NA NA
NA NA NA NA NA NA NA NA NA
NA NA NA NA NA NA NA NA NA
<2 <2 <2 <2 <2 <2 <2 <2 <2
<0.9 1.4 <0.9 <0.9 <0.9 4.9 <0.9 1.4 <0.9
62.1 59.3 42.6 68.6 46.5 126.2 74.0 54.6 120.6
<0.5 <0.5 <0.5 <0.5 <0.5 <0.5 <0.5 <0.5 <0.5
974 2046 623 1540 536 2001 1348 1748 857
0.61 <0.03 0.14 0.06 <0.03 0.06 0.16 0.09 <0.03
<0.2 <0.2 <0.2 <0.2 <0.2 0.5 <0.2 <0.2 <0.2
5 <3 <3 <3 <3 <3 6 3 <3
3.0 3.8 0.5 2.8 2.9 0.6 0.9 1.4 1.5
<0.5 <0.5 <0.5 <0.5 <0.5 <0.5 <0.5 <0.5 <0.5
0.6 0.4 1.9 8.8 5.3 7.0 3.9 2.7 7.9
6.1 3.7 5.2 3.0 5.5 11.3 5.0 9.7 6.7
<1.2 <1.2 <1.2 <1.2 <1.2 <1.2 <1.2 <1.2 <1.2
3.6 18.8 36.4 3.0 2.6 25.1 9.8 18.3 12.5
NA NA NA NA NA NA NA NA NA
0.02 0.13 0.04 0.02 0.02 0.01 0.01 0.01 0.02
0.01 0.02 0.01 0.01 0.01 0.01 0.01 0.01 0.01
0.01 0.07 0.01 0.01 0.01 0.01 0.01 0.01 0.01
0.01 0.01 0.01 0.04 0.01 0.01 0.01 <0.01 0.01
<0.01 <0.01 0.01 0.05 <0.01 <0.01 <0.01 <0.01 <0.01
<0.01 <0.01 0.01 0.05 <0.01 <0.01 <0.01 <0.01 <0.01
<0.01 <0.01 <0.01 0.02 <0.01 <0.01 <0.01 <0.01 <0.01
<0.01 <0.01 <0.01 0.02 <0.01 <0.01 <0.01 <0.01 <0.01
0.01 0.01 0.02 0.03 <0.01 <0.01 <0.01 <0.01 0.01
0.02 0.41 0.05 0.05 0.01 0.01 0.01 0.01 0.02
0.02 0.05 0.02 0.02 0.02 0.02 0.01 0.01 0.02
<0.01 <0.01 <0.01 0.02 <0.01 <0.01 <0.01 <0.01 <0.01
<0.01 <0.01 <0.01 <0.01 <0.01 <0.01 <0.01 <0.01 <0.01
<0.01 0.06 0.05 0.19 <0.01 0.03 0.02 <0.01 0.01
0.03 0.05 0.02 0.02 0.02 0.02 0.01 0.01 0.02
0.02 0.18 0.04 0.05 0.01 0.01 0.01 0.01 0.03
0.2 1.0 0.3 0.6 0.1 0.1 0.1 <0.1 0.2
91 98 97 94 89 96 97 96 97
<0.01 <0.01 0.02 0.07 <0.01 <0.01 <0.01 <0.01 <0.01
<5 <5 <5 <5 <5 <5 <5 <5 <5
<5 <5 <5 <5 <5 <5 <5 <5 <5
<5 <5 <5 <5 <5 <5 <5 <5 <5
<5 <5 <5 <5 <5 <5 <5 <5 <5
<10 <10 <10 <10 <10 <10 <10 <10 <10
<10 <10 <10 <10 <10 <10 <10 <10 <10
<10 <10 <10 <10 <10 <10 <10 <10 <10
<10 <10 <10 <10 <10 <10 <10 <10 <10
<5 <5 <5 <5 <5 <5 <5 <5 <5
<5 <5 <5 <5 <5 <5 <5 <5 <5
<5 <5 <5 <5 <5 <5 <5 <5 <5
<5 <5 <5 <5 <5 <5 <5 <5 <5
<10 <10 <10 <10 <10 <10 <10 <10 <10
<10 <10 <10 <10 <10 <10 <10 <10 <10
<10 <10 <10 <10 <10 <10 <10 <10 <10
<10 <10 <10 <10 <10 <10 <10 <10 <10
<10 <10 <10 <10 <10 <10 <10 <10 <10
NA NA NA NA NA NA NA NA NA
NA NA NA NA NA NA NA NA NA
NA NA NA NA NA NA NA NA NA
NA NA NA NA NA NA NA NA NA
NA NA NA NA NA NA NA NA NA
<0.1 <0.1 <0.1 <0.1 <0.1 <0.1 <0.1 <0.1 <0.1
<0.5 <0.5 <0.5 <0.5 <0.5 <0.5 <0.5 <0.5 <0.5
<0.5 <0.5 <0.5 <0.5 <0.5 <0.5 <0.5 <0.5 <0.5
<0.5 <0.5 <0.5 <0.5 <0.5 <0.5 <0.5 <0.5 <0.5
<1 <1 <1 <1 <1 <1 <1 <1 <1
<0.5 <0.5 <0.5 <0.5 <0.5 <0.5 <0.5 <0.5 <0.5
94 93 92 92 94 93 96 93 97
103 102 100 102 104 102 98 102 104
<0.5 <0.5 <0.5 <0.5 <0.5 <0.5 <0.5 <0.5 <0.5
NA NA NA NA NA NA NA NA NA
NA NA NA NA NA NA NA NA NA
NA NA NA NA NA NA NA NA NA
NA NA NA NA NA NA NA NA NA
NA NA NA NA NA NA NA NA NA
NA NA NA NA NA NA NA NA NA
NA NA NA NA NA NA NA NA NA
1130.46 953.46 314.00 281.23 211.23 233.69 857.57 2151.52 118.05
<0.01 <0.01 <0.01 <0.01 0.02 <0.01 <0.01 <0.01 <0.01
NA NA NA NA NA NA NA NA NA
6.95 7.10 7.45 7.31 7.31 7.34 7.13 7.13 7.40
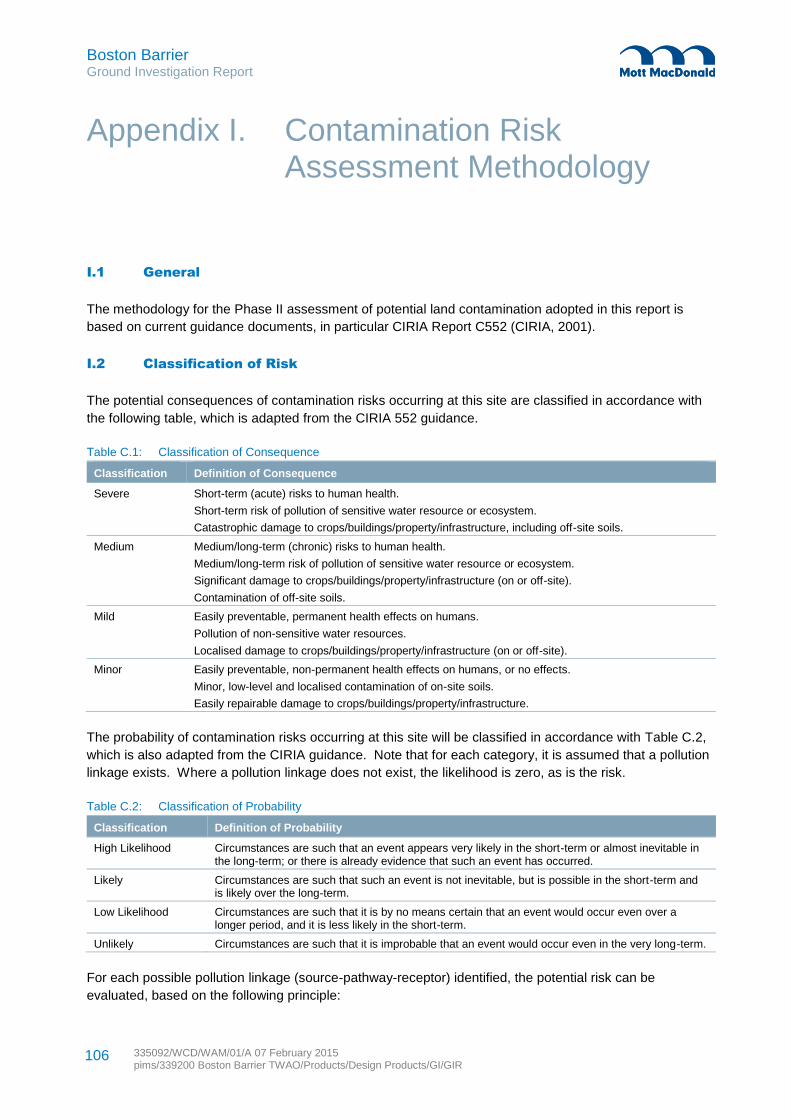
Boston Barrier Ground Investigation Report
335092/WCD/WAM/01/A 07 February 2015 pims/339200 Boston Barrier TWAO/Products/Design Products/GI/GIR
106
I.1 General
The methodology for the Phase II assessment of potential land contamination adopted in this report is
based on current guidance documents, in particular CIRIA Report C552 (CIRIA, 2001).
I.2 Classification of Risk
The potential consequences of contamination risks occurring at this site are classified in accordance with
the following table, which is adapted from the CIRIA 552 guidance.
Table C.1: Classification of Consequence
Classification Definition of Consequence
Severe Short-term (acute) risks to human health.
Short-term risk of pollution of sensitive water resource or ecosystem.
Catastrophic damage to crops/buildings/property/infrastructure, including off-site soils.
Medium Medium/long-term (chronic) risks to human health.
Medium/long-term risk of pollution of sensitive water resource or ecosystem.
Significant damage to crops/buildings/property/infrastructure (on or off-site).
Contamination of off-site soils.
Mild Easily preventable, permanent health effects on humans.
Pollution of non-sensitive water resources.
Localised damage to crops/buildings/property/infrastructure (on or off-site).
Minor Easily preventable, non-permanent health effects on humans, or no effects.
Minor, low-level and localised contamination of on-site soils.
Easily repairable damage to crops/buildings/property/infrastructure.
The probability of contamination risks occurring at this site will be classified in accordance with Table C.2,
which is also adapted from the CIRIA guidance. Note that for each category, it is assumed that a pollution
linkage exists. Where a pollution linkage does not exist, the likelihood is zero, as is the risk.
Table C.2: Classification of Probability
Classification Definition of Probability
High Likelihood Circumstances are such that an event appears very likely in the short-term or almost inevitable in the long-term; or there is already evidence that such an event has occurred.
Likely Circumstances are such that such an event is not inevitable, but is possible in the short-term and is likely over the long-term.
Low Likelihood Circumstances are such that it is by no means certain that an event would occur even over a longer period, and it is less likely in the short-term.
Unlikely Circumstances are such that it is improbable that an event would occur even in the very long-term.
For each possible pollution linkage (source-pathway-receptor) identified, the potential risk can be
evaluated, based on the following principle:
Appendix I. Contamination Risk Assessment Methodology
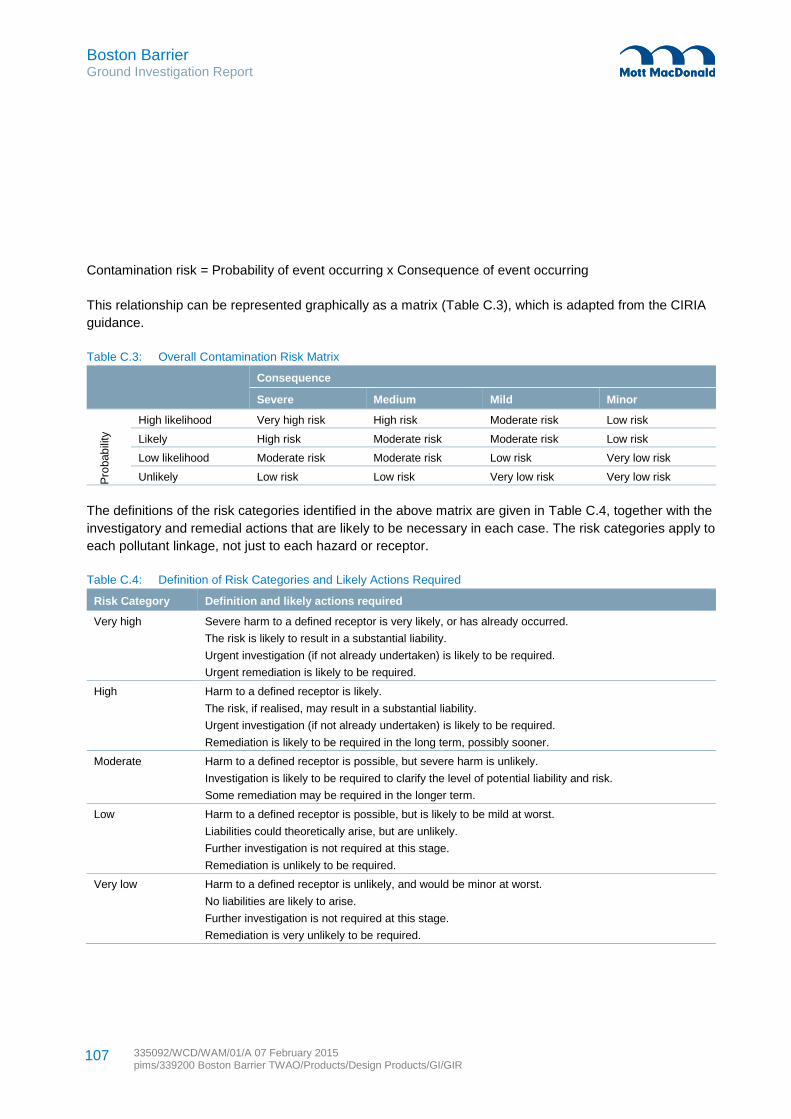
Boston Barrier Ground Investigation Report
335092/WCD/WAM/01/A 07 February 2015 pims/339200 Boston Barrier TWAO/Products/Design Products/GI/GIR
107
Contamination risk = Probability of event occurring x Consequence of event occurring
This relationship can be represented graphically as a matrix (Table C.3), which is adapted from the CIRIA
guidance.
Table C.3: Overall Contamination Risk Matrix
Consequence
Severe Medium Mild Minor
Pro
bab
ility
High likelihood Very high risk High risk Moderate risk Low risk
Likely High risk Moderate risk Moderate risk Low risk
Low likelihood Moderate risk Moderate risk Low risk Very low risk
Unlikely Low risk Low risk Very low risk Very low risk
The definitions of the risk categories identified in the above matrix are given in Table C.4, together with the
investigatory and remedial actions that are likely to be necessary in each case. The risk categories apply to
each pollutant linkage, not just to each hazard or receptor.
Table C.4: Definition of Risk Categories and Likely Actions Required
Risk Category Definition and likely actions required
Very high Severe harm to a defined receptor is very likely, or has already occurred.
The risk is likely to result in a substantial liability.
Urgent investigation (if not already undertaken) is likely to be required.
Urgent remediation is likely to be required.
High Harm to a defined receptor is likely.
The risk, if realised, may result in a substantial liability.
Urgent investigation (if not already undertaken) is likely to be required.
Remediation is likely to be required in the long term, possibly sooner.
Moderate Harm to a defined receptor is possible, but severe harm is unlikely.
Investigation is likely to be required to clarify the level of potential liability and risk.
Some remediation may be required in the longer term.
Low Harm to a defined receptor is possible, but is likely to be mild at worst.
Liabilities could theoretically arise, but are unlikely.
Further investigation is not required at this stage.
Remediation is unlikely to be required.
Very low Harm to a defined receptor is unlikely, and would be minor at worst.
No liabilities are likely to arise.
Further investigation is not required at this stage.
Remediation is very unlikely to be required.

Boston Barrier Ground Investigation Report
335092/WCD/WAM/01/A 07 February 2015 pims/339200 Boston Barrier TWAO/Products/Design Products/GI/GIR
108
Appendix J. Conceptual Site Model
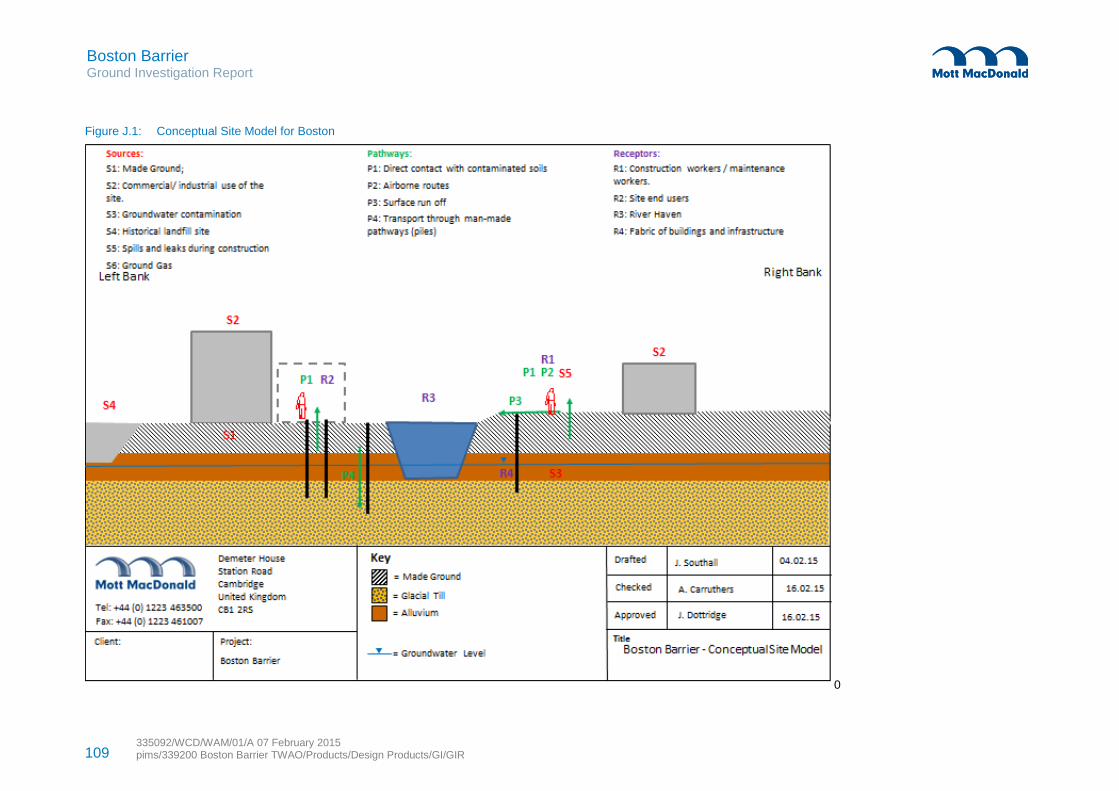
109 335092/WCD/WAM/01/A 07 February 2015 pims/339200 Boston Barrier TWAO/Products/Design Products/GI/GIR
Boston Barrier Ground Investigation Report
Figure J.1: Conceptual Site Model for Boston
0
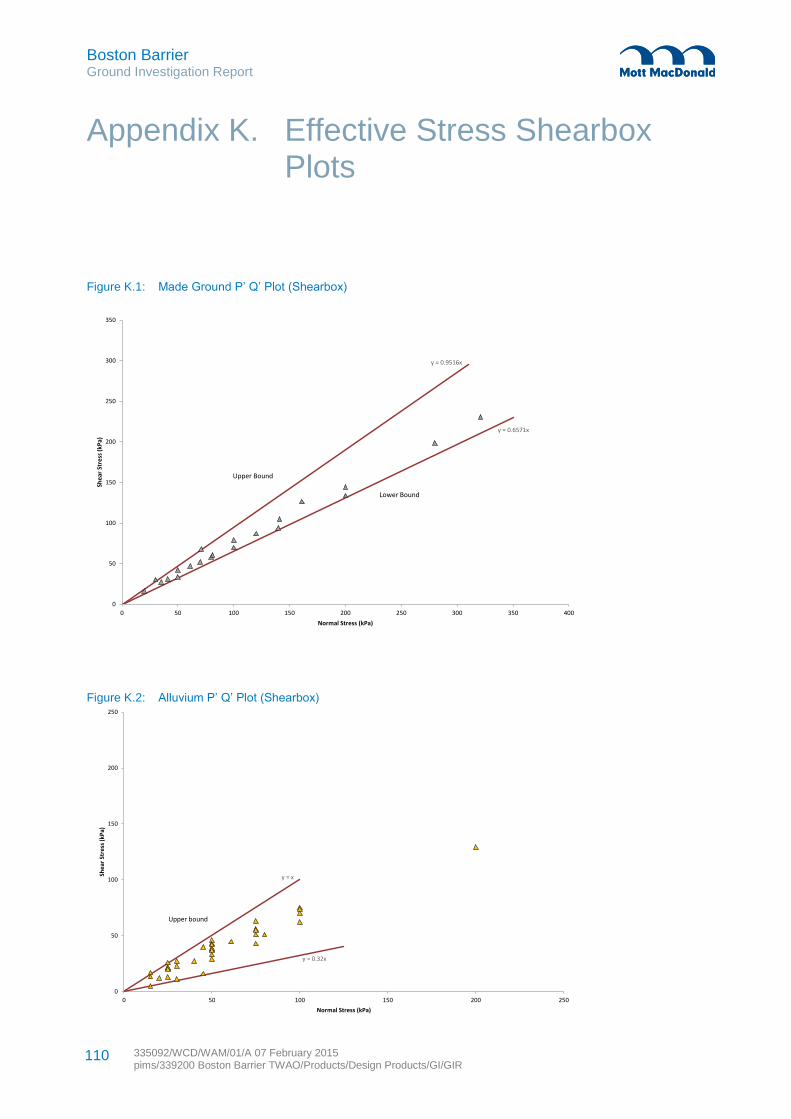
Boston Barrier Ground Investigation Report
335092/WCD/WAM/01/A 07 February 2015 pims/339200 Boston Barrier TWAO/Products/Design Products/GI/GIR
110
Figure K.1: Made Ground P’ Q’ Plot (Shearbox)
Figure K.2: Alluvium P’ Q’ Plot (Shearbox)
y = 0.6571x
y = 0.9516x
0
50
100
150
200
250
300
350
0 50 100 150 200 250 300 350 400
She
ar S
tre
ss (
kPa)
Normal Stress (kPa)
Lower Bound
Upper Bound
y = 0.32x
y = x
0
50
100
150
200
250
0 50 100 150 200 250
She
ar S
tre
ss (
kPa)
Normal Stress (kPa)
Upper bound
Appendix K. Effective Stress Shearbox Plots
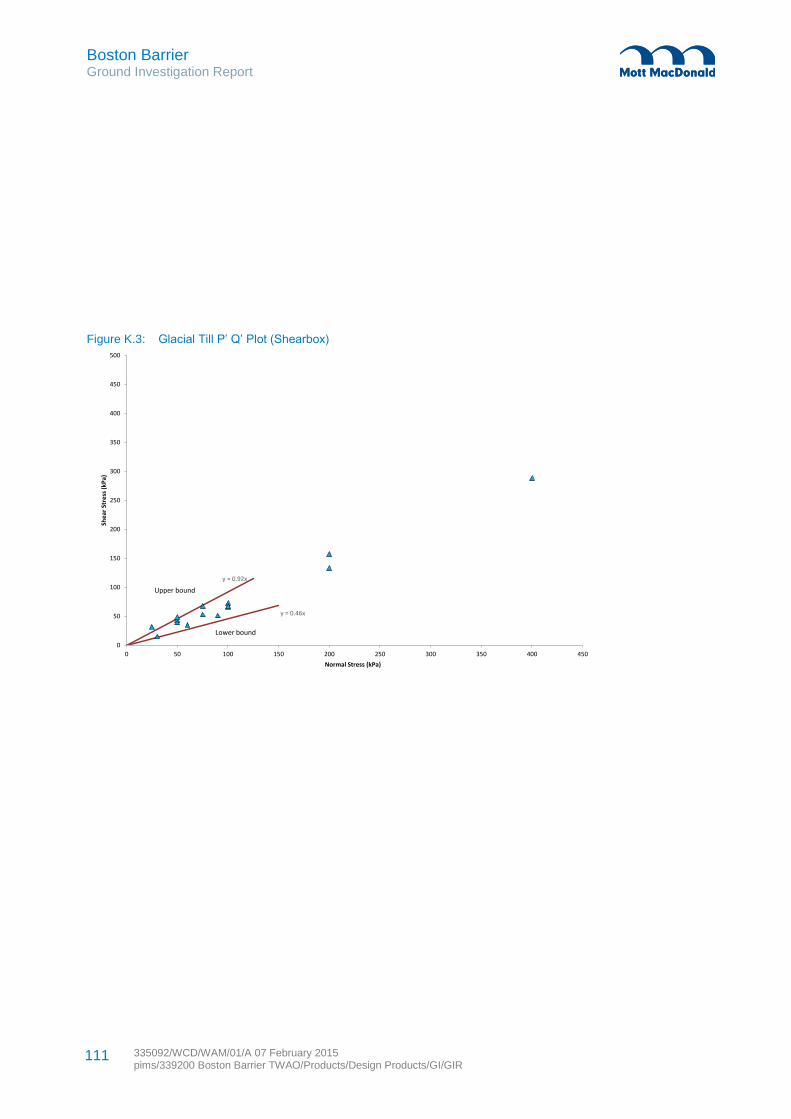
Boston Barrier Ground Investigation Report
335092/WCD/WAM/01/A 07 February 2015 pims/339200 Boston Barrier TWAO/Products/Design Products/GI/GIR
111
Figure K.3: Glacial Till P’ Q’ Plot (Shearbox)
y = 0.46x
y = 0.92x
0
50
100
150
200
250
300
350
400
450
500
0 50 100 150 200 250 300 350 400 450
She
ar S
tre
ss (
kPa)
Normal Stress (kPa)
Lower bound
Upper bound
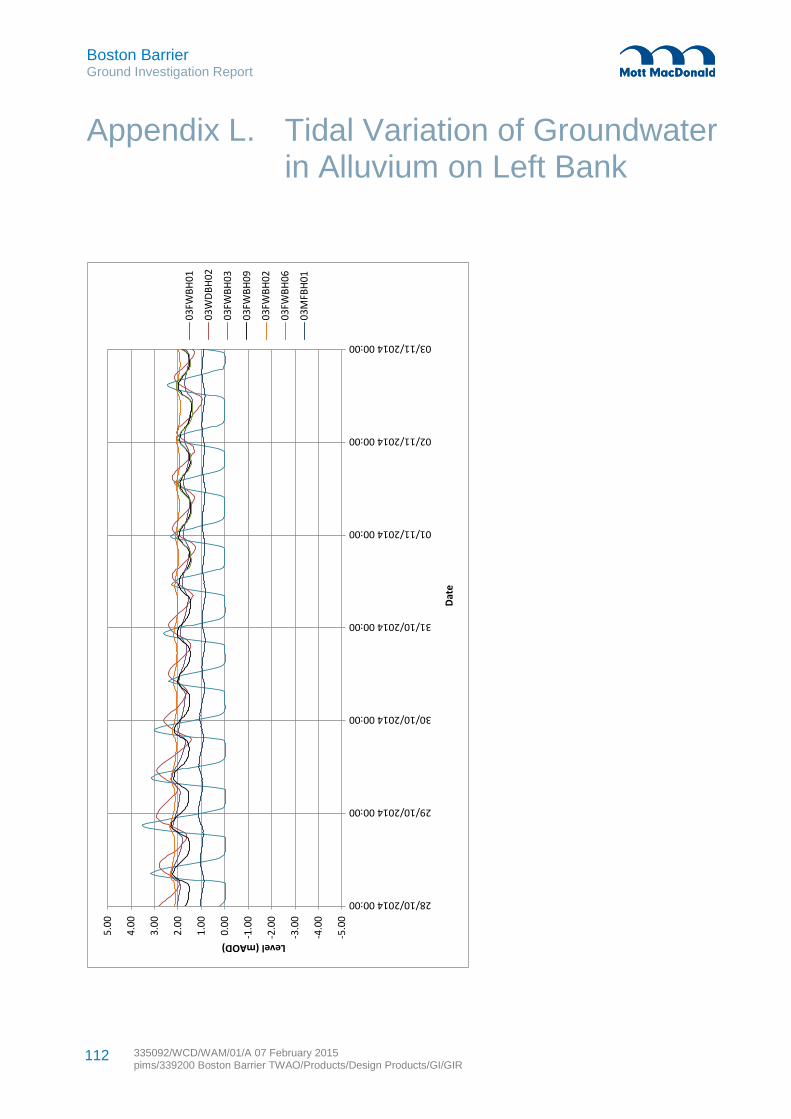
Boston Barrier Ground Investigation Report
335092/WCD/WAM/01/A 07 February 2015 pims/339200 Boston Barrier TWAO/Products/Design Products/GI/GIR
112
-5.0
0
-4.0
0
-3.0
0
-2.0
0
-1.0
0
0.00
1.00
2.00
3.00
4.00
5.00
28/10/2014 00:00
29/10/2014 00:00
30/10/2014 00:00
31/10/2014 00:00
01/11/2014 00:00
02/11/2014 00:00
03/11/2014 00:00
Level (mAOD)
Dat
e
03FW
BH
01
03W
DB
H02
03FW
BH
03
03FW
BH
09
03FW
BH
02
03FW
BH
06
03M
FBH
01
Appendix L. Tidal Variation of Groundwater in Alluvium on Left Bank
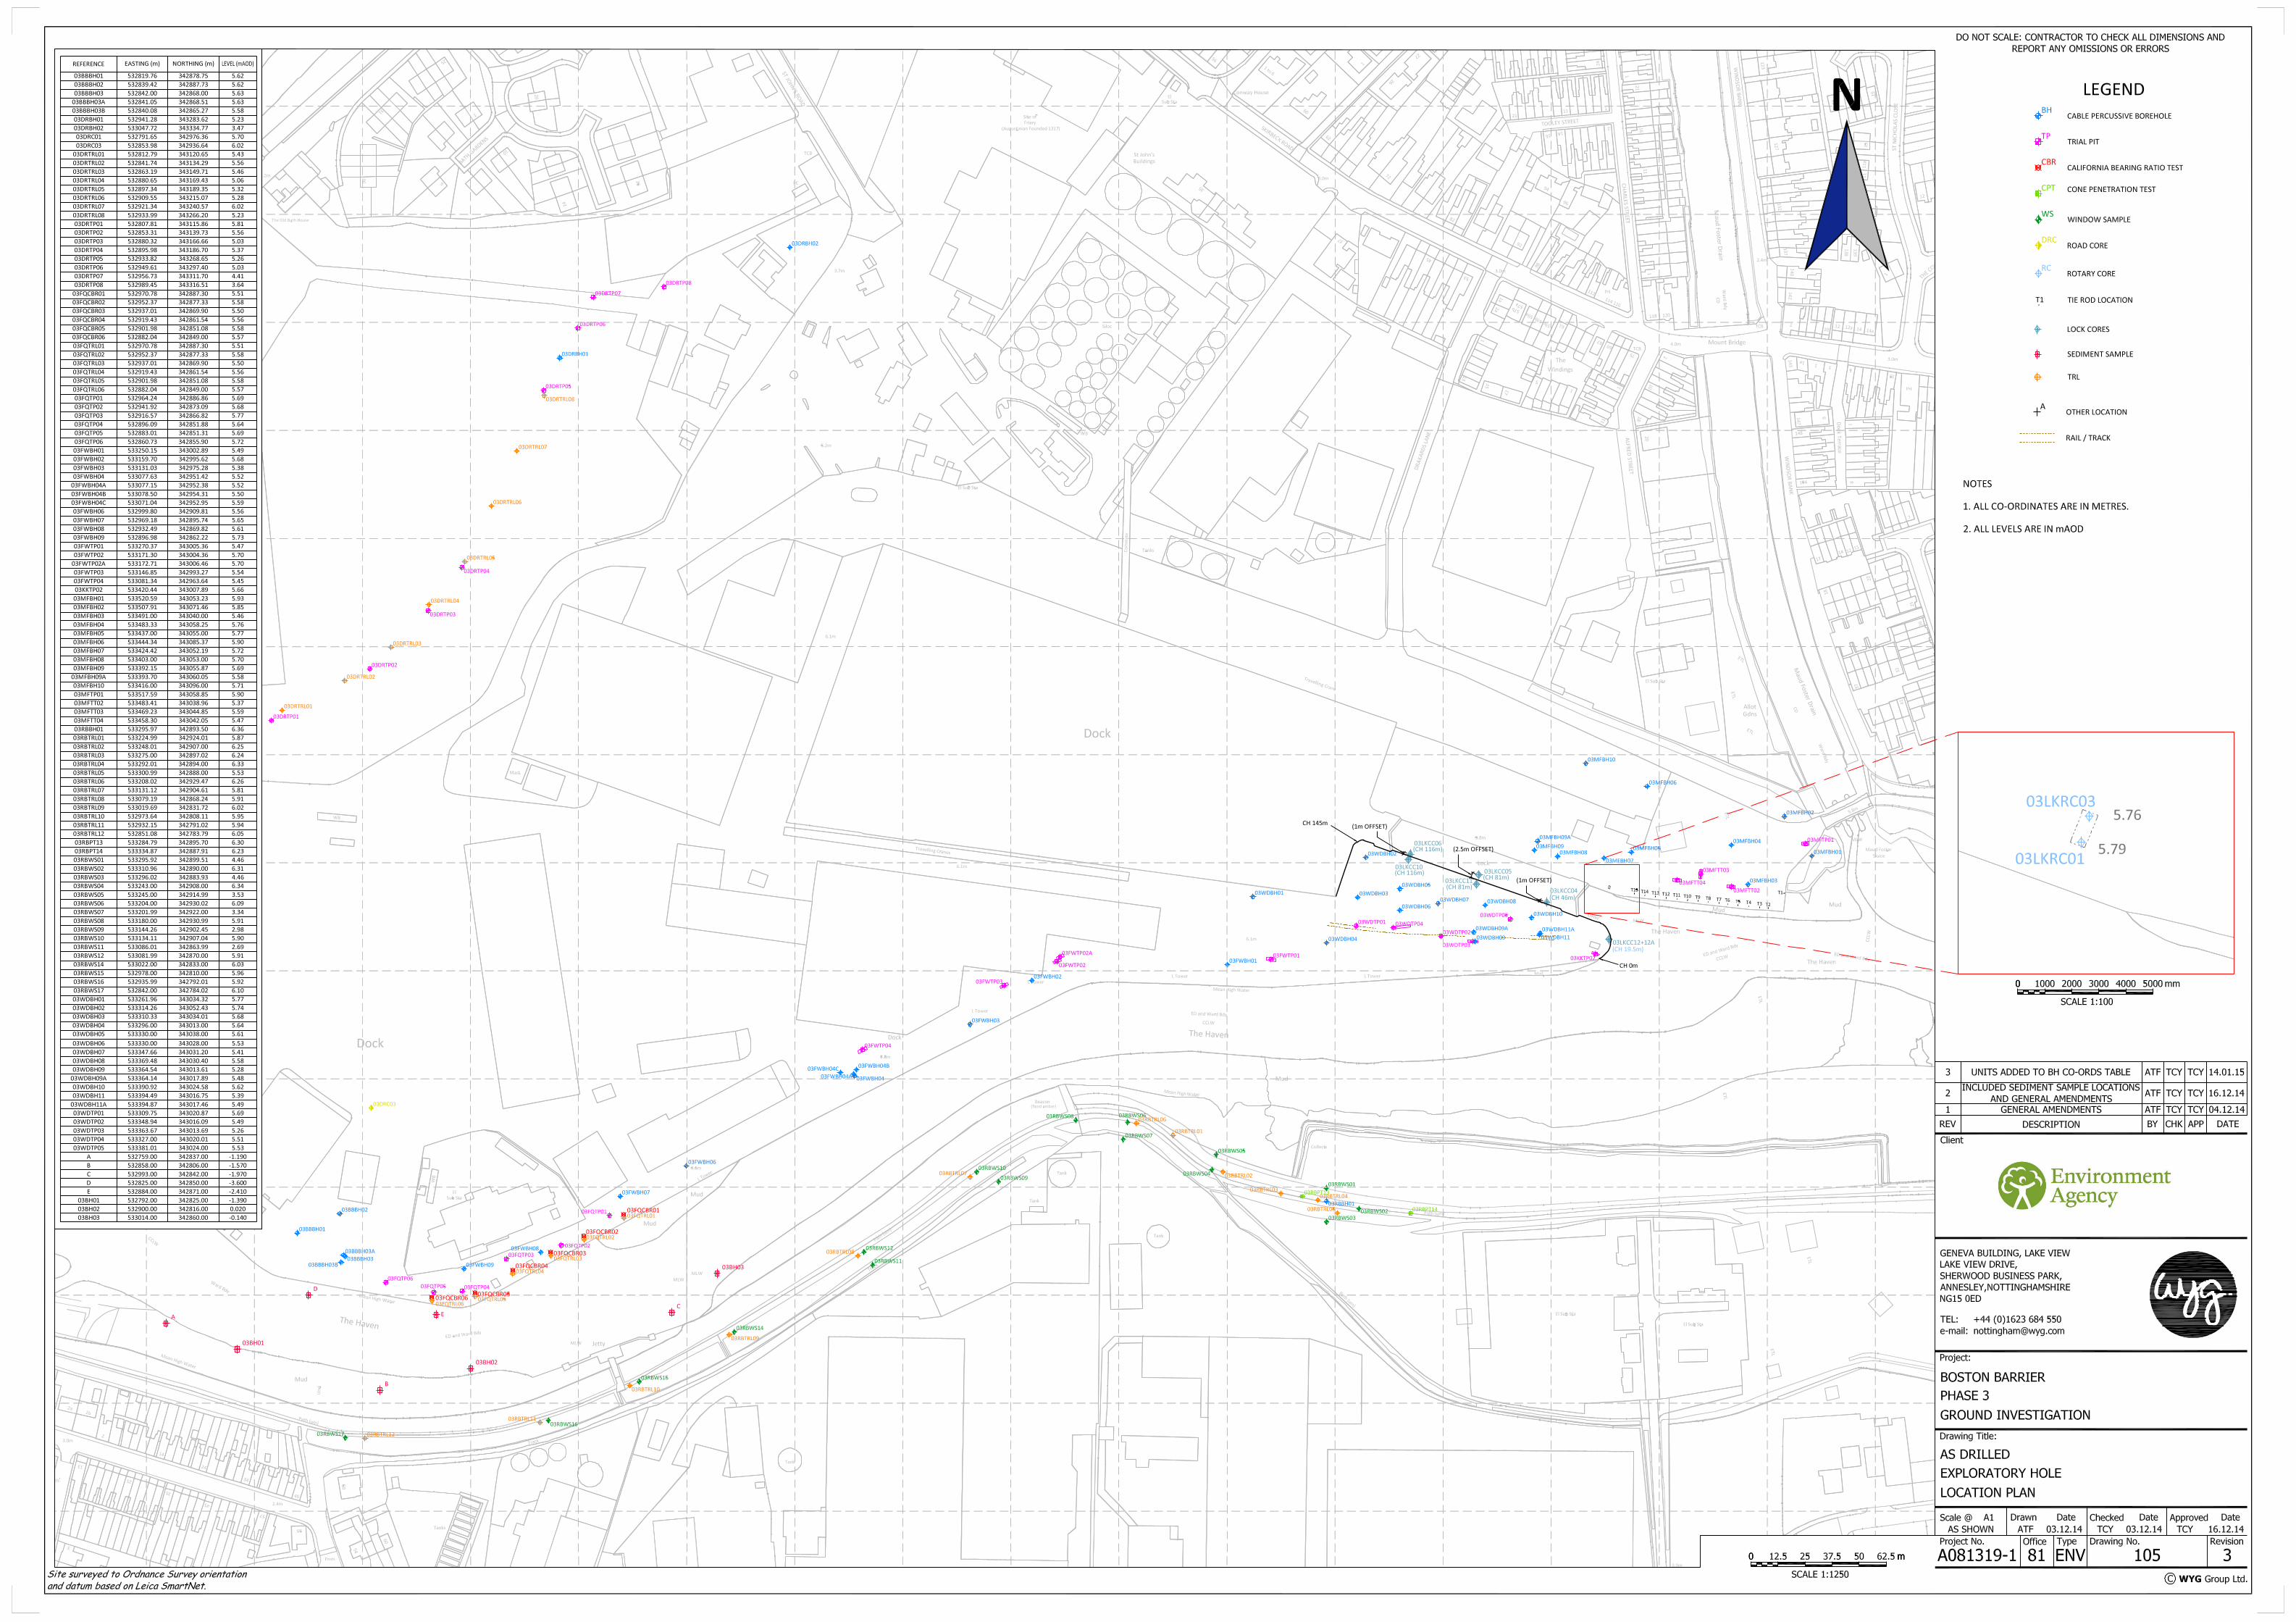


www.gov.uk/environment-agency


![Comprehensive Box Listing - Western University · A17-035-001 Harris Family Portrait Albums [Digitized] A17-035-002 Milly's photographic Album [Digitized] A17-035-003 Ronalds Album](https://static.fdocuments.us/doc/165x107/603c5a171d197267a3552f95/comprehensive-box-listing-western-university-a17-035-001-harris-family-portrait.jpg)