A WEB PROCESSING SERVICE FOR GNSS REALISTIC PLANNING · A WEB PROCESSING SERVICE FOR GNSS REALISTIC...
6
A WEB PROCESSING SERVICE FOR GNSS REALISTIC PLANNING Bianca Federici a , Davide Giacomelli b , Domenico Sguerso a , Alfonso Vitti b , Paolo Zatelli b a DICAT - Dipartimento di Ingegneria delle Costruzioni, dell’Ambiente e del Territorio Universit` a degli Studi di Genova 16145 Genova, ITALY (bianca.federici, domenico.sguerso)@unige.it b DICA - Dipartimento di Ingegneria Civile e Ambientale Universit` a degli Studi di Trento 38123 Trento, ITALY (alfonso.vitti, paolo.zatelli)@unitn.it Commission IV/5 KEY WORDS: GIS, Planning, GPS/INS, Internet, Services ABSTRACT: The spread presence of GNSS Permanent Station Networks makes satellite surveys simpler, quicker and cheaper, and the achievement of high precisions easier. However, the result of a GNSS campaign benefits from an accurate planning, especially in presence of natural or artificial obstructions that make satellite observations difficult. Most of the GNSS office suites provide planning tools to analyze the satellite’s visibility; visibility plots, sky plots and DOP charts are commonly built from the GNSS almanac. They usually allow planning on single points, taking into account the obstructions due to terrain morphology or buildings by hand-drawing polar diagrams after a visit of each location to be surveyed. This task can be made fully automatic by using a digital surface model to build the obstruction plot and the almanac to evaluate satellites’ positions, hence their visibility, in a GIS. The procedure may be applied to whole areas to find the best time for the survey campaign. Taking a step further, this approach has been made available as a service by creating a Web Processing Service, which allows also non GIS specialists to access this tool through a simple WebGIS interface. The user can select the satellites constellation, GPS or GPS and GLONASS, the cut-off elevation angle, the day, hour and temporal window of the survey. The service returns raster maps describing the minimum number of visible satellites and the PDOP index in every pixel. Moreover, the service implements some features of the UNAVCO TEQC software, which can help to choose the location of new permanent stations. The implementation follows the OGC specifications and relies fully on FOSS software, combining different systems to provide the user web interface, the data storage and the processing engine. The service features, the underlying technology and some examples will be presented in this paper. 1 INTRODUCTION The more and more spread presence of GNSS (Global Naviga- tion Satellite Systems) Permanent Station Networks makes the satellite survey techniques more simpler, quicker and cheaper, al- lowing the technician to easily obtain high precisions. However, the result and, above all, the speed of GNSS survey campaign get an advantage out of accurate planning, especially where the site to survey has characteristics that make the satellite observations difficult. Most of the GNSS office suites provide planning tools to analyze the satellites visibility. They usually allow planning on single points, taking into account the obstructions due to terrain morphology or buildings by hand-drawing polar diagrams after a visit of each location to be surveyed. A planning software, integrated in the Free and Open Source GIS GRASS, has been developed to make fully automatic the obstruc- tion determination, by using a digital surface model, and the cre- ation of realistic satellites visibility maps, on whole areas. Taking a step further, the procedure was made available as a service by creating a Web Processing Service, which allows also non GIS specialists to access this tool through a simple WebGIS interface. 2 GNSS PLANNING It is common practice to leave to operator experience and to unob- structed planning the choice of the best time to carry out GNSS measurements, relying the success of the survey on the grow- ing number of satellites available, of both NAVSTAR GPS and GLONASS constellations. Many of the available commercial software suites allow GNSS planning for individual points; they evaluate the number of visi- ble satellites from a given point over the horizon or over a given elevation angle (cut-off), and provide maps depicting their num- ber and their geometric configuration, the DOP (Dilution of Pre- cision) index, at different time steps during the selected time span (Figure 1). Figure 1: GNSS satellites number and PDOP plots from commer- cial software Manual introduction of obstructions and impediments to the sig-
Transcript of A WEB PROCESSING SERVICE FOR GNSS REALISTIC PLANNING · A WEB PROCESSING SERVICE FOR GNSS REALISTIC...

A WEB PROCESSING SERVICE FOR GNSS REALISTIC PLANNING
Bianca Federicia, Davide Giacomellib, Domenico Sguersoa, Alfonso Vittib, Paolo Zatellib
a DICAT - Dipartimento di Ingegneria delle Costruzioni, dell’Ambiente e del TerritorioUniversita degli Studi di Genova
16145 Genova, ITALY(bianca.federici, domenico.sguerso)@unige.it
b DICA - Dipartimento di Ingegneria Civile e AmbientaleUniversita degli Studi di Trento
38123 Trento, ITALY(alfonso.vitti, paolo.zatelli)@unitn.it
Commission IV/5
KEY WORDS: GIS, Planning, GPS/INS, Internet, Services
ABSTRACT:
The spread presence of GNSS Permanent Station Networks makes satellite surveys simpler, quicker and cheaper, and the achievementof high precisions easier. However, the result of a GNSS campaign benefits from an accurate planning, especially in presence of naturalor artificial obstructions that make satellite observations difficult. Most of the GNSS office suites provide planning tools to analyze thesatellite’s visibility; visibility plots, sky plots and DOP charts are commonly built from the GNSS almanac. They usually allow planningon single points, taking into account the obstructions due to terrain morphology or buildings by hand-drawing polar diagrams after avisit of each location to be surveyed. This task can be made fully automatic by using a digital surface model to build the obstructionplot and the almanac to evaluate satellites’ positions, hence their visibility, in a GIS. The procedure may be applied to whole areas tofind the best time for the survey campaign. Taking a step further, this approach has been made available as a service by creating a WebProcessing Service, which allows also non GIS specialists to access this tool through a simple WebGIS interface.The user can select the satellites constellation, GPS or GPS and GLONASS, the cut-off elevation angle, the day, hour and temporalwindow of the survey. The service returns raster maps describing the minimum number of visible satellites and the PDOP index inevery pixel. Moreover, the service implements some features of the UNAVCO TEQC software, which can help to choose the locationof new permanent stations.The implementation follows the OGC specifications and relies fully on FOSS software, combining different systems to provide the userweb interface, the data storage and the processing engine.The service features, the underlying technology and some examples will be presented in this paper.
1 INTRODUCTION
The more and more spread presence of GNSS (Global Naviga-tion Satellite Systems) Permanent Station Networks makes thesatellite survey techniques more simpler, quicker and cheaper, al-lowing the technician to easily obtain high precisions. However,the result and, above all, the speed of GNSS survey campaign getan advantage out of accurate planning, especially where the siteto survey has characteristics that make the satellite observationsdifficult. Most of the GNSS office suites provide planning toolsto analyze the satellites visibility. They usually allow planning onsingle points, taking into account the obstructions due to terrainmorphology or buildings by hand-drawing polar diagrams after avisit of each location to be surveyed.A planning software, integrated in the Free and Open Source GISGRASS, has been developed to make fully automatic the obstruc-tion determination, by using a digital surface model, and the cre-ation of realistic satellites visibility maps, on whole areas. Takinga step further, the procedure was made available as a service bycreating a Web Processing Service, which allows also non GISspecialists to access this tool through a simple WebGIS interface.
2 GNSS PLANNING
It is common practice to leave to operator experience and to unob-structed planning the choice of the best time to carry out GNSS
measurements, relying the success of the survey on the grow-ing number of satellites available, of both NAVSTAR GPS andGLONASS constellations.Many of the available commercial software suites allow GNSSplanning for individual points; they evaluate the number of visi-ble satellites from a given point over the horizon or over a givenelevation angle (cut-off), and provide maps depicting their num-ber and their geometric configuration, the DOP (Dilution of Pre-cision) index, at different time steps during the selected time span(Figure 1).
Figure 1: GNSS satellites number and PDOP plots from commer-cial software
Manual introduction of obstructions and impediments to the sig-

nal is usually possible but it requires burdensome on-site recon-naissance (Figure 2). Instead, the authors are not aware of soft-ware for a planning on large areas.
Figure 2: Polar skyplot with hand drawn obstructions
2.1 GNSS planning with GIS
A GNSS planning software has been developed (Fruet et al., 1999),(Sguerso and Zatelli, 1999), (Zatelli and D’Inca, 2004) and re-cently updated (Federici and Sguerso, 2009) as modules of theFree and Open Source GIS GRASS. It allows the identification ofoptimal areas to perform a survey in a given temporal window, orthe best time interval for a survey campaign in a certain area, tak-ing into account the realistic obstructions to satellite signals dueto terrain morphology and buildings automatically; moreover, itmay be applied to whole areas.Taking advantage of the GIS environment, the procedure for cre-ating maps of realistic satellites visibility, called realistic plan-ning, involves three logical steps: calculation of the obstructionsto satellite signals due to terrain morphology or buildings, deter-mination of the relative position of satellite-receiver and check ofthe visibility of each satellite, then creation of maps showing thenumber of visible satellites, PDOP (Positioning Dilution of Pre-cision) index and an index of visibility percentage, in each cell ofthe analyzed region.A first module, r.obstruction, determines realistic obstructions onthe area from three-dimensional models of the orographic surfaceand/or building (Digital Surface Models). The obstruction calcu-lation is based on the determination of the maximum elevation ofobstacles in the territory; this is done by determining the highestline of sight between all possible lines connecting the observationpoint at any other point in the DSM along a fixed azimuthal direc-tion. This operation, fully automatic, is performed for each cellscanning for the entire horizon, with azimuth resolution set bythe user, creating the polar pattern of obstruction for each point.The heavy computational calculation is counterbalanced by theneed to perform this calculation only once, whatever the periodin which GNSS planning has to be undertaken, assuming invari-ance of obstruction in time. The module r.obstruction requiresin input the DSM of the area under consideration, the azimuthalresolution and the cut-off angle, which represents the minimumobstruction angle.A second module, r.planning.static, determines the satellites po-sition at each time from the values of the Keplerian parameters,provided by the almanac file of the available GNSS constellation.
Then the relative positions between satellites and points on theground is obtained moving from the conventional celestial ref-erence system (CCRS) to a reference system locally defined withrespect to the barycentre of the area. The verification of the actualvisibility of each satellite is accomplished by comparing azimuthand elevation of obstructions and of satellites at given time. Incells where the number of realistically visible satellites is equalor greater than 4, the code is also able to evaluate the PDOP in-dex. Thus, realistic maps of satellite visibility and of PDOP areobtained, both evaluated for individual instants or for a time win-dow on whole areas defined by the operator. If queries are carriedout for a time window, the results are relative to the worst config-uration in each cells in the whole time interval, i.e. correspondingto the minimum number of satellite and to the maximum PDOPindex.This second module has been also integrated with the evaluationof an index of visibility percentage with respect to the numberof satellite potentially observable without obstructions, so to helpthe choice of the site for new GNSS permanent stations. Theimplementation of such index follows the criteria used by theTEQC software of UNAVCO for GNSS quality control (TEQCtoolkit for GNSS data pre-processing, 2010): the percentage ofthe number of observations actually acquired over the maximumacquirable without obstructions, for the whole day, is assessedwith a minimum cut-off angle of 5 degrees. In the current codethe evaluation of satellite availability and of number of satellitesrealistically visible taking into account the obstructions providedby the DSM, is made every five minutes and integrated over 24hours to finally get an overall percentage for the entire day. More-over, for a conservative design of permanent station, such esti-mates were made considering only the GPS constellation.The module r.planning.static requires in input the extension ofanalyzed area, the obstructions already determined by the previ-ous module, the GNSS almanac, the starting date and time andthe duration of the planning.
3 WPS FOR GPS PLANNING
3.1 OGC WPS
The pervasive availability of geographic information enables newusers to access and use them. However, geographic information isreally available to a large group of non specialists users only wheneasy and intuitive interface to data management and processingare deployed. The current trend in the field of geographic infor-mation management is to organize data collection through Sen-sor Observation Services on one hand and to cater to the users’processing needs using Web Processing Services (WPS) on theother.Such services, as defined by OGC (Open GIS Consortium Inc.,2007), provide geographic data processing capabilities, usuallythrough a Web or WebGIS interface, across a network. A WPSprovides also a standardized interface for the discovery and bind-ing of the geospatial processes by clients.The complexity of the model the WPS implements varies, but aspatial component of the data is always used. In most of the im-plementations some of the data are available on the server pub-lishing the WPS and some of the data are provided by the user:usually only simple maps or numerical parameters are requestedto the user.Different implementations of the OGC WPS 1.0.0 standard areavailable, the most used being FOSS projects, such as 52 North(52 North (52 North Geoprocessing Community), 2010), ZOOProject (ZOO Open WPS platform, 2010), Degree (Deegree -Free Software for Spatial Data Infrastructures, 2010) and PyWPS(PyWPS. an implementation of the Web processing Service stan-

dard from Open Geospatial Consortium, 2010). The latter is usedin the application described here.
3.2 WPS IMPLEMENTATION
The integration of the WPS in a WebGIS has been carried outusing PyWPS (PyWPS. an implementation of the Web process-ing Service standard from Open Geospatial Consortium, 2010).This choice is justified by the fact that PyWPS natively supportsGRASS GIS on one hand, and by the straightforward implemen-tation in the python language of the server side GRASS procedureon the other.With ease of use in mind, the user is requested to provide onlya few input parameters for the execution of the planning proce-dure. Other parameters are set to default values to simplify andmake more intuitive the user interface, choosing a set of valuessuitable for most of the situations. For example, in the currentinstance, the cut-off angle is set to 10 degrees and the ellipsoidused to evaluate the center of the area is always Hayford’s (alsoknown as “International”), since coordinates are provided in theItalian Gauss-Boaga/Rome40 datum.The user just chooses the interesting area, with the usual zoomand pan tools available in the WebGIS, the starting day and hourand the duration of the planning, with a dedicated interface, andwhich satellites’ constellation is to be used: GPS only (currently32 satellites) or GPS + GLONASS (currently 32 + 24 satellites)(Figure 3).
Figure 3: GNSS planning WPS interface
The almanac for the satellites’ ephemerides evaluation is auto-matically downloaded daily from ftp://ftp.trimble.com/pub/eph/.This almanac provides the whole necessary information about theephemerides for both GPS and GLONASS constellations. Onceall the input fields are complete, the process is started with anasynchronous call (thus the WebGIS interface can be used whilethe planning process runs in the background) to the PyWPS mod-ule on the server. The PyWPS module runs a GRASS script in-side a temporary GRASS mapset, which is deleted once the pro-cedure is completed. The analysis is performed on the whole
area visible when the procedure is started. Two GRASS mod-ules are used sequentially: r.obstruction creates the obstructionsfile and r.planning.static creates the maps containing the numberof visible satellites, the PDOP index and visibility percentage ofsatellites.The r.obstruction module can require long execution times, espe-cially if applied to a wide area. In principle, this module couldbe executed only once for a wide area: every time an user selectsa smaller area the relevant part of the obstruction file should beextracted and used by the r.planning.static module. However, thecurrent implementation of the r.planning.static module is not ableto extract subregions from an obstruction file, therefore this filemust be created every time according to the current region, se-lected by the user.To limit CPU load and running time, therefore the time the userwaits for the resulting maps, the resolution is automatically setso that a maximum number of cells has to be evaluated. This ob-viously means that a low resolution is used when large areas areselected: on the other hand this kind of analysis yields to interest-ing results only when an area reasonably interested by a satellitesurvey is selected. Still, the application of the procedure to largeareas can provide a reasonable idea of where problems due to alow number of visible satellites can occur, albeit on a low resolu-tion map.The process returns five output maps: number of visible satellites,at the planning starting time and the minimumn over the planningtime span, PDOP index, at the beginning of the planning and themaximum for the time window, and the minimum visibility per-centage for the time window. The process output consists of twoparts (Figures 4, 5 and 6):
1. five output maps of the r.planning.static module, as ASCII-GRID files, which are available for downloading through alink to a compressed folder containing them;
2. five new temporary layers in the WebGIS, inside their ownlayer tree, containing the same maps above. These new lay-ers provide a legend to the values of the maps.
For a more immediate interpretation, the maps so produced havebeen colored as follows:
• for the satellites visibility maps, red pixels represent areaswhere a GNSS survey is not possible because less than 4satellites are realistically visible; yellow, green and blue pix-els represent areas where the number of satellites is suf-ficient (4-7 satellites), good (8-11 satellites) or very good(more than 11 satellites) respectively;
• for the PDOP index maps, green pixels represent a good ge-ometric configuration of satellites (PDOP ≤ 3), while yel-low and red pixels represent sufficient (3 < PDOP < 7) andinadequate (PDOP ≥ 7 or not calculable if less than 4 satel-lites are observable) index values respectively;
• for the index of visibility percentage, green pixels are in-dicative of good satellite visibility (index ranging between80% and 100%), hence of sites suitable for the installationof new GNSS permanent stations; yellow and red pixels cor-respond to percentages respectively between 70% and 80%and less than 70%.
4 TESTS
Planning results from the WPS have been verified by comparingthe number of visible satellites to the number of satellites actually
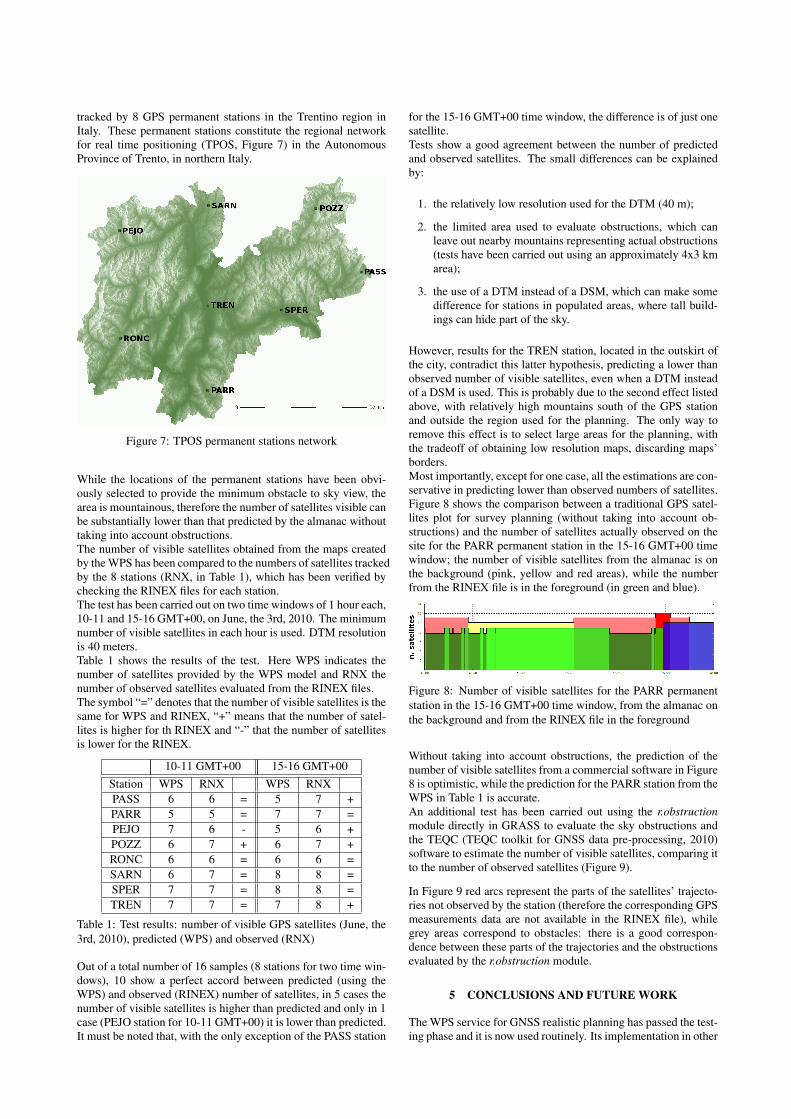
tracked by 8 GPS permanent stations in the Trentino region inItaly. These permanent stations constitute the regional networkfor real time positioning (TPOS, Figure 7) in the AutonomousProvince of Trento, in northern Italy.
Figure 7: TPOS permanent stations network
While the locations of the permanent stations have been obvi-ously selected to provide the minimum obstacle to sky view, thearea is mountainous, therefore the number of satellites visible canbe substantially lower than that predicted by the almanac withouttaking into account obstructions.The number of visible satellites obtained from the maps createdby the WPS has been compared to the numbers of satellites trackedby the 8 stations (RNX, in Table 1), which has been verified bychecking the RINEX files for each station.The test has been carried out on two time windows of 1 hour each,10-11 and 15-16 GMT+00, on June, the 3rd, 2010. The minimumnumber of visible satellites in each hour is used. DTM resolutionis 40 meters.Table 1 shows the results of the test. Here WPS indicates thenumber of satellites provided by the WPS model and RNX thenumber of observed satellites evaluated from the RINEX files.The symbol “=” denotes that the number of visible satellites is thesame for WPS and RINEX, “+” means that the number of satel-lites is higher for th RINEX and “-” that the number of satellitesis lower for the RINEX.
10-11 GMT+00 15-16 GMT+00Station WPS RNX WPS RNXPASS 6 6 = 5 7 +PARR 5 5 = 7 7 =PEJO 7 6 - 5 6 +POZZ 6 7 + 6 7 +RONC 6 6 = 6 6 =SARN 6 7 = 8 8 =SPER 7 7 = 8 8 =TREN 7 7 = 7 8 +
Table 1: Test results: number of visible GPS satellites (June, the3rd, 2010), predicted (WPS) and observed (RNX)
Out of a total number of 16 samples (8 stations for two time win-dows), 10 show a perfect accord between predicted (using theWPS) and observed (RINEX) number of satellites, in 5 cases thenumber of visible satellites is higher than predicted and only in 1case (PEJO station for 10-11 GMT+00) it is lower than predicted.It must be noted that, with the only exception of the PASS station
for the 15-16 GMT+00 time window, the difference is of just onesatellite.Tests show a good agreement between the number of predictedand observed satellites. The small differences can be explainedby:
1. the relatively low resolution used for the DTM (40 m);
2. the limited area used to evaluate obstructions, which canleave out nearby mountains representing actual obstructions(tests have been carried out using an approximately 4x3 kmarea);
3. the use of a DTM instead of a DSM, which can make somedifference for stations in populated areas, where tall build-ings can hide part of the sky.
However, results for the TREN station, located in the outskirt ofthe city, contradict this latter hypothesis, predicting a lower thanobserved number of visible satellites, even when a DTM insteadof a DSM is used. This is probably due to the second effect listedabove, with relatively high mountains south of the GPS stationand outside the region used for the planning. The only way toremove this effect is to select large areas for the planning, withthe tradeoff of obtaining low resolution maps, discarding maps’borders.Most importantly, except for one case, all the estimations are con-servative in predicting lower than observed numbers of satellites.Figure 8 shows the comparison between a traditional GPS satel-lites plot for survey planning (without taking into account ob-structions) and the number of satellites actually observed on thesite for the PARR permanent station in the 15-16 GMT+00 timewindow; the number of visible satellites from the almanac is onthe background (pink, yellow and red areas), while the numberfrom the RINEX file is in the foreground (in green and blue).
Figure 8: Number of visible satellites for the PARR permanentstation in the 15-16 GMT+00 time window, from the almanac onthe background and from the RINEX file in the foreground
Without taking into account obstructions, the prediction of thenumber of visible satellites from a commercial software in Figure8 is optimistic, while the prediction for the PARR station from theWPS in Table 1 is accurate.An additional test has been carried out using the r.obstructionmodule directly in GRASS to evaluate the sky obstructions andthe TEQC (TEQC toolkit for GNSS data pre-processing, 2010)software to estimate the number of visible satellites, comparing itto the number of observed satellites (Figure 9).
In Figure 9 red arcs represent the parts of the satellites’ trajecto-ries not observed by the station (therefore the corresponding GPSmeasurements data are not available in the RINEX file), whilegrey areas correspond to obstacles: there is a good correspon-dence between these parts of the trajectories and the obstructionsevaluated by the r.obstruction module.
5 CONCLUSIONS AND FUTURE WORK
The WPS service for GNSS realistic planning has passed the test-ing phase and it is now used routinely. Its implementation in other

Figure 9: Skyplot for the TREN site, with obstruction fromGRASS’s r.obstruction module; red archs represent the parts ofthe satellites’ trajectories not observed by the station, grey areascorrespond to obstacles
WebGIS services covering other Italian regions is under way.The sequence of the two GRASS modules implemented in theWPS is very useful for an optimum choice of time intervals andof the organization of measurement sessions in complex areas.Tests indicate a good reliability of the prediction of the num-ber of satellites resulting from the WPS output maps; when thenumbers of visible satellites do not agree, the difference is smalland the prediction is conservative. Additional tests have beenplanned, involving scattered points, different from permanent sta-tions, where obstructions can be more problematic in terms of re-duction of the number of visible satellites. The accuracy of theevaluation of the PDOP index by the r.planning.static module hasbeen already evaluated in independent tests.
Future work will consist in:
• the use of the Shuttle Radar Topography Mission (SRTM)digital elevation model (Official NASA SRTM site, 2010) orthe ASTER Global Digital Elevation Model (ASTER GlobalDigital Elevation Map. NASA, 2010), extending the avail-ability of the WPS to all the regions where these DTMs areavailable (from 56◦ S to 60◦ N for the SRTM dataset, from83◦ S to 83◦ N for the ASTER dataset); the application ofthe procedure should be accurate even for areas where onlylower resolution (three-arc-second, approx. 90-meter) dataare available if the SRTM dataset is used, the ASTER 30meters resolution is higher than the one used in our tests;
• the implementation of a “multi-station network” mode topredict the number of common visible satellites for a set ofpermanent stations and a position selected by the user;
• the implementation of an additional procedure to assess thevariability of the estimated parameters (number of visiblesatellites and PDOP) within the time span of the planning;
• the implementation of the WPS for other datums than theItalian Gauss-Boaga/Rome40 one and the possibility of tak-ing into account the local time offset to the GMT in the user
interface of the WPS, making its use more intuitive for theuser;
• the possibility to evaluate satellites’ visibility for single 2D(on a DTM or DSM) or 3D points or lines.
ACKNOWLEDGEMENTS
This research is partially founded by Ministero dell’Istruzione,dell’Universita e della Ricerca (MIUR) within the MIUR-COFIN2007 ”Interoperability and cooperative management of geographic,dynamic, multidimentional and distributed data with Free andOpen Source GIS” project.
REFERENCES
52 North (52 North Geoprocessing Community), 2010.http://52north.org/wps (accessed 18 May 2010).
ASTER Global Digital Elevation Map. NASA, 2010.http://asterweb.jpl.nasa.gov/gdem.asp (accessed 18 May 2010).
Deegree - Free Software for Spatial Data Infrastructures, 2010.http://www.deegree.org/ (accessed 18 May 2010).
Federici, B. and Sguerso, D., 2009. Planning GNSS realistico perapplicazioni statiche e cinematiche. Bollettino SIFET sessionescientifica, ISSN: 1721-971X 1(1), pp. 79–93.
Fruet, G., Sguerso, D. and Zatelli, P., 1999. Planning GPS au-tomatico con ostruzioni realistiche. In: Atti del convegno: “3aConferenza nazionale delle Associazioni Scientifiche per le In-formazioni Territoriali ed Ambientali”, Napoli.
Official NASA SRTM site, 2010. http://www2.jpl.nasa.gov/srtm/(accessed 18 May 2010).
Open GIS Consortium Inc., 2007. OpenGIS Web Processing Ser-vice Implementation Specication, OpenGIS Standard 05-007r7.http://www.opengeospatial.org/standards/wps (accessed 18 May2010).
PyWPS. an implementation of the Web processing Ser-vice standard from Open Geospatial Consortium, 2010.http://pywps.wald.intevation.org/ (accessed 18 May 2010).
Sguerso, D. and Zatelli, P., 1999. Planning of kinematic GPSincluding realistic obstacles description. In: XXII General As-sembly of IUGG, Birmingham, UK.
TEQC toolkit for GNSS data pre-processing, 2010. UNAVCO:http://facility.unavco.org/software/teqc/teqc.html (accessed 18May 2010).
Zatelli, P. and D’Inca, D., 2004. New modules for satellite sur-veying planning in GRASS. Geomatics Workbooks 3, pp. 1–14.
ZOO Open WPS platform, 2010. http://www.zoo-project.org/(accessed 18 May 2010).

Figure 4: GNSS planning WPS output and download: number of visible satellites
Figure 5: GNSS planning WPS output and download: PDOP
Figure 6: GNSS planning WPS output and download: % of visible satellites with respect to the maximum available without obstructions