A Web Based Voting Application Software Design · The Information Technology and Innovation...
26
The Information Technology and Innovation Foundation Accessible Voting Technology Initiative Working Paper Series Working Paper #015 A Web Based Voting Application Software Design Linda Harley, Shaun Mosley, Adrienne Jones, Andrew Baranak, Keith Kline, and Brad Fain December 2013 The Information Technology and Innovation Foundation 1101 K Street NW, Suite 610 Washington, DC 20005 (202) 449-1351 This research was supported by the U.S. Election Assistance Commission (EAC) under grant number EAC110149B. Any opinions, findings, conclusions or recommendations expressed in this report are those of the authors and do not necessarily represent the views of EAC or ITIF.
Transcript of A Web Based Voting Application Software Design · The Information Technology and Innovation...

The Information Technology and Innovation Foundation
Accessible Voting Technology Initiative
Working Paper Series
Working Paper #015
A Web Based Voting Application Software Design
Linda Harley, Shaun Mosley, Adrienne Jones, Andrew Baranak, Keith Kline, and Brad Fain
December 2013
The Information Technology and Innovation Foundation 1101 K Street NW, Suite 610
Washington, DC 20005 (202) 449-1351
This research was supported by the U.S. Election Assistance Commission (EAC) under grant number EAC110149B. Any opinions, findings, conclusions or recommendations expressed in this report are those of the authors and do not necessarily represent the views of EAC or ITIF.

Executive Summary The Information Technology and Innovation Foundation (ITIF) web based voting application, henceforth
referred to as “Voting App,” is a test bed developed to conduct accessible voting research studies. One
critical design decision was to ensure that the Voting App would be platform independent since the
testing would be done on a regular computer or a tablet of any type. The Voting App software needed
to be easy to maintain and modify. In this working paper, the overall system architecture for the Voting
App is described, as well as the user interface considerations. One key element that makes this Voting
App a test bed is that the software contains an event logging system that captures user selections and
system performance along with time stamps. This provides the ability to quantify user performance.
Therefore, event logging is also discussed in this paper.
The Voting App is built upon the jQuery Mobile framework and jQuery programming language making it
a web based application capable of rendering through an internet browser. One benefit of developing a
web app is that the code had to be maintained only in one language as opposed to multiple platform
languages. The overall system architecture flow involved the following: selecting the ballot to be
completed, entering a participant identification number, configuring the testing condition setup,
retrieving the appropriate ballot, rendering files to build the ballot, and then displaying the ballot in the
ballot viewer. The Voting App was designed to be streamlined, mostly text and few images and no
videos to ensure that the processing speed was optimized.
The Voting App was designed to mitigate errors and be efficient, versatile, learnable, memorable,
effective, and usable for all voters across a variety of device types. Errors were mitigated by notifying
users of errors immediately after they were committed. Efficiency was achieved by minimizing the
number of button presses required to complete a task. Versatility was achieved by testing and ensuring
that the Voting App did indeed function on a variety of devices. Learnability and memorability were
achieved by creating a minimalistic interface with few commands, a consistent layout, and readable
displays. Effectiveness and user satisfaction of various design considerations were evaluated in the
empirical studies.
The iPad version of the Voting App was designed to use Apple’s Voiceover screen reader. This allows
individuals with visual impairment to operate the Voting App through the iPad touchscreen voiceover
controls. In addition, the Voting App interfaces with the Komodo Tecla Shield accessible switches
through the iPad. The Komodo Tecla Shield can attach to various accessible switches, such as tactile
buttons and sip and puff. This allows for greater accessibility of the overall design.
The event logger makes the Voting App a proper test bed in that it allows for the collection of time
stamped events that are generated by the user. All of the selections made by users and any warning
errors (such as overvotes and undervotes) are logged. In this paper the schema that was used to
generate these data are discussed. In particular, the schema involved a time stamp, an overall event
type, followed by a more detailed event tile that contained an event state. The data were comma
separated values in a text file and thus were pretty flat. From this data the variables that provided
insight into voting performance (e.g., number of over-votes or candidate selection time) were

calculated. This was vital data used to evaluate the various different configurations of the Voting App
tested in the other research studies.

Table of Contents Executive Summary ....................................................................................................................................... 2
Introduction .................................................................................................................................................. 6
System Architecture ...................................................................................................................................... 7
Components .............................................................................................................................................. 8
Limitations .............................................................................................................................................. 12
Future Improvements ............................................................................................................................. 13
User Interface ............................................................................................................................................. 14
Requirements .......................................................................................................................................... 14
Overall Design ......................................................................................................................................... 14
Design for iPad ........................................................................................................................................ 17
Future Improvements ............................................................................................................................. 18
Event Logging .............................................................................................................................................. 19
Schema .................................................................................................................................................... 19
Calculations and Variables ...................................................................................................................... 21
Conclusion ................................................................................................................................................... 24
Acknowledgments ....................................................................................................................................... 25
References .................................................................................................................................................. 26
List of Figures
Figure 1. High-level Voting App system architecture diagram ..................................................................... 8
Figure 2. Ballot selection page. ................................................................................................................... 10
Figure 3. User ID information page. ............................................................................................................ 10
Figure 4. Example of the write in onscreen keyboard. ............................................................................... 11
Figure 5. Settings configuration page. ........................................................................................................ 11
Figure 6. Ballot Welcome page ................................................................................................................... 12
Figure 7. Candidate page of the Voting App ............................................................................................... 15
Figure 8. The NiceScroll3 plugin enabled scrolling within windows on a ballot page. ............................... 17
List of Tables
Table 1. Possible Event Descriptions for Voting Ballot Logs. ...................................................................... 20

List of Equations
Equation 1. Write-in Time ........................................................................................................................... 21
Equation 2. Click Time ................................................................................................................................. 21
Equation 3. Response Time ......................................................................................................................... 22
Equation 4. Race Time ................................................................................................................................ 22
Equation 5. Percent Correct ........................................................................................................................ 22
Equation 6. Prompt Time ............................................................................................................................ 23

Introduction The Information Technology and Innovation Foundation (ITIF) web based voting application, henceforth
referred to as “Voting App,” was created to serve as a stable and extensible test bed for various research
studies. A test bed is any device, facility, or means for testing something in development (Merriam-
Webster, 2013). The Voting App adheres to this definition because it allowed for variability by
constructing various graphical interface configurations, creating different ballots from various
templates, and allowing various forms of user input to allow for various test conditions.
Currently there are centers around the US that are in the process of developing usable and accessible
voting systems. The EZ Ballot has been designed with a simple and consistent linear structure (Lee et al.,
2012). That is, voters are always presented with a binary option “yes” and “no” to progress linearly
through the ballot. It is currently being investigated to understand its usability. The EZ Ballot is built on
proprietary software created by Georgia Tech’s CATEA laboratory.
The Anywhere Ballot has posed the challenge of “What if anyone, anywhere, could vote on any device?”
(Davies 2013). They set out to create a fully functional and operational ballot to be implemented on any
device. The software is being developed by AIGA Design for Democracy. The code is based in WordPress,
which offers its own set of unique problems with time delays of data processing.
Prime III, an accessible voting system that has been deployed on a limited basis in real elections, has
been developed at Clemson University. Prime III uses proprietary software that runs on a Microsoft
tablet PC (Williams et al. 2013). The software runs on a bootable DVD for security purposes. Voters use
either a touch screen or a voice enabled headset with binary switch to navigate through the ballot. Once
the ballot is cast, the tablet PC prints out a readable ballot that is then optically scanned to record the
vote.
All of these systems have had a profound impact on furthering the knowledge of usability and
accessibility of voting systems on tablets. However, the purposes of these voting systems are to find the
optimal solutions, whereas the purpose of the Voting App was to serve as a test bed to allow testing
fundamental concepts of usability and accessibility. In addition, the Voting App was to be usable by the
visually impaired community. The Voting App was required to be platform independent (Windows, Mac,
Linux, etc.) to maximize the populations reached by being available on various technologies. Also, to
ensure the system was able to be used at the polls or in the home, the Voting App was developed to
work on tablets. While working within those constraints, various configurations were evaluated to
create an optimal user experience.

System Architecture For the Voting App to work on various platforms, the system architecture was designed with a focus on
web applications. With a web base, the Voting App would be able to operate properly on desktops,
laptops, and tablets. Although web apps were the appropriate avenue for this design, there were some
trade-offs to consider with selecting a web app over platform specific programs including processing
speed, accessibility to device hardware, and operating system specific programs.
Processing speed was an important trade-off as it can have a large impact on usability; delays between
user input and system responses can cause errors and confusion. Users may notice more latency with
the web version than with a platform specific application (i.e., iOS app). With poor connection quality,
the lag can be very noticeable. To combat this issue, the Voting App was designed to be as lightweight as
possible. The Voting App featured simple text and lightweight graphics designed for mobile devices. This
mitigated downloading issues because there were no large images or other heavy objects that the
Voting App needed to retrieve via the network.
The next trade-off was the accessibility to device hardware. For example, if the system needed to use
the tablet’s camera to save a user headshot, it was not guaranteed that the device would give the web
browser access to the device’s camera. This may seem minor, but does limit some options for future
development such as monitoring device orientation or capturing photos of paper documents. However,
these specific and other potential functions were not seen as high priorities because the basic
functionality of navigating through the ballot by clicking or touching was still available regardless of the
platform. In addition, some devices already allow web apps access to their hardware and the trend
seems to be that more devices may start supporting this feature.
Lastly was the trade-off about creating and maintaining individual programs for separate operating
systems. Although this was an option, it was not the best solution. Keeping up with a code base for at
least three different platforms could quickly become overwhelming to manage. For example, features
available on the iPad may not match those available on the Android or Linux versions and require
additional resources to make them all match. In addition, device specific functionality may not be
supported by other devices and operating systems and could cause a further schism between the
experiences of the app on various platforms. One potential solution was to use programs such as
PhoneGap that assists with creating native apps from one code source. Although this would create
applications for mobile devices, it did not resolve the issue of having a version available to be used on
desktop computers.
Although there were a few trade-offs to using a web based application, the benefits of having one
source of code working across many platforms outweighed all of the costs against it for this specific
application.

Components The Voting App was built upon the jQuery Mobile framework and the jQuery programming language.
jQuery Mobile was used because of its popularity, documentation, support resources and because it is a
powerful tool used in web development to create applications targeted for mobile devices across
multiple platforms. The framework handles the majority of the layout and interactions the Voting App
uses, but this will be further discussed in the User Interface section. This section discusses how the
system was divided into several subcomponents responsible for handling different operations of the
Voting App. The diagram shown in Figure 1 illustrates a simple formation and flow of the components.
Figure 1. High-level Voting App system architecture diagram
The Voting App started with the Ballot Selection page. The user was given a list of all available ballots
and was prompted to click on one to begin the voting process. Error! Reference source not found.
shows an example of the Ballot Selection stage and the choices available. All of these ballots were
specifically created for research studies described in several other working papers (Harley et al., 2013a,
2013b, 2013c; Kline et al., 2013).
Once a user selected the ballot of choice, the Voting App prompted the researcher to input User ID
Information (Figure 3). The user clicked the button labeled “Write In” and an onscreen keyboard
appeared for typing in the participant identification. The researcher then accepted the input to continue
with the process (Figure 4). The purpose of the User ID Information page was to capture the participant
identification number to ensure the data collected was de-identified.
Once the user information was entered, the Event Logging started. This component was responsible for
storing information about the user’s performance selections inside the Voting App. The event logger was

responsible for monitoring all of the voter’s interactions with the system – every click was recorded. For
more information and a detailed description on how Event Logging worked, please refer to the Event
Logging section.
At the same moment that Event Logging began, the browser jumped to the Settings Configuration page
(Figure 5). This page allowed the experimenter to configure the layout, language, font type, and other
data relevant to the research study. The following values were controlled and set to a default inside of
the code - font type, font size, user input interface device, ballot ID, and layout. Research studies
unveiled the optimal configuration and were set as system defaults (Harley et al., 2013a, 2013b, 2013c).
Once the options have been set and the experimenter selects the “Start” button, the system retrieved
the data and compiled the actual ballot.
The Voting App utilized the File Retrieval component to obtain the needed ballot template file to
function properly. This ballot template file contained all of the information about the contests: offices
open; candidates running; party affiliations; and all other content that appeared inside of the ballot for
voters to see. If the Voting App was set to another language (Spanish or Chinese), it used the File
Retrieval component to fetch a special translated ballot template file as well as a language file before it
added the contests to the Voting App (Kline et al., 2013). This language file hosted the majority of the
translations needed and acted as a translator for most of the content that existed inside the Voting App.
Once the Voting App retrieved all files needed from the server, the ballot data were passed from the File
Retrieval onto the Ballot Builder component, which converted this information into a format viewable
inside the browser. Based on the information given by the template, the layout was generated for each
page of the ballot, and the contest information was filled into the application. Upon completion of
loading, the user was brought to the Welcome Page of the ballot to begin the voting process (Figure 6).
At this point, all of the content existed inside of the Voting App, and all interaction was handled within
the browser via the Ballot Viewer component. Users followed the onscreen instructions and navigated
their way through the ballot voting, as they desired. The Ballot Viewer was aimed to operate as closely
to traditional voting systems and provided users the ability to steer through pages, select candidates,
review their votes, and submit their ballot. In addition, the Ballot Viewer was responsible for handling
errors and providing users with feedback about any mistakes that may have been made. Information
concerning the system’s interactions and notification system is detailed in the User Interface section.
Once users have completed and submitted their ballot, they were returned to the main Ballot Selection
menu and allowed to begin voting on another ballot if they wished to do so.

Figure 2. Ballot selection page.
Figure 3. User ID information page.

Figure 4. Example of the write in onscreen keyboard.
Figure 5. Settings configuration page.
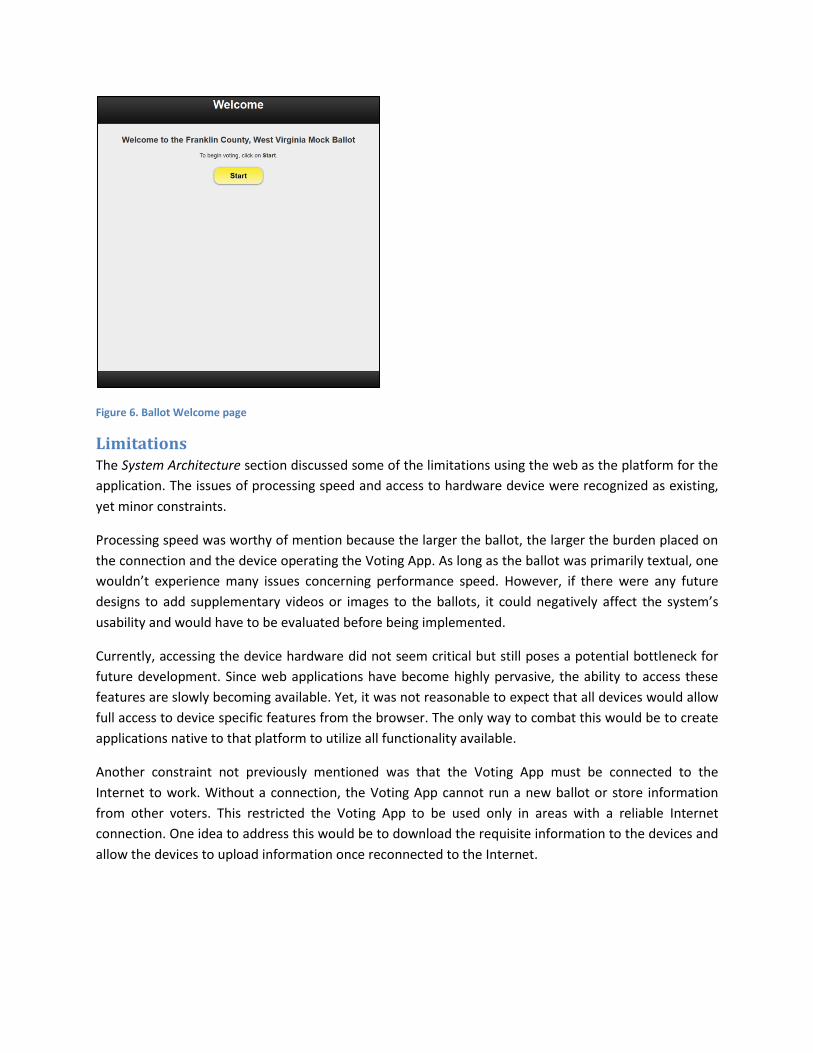
Figure 6. Ballot Welcome page
Limitations The System Architecture section discussed some of the limitations using the web as the platform for the
application. The issues of processing speed and access to hardware device were recognized as existing,
yet minor constraints.
Processing speed was worthy of mention because the larger the ballot, the larger the burden placed on
the connection and the device operating the Voting App. As long as the ballot was primarily textual, one
wouldn’t experience many issues concerning performance speed. However, if there were any future
designs to add supplementary videos or images to the ballots, it could negatively affect the system’s
usability and would have to be evaluated before being implemented.
Currently, accessing the device hardware did not seem critical but still poses a potential bottleneck for
future development. Since web applications have become highly pervasive, the ability to access these
features are slowly becoming available. Yet, it was not reasonable to expect that all devices would allow
full access to device specific features from the browser. The only way to combat this would be to create
applications native to that platform to utilize all functionality available.
Another constraint not previously mentioned was that the Voting App must be connected to the
Internet to work. Without a connection, the Voting App cannot run a new ballot or store information
from other voters. This restricted the Voting App to be used only in areas with a reliable Internet
connection. One idea to address this would be to download the requisite information to the devices and
allow the devices to upload information once reconnected to the Internet.

Future Improvements The system architecture design met the test bed requirements and needs. Its modularity and separation
of tasks made it easy to modify and extend functionality while having minimal impact on other areas of
the system. In addition, the jQuery framework met all of the project needs.
There was one issue in the system architecture that could be improved the division of ballot translation
efforts. When loading a non-English ballot, the Voting App retrieves language information from both the
ballot template and the specified language file. This made things confusing for subsequent development
when attempting to identify if information was coming from the language databases or the template. A
suggestion for future iterations was to separate the work entirely and avoid the overlap of functionality
by making the ballot template English only and remove all information about translations within the
language files. Using this approach, ballot translation would work separately, minimizing the number of
items that belonged to each study, and centralizing all language-related information into one location.

User Interface As briefly described in previous sections, the system aimed to be platform-independent and aid
individuals with visual impairments. The system requirements and how these constraints impacted the
original designs are described next. In addition, the important system changes needed to design the
Voting App to work on the iPad are highlighted. The lessons learned and recommendations are listed
following the design descriptions.
Requirements Georgia Tech Research Institute (GTRI) defined the following factors as usability goals – learnability,
memorability, effectiveness, efficiency, safety, and utility/versatility (Preece, 2002). They served as
guidelines for designing the system’s interactions and ways to evaluate its success in various measures.
GTRI also invested in making the application aesthetically pleasing to enhance the user experience.
The usability criteria are theoretically measurable. Learnability is defined as the ease with which new
users can learn to operate a system with minimal instruction. Similarly, memorability refers to how easy
a system is to use after a significant break in time of use. Effectiveness is defined as the ability of the
hardware, software, and user to perform the functions for which the system was created. Efficiency is
inversely related to time, effort, and steps required to complete a task. Safety is concerned with
ensuring that the system minimizes and/or prevents potential user errors. Utility/versatility is defined by
the range of users who can use the system successfully and the variety of settings in which the system
can be used successfully.
Aesthetic appeal is not recognized as a usability goal because the application could be very useful and
effective in completing the task of voting but lack visual appeal. Conversely, the application may seem
attractive to most, but be entirely unusable because it fails to address the usability goals. Nonetheless, it
is an important part of overall user experience, and it was considered in design decisions.
Overall Design The Voting App resembled a traditional paper ballot with a few modifications. The majority of the pages
followed a succinct, consistent layout, in the following order: contest title, overall ballot progress,
navigation bar, basic instructions, and contest candidates/content (Figure 7). The User ID, Settings,
Welcome, Review, and Help pages were unique pages that deviated from this format for various
functionality reasons. Yet they still resembled the format used inside the Voting App to maintain
familiarity. Although the option was eventually removed and set to a default, some research studies
allowed the pages to display the content in multiple columns, multiple pages, and scroll format (Harley
et al., 2013b). The aim of mimicking familiar systems and concepts of a paper ballot was to reduce the
Voting App’s learning curve and make it easier for users to remember how to use. Design that is
consistent with user expectations makes it easier to use. An additional benefit of this general layout
theme was that it worked well on both mobile and desktop devices without any needed modification.
To navigate the ballot, users were provided with the following four commands: “Back”, “Next”, “Help”,
and “Review”. The “Back” and “Next” button were used to page-backward and page-forward in linear
fashion. When the “Next” button was clicked, it would open the next sequential page in the ballot. The

“Back” button operated similar to a web browser’s back button in that it would return to the page last
visited. It was decided that the “Back” command be chronologically linear to emulate known browser
control and ease navigation because both the “Help” and “Review” buttons enacted non-linear
navigation. By clicking the “Help” button, users were directed to the Help page, which listed general use
tips and a “Back” button to return to the last place in the ballot. The “Review” button led to the Review
page on which users could examine their votes for all of the contests. While reviewing their votes, users
could jump directly to a particular contest by clicking the box of the contest in question. On the Review
page, the “Submit” button replaces the “Next” button. Once users completed their review, they would
click “Submit” to finish the ballot and be taken back to the Ballot Selection page.
The commands were all available on-screen and accessible by clicking on or touching them, depending
on the input device. The User Input Device research study was designed to research the effectiveness of
different tactile controllers with the Voting App format (Harley et al, 2013a).
The last form of input was the on-screen keyboard used for particular fields within the ballot. Figure 4
depicts the onscreen keyboard being used to complete User ID input. The on-screen keyboard was
created in the event that the device did not have an available keyboard, as well as to support the sole
use of tactile controllers for participant’s who needed to use the tactile controls. Every version of the
application limited users to using the on-screen keyboard for any text input (such as a write-in
candidate) for a normalized experience.
Figure 7. Candidate page of the Voting App
To guide users along the process, various pop-ups and visual cues provided feedback about the status
and actions of the Voting App. All of the pop-ups were designed to prevent and minimize user errors,
whether it was intentional or accidental. The most basic pop-ups were the “Overvote” and “Undervote”

dialog boxes that informed the user the total number of votes for a contest did not match the allowed
maximum. Users would be alerted with an “Overvote” warning if they clicked more options that were
allowed. The last vote would not be recognized, and users were prompted that they would return to the
page to deselect a previous selected option before adding any other votes. An “Undervote” warning
would pop-up if the voter clicked the “Next” button when they had not selected the maximum number
of candidates allowed (e.g., they had selected 2 of 4 possible votes). Unlike the “Overvote” warning,
users were permitted to continue with the ballot even though they did not vote for the maximum
amount.
The on-screen keyboard was another popup. It would only appear when users clicked a text field and
the Voting App requested a written response. Lastly, when submitting the ballot, a final popup emerged
that asked users to confirm if they were done or if they needed to return to the ballot. All pop-ups
would shade out all area behind it, excluding the page title. This was done to draw attention to the
popup dialog so the user could respond accurately and continue voting.
In addition to the pop-ups, the Voting App gave various visual cues to make operation intuitive. When
transitioning from one page to the next, all pages slid to indicate the content changed and to provide an
indication of the direction of the movement in the ballot. Another small detail was the progress caption
(e.g., “Ballot Page 6 of 17”) at the top of the page to indicate their location within the ballot. To show
how many candidates were selected on a certain contest, the selections were outlined in green and
stamped with a green checkmark. On the Review page, all contests were listed and marked with either a
green check to illustrate they completed the contest with the maximum amount of votes or marked with
a red “X” to depict that the voter had skipped the contest or had not marked the maximum allowable
number of candidates for the contest.
The Voting App interface was designed to address the following usability components: error mitigation,
efficiency, effectiveness, versatility for a diverse population, learnability, and memorability.
Error mitigation was achieved by notifying users of errors immediately after they were committed.
Undervote errors were also highlighted on the Review page, which was displayed immediately before
users submitted their ballots. Overvotes were prevented: Users could not select more than the
maximum allowable number of candidates for a contest.
Efficiency was achieved by minimizing the number of button presses required to complete a task. Bi-
directional cursor movement enabled users to choose the shortest route for cursor movement when
using button input devices. Shortcuts for “Next Page” and “Back Page” were provided on one of the
button input devices. When a new page appeared, the cursor automatically highlighted the button that
the user was most likely to press.
Versatility was achieved by creating an app that would run on a variety of mobile devices and personal
computers. Users could interact via a mouse, switches, or touchscreen.

Learnability and memorability were achieved by creating a minimalistic interface with few commands
and a consistent layout that was similar to common paper ballots and direct-recording electronic voting
systems.
Two additional components of usability – effectiveness and user satisfaction – were evaluated in the
empirical studies of the Voting App (Harley et al., 2013a, 2013b, 2013c; Kline et al., 2013).
Design for iPad The iPad was designed according to applicable Voluntary Voting System Guideline (VVSG) design
guidelines. To improve usability, the NiceScroll3 plugin was used to allow easy scrolling within the
windows containing candidates (Figure 8), and the FastButton plugin reduced system response time to
external buttons.
Figure 8. The NiceScroll3 plugin enabled scrolling within windows on a ballot page.
The Voting App was designed to be accessible to users with vision impairments; therefore it was
designed to be compatible with Apple’s Voiceover screen reader. The screen reader converts all text to
audio output, which is read sequentially on each page, and it also enables users to press and hold a
screen element to hear it read aloud.
The Voting App is also compatible with Komodo Tecla Shield, a device that makes the iPad compatible
with accessibility switches. This makes the Voting App accessible to users with upper-mobility
impairments that may need to use specialized devices. The Komodo Tecla Shield also leverages
Voiceover to provide access to individuals with both visual and mobility impairments.

Future Improvements There are improvements that need to be considered to enhance the Voting App performance.
Help in context. The current help page is static and provides information regarding how to use the
interface. Future studies and work may include investigating what type of race specific information
could be provided to voters on the help page. For example, a help page on the presidential race could
provide a description of the office and a brief blurb about each candidate with photos or video clips.
Button layout. The current Voting App button layout was designed primarily to ensure that the JAWS
screen reading software would read the buttons in an appropriate manner for visually impaired voters.
We would like to redesign the button layout to increase readability for both sighted and visually
impaired users. More research is needed to determine an optimal design of button layouts.
Interactive feedback. Currently there is no feedback on the candidate page notifying users how many
votes are remaining. An overvote error is provided when too many votes are attempted to be casted. An
undervote error is provided when voters attempt to move to the next race and still have votes
remaining on the current race. We would like to provide a more interactive feedback of how many votes
remain by providing a real-time counter on each page listing how many votes remain.
Native keyboard. Currently, the Voting App only allows for using the built-in on-screen keyboard.
Another enhancement would be to allow users to use the device’s native keyboard, since they may have
a greater familiarity with the native keyboard.
Touch and click input. We would like to design various parts of the iPad version of the Voting App to
allow for touch input rather than click input. This would facilitate usability studies that will use the iPad
for testing.

Event Logging The physical interactions participants had with the Voting App were recorded through eye tracking
software and an event logging system. The event logging system worked with the Voting App
architecture (see Figure 1) to record clicks as well as any pop-up displays, such as the on-screen
keyboard for write-in candidates and warnings for overvotes and undervotes. Recording this information
allowed for calculations of several variables, including percent correct and number of back clicks, which
provided insight into how participants used the ballot system and how user-friendly the ballot system
was.
Schema All event logging data were stored with corresponding timestamps in a comma separated txt file. Each
txt file was named according to the study, the epoch time in milliseconds at which the ballot was first
accessed, and the user ID, with periods separating the three pieces of information (i.e.
logScroll.1371665851199.1ad2.txt). The epoch timestamp is representative of Unix time,
which is common in many operating systems, and represents the amount of time elapsed in seconds
since 00:00:00 Coordinated Universal Time (UTC) on Thursday, January 1, 1970. To increase the
precision of the ballot logs, this study also included milliseconds in the epoch time, which added three
more digits to the end of the standard Unix epoch time for a total of 13 digits. The epoch time in each
filename, 1371665851199 in the above example marks the initial opening of the ballot and was not
logged within the txt file itself. This was done to allow for the synchronization of the data between the
event logger and the eye tracking program collected on the same computer.
When running a study with a participant, the researcher entered a user ID via an on-screen keyboard
that corresponded with the participant ID, the specific study being conducted, and the ballot used for
the participant. The following abbreviations were used to specify the study type: ac for arthritis control,
ad for arthritis display, d for dyslexia, e for English, s for Spanish, or c for Chinese. For example,
logScroll.1371665851199.1ad2.txt was the event logging file for participant 1ad2 of the
arthritis display (ad) study. The 1 indicates this participant was the first participant of the arthritis
display study. The 2 indicates this participant was on the second of three ballots completed for the
arthritis display study. The studies all consisted of different forms and candidate lists (represented as
different counties and states) for the ballot to apply different settings (i.e. language, number of
buttons, etc.) and prevent candidates from memorizing the correct candidates and introducing bias into
subsequent ballots. As such, the form types and presentation order for each participant ID were
counterbalanced by a Graeco-Latin square, and the assignments were stored in an Excel spreadsheet for
reference during analysis. For further information on specific ballot set-ups, refer to the other working
papers: User Input Devices, Display Layouts, Dyslexia Fonts, and Plain Language (Harley et al., 2013a,
2013b, 2013c; Kline 2013).
Each action that occurred in the ballot was stored with five pieces of information: epoch timestamp in
milliseconds, readable timestamp, event type, event title, and event state. Each line in the ballot log
represented a separate action. An example of two lines within the ballot log:
1371217073096,Fri 14 Jun 2013 13:37:53.096 GMT,button,Next,PresidentCuePage

1371217082729,Fri 14 Jun 2013 13:38:02.729 GMT,checkbox,LHerrera,checked
The readable timestamp is based off of the epoch but is displayed with the day of the week, date, and
24-hour formatted time in Greenwich Mean Time (GMT). The epoch timestamp is used to perform
mathematical calculations, which is harder to do with the readable timestamp. The event type can
consist of several possible event titles, which can occur with various event states. Table 1 includes the
possible event types and the different titles and states for each event type.
Table 1. Possible Event Descriptions for Voting Ballot Logs.
Event Type Event Title Event State userid userid Specified by user or researcher via an on-screen
keyboard, i.e. test or 11ac2 Settings ballot_id Specified ballot type used, i.e. ballotA layout columns
pages
scroll
interface mouse
font_type Specifies the font type used, i.e. Helvetica font_size Specifies a CSS file for font size, i.e. add2 loads the
file_size_add2.css file scroll_en True to enable scroll buttons
False to disable scroll buttons warning_en True to enable overvote/undervote warnings
False to disable warnings and display error instead language English
Spanish
Chinese
Note: only applies to plain language study Button Button display name,
i.e. Next or keyboard-a
clicked
(if from a pop-up window) Name of page where the button was pressed (if not from a pop-up window), i.e. Amendment1Page or GovernorCuePage
Info submit-attempt Name of page where vote was attempted, i.e. PresidentPage or LieutenantGovernorPage
dialog writein display (on-screen keyboard will show) overvote display
error (if warning_en is disabled in settings) undervote display
error (if warning_en is disabled in settings) submit complete
checkbox Checkbox display name, i.e. JSmith for candidate John Smith
checked
unchecked

Note: each action done on checkbox will be listed unknown Display name clicked
Note: clicked with always be listed regardless of what the unknown is
Calculations and Variables Event logging data, especially timestamps and occurrence of various event types, were used to calculate
a number of variables to examine the various ways in which participants interacted with the user
interface of the ballots.
Write-In Time
Write-in time is the amount of time taken to type out a candidate’s name and submit the response,
normalized by the length of the candidate’s name participants were asked to enter. Write-in time
indicates the effort required to manually enter a candidate of choice in an election based on the
electronic ballot set-up present. Write-in time can be calculated as follows:
Equation 1. Write-in Time
in which twi is the write-in time in milliseconds, tdisplay is the timestamp in milliseconds when the on-
screen keyboard appears, tsubmit is the timestamp in milliseconds when the participant submits the
write-in entry, and nletters is the number of letters in the prompted candidate’s name.
Click Time
The mean click time was calculated for each participant and is the average elapsed time between clicks.
Clicks included are on-screen button presses (i.e. Next, Back, etc.) and candidate selections. Button
presses of the hardware were not recorded. Mean click time suggests the navigation speed and usability
of the user input device. Click time is calculated as follows:
Equation 2. Click Time
in which tclick – tclick-1 represents the time elapsed in milliseconds between the timestamp of a click and
the timestamp of the previous click and is represented by tclick.
Response Time
Response time is the amount of time elapsed between the onset of a contest and the participant’s
selection of the candidate. The onset of the contest is marked by the appearance of the list of
candidates. The mean response time for each participant was calculated, and the write-in time was not
included in the average. The mean response time indicates the navigation speed required to operate

each ballot effectively using a given user input device and specific display settings. Response time is
calculated as follows:
Equation 3. Response Time
in which tresp,avg is the response time in milliseconds, tselection is the timestamp of the participant’s
candidate selection on-screen for each race, and tlist is the timestamp of the appearance of the
candidate list for each race.
Race Time
Race time is the time elapsed between the appearance of the prompt page (the page indicating who to
vote for) and the submission of the vote. The mean race time was calculated, and the race with the
write-in was not included in the average. Mean race time indicates the readability and navigation speed
required to operate and read each ballot effectively based on a certain display setting (i.e. multi-page,
scroll, or columns or font). Race time is calculated as follows:
Equation 4. Race Time
in which trace is the race time in milliseconds, tsubmit is the timestamp of the participant’s on-screen
candidate selection, and tprompt is the timestamp of the appearance of the prompt page.
Overvotes
The number of overvote errors was counted for each ballot, indicating that the participant made more
selections than was instructed. Overvote errors suggest how intuitive a particular display setting is.
There is no calculation for overvotes, since the number of occurrences was simply added together.
Undervotes
The number of undervote errors was counted for each ballot, suggesting that the participant made
fewer selections than was instructed. Undervote errors indicate the intuitiveness of the display setting.
There is no calculation for undervotes, since the number of occurrences was simply summed.
Percent Correct
The percentage of correctly chosen candidates was calculated for each ballot, indicating how readable
and navigable each ballot is based on its display layouts. Ballots with unfavorably organized candidate
lists may have made finding the correct candidate difficult, negatively affecting the percent correct. The
write-in race was not included in the percent correct. Percent correct can be calculated as follows:
Equation 5. Percent Correct

in which accuracy is the percentage of correct candidate selections, (nraces – 1) is the number of races
minus one to account for the write-in race not being included, and nincorrect is the number of incorrect
candidates selections.
Prompt Time
Mean prompt time is the average elapsed time between the first appearance of the prompt page (which
instructs the participant who to vote for) and the first appearance of the candidate list. Prompt time
indicates how readable a particular font is and accounts for how effectively the ballot instructs the
participant on who to vote for. Prompt time can impact race time and percent correct. Prompt time is
calculated as follows:
Equation 6. Prompt Time
in which tprompt is the total time in milliseconds spent on the prompt page, tprompt,app is the timestamp of
the appearance of the prompt page for a particular race, and tlist is the timestamp of the appearance of
the candidate list for that race.

Conclusion The purpose of this research endeavor was to create a Voting App that would be platform independent,
to allow for testing on a regular computer, as well as tablets, PCs, and other hardware. There were
various trade-offs that were considered in the design of the Voting App, and the outcome is one that is
well suited to be used as a test-bed. In addition, we wanted to ensure that the Voting App was usable
and therefore, kept key design criteria in mind as we progressed through the design and
implementation of the software. To enhance the capability of analyzing the user experience data, an
event logger was built into the software. This afforded the opportunity to calculate specific time
variables that were indicators of how the system was being used. For more details about each of the
individual research studies, and how the Voting App was modified to adjust to the specific study criteria,
please refer to those working papers (Harley et al., 2013a, 2013b, 2013c; Kline et al., 2013).

Acknowledgments The authors would like to thank Mr. Matthew Hung and Mr. Jerry Ray for their contributions to the development of the Voting App, and Dr. Cara Bailey Fausset and M.s Hannah Jahant for their contributions in reviewing and editing this manuscript.

References Davies, D. (2013) What if anyone could vote on any device, anywhere, at any time? The Anywhere Ballot
digital ballot template. Testimony to the Presidential Commission on Election Administration.
Harley, L., Kline, K., Price, C., Jones, A., Mosley, S., Farmer, S., and Fain, W.B. (2013a). A web based
voting application study of user input devices for older adult voters with arthritis. Working Paper
for the Information Technology and Innovation Foundation, Accessible Voting Technology
Initiative.
Harley, L., Kline, K., Price, C., Jones, A., Mosley, S., Farmer, S. and Fain, W.B. (2013b). A web based voting
application study of display layouts for older adult voters with arthritis. Working Paper for the
Information Technology and Innovation Foundation, Accessible Voting Technology Initiative.
Harley, L., Kline, K., Price, C., Jones, A., Mosley, S., Farmer, S., and Fain, W.B. (2013c). A web based
voting application study of fonts for voters with dyslexia. Working Paper for the Information
Technology and Innovation Foundation, Accessible Voting Technology Initiative.
Kline, K., Bell, C., Jahant, H., Price, C., Jones, A., Mosley, S., Farmer, S., Harley, L., and Fain, B. (2013). A
study of plain language writing style for ballots in english, spanish, and chinese
Lee, S., Xiong, X., Yilin, L.E., and Sanford, J. (2012) EZ ballot with multimodal inputs and outputs. ASSETS
’12: 215 – 216.
Preece, J., Rogers, Y., & Sharp, H. (2002). Interaction design: beyond human-computer interaction. New
York, NY: J. Wiley & Sons.
"Test Bed." Merriam-Webster.com. Merriam-Webster, n.d. Web. 2 Dec. 2013. <http://www.merriam-
webster.com/dictionary/test bed>.
Williams, P., Cross, E.V., Mkpong-Ruffin, I., McMillian, Y., Nobles, K., Gupta, P., and Gilbert, J.E. (2013)
Prime III: Where usable security and electronic voting meet. 15th International Conference on
Human Computer Interaction.