A Wavelet Transform Based Pseudo Color Enhancement of ...
4
INTRODUCTION The Three --- Dimensional (3-D) breast imaging is the leading meth- od for breast imaging today. Plain films and xeromammograms are extensively used to evaluate presumptive breast cancers and to detect those that are not suspected (Occult carcinoma). These otherwise hidden carcinoma cannot be palpated as a lump, and produce no clinical symp- toms. However on x rays they can appear as an abnormally dense area or as a small cluster of fine calcifications. Early detection of carcinoma is particularly important because it frequently leads to a favorable prog- nosis. An x --- ray beam exiting the breast contains structural information that can be recorded by either photochemical or conductive mammogra- phy uses film containing silver halide crystals. The conductive system of xeromammography relies on a charged selenium plate to record the radiographic image. Both the methods can also be used to image the lac- tiferic ducts after they have been injected with a radio opaque dye (con- trast material). This examination is called galactography or ductogra- phy 1) . Plain film mammography of a same patient taken at 45° / 90 ° angle differences between the two images is shown in the Figure 1 and Figure 2. Considerable attention is given to the problem of improving the photochemical and photoconductive systems so that they can pro- vide optimal diagnostic information and at the same time decrease in the amount of radiation required. The film screen system has successfully reduced the exposure of both the skin and underlying tissues to the x --- rays. Mammography Mammography is a non --- invasive imaging technique allowing for the visualization of the internal structures of an object without the superposition of over and underlying structures that usually plagues conventional projection images 2,3) . For example, in conventional chest radiography, the heart, lungs and ribs are all superimposed on the same film, where as a computer tomog- raphy (CT) slice captures each organ in its actual three dimensional positions. Mammography has found widespread application in many scientific fields, including physics, chemistry, astronomy, geophysics and of course, medicine. Methods for 3 --- D mammography can be used for both early detection and diagnosis of breast cancer 4,5) . The paper describes the 3 --- D mammography as a diagnostic technique with a goal of reducing the number of breast biopsies since the diagnostic qual- ity of the x --- ray based images is better than those obtained by other modalities. Each mammographic modality measures a different physical quantity. - CT: The number of x ray photons transmitted through the patient along individual projection lines - Nuclear medicine: The number of photons emitted from the patient along individual projection lines - Ultrasound diffraction mammography: The amplitude and phase of scattered waves along a particular line connection the source and detector The task is to estimate from these measurements the distribution of a particular physical quantity in the object. The quantities that can be reconstructed are: International Medical Journal Vol. 28, No. 4, pp. 481 - 484 , August 2021 SHORT COMMUNICATION A Wavelet Transform Based Pseudo Color Enhancement of Images in Digital Mammography Lilly Beaulah H. 1) , Sumathi. S. 2) , Samson Ravindran. R. 3) ABSTRACT Objective: This paper approaches an intelligent diagnosis system using. For 3D images taken in two plain film X-ray) mam- mography, pseudo coloring is applied at an angle of 450 / 900 between them and the details are collected digitally in a segmenta- tion and reconstruction. Materials: This method Based on using discrete wavelet transform for analyzing the mammography image and extracting the parameters related to dangerous breast problem. Improvement in resolution and introduction of methods requiring lower levels of radiation are contributing to the growing success of screening programs to detect breast carcinoma. Plain film Mammography use x rays of low energy which because of their differential absorption by the tissues, effective in imaging the breast skin, parenchyma, fat and calcifications. Results: The result give importance to that the proposed method to reconstructed single calcification using 3-D distributions of homogenous or linear malignant clusters and of peripheral plate like benign clusters are more clearly differentiated Conclusion: This paper presented the three Dimensional mammographic breast imaging techniques with the help of Pseudocolouring have potentials for both early cancer detection and diagnosis. KEY WORDS mammography, breast imaging, 2D 3D digital imaging, pseudo coloring, wavelet transform, reconstruction Received on February 14, 2020 and accepted on April 13, 2020 1) Mahendra College of Engineering, Salem, India 2) Mahendra Engineering College, Namakkal, India 3) Mahendra Group of Engineering Colleges, Salem Namakkal, Inida Correspondence to: Lilly Beaulah. H. (e-mail: [email protected]) 481 C 2021 Japan University of Health Sciences & Japan International Cultural Exchange Foundation
Transcript of A Wavelet Transform Based Pseudo Color Enhancement of ...

INTRODUCTION
The Three --- Dimensional (3-D) breast imaging is the leading meth-od for breast imaging today. Plain films and xeromammograms are extensively used to evaluate presumptive breast cancers and to detect those that are not suspected (Occult carcinoma). These otherwise hidden carcinoma cannot be palpated as a lump, and produce no clinical symp-toms. However on x rays they can appear as an abnormally dense area or as a small cluster of fine calcifications. Early detection of carcinoma is particularly important because it frequently leads to a favorable prog-nosis.
An x --- ray beam exiting the breast contains structural information that can be recorded by either photochemical or conductive mammogra-phy uses film containing silver halide crystals. The conductive system of xeromammography relies on a charged selenium plate to record the radiographic image. Both the methods can also be used to image the lac-tiferic ducts after they have been injected with a radio opaque dye (con-trast material). This examination is called galactography or ductogra-phy1).
Plain film mammography of a same patient taken at 45° / 90 ° angle differences between the two images is shown in the Figure 1 and Figure 2. Considerable attention is given to the problem of improving the photochemical and photoconductive systems so that they can pro-vide optimal diagnostic information and at the same time decrease in the amount of radiation required. The film screen system has successfully reduced the exposure of both the skin and underlying tissues to the x --- rays.
MammographyMammography is a non --- invasive imaging technique allowing for
the visualization of the internal structures of an object without the superposition of over and underlying structures that usually plagues conventional projection images2,3).
For example, in conventional chest radiography, the heart, lungs and ribs are all superimposed on the same film, where as a computer tomog-raphy (CT) slice captures each organ in its actual three dimensional positions. Mammography has found widespread application in many scientific fields, including physics, chemistry, astronomy, geophysics and of course, medicine. Methods for 3 --- D mammography can be used for both early detection and diagnosis of breast cancer4,5). The paper describes the 3 --- D mammography as a diagnostic technique with a goal of reducing the number of breast biopsies since the diagnostic qual-ity of the x --- ray based images is better than those obtained by other modalities. Each mammographic modality measures a different physical quantity.
- CT: The number of x ray photons transmitted through the patient along individual projection lines
- Nuclear medicine: The number of photons emitted from the patient along individual projection lines
- Ultrasound diffraction mammography: The amplitude and phase of scattered waves along a particular line connection the source and detector
The task is to estimate from these measurements the distribution of a particular physical quantity in the object. The quantities that can be reconstructed are:
International Medical Journal Vol. 28, No. 4, pp. 481 - 484 , August 2021
SHORT COMMUNICATION
A Wavelet Transform Based Pseudo Color Enhancement of Images in Digital Mammography
Lilly Beaulah H.1), Sumathi. S.2), Samson Ravindran. R.3)
ABSTRACTObjective: This paper approaches an intelligent diagnosis system using. For 3D images taken in two plain film X-ray) mam-
mography, pseudo coloring is applied at an angle of 450 / 900 between them and the details are collected digitally in a segmenta-tion and reconstruction.
Materials: This method Based on using discrete wavelet transform for analyzing the mammography image and extracting the parameters related to dangerous breast problem. Improvement in resolution and introduction of methods requiring lower levels of radiation are contributing to the growing success of screening programs to detect breast carcinoma. Plain film Mammography use x rays of low energy which because of their differential absorption by the tissues, effective in imaging the breast skin, parenchyma, fat and calcifications.
Results: The result give importance to that the proposed method to reconstructed single calcification using 3-D distributions of homogenous or linear malignant clusters and of peripheral plate like benign clusters are more clearly differentiated
Conclusion: This paper presented the three Dimensional mammographic breast imaging techniques with the help of Pseudocolouring have potentials for both early cancer detection and diagnosis.
KEY WORDSmammography, breast imaging, 2D 3D digital imaging, pseudo coloring, wavelet transform, reconstruction
Received on February 14, 2020 and accepted on April 13, 20201) Mahendra College of Engineering, Salem, India2) Mahendra Engineering College, Namakkal, India3) Mahendra Group of Engineering Colleges, Salem Namakkal, InidaCorrespondence to: Lilly Beaulah. H. (e-mail: [email protected])
481
C 2021 Japan University of Health Sciences & Japan International Cultural Exchange Foundation
Lilly Beaulah H. et al.482
- CT: The distribution of linear attenuation coefficient in the slice being images.
- Nuclear medicine: The distribution of the radio tracer adminis-tered to the patient in the slice being images.
- Ultrasound diffraction mammography: The distribution of the refractive index in the slice being imaged.
The primary concern in the 3D mammography is the received dose. Dose for the screening should not exceed the dose currently used in mammography (approx. 2.3 mGy of mean glandular dose, per image) unless the sensitivity is greatly improved. Another concern is duration of the exam, due to the number of screening patients and the amount of the tissue visualized. The 3D mammography is based upon digital mam-mography and utilizes the advantages of separate optimization of image acquisition, reconstruction, visualization and storing. Multiple images are required at different angles of the x ray tube with respect to the lon-gitudinal axis.
NEED FOR DIGITAL MAMMOGRAPHY
The plain film mammography is mammography one and it is very difficult to identify the differences in detecting carcinoma. The linear attenuation coefficient of tissue is represented by the scanner computer as integers in values from --- 1000 to +1000 Breast lies below water (CT) and along with fat and tumor stages.
From the below Figure 3 it is very clear that, the breast has CT number of scales amount 50 --- 110 which is lesser than water as refer-ence 0 and comparatively very low with the other organs and lies with tumor range as +80 to --- 125. By taking two different angle mam-mographic plain films from 45° to 90° spacing, image segmentation and reconstruction is possible to get two / three dimension images with help of Radon transform based on direct iterative methods. For this the imag-es may be digitized using a high resolution digitizer.
The images can be stored and retrieved electronically, which makes long-distance consultations with other mammography specialists easier. Since the images can be adjusted by the radiologist, micro variations between tissues may be noted. The improved accuracy of digital mam-mography may reduce the number of follow up procedures6,7).
The first digital mammography system received U.S. Food and Drug Administration (FDA) approval in 2000. An example of a digital mammography system is the Stenographer 2000D.
RECONSTRUCTION
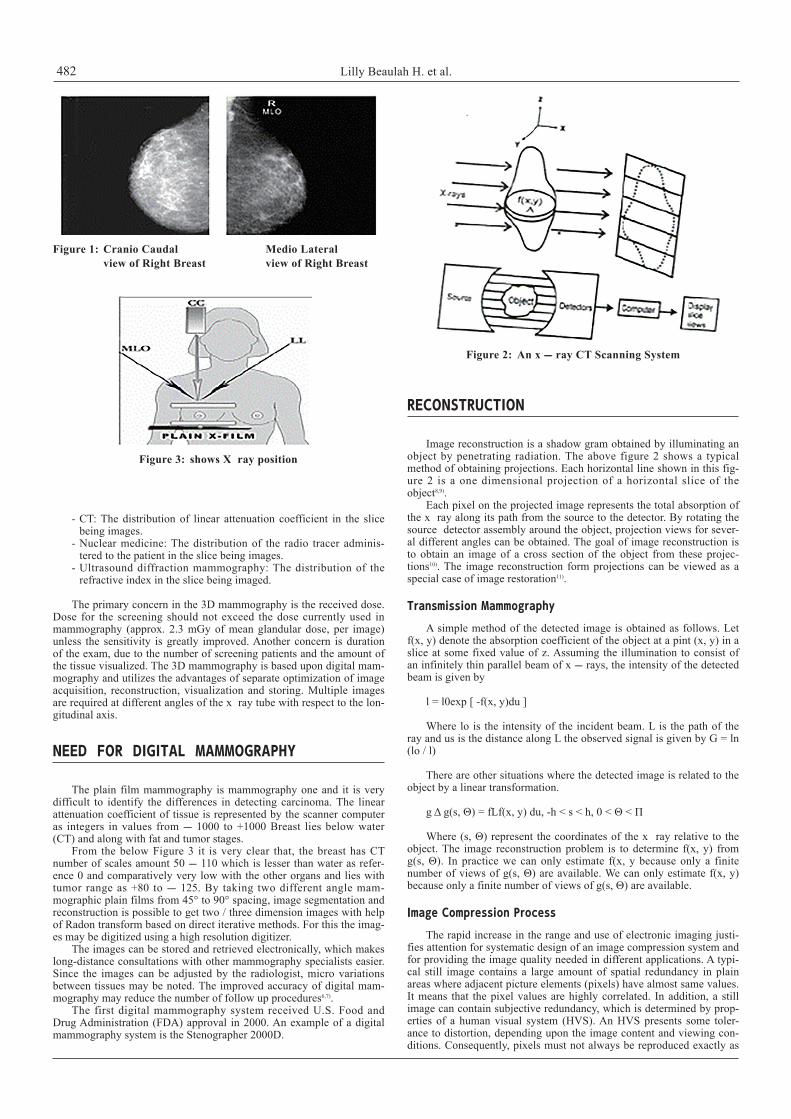
Image reconstruction is a shadow gram obtained by illuminating an object by penetrating radiation. The above figure 2 shows a typical method of obtaining projections. Each horizontal line shown in this fig-ure 2 is a one dimensional projection of a horizontal slice of the object8,9).
Each pixel on the projected image represents the total absorption of the x ray along its path from the source to the detector. By rotating the source detector assembly around the object, projection views for sever-al different angles can be obtained. The goal of image reconstruction is to obtain an image of a cross section of the object from these projec-tions10). The image reconstruction form projections can be viewed as a special case of image restoration11).
Transmission MammographyA simple method of the detected image is obtained as follows. Let
f(x, y) denote the absorption coefficient of the object at a pint (x, y) in a slice at some fixed value of z. Assuming the illumination to consist of an infinitely thin parallel beam of x --- rays, the intensity of the detected beam is given by
l = l0exp [ -f(x, y)du ]
Where lo is the intensity of the incident beam. L is the path of the ray and us is the distance along L the observed signal is given by G = ln (lo / l)
There are other situations where the detected image is related to the object by a linear transformation.
g Δ g(s, Θ) = fLf(x, y) du, -h < s < h, 0 < Θ < Π
Where (s, Θ) represent the coordinates of the x ray relative to the object. The image reconstruction problem is to determine f(x, y) from g(s, Θ). In practice we can only estimate f(x, y because only a finite number of views of g(s, Θ) are available. We can only estimate f(x, y) because only a finite number of views of g(s, Θ) are available.
Image Compression ProcessThe rapid increase in the range and use of electronic imaging justi-
fies attention for systematic design of an image compression system and for providing the image quality needed in different applications. A typi-cal still image contains a large amount of spatial redundancy in plain areas where adjacent picture elements (pixels) have almost same values. It means that the pixel values are highly correlated. In addition, a still image can contain subjective redundancy, which is determined by prop-erties of a human visual system (HVS). An HVS presents some toler-ance to distortion, depending upon the image content and viewing con-ditions. Consequently, pixels must not always be reproduced exactly as
Figure 1: Cranio Caudal Medio Lateral view of Right Breast view of Right Breast
Figure 2: An x --- ray CT Scanning System
Figure 3: shows X ray position

A Wavelet Transform based Pseudo Color Enhancement of Images in Digital Mammography 483
originated and the HVS will not detect the difference between the origi-nal image and reproduced image. The redundancy (both statistical and subjective) can be removed to achieve compression of the image data12). The basic measure for the performance of compression algorithm is compression ratio (CR), defined as the ratio between original data size and compressed data size. In a lossy compression scheme, the image compression algorithm should achieve a tradeoff between compression ratio and image quality, higher compression ratio and image quality.
Higher compression rations will produce lower image quality and vice versa. Quality and compression can also vary according to input characteristics and content. Transform coding is a widely used method of compressing image information. In a transform based compression system two dimensional (2 --- D) images are transformed from the spa-tial domain to the frequency domain. An effective transform will con-centrate useful information into a few of the low frequency transform coefficients. An HVS is more sensitive to energy with low spatial fre-quency than with high spatial frequency. Therefore, compression can be achieved by quantizing the coefficients, so that important coefficients (low frequency coefficients) are transmitted and the remaining coeffi-cients are discarded13-16). Over the years, a variety of linear transforms have been developed which include Discrete Fourier Transform (DFT), Discrete Cosine Transform (DCT) and Discrete Wavelet Transform (DWT) and many more with its advantages and disadvantages. By using the advantage in many aspects of the DWT as highlighted below we can successfully reconstruct the mammography images.
DISCRETE WAVELET TRANSFORM
Wavelet transform (WT) represents an image as a sum of wavelet functions (wavelets) with different locations and scales. In recent times, much of the research activities in image coding have been focused on the DWT, which has become a standard tool in image compression applications because of their data reduction capability. In a wavelet compression system, the entire image is transformed and compressed as a single data object rather than block by block as in a DCT --- based compression system. It allows a uniform distribution of compression error across the entire image. DWT offers adaptive spatial --- frequency resolution (better spatial resolution at high frequencies and better fre-quency resolution at low frequencies) that is well suited to properties of an HVS.
Advantages of DWT Over DCT* No need to divide the input coding into non ---verlapping 2 --- D
blocks. It has higher compression ratios and thus avoids blocking artifacts.
* Allows good localization both in time and spatial frequency domain
* Better identification of which data is relevant to human percep-tion due to its higher compression ratio.
* Higher flexibility: Wavelet function can be freely chosen.* Better image quality: The wavelet transform encodes an image in
a continuous stream allowing it.
To avoid the artifacts that result from DCT's division of an image into discrete compression blocks. Wavelet artifacts take the form of blurring high contrast lines, merely making the image softer. The wave-let transform perform what's called, multi --- resolution compression it stores images information in a series of bands with the most important image information at the beginning of the file. Each band contains a representation of the entire image with the various bands containing details of the image at every level from coarse resolution and textures to
fine details.
* Progressive image down loading: An inherent benefit of the wavelet's multi --- resolution architecture is the ability to progres-sively access the encoded image in a smooth continuous fashion without having to down load, decode and /or print the entire file. Wavelet compressed images appear first as an image with coarse resolution and then filter finer resolution details are progressively filled in. Since the most important details are stored at the front of the image file, users will first see a blurry version of the image and the remaining details appearing as the bit stream arrives. Usually with about 10% of the image data, the user can tell what the image will be and can decide whether or not to wait for high-er resolution.
* It can provide better image quality than DCT, especially on a higher compression ratio. However, the implementation of the DCT is less expensive than that of the DWT. For example, the most efficient algorithm for 2 --- D 8 x 8 DCT requires only 54 multiplications, while the complexity of calculating the DWT depends on the wavelet filters.
ReconstructionReconstruction of position and shape are illustrated in figure 2. The
position can be detected by using two different x --- ray tube positions. The shape of the tissue can be reconstructed by using two spatially sepa-rated sources producing two different reconstruction of calcification position (left) and shape (right) using limited view reconstruction tech-nique. Position is reconstructed as intersection of projection lines for different x --- ray tube angles. Shape is reconstructed by comparing the intensities in different projection images of the same calcification. The practical plain mammography Rcc (cranio --- caudal) is taken17). In some different cases, we are analyzing the 45° right wards in the case of right breast and 45° leftwards in the case of left breast.
Figure 3 is using 90° simulation arriving approximation manually10). This is the basis for developing algorithm for wavelet transform ---Radon transform. The RMLO (Medio Lateral Oblique) is also taken. With these two available 45° separation details we have to simulate the 90° approximation. Using this we can get 2D image which helps more to go for 3D simulation using the transforms9). (Wavelet Transform, Direct Cosine Transform, Direct wavelet transform and Radon trans-form). We can get a clear reconstruction of this digital image of the mammography in 3 dimensions
NEED FOR PSEUDO COLORING
The classifications to be deducted to identify and diagnose the breast cancer are identified in a better way by the results of this pseudo coloring. The term Pseudo --- color refers to using color to visualize things that aren't inherently colored. If two variables of information have to be displayed at a time in an image, the intensity (one variable) and the hue (other variable) may be varied independently. Pseudo --- color can be effectively used to label or identify particularly significant sections of the image as determined by some other image processing or vision algorithm. It has to be kept in mind while using a color that a large portion of the population (estimated 10% of all males) is color blind. If isoluminant displays are created (one with uniform intensity and varying hues), color blind people can't see the displays. Normal sighted people will see them poorly.
(a) (b) (c)
Figure 4 : (a) circumscribed lesions before pseudo coloring (b) after applying color policies to circumscribed
lesions (c ) Multi resolution after Pseudo coloring Figure 5: shows reconstruction of a single simulated calcification

Lilly Beaulah H. et al.484
Pseudo Coloring in C++ An array of pixels with an associated intensity (as a float between 0
and 1) is convert to a RGB image, multiply each value by 255 and assign it to R + G + B to obtain a greyscale image called a pseudo/false color image.
if(intensity <= 0.25) { p->r = 0; p->g = 0; p->b = (intensity) * 4 * 255; return; } if(intensity <= 0.5) { p->r = 0; p->g = (intensity - 0.25) * 4 * 255; p->b = 255; return; } if(intensity <= 0.75) { p->r = 0; p->g = 255; p->b = (0.75 - intensity) * 4 * 255; return; } if(intensity <= 1.0) { p->r = (intensity - 0.75) * 4 * 255; p->g = (1.0 - intensity) * 4 *
255; p->b = 0; return; }
Color SlicingSeparating the objects form their surroundings is the main use of
highlighting a specific range of color in an image. The basic idea is either to 1) display the colors of interest so that they stand out from the background or 2) use the region defined by the colors as a mask for fur-ther processing.
IMAGE COMPRESSION PROCESS
Image compression research aims at reducing the number of bits needed to represent an image by removing the spatial and spectral redundancies as much as possible. The foremost task is to find less cor-related representation of the image. Two fundamental components of compression are redundancy and irrelevancy reduction. Redundancy reduction aims at removing duplication from the signal source (image / video). Irrelevancy reduction omits parts of the signal that will not be noticed by the signal receiver, namely the Human visual system (HVS).
RESULTS
Using the color preference after applying the pseudo coloring to the sample images taken, where different micro clarifications and circum-scribed lesions are available, and the results we get one very much encouraging. The selections of colors for different gray levels are done with the help and consultations of the Radiologists in the high --- tech hospital available here. Some of the results are as follows.
An example of reconstructed single calcification is shown in the Figure.4. Using this approach, 3-D distributions of homogenous or lin-ear malignant clusters and of peripheral plate like benign clusters are more clearly differentiated. This approach offers parametric representa-tion of reconstructed calcifications9), which can potentially reduce the amount of data needed for visualization, transmission and storing and can be of significance in telemammography.
CONCLUSION
Thus the application of Pseudocolouring with the help of Photoshop colour policies is used to separate the carcinoma and to apply various
colours for the calcifications in gray scale for better perception and understanding. The diagnostic quality will certainly improve because; by any human eye can easily differentiate the colours. That is very dif-ferent from others has established in the results. The shape size and location of the occult carcinoma may be easily detected. Also we have found that the Three Dimensional mammographic breast imaging tech-niques with the help of Pseudocolouring have potentials for both early cancer detection and diagnosis.
REFERENCES
1. Boag A. H., L. A. Kennedy, M. J. Miller. Three-Dimensional Microscopic Image Reconstruction of Prostatic Adenocarcinoma. Archives of Pathology and Laboratory Medicine: 125(4): 562-566. April 2001.
2. Rafael C. Gonzalez, Richard E.Woods (2001) Digital Image Processing. Addison-Wesley Longman Publishing Co., Inc. Boston, MA, USA second edition. Sheng Liu, C.F. Babbs; Delp, E.J. (2001) Multiresolution detection of spiculated lesions in digital mammograms. IEEE Trans. Image Processing. 10(6): 874-884.
3. Yam M., M. Brady, R. Highnam, C. Behrenbruch (2001) Three-dimensional Reconstruction of micro- calcifications clusters from two mammographic view's. IEEE Trans. Medical Imaging. 20(6): 479-489.
4. Zheng B., Y.H.Chang, D.Gur, Computerized Detection of masses in Digitized Mammograms using single image segmentation and a multilayer topograophic feature analysis. Acad. Radiology. 2(5): 959-966. US Patent Issued on March 6, 2001
5. Pratt.W.K. (2003) Digital image processing. John Wiley & Sons. Inc. New York, NY, USA. second edition.
6. Lee L, Stickland V, Wilson R, Evans A: Fundamentals of Mammography. 2nd edition. London, Churchill Livingstone; 2003, 176 ISBN 0 443 071144.
7. Geetha, V., Chandrakala, D., Nadarajan, R., Dass, C.K., A bayesian classification approach for handling uncertainty in adaptive E-assessment, (2013) International Review on Computers and Software (IRECOS), 8 (4), pp. 1045-1052.
8. Lekha, A., Srikrishna, C.V., Vinod, V., Multiscale segmentation and enhancement of mammogram, (2017) International Review on Computers and Software, 9 (4), pp. 650-658.
9. Yam M., M. Brady, R. Highnam, C. Behrenbruch (2001) Three-dimensional Reconstruction of micro- calcifications clusters from two mammographic view's. IEEE Trans. Medical Imaging. 20(6): 479-489.
http://dx.doi.org/10.1109/42.929614. 10. Wu, Z., Zhou, Z., Tian, D. et al. Vis Computer (2018) Reconstruction Construction of
Three-Dimensional Flame With Color Temperature, Springer Berlin Heidelberg 31: 613. https://doi.org/10.1007/s00371-014-0987-5,..
11. . Reis S, Eiben B, Mertzanidou T, et al. Minimum slice spacing required to reconstruct 3D shape for serial sections of breast tissue for comparison with medical imaging. In: SPIE Medical Imaging. Orlando, FL: International Society for Optics and Photonics; 2015: 94200K.
12. Rhodes DJ, Breitkopf CR, Ziegenfuss JY, Jenkins SM, Vachon CM. [2015] Awareness of breast density and its impact on breast cancer detection and risk. Journal of Clinical Oncology, 33(10): 1143-1150.
13. Albarqouni, S., Baur, C., Achilles, F., Belagiannis, V., Demirci, S, & Navab, N. (2016). AggNet: Deep Learning from Crowds for Mitosis Detection in Breast Cancer Histology Images. IEEE transactions on medical imaging, 35(5), 1313-1321.
14. Sarafianou M, Preece AW, Craddock IJ, Klemm M, Leendertz JA. [2019] Evaluation of Two Approaches for Breast Surface Measurement Applied to a Radar-Based Imaging System. IEEE Transactions on Antennas and Propagation, 64(2): 609-617.
15. Mertzanidou T, Hipwell JH, Reis S, et al[2018]. Whole mastectomy volume reconstruc-tion from 2d radiographs and its mapping to histology. In: Breast Imaging, IWDM. Malmo, Sweden: Springer International Publishing; 2016: 367-374.
16. Porter E, Bahrami H, Santorelli A, Gosselin B, Rusch LA, Popovi M. [2016] A Wearable Microwave Antenna Array for Time-Domain Breast Tumor Screening. IEEE transactions on medical imaging, 35(6): 1501-1509.
17. Hang Min, Devin Wilson, Yinhuang Huang, Siyu Liu, Stuart Crozier, Andrew P Bradley, Shekhar S. Chandra[2020], Fully automatic computer- aided mass detection and segmentation via pseudo-colour Mmmograms and mask R-CNN, Computer vision and pattern recognition, 23(4).