A Waterway to Resilience - World...
52
1 A Waterway to Resilience Fiscal Year 2015 Annual Report Public Disclosure Authorized Public Disclosure Authorized Public Disclosure Authorized Public Disclosure Authorized
Transcript of A Waterway to Resilience - World...

1
A Waterway to Resilience
Fiscal Year 2015 Annual ReportPub
lic D
iscl
osur
e A
utho
rized
Pub
lic D
iscl
osur
e A
utho
rized
Pub
lic D
iscl
osur
e A
utho
rized
Pub
lic D
iscl
osur
e A
utho
rized

© 2016 The World Bank1818 H Street NWWashington, DC 20433Telephone: 202-473-1000Internet: www.worldbank.org
This report is available on the WPP website (go to http://water.worldbank.org/wpp/AnnualReport2015.html).
AcknowledgementsThis report was prepared by members of the WPP Program Management Team: Diego J. Rodríguez, Matthijs Schuring, Nansia Constantinou, Amanda Goksu, Danielle A. García Ramírez, Svetlana Valieva, Adria Vargas, and Luisa M. Mimmi. In addition, contributions were made by the following Bank staff and consultants: Jean-Martin Brault, Anjali Acharya, Christopher C. Ancheta, Saurabh Suresh Dani, Anju Gaur, Claudio Jose Guglielmelli Russian, Cuong Hung Pham, Sheryl Silverman, Ruth Tiffer-Sotomayor, Víctor Vázquez, Clementine M. Stip, Nathan Engle, Susanne M. Scheierling, Federica Ranghieri, Claire Kfouri, Lilian Pena Pereira Weiss, Natalia Limones Rodríguez, Ximing Zhang, Poonam Pillai, Isabel Duarte A. Junior, Xiaokai Li, Carter J. Brandon, Peter Goodman, Noosha Tayebi, Luis Ernesto García, Marcus Wijnen, Valentina Costa, Meleesa Naughton. Special thanks to Marie-Chantal Uwanyiligira for her strategic advice. Document design (including front and back covers, and internal layout) was created by STUDIOGRAFIK.
Photo CreditsCover photo - Ream National Park Islands, Cambodia. © Stuart Chape/International Centre for Environmental Management (ICEM) www.icem.com.auForeword photo - Lesotho – Metolong Dam Toilets & Bricks Making (090625 (2)F)). © John Hogg/World BankPage 17 - Wegala Community Water Supply and Sanitation Project. Sri Lanka. © Simone D. McCourtie/World BankPage 20 - Mana, Uttarakhand, Himalayas, India. © Danielle A. Garcia/World BankPage 21 - Kedarnath, a town at 3,500 m (11, 750 ft) above sea level near the Chorabari Glacier in Western Garhwal Himalaya, the head of the River Mandakini. © Danielle A. Garcia/World BankPage 23 - Vitoriano Alves, Cruzeta, Northeastern Brazil. © Mariana Ceratti/World BankPage 26 - A young boy fetches water from a well near his home in Juliana, in the Amazon region of Brazil, near Manaus. © Julio Pantoja/World BankPage 27 - The people in Woukpokpoe village have benefited greatly from Benin’s national CDD project. They now have access to safe, clean water. © Arne Hoel/World BankPage 28 - Annual floods after Monsoon rains in the Mekong Delta. Jesse Allen, Earth Observatory using data obtained from the MODIS Rapid Response team. NASA http://eoimages.gsfc.nasa.gov/ images/imagerecords/13000/13982/terra_mekong_21sep04_250m.jpg Page 29 - Harvesting irrigated fields. Indonesia. © Curt Carnemark/World BankPage 30 - Learning Session Spatial Planning and Integrated Urban Water Management in Amsterdam, The Netherlands. © Macha Kemperman/World BankPage 34 - Workshop session: “Dam Security Management Challenges and Risk Reduction”. Montevideo, Uruguay. © Sala de Medios, Presidencia de la República de Uruguay (May 20, 2014) https://www.presidencia.gub.uy/sala-de-medios/fotografias/dinaguaPage 38 - Sifting grain. India. © Ray Witlin/World BankPage 43 - Girl getting water from community water pipe. Sri Lanka. © Dominic Sansoni/World Bank
DisclaimerThis work is a product of The World Bank with external contributions. The findings, interpretations, and conclusions expressed in this work do not necessarily reflect the views of The World Bank, its Board of Executive Directors or the governments they represent.
The World Bank does not guarantee the accuracy of the data included in this work. The boundaries, colors, denominations, and other information shown on any map in this work do not imply any judgment on the part of The World Bank concerning the legal status of any territory or the endorsement or acceptance of such boundaries.
Rights and PermissionsThe material in this work is subject to copyright. Because The World Bank encourages dissemination of its knowledge, this work may be reproduced, in whole or in part, for noncommercial purposes as long as full attribution to this work is given.
Any queries on rights and licenses, including subsidiary rights, should be addressed to the Office of the Publisher, The World Bank, 1818 H Street NW, Washington, DC 20433, USA; fax: 202-522-2422; e-mail: [email protected].

A Waterway to Resilience
Fiscal Year 2015 Annual Report

LIST OF ACRONYMS
AGWA Alliance for Global Water Adaptation
CESAN Companhia Espírito Santense de Saneamento (Espírito Santo Water and Sanitation Company, Brazil)
CIWA Cooperation in International Waters in Africa
DANIDA Danish International Development Agency
DAWASA Dar es Salaam Water and Sewerage Authority
DAWASCO Dar es Salaam Water and Sewerage Corporation
DFAT Department of Foreign Affairs and Trade (Australia)
DfID Department for International Development (United Kingdom)
DGIS Directorate-General for International Cooperation (the Netherlands)
DHMS Department of Hydro-Met Services (Bhutan)
DRM Disaster Risk Management
DSS Decision Support System
ESMAP Energy Sector Management Assistance Program
EU European Union
GFDRR Global Facility for Disaster Reduction and Recovery
GP Global Practice
GSG Global Solutions Group
ICs Indigenous Communities
IDA International Development Association
IFC International Finance Corporation
IRENA International Renewable Energy Agency
IWRM Integrated Water Resources Management
MDG Millennium Development Goal
NASA National Aeronautics and Space Administration
O&M Operations and Maintenance
PJT Perum Jasa Tirta (for-profit river basin corporation in Indonesia)
PMA Program Management and Administration
PPIAF Public-Private Infrastructure Advisory Facility
QBS Quality-Based Selection
RS Remote Sensing
SAWI South Asia Water Initiative
SONEDE Société Nationale d’Exploitation et de Distribution des Eaux, (National Public Water Supply Utility, Tunisia)
SDG Sustainable Development Goal
SE4ALL Sustainable Energy for All
TTL Task Team Leader
USACE United States Army Corps ofEngineers
USDMA Uttarakhand State Disaster Management Authority
WB World Bank
WBG World Bank Group
WET Water Expert Team (WPP)
WGP Water Global Practice (World Bank)
WPP Water Partnership Program
WRM Water Resources Management
WSP Water and Sanitation Program
WSS Water Supply and Sanitation
WUA(s) Water User Association(s)

5
CONTENTS
LIST OF ACRONYMS 4
FOREWORD 7
EXECUTIVE SUMMARY 8
CHAPTER 1. INTRODUCTION 11
1.1 Background 12
1.1.1 Mile Marker: 2015 12
1.1.2 Reconfigured for Resilience 12
1.2 About the WPP 13
1.2.1 What We Do 13
1.2.2 From Traditional to Transformational 13
1.2.3 Theory of Change 13
CHAPTER 2. THEMATIC HIGHLIGHTS 16
2.1 Building Resilience 19
2.1.1 Building Investments: From Theory to Practice 19
2.1.2 Science Meets Investment in Nepal 19
2.1.3 Building Institutions: Decision Support Tools 20
2.1.4 Working at the Core of the Himalayas 20
2.1.5 Monitoring the Skies in Bhutan 22
2.1.6 Resilience and Rapid Urbanization in Odisha 22
2.1.7 Weather Extremes Touch Land: A Paradigm Shift for Brazil 22
2.2 Moving from the MDGs to the SDGs: Beyond Traditional WSS 23
2.2.1 The Science of Delivery: Utility Performance Improvements 24
2.2.2 Energy Efficiency: From Guidelines to Piloting 24
2.2.3 Fixing the Institutions that Fix the Pipes 25
2.2.4 The Art of Delivery: Reaching the Marginalized 25
2.2.5 The Next Generation: Gender and Water (writ large) 26
2.3 Confronting Complexity in WRM through Integrated Approaches 27
2.3.1 Complex Geographies: Indonesia and the Philippines 28
2.3.2 Citizen Engagement for Integrated Management 30
2.3.3 Learning from the Dutch about Integrated Urban Water Management 30
CHAPTER 3. DELIVERING RESULTS 31
3.1 How We Measure Success 32
3.2 Overview of Fiscal Year 2015 Results 32
3.2.1 Outcome 1: WPP Strategic Funding Mobilized 32
Crowding in New Expertise 32
Co-Creating Solutions 33
3.2.2 Outcome 2: Knowledge and Operational Tools Created, Disseminated and Used 33
Global Networking: Utility CEOs Learn from Their Peers 33
Stakeholders Devise Strategy for Dam Safety 34
Changing the Way We View Water and Agriculture 34
3.2.3 Outcome 3: Plans and Strategies Designed and Capacity Enhanced
for Improved WRM and Service Delivery 35
Planning for Resilience Saves Lima $600 Million 35
Working at the Nexus: Non-Water Strategies Incorporate Water 36
Cost Recovery in Irrigation: Building the Capacity of Armenia’s WUAs 36

3.2.4 Outcome 4: Downstream Loans Supported through Improved Design and Implementation 37
A Pragmatic Design Change for Lebanon’s $474 Million Dam 37
Finding a Cheaper Solution for Disaster Preparedness 37
3.2.5 Outcome 5: Vulnerability Reduced via Pro-Poor and Gender-Sensitive Interventions 38
Joint IFC-World Bank Partnership Supports Small and Marginal Farmers 39
3.2.6 Outcome 6: Water Mainstreamed in Other Sectors 39
3.3Impacts–WPP’sBroadInfluenceontheGlobalDialogue 40
3.3.1 Influencing Within the Bank: An Incentive to Coordinate 40
3.3.2 Influencing Beyond the Bank 41
Annex 1. Financial Summary WPP Phase II (July 2012 – June 2015) 42
Annex 2. WPP Phase II Results Framework 47
List of Boxes
Box1-WPP’sInfluencebeyondtheBank 15Box 2 - Climate Resilience in Complex Water Systems 23Box 3 - Integrating for Resilience in the Mekong 28Box 4 - Additional Project Outcomes: Physical and Natural Assets Protected 38
List of Figures
Figure 1 - Knowledge in Implementation 14Figure 2 - Drought Preparedness in Implementation 23Figure A1 - WPP Phase II Financial Overview (as of June 30, 2015) 45Figure A2 - WPP Activity vs. PMA Disbursements (July 2012 – 2015) 46
List of Tables
Table 1 - FY15 WPP Strategic Focus 18Table 2 - Indicator A: Funding Mobilization 33Table 3 - Indicator B: Events and Training Support 34Table 4 - Indicator C: Web-Based Outreach and Use of WPP publications 35Table 5 - Indicator D: New Plans and Strategies Promoted 35Table 6 - Indicator E: Capacity Enhancement 36Table7-IndicatorF:BankLendingInfluenced/Leveraged 37Table 8 - Indicator G: Physical and Natural Assets Protected 38Table9-IndicatorH:Beneficiaries 39Table 10 - Indicator I: Cross-sector mainstreaming 40Table A1- Overview of Donor Contributions to the WPP - Phase II 44Table A2- WPP Phase II Financial Overview (as of June 30, 2015) 45Table A3 - WPP Phase II Results Framework (Part I of 2) 48Table A4 - WPP Phase II Results Framework (Part 2 of 2) 49

7
FOREWORD
The adoption of the Sustainable Development Goals (SDGs) is an ambitious step
toward poverty eradication in all its forms. These global goals aim to shift the world
onto a sustainable and resilient path by 2030 – a journey we will collectively take
towards protecting the dignity and equality of each person. To get there, we need
to expand our funding from billions to trillions, leveraging every grant dollar to
crowd in public and private investment. The World Bank Group (WBG) is eager to
be a major driver and implementer of this agenda in its client countries.
Water permeates much of the SDG agenda, from sustainable services to
enhanced agricultural productivity and more resilient cities. Water is a short-
term and a long-term risk to global growth. Whether in shortage or excess,
water variability presents new challenges, and as each year passes, new
pressures emerge. In many of the poorest countries, a changing climate
and changing demographics have compounded, leaving more people more
vulnerable to more frequent extremes.
The World Bank’s Water Global Practice (WGP) was established in 2014 to
confront this complexity. Based on the tenant that water security should be
everyone’s business, the WGP decided to move beyond the traditional lens
to embrace Water Writ Large, linking improved water management and the
services it delivers as an input to achieving the SDGs in other sectors. This
new approach requires a coalition of traditionally disparate disciplines around
a common goal – a water-secure world that balances the demands of various
water users, while ensuring that no one is left behind.
The WGP is endowed with the Water Partnership Program (WPP) as a critical
tool for implementing this philosophy. The WPP has allowed us to shape
global water policy through partnerships with innovators, which informs our
investments and provides us with the tools we need to anticipate the needs of
the future. By combining analysis, capacity building and knowledge exchange
in one platform, the WPP positions the WGP to tackle complex water issues by
taking global knowledge to the local context.
I am pleased to introduce this Annual Report “A Waterway to Resilience” which
highlights the program’s progress and results and shows how it is supporting
the WGP in its ambitious vision. During Fiscal Year 2015 (FY15) the WPP
focused resources in three areas: building resilience; going beyond traditional
service delivery; and using integrated approaches to confront complexity. Each
WPP-funded activity makes a unique contribution to our clients’ sustainability.
Our partners and WPP donors - the governments of the Netherlands, United
Kingdom, Denmark and Austria - are making a true difference with their
support. We are also proud to announce that the government of Switzerland
joined the WPP shortly after the beginning of FY16. We look forward to stronger
collaboration and to directing our planet toward a water-secure future.
Sincerely,
Jennifer Sara
Director
Water Global Practice
8
EXECUTIVE SUMMARY
Water Writ Large and the New SDGs
The year 2015 was a turning point in water’s history. The
Millennium Development Goal
(MDG) for improved water
access has been met—5 years
ahead of schedule—but 2.5
billion people still lack access
to improved sanitation, a figure
far behind the target. The
Sustainable Development Goal
(SDG) 6, adopted in September
2015, calls for universal access
to water and sanitation and
stretches far beyond access
to ensure proper resource
management, from both the local
and transboundary perspectives,
including efficient use, pollution
control, and ecosystem services.
The impacts of climate change are being felt primarily through water. Adapting to a new reality
of extremes— from a lack of
water to serious flooding—
requires a paradigm shift in
the way we view, manage, and
use water resources. If done
properly, adaptation may also
bring about the resilience
needed to guard countries
against climate-related impacts
for centuries to come.
Forthefirsttime,theWorldBank (WB) is organizing itself around the same principle, termed “water writ large.” The
WB brings a link between the
resource itself and the services
it delivers, as well as an input to
achieving SDGs in other sectors.
Water has become one of the
Bank’s 14 new Global Practices
(GPs)—the pillars of a new
business model that ensures
the integration of the best
global knowledge within lending
operations.
The Bank now systematically consolidates global knowledge and experience and keeps up ondevelopmenttrendsinfivemainfields.The new structure,
embodied in five thematic
Global Solution Groups (GSGs)
in the Water Global Practice
(WGP) (irrigation, hydropower,
water supply and sanitation
(WSS), water economics and
poverty, and water resources
management (WRM)), ensures
external and internal lessons
learned are incorporated into
project designs and integrated
across the Bank’s six regions.
The WB is strategically and tactically positioned to serve as an implementation arm of the Water SDG in the face of complexity and uncertainty. By
strengthening the core of our
delivery system, the WB helps
client countries devise more
integrated solutions that build
resilience in the face of complex
water challenges and growing
uncertainty.
The WPP: From Traditional to Transformational
The Water Partnership Program (WPP) is working to end poverty and boost shared prosperity through support to investments and analytical work in the water sector. A partnership between
the WB and the Governments
of the Netherlands, the United
Kingdom, Denmark, and
Austria, Switzerland became
a WPP partner in Fiscal Year
2016, the WPP is helping client
countries enhance water security
by mainstreaming climate-
resilient growth and pragmatic
approaches into WRM and WSS.
The WPP remains committed to
its initial goal—providing water
security for all—by continually
building on the experiences of its
partners to expand its repertoire
of tools and methodologies.
The WPP has evolved from single-country interventions on either WSS or WRM, to more integrated framework solutions that address multiple water uses at the city, basin, or regional level. The evolution
of the program is strongly
driven by its donors and the
changing needs of clients, who
are now looking to the WB
for more sophisticated and
comprehensive solutions. Today,
the new structure of the WGP
is well aligned with the delivery
model of the WPP, which, by
focusing on WRM interventions
has pioneered a water writ large
approach to addressing multi-
sector challenges.
The WPP moves from traditional to transformational. WPP activities add value to
many of the WGP’s operations
by creating the space and time
needed to deal with challenges
as they arise. The WPP provides
a solution to fixed budgets and
schedules of a typical lending
operation and offers flexibility
in the face of new challenges
or demands by helping teams
find world-class expertise,
and low-cost and innovative
ways to improve design and
implementation.

9
Theory of Change
The WPP’s value added is
manifested through three types
of interventions:
• Getting the best ideas on the table. The program
supports global partnerships
that foster collaboration
between academia, industry,
client governments, donors,
and International Financial
Institutions.
• Driving creative thinking and make ideas that work replicable. The WPP supports
global knowledge generation
and exchanges through study
tours, events, and peer-to-
peer learning.
• Delivering innovation in a big way. The WPP teams with
the brightest people in the
best organizations to design
new tools for task teams
and clients, and to take best
practices from developed
countries and contextualize
them for developing countries.
Long-term investments in partnerships and global initiatives yield targeted improvements in policies, institutions, and project designs at the activity level. These
individual improvements can
potentially influence a $22 billion
and growing water portfolio.
When Bank projects have
better outcomes, as a result
of WPP support, the projects’
beneficiaries ultimately benefit
from enhanced water security.
The WPP shapes the knowledge architecture of the practice through the GSGs. From an
organizational perspective,
the WPP resides in the Global
Programs Unit of the WGP,
and its goals have influenced
the shape and scope of the
GSGs. Knowledge produced
and lessons learned in the
implementation of WPP activities
feed back into the design of
operations and the strengthening
of global partnerships, creating
a virtuous cycle of improvement
in outcomes with each iteration
(see figure 1). By integrating the
WPP at the core of the WGP,
successes are more easily scaled
up or replicated globally.
Through this same theory of change,theWPPinfluencescountry-funded programs. By working upstream with
clients on policies, strategies
and institutional arrangements,
the contributions of the WPP
are relevant far beyond the
influence of the World Bank’s
individual operations. This
year’s report also highlights
the broader impacts of the
Decision Tree Framework, the Science of Delivery in Urban
WSS Initiative, and the Complex Water Systems Initiative, each
with contributions to the WGP’s
global knowledge agenda and
several country-level pilot
programs.
Report Outline
This Annual Report summarizes
the WPP Phase II activities
implemented and results achieved
during the Bank’s fiscal year 2015
(June 2014 – June 2015).
Chapter 2 offers three select
themes supported by the WPP
this year: building resilience; beyond traditional WSS; and
confronting complexity.
• Building Resilience: Bolstering client capacity
to adapt to climate change
through more robust
investments, policies, and
institutions;
• Beyond Traditional Water Supply and Sanitation (WSS): Helping service
providers become more
efficient and sustainable on
the path to universal access;
and
WPP Phase II Results (July 2012 – June 2015)
• 168 activities completed, of which 94 by the WPP and 74 by the Water Expert Team (WET)
• 58 countries across all six Bank regions supported• 154 Bank projects influenced, involving a combined loan amount of
$13.7 billion• 133 Bank projects benefited from an improved design• 26.5 million people benefited from improved water services or water
resources management • 86% of all targets expected to be met by the end of the program (June
2016)• 4 Global Initiatives showing clear influence on Bank operations and
country-financed programs

10
• Confronting Complexity through Integration: Directing resources to areas
with complex hydrological
systems to help clients
use integrated planning
models for Water Resources
Management (WRM).
Chapter 3 focuses on the results
and presents the progress made
as of June 2015 toward each
WPP indicator target (targets
have been set for June 2016),
providing illustrative activities for
each. The chapter also provides
a qualitative summary of the
overall impact and influence of
the program, both within and
outside the Bank, which are
not perfectly captured in the
quantitative results framework.
As of June 2015, 35 of the 44 indicator targets had been met
or are likely to be met by the
close of the program’s second
phase in June 2016. This figure
represents 80 percent of the
WPP Phase II targets.* A few
targets are likely not to be met
and were discussed with the
donors in 2015.
While the results framework reflects many of the outcomes
and outputs of WPP activities, the
program as a whole also yields
qualitative outcomes beyond what
is presented quantitatively in the
results framework. This applies
particularly to the program’s
added value in two distinct areas:
(i) As an incentive to coordinate
activities across practices within
the Bank, by co-funding activities
with trust funds for climate
change, water resources, energy,
or disaster risk ($2.5m total); and
(ii) As an influence beyond the
Bank, through global uptake of
the outputs from WPP’s Global
Initiatives (see box 1). A financial
summary is provided in Annex 1,
and the full results framework is
presented in Annex 2.
* This percentage excludes “to-be-determined” indicators as of June 2015.

11
CHAPTER 1
INTRODUCTION

INTRODUCTION
1
12
1.1 Background
1.1.1 Mile Marker: 2015
The year 2015 was a turning
point in water’s history. The
Millennium Development Goal
(MDG) for improved water
access1 has been met—5 years
ahead of schedule—but 2.5
billion people still lack access to
improved sanitation, a figure far
behind the target. While many
countries have made significant
advances, others have been
hindered by rapid urbanization
or are still unable to reach
marginalized groups. Having met
one goal but not the other, and
with varying degrees of success
across regions and even within
countries, gives the world cause
for reflection.
Last year was also the warmest
year on record.2 The impacts
of climate change are being
felt primarily through water—
illustrated by the lack of water
to irrigate crops and generate
power at one extreme, and
serious flooding that destroys
economies and promotes the
spread of disease at the other
extreme. In fact, one quarter of
the world’s population already
live in countries with physical
water scarcity, and in just two
decades this number is expected
to double. Adapting to this new
reality of extremes requires a
paradigm shift in the way we
view, manage, and use water
resources. On the bright side, if
done properly, adaptation may
also bring about the resilience
needed to guard countries
against climate-related impacts
for centuries to come.
Most prudently, the global goals
of 2015 have graduated to a
new degree of ambition. First,
1. Halve, by 2015, the proportion of people without sustainable access to safe drink-ing water and basic sanitation.2. Since 1880, when record keeping began.
Sustainable Development Goal
(SDG)3 6, adopted in September
2015, calls for universal access
to water and sanitation, which
means figuring out how to reach
everyone, wherever they may
need it—from the urbanite to the
agrarian, from homes to schools.
Second, Goal 6 stretches far
beyond access to ensure proper
resource management, from
both the local and transboundary
perspectives, including efficient
use, pollution control, and
ecosystem services. Finally, the
SDGs as a whole position wider
water management as a means
to achieving the goals that would
shift the world onto a more
sustainable and resilient path by
2030. For instance, managing
water while targeting vulnerable
populations in planning for urban
resilience plays a critical role in
reducing the number of deaths
and economic losses caused
by water-related disasters in
cities (SDG 11, target 5). In the
agricultural sector, planning for
climate change preparedness
requires strategies to better
manage water resources under
extreme weather conditions,
including severe floods and
droughts, to be able to increase
productivity while developing
more resilient agricultural
practices (SDG 2, target 4).
1.1.2 Reconfigured for Resilience
At the same time, and for the
first time, the World Bank (WB)
is organizing itself around the
same principle, termed “water
writ large,” to help countries
see water for what it is: a link
between the resource itself and
the services it delivers, as well
as an input to achieving SDGs
3. The Sustainable Development Goals (SDGs), officially known as “Transforming our world: the 2030 Agenda for Sustain-able Development,” are a new, universal set of goals, targets and indicators that UN member states will be expected to use to frame their agendas and political policies over the next 15 years.
in other sectors. Water has
become one of the Bank’s 14
new Global Practices (GPs)—the
pillars of a new business model
that ensures the integration
of global knowledge with the
architecture of operations and
financial resources offered to
client countries.
The Bank now consolidates
the knowledge and experience
of 350 staff into a single
Water Global Practice (WGP).
Moreover, all staff are mapped
to Global Solutions Groups
(GSGs), a network through
which they give and take
knowledge and delve deeply into
one of four topics. GSGs keep
up on development trends in
their field and ensure external
and internal lessons learned
are incorporated into project
designs. By strengthening the
core of our delivery system, we
are strategically and tactically
positioned to serve as an
implementation arm of the Water
SDG, and to support the other
SDGs through which water flows.
Our new structure is already
changing the way we deliver
to our clients. Teams working
on irrigation, hydropower,
flood protection, water supply
and sanitation (WSS), water
economics and poverty, and
water resources are under one
management structure and
integrated across the Bank’s six
regions. Clients can tap expertise
on a number of water-related
areas through the same project
or team, and draw on best
practices from any region in the
world. This means our solutions
are growing more integrated, just
as our clients’ needs are growing
more complex.

13
Today’s broader view of
water with its myriad links—
underpinned by the design of
both the new WGP and the new
SDGs—is changing the game.
Water writ large asks countries
to unbundle a knot of challenges
to understand how improving
their water management
could help them achieve other
development outcomes as well.
By extension, it opens the door
to more integrated, robust,
and sustainable solutions that
build resilience in the face of
uncertainty.
1.2 About the WPP
1.2.1 What We Do
The Water Partnership Program
(WPP) is a partnership between
the WB and the governments
of the Netherlands, the United
Kingdom, Denmark, and Austria,
working together to end poverty
and boost shared prosperity
through support to investments
and analytical work in the
water sector. Water security
is enhanced in Bank client
countries by mainstreaming
climate-resilient growth and
pragmatic approaches into
Water Resources Management
(WRM) and WSS. In 2015, the
WPP turned 6 years old. It
remains committed to its initial
goal—providing water security
for all—by continually building on
the experiences of its partners to
expand its repertoire of tools and
methodologies.
In July of 2012, Phase II of the
WPP began, which entailed an
expansion of the program’s initial
scope—meeting immediate client
demands—to also include long-
term global initiatives that help
clients prepare for the future in
areas such as climate change,
disaster risk management,
and pressing energy, food,
water nexus challenges. The
program has also evolved from
single-country interventions
on either WSS or WRM, to
more integrated framework
solutions that address multiple
water uses at the city, basin,
or regional level. The evolution
of the program is strongly
driven by its donors and the
changing needs of clients, who
are now looking to the WB
for more sophisticated and
comprehensive solutions. Today,
the new structure of the WGP
is well aligned with the delivery
model of the WPP, which, by
focusing on WRM interventions
has pioneered a water writ large
approach to addressing multi-
sector challenges.
1.2.2 From Traditional to Transformational
For our clients, development can
be a sluggish journey toward
growth, filled with unforeseen
obstacles. WPP activities add
value to many of the WGP’s
operations by creating the space
and time needed to deal with
challenges as they arise. The
fixed budget and schedule of a
typical lending operation offer
limited flexibility in the face of
new challenges or demands
(think sudden increase in
climate-related impacts; lack
of data; institutional changes).
The WPP adds significant value
to a project by finding low-
cost, innovative, and alternative
ways to improve design and
implementation.
The niche of the WPP is its ability
to provide the best possible
knowledge, science, skills, and
solutions at the right time
to ensure that development
programs are steered in the
right direction and that project
task teams have the tools to
respond quickly and adequately
to water sector challenges.
With WPP funds, a team can
introduce innovative or proven
methodologies, consult world class
experts, establish strong alliances,
take an integrated approach, and
think outside the box.
1.2.3 Theory of Change
Since the creation of the WGP,
the WPP has moved from serving
as a trust fund satisfying regional
demands, to a centralizing force
that helps direct the thinking of
the practice in new areas like
climate change, disaster risk
management, and cross-sector
integration. The partnership thus
both responds to the challenges
of today and anticipates those
of tomorrow. The WPP’s value
added is manifested through
three types of interventions, each
taking the client from traditional
to transformational ways of
thinking:
• First, to get the best ideas
on the table, the program
supports global partnerships
that foster collaboration
between academia, industry,
client governments, donors,
and IFIs.
• Second, to drive creative
thinking and make ideas that
work replicable, the WPP
supports global knowledge
generation and exchanges
through study tours, events,
and peer-to-peer learning.

INTRODUCTION
1
14
• Finally, to deliver innovation
in a big way, the WPP teams
with the brightest people
in the best organizations
to design new tools for
task teams and clients,
and to take best practices
from developed countries
and contextualize them
for developing countries.
Analytical work often
jump-starts much-needed
investments and informs their
design and implementation.
The WPP consistently uses
the Bank’s lending programs
to pilot and scale up new
approaches surfaced through
both operational and
analytical experience.
These kinds of interventions
are depicted in Figure 1.
To summarize, long-term
investments in partnerships
and global initiatives yield
targeted improvements in
policies, institutions, and project
designs at the activity level.
These individual improvements
influence a $22 billion and
growing water portfolio.
When Bank projects have
better outcomes, as a result
of WPP support, the projects’
beneficiaries ultimately benefit
from enhanced water security.
In addition to influencing the
Bank’s portfolio, the WPP shapes
the knowledge architecture
of the practice through the
GSGs. From an organizational
perspective, the WPP resides
in the Global Programs Unit of
the WGP, and its goals have
influenced the shape and scope
of the GSGs. Now more than
ever, knowledge produced
and lessons learned in the
implementation of WPP activities
feed back into the design of
operations and the strengthening
of global partnerships, creating
a virtuous cycle of improvement
in outcomes with each iteration
(see figure 1). By integrating the
WPP at the core of the WGP,
successes are more easily scaled
up or replicated from one side of
the globe to the other.
Through this same theory of
change, the WPP influences
country-funded programs. For
example, the WPP’s Thirsty
Energy initiative is influencing
the way China and Morocco
conceptualize water use in
energy on a national scale (see
box 1), with future impacts
on large-scale investments
in the energy sector. By
working upstream with clients
on policies, strategies and
institutional arrangements, the
contributions of the WPP are
relevant far beyond the influence
of the World Bank’s individual
operations. This year’s report
also highlights the broader
impacts of the Decision Tree
Framework, the Science of
Delivery in Urban WSS Initiative,
and the Complex Water Systems
Initiative, each with contributions
to the WGP’s global knowledge
agenda and several country-level
pilot programs (see Chapter 2).
Figure 1 – Knowledge in Implementation
Better Project Outcomes Enhance Water Security for All
Project Lessons Collated by GSG
Global Partnerships & Knowledge
• Global Initiatives • Learning: peer-to-
peer, study tours, events
• Knowledge: support to Global Solutions Groups
• Technical assistance provides sustained Bank-client engagement outside project timelines
• Countries’ self-funded programs
• Innovative methods, tools, and analyses enhance project design, implementation, and evaluation
Improving Client Policies and Institutions
Improving WGP Projects

15
WPP PHASE II ACTIVITIES HAVE BEEN IMPLEMENTED IN 58 COUNTRIES
Box 1 - WPP’s Influence beyond the Bank
The Decision Tree Framework (see Section 2.1) is informing the design standards of the Climate Bond Initiative; being used by the IFC in the design of its hydropower portfolio; and has been used by the United States Army Corps of Engineers to draft new guidelines for water engineers. Moreover, other IFIs have asked the Bank to present the framework to see how it can be used in their institutions, and it has become part of the core guiding principles promoted by the Alliance for Global Water Adaptation (AGWA).
The Thirsty Energy initiative (see Section 3.3) is being used to incorporate potential water constraints into China’s upcoming 5-year energy plan (2016–20). In Morocco, the initiative is being used to formulate a road map to identify key investment and planning opportunities. While this influence at the national level extends to governments and private entities involved in water and energy, it also has the potential to affect regional and global thinking on nexus issues. In addition, the Thirsty Energy team has provided inputs to the United States Department of Energy, the International Renewable Energy Agency (IRENA), the Clean Energy Ministerial, and Sustainable Energy for All (SE4ALL), and continues to build a very strong alliance with the private sector.

INTRODUCTION
1
16
CHAPTER 2
THEMATIC HIGHLIGHTS

17
CHAPTER 2
THEMATIC HIGHLIGHTS

THEMATIC HIGHLIGHTS
2
18
In FY15, the WPP focused
resources on three critical topics
that will help advance the SDG
agenda:
• Building Resilience: Bolstering client capacity
to adapt to climate change
through more robust
investments, policies, and
institutions;
• Beyond Traditional Water Supply and Sanitation (WSS): Helping service providers
become more efficient and
sustainable on the path to
universal access; and
• Confronting Complexity through Integration: Directing resources to areas
with complex hydrological
systems to help clients
use integrated planning
models for Water Resources
Management (WRM).
This chapter showcases select
results and impacts related to
work in these priority areas
for FY15. Table 1 outlines the
strategic relevance of the
activities summarized in this
chapter, and indicates how
WPP funds were catalyzed to
make progress toward three
specific objectives. Within each
topic, WPP-funded activities
utilized the WGP’s full suite
of instruments depending on
specific client needs, including:
piloting of analytical frameworks
designed under WPP Global
Initiatives; technical assistance on
institution building; codification
of best practices from developed
to developing countries; study
tours; south-south knowledge
exchange and just-in-time
support from global experts.
The activities described in this
chapter both pull from and
contribute to the WGP’s Global
Solutions Groups for Water
Supply and Sanitation and Water
Resources Management/Water
Security. WPP fuels a large
part of the WGP’s “knowledge
in implementation” approach
as described in the WGP’s
Theory of Change (see figure
1). Thus, lessons learned are
already feeding back into the
WGP’s centralized knowledge
architecture to improve the next
generation of project designs
and refine the tools available to
task teams and clients.
Table 1 – FY15 WPP Strategic Focus
FY15 Priority Topic Global Initiative Piloted Objective Strategic Focus
Building Resilience Decision Tree Framework Taking clients from reactive to proactive in managing risk
Climate-sensitive project areas
Beyond Traditional WSS The Science of Delivery in Urban WSS
Addressing both the supply and demand side for sustainable WSS
Utility managers and marginalized communities
Confronting Complexity Complex Water Systems (CoWS)
Using integrated planning models to address multiple challenges
East Asia & Pacific Region as testing ground for global scale-up
Figure 1 (summary version) - Knowledge in Implementation
Better Project Outcomes Enhance Water Security for All
Project Lessons Collated by GSG
Global Partnerships & Knowledge
Improving Client Policies and Institutions
Improving WGP Projects

19
2.1 Building Resilience
Climate change and water are
intrinsically connected. Climate
change is already hitting the
water cycle, causing more
intense and frequent floods and
droughts. The exact impacts vary
from locale to locale, as does the
degree of uncertainty to adapt
to the future climate without
compromising the development
needs in the short term.
Countries are demanding more
reliable tools to manage the risks
and reduce the vulnerabilities
associated with a changing
climate so they can maximize
the benefits of water planning
and investments. Adaptation
means securing water for people
and the economy by preparing
institutions, designing the right
policies, and making sure that
investments help communities
and cities better prepare for
natural disasters.
Toward the building resilience
agenda, the WPP is helping take
clients from reactive to proactive
approaches to managing
disasters and risk using a range
of instruments at different
planning stages. First, the WPP
is rolling out a major analytical
piece on climate change – taking
theory to practice to build
resilience into project design
in Nepal, Mexico and Lebanon.
An alternative methodology –
Decision Making under Deep
Uncertainty - was used to save
nearly $600 million in Peru
(see Chapter 3, Outcome 3).
Second, global best practices in
institutional and policy design
are supporting forward thinking
disaster preparedness and risk
reduction in Brazil, India, and
Bhutan. This first generation of
just-in-time support on disaster
preparedness will feed into the
learning of the GSG on WRM
to better inform future piloting,
replication and scale-up.
2.1.1 Building Investments: From Theory to Practice
The World Bank (WB) requires
that every International
Development Association
(IDA) project incorporate
climate risk in the respective
country’s priority investments.
Following this mandate, the WPP
spearheaded the creation of the
Decision Tree Framework,4 a tool
developed in partnership with
academia, to determine whether
project designs are robust to
climate risks.
The tool looks to a robustness-
based, bottom-up evaluation
as an alternative to previous
top-down approaches to climate
risk assessment, moving beyond
the use of downscaled global
circulation models (GCMs),
which are often of limited use
to support practical policy
decisions. It brings together
advanced economic modeling
to identify the potential
benefits, or best-preferred
investment alternatives, based
on a systematic assessment of
climatic and non-climatic risks.
Three applications of the
Framework, published in 2015,
are highlighted here:
• In Nepal, to assess the pre-
feasibility project design
options and costs of an
installed hydropower capacity
of 335 MW in the Upper Arun
Hydropower Project (UAHP),
and a basin-scale analysis for
the Koshi Basin Hydropower
Development Project that
considered five existing
dams, including the UAHP,
to confirm the proposed
investment options.
4. For an elaborate explanation of this new tool, see “Confronting Climate Uncertainty in Water Resources Planning and Project Design – The Decision Tree Framework.”
• Mexico is now ready to use
the framework to assess
the resilience of its largest
aqueduct system, supplying
water to more than 6 million
people (see box 2).
• In Lebanon, a rapid
assessment and analysis
served to identify the future
climate scenarios that would
fill the water supply gap for
Greater Beirut (see Outcome
4, Chapter 3).
2.1.2 Science Meets Investment in Nepal
Hydropower currently provides
over 90 percent of Nepal’s
total electricity, and demand is
outstripping supply, particularly
in the dry season, when energy
production declines by 60 to
75 percent. Climate change will
likely pose significant problems
for hydroelectric generation
given the projected increase in
the temporal variability of rain
between seasons, resulting in
more severe and frequent floods
and droughts.
The application of the Decision
Tree Framework to the UAHP
has helped to identify robust
investment portfolios that meet
conditions in which performance
is maximized over a range of
plausible futures.

THEMATIC HIGHLIGHTS
2
20
The assessment identified robust
investments (that is, those that
perform acceptably well over
a range of plausible futures)
considering the total annual
electricity generation, including
both firm (guaranteed) and
energy produced in the dry
season, as well as environmental
flow impacts, urban and
agricultural water supply, and
flood alleviation (for storage
schemes). The approach
quantifies how different
portfolios of hydropower
assets (their scheme, capacity,
operating policies) have an
impact on the trade-offs
between these performance
metrics. Although this exercise
explored hydropower investment
options at the project- and basin-
level, it also facilitated planning
at the national level.
2.1.3 Building Institutions: Decision Support Tools
In response to recent deadly
floods across India, the WPP
is supporting the preparation
of a Local Resilience Action
Plan for cities in Odisha and an
early warning system for the
State of Uttarkhand. Both tools
take an integrated approach
to understand the risks and
vulnerabilities to future water-
related hazards, looking at a
combination of variables—ranging
from glacial melt and river
morphology to changing land
use patterns and urbanization. In
Brazil, the WPP is supporting a
national drought framework and
risk reduction program.
The WPP is also aiding in the
rapid development of two
nascent organizations: the
Uttarakhand State Disaster
Management Authority
(USDMA), in India, and Bhutan’s
Department of Hydro-Met
Services (DHMS). Both newly
formed agencies need to deliver
on their mandate to provide
better hydromet services like
forecasting and early warning
systems, and the WPP is bringing
global expertise to bolster
capacity and plan the required
capital investments.
2.1.4 Working at the Core of the Himalayas
In June 2013, the State of
Uttarkhand in India experienced
a one-time cloudburst flood
event resulting in over 6,000
deaths, leaving over 200 villages
with crop and property damage,
Mana, Uttarakhand, Himalayas, India. Photo: Danielle A. García/World Bank

21
and displacing 75,000 people.
The force of the deluges and
landslides reshaped the newly
formed river pathways, changing
flow patterns. Now, flood models
need to be continually updated
to reflect rapid changes and
newer distributions of flood risks,
as well as social and economic
vulnerabilities across the state.
The WB is helping the newly
created USDMA to better
understand the morphology of
the Mandakini and Alakhnanda
Rivers through a US$250
million project for post-disaster
reconstruction and preparedness.
The project includes financing
for a decision support system
for disaster risk management,
based on, hydrometeorological
data, topography, geology, land
use, and current and future
infrastructure (such as dams)
in the context of the impact of
climate change on glaciers and
water flow variability.
Through the WPP, the WB is
helping USDMA build a Google
Earth Engine (GEE) platform
to provide an up-to-date
data catalog that can support
responsive analysis. Streaming
satellite imagery available in
GEE can quickly and cheaply
generate flood vulnerability
maps for immediate planning
and decision making in the
wake of a flood event, at least
while more precise hydrologic
models are being developed.
This platform is combined with
a social vulnerability assessment
that provides actionable
information on where to focus
disaster resilience efforts,
especially when dealing with
regions undergoing rapid land
use change, like Uttarakhand,
through both urbanization
and geomorphic changes. The
platform’s accessibility and the
fact that the browser-based
model can be adjusted set a new
approach for risk modeling—one
that is adaptable to different
levels of technology and data
management requirements.
Kedarnath, a town at 3,500 m (11, 750 ft) above sea level near the Chorabari Glacier in Western Garhwal Himalaya, the head of the River Mandakini, was the area worst affected by the floods of June 2013. Thou-sands of people were killed and thousands (mostly pilgrims) were reported missing or stranded due to the landslides. Photo: Danielle A. García/World Bank

THEMATIC HIGHLIGHTS
2
22
2.1.5 Monitoring the Skies in Bhutan
Bhutan is a mountainous country
situated in the southern slopes of
the Himalayan range. Its location,
climate, and topography make
the country highly prone to a
variety of hydrometeorological
hazards. Flooding is a recurrent
phenomenon, especially during
the monsoon season. Given the
number of existing hydropower
plants and the ongoing
construction of many others,
natural dam formation and dam
bursts (often accompanied by
the release of huge volumes
of water) pose a severe risk to
hydropower plants, farmlands,
and human settlements.
Through the WPP and the South
Asia Water Initiative (SAWI),
the WB supported the DHMS
of the government of Bhutan
to improve its strategic plan
for DRM and climate resilience
through the modernization of
its hydrometeorological services
network. The activity advanced
an assessment of the country’s
needs and priorities, a review
of its existing observation and
forecasting systems, and the
design of a modernized end-to-
end early warning system.
A detailed analysis5 was
undertaken for two pilot basins/
catchments to show how risk
resilience can be improved
through better forecasting and
the use of early warning systems.
The study results will help
identify priority areas for Bank
support through a subsequent
lending program.
5. Modernizing Weather, Water, and Climate Services: A Road Map for Bhutan.
2.1.6 Resilience and Rapid Urbanization in Odisha
In early August 2014, heavy rains
triggered floods in the northern
Odisha, affecting over 3.3 million
people, and destroying 320,000
hectares of cropland, clearly
showing the need for immediate
action on flood risk management.
Odisha is one of the poorest
states in India and climate
change is expected to deepen
poverty in Odisha if capacity
and resilience in key sectors are
not bolstered. Bhubaneswar,
Odisha’s capital, is rapidly
urbanizing—today’s population
of 1 million is likely to be double
that size by 2025.
The WB, through its WPP,
is working with the state
government and other donors
to reinforce resilience in
Greater Bhubaneswar through
the Odisha Disaster Recovery
Project as well as other urban
development projects. Three
action plans—one for the State
of Odisha and two for the cities
of Bhubaneswar and Cuttack—
provide an in-depth vulnerability
and hydromet risk assessment.
In Bhubaneswar this work was
expanded to include a technical,
institutional, and financial gap
analysis for the poor districts and
then used to formulate a Local
Resilience Action Plan (LRAP)
that is now being developed to
assess the risk of natural hazards,
the vulnerability at state and city
levels, and the policy capacity
to respond adequately to those
risks and vulnerabilities.
2.1.7 Weather Extremes Touch Land: A Paradigm Shift for Brazil
One of the most severe multi-
year droughts in decades has
plagued Northeast Brazil for the
past 5 years. Residents have
long lived under challenging
climatic conditions, which
are further exacerbated by
an increasing population and
corresponding water demand.
At the request of Brazil’s Ministry
of Integration, the WGP is
assisting the government of
Brazil in building a proactive
drought management
framework6 to better anticipate
drought events and to guide
relief measures more effectively.
The program is divided into
two tracks: (i) enhancing the
government’s capacity to
manage droughts through a
national and state drought policy
framework and dialogue; and
(ii) implementing a regional
pilot program in the Northeast.
Preparedness measures are
intended to increase resilience
through a robust monitoring,
early warning, and forecasting
data system; detailed risk
assessments, identifying type of
risk and vulnerable population;
and risk reduction and disaster
response programs. These
elements taken together
underpin the shift from the
current crisis-type management
of droughts—characterized by
a reactive approach—to a more
proactive risk management and
drought preparedness system
(see figure 2).
6. Living with the Semi-Arid and Proactive Drought Management in Northeast Brazil: A New Perspective (Água Brasil series # 90527).

23
1. Monitoring and forecasting/earlywarning
Foundation of a drought plan Indices/ indicators linked to impacts and action triggers
Feeds into the development/ delivery of information and decision-support tools
2.Vulnerability/resilienceand impact assessment
Identifies who and what is at risk and why
Involves monitoring/ archiving of impacts to improve drought characterization
3. Mitigation and response planning and measures
Pre-drought programs and actions to reduce risks (short and long-term)
Well-defined and negotiated operational response plan for when a drought hits
Safety net and social programs, research and extension
Other activities supported
include a multi-sectoral impact
assessment and a vulnerability
analysis of the current drought.
These activities will enable
a more coordinated and
systematic response to droughts
and the development of a long-
term mitigation strategy. A
report published in 2015 furthers
the dissemination of the Brazil
case study, by documenting the
analyses carried out, as well as
the preparedness measures and
approaches used at the national
and subnational levels.
2.2 Moving from the MDGs to the SDGs: Beyond Traditional WSS
Providing universal access to
improved WSS services is more
complex than it sounds. Moving
from the MDGs to the SDGs will
require making leaps beyond
traditional approaches to WSS to
reach the marginalized – whether
in rural or informal urban areas
– and to build more efficient
systems that ensure sustainable
and high quality service delivery
for all in the long-term.
Vitoriano Alves, Cruzeta, Northeastern Brazil. Photo: Mariana Ceratti/World Bank
Figure 2 – Drought Preparedness in Implementation
Source: Gutiérrez, A.P.A., N.L. Engle, E. De Nys, C. Molejón, and E.S. Martins. 2015. Living with the Semi’Arid and Proactive Drought Man-agement in Northeast Brazil: A New Perspective. Água Brazil Series. World Bank Group. Note: These three pillars support a paradigm shift from reactive crisis management to more proactive approaches to drought events.
Box 2- Climate Resilience in Complex Water Systems
The Cutzamala system supplies water to more than 5 million inhabitants of Mexico City and is one of the largest and most complex systems in the world. The WB’s WGP is supporting the Basin Organization of the Valley of Mexico (OCAVM) in developing a diagnostic tool and an integrated plan for the system and its basins. As part of the diagnostic assessment, several threats to the existing infrastructure and basins were identified and OCAVM asked the WB for assistance in implementing an approach to identify vulnerabilities, conduct a climate stress test for infrastructure, and prioritize investments. In response, the WPP is finalizing a work plan that will implement the Decision Tree Framework for climate uncertainty in the Cutzamala system as one element of a long-term strategy for the sector.
Three Pillars of Drought Preparedness

THEMATIC HIGHLIGHTS
2
24
We must shift our thinking to
fill the service gap; we must
invest in building up both the
potential demand for and
supply of services. Bringing
longtime marginalized groups
into formal provision requires
taking a new look at why and
how they are disenfranchised,
and how governments can
work with service providers
so the latter perceive these
groups as a new market that,
once tapped, can bolster sector
sustainability and improve
services for all. Governments can
improve WSS service delivery by
institutionalizing universal access
goals through policies and
planning, while relying on service
providers to offer more services
to more people by operating
more efficiently.
Toward service delivery for
all, the WPP is building on its
Science of Delivery in Urban WSS
approach to bringing knowledge
into operational design. First,
the WPP is tackling the supply
side of the WSS equation, by
guiding clients to improve
sector sustainability, shifting the
focus to building more energy-
efficient infrastructure, and
creating more efficient utility
operations. Work in Tanzania,
Tunisia and Brazil is being
informed by a collection of new
analytical work and global best
practices. Efficiency programs
in infrastructure and utilities can
lead to cost-savings and thereby
make it easier to build the
capacity needed to jump-start
a series of service improvement
programs, including extending
services to the poor. Second,
the WPP is tackling the demand
side of the WSS equation – or
the art of delivery – by building
the tools needed to mainstream
gender in project design and
implementation, and studying
the delivery models that work
best for indigenous communities.
2.2.1 The Science of Delivery: Utility Performance Improvements
Under its Science of Delivery in
Urban WSS Initiative, the WPP
began codifying best practices
in utility improvements and
piloting models for bringing the
best new knowledge to the field.
An analysis of Bank support
to Urban WSS uncovered a
greater need for self-financed
improvements that utilities could
leverage as a starting block for
bigger reforms toward financial
sustainability. One of the areas
identified is energy efficiency.
Energy is generally the largest
input to water and wastewater
treatment and conveyance,
which is why shifts in energy
costs are a key concern for
water operators as they strive to
provide sustainable services.
The WPP has since promoted
this agenda through two
avenues: A Guidance Note for
TTLs and implementation of
recommendations in Brazil.
Parallel technical assistance
to utilities in Tanzania and
Tunisia on financial planning
and management are feeding
back into the toolkit for the
Science of Delivery to inform
new project designs through
the GSG. Through its utility
work the WPP is leveraging
the know-how and co-funding
provided through other Bank
trust funds, and catalyzing
south-south knowledge
exchange to help utilities learn
directly from their peers (see
Chapter 3, Outcome 2).
2.2.2 Energy Efficiency: From Guidelines to Piloting
In 2015, the WPP co-published
a technical note7 that provides
guidance to utility managers on
7. Wastewater to Energy: A Technical Note for Utility Managers and Decision Makers on Urban Sanitation in East Asian Countries.
energy recovery in wastewater
treatment. The note is geared
to the specific needs of densely
populated urban areas in East
Asia but is likewise relevant for
any developing country. The
note includes:
• A review of operating costs
in wastewater treatment
plants, the link between
energy consumption and
specific types of technology,
and the potential for energy
generation;
• Case studies presenting a
wide range of wastewater-to-
energy options for developing
countries, for both retrofit and
greenfield investments;
• A simple assessment tool
for quick quantification of
operational expenditure-
related implications of
wastewater-to-energy
facilities, and for making a
preliminary design of such a
facility’s major components;
and Identification of existing
constraints that require
attention and factors that
need to be in place when
considering investments in
energy generation.
The Guidance Note is gaining
traction in several countries,
including In Brazil, where only
38 percent of the sewage
collection is treated before
discharge, partly due to the high
cost of the electricity needed
to run treatment plants. The
WSS sector throughout Brazil is
dedicated to improving energy
efficiency to reduce costs, and
the Bank is supporting these
efforts through a $225 million
loan to bolster energy efficiency
in the Espírito Santo Water and
Sanitation Company (CESAN).
WPP funds enabled the project
team to explore various
methodologies that allow
energy to be integrated into
the decision-making processes
25
for capital investments and
operations. First, aimed at
short-term improvements,
CESAN’s performance was
benchmarked against similar
utilities in Europe and Brazil, and
an analysis of operational and
control strategies for existing
plants were conducted. The
resulting recommendations,
including specific operational
changes for three of the utility’s
largest plants that use three very
different technologies, were well
received by the government and
are being incorporated into the
design of the ongoing Bank-
financed project. CESAN was
encouraged to use its existing
capacity to make the suggested
improvements. Second, aimed
at long-term efficiencies, several
options for energy generation
and wastewater reuse have been
explored and are being shared
with the government.
This activity also allowed the
team to secure an additional
$80,000 from the Energy
Sector Management Assistance
Program (ESMAP) trust fund
to extend the analysis to other
wastewater treatment plants run
by CESAN.
2.2.3 Fixing the Institutions that Fix the Pipes
Between 2000 and 2014,
only 15 percent of Tanzania’s
population gained access to
improved WSS and the country
missed achieving the MDG. The
government’s commitment to
ramping up progress toward
universal access is part of its
Development Vision 2025, but
the country’s existing water
institutions are ill-prepared
to make this happen. In the
capital, WSS services are
governed by a lease contract
between the operator, the Dar
es Salaam Water and Sewerage
Corporation (DAWASCO), and
the asset holding company,
the Dar es Salaam Water and
Sewerage Authority (DAWASA).
These institutions are fairly
young and have little capacity to
meet rising demands for more
and better services. The Bank’s
planned Second Water Sector
Support Project will invest $225
million to strengthen DAWASA
and DAWASCO, improve their
operational efficiency, and bring
access to more of the city’s
residents. The project’s strategy
is to link WRM with service
delivery, which will require
strong coordination and data-
sharing mechanisms across
different agencies.
A specialist sourced by the
Water Expert Team (WET) gave
the core reform team advice on
capacity building needs with
an implementation plan that
includes:
• A study tour to Durban, South
Africa, to see first-hand how
the city manages bulk water
distribution, followed by a
detailed risk analysis of Dar es
Salaam’s raw water sources;
• Training on capital investment
and asset management
planning and procurement
for DAWASCO; operational
management training for
DAWASA;
• Business plan preparation for
both entities;
• Capacity building on
performance improvement
planning for both entities
aimed at self-financing the
improvement programs to
gain efficiencies.
The WPP is also supporting the
national water utility of Tunisia
(Société Nationale d’Exploitation et de Distribution des Eaux, (SONEDE)) in its development
of a road map to reach financial
equilibrium by 2016. The
study, co-funded by the WB’s
Public Private Infrastructure
Advisory Facility (PPIAF),
aims to help SONEDE, one of
the few corporatized utilities
in the region with a full cost-
recovery tariff, to finance future
infrastructure improvements on
the back of increased revenues.
A Steering Committee that
includes line ministries and
key donors was appointed to
monitor and supervise the study
implementation throughout its
14-month timetable and provide
guidance on the financial model,
scenarios used, and prioritization
of recommendations. The
Committee has reviewed the
draft and a final report will be
issued in early 2016. The project
team is also collaborating with
the European Union’s (EU) Tunis
office to ensure consistency
between the institutional
recommendations drawn from
the EU’s organizational audit of
SONEDE and this study.
2.2.4 The Art of Delivery: Reaching the Marginalized
While the supply side of the
access equation can come
down to a scientific diagnosis
of a utility’s performance, the
demand side is much more
of an art: understanding why
certain groups remain unserved
or underserved and how best
to meet their needs. The WPP
has been supporting new
analyses and tools to help TTLs
understand barriers to entry and
the specific needs of women and
indigenous communities.
While indigenous communities
(ICs) represent 7–10 percent of
the population of Latin America,
they are 2.7 times more likely
to be extremely poor and 50
percent more likely to lack
access to basic sanitation. While
these groups are often excluded
from mainstream WSS services,
their diverse delivery models
can be improved and possibly
replicated or shared across
countries.

THEMATIC HIGHLIGHTS
2
26
We now know that the adoption
and use of WSS systems is lower
and slower in ICs, partly due
to geographic dispersion, and
partly due to their sociopolitical
structures, which exist alongside
the mainstream governance
structures in a given country or
city. This means ICs’ needs are
not taken into account within
country-level resource allocation
and prioritization processes. In
essence, their political exclusion
also leads to economic exclusion,
as illustrated by their inability
to benefit from investments in
public goods like WSS.
In anticipation of the call for
universal access to clean water,
the Bank’s Latin America
and Caribbean Region (LCR)
set out to understand the
unique attributes of ICs with
regard to their demand for,
use, and adoption of WSS
services. The task team is
looking to develop a common
participatory framework and a
set of principles (a toolkit) to
guide stakeholder engagement
processes in ICs to ensure that
those vulnerable groups are duly
taken into account in the design,
development, operation, and
maintenance of WSS systems.
So far, seven field visits have
been made to Latin American
countries where the WB or other
organizations have supported
the provision of WSS services
to ICs: Panama, Paraguay,
Argentina, Nicaragua, Colombia,
Peru, and Bolivia. A wide range
of stakeholders, from central
governments to NGOs and
indigenous organizations, were
interviewed during those field
visits to extract practical lessons
from individual WSS projects.
Preliminary findings across a
range of interventions point
to three key principles for
success: respect, ownership, and
sustainability. Some of the critical
aspects identified are customs
and norms concerning water
in nature; traditional views of
sanitation and on climate change
adaptation; involvement of all
individuals in the identification
and design of solutions, as well
as in the construction of new
infrastructure; and the use of
traditional authority structures
for decision-making and
operations and maintenance
(O&M). A common thread
that emerged through all
stakeholder interviews was
that those institutions lacking
a special approach for dealing
with ICs were very interested
in the final product and its
recommendations to inform
future strategy. The toolkit will
be used to help clients (among
other ways, through eight active
Bank projects) achieve universal,
sustainable access to clean
water, something especially
important for society’s most
marginalized.
2.2.5 The Next Generation: Gender and Water (writ large)
Women and men access and use
water and sanitation in different
ways, and while the costs and
benefits are well documented,
countries still fail to address
these differences in their policy
formulation and planning. Even
development institutions and
donors, many of whom even
have a mandate to design
gender-informed projects, have
made little progress in measuring
project outcomes by gender to
better inform the design of the
next generation of interventions.
Moreover, the gender impacts
of broader WRM—including
irrigation, hydropower, and
DRM—have not yet been
sufficiently studied. This
knowledge gap expands to
even more critical issues such
as control over resources, land
ownership, decision making,
job opportunities, as well as the
physical protection of children,
and families and their health.
A global gender portfolio review
of projects from the period
2000–14, funded by the WPP,
revealed that only 4 percent of
water projects (including water
and sanitation and WRM) are
gender-informed. Given these
results, the report highlighted
the need to build WB Task
Team Leader (TTL) capacity
to understand how and where
gender considerations are critical
for project outcomes, and to give
A young boy fetches water from a well near his home in Juliana, in the Amazon region of Brazil, near Manaus. Photo: Julio Pantoja/World Bank

27
TTLs practical tools for designing
relevant interventions.
To respond to this challenge, the
WPP is developing a program that
complements the ongoing work of
the WSP on this important topic,
by supporting the WGP through
four new activities:
1. A gender-inclusive
approach to sanitation is
being promoted through
a Menstrual Hygiene
Management (MHM) note
for integration in rural water,
sanitation and hygiene
(WASH) programs;
2. A Toolkit for Mainstreaming
Gender in Water Operations
was published in 2015, and is
being used as a guide to help
task teams know when and
how to incorporate gender
elements within each stage of
the project cycle.
3. A number of gender
checklists for TTLs working
in WSS are being piloted at
design, implementation, and
evaluation stage;
4. A project concept has been
developed for a Women,
Girls and WRM Initiative,
which builds on the Toolkit
(#2 above) and helps teams
access the global experience
and local expertise needed to
make gender a major design
principle of water projects.
These four activities taken
together are building the
knowledge base TTLs need to
help them mainstream gender
in Bank projects. The activities
focus first on building awareness
of the issues—both among
clients and Bank teams—and
then provide the tools needed
to make inroads into gender-
sensitive programming. The
gender series is a response to
the pragmatic recommendations
and findings of the 2015 gender
portfolio review and, as such,
is providing quick and practical
ways to improve the World Bank
Group (WBG) performance in
terms of gender outcomes.
2.3 Confronting Complexity in WRM through Integrated Approaches
Many countries are up against
unique physical characteristics
that compound their institutional,
financial, and technical challenges
in water resources planning and
management. They need extra
resources to help them think
through the best operational
structures, planning mechanisms,
and financing schemes on the
path toward greater resilience.
The WPP’s Global Initiative on
Complex Water Systems (CoWS)
brings together in-house global
expertise to provide additional,
high-level hydrological support
in “water resource hot spots”
around the world—that is, river
basins, cities, and deltas—
where water challenges are
constraining shared growth and
exacerbating extreme poverty,
and where traditional solutions
are failing because the issues are
increasingly complex.
Many of these hot spots are in
the East Asia and Pacific Region
(EAP), which includes eight
megacities (populations over
10 million) despite the fact that
50% of the total population is still
living in rural areas. This highly
urbanizing region is also where
70% of natural disasters occur,
making water management,
especially resilience, a major
challenge for maintaining
current levels of growth. The
archipelagos of Indonesia and
the Philippines need to conduct
water resources planning in
an integrated fashion across a
multitude of basin sizes. They
are looking to the WB for
lessons from other countries on
systematic and cost-effective
approaches. Other countries in
East Asia, like China or Vietnam,
have to deal with growing
numbers of water users within
a basin or delta, which adds
to their already troublesome
erosion and flood risks. Each
unique environment requires a
customized, multi-disciplinary,
and long-term view toward
integrated WRM.
The people in Woukpokpoe village have benefited greatly from Benin’s national CDD project. They now have access to safe, clean water. Photo: Arne Hoel/World Bank

THEMATIC HIGHLIGHTS
2
28
Toward confronting these
complexities, the WPP
is incubating a variety of
instruments in EAP, including:
The roll out of CoWS in the
Philippines; institution building
in Indonesia; a data visualization
tool in Vietnam (see box 3);
documenting best practices
in participatory planning in
China; and regional knowledge
exchange on global best
practices in Integrated Urban
Water Management. The suite
of tools deployed in EAP will be
assessed to inform the Water
Security GSG’s future support in
complex environments across
the globe.
2.3.1 Complex Geographies: Indonesia and the Philippines
The Philippines comprises more
than 7,000 islands, and more
than 400 unique river basins,
including 20 major basins with
an area of more than 1000 km2,
which are also major drivers for
economic development. The
increased pressure on water
resources in recent years has
exacerbated conflicts over
competing uses of water for
irrigation, hydropower, urban
water supply, and fisheries.
The government is committed
to implementing its Integrated
Water Resources Management
(IWRM) approach, adopted in
2004, and has prioritized the
development of master plans
for each river basin. Efforts to
reform the water sector through
IWRM took off in 2011 with
the creation of an interagency
committee on the water
sector. But without national
guidelines on how to implement
the IWRM planning process,
local organizations lacked the
direction needed to properly
integrate national planning or
projected climate change risks
into their basin development
plans.
Annual floods after Monsoon rains in the Mekong Delta. Jesse Allen, Earth Observatory using data obtained from the MODIS Rapid Response team. Photo: NASA http://eoimages.gsfc.nasa.gov/images/imagerecords/13000/13982/ter-ra_mekong_21sep04_250m.jpg
Box 3 - Integrating for Resilience in the Mekong
The WPP has for several years supported the government of Vietnam toward developing a new Mekong Delta Plan. The year 2015 saw the publication of two major outputs, produced in collaboration with the government of Australia’s Department of Foreign Affairs and Trade (DFAT), which are already being used to improve investment planning across numerous sectors:
• Mekong Delta Atlas and User Guide: Facilitates stakeholder dialogue by visualizing baseline and risks
• Investment Review Report: Outlines broad, subregional strategies aligned with the Delta Plan and identifies low-regret subprojects to be financed through WB loans.
The WPP also supports complementary capacity building on planning, including the Mekong Delta Forum, which was held in February of 2015 and convened representatives from the central government and 13 delta provinces to discuss development challenges for the key subregions in the Delta.

29
Harvesting irrigated fields. Indonesia. Photo: Curt Carnemark / World Bank
As a pilot under its CoWS
Initiative, the WPP supported
the development of National
IWRM Master Plan Templates
and Guidance, which are being
used to develop individual
master plans for a range of river
basins across the Philippines. At
the same time, the task team is
providing training to build the
capacity of various basin and
national agencies responsible
for IWRM, as a precursor to
the newly planned center
for excellence and regional
training hubs that will scale
up the technical assistance.
Moreover, two pilot river basins
have been selected to develop
investment plans using the IWRM
methodology, and they will be
the first to link the new planning
mechanisms to investment loans.
The WPP is also funding work
in Indonesia, a mountainous
country comprising 6,000
islands, where most river basins
are relatively small and have
steep gradients.The country
is organized around 33 public
river basin management
organizations (RBOs) covering
63 “river territories.” Due to the
government’s concern about
the effectiveness of existing
public sector arrangements
through the RBOs and budget
constraints for O&M, the central
Directorate General for Water
Resources (DGWR) under the
Ministry of Public Works (MoPW)
in Indonesia asked the WB to
support a study to identify which
models were most effective and
could be rolled out across the
country.
With WPP funding, the Bank
team looked at two pilots in Java
and Sumatra that use Perum
Jasa Tirta (PJTs), a for-profit
river basin corporation set up as
an alternative river management
and operations model, through
special government regulations.
PJTs are responsible for bulk
water supply, O&M of river
infrastructure and flood control
works, and water quality
monitoring. They are allowed
to make a profit from the bulk
water services they provide
to hydropower stations, water
utilities, and industry users.
A report entitled Toward Efficient and Sustainable River Basin Operational Services – River Basin Operational Management Study in Indonesia

THEMATIC HIGHLIGHTS
2
30
assessed the new approach.
The study revealed that the
PJT model has been financially
sustainable on a pilot basis and
recommended that the model
be rolled out systematically,
setting up eight to 12 new PJTs
to ultimately cover the entire
country. The study advocates for
a more integrated operational
approach to basin management
and improved regulation of the
PJT model; more competition
and bidding among agencies,
a common approach for all
river infrastructure O&M; and
improvements in tariff setting,
asset management, and financial
reporting and management.
More in-depth studies have been
planned.
2.3.2 Citizen Engagement for Integrated Management
The rivers and floodplains that
have historically fed China’s vast
population are at risk of flooding
and soil erosion, leaving farming
communities economically and
physically vulnerable. China
is one of the countries most
affected by severe floods and
soil erosion, particularly in the
areas upstream of its seven
major river basins; its experience
pioneers the way for many
developing countries.
Participatory, integrated
watershed management has
proven to be a critical model
for strengthening community
resilience to floods. The WB-
funded Xining Flood and
Watershed Management Project
has helped communities in Xining
Municipality overcome such
challenges. Under the project,
which includes 17 subwatersheds
and 68,000 farmers in 44
villages, all stakeholders were
asked to participate in the
design, supervision, and O&M of
the works—ranging from gully
improvement, construction
of check dams, country roads
and terraces, and planting of
trees to the procurement of
cattle. Nearly 20 percent of the
project’s beneficiaries are ethnic
minorities, requiring a close look
at property rights, safety, and
sustainable land use practice to
protect the surrounding ecology.
Upon the successful
completion of most of the
major subprojects, and with
Xining Municipality becoming
a model of river management
for Qinghai Province, WPP
funds were used to summarize
the project’s best practices in
the fields of integrated flood
and environment management
and participatory watershed
management. The report looks
at some of the key factors
of success, including equity
issues related to project benefit
distribution, monitoring and
evaluation methods used, and
how to scale up pilot projects.
2.3.3 Learning from the Dutch about Integrated Urban Water Management
To meet WB clients’ demand
for innovative and practical
solutions to flood risks, the WGP
with the financial support of
the WPP gathered 25 decision
makers and practitioners
from Bangladesh, China, the
Philippines, and Vietnam, as
well as 10 Bank staff on a study
tour to the Netherlands to learn
about integrated urban water
management practices.
Many developing countries in
EAP lack the tools, expertise,
and instruments to factor the
potential impacts of adverse
natural events into their
investment decisions. The
countries that participated in
the study tour are among the
most affected by climate-related
impacts; they also have densely
populated coastal cities that
can learn a lot from the Dutch
experience in flood management.
The study tour included site visits
that allowed the participants
to see Dutch approaches first-
hand, as well as working sessions
and presentations followed by
discussion on specific challenges
and approaches. The participants
were encouraged to take into
account the lessons learned
during the study tour when
designing and implementing
existing and future projects.
“We have really come to realize that solving the climate change challenge requires integrated planning and innovative approaches. Working with partners such as the World Bank and the Netherlands bring this knowledge and innovation to the forefront of our efforts in flood management, which many developing countries can learn from.”
Maria Belen Andaya-Eusebio, Mayor of Pasig City in the Philippines and participant of the Integrated Urban Water Management study tour (October 2014)
Learning Session Spatial Planning and Integrated Urban Water Management in Amsterdam, The Netherlands. Photo: Macha Kemperman / World Bank

31
CHAPTER 3
DELIVERING RESULTS

DELIVERING RESULTS
3
32
3.1 How We Measure Success
The Water Partnership
Program (WPP) Phase II results
framework translates the
program’s objectives into two
principal impacts: (i) vulnerable
populations have been provided
with an enhanced quality of
life; and (ii) climate-resilient
green growth has been made
possible through water-smart
development. The first impact
represents the program’s
progress toward social and
human development goals,
while the second represents the
program’s goal toward economic
growth coupled with sustainable
development. The full results
framework is presented in annex
2. These two impacts signify
the ultimate, long-term goals
that the program promotes. The
results framework deconstructs
these ambitious impacts into
six measurable outcomes. In
turn, each of those outcomes is
systematically monitored over
time through eight indicators
and 43 sub-indicators,8 measured
against individual targets.
Section 3.2 provides a summary
of progress made on each of
the eight indicators, along with
qualitative examples. In the
course of Fiscal Year 2015 (FY15:
July 1, 2014 – June 30, 2015), the
WPP made significant progress
on its 44 sub-indicators, with
one year remaining to reach the
final targets. The program has
already met 17 targets and is on
track to meet another 18 by the
close of Phase II, at the end of
June, 2016. Thus, 33 of the 44
targets, or 80 percent, are likely
to be met (which increases to
86 percent if the three to-be-
determined indicators are taken
into account) given there is one
8. Originally 45 sub-indicators, but two were removed in 2015 following discus-sions with donors (see indicator I under outcome 6).
year remaining for progress
to be made across all sub-
indicators.
A few indicators are, for various
reasons, unlikely to be met by
the end of the program. Some of
these were stretch targets, given
the short timeline and demand-
driven nature of the program,
others have proven difficult to
monitor, given the variety of
indicators used in the tracking
system of Bank projects. Sub-
indicators that are likely not to
be met are found under indicator
C (Web-Based Outreach and Use
of WPP Publications; indicator
G (Physical and Natural Assets
Protected); and indicator H
(Beneficiaries). These are
detailed further in this chapter.
As the current results framework
is the first framework ever
implemented to monitor WPP
results, it was to be expected
that not all indicators would
yield the results foreseen.
These experiences have yielded
valuable lessons, and the WPP
team is working with Monitoring
& Evaluation (M&E) experts
within the WGP to ensure that
these lessons will be taken
into account in the design of
future results frameworks and
monitoring systems.
The WPP also has a broader
and more influential impact on
the global water dialogue; an
impact that is not necessarily
measured by the more
quantitatively oriented results
framework. Section 3.3 provides
several examples of the WPP’s
influence in building networks
within the Bank and leveraging
global partnerships beyond the
Bank, examples that illustrate
the WPP’s more enduring,
institutional impacts that are
helping lay the foundation for the
Bank and its partners to deliver
on the Sustainable Development
Goals (SDGs).
3.2 Overview of Fiscal Year 2015 Results
3.2.1 Outcome 1: WPP Strategic Funding Mobilized
The combination of targeted
WPP funding and high-quality
activities that deliver results has
made the WPP an effective tool
for fighting poverty (Indicator A:
Funding Mobilization). The WPP
strategically uses its funds to
target the world’s poorest region,
Africa, and ensures that the
quality of its activities attracts
the best global implementing
agencies by promoting quality-
based procurement. The
quality of WPP activities is also
measured by the crowding in of
other Bank and external funding
sources, including bilateral aid
from WPP donors themselves,
which totals $4.2 million under
Phase II. Three of the four sub-
indicators for indicator A have
been met, while the fourth (A3)
experienced a 100 percent
increase during FY15.
Crowding in New Expertise
In FY15, an additional $1.2 million
in WB co-funding was secured,
which is critical to the cross-
fertilization of ideas between
GPs, by combining trust funds
with project funds that bring in
sector-specific expertise. For
example, support to building
hydromet services in Bhutan
was done in concert with the
South Asia Water Initiative
(SAWI); Brazil’s wastewater-
to-energy study leveraged
$80,000 in financing from the
Energy Sector Management
Assistance Program (ESMAP)
to conduct the same study for
other treatment plants; and
the Complex Water Systems
Initiative is receiving nearly
$400,000 in co-funding from
Bank projects, the International
Finance Corporation (IFC),
SAWI, and CIWA. Other activities

33
receive co-funding from the WSP
and the PPIAF. One quarter of
the initial target of $10 million
has been met. This was a stretch
target given that alignment
with other programs’ priorities
is uncertain and limited by TTL
interest in tapping into other
funding sources. The design for
targets for this type of indicator
will be re-evaluated in future
results frameworks.
Co-Creating Solutions
A recent decision to restructure
the irrigation sector in Vietnam
requires a broader view to
improve WRM in the Mekong
Delta, where siltation challenges
are expensive to resolve. A
WPP activity supporting the
finalization of the Vietnam
Law on Water Hydraulics
has leveraged the financial,
technical, and strategic advice
of the Dutch with regard to
delta management. Through a
cooperative agreement with the
government of the Netherlands,
the government of Vietnam
learned about new dredging
and soil embankment strategies
under WPP-funded workshops
that support technical
knowledge exchange. By
bringing in Dutch global experts
and technologies, the WPP is
leveraging the knowledge of its
donor partner’s institutions, while
influencing a $100 million Bank
investment for rural development
in the Mekong. Following
this experience, the client is
implementing a pilot soil bank
creation project, also bolstered
by bilateral support from the
Netherlands for technical
assistance. And the Vietnamese
government is currently carrying
out a feasibility study to see if
the pilot can be scaled up.
3.2.2 Outcome 2: Knowledge and Operational Tools Created, Disseminated and Used
The WPP leverages the
knowledge and learning tools
of the WGP to ensure that
our clients and our staff are
able to apply cutting-edge
tools and information to their
operations. First, WPP events,
from global workshops to
local training sessions, build
the capacity of government
agencies and private firms
around the world (Indicator B:
Events and Training Supported).
Second, the program manages
on-line communications about
WPP’s work on the WB’s water
website10 and also publishes
global and project-based
studies and reports to further
the dissemination of best
practices (Indicator C: Web-
based Outreach and Use of WPP
Publications).
This year, the WPP has reached
3,000 people through learning
events, on track to reaching an
additional 1,000 people to meet
the target by next year. Of these
event participants, 77 percent
9. This number includes contracts pro-cured through (a) a selection process whereby technical quality was given at least 90% weight; and (b) single-source selection.10. See http://www.worldbank.org/en/topic/water.
indicate that they are likely to
apply the knowledge learned in
their work, surpassing the target
of 70 percent. Under indicator B,
three sub-indicators have already
been met and the remaining
two are on track. In FY15, WPP
publications represented nine out
of the top 10 WGP downloads
in FY15, with one third of
the downloads happening in
developing countries.
Global Networking: Utility CEOs Learn from Their Peers
In 2014, a total of 15 CEOs of
water utilities in urbanizing
areas of Africa participated in an
intense 3-day course on how to
turn utilities around by improving
performance and financial
sustainability. This Leadership
Course for African Water Utility
CEOs was held in Cape Town,
South Africa, and designed and
managed through a WPP-grant.
The course highlighted the
experiences of former utility
CEOs from Durban, South Africa,
and from the National Water
and Sewerage Company in
Uganda, all of whom had had
to manage complex political
economies while reforming
their utilities. Being able to learn
directly from peers fostered an
honest dialogue about critical
reform challenges and enabled
(A) Strategic use of WPP activity funds Target Results
June 2014 June 2015
1) Percentage of the value of approved WPP activities in Africa (%)
30% 51% 54%
2) Percentage of the value of firm contracts (in PRO window) adopting QBS procurement (%)*
50% 94% 84%9
3) Bank internal co-funding for WPP activities ($)
$10m $1.3m $2.5m
4) External co-funding for WPP activities ($)
$1m $0.67m $1.7m
* Quality-Based Selection (QBS) includes 90 percent quality or more, and sole-source contracts.
Table 2 – Indicator A: Funding Mobilization
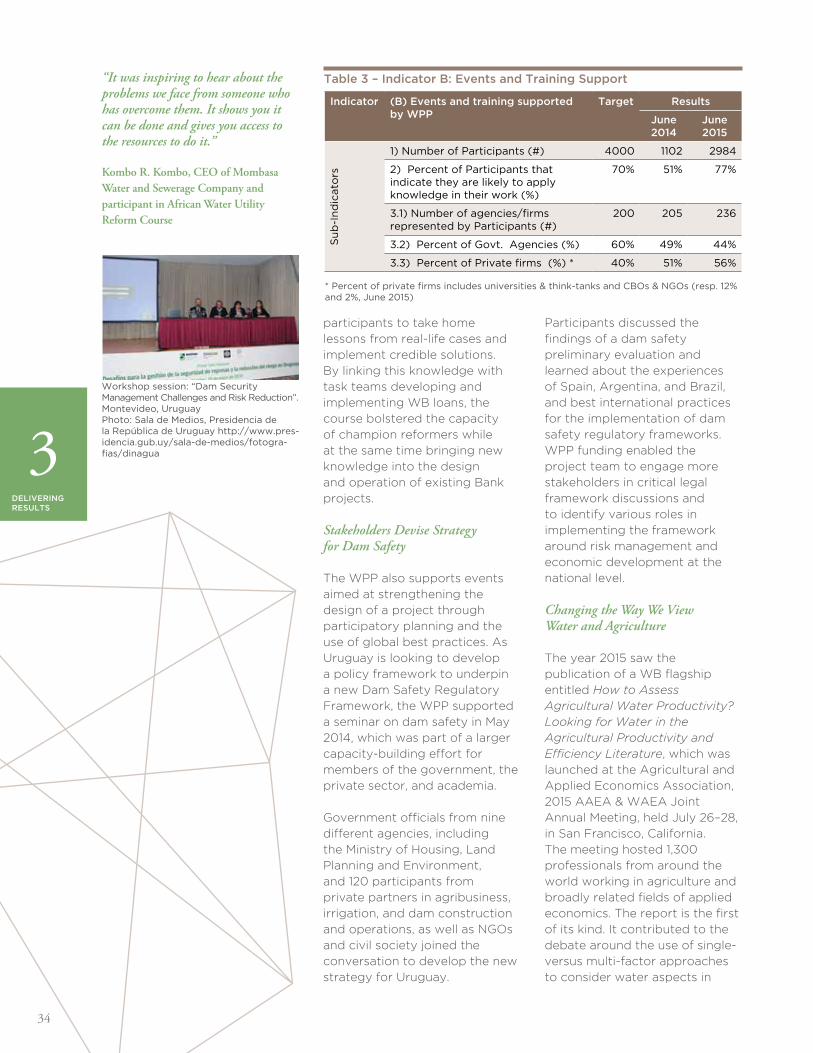
DELIVERING RESULTS
3
34
participants to take home
lessons from real-life cases and
implement credible solutions.
By linking this knowledge with
task teams developing and
implementing WB loans, the
course bolstered the capacity
of champion reformers while
at the same time bringing new
knowledge into the design
and operation of existing Bank
projects.
Stakeholders Devise Strategy for Dam Safety
The WPP also supports events
aimed at strengthening the
design of a project through
participatory planning and the
use of global best practices. As
Uruguay is looking to develop
a policy framework to underpin
a new Dam Safety Regulatory
Framework, the WPP supported
a seminar on dam safety in May
2014, which was part of a larger
capacity-building effort for
members of the government, the
private sector, and academia.
Government officials from nine
different agencies, including
the Ministry of Housing, Land
Planning and Environment,
and 120 participants from
private partners in agribusiness,
irrigation, and dam construction
and operations, as well as NGOs
and civil society joined the
conversation to develop the new
strategy for Uruguay.
Participants discussed the
findings of a dam safety
preliminary evaluation and
learned about the experiences
of Spain, Argentina, and Brazil,
and best international practices
for the implementation of dam
safety regulatory frameworks.
WPP funding enabled the
project team to engage more
stakeholders in critical legal
framework discussions and
to identify various roles in
implementing the framework
around risk management and
economic development at the
national level.
Changing the Way We View Water and Agriculture
The year 2015 saw the
publication of a WB flagship
entitled How to Assess Agricultural Water Productivity? Looking for Water in the Agricultural Productivity and Efficiency Literature, which was
launched at the Agricultural and
Applied Economics Association,
2015 AAEA & WAEA Joint
Annual Meeting, held July 26–28,
in San Francisco, California.
The meeting hosted 1,300
professionals from around the
world working in agriculture and
broadly related fields of applied
economics. The report is the first
of its kind. It contributed to the
debate around the use of single-
versus multi-factor approaches
to consider water aspects in
“It was inspiring to hear about the problems we face from someone who has overcome them. It shows you it can be done and gives you access to the resources to do it.”
Kombo R. Kombo, CEO of Mombasa Water and Sewerage Company and participant in African Water Utility Reform Course
Table 3 – Indicator B: Events and Training Support
Workshop session: “Dam SecurityManagement Challenges and Risk Reduction”.Montevideo, UruguayPhoto: Sala de Medios, Presidencia de la República de Uruguay http://www.pres-idencia.gub.uy/sala-de-medios/fotogra-fias/dinagua
Indicator (B) Events and training supported by WPP
Target Results
June 2014
June 2015
Su
b-I
nd
icato
rs
1) Number of Participants (#) 4000 1102 2984
2) Percent of Participants that indicate they are likely to apply knowledge in their work (%)
70% 51% 77%
3.1) Number of agencies/firms represented by Participants (#)
200 205 236
3.2) Percent of Govt. Agencies (%) 60% 49% 44%
3.3) Percent of Private firms (%) * 40% 51% 56%
* Percent of private firms includes universities & think-tanks and CBOs & NGOs (resp. 12% and 2%, June 2015)

35
agricultural productivity and
efficiency. Its key finding is that
most studies either incorporate
field- and basin-level aspects
but focus only on a single input
(water), or they apply a multi-
factor approach but fail to
tackle the basin level. It suggests
more research should target
agricultural water productivity
that duly takes into account
multiple inputs and basin-level
issues.
3.2.3 Outcome 3: Plans and Strategies Designed and Capacity Enhanced for Improved WRM and Service Delivery
The WPP pushes the envelope
by providing new ways of
tackling pressing water
challenges. WPP funds can
be a vital resource for clients
who need the space and time
to develop sound, integrated
strategies, policies, and
investment plans for the future
(Indicator D: New Plans and
Strategies Promoted). Strategy
development also offers Bank
staff an opportunity to work arm
in arm with client counterparts,
introducing them to new ideas
from other countries and regions,
and building their capacity in
new areas, be it urban planning
for adaptation, expanding
WSS services to new areas,
or building hydromet service
capabilities (Indicator E: Capacity
Enhancement).
Under Component 3, the WPP
nudges clients to be better
prepared—with the right
institutional capacity and the
right investment projects—for
the next challenge. Under Phase
II, in pursuit of the targets
for indicator D, the WPP has
supported the development
of 21 new strategies, policies,
or plans, 18 of which involve
competing water uses, and 16 of
which are non-water strategies
that incorporate water. One
sub-indicator has already been
met and significant progress
has been made with the other
three indicators, which can be
considered on track. Only at the
end of the program will the WPP
be able to report on Indicator
D.3 (Budget Allocated for Policy/
Strategy Implementation).
Indicator E demonstrates how
the WPP helps Bank teams
build capacity across a number
of emerging themes, from
emergency preparedness to
irrigation management. As of
June 30, 2015, four of the seven
sub-indicators had been met,
and two were on track. One is to
be accounted for at the closing
of the program.
Planning for Resilience Saves Lima $600 Million
Lima is one of the largest
metropolitan areas in Latin
America and also the second
largest desert city in the world.
Rapid population growth and
climate change are placing
additional pressures on water
resources, posing a significant
threat to water security.
Recognizing the need for action,
SEDAPAL—Lima’s water utility—
has developed a multi-billion
dollar master plan to implement
14 large and diverse infrastructure
investment projects between now
and 2040. However, questions
remained about the design,
reliability, and sequencing of the
(C) Web-based outreach and use of WPP publications
Target Results
June 2014
June 2015
1.1) Downloads per document after announcement (#) 300 692 509
1.2) Percent of downloads from developing countries (%) 50% 31% 41%
2.1) Downloads per flagship document after announcement (#)
2000 1721 1464
2.2) Percent of downloads from developing countries (%) 50% 21% 31%
3) Percent of visitors of the WPP website that visit at least 2 pages (%)
40% 66% TBD
4) Average quality assessment scoring of WPP knowledge products by client country governments (and WET products scoring by Bank project teams)
4 out of 5
4.6 4.6
Table 4 – Indicator C: Web-Based Outreach and Use of WPP publications
(D) New plans & strategies promoted by WPP activities in client countries
Target Results
June 2014
June 2015
1.1) Number of non-water Policies/ Strategies that incorporate water (#)
10 9 16
1.2) Number of policies/strategies accounting for competing water uses (#)
40 6 18
2.1) Number of Policies/ Strategies endorsed by a client agency (#)
30 6 12
2.2) Number of policy or strategy investment plans endorsed by clients (#)
15 9 10
3) Budget Allocated for policy/strategy implementation ($)
$150m TBD TBD
Table 5 – Indicator D: New Plans and Strategies Promoted

DELIVERING RESULTS
3
36
proposed investments in the face
of “deep uncertainty”11 to ensure
both “no regrets”12 and maximum
future adaptability.
The WGP, through its WPP, has
bridged this knowledge gap
with a comprehensive study
that draws upon the Decision
Making under Deep Uncertainty
(DMU), a state-of-the art method
to reduce deep uncertainty and
minimize risks. The study helped
SEDAPAL revise its master plan
by identifying the projects to be
implemented first, and preparing
adaptive future activities, that is,
activities defined in a way that
can be adjusted in response to
evolving conditions.
11. Conditions where the parties to a decision do not know or do not agree on the system model(s) relating actions to consequences or the prior probability distributions for the key input parameters to those model(s).12. In this context, “no regret” strategies aim to maximize the positive and mini-mize the negative outcomes of climate risk management for communities and societies in climate-sensitive fields such as water resources, food security, agricul-ture, and health.
The analysis found that certain
investments representing only
75 percent ($2 billion) of the
proposed total cost of the
master plan actually still made
it possible to meet the water
reliability targets to the same
extent as when implementing the
full $2.7 billion investment plan.
This method saved the city over
$600 million and has drastically
changed the originally proposed
master plan, ultimately improving
reliability at a lower cost than
projected.
Working at the Nexus: Non-Water Strategies Incorporate Water
The WPP supported the
preparation of a national
irrigation strategy (2016–25) to
restore Georgia’s position as
agricultural exporter. Approval
by the Cabinet of Ministers is
expected in June 2016. The
strategy—which aims to improve
the efficiency and effectiveness
of irrigation infrastructure and
expand the area irrigated—
includes proposals for tariff
structures, regulatory structures,
13. The WPP funded a road map towards modernizing weather, water and climate services in Bhutan, including Early Warn-ing Systems, but no project has been defined at this moment to implement the road map. More information on this activi-ty can be found in section 2.1.
management models, and
rehabilitation and modernization
of the existing infrastructure. It
also emphasizes the need for
more modern data collection and
transmission systems to monitor
the changes in water flows
resulting from the rehabilitation
investments.
Cost Recovery in Irrigation: Building the Capacity of Armenia’s WUAs
In Armenia, agriculture is the main
livelihood of rural communities
and it is highly dependent on
irrigation. Under the water
sector reforms of 2002, water
users associations (WUAs) were
established. Currently, 42 WUAs
are responsible for about 195,000
ha (or 94 percent of the 208,000
ha of irrigable lands in Armenia).
A WPP-financed activity provided
a comprehensive review and
strategic plan to enhance the
effectiveness of WUAs in Armenia
as they struggle to be financially
sustainable. Over 100 people
attended a workshop in June,
2015, to learn about operational
improvements and opportunities
to increase efficiency and
cost recovery as outlined in
the strategic plan. The WUA
strengthening process will soon
be scaled up as part of a national
strategy for the irrigation sector.
Table 6 – Indicator E: Capacity Enhancement13
Indicator (E) Capacity enhancement Target Results June 2014
Results June 2015
Actual Planned Actual Planned
Su
b-I
nd
icato
rs
"1.1) Early Warning Systems (EWS) installed (#)” 8 1 3 2 6
1.2) (Upon installation of EWS), relevant threat information is disseminated to stakeholders on a timely basis (Yes/No)
90% Yes
100% Yes
NA TBD TBD
2) Operational water users associations created /strengthened (#)
20 1448 2344 2589 6510
3) Government Agencies (#) with strenghtened capacity to address:
33 15 73 54 97
3.1) Climate change /WRM (*) 5 0 45 32 68
3.2) Water Security 8 0 16 15 16
3.3) River Basin issues 20 15 12 7 13
* WRM numbers added for June 2015

37
3.2.4 Outcome 4: Downstream Loans Supported through Improved Design and Implementation
The WPP leverages the Bank’s
water portfolio by improving
the design of projects and
building client capacity during
implementation (Indicator
F: Amount of Bank Lending
Influenced and Additional
Funding Leveraged through
WPP Activities). Through
these interventions, the WPP
influences project outcomes in a
big way. Most major outcomes
are measured through core
Bank indicators, some of which
are included in the WPP results
framework. For example,
Indicator H (under Outcome
5) aggregates the number of
beneficiaries, while Indicator G
(Physical and Natural Assets
Protected) measures progress
made in terms of environmental
and ecological outcomes.
By the end of FY15, the WPP had
influenced the design of over
130 Bank projects, a figure 30
percent higher than the target.
New WPP activities influenced
an additional $3.5 billion in WB
investments and another $5.5
billion if total project costs are
also taken into account. As
to indicator F, one target has
already been met, two are on
track, and one will be reported
on at the close of the program.
Indicator G has shown less
progress, as little demand has
been generated from project
teams working on environmental
programs that protect
natural assets like freshwater,
biodiversity, or forests. While the
sub-indicator for reduction in
aquifer pumping is on track, the
remaining six sub-indicators are
unlikely to be met.
However, several activities
that support other indicators
demonstrating protection of
natural assets are not covered
by the results framework (see
box 4). These activities include
the treatment of 5 million m3 of
wastewater to make it suitable
for agricultural use; the removal
of 17,410 tons of pollution load
by wastewater treatment plants;
and a reduction in flooding and
erosion risks that benefits 33,888
ha of land.
A Pragmatic Design Change for Lebanon’s $474 Million Dam
Lebanon has significant water
resources per capita relative to
other countries in the Middle
East, but growing water use
and climate change will require
greater storage capacity to
be able to meet local demand,
which is predicted to increase
fivefold between now and 2025.
The construction of the Bisri
Dam—as part of the $474 million
WB Lebanon Water Supply
Augmentation Project aimed at
improving water supply services
for 1.6 million people—will be
one of the largest dams in
Lebanon and will allow closing
the water supply gap of Greater
Beirut. The WPP WET’s support
was pivotal to the design of
the project by providing the
expertise necessary to assess the
reliability of the projected water
availability, taking into account
climate change and based on
international good practices as
well as local circumstances and
constraints (especially related
to data availability). Two quick
assessments were conducted
to generate the plausible
hydrological scenarios under
climate change and project
robustness tests were conducted
to review the dam flooding
design and identify the stress
points susceptible to potential
failure brought on by climatic
and non-climatic factors. As a
result, the design of the dam was
altered to reduce its capacity
from 150 m3 to 125 m3 to reflect
the revised flow projections that
take into account the expected
climate change impacts, thereby
saving significant project costs.
Finding a Cheaper Solution for Disaster Preparedness
In preparing a $75m Weather
and Climate Services Project,
the government of Bangladesh
found a lack of readily
available data for coastal
hydrometeorological monitoring
and hazard modelling, which was
required for understanding the
country’s deltaic ecosystems.
Elevation data—one such key set
of information—were scattered
across different government
departments and not being
consistently collected.
Table7-IndicatorF:BankLendingInfluenced/Leveraged
Indicator (F) Amount of Bank lending influenced&additionalfundingleveraged through WPP activities
Target Results
June 2014
June 2015
Su
b-I
nd
icato
rs
1) Value of (WB) investments supported ($)
$15b $10.2b $13.7b
2) Total project value of influenced investments in which the Bank is involved ($)
$25b $15.3b $20.8b
3) Value of additional investments (in which WB is not involved) ($)
$500m TBD TBD
4) Number of projects designs improved through a WPP activity (#)
100 71 133

DELIVERING RESULTS
3
38
A consultancy arranged
through the WET and funded
by the WPP recommended
improved coastal topography in
preparation for the start of the
project. With collaboration from
the Bangladesh Meteorological
Division (BMD), the WET
specialist mapped and classified
different regions along the coast
of Bangladesh. Priority areas
for data collection were next
selected, and cost-effective,
pragmatic approaches for
gathering data recommended,
such as sonar sensors rather
than the better but also more
expensive LiDAR technology
or comprehensive bathymetric
surveys. An accompanying
report outlines how the new
data should be stored, analyzed,
and used to design disaster risk
reduction interventions.
The consultant also
recommended a satellite
feasibility study prior to the
start of the project, which is
now being undertaken by the
government in parallel with
project preparation.
3.2.5 Outcome 5: Vulnerability Reduced via Pro-Poor and Gender-Sensitive Interventions
When it comes to impacts, the
WPP’s most direct success is
measured by the number of
people reached via individual
activities (Indicator H:
Beneficiaries). Such projects
are active in areas where nearly
2 billion of the world’s poorest
are living (sub-indicator 1), four
times more than the original
target. WPP activities support
WB projects that have benefited
over 26 million people under
Phase II (sub-indicator 2.1).
Moreover, these projects, once
completed, will benefit 50 million
people, of which half are women
and more than a third of their
target population are vulnerable.
Overall, for Indicator H, two of
the sub-indicators have already
been met or are on track, while
the other three will probably be
met or at least show significant
progress during the program’s
last year of implementation.
Table 8 – Indicator G: Physical and Natural Assets Protected
Box 4 - Additional Project Outcomes: Physical and Natural Assets Protected
• Water Reused: 5 million m3 per year of treated wastewater available for agricultural use
• Environmental Quality Improved: 17,000 tons per year of pollution loads removed by wastewater treatment plants
• Flood-Prone Areas Protected: 3,400 hectares benefiting from reduced flooding or erosion risks
Sifting grain. India. Photo: Ray Witlin /World Bank
Indicator (G) Physical and natural assets protected Target Results June 2014
Results June 2015
Actual Planned Actual Planned
Su
b-I
nd
icato
rs
1) Coastline and freshwater under biodiversity protection (km)
1200 0 0 0 0
2.1) Area brought under enhanced biodiversity protection (ha)*
1 m 0 0 1,955 2,205
2.2) Number of studies incorporating ecosystem valuation (#) 7 0 0 0 0
3) Water Storage capacity increase (m3) 12 b 0 0 0 0
4) Aquifer pumping reduction (m3 /yr) 20 m 14.3 m 20.6 m 20.6 m 16.2 m
5) Areas provided with irrigation / drainage services (ha) 2 m 93 k 700 m 395 k 1.1 m
6) Hydropower generated (MW) 3000 16 285 26 885
* Core Sector Indicator: Areas restored or re/afforested (ha)

39
Joint IFC-World Bank Partnership Supports Small and Marginal Farmers
Average agricultural productivity
levels in West Bengal are low in
comparison to those of the more
advanced agricultural states in
India. Under several components
of the West Bengal Accelerated
Development of Minor Irrigation
(WBADMI) Project, valued at over
$378 million, the WB is working
to enhance agriculture-based
rural livelihoods by boosting the
yields of agriculture, horticulture,
and fisheries.
WPP funding was used to launch
an innovative, joint WB-IFC task
team to provide support on
the knowledge agenda toward
improving the performance
of minor irrigation systems in
the project area, groundwater
development, and the
organization and operation of
WUAs and commodity groups.
The team is advising on potential
markets and value chains, how
to enhance community-led
WRM, and how to assist target
beneficiaries trying to diversify
into higher-income and less
water-intensive crops.
First, the team conducted a
rapid assessment of project
sites, in which WUAs used
a participatory approach to
identify crop segments, and
selected a preliminary set of
five districts for support. The
team next outlined potential
interventions to raise the
production of small and marginal
farmers. These interventions
will become part of the project
design and are expected to be
replicated in other agricultural
competitiveness projects
in states such as Rajasthan,
Maharashtra, and Assam.
The WPP support will be
instrumental in making long-
term project outcomes more
sustainable, among others, by
improving the economic water
productivity of small farmers.
More than 160,000 people are
ultimately expected to benefit
from this project, with 40
percent of farmers in the area
adopting better production
techniques.
3.2.6 Outcome 6: Water Mainstreamed in Other Sectors
The WPP was designed to work
from within other sectors to
ensure that water resources
are properly accounted for
in energy, agriculture, urban,
and environmental programs.
The WPP’s Global Initiatives
are used to ensure that other
sectors are brought into
the process from the very
beginning, so that a common
understanding of water’s role
can be developed and specific
tools be designed that will work
within the parameters of the
other sectors. WPP funds also
provide incentives at the activity
level for experts from various
backgrounds to collaborate, and
the WPP has been instrumental
in building platforms for cross-
sector dialogue and joint
publications. This mainstreaming
was originally measured through
indicator I (Cross-Sector
Sub-Indicators
(H)Peoplebenefitingfromprojectssupported by WPP activities
Target Results June 2014 Results June 2015
Actual Women (%)
Planned Actual Women (%)
Planned
1) Target Population in project area (#)
0.5 b 1.21 b NA NA 1.28 b NA NA
2.1) Actual beneficiaries from the project (#)
100 m 12.9 m 48 27.1 m 26.58m NA 57.66m
2.2) WSS beneficiaries (#) 35 m 12.0 m 53 17.4 m 19.8m 49.8 37.6m
2.3) Water users with new/improved irrigation & drainage services (#)
30 m 0.7 m 36 0.8 m 927k 40.3 3.5m
2.4) Other WRM beneficiaries (#) 35 m 0.1 m 51 8.9 m 5.8m 46 16.4m
Table9–IndicatorH:Beneficiaries

DELIVERING RESULTS
3
40
Mainstreaming), with the aim of
influencing the Bank’s internal
operational policies in other
sectors. With the creation of
the new WGP, this measure
for mainstreaming is no longer
appropriate, but the work
continues through various
channels, as summarized above
and detailed in section 3.3.
In the wake of the changes made
to the Bank’s organizational
structure, sub-indicators 2 and 3
are no longer feasible or relevant
for measuring this outcome.
Rather, the WPP will continue
to qualify its contribution to
other sectors by completing five
guidance notes (sub-indicator
1) and exploiting opportunities
to work across the new GPs in
its global, regional, and country-
level activities. The WPP is on
track to meet one sub-indicator
of indicator I and the remaining
two have been removed from the
overall framework, bringing the
total number of sub-indicators
down from 45 to 43.
3.3 Impacts – WPP’s Broad InfluenceontheGlobalDialogue
In addition to the impacts the
WPP has in client countries
through individual activities at
the country level, the program,
now in its fourth year of
implementation under Phase II,
is emerging as a big contributor
to the global dialogue on
water security. WPP’s Global
Initiatives, as well as its strategic
use of global and country-level
activity funding toward other
sectors that incorporate water,
contribute to a higher-level
impact that is not necessarily
visible in the results reported in
section 3.2.
This section provides select
examples of the WPP’s influence
in building networks within the
Bank and leveraging global
partnerships beyond the Bank.
It illustrates the program’s more
enduring, institutional impacts,
which are helping build the
foundation needed to enable the
Bank and its partners to deliver
on the SDGs.
3.3.1 Influencing Within the Bank: An Incentive to Coordinate
The WGP is strengthening the
Bank’s skills and knowledge
on water-related issues and
providing “water writ large”
approaches to development
challenges. When all staff
involved in an activity works
under one management, sharing
experiences and knowledge
across water subsectors is
easy, but working across other
sectors—like urban, energy, or
environment—can be prohibitive
in terms of time and resource
requirements. Fortunately,
the WPP influences initiatives
undertaken across the Bank in
three major ways.
Firstly, many WPP activities
are carried out in partnership
with other trust funds, and
therefore act as a mechanism to
provide incentives for cross-GP
collaboration toward integrated
approaches and solutions. As
detailed in chapter 3, indicator
A, the WPP has leveraged more
than $1.2 million from various trust
funds, including SAWI, CIWA,
PPIAF, the WSP, and ESMAP.
Secondly, the WPP has been a
critical factor in funding a cross-
GP institutional arrangement
that provides a platform
for integrated thinking and
program design across GPs—
the Integrated Urban Water
Management Knowledge Silo
Breaker. In 2016, the Silo Breaker
will produce its first joint output,
a Guidance Note on Integrated
Urban Water Management,
with the aim of building joint
operational work in several
countries.
Finally, the WPP has its strongest
impact on the Bank’s other GPs
through the conception and
design of some of its major
Global Initiatives. For instance,
the Global Initiative for Disaster
Risk Management is being
implemented in collaboration
with the WB’s Global Facility
for Disaster Reduction and
Recovery (GFDRR). The initiative
aims to meet the growing
demand for hydromet and
climate services to help mitigate
risks and reduce people’s
vulnerability and exposure to
water-related hazards. The
team is currently conducting
an in-depth assessment of
national hydrological services
Table 10 – Indicator I: Cross-sector mainstreaming
Indicator (I) Cross-sectoral mainstreaming of WRM
Target Results
June 2014
June 2015
Su
b-I
nd
icato
rs
1) Guidance Notes created including an assessment on improvements required in Operational Policies for specific sectors (#)
5 2 2 (plus
2 in draft)
2) Guidance Notes for specific sectors endorsed by respective Sector Board (#)
4 NA NA
3) Agreement by Operational Policy and Quality Department (OPCSPQ) to move forward on modernization of Operational Policies for mainstreaming of WRM (# of sectors)
2 NA NA

41
(NHS) in two pilot countries,
and designing a road map to
modernize the NHS with a view
to: (i) helping users access the
available information; (ii) helping
users interpret and use that
information; and (iii) informing
the planning and decision-
making processes underlying
cost-effective investments
toward a climate-resilient
development. The work is cross-
sectoral by nature, and relevant
to agriculture, energy, transport,
health, and particularly WRM
at the national, regional, and
international levels.
Similarly, the WPP’s Global
Initiative on Remote Sensing (RS)
responds to the demand from
Bank teams for (i) innovative
tools and approaches to improve
long-term investment planning
in water and other sectors;
and (ii) practical information
on the potential use of RS
technologies to improve data
coverage and availability to
enhance decision making
across all water subsectors.
RS can cover large areas or
support ground-based (in situ)
measurements when available
data are scarce or unreliable.
RS technologies have myriad
applications, such as flood and
drought risk management, DRM,
evapotranspiration mapping,
irrigation and rainfed systems’
management, conjunctive
surface and groundwater analysis
and management, regional
and transboundary river basin
planning and management, water
quality management, and delta
and coastal area management.
The team has already worked
across the Bank to understand
the applicability in other sectors,
which resulted in a guidance tool
for the use of RS technology
products for particular tasks. In
the next phase, this multi-sectoral
team will provide funding to help
mainstream RS technologies into
Bank operations.
Under each of these three
arrangements, members of water
teams leverage new expertise,
learning much in the process
and then folding those lessons
back into the practice via the
Global Solutions Groups (see
figure 1 in chapter 1). They also
have the time and incentives to
change the way other sectors
address water and to provide
the water expertise needed to
properly design a project in
energy, environment, DRM, or
agriculture.
3.3.2 Influencing Beyond the Bank
While WPP Global Initiatives
are primarily designed to
mainstream global best practices
in Bank operations, in the
process of consulting with and
building on external knowledge,
they have also made a significant
mark on the global dialogue.
First, the Decision Tree
Framework (see section 2.1)
is the product of 2 years of
collaboration between the
Bank, the Alliance for Global
Water Adaptation (AGWA),
Conservation International, the
United States Army Corps of
Engineers (USACE), and the
University of Massachusetts.
Two publications14 resulting from
this work and global interaction
have been disseminated widely
and been in high demand from
other institutions. The initiative
is now informing the design of
standards being formulated
by the Climate Bond Initiative,
is being used by the IFC in
the design of its hydropower
portfolio, and has been used
by the USACE to draft new
guidelines for water engineers.
Moreover, other IFIs have
asked the Bank to present the
14. See Confronting Climate Uncertainty in Water Resources Planning and Project Design: The Decision Tree Framework; and Beyond Downscaling: A Bottom-Up Approach to Climate Adaptation for Water Resources Management.
framework to see how it can be
used in their institutions, and
it has become part of the core
guiding principles promoted by
the AGWA.
Second, Thirsty Energy, an
initiative that showcases the
practical use of evidence-
based operational tools for
development, has evolved into
an external guide that is being
used by energy sectors in China
and South Africa to incorporate
water considerations into their
sector planning. In China, the
National Energy Agency is
working with Thirsty Energy
to incorporate potential water
constraints into the upcoming
5-year energy plan (2016–20).
In Morocco, the methodology is
being used to formulate a road
map to identify key investment
and planning opportunities.
This influence at the country
level extends to governments
and private entities working on
water and energy, and could
influence regional and global
thinking on nexus issues. The
team has also provided inputs to
the United States Department of
Energy, IRENA, the Clean Energy
Ministerial, and SE4ALL, and
continues building a very strong
alliance with the private sector.

ANNEX
1FINANCIAL SUMMARY WPP PHASE II (JULY 2012 – JUNE 2015)
42
ANNEX 1
FINANCIAL SUMMARY WPP PHASE II
(JULY 2012 – JUNE 2015)

43
ANNEX 1
FINANCIAL SUMMARY WPP PHASE II
(JULY 2012 – JUNE 2015)

ANNEX
1FINANCIAL SUMMARY WPP PHASE II (JULY 2012 – JUNE 2015)
44
This annex provides financial
information about the second
phase of the WPP on donor
contributions, approvals,
disbursements and commitments
of activities, and program
management and administration
costs. This financial report covers
a 36-month period, from July
2012 to June 2015.15 From Phase
II inception until June 2015, a
total of 163 activities (including
74 for WET) were approved for
a total amount of $24.1 million.
From July 1, 2014 through June
30, 2015 (the Bank’s Fiscal Year
2015, FY15), 69 new activities
were approved, amounting to
$9.8 million.
The program’s overall approvals
represent 76 percent of the
total allocation approved under
the different windows. When
proposed activities and program
management are included, the
15. To provide clear and accurate data, all WPP Phase II financials are included in this report. The second phase of the program officially started in July 2012, so this financial report gives figures for activities undertaken from that date onward. How-ever, since donor funds were received at the beginning of 2013, most activities only started after the first quarter of 2013—only the WET services were continued from July 2012 due to the specific nature and high demand from the regions, using remaining WPP Phase I funds.
total amount increases to $33.4
million, representing 75 percent
of the total available contribution
to the program. Most approved
activities are currently under
implementation—only 19 WPP
and 32 WET activities had been
closed by the end of June 2015.
Donor Contributions to the WPP
Total donor contributions to
the second phase of the WPP
amount to $40.5 million. In
November 2013, the WPP
welcomed the government of
Austria as its fourth donor, joining
its three existing donors: the
Netherlands’ Directorate-General
for International Cooperation
(DGIS), the United Kingdom’s
Department for International
Development (DfID), and the
Danish International Development
Agency (DANIDA). As detailed
in table A1, the WPP Phase II
contributions equal $45.1 million
when including the $4.6 million
remaining balance from WPP
Phase I, all of which was received
as of June 2015. After deducting
the 2 percent administration
fee and adding the earned
investment income, this leaves
an available balance of $44.5
million. In June 2015, the Bank
and DGIS reached agreement on
an additional contribution of $6.3
million, and discussions with DfID
on further funding were ongoing.
However, since these funds were
received after June 2015, they
are not taken into account in this
financial summary.
Overview of the WPP Allocations and Activity Portfolio
Since the inception of its
second phase, the program has
disbursed $11.8 million through
163 activities. During FY15 only,
$6.8 million was expended.
Including commitments, the
program has used $15.8 million
(of which $8.1 million or 51
percent in FY15 alone), which
increases to $17.9 million when
program management and
administration expenditures are
taken into account. Table A2
and figure A1 show the current
allocations, pipeline, approval
status, and expenditures of
the six regional windows and
six global windows—including
the new window created to
temporarily support activities
Table A1 – Overview of Donor Contributions to the WPP - Phase II
Contributions to WPP Donor Currency Amt pledged (donor curr.)
Amt pledged (USD) Amt received (USD)
Austria EUR 4,000,000 5,515,200 5,515,200
Denmark (DANIDA) DKK 20,000,000 3,522,245 3,522,245
Netherlands (DGIS) USD 12,500,000 12,500,000 12,500,000
United Kingdom (DFID) GBP 12,000,000 19,001,850 19,001,850
Total Phase II Contributions 40,539,295
Balance Phase I Contribution 4,558,165
WPP Total 40,539,295 45,097,460
Administration fee (2%) (810,786)
Investment Income 259,025
WPP Total Funds 44,545,698

45
Table A2 – WPP Phase II Financial Overview (as of June 30, 2015)
Figure A1 – WPP Phase II Financial Overview (as of June 30, 2015)
Note: AFR = Africa; EAP =East Asia and Pacific; ECA = Europe and Central Asia; LCR = Latin America and Caribbean; MNA = Middle East and North Africa; SAR = South Asia; DRM = Disaster Risk Management; WET = Water Expert Team; KM/Comms = Knowledge Management/Com-munications; GSG = Global Solutions Group.
Note: AFR = Africa; EAP =East Asia and Pacific; ECA = Europe and Central Asia; LCR = Latin America and Caribbean; MNA = Middle East and North Africa; SAR = South Asia; DRM = Disaster Risk Management; WET = Water Expert Team; KM/Comms = Knowledge Management/Communications; GSG = Global Solutions Group.
0
1,000,000
2,000,000
3,000,000
4,000,000
5,000,000
6,000,000
7,000,000
8,000,000
Disbursed + CommittedPipeline Activity AmountApproved Activity AmountApproved Allocation
Tem
p G
SG
KM
/Co
mm
s
WE
T
DR
M
Pro
gra
mm
ati
c
An
ch
or
SA
R
MN
A
LC
R
EC
A
EA
P
AF
R
Window ApprovedAllocation
Pipeline Activities
Approved Activities
% of Allocation Approved
% of ApprovedDisb/Comm
ApprovedAllocation FY13&14
Draft Under revision
ApprovedAmount
Disbursed Commit-ted
Disbursed+Committed
No. ofAct.
% of Allocation Approved
% of ApprovedDisb/Comm.
AFR 3,000,000 80,000 240,000 2,122,145 684,770 544,807 1,229,576 7 70.7% 57.9%
EAP 2,500,000 - 150,000 2,060,787 704,411 571,686 1,276,097 14 82.4% 61.9%
ECA 2,000,000 150,000 70,000 1,641,957 691,271 194,786 886,058 13 82.1% 54.0%
LCR 2,500,000 150,000 385,000 1,894,487 906,659 115,913 1,022,572 15 75.8% 54.0%
MNA 1,500,000 75,000 - 1,400,000 369,124 142,657 511,781 6 93.3% 36.6%
SAR 1,500,000 240,000 - 1,254,315 403,532 83,198 486,729 6 83.6% 38.8%
Anchor 1,500,000 - - 1,422,389 1,133,813 138,721 1,272,534 10 94.8% 89.5%
Program-matic
6,850,000 1,488,278 634,500 4,702,151 2,276,167 935,201 3,211,368 10 68.6% 68.3%
DRM 2,900,000 1,020,000 450,000 1,404,139 928,384 142,873 1,071,257 5 48.4% 76.3%
WET 4,250,000 35,000 - 3,598,351 2,682,513 703,194 3,385,707 74 84.7% 94.1%
KM/Comms
2,100,000 - - 2,100,000 959,976 144,677 1,104,653 n/a 100.0% 52.6%
Temp GSG
1,000,000 105,200 - 538,200 75,993 246,000 321,993 3 53.8% 59.8%
TOTALS 31,600,000 3,343,478 1,929,500 24,138,920 11,816,613 3,963,712 15,780,326 163 76.4% 65.4%

ANNEX
1FINANCIAL SUMMARY WPP PHASE II (JULY 2012 – JUNE 2015)
46
of the Global Solutions Groups
(GSGs) until the new GSG
windows have been set up. The
number of activities per window
is also indicated.
As can be seen in these figures,
on average, 80 percent of the
regional allocations has been
approved for activities, while the
regional implementation rate is
relatively low (37–62 percent,
average 52 percent). The global
windows show an approval rate of
74 percent, boosted by mid-year
increases of global allocations, and
a higher implementation rate of 75
percent.
The average activity size
amounts to $170,000 for
the regional windows, and
$288,000 for the global windows
(excluding the WET window,
for which the average activity
budget is about $27,00016).
Compared to WPP Phase I, in
which average activity size was
less than $140,000,17 the Phase II
activities are relatively larger.
Program Management and Administration Costs
Program Management and
Administration (PMA) costs
refer to the costs incurred by
the WPP Team and the Bank’s
Technical experts who provide
strategic advice and support.
These include expenditures on
general program management,
M&E, and donor coordination,
among others. Total PMA
disbursements and commitments
under Phase II from inception to
June 30, 2015 make up about 12
percent of total disbursements
and commitments—down from
15 percent at the end of June
2014. While significantly higher
than the WPP cap on PMA costs
16. This figure does not include WET man-agement and administration costs.17. This figure does not include activities under the Expert Support Teams window.
of 9 percent, the costs to date
are justified by the program’s
front-end needs. As is common
in trust-funded programs,
much of the initial expenses are
primarily derived from program
management and administration,
related to the design and setup
of the program structure and
procedures. Moreover, although
the official start date of the
second phase of the WPP was
July 2012, the main donor
contributions only arrived at the
beginning of 2013. Only then
could teams start preparing their
window work plans, which are
required before any activities can
be proposed. This is illustrated in
figure A2, which shows relatively
low activity disbursements in the
first year of the program, but
exponential growth of this figure
since July 2013. As this trend is
expected to continue, PMA costs
will decrease further relative to
activity costs over the coming
years. The program has set
limitations in the financial systems
to ensure that PMA spending
cannot go above 9 percent of
total Phase II contributions.
0.0
0.3
0.6
0.9
1.2
1.5
Program Management DisbursementsActivity Disbursements
Ap
r 20
15
Jan
20
15
Oct
20
14
Ju
l 20
14
Ap
r 20
14
Jan
20
14
Oct
20
13
Ju
l 20
13
Ap
r 20
13
Jan
20
13
Oct
20
12
Ju
l 20
12
Figure A2 – WPP Activity vs. PMA Disbursements (July 2012 – 2015)

47
ANNEX 2
WPP PHASE II RESULTS FRAMEWORK

48
ANNEX
2WPP PHASE II RESULTS FRAMEWORK
Ob
jecti
ve
Po
ve
rty R
ed
ucti
on
th
rou
gh
Im
pro
ve
d W
RM
an
d S
erv
ice
De
live
ry,-
---
an
d C
lim
ate
-Re
silie
nt
Gre
en
Gro
wth
Imp
act
Clim
ate
-re
silie
nt
gre
en
gro
wth
en
ab
led
th
rou
gh
wate
r-sm
art
de
ve
lop
me
nt
Vu
lne
rab
le p
op
ula
tio
ns
pro
vid
ed
wit
h a
n e
nh
an
ce
d q
uality
of
life
Ou
tco
me
WP
P s
trate
gic
fu
nd
ing
m
ob
iliz
ati
on
Kn
ow
led
ge
an
d
op
era
tio
nal
too
ls c
reate
d,
dis
sem
inate
d
an
d u
sed
Pla
ns
& s
trate
gie
s d
esi
gn
ed
an
d
cap
acit
y e
nh
an
ce
d
for
imp
rove
d W
RM
an
d s
erv
ice
de
live
ry
Ind
icato
r(A
) S
trate
gic
use
of
WP
P a
cti
vit
y
fun
ds
(B)
Even
ts a
nd
tra
inin
g
sup
po
rted
by W
PP
(C
) W
eb
-base
d o
utr
each
an
d u
se o
f W
PP
pu
blic
ati
on
s (D
) N
ew
pla
ns
& s
trate
gie
s p
rom
ote
d b
y W
PP
acti
vit
ies
in
clie
nt
co
un
trie
s
(E)
Cap
acit
y e
nh
an
cem
en
t
Targ
et:
Targ
et:
Targ
et:
Targ
et:
Targ
et:
Su
b-
Ind
icato
rs
& T
arg
ets
1) P
erc
en
tag
e o
f th
e v
alu
e
of
ap
pro
ved
WP
P a
cti
vit
ies
in A
fric
a (
%)
30
1) N
um
ber
of
Part
icip
an
ts (
#)
40
00
1.1)
Do
wn
load
s p
er
do
cu
men
t aft
er
an
no
un
cem
en
t (
#)
30
01.
1)
Nu
mb
er
of
no
n-w
ate
r P
olic
ies/
S
trate
gie
s t
hat
inco
rpo
rate
wate
r (#
)
101.
1) E
arl
y W
arn
ing
S
yst
em
s (E
WS
) in
stalle
d
(#)
8
2)
Perc
en
t o
f th
e v
alu
e
of
firm
co
ntr
acts
(in
pro
-g
ram
mati
c w
ind
ow
) ad
op
t-in
g Q
BS
pro
cu
rem
en
t (%
)
50
2)
Perc
en
t o
f P
art
icip
an
ts
that
ind
icate
th
ey a
re lik
ely
to
ap
ply
kn
ow
led
ge in
th
eir
wo
rk (
%)
70
1.2)
Perc
en
t o
f d
ow
nlo
ad
s fr
om
develo
pin
g c
ou
ntr
ies
(%)
50
1.2)
Nu
mb
er
of
po
licie
s/st
rate
gie
s acco
un
tin
g f
or
co
mp
eti
ng
wate
r u
ses
(#)
40
1.2)
(Up
on
in
stalla
tio
n
of
EW
S),
rele
van
t th
reat
info
rmati
on
is
dis
sem
inate
d t
o
stakeh
old
ers
on
a t
imely
b
asi
s (Y
es/
No
)
90
%
Yes
3)
Ban
k in
tern
al co
-fu
nd
ing
fo
r W
PP
acti
vit
ies
($)
10
m
illio
n3
.1)
Nu
mb
er
of
ag
en
cie
s/fi
rms
rep
rese
nte
d b
y
Part
icip
an
ts (
#)
20
02.1
) D
ow
nlo
ad
s p
er
flag
ship
do
cu
men
t aft
er
an
no
un
cem
en
t (
#)
20
00
2.1
) N
um
ber
of
Po
licie
s/ S
trate
gie
s en
do
rsed
by a
clie
nt
ag
en
cy (
#)
30
2)
Op
era
tio
nal w
ate
r u
sers
ass
ocia
tio
ns
cre
ate
d /
stre
ng
then
ed
(#
)
20
4)
Exte
rnal co
-fu
nd
ing
fo
r W
PP
acti
vit
ies
($)
1 m
illio
n3
.2)
Perc
en
t o
f G
ovt.
A
gen
cie
s (%
)3
.3)
Perc
en
t o
f P
rivate
firm
s
(%)
60
40
2.2
) P
erc
en
t o
f d
ow
nlo
ad
s fr
om
develo
pin
g c
ou
ntr
ies
(%)
50
2.2
) N
um
ber
of
po
licy o
r st
rate
gy
invest
men
t p
lan
s en
do
rsed
by c
lien
ts
(#)
153
) G
overn
men
t A
gen
cie
s (#
) w
ith
str
en
gh
ten
ed
cap
acit
y t
o a
dd
ress
:
33
3)
Perc
en
t o
f vis
ito
rs o
f th
e
WP
P w
eb
site
th
at
vis
it a
t le
ast
2 p
ag
es
(%)
40
3)
Bu
dg
et
Allo
cate
d
for
po
licy/s
trate
gy
imp
lem
en
tati
on
($
)
150
m
illio
n3
.1)
Clim
ate
ch
an
ge
3.2
) W
ate
r S
ecu
rity
3.3
) R
iver
Basi
n iss
ues
5 8 20
4)
Avera
ge q
ualit
y
ass
ess
men
t sc
ori
ng
of
WP
P
kn
ow
led
ge p
rod
ucts
by
clie
nt
co
un
try g
overn
men
ts
(an
d W
ET
pro
du
cts
sco
rin
g
by B
an
k p
roje
ct
team
s)
4 o
ut
of
5
(2)
Co
nfi
rmati
on
of
feasi
bili
ty o
f in
dic
ato
r p
en
din
g
(3
) B
ud
get
of
$10
mill
ion
per
invest
men
t p
lan
s en
do
rsed
(2.2
)
Tab
le A
3 –
WP
P P
hase
II
Re
sult
s F
ram
ew
ork
(P
art
I o
f 2
)

49
(2)
Co
nfi
rmati
on
of
feasi
bili
ty o
f in
dic
ato
r p
en
din
g
(3
) B
ud
get
of
$10
mill
ion
per
invest
men
t p
lan
s en
do
rsed
(2.2
)*
Fo
r all
sub
-in
dic
ato
rs: so
me o
f th
ese
are
new
WB
co
re-i
nd
icato
rs (
easy
to
tra
ck in
th
e f
utu
re),
bu
t n
ot
all.
Fo
r so
me in
dic
ato
rs, it
is
qu
ite lik
ely
th
at
on
ly a
co
up
le o
f B
an
k p
roje
cts
will
be t
rackin
g th
em
, an
d t
he W
PP
can
no
t g
uar-
an
tee t
hat
it w
ill b
e r
eq
uest
ed
to
su
pp
ort
th
ese
pro
jects
.D
ue t
o t
hese
un
cert
ain
ties,
th
e W
PP
pro
po
ses
to e
valu
ate
th
ese
in
dic
ato
rs &
targ
ets
aft
er
2 y
ears
.T
he f
ollo
win
g a
ssu
mp
tio
ns
were
mad
e t
o d
ete
rmin
e t
he t
arg
ets
of
the s
ub
-in
dic
ato
rs:
1) e
st. 4
Ban
k p
roje
cts
pro
tecti
ng
30
0km
each
2.1
) W
PP
Ph
ase
I: 1
pro
ject,
0.5
mill
ion
ha; est
imate
fo
r W
PP
Ph
ase
II: 2
pro
jects
3)
Est
imate
of
TW
IWA
hyd
ro t
eam
: 2 larg
e s
tora
ge p
roje
cts
per
year,
avera
ge 3
bill
ion
m3 s
tora
ge p
er
pro
ject.
50
% s
up
po
rt b
y W
PP
Ph
ase
II.
4
) W
PP
Ph
ase
I: 1
pro
ject,
10
MC
M; est
imate
fo
r P
hase
II: 2
pro
jects
5)
WP
P P
hase
I: 2 p
roje
cts
, 0
.43
mill
ion
ha; est
imate
fo
r P
hase
II: 8
pro
jects
.
6)
20
02-2
012
: 8
00
MW
/yr
in W
B p
roje
cts
, F
Y11
-12 1
,60
0 M
W/y
r. F
Y13
-16
est
imate
: 1,
50
0 M
W/y
r, o
f w
hic
h 5
0%
su
pp
ort
ed
by W
PP
.
(*
) %
fem
ale
of
dir
ect
ben
efi
cia
ries
is c
ore
secto
r in
dic
ato
r fo
r W
B p
roje
cts
, w
hic
h a
llow
s fo
r d
eta
iled
sp
ecifi
cati
on
.
Ob
jecti
ve
Po
ve
rty R
ed
ucti
on
th
rou
gh
Im
pro
ve
d W
RM
an
d S
erv
ice
De
live
ry,-
---
an
d C
lim
ate
-Re
silie
nt
Gre
en
Gro
wth
Imp
act
Clim
ate
-re
silie
nt
gre
en
gro
wth
en
ab
led
th
rou
gh
wate
r-sm
art
de
ve
lop
me
nt
Vu
lne
rab
le p
op
ula
tio
ns
pro
vid
ed
wit
h a
n e
nh
an
ce
d
qu
ality
of
life
Ou
tco
me
Do
wn
stre
am
lo
an
s su
pp
ort
ed
th
rou
gh
im
pro
ve
d d
esi
gn
an
d
imp
lem
en
tati
on
Vu
lne
rab
ilit
y r
ed
uce
d v
ia
pro
-po
or
an
d g
en
de
r-se
nsi
tive
in
terv
en
tio
ns
Wate
r m
ain
stre
am
ed
in
to o
the
r se
cto
rs
Ind
icato
r(F
) A
mo
un
t o
f B
an
k len
din
g in
flu
en
ced
&
ad
dit
ion
al fu
nd
ing
levera
ged
th
rou
gh
W
PP
acti
vit
ies
(G)
Ph
ysi
cal an
d n
atu
ral ass
ets
pro
tecte
d *
(H)
Peo
ple
ben
efi
tin
g f
rom
pro
jects
su
pp
ort
ed
by W
PP
acti
vit
y(I
) C
ross
-secto
ral m
ain
stre
am
ing
of
WR
M
Targ
et:
Targ
et:
Targ
et:
Targ
et:
Su
b-
Ind
icato
rs &
T
arg
ets
1) V
alu
e o
f (W
B)
invest
men
ts
sup
po
rted
($
)15
b
illio
n1)
Co
ast
line a
nd
fre
shw
ate
r u
nd
er
bio
div
ers
ity p
rote
cti
on
(km
) 12
00
1) T
arg
et
Po
pu
lati
on
in
pro
ject
are
a (
#)
0.5
b
illio
n1)
Gu
idan
ce N
ote
s cre
ate
d
inclu
din
g a
n a
ssess
men
t o
n
imp
rovem
en
ts r
eq
uir
ed
in
O
pera
tio
nal P
olic
ies
for
specifi
c
secto
rs (
#)
5
2)
To
tal p
roje
ct
valu
e o
f in
flu
en
ced
in
vest
men
ts in
w
hic
h t
he B
an
k is
invo
lved
($
)
25
b
illio
n2.1
) A
rea b
rou
gh
t u
nd
er
en
han
ced
bio
div
ers
ity p
rote
cti
on
(h
a)
1 m
illio
n2.1
) A
ctu
al b
en
efi
cia
ries
fro
m t
he
pro
ject
(#):
100
m
illio
n
3)
Valu
e o
f ad
dit
ion
al
invest
men
ts (
in w
hic
h W
B is
no
t in
vo
lved
) ($
)
50
0
mill
ion
2.2
) N
um
ber
of
stu
die
s in
co
rpo
rati
ng
eco
syst
em
valu
ati
on
(#
)
72.2
) W
SS
ben
efi
cia
ries
(#)
35
m
illio
n2)
Gu
idan
ce N
ote
s fo
r sp
ecifi
c
secto
rs e
nd
ors
ed
by r
esp
ecti
ve
Secto
r B
oard
(#
)
4
4)
Nu
mb
er
of
pro
jects
desi
gn
s im
pro
ved
th
rou
gh
a W
PP
acti
vit
y (
#)
100
3)
Wate
r S
tora
ge c
ap
acit
y
incre
ase
(m
3)
12
bill
ion
2.3
) W
ate
r u
sers
pro
vid
ed
wit
h
new
/im
pro
ved
irr
igati
on
&
dra
inag
e s
erv
ices
(#)
30
m
illio
n3
) A
gre
em
en
t b
y O
pera
tio
nal
Po
licy a
nd
Qu
alit
y D
ep
art
men
t (O
PC
SP
Q)
to m
ove f
orw
ard
on
m
od
ern
izati
on
of
Op
era
tio
nal
Po
licie
s fo
r m
ain
stre
am
ing
of
WR
M (
# o
f se
cto
rs)
2
4)
Aq
uif
er
pu
mp
ing
red
ucti
on
(m
3 /
yr)
20
m
illio
n2.4
) O
ther
WR
M b
en
efi
cia
ries
(#)
35
m
illio
n
5)
Are
as
pro
vid
ed
wit
h
irri
gati
on
/
dra
inag
e s
erv
ices
(ha)
6)
Hyd
rop
ow
er
gen
era
ted
(M
W)
2
mill
ion
30
00
2.5
) F
or
2.1
to
2.4
: W
om
en
(%
)
2.6
) F
or
2.1
to
2.4
: V
uln
era
ble
(%
)5
0 (
*)
35
Tab
le A
4 –
WP
P P
hase
II
Re
sult
s F
ram
ew
ork
(P
art
2 o
f 2
)