A VVER-1000 LEU and MOX Assembly Computational Benchmark
156
Nuclear Science ISBN 92-64-18491-0 NEA/NSC/DOC(2002)10 A VVER-1000 LEU and MOX Assembly Computational Benchmark Specification and Results © OECD 2002 NUCLEAR ENERGY AGENCY ORGANISATION FOR ECONOMIC CO-OPERATION AND DEVELOPMENT
Transcript of A VVER-1000 LEU and MOX Assembly Computational Benchmark
Nuclear Science ISBN 92-64-18491-0NEA/NSC/DOC(2002)10
A VVER-1000 LEU and MOX AssemblyComputational Benchmark
Specification and Results
© OECD 2002
NUCLEAR ENERGY AGENCYORGANISATION FOR ECONOMIC CO-OPERATION AND DEVELOPMENT
ORGANISATION FOR ECONOMIC CO-OPERATION AND DEVELOPMENT
Pursuant to Article 1 of the Convention signed in Paris on 14th December 1960, and which came into force on 30thSeptember 1961, the Organisation for Economic Co-operation and Development (OECD) shall promote policies designed:
− to achieve the highest sustainable economic growth and employment and a rising standard of living inMember countries, while maintaining financial stability, and thus to contribute to the development of theworld economy;
− to contribute to sound economic expansion in Member as well as non-member countries in the process ofeconomic development; and
− to contribute to the expansion of world trade on a multilateral, non-discriminatory basis in accordance withinternational obligations.
The original Member countries of the OECD are Austria, Belgium, Canada, Denmark, France, Germany, Greece,Iceland, Ireland, Italy, Luxembourg, the Netherlands, Norway, Portugal, Spain, Sweden, Switzerland, Turkey, the UnitedKingdom and the United States. The following countries became Members subsequently through accession at the datesindicated hereafter: Japan (28th April 1964), Finland (28th January 1969), Australia (7th June 1971), New Zealand (29thMay 1973), Mexico (18th May 1994), the Czech Republic (21st December 1995), Hungary (7th May 1996), Poland (22ndNovember 1996), Korea (12th December 1996) and the Slovak Republic (14 December 2000). The Commission of theEuropean Communities takes part in the work of the OECD (Article 13 of the OECD Convention).
NUCLEAR ENERGY AGENCY
The OECD Nuclear Energy Agency (NEA) was established on 1st February 1958 under the name of the OEECEuropean Nuclear Energy Agency. It received its present designation on 20th April 1972, when Japan became its firstnon-European full Member. NEA membership today consists of 28 OECD Member countries: Australia, Austria, Belgium,Canada, Czech Republic, Denmark, Finland, France, Germany, Greece, Hungary, Iceland, Ireland, Italy, Japan, Luxembourg,Mexico, the Netherlands, Norway, Portugal, Republic of Korea, Slovak Republic, Spain, Sweden, Switzerland, Turkey, theUnited Kingdom and the United States. The Commission of the European Communities also takes part in the work of theAgency.
The mission of the NEA is:
− to assist its Member countries in maintaining and further developing, through international co-operation, thescientific, technological and legal bases required for a safe, environmentally friendly and economical use ofnuclear energy for peaceful purposes, as well as
− to provide authoritative assessments and to forge common understandings on key issues, as input togovernment decisions on nuclear energy policy and to broader OECD policy analyses in areas such as energyand sustainable development.
Specific areas of competence of the NEA include safety and regulation of nuclear activities, radioactive wastemanagement, radiological protection, nuclear science, economic and technical analyses of the nuclear fuel cycle, nuclear lawand liability, and public information. The NEA Data Bank provides nuclear data and computer program services forparticipating countries.
In these and related tasks, the NEA works in close collaboration with the International Atomic Energy Agency inVienna, with which it has a Co-operation Agreement, as well as with other international organisations in the nuclear field.
© OECD 2002Permission to reproduce a portion of this work for non-commercial purposes or classroom use should be obtained through the Centre françaisd’exploitation du droit de copie (CCF), 20, rue des Grands-Augustins, 75006 Paris, France, Tel. (33-1) 44 07 47 70, Fax (33-1) 46 34 67 19,for every country except the United States. In the United States permission should be obtained through the Copyright Clearance Center,Customer Service, (508)750-8400, 222 Rosewood Drive, Danvers, MA 01923, USA, or CCC Online: http://www.copyright.com/. All otherapplications for permission to reproduce or translate all or part of this book should be made to OECD Publications, 2, rue André-Pascal,75775 Paris Cedex 16, France.

3
FOREWORD
The NEA Nuclear Science Committee has an Expert Group that deals with the status and trendsof reactor physics, fuel performance, and fuel cycle issues related to the disposition of weapons-gradeplutonium as mixed-oxide fuel. The objectives of the group are to provide NEA Member countrieswith up-to-date information on, and develop consensus regarding, core and fuel cycle issues associatedwith weapons-grade plutonium disposition in thermal water reactors (PWR, BWR, VVER-1000 andCANDU) and fast reactors (BN-600). These issues concern core physics, fuel performance andreliability, and the capability and flexibility of thermal water reactors and fast reactors to dispose ofweapons-grade plutonium in standard fuel cycles.
The activities of the NEA Expert Group on Reactor-based Plutonium Disposition are carried outin close co-operation with the NEA Working Party on Physics of Plutonium Fuels and Innovative FuelCycles (WPPR), sometimes jointly. An eminent part of these activities include benchmark studies. Atthe time of preparation of the report the following benchmarks were completed or in progress:
• VENUS-2 MOX Core Benchmarks – carried out jointly with the WPPR (completed);
• VVER-1000 LEU and MOX Benchmark – (completed, and the object of this report);
• KRITZ-2 Benchmarks – carried out jointly with the WPPR (in progress);
• Hollow and Solid MOX Fuel Behaviour Benchmark (in progress).
This report describes the detailed results of a benchmark study investigating the physics of aVVER-1000 reactor using low-enriched uranium (LEU) and MOX fuel. It contributes to the computercode certification process and to the verification of calculation methods used in the RussianFederation.
Acknowledgements
The Secretariat expresses its sincere gratitude to the participants who devoted their time andeffort to this benchmark exercise.
4
CONTRIBUTORS
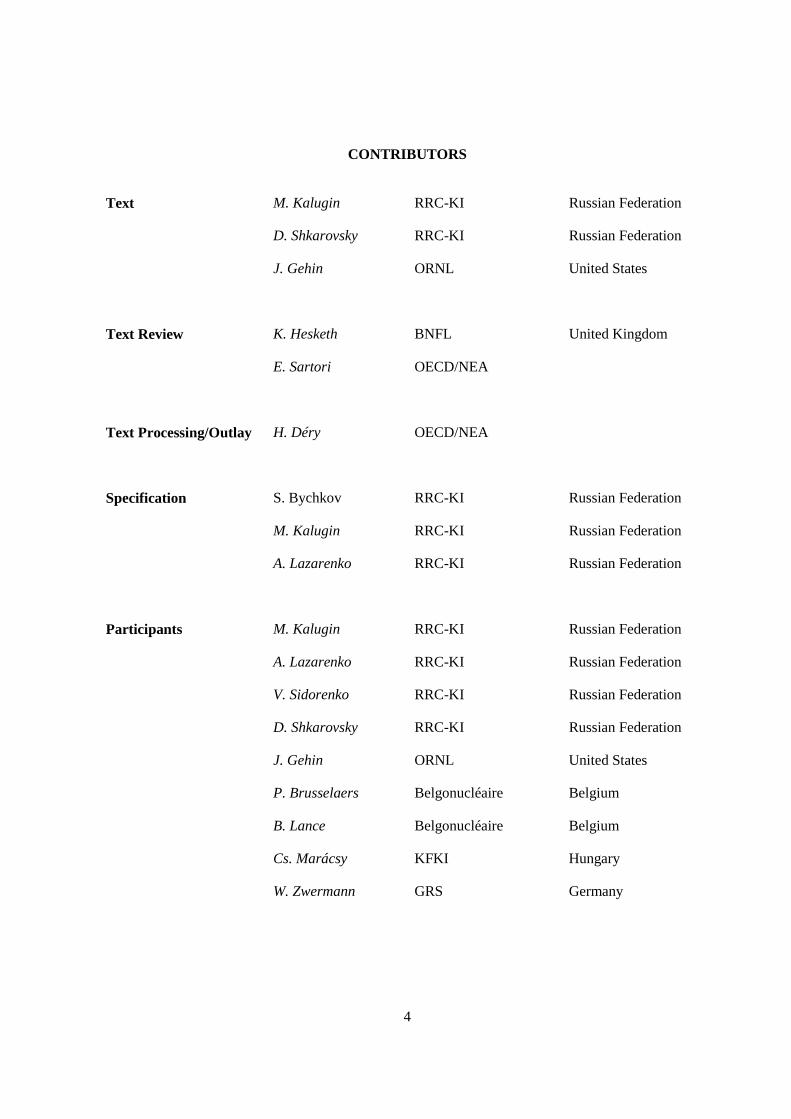
Text M. Kalugin RRC-KI Russian Federation
D. Shkarovsky RRC-KI Russian Federation
J. Gehin ORNL United States
Text Review K. Hesketh BNFL United Kingdom
E. Sartori OECD/NEA
Text Processing/Outlay H. Déry OECD/NEA
Specification S. Bychkov RRC-KI Russian Federation
M. Kalugin RRC-KI Russian Federation
A. Lazarenko RRC-KI Russian Federation
Participants M. Kalugin RRC-KI Russian Federation
A. Lazarenko RRC-KI Russian Federation
V. Sidorenko RRC-KI Russian Federation
D. Shkarovsky RRC-KI Russian Federation
J. Gehin ORNL United States
P. Brusselaers Belgonucléaire Belgium
B. Lance Belgonucléaire Belgium
Cs. Marácsy KFKI Hungary
W. Zwermann GRS Germany

5
TABLE OF CONTENTS
FOREWORD ................................................................................................................................. 3
CONTRIBUTORS......................................................................................................................... 4
EXECUTIVE SUMMARY ........................................................................................................... 9
Chapter 1. INTRODUCTION ................................................................................................... 11
Chapter 2. BENCHMARK MODEL ........................................................................................ 13
Chapter 3. PARTICIPANTS, CODES, AND DATA............................................................... 17
Chapter 4. RESULTS OF BENCHMARK CALCULATIONS.............................................. 21
4.1. Calculations methods .................................................................................................. 22
4.2. Effective multiplication factor ..................................................................................... 23
4.3. Fission rate distributions............................................................................................. 24
4.4. Isotopic concentrations................................................................................................ 24
Chapter 5. CONCLUSIONS...................................................................................................... 25
Appendix A. BENCHMARK SPECIFICATION..................................................................... 117
Appendix B. CALCULATIONAL DETAILS PROVIDED BY THE PARTICIPANTS ..... 127
Appendix C. ADDITIONAL RESULTS ................................................................................... 145
List of figures
Figure 2.1. UGD assembly configuration............................................................................. 14Figure 2.2. MOXGD assembly configuration ...................................................................... 15Figure 1. UGD Variant Kinf vs burnup.................................................................................. 30Figure 2. MOXGD Variant Kinf vs burnup ........................................................................... 72Figure A.1. Cartogram of the Uniform LEU fuel assembly with 12 Gd BA rods................ 124Figure A.2. Cartogram of the Profiled MOX fuel assembly with 12 Gd BA rods ............... 125Figure A.3. Cell numeration in the fuel assemblies to presenting
fission rate distribution ..................................................................................... 126Figure B.1. WIMS8A. Calculation scheme for the VVER benchmarks .............................. 135Figure B.2. WIMS8A. Explicit heterogeneous representation of the geometry,
with the CACTUS module of WIMS. .............................................................. 136
6
List of tables
Table 2.1. Calculations States............................................................................................... 14Table 3.1. Participants, basic library and computer codes used ........................................... 19Table 1. UGD Variant. Kinf. Abs. deviation from Mean Value ............................................ 29Table 2. UGD. Assembly Average Isotopic Composition. 235U, atoms/barn*cm ................ 31Table 3. UGD. Assembly Average Isotopic Composition. 236U, atoms/barn*cm ................ 32Table 4. UGD. Assembly Average Isotopic Composition. 238U, atoms/barn*cm ................ 33Table 5. UGD. Assembly Average Isotopic Composition. 239Pu, atoms/barn*cm............... 34Table 6. UGD. Assembly Average Isotopic Composition. 240Pu, atoms/barn*cm............... 35Table 7. UGD. Assembly Average Isotopic Composition. 241Pu, atoms/barn*cm............... 36Table 8. UGD. Assembly Average Isotopic Composition. 242Pu, atoms/barn*cm............... 37Table 9. UGD. Assembly Average Isotopic Composition. 135Xe, atoms/barn*cm............... 38Table 10. UGD. Assembly Average Isotopic Composition. 149Sm, atoms/barn*cm
(codes with equilibrium concentration of 149Sm at 0MWd/kgHM) ................... 39Table 11. UGD. Assembly Average Isotopic Composition. 149Sm, atoms/barn*cm
(codes with zero concentration of 149Sm at 0MWd/kgHM) ................................ 40Table 12. UGD. Assembly Average Isotopic Composition. 155Gd, atoms/barn*cm ............ 41Table 13. UGD. Assembly Average Isotopic Composition. 157Gd, atoms/barn*cm ............ 42Table 14. UGD. Assembly Average Isotopic Composition Deviation from Average
Value, %. Burnup=40 MWd/kgHM.................................................................... 43Table 15. UGD. Isotopic Composition in Cell 1. 235U, atoms/barn*cm ............................... 44Table 16. UGD. Isotopic Composition in Cell 1. 236U, atoms/barn*cm ............................... 45Table 17. UGD. Isotopic Composition in Cell 1. 238U, atoms/barn*cm ............................... 46Table 18. UGD. Isotopic Composition in Cell 1. 239Pu, atoms/barn*cm.............................. 47Table 19. UGD. Isotopic Composition in Cell 1. 240Pu, atoms/barn*cm.............................. 48Table 20. UGD. Isotopic Composition in Cell 1. 241Pu, atoms/barn*cm.............................. 49Table 21. UGD. Isotopic Composition in Cell 1. 242Pu, atoms/barn*cm.............................. 50Table 22. UGD. Isotopic Composition in Cell 1. 135Xe, atoms/barn*cm ............................. 51Table 23. UGD. Isotopic Composition in Cell 1. 149Sm, atoms/barn*cm
(codes with equilibrium concentration of 149Sm at 0MWd/kgHM) .................... 52Table 24. UGD. Isotopic Composition in Cell 1. 149Sm, atoms/barn*cm
(codes with zero concentration of 149Sm at 0MWd/kgHM) ................................ 53Table 25. UGD. Isotopic Composition in Cell 1 Deviation from Average
Value, %. Burnup=40 MWd/kgHM.................................................................... 54Table 26. UGD. Isotopic Composition in Cell 24. 235U, atoms/barn*cm ............................. 55Table 27. UGD. Isotopic Composition in Cell 24. 236U, atoms/barn*cm ............................. 56Table 28. UGD. Isotopic Composition in Cell 24. 238U, atoms/barn*cm ............................. 57Table 29. UGD. Isotopic Composition in Cell 24. 239Pu, atoms/barn*cm............................ 58Table 30. UGD. Isotopic Composition in Cell 24. 240Pu, atoms/barn*cm............................ 59Table 31. UGD. Isotopic Composition in Cell 24. 241Pu, atoms/barn*cm............................ 60Table 32. UGD. Isotopic Composition in Cell 24. 242Pu, atoms/barn*cm............................ 61Table 33. UGD. Isotopic Composition in Cell 24. 135Xe, atoms/barn*cm ........................... 62Table 34. UGD. Isotopic Composition in Cell 24. 149Sm, atoms/barn*cm
(codes with equilibrium concentration of 149Sm at 0MWd/kgHM) .................... 63Table 35. UGD. Isotopic Composition in Cell 24. 149Sm, atoms/barn*cm
(codes with zero concentration of 149Sm at 0MWd/kgHM) ................................ 64Table 36. UGD. Isotopic Composition in Cell 24. 155Gd, atoms/barn*cm ........................... 65Table 37. UGD. Isotopic Composition in Cell 24. 157Gd, atoms/barn*cm ........................... 66Table 38. UGD. Isotopic Composition in Cell 24 Deviation from Average
Value, %. Burnup=40 MWd/kgHM.................................................................... 67
7
Table 39. UGD. Isotopic Composition in Cell 24 vs radius, burnup=40 MWd/kgHM.235U, atoms/barn*cm ........................................................................................... 68
Table 40. UGD. Isotopic Composition in Cell 24 vs radius, burnup=40 MWd/kgHM.239Pu, atoms/barn*cm .......................................................................................... 68
Table 41. UGD. Isotopic Composition in Cell 24 vs radius, burnup=2 MWd/kgHM.155Gd, atoms/barn*cm ......................................................................................... 69
Table 42. UGD. Isotopic Composition in Cell 24 vs radius, burnup=2 MWd/kgHM.157Gd, atoms/barn*cm ......................................................................................... 69
Table 43. UGD. Reactivity Effects, 100*(Kinit-Kfin) ............................................................. 70Table 44. MOXGD Variant. Kinf. Abs. deviation from Mean Value.................................... 71Table 45. MOXGD. Assembly Average Isotopic Composition. 235U, atoms/barn*cm........ 73Table 46. MOXGD. Assembly Average Isotopic Composition. 236U, atoms/barn*cm........ 74Table 47. MOXGD. Assembly Average Isotopic Composition. 238U, atoms/barn*cm........ 75Table 48. MOXGD. Assembly Average Isotopic Composition. 239Pu, atoms/barn*cm....... 76Table 49. MOXGD. Assembly Average Isotopic Composition. 240Pu, atoms/barn*cm....... 77Table 50. MOXGD. Assembly Average Isotopic Composition. 241Pu, atoms/barn*cm....... 78Table 51. MOXGD. Assembly Average Isotopic Composition. 242Pu, atoms/barn*cm....... 79Table 52. MOXGD. Assembly Average Isotopic Composition. 135Xe, atoms/barn*cm ...... 80Table 53. MOXGD. Assembly Average Isotopic Composition. 149Sm, atoms/barn*cm
(codes with equilibrium concentration of 149Sm at 0MWd/kgHM), ................... 81Table 54. MOXGD. Assembly Average Isotopic Composition. 149Sm, atoms/barn*cm
(codes with zero concentration of 149Sm at 0MWd/kgHM), ............................... 82Table 55. MOXGD. Assembly Average Isotopic Composition. 155Gd, atoms/barn*cm...... 83Table 56. MOXGD. Assembly Average Isotopic Composition. 157Gd, atoms/barn*cm...... 84Table 57. MOXGD. Assembly Average Isotopic Composition Deviation from
Average Value, %. Burnup=40 MWd/kgHM ..................................................... 85Table 58. MOXGD. Isotopic Composition in Cell 1. 235U, atoms/barn*cm......................... 86Table 59. MOXGD. Isotopic Composition in Cell 1. 236U, atoms/barn*cm......................... 87Table 60. MOXGD. Isotopic Composition in Cell 1. 238U, atoms/barn*cm......................... 88Table 61. MOXGD. Isotopic Composition in Cell 1. 239Pu, atoms/barn*cm ....................... 89Table 62. MOXGD. Isotopic Composition in Cell 1. 240Pu, atoms/barn*cm ....................... 90Table 63. MOXGD. Isotopic Composition in Cell 1. 241Pu, atoms/barn*cm ....................... 91Table 64. MOXGD. Isotopic Composition in Cell 1. 242Pu, atoms/barn*cm ....................... 92Table 65. MOXGD. Isotopic Composition in Cell 1. 135Xe, atoms/barn*cm....................... 93Table 66. MOXGD. Isotopic Composition in Cell 1. 149Sm, atoms/barn*cm
(codes with equilibrium concentration of 149Sm at 0MWd/kgHM) .................... 94Table 67. MOXGD. Isotopic Composition in Cell 1. 149Sm, atoms/barn*cm
(codes with zero concentration of 149Sm at 0MWd/kgHM) ................................ 95Table 68. MOXGD. Isotopic Composition in Cell 1 Deviation from Average
Value, %. Burnup=40 MWd/kgHM.................................................................... 96Table 69. MOXGD. Isotopic Composition in Cell 24. 235U, atoms/barn*cm....................... 97Table 70. MOXGD. Isotopic Composition in Cell 24. 236U, atoms/barn*cm....................... 98Table 71. MOXGD. Isotopic Composition in Cell 24. 238U, atoms/barn*cm....................... 99Table 72. MOXGD. Isotopic Composition in Cell 24. 239Pu, atoms/barn*cm ..................... 100Table 73. MOXGD. Isotopic Composition in Cell 24. 240Pu, atoms/barn*cm ..................... 101Table 74. MOXGD. Isotopic Composition in Cell 24. 241Pu, atoms/barn*cm ..................... 102Table 75. MOXGD. Isotopic Composition in Cell 24. 242Pu, atoms/barn*cm ..................... 103Table 76. MOXGD. Isotopic Composition in Cell 24. 135Xe, atoms/barn*cm..................... 104Table 77. MOXGD. Isotopic Composition in Cell 24. 149Sm, atoms/barn*cm
(codes with equilibrium concentration of 149Sm at 0MWd/kgHM) .................... 105

8
Table 78. MOXGD. Isotopic Composition in Cell 24. 149Sm, atoms/barn*cm(codes with zero concentration of 149Sm at 0MWd/kgHM), ............................... 106
Table 79. MOXGD. Isotopic Composition in Cell 24. 155Gd, atoms/barn*cm..................... 107Table 80. MOXGD. Isotopic Composition in Cell 24. 157Gd, atoms/barn*cm..................... 108Table 81. MOXGD. Isotopic Composition in Cell 24 Deviation from Average
Value, %. Burnup=40 MWd/kgHM.................................................................... 109Table 82. MOXGD. Isotopic Composition in Cell 24 vs radius, burnup=40 MWd/kgHM.
235U, atoms/barn*cm .......................................................................................... 110Table 83. MOXGD. Isotopic Composition in Cell 24 vs radius, burnup=40 MWd/kgHM.
239Pu, atoms/barn*cm .......................................................................................... 110Table 84. MOXGD. Isotopic Composition in Cell 24 vs radius, burnup=2 MWd/kgHM.
155Gd, atoms/barn*cm ......................................................................................... 111Table 85. MOXGD. Isotopic Composition in Cell 24 vs radius, burnup=2 MWd/kgHM.
157Gd, atoms/barn*cm ......................................................................................... 111Table 86. MOXGD Reactivity Effects, 100*(Kinit-Kfin)........................................................ 112Table 87. UGD Variant. Fission Rates Distribution. Max. R.M.S. over all the pins (%)
and Corresponding Pin N versus burnup............................................................. 113Table 88. UGD Variant. Fission Rates Distribution. Max. R.M.S. over all the pins (%)
and Corresponding Pin N for different states...................................................... 114Table 89. MOXGD Variant. Fission Rates Distribution. Max. R.M.S. over all the pins (%)
and Corresponding Pin N versus burnup............................................................. 115Table 90. MOXGD Variant. Fission Rates Distribution. Max. R.M.S. over all the pins (%)
and Corresponding Pin N for different states...................................................... 116Table A.1. Material description ............................................................................................ 119Table A.2. Description of cell types geometry ..................................................................... 120Table A.3. State parameters.................................................................................................. 121Table A.4. Set of calculation variants................................................................................... 123Table C.1. UGD Variant. Kinf States S1, S2, S3, S4, S5. Burnup=0, 20, 40 MWd/kgHM... 147Table C.2. MOXGD Variant. Kinf States S1, S2, S3, S4, S5.
Burnup=0, 20, 40 MWd/kgHM........................................................................... 148Table C.3. UGD. Variant. Fission Rate Distribution. States S2, S3, S4, S5.
Burnup=0 MWd/kgHM....................................................................................... 149Table C.4. MOXGD Variant. Fission Rate Distribution. States S2, S3, S4, S5.
Burnup=0 MWd/kgHM....................................................................................... 152
9
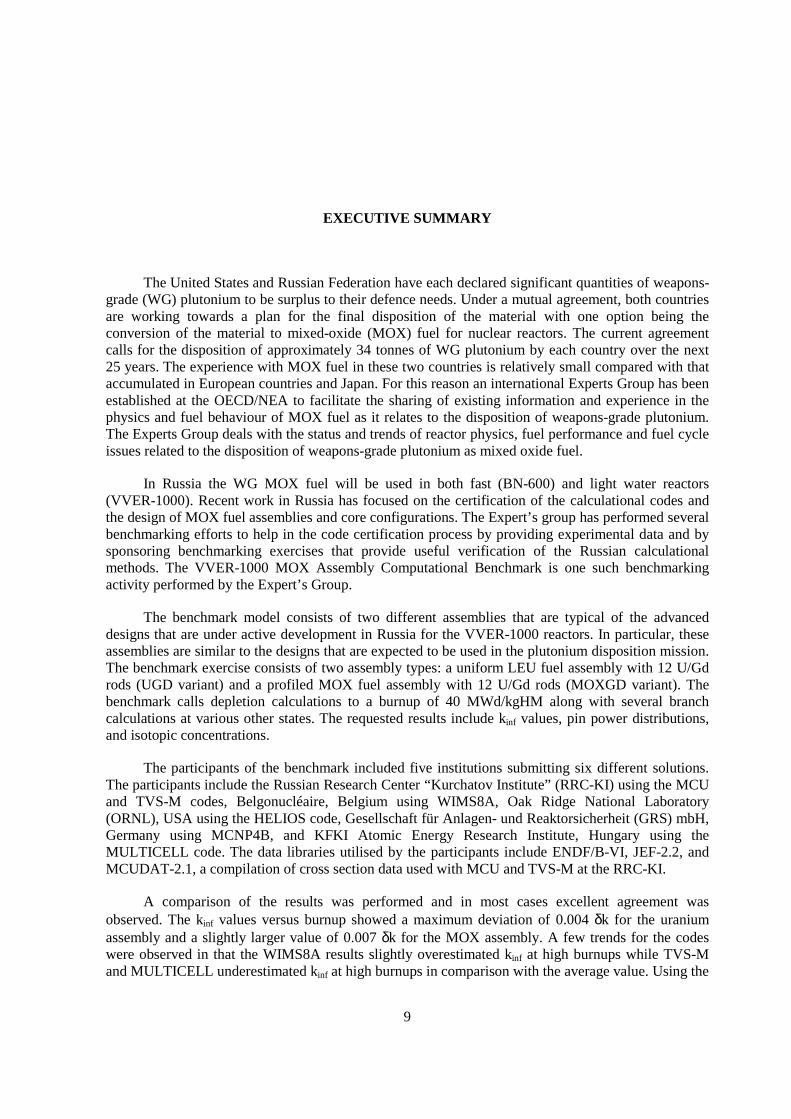
EXECUTIVE SUMMARY
The United States and Russian Federation have each declared significant quantities of weapons-grade (WG) plutonium to be surplus to their defence needs. Under a mutual agreement, both countriesare working towards a plan for the final disposition of the material with one option being theconversion of the material to mixed-oxide (MOX) fuel for nuclear reactors. The current agreementcalls for the disposition of approximately 34 tonnes of WG plutonium by each country over the next25 years. The experience with MOX fuel in these two countries is relatively small compared with thataccumulated in European countries and Japan. For this reason an international Experts Group has beenestablished at the OECD/NEA to facilitate the sharing of existing information and experience in thephysics and fuel behaviour of MOX fuel as it relates to the disposition of weapons-grade plutonium.The Experts Group deals with the status and trends of reactor physics, fuel performance and fuel cycleissues related to the disposition of weapons-grade plutonium as mixed oxide fuel.
In Russia the WG MOX fuel will be used in both fast (BN-600) and light water reactors(VVER-1000). Recent work in Russia has focused on the certification of the calculational codes andthe design of MOX fuel assemblies and core configurations. The Expert’s group has performed severalbenchmarking efforts to help in the code certification process by providing experimental data and bysponsoring benchmarking exercises that provide useful verification of the Russian calculationalmethods. The VVER-1000 MOX Assembly Computational Benchmark is one such benchmarkingactivity performed by the Expert’s Group.
The benchmark model consists of two different assemblies that are typical of the advanceddesigns that are under active development in Russia for the VVER-1000 reactors. In particular, theseassemblies are similar to the designs that are expected to be used in the plutonium disposition mission.The benchmark exercise consists of two assembly types: a uniform LEU fuel assembly with 12 U/Gdrods (UGD variant) and a profiled MOX fuel assembly with 12 U/Gd rods (MOXGD variant). Thebenchmark calls depletion calculations to a burnup of 40 MWd/kgHM along with several branchcalculations at various other states. The requested results include kinf values, pin power distributions,and isotopic concentrations.
The participants of the benchmark included five institutions submitting six different solutions.The participants include the Russian Research Center “Kurchatov Institute” (RRC-KI) using the MCUand TVS-M codes, Belgonucléaire, Belgium using WIMS8A, Oak Ridge National Laboratory(ORNL), USA using the HELIOS code, Gesellschaft für Anlagen- und Reaktorsicherheit (GRS) mbH,Germany using MCNP4B, and KFKI Atomic Energy Research Institute, Hungary using theMULTICELL code. The data libraries utilised by the participants include ENDF/B-VI, JEF-2.2, andMCUDAT-2.1, a compilation of cross section data used with MCU and TVS-M at the RRC-KI.
A comparison of the results was performed and in most cases excellent agreement wasobserved. The kinf values versus burnup showed a maximum deviation of 0.004 δk for the uraniumassembly and a slightly larger value of 0.007 δk for the MOX assembly. A few trends for the codeswere observed in that the WIMS8A results slightly overestimated kinf at high burnups while TVS-Mand MULTICELL underestimated kinf at high burnups in comparison with the average value. Using the

10
branch calculations, several reactivity effects were compared and generally show good agreement. Asummary of the results is given below:
• Discrepancies for reactivity effects are approximately the same both for UGD and MOXGDvariants and are somewhat increased at high burnup.
• The R.M.S. (root-mean-square) difference for 135Xe and 149Sm poisoning effect is ~5% δk.
• Deviations in boron effect are smaller and equal to 2-2.5% δk.
• The R.M.S. difference for fuel temperature effect is 5-7% δk for all the burnup points withexception of the UGD variant in zero burnup point, where the R.M.S. difference is 8.7% δk.
• Deviations of the total temperature effect have a tendency to increase with burnup; at highburnups the deviations are 6% δk for UGD and 7% δk for MOXGD variants.
The results of comparison of pin-by-pin power distributions computed by various codes show verygood agreement. The discrepancies do not exceed 2% for UGD and 3% for MOXGD variants. Thebenchmark problem has demonstrated that the codes and data represented by the participants can beused to compute constant results for both the UGD and MOXGD assembly designs.
The verification of spectral codes using benchmarks such as the one described above, is only a part ofoverall verification of the whole code package for VVERs calculations. Additional parts of thispackage (codes for core coarse-mesh and fine-mesh calculation) must be verified as well. Work alongthese lines should be continued and benchmarking efforts should be extended to the whole-coremethods involving fuel cycle and kinetics calculations. Further, it should be emphasised thatverification on the base of calculational benchmarks does not eliminate the necessity of comparingwith the results obtained at MOX fuelled experimental facilities.

11
Chapter 1
INTRODUCTION
The United States and Russian Federation have each declared significant quantities of weapons-grade (WG) plutonium to be surplus to their defence needs. Under a mutual agreement, both countriesare working towards a plan for the final disposition of the material with one option being theconversion of the material to mixed-oxide (MOX) fuel for nuclear reactors. The current agreementcalls for the disposition of approximately 34 tonnes of WG plutonium by each country over the nexttwenty-five years. The experience with MOX fuel in these two countries is relatively small comparedwith that accumulated in European countries and Japan.
For this reason an international Experts Group has been established at the OECD/NEA tofacilitate the sharing of existing information and experience in the physics and fuel behaviour of MOXfuel as it relates to the disposition of weapons-grade plutonium. The Experts Group deals with thestatus and trends of reactor physics, fuel performance and fuel cycle issues related to the disposition ofweapons-grade plutonium as mixed oxide fuel. Its objectives are to provide up-to-date information anddevelop a consensus regarding core and fuel cycle issues with weapons-grade plutonium disposition inthermal water reactors (PWR, BWR, VVER-1000, and CANDU) and fast reactors (BN-600). Thetopics covered include core physics, fuel performance and reliability, thermal water reactor and fastreactor fuel designs, fuel management approaches for maximising weapons-grade plutoniumdisposition rates, and fuel cycle flexibility. The Experts Group also aims to provide advice to thenuclear community on the scientific and technical developments needed to meet requirements (e.g.data, methods and validation experiments) for implementing weapons-grade plutonium dispositionapproaches. In this regard, activities are closely co-ordinated with other NEA groups such as theWorking Party on Physics of Plutonium Fuels and Innovative Fuel Cycles. A summary of recentactivities of the Experts Group was recently presented at an International Meeting [1].
In Russia the WG MOX fuel will be used in both fast (BN-600) and light water reactors(VVER-1000). Recent work in Russia has focused on the certification of the calculational codes andthe design of MOX fuel assemblies and core configurations. The Expert’s group has performed severalbenchmarking efforts to help in the code certification process by providing experimental data and bysponsoring benchmarking exercises that provide useful verification of the Russian calculationalmethods. While these Russian codes and data have been certified for LEU-based fuel, the certificationfor MOX fuel is required because of the essential differences between reactors fuelled with MOX:
• Reduced worth of the control rods, boric acid and burnable poisons.
• Reduced effective fraction of delayed neutrons.
• Reduced moderator temperature reactivity coefficient at the end of fuel cycle.
• Increased pin power peaking factor at the boundary between MOX and UOX FAs whichmakes it necessary to use fuel rods with different contents of plutonium in fuel assembly.
12
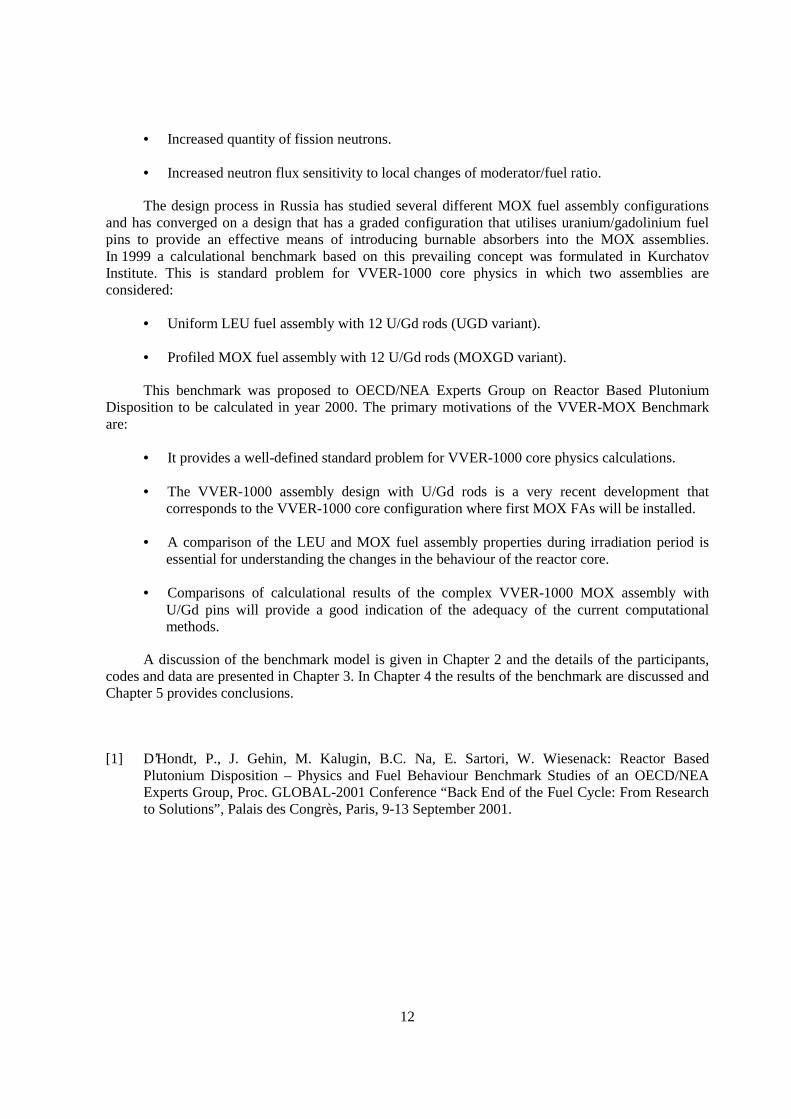
• Increased quantity of fission neutrons.
• Increased neutron flux sensitivity to local changes of moderator/fuel ratio.
The design process in Russia has studied several different MOX fuel assembly configurationsand has converged on a design that has a graded configuration that utilises uranium/gadolinium fuelpins to provide an effective means of introducing burnable absorbers into the MOX assemblies.In 1999 a calculational benchmark based on this prevailing concept was formulated in KurchatovInstitute. This is standard problem for VVER-1000 core physics in which two assemblies areconsidered:
• Uniform LEU fuel assembly with 12 U/Gd rods (UGD variant).
• Profiled MOX fuel assembly with 12 U/Gd rods (MOXGD variant).
This benchmark was proposed to OECD/NEA Experts Group on Reactor Based PlutoniumDisposition to be calculated in year 2000. The primary motivations of the VVER-MOX Benchmarkare:
• It provides a well-defined standard problem for VVER-1000 core physics calculations.
• The VVER-1000 assembly design with U/Gd rods is a very recent development thatcorresponds to the VVER-1000 core configuration where first MOX FAs will be installed.
• A comparison of the LEU and MOX fuel assembly properties during irradiation period isessential for understanding the changes in the behaviour of the reactor core.
• Comparisons of calculational results of the complex VVER-1000 MOX assembly withU/Gd pins will provide a good indication of the adequacy of the current computationalmethods.
A discussion of the benchmark model is given in Chapter 2 and the details of the participants,codes and data are presented in Chapter 3. In Chapter 4 the results of the benchmark are discussed andChapter 5 provides conclusions.
[1] D’Hondt, P., J. Gehin, M. Kalugin, B.C. Na, E. Sartori, W. Wiesenack: Reactor BasedPlutonium Disposition – Physics and Fuel Behaviour Benchmark Studies of an OECD/NEAExperts Group, Proc. GLOBAL-2001 Conference “Back End of the Fuel Cycle: From Researchto Solutions”, Palais des Congrès, Paris, 9-13 September 2001.

13
Chapter 2
BENCHMARK MODEL
The benchmark model consists of two different assemblies that are typical of the advanceddesigns that are under active development in Russia for the VVER-1000 reactors. In particular, theseassemblies are similar to the designs that are expected to be used in the plutonium disposition mission.The detailed benchmark specifications, as used by the participants, are given in Appendix A. Anoverview of the benchmark model will be discussed in this chapter.
The benchmark exercise consists of two assembly types:
• Uniform LEU fuel assembly with 12 U/Gd rods (UGD variant).
• Profiled MOX fuel assembly with 12 U/Gd rods (MOXGD variant).
The VVER-1000 assemblies are hexagonal in design and consist of one central tube,312 fuel pin locations (12 of which are U/Gd rods), and 18 guide tubes. The clad and structuralmaterial are composed of a Zr-Nb alloy. The UGD assembly is shown in Figure 2.1 and consists offuel rods with 3.7 wt.% enrichment. The 12 U/Gd pins have a 235U enrichment of 3.6 wt.% and aGd2O3 content of 4.0 wt.%. The MOXGD assembly is shown in Figure 2.2 and contains fuel rods withthree different plutonium loadings. The central region contains MOX pins with 4.2 wt.% fissileplutonium (consisting of 93 wt.% 239Pu), two rings of fuel rods with 3.0 wt.% fissile plutonium, and anouter ring of fuel rods with 2.0 wt.% fissile plutonium. The 12 U/Gd rods are in the same locations asin the UGD assembly configuration and have the same design.
Several calculational states were included in the benchmark exercise. These states, listed inTable 2.1 cover the operational states and cold conditions. Burnup calculations are performed with theS1 state with a power density of 108 MWt/m3 to a burnup of 40 MWd/kgHM with a sufficient numberof burnup steps to provide accurate results, particularly during the burn out of the Gd absorber. Atspecified burnup points, branch calculations are performed for states S2-S5 using the isotopiccompositions from the burnup calculation. The parameters that are requested include:
State S1. Parameters versus burnup (0, 2, 4, 6, 8, 10, 12, 14, 15, 20, 40 MWd/kgHM):
kinf;
fuel isotopic composition;
pin by pin fission rate distribution.
States S2-S5. with isotopic composition at burnup points 0, 20, 40 MWd/kgHM:
kinf ;
pin by pin fission rate distribution.

14
Table 2.1. Calculation States
State Description Fuel temp.,K
Non-fuel temp.,K
135Xe,149Sm
S1 Operating poisoned state 1027 575 Eq.*
S2 Operating non-poisoned state 1027 575 0.0
S3 Hot state 575 575 0.0
S4 Hot state without boron acid 575 575 0.0
S5 Cold state 300 300 0.0
* Eq. Indicates equilibrium 135Xe and 149Sm concentrations.
Figure 2.1. UGD assembly configuration
�
�
�
�
�
�
�
�
�
�
�
�
�
�
�
�
�
�
�
�
�
�
�
�
�
�
�
�
�
�
�
�
�
�
�
�
�
�
�
�
�
�
�
�
�
�
�
�
�
�
�
�
�
�
�
�
�
�
�
�
�
�
�
�
�
�
�
�
�
�
�
�
�
�
�
�
�
�
�
�
�
�
�
�
�
�
�
�
�
�
�
�
�
�
�
�
�
�
�
�
�
�
�
�
�
�
�
�
�
�
�
�
�
�
�
�
�
�
�
�
�
�
�
�
�
�
�
�
�
�
�
�
� �
�
�
�
�
�
�
�
�
�
�
�
�
�
�
�
�
�
�
�
�
�
�
�
�
�
�
�
�
�
�
�
�
�
�
�
�
�
�
�
�
�
�
�
�
�
�
�
�
�
�
�
�
�
�
�
�
�
�
�
�
�
�
�
�
�
�
�
�
�
�
�
�
�
�
�
�
�
�
�
�
�
�
�
�
�
�
�
�
�
�
�
�
�
�
�
�
�
�
�
�
�
�
�
�
�
�
�
�
�
�
�
�
�
�
�
�
�
�
�
�
�
�
�
�
�
�
�
�
�
�
�
�
�
�
�
�
�
�
�
�
�
�
�
�
�
�
�
�
�
�
�
�
�
�
�
�
�
�
�
�
�
�
�
�
�
�
�
�
�
�
�
�
�
�
�
�
�
�
�
�
�
�
�
�
�
�
�
�
�
�
�
�
�
�
�
�
�
Cell types:
1. Central tube cell.2. Fuel cell (with U1, 3.7 wt.% LEU).3. Guide tube cell.4. Fuel cell (with GD1, 3.6 wt.% LEU with 4.0 wt.% Gd2O3).

15
Figure 2.2. MOXGD assembly configuration
5
5
2
45
4
55
5
45
4
45
46
2
4
4
55
5
5
5
5
5
5
5
5
5
54
45
54
5
4
4
5
5
4
4
4
4
4
4
4
4
5
2
4
5
4
4
4
4
4
6
5
2
2
2
2
2
2
5
4
4
4
5
4
4
2
2
2
2
2
3
2
2
2
4
2
3
2
4
4
5
4
4
2
2
2
2
2
3
2
2
4
2
6
2
2
2
2
2
2
5
4
6
2
2
6
2
5
4
4
2
3
3
2
2
2
22
2
2
2
2
2
2
2
5
4
4
2
5
4
4
2
2
2
2
2
3
2
2
2
2
62
4
4
2
2
2
2
2
4
2
5
5
4
4
2
2
2
2
6
5
4
4
2
2
2
2
2
2
2
5
4
4
2
4
2
2
2
2
4
2
2
3
5
5
4
4
2
55
5
4
44
2
2
3
4
6
6
2
44
3
32
2
2
4
2
2
2
2
54
4
45
2
3
3
2
2
2
2
2
2
2
2
2
22
2
3
3
33
3
2
2
2
22
2
3
22
2
6
5
4
4
2
5
4
6
2
5
4
4
2
2
4
4
4
2
22
2
2
2
2
2
2
5
2
2
2
2
2
2
5
4
4
4
4
4
4
4
4
4
5
5
4
4
4
4
4
6
4
4
4
4
5
5
4
4
5
5
5
5
5
1
5
5
5
5
52
2
5
Cell types:
1. Central tube cell.2. Fuel cell (with PU3, 4.2 wt.% Pu).3. Guide tube cell.4. Fuel cell (with PU2, 3.0 wt.% Pu).5. Fuel cell (with PU1, 2.0 wt.% Pu).6. Fuel cell (with GD1, 3.6 wt.% LEU with 4.0 wt.% Gd2O3).


17
Chapter 3
PARTICIPANTS, CODES, AND DATA
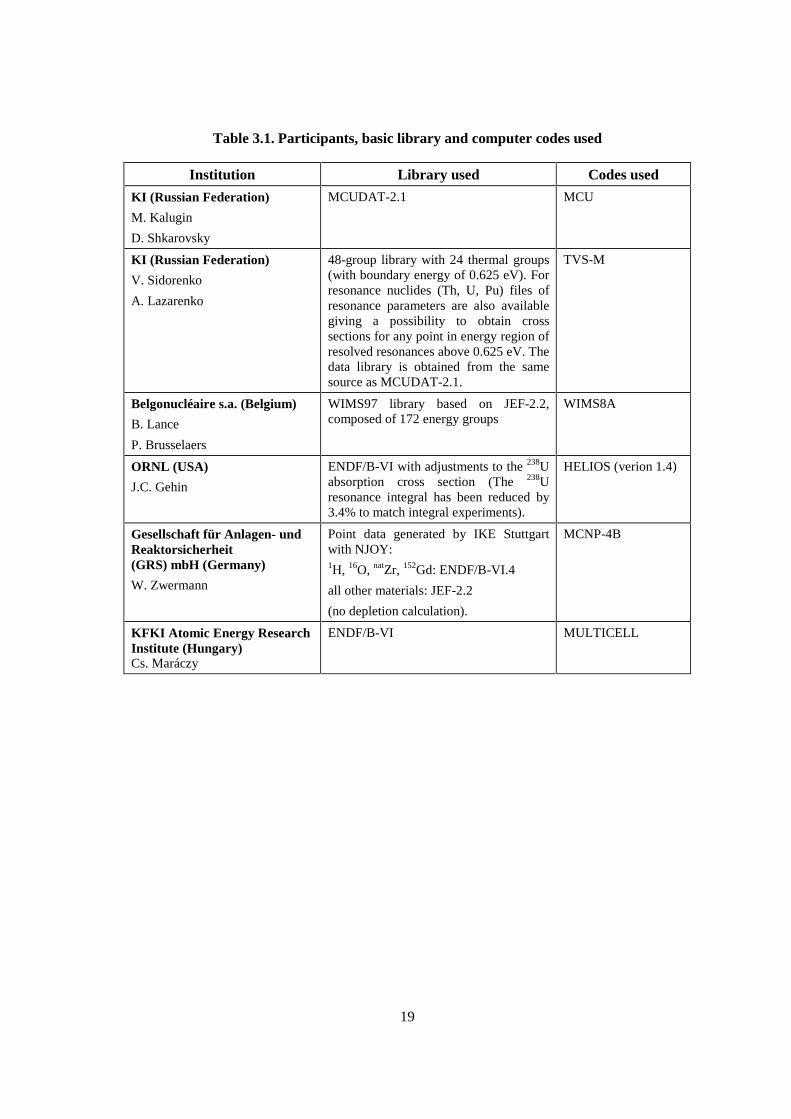
A total of six solutions were received from five countries with each participant using differentmethods and data combinations. Two of the solutions are based on continuous energy Monte Carlomethods, while the remaining solutions are based on collision probability (or similar) methods. Thesubmitted solutions cover several data libraries. The complete list of participants, basic libraries andcodes used are presented below and summarised in Table 3.1. Calculational details provided by theparticipants can be found in Appendix B.
RRC-KI, Russian Federation
• Participants: M. Kalugin and D. Shkarovsky.
• Basic Library: MCUDAT-2.1.
• Code: MCU.
• Remarks: MCU is a continuous energy Monte Carlo code.
RRC-KI, Russian Federation
• Participants: V. Sidorenko and A. Lazarenko.
• Basic Library: MCUDAT-2.1.
• Code: TVS-M.
• Remarks: Same basic library as MCU, calculational method similar to collision probabilitymethod.
Belgonucléaire, Belgium
• Participants: B. Lance and P. Brusselaers.
• Basic Library: JEF-2.2.
• Code: WIMS8A.
• Remarks: none.

18
ORNL, USA
• Participant: J.C. Gehin.
• Basic Library: ENDF/B-VI.
• Code: HELIOS 1.4.
• Remarks: none.
GRS, Germany
• Participant: W. Zwermann.
• Basic Library: JEF-2.2 and ENDF/B-VI.
• Code: MCNP4B.
• Remarks: 1H, 16O, natZr, 152Gd: ENDF/B-VI.4, all other materials: JEF-2.2.
KFKI, Hungary
• Participant: Cs. Maráczy.
• Basic Library: ENDF/B-VI.
• Code: MULTICELL.
• Remarks: none.
19
Table 3.1. Participants, basic library and computer codes used
Institution Library used Codes used
KI (Russian Federation)
M. Kalugin
D. Shkarovsky
MCUDAT-2.1 MCU
KI (Russian Federation)
V. Sidorenko
A. Lazarenko
48-group library with 24 thermal groups(with boundary energy of 0.625 eV). Forresonance nuclides (Th, U, Pu) files ofresonance parameters are also availablegiving a possibility to obtain crosssections for any point in energy region ofresolved resonances above 0.625 eV. Thedata library is obtained from the samesource as MCUDAT-2.1.
TVS-M
Belgonucléaire s.a. (Belgium)
B. Lance
P. Brusselaers
WIMS97 library based on JEF-2.2,composed of 172 energy groups
WIMS8A
ORNL (USA)
J.C. Gehin
ENDF/B-VI with adjustments to the 238Uabsorption cross section (The 238Uresonance integral has been reduced by3.4% to match integral experiments).
HELIOS (verion 1.4)
Gesellschaft für Anlagen- undReaktorsicherheit(GRS) mbH (Germany)
W. Zwermann
Point data generated by IKE Stuttgartwith NJOY:1H, 16O, natZr, 152Gd: ENDF/B-VI.4
all other materials: JEF-2.2
(no depletion calculation).
MCNP-4B
KFKI Atomic Energy ResearchInstitute (Hungary)Cs. Maráczy
ENDF/B-VI MULTICELL

21
Chapter 4
RESULTS OF BENCHMARK CALCULATIONS
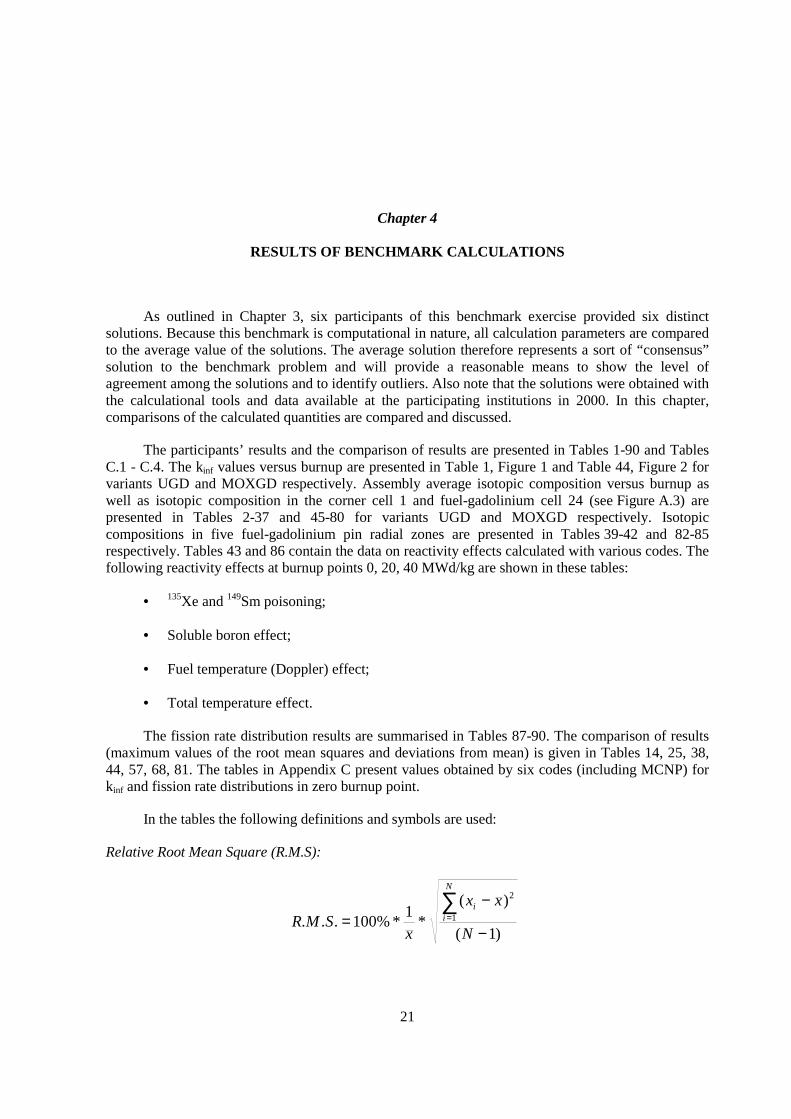
As outlined in Chapter 3, six participants of this benchmark exercise provided six distinctsolutions. Because this benchmark is computational in nature, all calculation parameters are comparedto the average value of the solutions. The average solution therefore represents a sort of “consensus”solution to the benchmark problem and will provide a reasonable means to show the level ofagreement among the solutions and to identify outliers. Also note that the solutions were obtained withthe calculational tools and data available at the participating institutions in 2000. In this chapter,comparisons of the calculated quantities are compared and discussed.
The participants’ results and the comparison of results are presented in Tables 1-90 and TablesC.1 - C.4. The kinf values versus burnup are presented in Table 1, Figure 1 and Table 44, Figure 2 forvariants UGD and MOXGD respectively. Assembly average isotopic composition versus burnup aswell as isotopic composition in the corner cell 1 and fuel-gadolinium cell 24 (see Figure A.3) arepresented in Tables 2-37 and 45-80 for variants UGD and MOXGD respectively. Isotopiccompositions in five fuel-gadolinium pin radial zones are presented in Tables 39-42 and 82-85respectively. Tables 43 and 86 contain the data on reactivity effects calculated with various codes. Thefollowing reactivity effects at burnup points 0, 20, 40 MWd/kg are shown in these tables:
• 135Xe and 149Sm poisoning;
• Soluble boron effect;
• Fuel temperature (Doppler) effect;
• Total temperature effect.
The fission rate distribution results are summarised in Tables 87-90. The comparison of results(maximum values of the root mean squares and deviations from mean) is given in Tables 14, 25, 38,44, 57, 68, 81. The tables in Appendix C present values obtained by six codes (including MCNP) forkinf and fission rate distributions in zero burnup point.
In the tables the following definitions and symbols are used:
Relative Root Mean Square (R.M.S):
)1(
)(*
1*%100... 1
2
−
−=
∑=
N
xx
xSMR
N
ii

22
Absolute Root Mean Square (∆):
)1(
)(1
2
−
−=∆
∑=
N
xxN
ii
Relative Deviation from mean value:
x
xxDeviationRelative i −
= *%100
Absolute deviation from mean value:
xxDeviationAbsolute i −=where
i code number, i=1,N
N total number of codes used to obtain the parameter (in this report N=5, except for tables onfission rate distributions and reactivity effects that include the results obtained by means ofMCNP-4B, where N=6 in corresponding rows and columns).
ix value of parameter obtained by code i, ∑=
=N
iix
Nx
1
1 - mean values of parameter
4.1. Calculational methods
Four of the submitted solutions are based on deterministic methods. The RRC-KI calculationsperformed with the two-dimensional lattice code TVS-M is based on the so-called “method of passingthrough probability”, which is similar to collision probability methods commonly used in other codes.The TVS-M library contains 48 energy groups with 24 thermal groups and the data is based on astandard formulation used at the RRC-KI known as MCUDAT-2.1. MCUDAT-2.1 has been derivedfrom several sources and is described in more detail in Appendix B. The ORNL calculations wereperformed with the HELIOS fuel assembly analysis code version 1.4. The HELIOS methods are basedon collision probability with current coupling. The calculations were performed with 190 energygroups (62 thermal groups) with the data based on ENDF/B-VI. Note that in the production HELIOSlibrary that the 238U resonance integral has been adjusted to match critical experiments. TheBelgonucléaire calculations were performed with WIMS8A using the method of characteristics. Thecross section library (WIMS97) is based on JEF-2.2 and consists of 172 energy groups. The KFKIAtomic Energy Research Institute provided results using the MULTICELL collision probability code.The MULTICELL cross sections are based on ENDF/B-VI and use 70 energy groups (35 thermalgroups).
Two solutions based on Monte Carlo calculations were submitted. One of these solutions wasprovided by the RRC-KI using the MCU Monte Carlo code. MCU uses a continuous energyformulation and uses the MCUDAT-2.1 cross section data, as previously discussed above in regards tothe TVS-M code. Burnup calculations were performed using MCU in combination with a standardburnup code using 39 actinides and 165 fission products. The MCU kinf results were performed with asufficient number of particle histories such that the statistical uncertainty is less than 0.1% (onestandard deviation). The other Monte Carlo solution was submitted by GRS using MCNP4B with 1H,
23
16O, natZr, 152Gd cross sections from ENDF/B-VI.4 all other materials from JEF-2.2. The MCNPcalculations were performed for fresh fuel conditions and used 1,000,000 particle histories.
More details of the codes, methods, and data libraries were provided by the benchmarkparticipants and are given in Appendix B.
4.2. Effective multiplication factor
The benchmark specification called for depletion calculation of two VVER-1000 fuelassemblies (UGD and MOXGD) were being in the working state S1. Additionally, for some burnuppoints calculation of several alternate states is required.
The kinf values versus burnup obtained by various codes are presented in Table 1, Figure 1 andTable 44, Figure 2 for variants UGD and MOXGD respectively. The results show generally goodagreement, but it should be noted that:
• All the codes give very similar behaviour of kinf vs. burnup for both UGD and MOXGDvariants.
• The results for the UGD variant demonstrate very good agreement among all of thesubmitted solutions with a maximum difference of 0.004 δk at high burnup. The WIMS8Aslightly underestimates kinf at the beginning of burnup in comparison with the othersolutions while TVS-M and MULTICELL slightly underestimate kinf values at the higherburnups (0.004 δk in comparison to the mean value).
• The results for the MOXGD variant show slightly larger discrepancies in kinf withdeviations exceeding 0.007 δk at high burnup. Similar to the UGD results, WIMS8Aunderestimates kinf relatively to mean value at the beginning of burnup (0.007 δk), and TVS-M and MULTICELL underestimate kinf values at the higher burnups (~0.007 δk relatively tomean value).
Results of separate state calculations (for specific states see Table 2.1) obtained for severalburnup points are given in Tables C.1 and C.2. These results show that the maximum differencesbetween codes are observed at high burnups and for some states the deviations are as large as ~1.5% incase of uranium assembly and up to ~2.5% in case of MOX assembly.
The multiplication factors for fuel assembly variants were used to compute various reactivityeffects. Corresponding results obtained with six codes are presented in Tables 43, 86 and showgenerally good agreement with a few exceptions:
• Discrepancies for reactivity effects are approximately the same both for UGD and MOXGDvariants and are somewhat increased at high burnup.
• The R.M.S. difference for 135Xe and 149Sm poisoning effect is ~5% δk.
• Deviations in boron effect are smaller and equal to 2-2.5% δk.
• The R.M.S. difference for fuel temperature effect is 5-7% δk for all the burnup points withexception of the UGD variant in zero burnup point, where the R.M.S. difference is 8.7% δk.

24
• Deviations of the total temperature effect have a tendency to increase with burnup; at highburnups the deviations are 6% δk for UGD and 7% δk for MOXGD variants.
4.3. Fission rate distributions
The results of comparison of pin-by-pin power distributions computed by various codes areshown in Tables 87-90. Comparison results are presented for state S1 burnup points 0, 2, 4, 6, 8, 10,12, 14, 15, 20, 40 MWd/kgHM, and for other states S2-S5 for three burnup points (0, 20 and40 MWd/kgHM) The tables make it possible to conclude that pin-by-pin fission rate distributioncalculations show very good agreement. The discrepancies do not exceed 2% for UGD and 3% forMOXGD variants.
For UGD variant at the beginning of burnup, the pin with maximum deviation is uranium-gadolinium pin and is located at pin location 24 (see Figure A.3). At the end of burnup pin withmaximum deviation is uranium pin number 1 at the corner of the system. For MOXGD variant at thebeginning of burnup pin with maximum deviation is uranium pin number 1 at the corner of theassembly and at the end of burnup pin with maximum deviation is uranium-gadolinium pin number 35.
4.4. Isotopic concentrations
Assembly average isotopic composition versus burnup as well as isotopic composition in thecorner cell 1 and fuel-gadolinium cell 24 (see Figure A.3) are presented in Tables 2-38 and 45-81 forvariants UGD and MOXGD respectively. For assembly average isotopic composition the R.M.S.deviation is ~2% for 235U and 3.4% for 239Pu. For 149Sm the R.M.S. deviation is approximately 7%.
Isotopic compositions in five fuel-gadolinium pin radial zones for burnup point 2 MWd/kgHMare presented in Tables 39-42 and 82-85 respectively. The radial distribution of the Pu and Gd isotopesin the fuel-gadolinium pin shows very good agreement. For 239Pu the R.M.S. deviation is 5% in innerzone when the MULTICELL results are not included in the comparison and about 11% with theMULTICELL results are included. The 155Gd R.M.S. deviation is 2% in the outer zone.
25
Chapter 5
CONCLUSIONS
The VVER-MOX Calculational Benchmark Results were analysed. Five participants havesubmitted results with burnup calculations and one with only BOL results. The codes use a variety ofdifferent methods and nuclear data. A comparison of the results shows rather good agreement amongthe various codes.
All codes give very similar trends in kinf versus burnup, but TVS-M and MULTICELL codeshave a tendency to underestimate somewhat a kinf at the end of burnup relative to the other tree codes.Pin-by-pin fission rate distribution calculations show very good agreement with the discrepancy notexceeding 2% for UGD and 3% for MOXGD variants.
The verification of spectral codes using benchmarks such as the one described above, is only apart of overall verification of the whole code package for VVERs calculations. Additional parts of thispackage (codes for core coarse-mesh and fine-mesh calculation) must be verified as well. Work alongthese lines should be continued and benchmarking efforts should be extended to the whole-coremethods involving fuel cycle and kinetics calculations. Further, it should be emphasised thatverification on the base of calculational benchmarks does not eliminate the necessity of comparingwith the results obtained at MOX fuelled experimental facilities.


27
TABLES


Table 1. UGD Variant. Kinf. Abs. Deviation from Mean Value
Kinf Abs. Deviation from Mean (K-mean)BurnupMWd/kgHM MCU TVS-M WIMS8A HELIOS MULTICELL
Mean ∆MCU TVS-M WIMS8A HELIOS MULTICELL
0 1.1353 1.1353 1.1328 1.1355 1.1363 1.1350 0.001 0.000 0.000 -0.002 0.000 0.001
1 1.1364 1.1345 1.1303 1.1361 1.1370 1.1349 0.002 0.002 0.000 -0.005 0.001 0.002
2 1.1354 1.1355 1.1318 1.1377 1.1382 1.1357 0.002 0.000 0.000 -0.004 0.002 0.002
3 1.1388 1.1359 1.1330 1.1387 1.1386 1.1370 0.002 0.002 -0.001 -0.004 0.002 0.002
4 1.1377 1.1365 1.1341 1.1395 1.1389 1.1373 0.002 0.000 -0.001 -0.003 0.002 0.002
5 1.1390 1.1375 1.1358 1.1407 1.1394 1.1385 0.002 0.001 -0.001 -0.003 0.002 0.001
6 1.1408 1.1390 1.1380 1.1421 1.1404 1.1401 0.001 0.001 -0.001 -0.002 0.002 0.000
7 1.1427 1.1403 1.1392 1.1430 1.1414 1.1413 0.001 0.001 -0.001 -0.002 0.002 0.000
8 1.1421 1.1390 1.1371 1.1414 1.1404 1.1400 0.002 0.002 -0.001 -0.003 0.001 0.000
9 1.1344 1.1346 1.1318 1.1365 1.1363 1.1347 0.002 0.000 0.000 -0.003 0.002 0.002
10 1.1284 1.1273 1.1240 1.1291 1.1295 1.1277 0.002 0.001 0.000 -0.004 0.001 0.002
11 1.1178 1.1185 1.1150 1.1203 1.1209 1.1185 0.002 -0.001 0.000 -0.003 0.002 0.002
12 1.1099 1.1092 1.1058 1.1112 1.1117 1.1096 0.002 0.000 0.000 -0.004 0.002 0.002
13 1.0996 1.1000 1.0966 1.1020 1.1025 1.1002 0.002 -0.001 0.000 -0.004 0.002 0.002
14 1.0923 1.0910 1.0877 1.0931 1.0935 1.0915 0.002 0.001 -0.001 -0.004 0.002 0.002
15 1.0827 1.0821 1.0790 1.0843 1.0846 1.0825 0.002 0.000 0.000 -0.004 0.002 0.002
20 1.0403 1.0405 1.0383 1.0435 1.0427 1.0411 0.002 -0.001 -0.001 -0.003 0.002 0.002
25 1.0039 1.0022 1.0017 1.0061 1.0041 1.0036 0.002 0.000 -0.001 -0.002 0.003 0.001
30 0.9703 0.9665 0.9681 0.9714 0.9681 0.9689 0.002 0.001 -0.002 -0.001 0.003 -0.001
35 0.9415 0.9332 0.9372 0.9391 0.9343 0.9371 0.004 0.004 -0.004 0.000 0.002 -0.003
40 0.9091 0.9025 0.9088 0.9091 0.9029 0.9065 0.004 0.003 -0.004 0.002 0.003 -0.004
29

Figure 1. UGD Variant. Kinf vs Burnup
���
�����
�����
�����
�����
�����
�����
� � �� �� �� �� �� �� ��
%XUQXS�0:G�NJ
.LQI
0&8
796�0
:,06�$
+(/,26
08/7,&(//
30

Table 2. UGD. Assembly Average Isotopic Composition. 235U, atoms/barn*cm
UGD. Assembly Average Isotopic Composition. 235U, atoms/barn*cm Relative Deviation from Mean Value,100%*(X-Mean)/Mean
BurnupMWd/kgHM
MCU TVS-M WIMS8A HELIOS MULTICELL
Mean R.M.S. %
MCU TVS-M WIMS8A HELIOS MULTICELL
0 2.595E-04 2.596E-04 2.596E-04 2.596E-04 2.596E-04 2.596E-04 0.02 -0.04 0.01 0.01 0.01 0.00
1 2.512E-04 2.513E-04 2.514E-04 2.514E-04 2.514E-04 2.513E-04 0.03 -0.05 0.00 0.01 0.01 0.03
2 2.432E-04 2.434E-04 2.434E-04 2.434E-04 2.434E-04 2.434E-04 0.03 -0.06 0.00 0.03 0.02 0.01
3 2.356E-04 2.357E-04 2.358E-04 2.358E-04 2.358E-04 2.357E-04 0.04 -0.07 -0.01 0.04 0.02 0.03
4 2.281E-04 2.283E-04 2.284E-04 2.284E-04 2.284E-04 2.283E-04 0.05 -0.08 -0.02 0.05 0.02 0.03
5 2.209E-04 2.211E-04 2.213E-04 2.212E-04 2.212E-04 2.212E-04 0.06 -0.09 -0.03 0.08 0.03 0.02
6 2.140E-04 2.141E-04 2.144E-04 2.143E-04 2.143E-04 2.142E-04 0.08 -0.11 -0.04 0.10 0.02 0.04
7 2.072E-04 2.074E-04 2.077E-04 2.075E-04 2.076E-04 2.075E-04 0.10 -0.13 -0.06 0.12 0.02 0.05
8 2.006E-04 2.008E-04 2.012E-04 2.010E-04 2.010E-04 2.009E-04 0.11 -0.15 -0.07 0.15 0.03 0.04
9 1.942E-04 1.944E-04 1.949E-04 1.946E-04 1.946E-04 1.946E-04 0.13 -0.16 -0.08 0.19 0.03 0.02
10 1.880E-04 1.882E-04 1.888E-04 1.884E-04 1.884E-04 1.884E-04 0.15 -0.18 -0.10 0.22 0.03 0.02
11 1.819E-04 1.821E-04 1.828E-04 1.824E-04 1.824E-04 1.823E-04 0.18 -0.21 -0.12 0.26 0.03 0.04
12 1.760E-04 1.762E-04 1.770E-04 1.765E-04 1.765E-04 1.765E-04 0.20 -0.23 -0.13 0.30 0.03 0.03
13 1.703E-04 1.705E-04 1.713E-04 1.708E-04 1.708E-04 1.707E-04 0.23 -0.26 -0.16 0.34 0.03 0.04
14 1.647E-04 1.649E-04 1.658E-04 1.652E-04 1.652E-04 1.652E-04 0.26 -0.28 -0.18 0.40 0.04 0.02
15 1.593E-04 1.594E-04 1.605E-04 1.598E-04 1.598E-04 1.598E-04 0.29 -0.31 -0.20 0.45 0.04 0.03
20 1.341E-04 1.343E-04 1.358E-04 1.348E-04 1.346E-04 1.347E-04 0.48 -0.45 -0.30 0.79 0.04 -0.08
25 1.121E-04 1.123E-04 1.142E-04 1.129E-04 1.126E-04 1.128E-04 0.74 -0.64 -0.44 1.24 0.03 -0.20
30 9.294E-05 9.319E-05 9.548E-05 9.379E-05 9.342E-05 9.376E-05 1.08 -0.88 -0.61 1.83 0.03 -0.37
35 7.636E-05 7.665E-05 7.926E-05 7.730E-05 7.680E-05 7.728E-05 1.50 -1.18 -0.81 2.57 0.03 -0.61
40 6.223E-05 6.248E-05 6.534E-05 6.317E-05 6.254E-05 6.315E-05 2.01 -1.46 -1.07 3.47 0.03 -0.97
31
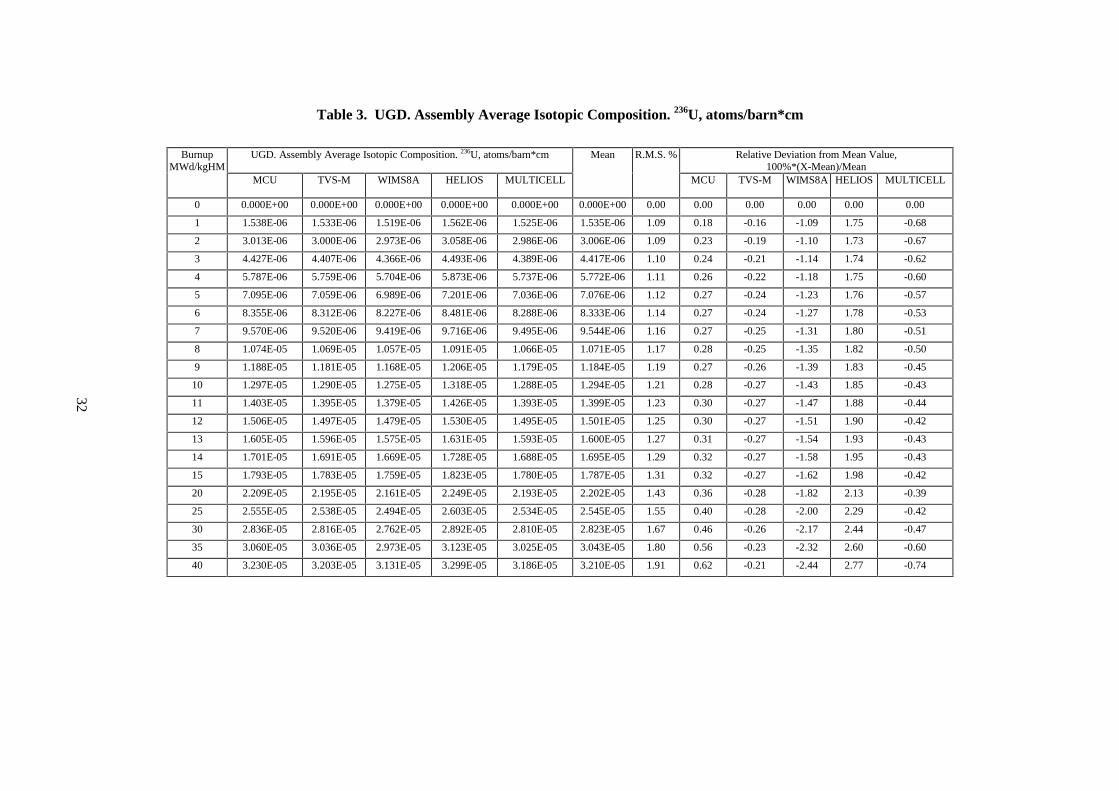
Table 3. UGD. Assembly Average Isotopic Composition. 236U, atoms/barn*cm
UGD. Assembly Average Isotopic Composition. 236U, atoms/barn*cm Relative Deviation from Mean Value,100%*(X-Mean)/Mean
BurnupMWd/kgHM
MCU TVS-M WIMS8A HELIOS MULTICELL
Mean R.M.S. %
MCU TVS-M WIMS8A HELIOS MULTICELL
0 0.000E+00 0.000E+00 0.000E+00 0.000E+00 0.000E+00 0.000E+00 0.00 0.00 0.00 0.00 0.00 0.00
1 1.538E-06 1.533E-06 1.519E-06 1.562E-06 1.525E-06 1.535E-06 1.09 0.18 -0.16 -1.09 1.75 -0.68
2 3.013E-06 3.000E-06 2.973E-06 3.058E-06 2.986E-06 3.006E-06 1.09 0.23 -0.19 -1.10 1.73 -0.67
3 4.427E-06 4.407E-06 4.366E-06 4.493E-06 4.389E-06 4.417E-06 1.10 0.24 -0.21 -1.14 1.74 -0.62
4 5.787E-06 5.759E-06 5.704E-06 5.873E-06 5.737E-06 5.772E-06 1.11 0.26 -0.22 -1.18 1.75 -0.60
5 7.095E-06 7.059E-06 6.989E-06 7.201E-06 7.036E-06 7.076E-06 1.12 0.27 -0.24 -1.23 1.76 -0.57
6 8.355E-06 8.312E-06 8.227E-06 8.481E-06 8.288E-06 8.333E-06 1.14 0.27 -0.24 -1.27 1.78 -0.53
7 9.570E-06 9.520E-06 9.419E-06 9.716E-06 9.495E-06 9.544E-06 1.16 0.27 -0.25 -1.31 1.80 -0.51
8 1.074E-05 1.069E-05 1.057E-05 1.091E-05 1.066E-05 1.071E-05 1.17 0.28 -0.25 -1.35 1.82 -0.50
9 1.188E-05 1.181E-05 1.168E-05 1.206E-05 1.179E-05 1.184E-05 1.19 0.27 -0.26 -1.39 1.83 -0.45
10 1.297E-05 1.290E-05 1.275E-05 1.318E-05 1.288E-05 1.294E-05 1.21 0.28 -0.27 -1.43 1.85 -0.43
11 1.403E-05 1.395E-05 1.379E-05 1.426E-05 1.393E-05 1.399E-05 1.23 0.30 -0.27 -1.47 1.88 -0.44
12 1.506E-05 1.497E-05 1.479E-05 1.530E-05 1.495E-05 1.501E-05 1.25 0.30 -0.27 -1.51 1.90 -0.42
13 1.605E-05 1.596E-05 1.575E-05 1.631E-05 1.593E-05 1.600E-05 1.27 0.31 -0.27 -1.54 1.93 -0.43
14 1.701E-05 1.691E-05 1.669E-05 1.728E-05 1.688E-05 1.695E-05 1.29 0.32 -0.27 -1.58 1.95 -0.43
15 1.793E-05 1.783E-05 1.759E-05 1.823E-05 1.780E-05 1.787E-05 1.31 0.32 -0.27 -1.62 1.98 -0.42
20 2.209E-05 2.195E-05 2.161E-05 2.249E-05 2.193E-05 2.202E-05 1.43 0.36 -0.28 -1.82 2.13 -0.39
25 2.555E-05 2.538E-05 2.494E-05 2.603E-05 2.534E-05 2.545E-05 1.55 0.40 -0.28 -2.00 2.29 -0.42
30 2.836E-05 2.816E-05 2.762E-05 2.892E-05 2.810E-05 2.823E-05 1.67 0.46 -0.26 -2.17 2.44 -0.47
35 3.060E-05 3.036E-05 2.973E-05 3.123E-05 3.025E-05 3.043E-05 1.80 0.56 -0.23 -2.32 2.60 -0.60
40 3.230E-05 3.203E-05 3.131E-05 3.299E-05 3.186E-05 3.210E-05 1.91 0.62 -0.21 -2.44 2.77 -0.74
32

Table 4. UGD. Assembly Average Isotopic Composition. 238U, atoms/barn*cm
UGD. Assembly Average Isotopic Composition. 238U, atoms/barn*cm Relative Deviation from Mean Value,100%*(X-Mean)/Mean
BurnupMWd/kgHM
MCU TVS-M WIMS8A HELIOS MULTICELL
Mean R.M.S. %
MCU TVS-M WIMS8A HELIOS MULTICELL
0 6.676E-03 6.678E-03 6.679E-03 6.679E-03 6.679E-03 6.678E-03 0.02 -0.04 0.01 0.01 0.01 0.01
1 6.670E-03 6.674E-03 6.674E-03 6.674E-03 6.674E-03 6.673E-03 0.03 -0.05 0.01 0.01 0.01 0.01
2 6.667E-03 6.669E-03 6.669E-03 6.669E-03 6.669E-03 6.669E-03 0.02 -0.03 0.01 0.01 0.01 0.01
3 6.661E-03 6.665E-03 6.664E-03 6.665E-03 6.665E-03 6.664E-03 0.03 -0.05 0.01 0.01 0.01 0.02
4 6.657E-03 6.660E-03 6.659E-03 6.660E-03 6.660E-03 6.659E-03 0.02 -0.03 0.01 0.00 0.01 0.01
5 6.652E-03 6.655E-03 6.655E-03 6.656E-03 6.655E-03 6.654E-03 0.02 -0.04 0.01 0.00 0.02 0.01
6 6.648E-03 6.651E-03 6.650E-03 6.651E-03 6.651E-03 6.650E-03 0.02 -0.03 0.01 0.00 0.02 0.01
7 6.643E-03 6.646E-03 6.645E-03 6.647E-03 6.646E-03 6.645E-03 0.02 -0.04 0.01 0.00 0.02 0.01
8 6.638E-03 6.641E-03 6.640E-03 6.642E-03 6.642E-03 6.641E-03 0.03 -0.04 0.01 -0.01 0.02 0.02
9 6.633E-03 6.637E-03 6.636E-03 6.637E-03 6.637E-03 6.636E-03 0.02 -0.04 0.01 -0.01 0.02 0.02
10 6.629E-03 6.632E-03 6.631E-03 6.633E-03 6.632E-03 6.631E-03 0.02 -0.04 0.01 -0.01 0.02 0.01
11 6.624E-03 6.627E-03 6.626E-03 6.628E-03 6.627E-03 6.626E-03 0.02 -0.04 0.01 -0.01 0.02 0.01
12 6.619E-03 6.622E-03 6.621E-03 6.623E-03 6.623E-03 6.622E-03 0.03 -0.04 0.01 -0.01 0.02 0.02
13 6.614E-03 6.618E-03 6.616E-03 6.618E-03 6.618E-03 6.617E-03 0.03 -0.04 0.01 -0.01 0.02 0.02
14 6.609E-03 6.613E-03 6.611E-03 6.614E-03 6.613E-03 6.612E-03 0.03 -0.05 0.01 -0.01 0.03 0.02
15 6.604E-03 6.608E-03 6.606E-03 6.609E-03 6.608E-03 6.607E-03 0.03 -0.04 0.01 -0.02 0.03 0.02
20 6.578E-03 6.582E-03 6.580E-03 6.584E-03 6.583E-03 6.581E-03 0.03 -0.05 0.01 -0.02 0.03 0.02
25 6.552E-03 6.556E-03 6.553E-03 6.557E-03 6.557E-03 6.555E-03 0.04 -0.05 0.01 -0.03 0.04 0.03
30 6.524E-03 6.528E-03 6.525E-03 6.530E-03 6.530E-03 6.527E-03 0.04 -0.05 0.01 -0.04 0.04 0.04
35 6.495E-03 6.500E-03 6.496E-03 6.502E-03 6.502E-03 6.499E-03 0.05 -0.06 0.01 -0.05 0.04 0.05
40 6.465E-03 6.470E-03 6.465E-03 6.472E-03 6.472E-03 6.469E-03 0.05 -0.06 0.01 -0.05 0.05 0.05
33

Table 5. UGD. Assembly Average Isotopic Composition. 239Pu, atoms/barn*cm
UGD. Assembly Average Isotopic Composition. 239Pu, atoms/barn*cm Relative Deviation from Mean Value,100%*(X-Mean)/Mean
BurnupMWd/kgHM
MCU TVS-M WIMS8A HELIOS MULTICELL
Mean R.M.S. %
MCU TVS-M WIMS8A HELIOS MULTICELL
0 0.000E+00 0.000E+00 0.000E+00 0.000E+00 0.000E+00 0.000E+00 0.00 0.00 0.00 0.00 0.00 0.00
1 3.403E-06 3.412E-06 3.492E-06 3.383E-06 3.391E-06 3.416E-06 1.29 -0.38 -0.12 2.22 -0.99 -0.74
2 6.992E-06 6.989E-06 7.164E-06 6.861E-06 6.948E-06 6.991E-06 1.58 0.02 -0.03 2.48 -1.86 -0.62
3 1.024E-05 1.022E-05 1.048E-05 9.994E-06 1.016E-05 1.022E-05 1.70 0.23 0.03 2.53 -2.20 -0.58
4 1.320E-05 1.315E-05 1.348E-05 1.282E-05 1.306E-05 1.314E-05 1.80 0.43 0.08 2.54 -2.43 -0.62
5 1.586E-05 1.581E-05 1.620E-05 1.539E-05 1.570E-05 1.579E-05 1.85 0.46 0.14 2.56 -2.58 -0.58
6 1.829E-05 1.823E-05 1.867E-05 1.771E-05 1.809E-05 1.820E-05 1.91 0.50 0.20 2.58 -2.70 -0.59
7 2.050E-05 2.044E-05 2.092E-05 1.982E-05 2.027E-05 2.039E-05 1.96 0.56 0.25 2.59 -2.81 -0.58
8 2.252E-05 2.245E-05 2.297E-05 2.173E-05 2.225E-05 2.238E-05 2.00 0.61 0.29 2.61 -2.91 -0.60
9 2.437E-05 2.429E-05 2.485E-05 2.349E-05 2.406E-05 2.421E-05 2.05 0.67 0.32 2.64 -2.99 -0.63
10 2.608E-05 2.598E-05 2.659E-05 2.510E-05 2.571E-05 2.589E-05 2.10 0.72 0.36 2.68 -3.06 -0.70
11 2.765E-05 2.755E-05 2.819E-05 2.658E-05 2.724E-05 2.744E-05 2.15 0.77 0.38 2.72 -3.14 -0.73
12 2.912E-05 2.899E-05 2.968E-05 2.795E-05 2.865E-05 2.888E-05 2.20 0.83 0.40 2.77 -3.21 -0.79
13 3.047E-05 3.034E-05 3.106E-05 2.922E-05 2.995E-05 3.021E-05 2.25 0.87 0.43 2.82 -3.27 -0.85
14 3.171E-05 3.158E-05 3.234E-05 3.039E-05 3.116E-05 3.144E-05 2.30 0.88 0.45 2.87 -3.33 -0.88
15 3.287E-05 3.273E-05 3.353E-05 3.148E-05 3.227E-05 3.258E-05 2.34 0.91 0.48 2.93 -3.38 -0.94
20 3.750E-05 3.731E-05 3.831E-05 3.579E-05 3.666E-05 3.712E-05 2.54 1.03 0.54 3.22 -3.56 -1.23
25 4.061E-05 4.043E-05 4.162E-05 3.870E-05 3.958E-05 4.019E-05 2.75 1.04 0.60 3.57 -3.71 -1.51
30 4.265E-05 4.251E-05 4.390E-05 4.062E-05 4.145E-05 4.222E-05 2.96 1.00 0.67 3.97 -3.80 -1.83
35 4.385E-05 4.385E-05 4.545E-05 4.185E-05 4.260E-05 4.352E-05 3.16 0.76 0.77 4.43 -3.84 -2.12
40 4.444E-05 4.469E-05 4.649E-05 4.260E-05 4.324E-05 4.429E-05 3.38 0.33 0.90 4.95 -3.81 -2.37
34

Table 6. UGD. Assembly Average Isotopic Composition. 240Pu, atoms/barn*cm
UGD. Assembly Average Isotopic Composition. 240Pu, atoms/barn*cm Relative Deviation from Mean Value100%*(X-Mean)/Mean
BurnupMWd/kgHM
MCU TVS-M WIMS8A HELIOS MULTICELL
Mean R.M.S. %
MCU TVS-M WIMS8A HELIOS MULTICELL
0 0.000E+00 0.000E+00 0.000E+00 0.000E+00 0.000E+00 0.000E+00 0.00 0.00 0.00 0.00 0.00 0.00
1 6.285E-08 6.331E-08 6.491E-08 6.010E-08 5.980E-08 6.219E-08 3.52 1.06 1.80 4.36 -3.37 -3.85
2 2.505E-07 2.516E-07 2.592E-07 2.446E-07 2.444E-07 2.500E-07 2.43 0.18 0.61 3.65 -2.18 -2.25
3 5.302E-07 5.330E-07 5.481E-07 5.202E-07 5.216E-07 5.306E-07 2.11 -0.08 0.45 3.29 -1.97 -1.70
4 8.781E-07 8.835E-07 9.056E-07 8.615E-07 8.663E-07 8.790E-07 1.97 -0.10 0.51 3.03 -1.99 -1.44
5 1.277E-06 1.286E-06 1.313E-06 1.251E-06 1.261E-06 1.278E-06 1.90 -0.07 0.66 2.80 -2.10 -1.29
6 1.715E-06 1.728E-06 1.758E-06 1.675E-06 1.695E-06 1.714E-06 1.85 0.05 0.80 2.57 -2.29 -1.13
7 2.182E-06 2.201E-06 2.231E-06 2.125E-06 2.157E-06 2.179E-06 1.85 0.14 0.98 2.37 -2.47 -1.02
8 2.671E-06 2.697E-06 2.724E-06 2.595E-06 2.642E-06 2.666E-06 1.88 0.21 1.17 2.19 -2.67 -0.89
9 3.177E-06 3.212E-06 3.233E-06 3.078E-06 3.143E-06 3.168E-06 1.93 0.27 1.37 2.03 -2.86 -0.80
10 3.696E-06 3.741E-06 3.752E-06 3.570E-06 3.658E-06 3.683E-06 1.99 0.34 1.55 1.87 -3.07 -0.69
11 4.223E-06 4.280E-06 4.280E-06 4.070E-06 4.183E-06 4.207E-06 2.07 0.37 1.74 1.74 -3.27 -0.58
12 4.758E-06 4.829E-06 4.814E-06 4.574E-06 4.716E-06 4.738E-06 2.16 0.42 1.92 1.60 -3.48 -0.47
13 5.298E-06 5.384E-06 5.352E-06 5.080E-06 5.254E-06 5.274E-06 2.26 0.47 2.10 1.48 -3.68 -0.37
14 5.843E-06 5.944E-06 5.892E-06 5.587E-06 5.796E-06 5.813E-06 2.37 0.53 2.27 1.36 -3.88 -0.28
15 6.393E-06 6.508E-06 6.432E-06 6.094E-06 6.340E-06 6.353E-06 2.48 0.62 2.43 1.24 -4.08 -0.21
20 9.109E-06 9.293E-06 9.109E-06 8.578E-06 9.031E-06 9.024E-06 2.96 0.95 2.98 0.94 -4.94 0.08
25 1.173E-05 1.200E-05 1.166E-05 1.093E-05 1.163E-05 1.159E-05 3.43 1.19 3.55 0.60 -5.70 0.35
30 1.416E-05 1.455E-05 1.402E-05 1.309E-05 1.405E-05 1.398E-05 3.85 1.34 4.13 0.34 -6.32 0.52
35 1.642E-05 1.690E-05 1.617E-05 1.504E-05 1.626E-05 1.616E-05 4.24 1.61 4.60 0.08 -6.91 0.62
40 1.828E-05 1.902E-05 1.809E-05 1.676E-05 1.823E-05 1.808E-05 4.52 1.14 5.20 0.07 -7.26 0.85
35

Table 7. UGD. Assembly Average Isotopic Composition. 241Pu, atoms/barn*cm
UGD. Assembly Average Isotopic Composition. 241Pu, atoms/barn*cm Relative Deviation from Mean Value100%*(X-Mean)/Mean
BurnupMWd/kgHM
MCU TVS-M WIMS8A HELIOS MULTICELL
Mean R.M.S. %
MCU TVS-M WIMS8A HELIOS MULTICELL
0 0.000E+00 0.000E+00 0.000E+00 0.000E+00 0.000E+00 0.000E+00 0.00 0.00 0.00 0.00 0.00 0.00
1 3.013E-09 2.940E-09 3.268E-09 2.991E-09 2.873E-09 3.017E-09 4.98 -0.13 -2.54 8.31 -0.86 -4.77
2 2.448E-08 2.371E-08 2.661E-08 2.517E-08 2.421E-08 2.484E-08 4.52 -1.43 -4.53 7.15 1.33 -2.52
3 7.743E-08 7.458E-08 8.378E-08 8.014E-08 7.717E-08 7.862E-08 4.44 -1.52 -5.14 6.57 1.93 -1.84
4 1.675E-07 1.611E-07 1.809E-07 1.741E-07 1.676E-07 1.702E-07 4.41 -1.60 -5.36 6.25 2.26 -1.55
5 2.962E-07 2.844E-07 3.189E-07 3.082E-07 2.964E-07 3.008E-07 4.38 -1.53 -5.48 6.02 2.46 -1.47
6 4.598E-07 4.426E-07 4.959E-07 4.807E-07 4.617E-07 4.681E-07 4.39 -1.78 -5.45 5.92 2.69 -1.38
7 6.573E-07 6.327E-07 7.081E-07 6.881E-07 6.599E-07 6.692E-07 4.37 -1.79 -5.45 5.81 2.82 -1.39
8 8.842E-07 8.511E-07 9.517E-07 9.264E-07 8.870E-07 9.001E-07 4.37 -1.76 -5.44 5.74 2.92 -1.46
9 1.137E-06 1.095E-06 1.223E-06 1.192E-06 1.139E-06 1.157E-06 4.38 -1.77 -5.41 5.71 3.03 -1.56
10 1.412E-06 1.360E-06 1.519E-06 1.482E-06 1.414E-06 1.437E-06 4.37 -1.75 -5.39 5.68 3.08 -1.63
11 1.709E-06 1.645E-06 1.836E-06 1.792E-06 1.707E-06 1.738E-06 4.37 -1.67 -5.36 5.66 3.13 -1.77
12 2.021E-06 1.946E-06 2.171E-06 2.120E-06 2.017E-06 2.055E-06 4.37 -1.64 -5.32 5.65 3.16 -1.86
13 2.349E-06 2.261E-06 2.521E-06 2.463E-06 2.341E-06 2.387E-06 4.36 -1.59 -5.29 5.63 3.17 -1.92
14 2.689E-06 2.587E-06 2.884E-06 2.816E-06 2.675E-06 2.730E-06 4.34 -1.52 -5.25 5.62 3.16 -2.02
15 3.035E-06 2.922E-06 3.255E-06 3.179E-06 3.017E-06 3.081E-06 4.34 -1.52 -5.19 5.64 3.15 -2.09
20 4.841E-06 4.679E-06 5.175E-06 5.055E-06 4.808E-06 4.912E-06 4.07 -1.45 -4.73 5.37 2.92 -2.11
25 6.618E-06 6.403E-06 7.070E-06 6.876E-06 6.554E-06 6.704E-06 3.98 -1.28 -4.50 5.46 2.56 -2.24
30 8.261E-06 7.991E-06 8.821E-06 8.528E-06 8.151E-06 8.350E-06 3.93 -1.07 -4.30 5.64 2.12 -2.39
35 9.661E-06 9.399E-06 1.037E-05 9.961E-06 9.552E-06 9.789E-06 3.94 -1.31 -3.99 5.97 1.76 -2.42
40 1.097E-05 1.061E-05 1.171E-05 1.117E-05 1.074E-05 1.104E-05 3.91 -0.66 -3.88 6.09 1.15 -2.70
36

Table 8. UGD. Assembly Average Isotopic Composition. 242Pu, atoms/barn*cm
UGD. Assembly Average Isotopic Composition. 242Pu, atoms/barn*cm Relative Deviation from Mean Value100%*(X-Mean)/Mean
BurnupMWd/kgHM
MCU TVS-M WIMS8A HELIOS MULTICELL
Mean R.M.S. %
MCU TVS-M WIMS8A HELIOS MULTICELL
0 0.000E+00 0.000E+00 0.000E+00 0.000E+00 0.000E+00 0.000E+00 0.00 0.00 0.00 0.00 0.00 0.00
1 1.959E-11 1.904E-11 1.902E-11 1.723E-11 1.644E-11 1.826E-11 7.40 7.26 4.24 4.14 -5.66 -9.98
2 3.268E-10 3.162E-10 3.201E-10 3.025E-10 2.891E-10 3.109E-10 4.86 5.11 1.68 2.94 -2.71 -7.02
3 1.579E-09 1.524E-09 1.545E-09 1.482E-09 1.417E-09 1.509E-09 4.15 4.63 0.95 2.37 -1.82 -6.13
4 4.649E-09 4.472E-09 4.532E-09 4.381E-09 4.189E-09 4.445E-09 3.89 4.60 0.63 1.96 -1.43 -5.75
5 1.047E-08 1.004E-08 1.016E-08 9.876E-09 9.434E-09 9.997E-09 3.82 4.70 0.48 1.66 -1.21 -5.63
6 1.989E-08 1.909E-08 1.928E-08 1.881E-08 1.795E-08 1.900E-08 3.74 4.68 0.45 1.45 -1.03 -5.55
7 3.371E-08 3.238E-08 3.264E-08 3.194E-08 3.044E-08 3.222E-08 3.69 4.60 0.49 1.31 -0.87 -5.53
8 5.263E-08 5.059E-08 5.092E-08 4.993E-08 4.752E-08 5.032E-08 3.68 4.59 0.53 1.20 -0.76 -5.56
9 7.726E-08 7.431E-08 7.469E-08 7.337E-08 6.973E-08 7.387E-08 3.69 4.59 0.59 1.10 -0.68 -5.61
10 1.082E-07 1.041E-07 1.044E-07 1.027E-07 9.752E-08 1.034E-07 3.72 4.62 0.65 1.02 -0.63 -5.68
11 1.458E-07 1.403E-07 1.406E-07 1.385E-07 1.313E-07 1.393E-07 3.75 4.65 0.73 0.96 -0.60 -5.74
12 1.905E-07 1.834E-07 1.836E-07 1.809E-07 1.713E-07 1.819E-07 3.81 4.71 0.82 0.90 -0.59 -5.85
13 2.426E-07 2.337E-07 2.336E-07 2.303E-07 2.179E-07 2.316E-07 3.86 4.74 0.91 0.85 -0.59 -5.92
14 3.026E-07 2.915E-07 2.909E-07 2.868E-07 2.712E-07 2.886E-07 3.93 4.85 1.00 0.79 -0.61 -6.03
15 3.707E-07 3.568E-07 3.556E-07 3.507E-07 3.314E-07 3.530E-07 4.02 5.00 1.07 0.72 -0.67 -6.13
20 8.307E-07 8.015E-07 7.919E-07 7.809E-07 7.383E-07 7.887E-07 4.27 5.33 1.62 0.42 -0.98 -6.39
25 1.489E-06 1.441E-06 1.413E-06 1.391E-06 1.316E-06 1.410E-06 4.54 5.58 2.24 0.20 -1.35 -6.66
30 2.331E-06 2.262E-06 2.201E-06 2.160E-06 2.045E-06 2.200E-06 4.90 5.96 2.82 0.06 -1.81 -7.03
35 3.334E-06 3.239E-06 3.132E-06 3.061E-06 2.896E-06 3.132E-06 5.37 6.45 3.41 -0.01 -2.29 -7.55
40 4.459E-06 4.347E-06 4.178E-06 4.063E-06 3.839E-06 4.177E-06 5.81 6.74 4.06 0.03 -2.73 -8.09
37
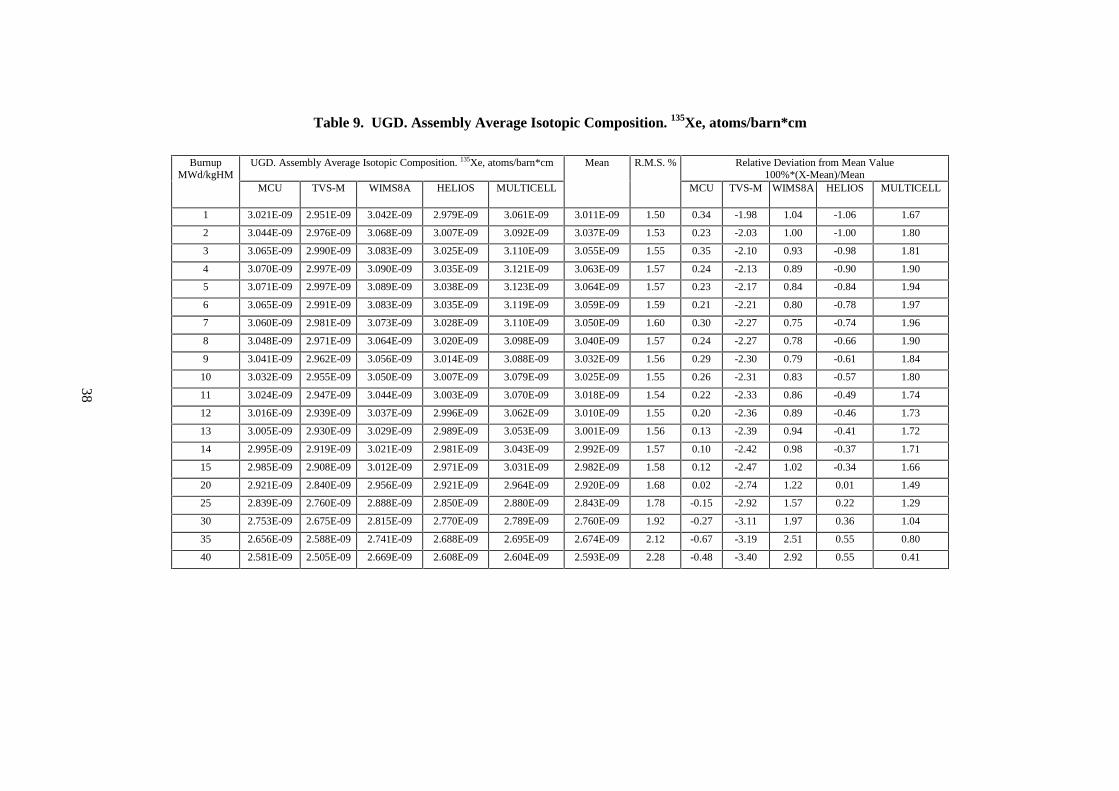
Table 9. UGD. Assembly Average Isotopic Composition. 135Xe, atoms/barn*cm
UGD. Assembly Average Isotopic Composition. 135Xe, atoms/barn*cm Relative Deviation from Mean Value100%*(X-Mean)/Mean
BurnupMWd/kgHM
MCU TVS-M WIMS8A HELIOS MULTICELL
Mean R.M.S. %
MCU TVS-M WIMS8A HELIOS MULTICELL
1 3.021E-09 2.951E-09 3.042E-09 2.979E-09 3.061E-09 3.011E-09 1.50 0.34 -1.98 1.04 -1.06 1.67
2 3.044E-09 2.976E-09 3.068E-09 3.007E-09 3.092E-09 3.037E-09 1.53 0.23 -2.03 1.00 -1.00 1.80
3 3.065E-09 2.990E-09 3.083E-09 3.025E-09 3.110E-09 3.055E-09 1.55 0.35 -2.10 0.93 -0.98 1.81
4 3.070E-09 2.997E-09 3.090E-09 3.035E-09 3.121E-09 3.063E-09 1.57 0.24 -2.13 0.89 -0.90 1.90
5 3.071E-09 2.997E-09 3.089E-09 3.038E-09 3.123E-09 3.064E-09 1.57 0.23 -2.17 0.84 -0.84 1.94
6 3.065E-09 2.991E-09 3.083E-09 3.035E-09 3.119E-09 3.059E-09 1.59 0.21 -2.21 0.80 -0.78 1.97
7 3.060E-09 2.981E-09 3.073E-09 3.028E-09 3.110E-09 3.050E-09 1.60 0.30 -2.27 0.75 -0.74 1.96
8 3.048E-09 2.971E-09 3.064E-09 3.020E-09 3.098E-09 3.040E-09 1.57 0.24 -2.27 0.78 -0.66 1.90
9 3.041E-09 2.962E-09 3.056E-09 3.014E-09 3.088E-09 3.032E-09 1.56 0.29 -2.30 0.79 -0.61 1.84
10 3.032E-09 2.955E-09 3.050E-09 3.007E-09 3.079E-09 3.025E-09 1.55 0.26 -2.31 0.83 -0.57 1.80
11 3.024E-09 2.947E-09 3.044E-09 3.003E-09 3.070E-09 3.018E-09 1.54 0.22 -2.33 0.86 -0.49 1.74
12 3.016E-09 2.939E-09 3.037E-09 2.996E-09 3.062E-09 3.010E-09 1.55 0.20 -2.36 0.89 -0.46 1.73
13 3.005E-09 2.930E-09 3.029E-09 2.989E-09 3.053E-09 3.001E-09 1.56 0.13 -2.39 0.94 -0.41 1.72
14 2.995E-09 2.919E-09 3.021E-09 2.981E-09 3.043E-09 2.992E-09 1.57 0.10 -2.42 0.98 -0.37 1.71
15 2.985E-09 2.908E-09 3.012E-09 2.971E-09 3.031E-09 2.982E-09 1.58 0.12 -2.47 1.02 -0.34 1.66
20 2.921E-09 2.840E-09 2.956E-09 2.921E-09 2.964E-09 2.920E-09 1.68 0.02 -2.74 1.22 0.01 1.49
25 2.839E-09 2.760E-09 2.888E-09 2.850E-09 2.880E-09 2.843E-09 1.78 -0.15 -2.92 1.57 0.22 1.29
30 2.753E-09 2.675E-09 2.815E-09 2.770E-09 2.789E-09 2.760E-09 1.92 -0.27 -3.11 1.97 0.36 1.04
35 2.656E-09 2.588E-09 2.741E-09 2.688E-09 2.695E-09 2.674E-09 2.12 -0.67 -3.19 2.51 0.55 0.80
40 2.581E-09 2.505E-09 2.669E-09 2.608E-09 2.604E-09 2.593E-09 2.28 -0.48 -3.40 2.92 0.55 0.41
38
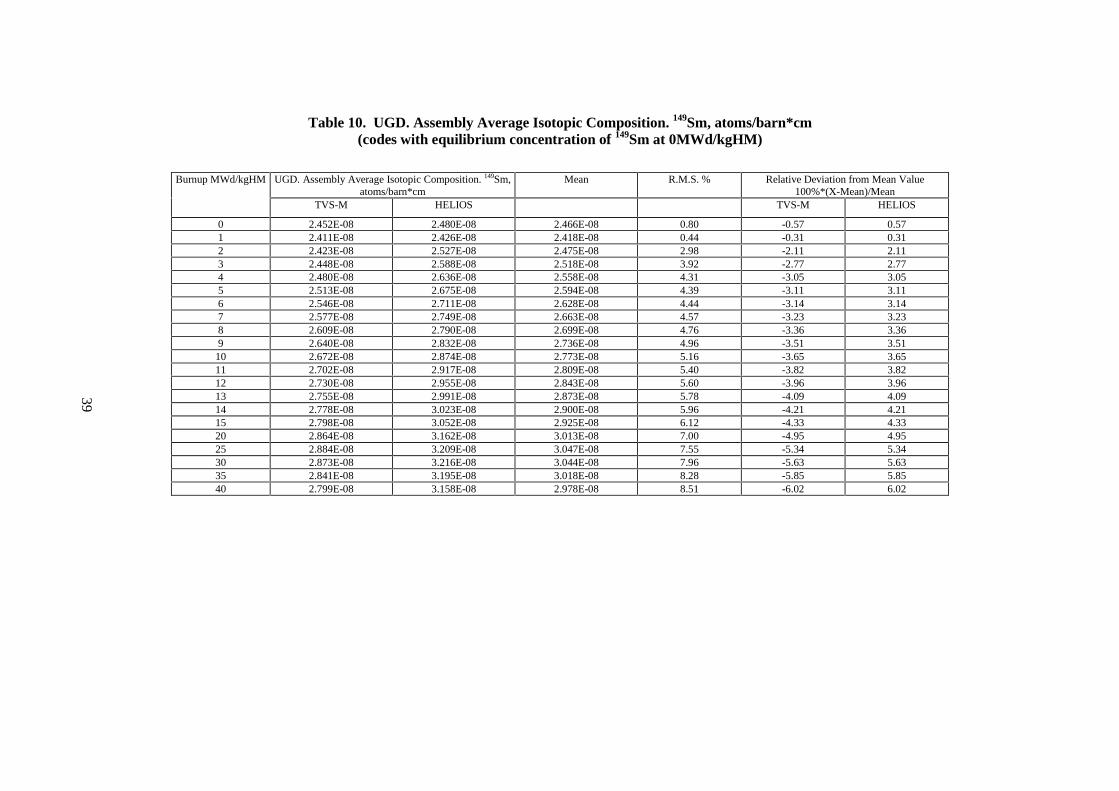
Table 10. UGD. Assembly Average Isotopic Composition. 149Sm, atoms/barn*cm(codes with equilibrium concentration of 149Sm at 0MWd/kgHM)
UGD. Assembly Average Isotopic Composition. 149Sm,atoms/barn*cm
Mean R.M.S. % Relative Deviation from Mean Value100%*(X-Mean)/Mean
Burnup MWd/kgHM
TVS-M HELIOS TVS-M HELIOS
0 2.452E-08 2.480E-08 2.466E-08 0.80 -0.57 0.571 2.411E-08 2.426E-08 2.418E-08 0.44 -0.31 0.312 2.423E-08 2.527E-08 2.475E-08 2.98 -2.11 2.113 2.448E-08 2.588E-08 2.518E-08 3.92 -2.77 2.774 2.480E-08 2.636E-08 2.558E-08 4.31 -3.05 3.055 2.513E-08 2.675E-08 2.594E-08 4.39 -3.11 3.116 2.546E-08 2.711E-08 2.628E-08 4.44 -3.14 3.147 2.577E-08 2.749E-08 2.663E-08 4.57 -3.23 3.238 2.609E-08 2.790E-08 2.699E-08 4.76 -3.36 3.369 2.640E-08 2.832E-08 2.736E-08 4.96 -3.51 3.51
10 2.672E-08 2.874E-08 2.773E-08 5.16 -3.65 3.6511 2.702E-08 2.917E-08 2.809E-08 5.40 -3.82 3.8212 2.730E-08 2.955E-08 2.843E-08 5.60 -3.96 3.9613 2.755E-08 2.991E-08 2.873E-08 5.78 -4.09 4.0914 2.778E-08 3.023E-08 2.900E-08 5.96 -4.21 4.2115 2.798E-08 3.052E-08 2.925E-08 6.12 -4.33 4.3320 2.864E-08 3.162E-08 3.013E-08 7.00 -4.95 4.9525 2.884E-08 3.209E-08 3.047E-08 7.55 -5.34 5.3430 2.873E-08 3.216E-08 3.044E-08 7.96 -5.63 5.6335 2.841E-08 3.195E-08 3.018E-08 8.28 -5.85 5.8540 2.799E-08 3.158E-08 2.978E-08 8.51 -6.02 6.02
39
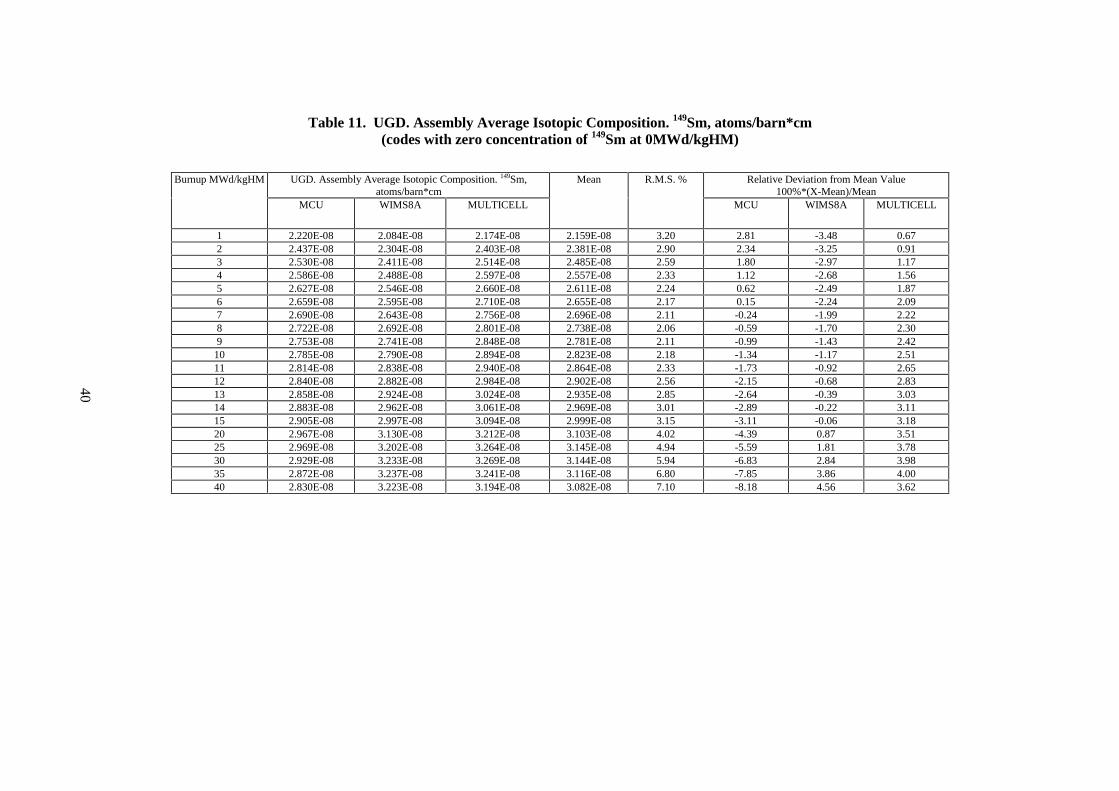
Table 11. UGD. Assembly Average Isotopic Composition. 149Sm, atoms/barn*cm(codes with zero concentration of 149Sm at 0MWd/kgHM)
UGD. Assembly Average Isotopic Composition. 149Sm,atoms/barn*cm
Relative Deviation from Mean Value100%*(X-Mean)/Mean
Burnup MWd/kgHM
MCU WIMS8A MULTICELL
Mean R.M.S. %
MCU WIMS8A MULTICELL
1 2.220E-08 2.084E-08 2.174E-08 2.159E-08 3.20 2.81 -3.48 0.672 2.437E-08 2.304E-08 2.403E-08 2.381E-08 2.90 2.34 -3.25 0.913 2.530E-08 2.411E-08 2.514E-08 2.485E-08 2.59 1.80 -2.97 1.174 2.586E-08 2.488E-08 2.597E-08 2.557E-08 2.33 1.12 -2.68 1.565 2.627E-08 2.546E-08 2.660E-08 2.611E-08 2.24 0.62 -2.49 1.876 2.659E-08 2.595E-08 2.710E-08 2.655E-08 2.17 0.15 -2.24 2.097 2.690E-08 2.643E-08 2.756E-08 2.696E-08 2.11 -0.24 -1.99 2.228 2.722E-08 2.692E-08 2.801E-08 2.738E-08 2.06 -0.59 -1.70 2.309 2.753E-08 2.741E-08 2.848E-08 2.781E-08 2.11 -0.99 -1.43 2.42
10 2.785E-08 2.790E-08 2.894E-08 2.823E-08 2.18 -1.34 -1.17 2.5111 2.814E-08 2.838E-08 2.940E-08 2.864E-08 2.33 -1.73 -0.92 2.6512 2.840E-08 2.882E-08 2.984E-08 2.902E-08 2.56 -2.15 -0.68 2.8313 2.858E-08 2.924E-08 3.024E-08 2.935E-08 2.85 -2.64 -0.39 3.0314 2.883E-08 2.962E-08 3.061E-08 2.969E-08 3.01 -2.89 -0.22 3.1115 2.905E-08 2.997E-08 3.094E-08 2.999E-08 3.15 -3.11 -0.06 3.1820 2.967E-08 3.130E-08 3.212E-08 3.103E-08 4.02 -4.39 0.87 3.5125 2.969E-08 3.202E-08 3.264E-08 3.145E-08 4.94 -5.59 1.81 3.7830 2.929E-08 3.233E-08 3.269E-08 3.144E-08 5.94 -6.83 2.84 3.9835 2.872E-08 3.237E-08 3.241E-08 3.116E-08 6.80 -7.85 3.86 4.0040 2.830E-08 3.223E-08 3.194E-08 3.082E-08 7.10 -8.18 4.56 3.62
40
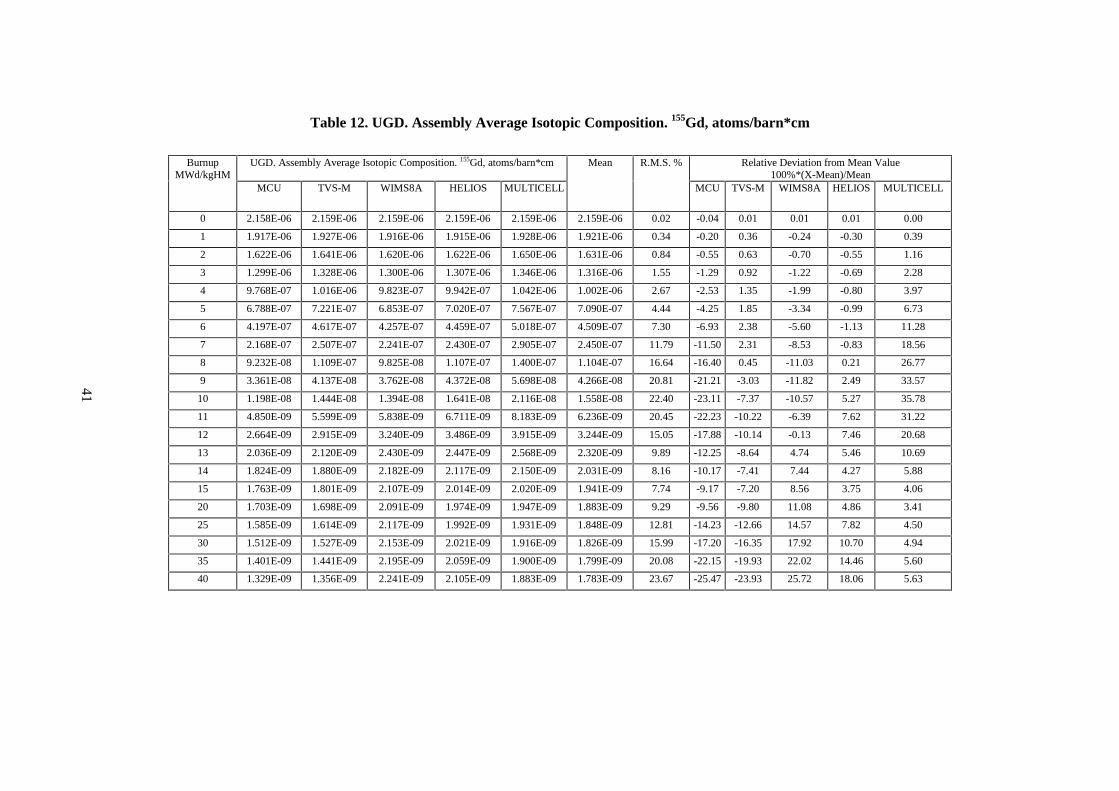
Table 12. UGD. Assembly Average Isotopic Composition. 155Gd, atoms/barn*cm
UGD. Assembly Average Isotopic Composition. 155Gd, atoms/barn*cm Relative Deviation from Mean Value100%*(X-Mean)/Mean
BurnupMWd/kgHM
MCU TVS-M WIMS8A HELIOS MULTICELL
Mean R.M.S. %
MCU TVS-M WIMS8A HELIOS MULTICELL
0 2.158E-06 2.159E-06 2.159E-06 2.159E-06 2.159E-06 2.159E-06 0.02 -0.04 0.01 0.01 0.01 0.00
1 1.917E-06 1.927E-06 1.916E-06 1.915E-06 1.928E-06 1.921E-06 0.34 -0.20 0.36 -0.24 -0.30 0.39
2 1.622E-06 1.641E-06 1.620E-06 1.622E-06 1.650E-06 1.631E-06 0.84 -0.55 0.63 -0.70 -0.55 1.16
3 1.299E-06 1.328E-06 1.300E-06 1.307E-06 1.346E-06 1.316E-06 1.55 -1.29 0.92 -1.22 -0.69 2.28
4 9.768E-07 1.016E-06 9.823E-07 9.942E-07 1.042E-06 1.002E-06 2.67 -2.53 1.35 -1.99 -0.80 3.97
5 6.788E-07 7.221E-07 6.853E-07 7.020E-07 7.567E-07 7.090E-07 4.44 -4.25 1.85 -3.34 -0.99 6.73
6 4.197E-07 4.617E-07 4.257E-07 4.459E-07 5.018E-07 4.509E-07 7.30 -6.93 2.38 -5.60 -1.13 11.28
7 2.168E-07 2.507E-07 2.241E-07 2.430E-07 2.905E-07 2.450E-07 11.79 -11.50 2.31 -8.53 -0.83 18.56
8 9.232E-08 1.109E-07 9.825E-08 1.107E-07 1.400E-07 1.104E-07 16.64 -16.40 0.45 -11.03 0.21 26.77
9 3.361E-08 4.137E-08 3.762E-08 4.372E-08 5.698E-08 4.266E-08 20.81 -21.21 -3.03 -11.82 2.49 33.57
10 1.198E-08 1.444E-08 1.394E-08 1.641E-08 2.116E-08 1.558E-08 22.40 -23.11 -7.37 -10.57 5.27 35.78
11 4.850E-09 5.599E-09 5.838E-09 6.711E-09 8.183E-09 6.236E-09 20.45 -22.23 -10.22 -6.39 7.62 31.22
12 2.664E-09 2.915E-09 3.240E-09 3.486E-09 3.915E-09 3.244E-09 15.05 -17.88 -10.14 -0.13 7.46 20.68
13 2.036E-09 2.120E-09 2.430E-09 2.447E-09 2.568E-09 2.320E-09 9.89 -12.25 -8.64 4.74 5.46 10.69
14 1.824E-09 1.880E-09 2.182E-09 2.117E-09 2.150E-09 2.031E-09 8.16 -10.17 -7.41 7.44 4.27 5.88
15 1.763E-09 1.801E-09 2.107E-09 2.014E-09 2.020E-09 1.941E-09 7.74 -9.17 -7.20 8.56 3.75 4.06
20 1.703E-09 1.698E-09 2.091E-09 1.974E-09 1.947E-09 1.883E-09 9.29 -9.56 -9.80 11.08 4.86 3.41
25 1.585E-09 1.614E-09 2.117E-09 1.992E-09 1.931E-09 1.848E-09 12.81 -14.23 -12.66 14.57 7.82 4.50
30 1.512E-09 1.527E-09 2.153E-09 2.021E-09 1.916E-09 1.826E-09 15.99 -17.20 -16.35 17.92 10.70 4.94
35 1.401E-09 1.441E-09 2.195E-09 2.059E-09 1.900E-09 1.799E-09 20.08 -22.15 -19.93 22.02 14.46 5.60
40 1.329E-09 1.356E-09 2.241E-09 2.105E-09 1.883E-09 1.783E-09 23.67 -25.47 -23.93 25.72 18.06 5.63
41

Table 13. UGD. Assembly Average Isotopic Composition. 157Gd, atoms/barn*cm
UGD. Assembly Average Isotopic Composition. 157Gd, atoms/barn*cm Relative Deviation from Mean Value100%*(X-Mean)/Mean
BurnupMWd/kgHM
MCU TVS-M WIMS8A HELIOS MULTICELL
Mean R.M.S. %
MCU TVS-M WIMS8A HELIOS MULTICELL
0 2.267E-06 2.269E-06 2.269E-06 2.269E-06 2.269E-06 2.268E-06 0.03 -0.04 0.01 0.01 0.00 0.03
1 1.566E-06 1.592E-06 1.578E-06 1.583E-06 1.605E-06 1.585E-06 0.92 -1.17 0.44 -0.42 -0.13 1.28
2 1.031E-06 1.062E-06 1.037E-06 1.052E-06 1.092E-06 1.055E-06 2.29 -2.29 0.70 -1.64 -0.30 3.54
3 6.251E-07 6.599E-07 6.279E-07 6.473E-07 6.961E-07 6.513E-07 4.43 -4.02 1.32 -3.59 -0.60 6.88
4 3.313E-07 3.639E-07 3.323E-07 3.528E-07 4.004E-07 3.561E-07 7.96 -6.97 2.18 -6.71 -0.93 12.43
5 1.399E-07 1.630E-07 1.396E-07 1.566E-07 1.940E-07 1.586E-07 14.05 -11.82 2.78 -11.98 -1.27 22.30
6 3.894E-08 4.957E-08 3.943E-08 4.862E-08 6.942E-08 4.920E-08 25.10 -20.85 0.77 -19.85 -1.18 41.11
7 6.878E-09 8.658E-09 7.602E-09 9.704E-09 1.552E-08 9.672E-09 35.56 -28.89 -10.49 -21.40 0.33 60.46
8 2.684E-09 2.498E-09 3.150E-09 3.149E-09 3.997E-09 3.096E-09 18.73 -13.30 -19.30 1.76 1.73 29.12
9 2.300E-09 1.989E-09 2.762E-09 2.569E-09 2.876E-09 2.499E-09 14.37 -7.96 -20.43 10.51 2.80 15.07
10 2.301E-09 1.873E-09 2.691E-09 2.478E-09 2.712E-09 2.411E-09 14.29 -4.56 -22.32 11.62 2.79 12.48
11 2.236E-09 1.836E-09 2.692E-09 2.471E-09 2.672E-09 2.381E-09 14.96 -6.09 -22.92 13.05 3.76 12.20
12 2.185E-09 1.827E-09 2.720E-09 2.483E-09 2.678E-09 2.378E-09 15.72 -8.14 -23.20 14.36 4.39 12.60
13 2.297E-09 1.826E-09 2.756E-09 2.508E-09 2.700E-09 2.417E-09 15.58 -4.98 -24.48 14.02 3.75 11.69
14 2.282E-09 1.827E-09 2.795E-09 2.538E-09 2.727E-09 2.434E-09 16.16 -6.23 -24.93 14.83 4.28 12.05
15 2.276E-09 1.828E-09 2.833E-09 2.569E-09 2.754E-09 2.452E-09 16.69 -7.16 -25.45 15.53 4.76 12.32
20 2.315E-09 1.821E-09 3.015E-09 2.706E-09 2.885E-09 2.548E-09 19.01 -9.16 -28.53 18.32 6.17 13.21
25 2.362E-09 1.802E-09 3.188E-09 2.855E-09 3.013E-09 2.644E-09 21.27 -10.65 -31.84 20.58 7.96 13.95
30 2.360E-09 1.774E-09 3.363E-09 3.010E-09 3.150E-09 2.731E-09 23.92 -13.60 -35.06 23.14 10.18 15.33
35 2.279E-09 1.741E-09 3.550E-09 3.179E-09 3.303E-09 2.810E-09 27.29 -18.90 -38.06 26.33 13.10 17.53
40 2.277E-09 1.706E-09 3.756E-09 3.367E-09 3.480E-09 2.917E-09 30.17 -21.95 -41.51 28.75 15.42 19.29
42
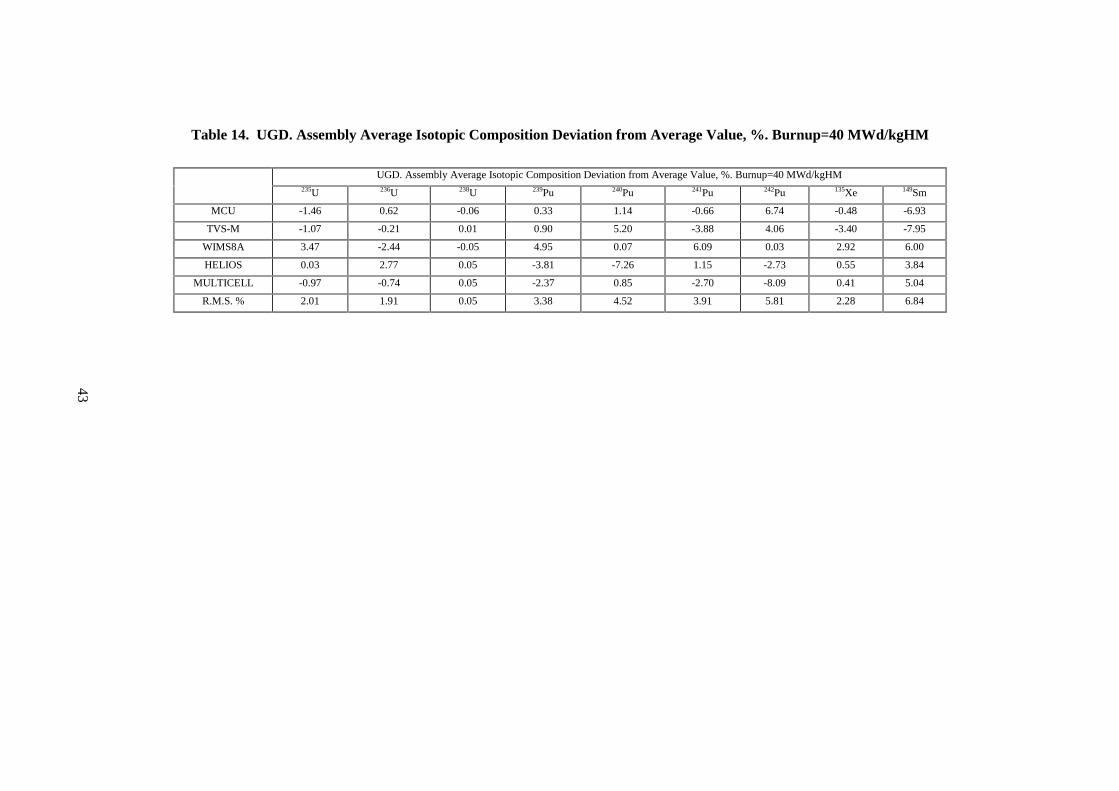
Table 14. UGD. Assembly Average Isotopic Composition Deviation from Average Value, %. Burnup=40 MWd/kgHM
UGD. Assembly Average Isotopic Composition Deviation from Average Value, %. Burnup=40 MWd/kgHM235U 236U 238U 239Pu 240Pu 241Pu 242Pu 135Xe 149Sm
MCU -1.46 0.62 -0.06 0.33 1.14 -0.66 6.74 -0.48 -6.93
TVS-M -1.07 -0.21 0.01 0.90 5.20 -3.88 4.06 -3.40 -7.95
WIMS8A 3.47 -2.44 -0.05 4.95 0.07 6.09 0.03 2.92 6.00
HELIOS 0.03 2.77 0.05 -3.81 -7.26 1.15 -2.73 0.55 3.84
MULTICELL -0.97 -0.74 0.05 -2.37 0.85 -2.70 -8.09 0.41 5.04
R.M.S. % 2.01 1.91 0.05 3.38 4.52 3.91 5.81 2.28 6.84
43

Table 15. UGD. Isotopic Composition in Cell 1. 235U, atoms/barn*cm
UGD. Isotopic Composition in Cell 1. 235U, atoms/barn*cm Relative Deviation from Mean Value100%*(X-Mean)/Mean
BurnupMWd/kgHM
MCU TVS-M WIMS8A HELIOS MULTICELL
Mean R.M.S. %
MCU TVS-M WIMS8A HELIOS MULTICELL
0 8.626E-04 8.626E-04 8.626E-04 8.626E-04 8.626E-04 8.626E-04 0.00 0.00 0.00 0.00 0.00 0.00
1 8.311E-04 8.315E-04 8.318E-04 8.311E-04 8.303E-04 8.312E-04 0.07 -0.01 0.04 0.08 -0.01 -0.10
2 8.008E-04 8.018E-04 8.026E-04 8.010E-04 7.997E-04 8.012E-04 0.13 -0.05 0.08 0.17 -0.02 -0.18
3 7.723E-04 7.735E-04 7.747E-04 7.724E-04 7.705E-04 7.727E-04 0.20 -0.05 0.10 0.26 -0.03 -0.28
4 7.451E-04 7.464E-04 7.481E-04 7.451E-04 7.428E-04 7.455E-04 0.26 -0.05 0.12 0.35 -0.05 -0.36
5 7.188E-04 7.204E-04 7.226E-04 7.190E-04 7.163E-04 7.194E-04 0.32 -0.09 0.14 0.44 -0.06 -0.44
6 6.938E-04 6.956E-04 6.983E-04 6.940E-04 6.910E-04 6.945E-04 0.38 -0.11 0.15 0.54 -0.07 -0.51
7 6.698E-04 6.717E-04 6.749E-04 6.701E-04 6.669E-04 6.707E-04 0.44 -0.13 0.16 0.63 -0.09 -0.56
8 6.468E-04 6.488E-04 6.525E-04 6.470E-04 6.437E-04 6.478E-04 0.50 -0.15 0.16 0.73 -0.12 -0.63
9 6.245E-04 6.267E-04 6.308E-04 6.248E-04 6.214E-04 6.256E-04 0.55 -0.18 0.17 0.83 -0.14 -0.68
10 6.026E-04 6.053E-04 6.099E-04 6.033E-04 5.999E-04 6.042E-04 0.62 -0.26 0.18 0.94 -0.15 -0.71
11 5.817E-04 5.845E-04 5.896E-04 5.824E-04 5.791E-04 5.835E-04 0.67 -0.30 0.18 1.05 -0.18 -0.75
12 5.613E-04 5.644E-04 5.699E-04 5.622E-04 5.588E-04 5.633E-04 0.74 -0.36 0.19 1.16 -0.20 -0.80
13 5.415E-04 5.448E-04 5.507E-04 5.425E-04 5.392E-04 5.437E-04 0.80 -0.41 0.19 1.28 -0.22 -0.83
14 5.225E-04 5.257E-04 5.321E-04 5.234E-04 5.201E-04 5.248E-04 0.87 -0.43 0.18 1.39 -0.25 -0.89
15 5.039E-04 5.072E-04 5.140E-04 5.049E-04 5.015E-04 5.063E-04 0.94 -0.47 0.18 1.52 -0.28 -0.95
20 4.186E-04 4.224E-04 4.310E-04 4.197E-04 4.162E-04 4.216E-04 1.36 -0.71 0.19 2.24 -0.44 -1.28
25 3.453E-04 3.490E-04 3.592E-04 3.462E-04 3.425E-04 3.484E-04 1.84 -0.90 0.15 3.08 -0.63 -1.70
30 2.824E-04 2.858E-04 2.972E-04 2.832E-04 2.791E-04 2.855E-04 2.43 -1.09 0.09 4.08 -0.83 -2.25
35 2.278E-04 2.319E-04 2.441E-04 2.294E-04 2.252E-04 2.317E-04 3.17 -1.68 0.09 5.36 -0.97 -2.80
40 1.816E-04 1.864E-04 1.990E-04 1.842E-04 1.797E-04 1.862E-04 4.08 -2.45 0.11 6.89 -1.07 -3.47
44
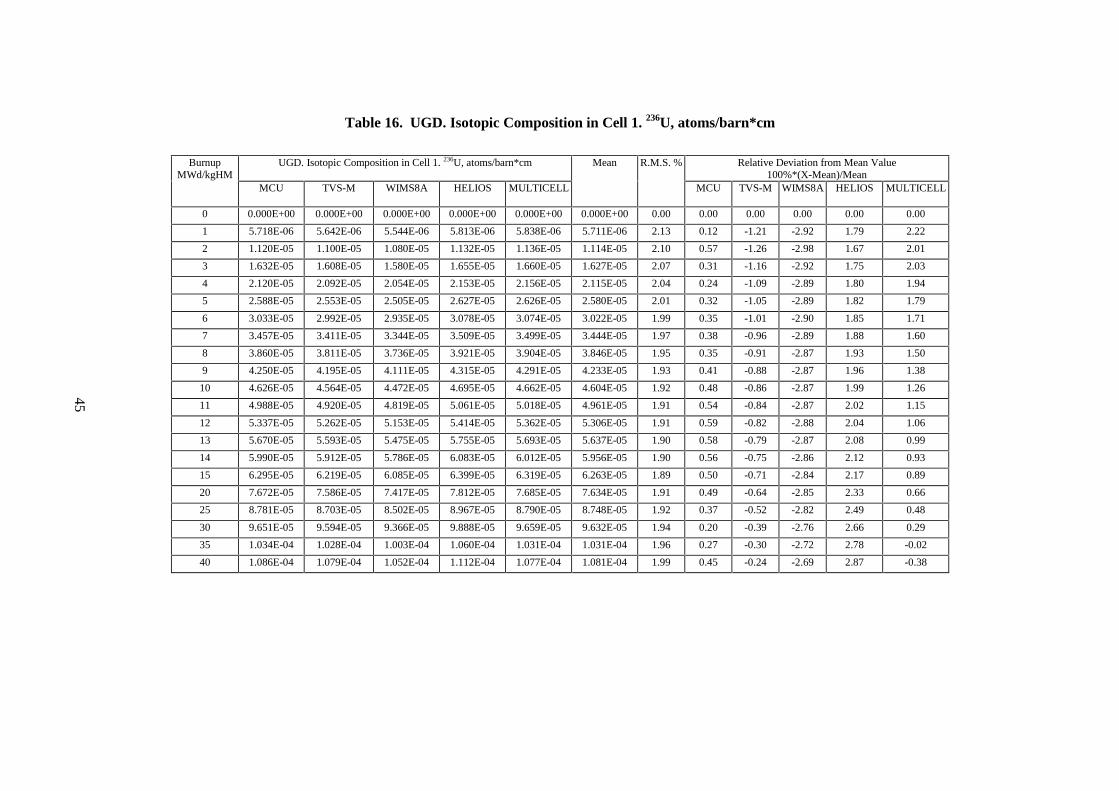
Table 16. UGD. Isotopic Composition in Cell 1. 236U, atoms/barn*cm
UGD. Isotopic Composition in Cell 1. 236U, atoms/barn*cm Relative Deviation from Mean Value100%*(X-Mean)/Mean
BurnupMWd/kgHM
MCU TVS-M WIMS8A HELIOS MULTICELL
Mean R.M.S. %
MCU TVS-M WIMS8A HELIOS MULTICELL
0 0.000E+00 0.000E+00 0.000E+00 0.000E+00 0.000E+00 0.000E+00 0.00 0.00 0.00 0.00 0.00 0.00
1 5.718E-06 5.642E-06 5.544E-06 5.813E-06 5.838E-06 5.711E-06 2.13 0.12 -1.21 -2.92 1.79 2.22
2 1.120E-05 1.100E-05 1.080E-05 1.132E-05 1.136E-05 1.114E-05 2.10 0.57 -1.26 -2.98 1.67 2.01
3 1.632E-05 1.608E-05 1.580E-05 1.655E-05 1.660E-05 1.627E-05 2.07 0.31 -1.16 -2.92 1.75 2.03
4 2.120E-05 2.092E-05 2.054E-05 2.153E-05 2.156E-05 2.115E-05 2.04 0.24 -1.09 -2.89 1.80 1.94
5 2.588E-05 2.553E-05 2.505E-05 2.627E-05 2.626E-05 2.580E-05 2.01 0.32 -1.05 -2.89 1.82 1.79
6 3.033E-05 2.992E-05 2.935E-05 3.078E-05 3.074E-05 3.022E-05 1.99 0.35 -1.01 -2.90 1.85 1.71
7 3.457E-05 3.411E-05 3.344E-05 3.509E-05 3.499E-05 3.444E-05 1.97 0.38 -0.96 -2.89 1.88 1.60
8 3.860E-05 3.811E-05 3.736E-05 3.921E-05 3.904E-05 3.846E-05 1.95 0.35 -0.91 -2.87 1.93 1.50
9 4.250E-05 4.195E-05 4.111E-05 4.315E-05 4.291E-05 4.233E-05 1.93 0.41 -0.88 -2.87 1.96 1.38
10 4.626E-05 4.564E-05 4.472E-05 4.695E-05 4.662E-05 4.604E-05 1.92 0.48 -0.86 -2.87 1.99 1.26
11 4.988E-05 4.920E-05 4.819E-05 5.061E-05 5.018E-05 4.961E-05 1.91 0.54 -0.84 -2.87 2.02 1.15
12 5.337E-05 5.262E-05 5.153E-05 5.414E-05 5.362E-05 5.306E-05 1.91 0.59 -0.82 -2.88 2.04 1.06
13 5.670E-05 5.593E-05 5.475E-05 5.755E-05 5.693E-05 5.637E-05 1.90 0.58 -0.79 -2.87 2.08 0.99
14 5.990E-05 5.912E-05 5.786E-05 6.083E-05 6.012E-05 5.956E-05 1.90 0.56 -0.75 -2.86 2.12 0.93
15 6.295E-05 6.219E-05 6.085E-05 6.399E-05 6.319E-05 6.263E-05 1.89 0.50 -0.71 -2.84 2.17 0.89
20 7.672E-05 7.586E-05 7.417E-05 7.812E-05 7.685E-05 7.634E-05 1.91 0.49 -0.64 -2.85 2.33 0.66
25 8.781E-05 8.703E-05 8.502E-05 8.967E-05 8.790E-05 8.748E-05 1.92 0.37 -0.52 -2.82 2.49 0.48
30 9.651E-05 9.594E-05 9.366E-05 9.888E-05 9.659E-05 9.632E-05 1.94 0.20 -0.39 -2.76 2.66 0.29
35 1.034E-04 1.028E-04 1.003E-04 1.060E-04 1.031E-04 1.031E-04 1.96 0.27 -0.30 -2.72 2.78 -0.02
40 1.086E-04 1.079E-04 1.052E-04 1.112E-04 1.077E-04 1.081E-04 1.99 0.45 -0.24 -2.69 2.87 -0.38
45
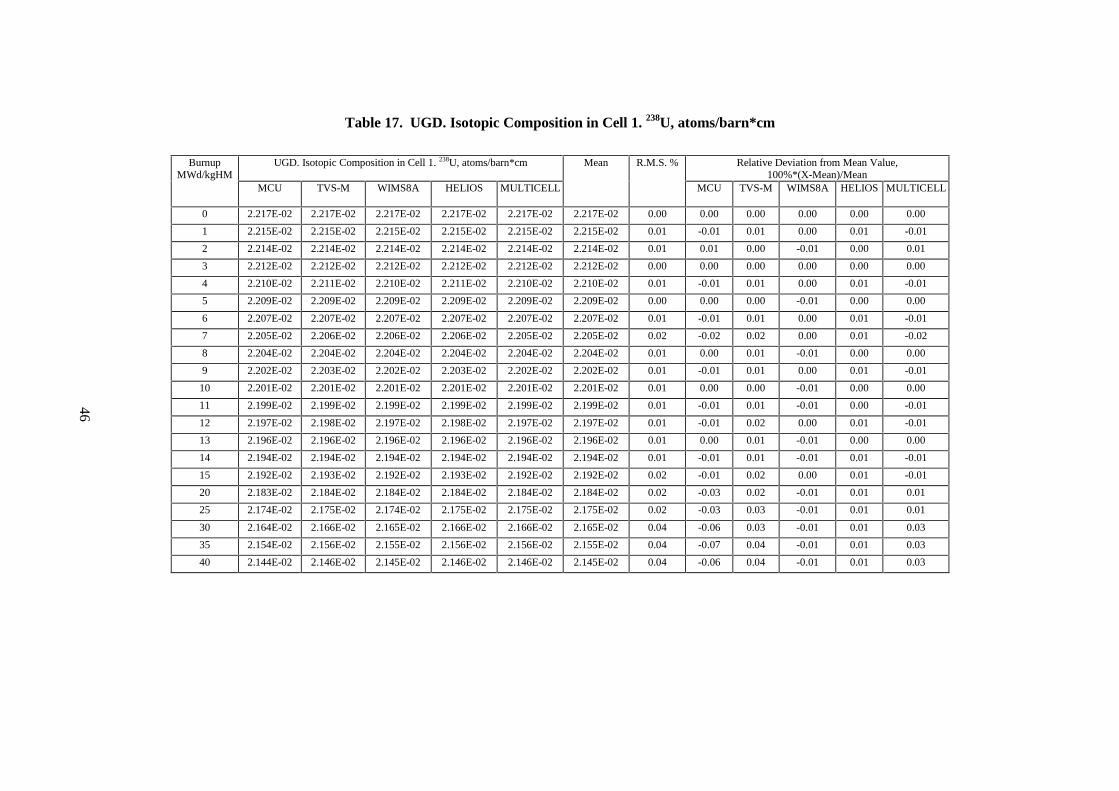
Table 17. UGD. Isotopic Composition in Cell 1. 238U, atoms/barn*cm
UGD. Isotopic Composition in Cell 1. 238U, atoms/barn*cm Relative Deviation from Mean Value,100%*(X-Mean)/Mean
BurnupMWd/kgHM
MCU TVS-M WIMS8A HELIOS MULTICELL
Mean R.M.S. %
MCU TVS-M WIMS8A HELIOS MULTICELL
0 2.217E-02 2.217E-02 2.217E-02 2.217E-02 2.217E-02 2.217E-02 0.00 0.00 0.00 0.00 0.00 0.00
1 2.215E-02 2.215E-02 2.215E-02 2.215E-02 2.215E-02 2.215E-02 0.01 -0.01 0.01 0.00 0.01 -0.01
2 2.214E-02 2.214E-02 2.214E-02 2.214E-02 2.214E-02 2.214E-02 0.01 0.01 0.00 -0.01 0.00 0.01
3 2.212E-02 2.212E-02 2.212E-02 2.212E-02 2.212E-02 2.212E-02 0.00 0.00 0.00 0.00 0.00 0.00
4 2.210E-02 2.211E-02 2.210E-02 2.211E-02 2.210E-02 2.210E-02 0.01 -0.01 0.01 0.00 0.01 -0.01
5 2.209E-02 2.209E-02 2.209E-02 2.209E-02 2.209E-02 2.209E-02 0.00 0.00 0.00 -0.01 0.00 0.00
6 2.207E-02 2.207E-02 2.207E-02 2.207E-02 2.207E-02 2.207E-02 0.01 -0.01 0.01 0.00 0.01 -0.01
7 2.205E-02 2.206E-02 2.206E-02 2.206E-02 2.205E-02 2.205E-02 0.02 -0.02 0.02 0.00 0.01 -0.02
8 2.204E-02 2.204E-02 2.204E-02 2.204E-02 2.204E-02 2.204E-02 0.01 0.00 0.01 -0.01 0.00 0.00
9 2.202E-02 2.203E-02 2.202E-02 2.203E-02 2.202E-02 2.202E-02 0.01 -0.01 0.01 0.00 0.01 -0.01
10 2.201E-02 2.201E-02 2.201E-02 2.201E-02 2.201E-02 2.201E-02 0.01 0.00 0.00 -0.01 0.00 0.00
11 2.199E-02 2.199E-02 2.199E-02 2.199E-02 2.199E-02 2.199E-02 0.01 -0.01 0.01 -0.01 0.00 -0.01
12 2.197E-02 2.198E-02 2.197E-02 2.198E-02 2.197E-02 2.197E-02 0.01 -0.01 0.02 0.00 0.01 -0.01
13 2.196E-02 2.196E-02 2.196E-02 2.196E-02 2.196E-02 2.196E-02 0.01 0.00 0.01 -0.01 0.00 0.00
14 2.194E-02 2.194E-02 2.194E-02 2.194E-02 2.194E-02 2.194E-02 0.01 -0.01 0.01 -0.01 0.01 -0.01
15 2.192E-02 2.193E-02 2.192E-02 2.193E-02 2.192E-02 2.192E-02 0.02 -0.01 0.02 0.00 0.01 -0.01
20 2.183E-02 2.184E-02 2.184E-02 2.184E-02 2.184E-02 2.184E-02 0.02 -0.03 0.02 -0.01 0.01 0.01
25 2.174E-02 2.175E-02 2.174E-02 2.175E-02 2.175E-02 2.175E-02 0.02 -0.03 0.03 -0.01 0.01 0.01
30 2.164E-02 2.166E-02 2.165E-02 2.166E-02 2.166E-02 2.165E-02 0.04 -0.06 0.03 -0.01 0.01 0.03
35 2.154E-02 2.156E-02 2.155E-02 2.156E-02 2.156E-02 2.155E-02 0.04 -0.07 0.04 -0.01 0.01 0.03
40 2.144E-02 2.146E-02 2.145E-02 2.146E-02 2.146E-02 2.145E-02 0.04 -0.06 0.04 -0.01 0.01 0.03
46

Table 18. UGD. Isotopic Composition in Cell 1. 239Pu, atoms/barn*cm
UGD. Isotopic Composition in Cell 1. 239Pu, atoms/barn*cm Relative Deviation from Mean Value100%*(X-Mean)/Mean
BurnupMWd/kgHM
MCU TVS-M WIMS8A HELIOS MULTICELL
Mean R.M.S. %
MCU TVS-M WIMS8A HELIOS MULTICELL
0 0.000E+00 0.000E+00 0.000E+00 0.000E+00 0.000E+00 0.000E+00 0.00 0.00 0.00 0.00 0.00 0.00
1 1.213E-05 1.175E-05 1.196E-05 1.193E-05 1.214E-05 1.198E-05 1.36 1.25 -1.95 -0.18 -0.46 1.34
2 2.467E-05 2.391E-05 2.438E-05 2.401E-05 2.463E-05 2.432E-05 1.43 1.44 -1.68 0.23 -1.27 1.28
3 3.569E-05 3.478E-05 3.544E-05 3.474E-05 3.568E-05 3.527E-05 1.35 1.20 -1.39 0.50 -1.49 1.18
4 4.587E-05 4.452E-05 4.535E-05 4.431E-05 4.550E-05 4.511E-05 1.48 1.68 -1.31 0.54 -1.78 0.86
5 5.485E-05 5.329E-05 5.427E-05 5.287E-05 5.425E-05 5.391E-05 1.49 1.75 -1.14 0.67 -1.92 0.64
6 6.274E-05 6.121E-05 6.231E-05 6.056E-05 6.207E-05 6.178E-05 1.42 1.55 -0.92 0.86 -1.97 0.47
7 7.006E-05 6.838E-05 6.959E-05 6.749E-05 6.908E-05 6.892E-05 1.47 1.65 -0.79 0.98 -2.08 0.23
8 7.678E-05 7.487E-05 7.621E-05 7.375E-05 7.538E-05 7.540E-05 1.56 1.83 -0.70 1.08 -2.19 -0.02
9 8.288E-05 8.080E-05 8.226E-05 7.943E-05 8.107E-05 8.129E-05 1.65 1.96 -0.60 1.19 -2.28 -0.27
10 8.833E-05 8.622E-05 8.781E-05 8.461E-05 8.624E-05 8.664E-05 1.70 1.95 -0.49 1.35 -2.34 -0.46
11 9.346E-05 9.120E-05 9.292E-05 8.936E-05 9.095E-05 9.158E-05 1.80 2.05 -0.41 1.47 -2.43 -0.69
12 9.804E-05 9.579E-05 9.765E-05 9.371E-05 9.527E-05 9.609E-05 1.85 2.03 -0.31 1.62 -2.48 -0.85
13 1.024E-04 1.000E-04 1.020E-04 9.770E-05 9.922E-05 1.003E-04 1.95 2.12 -0.25 1.74 -2.56 -1.05
14 1.063E-04 1.039E-04 1.060E-04 1.014E-04 1.028E-04 1.041E-04 2.03 2.13 -0.16 1.88 -2.61 -1.24
15 1.101E-04 1.075E-04 1.098E-04 1.047E-04 1.062E-04 1.077E-04 2.14 2.26 -0.15 1.97 -2.72 -1.36
20 1.252E-04 1.215E-04 1.245E-04 1.178E-04 1.189E-04 1.216E-04 2.70 2.96 -0.05 2.42 -3.10 -2.22
25 1.343E-04 1.308E-04 1.345E-04 1.263E-04 1.269E-04 1.306E-04 3.01 2.86 0.19 3.04 -3.28 -2.81
30 1.388E-04 1.368E-04 1.412E-04 1.316E-04 1.318E-04 1.361E-04 3.14 2.02 0.56 3.82 -3.27 -3.13
35 1.412E-04 1.406E-04 1.457E-04 1.348E-04 1.345E-04 1.394E-04 3.39 1.32 0.89 4.54 -3.25 -3.49
40 1.429E-04 1.429E-04 1.486E-04 1.367E-04 1.358E-04 1.414E-04 3.70 1.08 1.06 5.11 -3.30 -3.95
47
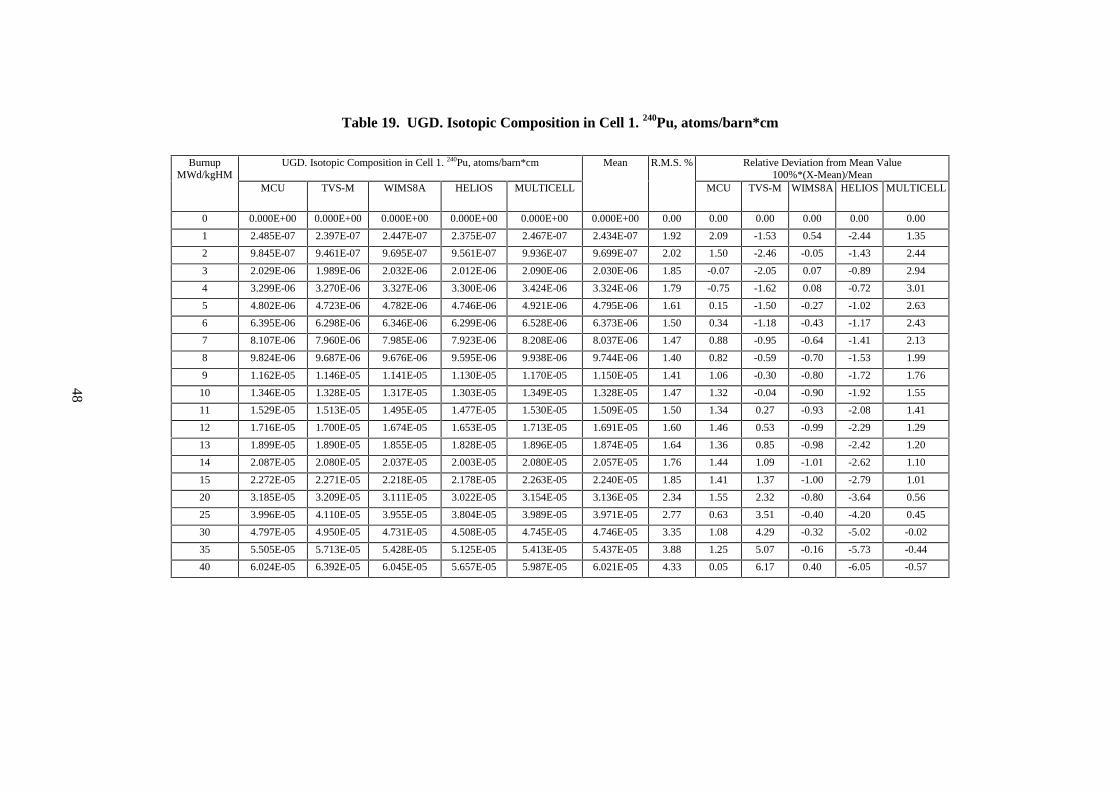
Table 19. UGD. Isotopic Composition in Cell 1. 240Pu, atoms/barn*cm
UGD. Isotopic Composition in Cell 1. 240Pu, atoms/barn*cm Relative Deviation from Mean Value100%*(X-Mean)/Mean
BurnupMWd/kgHM
MCU TVS-M WIMS8A HELIOS MULTICELL
Mean R.M.S. %
MCU TVS-M WIMS8A HELIOS MULTICELL
0 0.000E+00 0.000E+00 0.000E+00 0.000E+00 0.000E+00 0.000E+00 0.00 0.00 0.00 0.00 0.00 0.00
1 2.485E-07 2.397E-07 2.447E-07 2.375E-07 2.467E-07 2.434E-07 1.92 2.09 -1.53 0.54 -2.44 1.35
2 9.845E-07 9.461E-07 9.695E-07 9.561E-07 9.936E-07 9.699E-07 2.02 1.50 -2.46 -0.05 -1.43 2.44
3 2.029E-06 1.989E-06 2.032E-06 2.012E-06 2.090E-06 2.030E-06 1.85 -0.07 -2.05 0.07 -0.89 2.94
4 3.299E-06 3.270E-06 3.327E-06 3.300E-06 3.424E-06 3.324E-06 1.79 -0.75 -1.62 0.08 -0.72 3.01
5 4.802E-06 4.723E-06 4.782E-06 4.746E-06 4.921E-06 4.795E-06 1.61 0.15 -1.50 -0.27 -1.02 2.63
6 6.395E-06 6.298E-06 6.346E-06 6.299E-06 6.528E-06 6.373E-06 1.50 0.34 -1.18 -0.43 -1.17 2.43
7 8.107E-06 7.960E-06 7.985E-06 7.923E-06 8.208E-06 8.037E-06 1.47 0.88 -0.95 -0.64 -1.41 2.13
8 9.824E-06 9.687E-06 9.676E-06 9.595E-06 9.938E-06 9.744E-06 1.40 0.82 -0.59 -0.70 -1.53 1.99
9 1.162E-05 1.146E-05 1.141E-05 1.130E-05 1.170E-05 1.150E-05 1.41 1.06 -0.30 -0.80 -1.72 1.76
10 1.346E-05 1.328E-05 1.317E-05 1.303E-05 1.349E-05 1.328E-05 1.47 1.32 -0.04 -0.90 -1.92 1.55
11 1.529E-05 1.513E-05 1.495E-05 1.477E-05 1.530E-05 1.509E-05 1.50 1.34 0.27 -0.93 -2.08 1.41
12 1.716E-05 1.700E-05 1.674E-05 1.653E-05 1.713E-05 1.691E-05 1.60 1.46 0.53 -0.99 -2.29 1.29
13 1.899E-05 1.890E-05 1.855E-05 1.828E-05 1.896E-05 1.874E-05 1.64 1.36 0.85 -0.98 -2.42 1.20
14 2.087E-05 2.080E-05 2.037E-05 2.003E-05 2.080E-05 2.057E-05 1.76 1.44 1.09 -1.01 -2.62 1.10
15 2.272E-05 2.271E-05 2.218E-05 2.178E-05 2.263E-05 2.240E-05 1.85 1.41 1.37 -1.00 -2.79 1.01
20 3.185E-05 3.209E-05 3.111E-05 3.022E-05 3.154E-05 3.136E-05 2.34 1.55 2.32 -0.80 -3.64 0.56
25 3.996E-05 4.110E-05 3.955E-05 3.804E-05 3.989E-05 3.971E-05 2.77 0.63 3.51 -0.40 -4.20 0.45
30 4.797E-05 4.950E-05 4.731E-05 4.508E-05 4.745E-05 4.746E-05 3.35 1.08 4.29 -0.32 -5.02 -0.02
35 5.505E-05 5.713E-05 5.428E-05 5.125E-05 5.413E-05 5.437E-05 3.88 1.25 5.07 -0.16 -5.73 -0.44
40 6.024E-05 6.392E-05 6.045E-05 5.657E-05 5.987E-05 6.021E-05 4.33 0.05 6.17 0.40 -6.05 -0.57
48
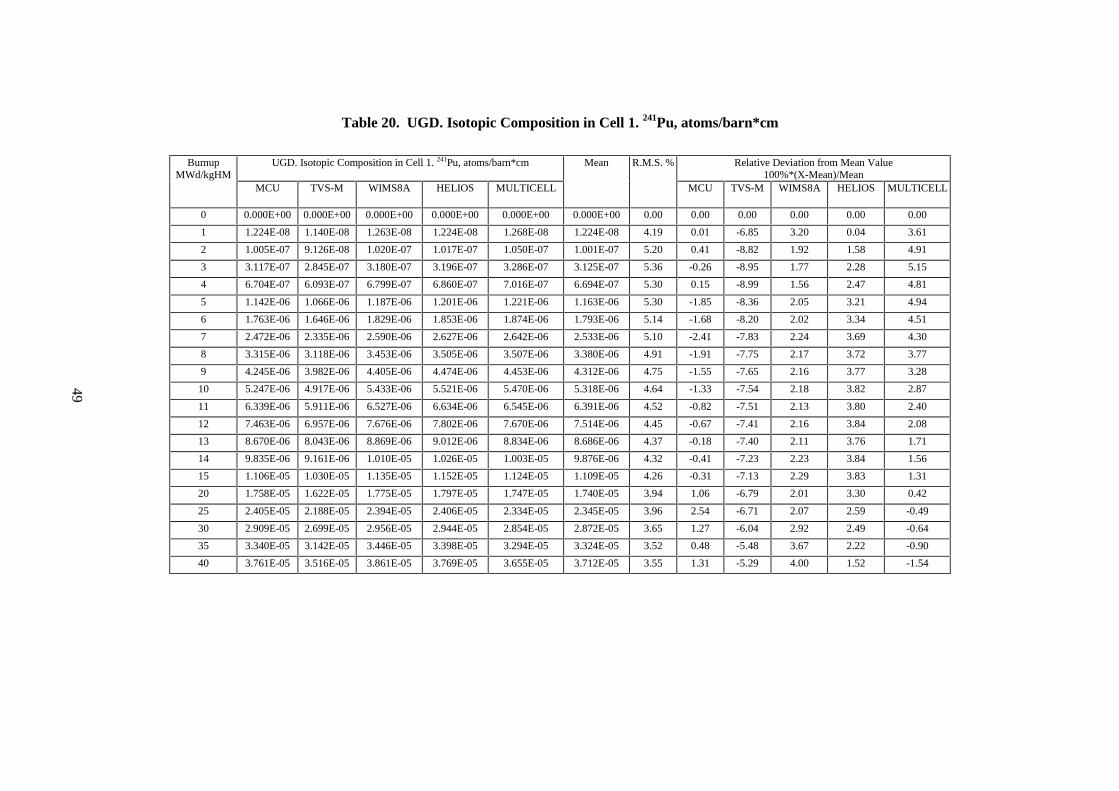
Table 20. UGD. Isotopic Composition in Cell 1. 241Pu, atoms/barn*cm
UGD. Isotopic Composition in Cell 1. 241Pu, atoms/barn*cm Relative Deviation from Mean Value100%*(X-Mean)/Mean
BurnupMWd/kgHM
MCU TVS-M WIMS8A HELIOS MULTICELL
Mean R.M.S. %
MCU TVS-M WIMS8A HELIOS MULTICELL
0 0.000E+00 0.000E+00 0.000E+00 0.000E+00 0.000E+00 0.000E+00 0.00 0.00 0.00 0.00 0.00 0.00
1 1.224E-08 1.140E-08 1.263E-08 1.224E-08 1.268E-08 1.224E-08 4.19 0.01 -6.85 3.20 0.04 3.61
2 1.005E-07 9.126E-08 1.020E-07 1.017E-07 1.050E-07 1.001E-07 5.20 0.41 -8.82 1.92 1.58 4.91
3 3.117E-07 2.845E-07 3.180E-07 3.196E-07 3.286E-07 3.125E-07 5.36 -0.26 -8.95 1.77 2.28 5.15
4 6.704E-07 6.093E-07 6.799E-07 6.860E-07 7.016E-07 6.694E-07 5.30 0.15 -8.99 1.56 2.47 4.81
5 1.142E-06 1.066E-06 1.187E-06 1.201E-06 1.221E-06 1.163E-06 5.30 -1.85 -8.36 2.05 3.21 4.94
6 1.763E-06 1.646E-06 1.829E-06 1.853E-06 1.874E-06 1.793E-06 5.14 -1.68 -8.20 2.02 3.34 4.51
7 2.472E-06 2.335E-06 2.590E-06 2.627E-06 2.642E-06 2.533E-06 5.10 -2.41 -7.83 2.24 3.69 4.30
8 3.315E-06 3.118E-06 3.453E-06 3.505E-06 3.507E-06 3.380E-06 4.91 -1.91 -7.75 2.17 3.72 3.77
9 4.245E-06 3.982E-06 4.405E-06 4.474E-06 4.453E-06 4.312E-06 4.75 -1.55 -7.65 2.16 3.77 3.28
10 5.247E-06 4.917E-06 5.433E-06 5.521E-06 5.470E-06 5.318E-06 4.64 -1.33 -7.54 2.18 3.82 2.87
11 6.339E-06 5.911E-06 6.527E-06 6.634E-06 6.545E-06 6.391E-06 4.52 -0.82 -7.51 2.13 3.80 2.40
12 7.463E-06 6.957E-06 7.676E-06 7.802E-06 7.670E-06 7.514E-06 4.45 -0.67 -7.41 2.16 3.84 2.08
13 8.670E-06 8.043E-06 8.869E-06 9.012E-06 8.834E-06 8.686E-06 4.37 -0.18 -7.40 2.11 3.76 1.71
14 9.835E-06 9.161E-06 1.010E-05 1.026E-05 1.003E-05 9.876E-06 4.32 -0.41 -7.23 2.23 3.84 1.56
15 1.106E-05 1.030E-05 1.135E-05 1.152E-05 1.124E-05 1.109E-05 4.26 -0.31 -7.13 2.29 3.83 1.31
20 1.758E-05 1.622E-05 1.775E-05 1.797E-05 1.747E-05 1.740E-05 3.94 1.06 -6.79 2.01 3.30 0.42
25 2.405E-05 2.188E-05 2.394E-05 2.406E-05 2.334E-05 2.345E-05 3.96 2.54 -6.71 2.07 2.59 -0.49
30 2.909E-05 2.699E-05 2.956E-05 2.944E-05 2.854E-05 2.872E-05 3.65 1.27 -6.04 2.92 2.49 -0.64
35 3.340E-05 3.142E-05 3.446E-05 3.398E-05 3.294E-05 3.324E-05 3.52 0.48 -5.48 3.67 2.22 -0.90
40 3.761E-05 3.516E-05 3.861E-05 3.769E-05 3.655E-05 3.712E-05 3.55 1.31 -5.29 4.00 1.52 -1.54
49

Table 21. UGD. Isotopic Composition in Cell 1. 242Pu, atoms/barn*cm
UGD. Isotopic Composition in Cell 1. 242Pu, atoms/barn*cm Relative Deviation from Mean Value100%*(X-Mean)/Mean
BurnupMWd/kgHM
MCU TVS-M WIMS8A HELIOS MULTICELL
Mean R.M.S. %
MCU TVS-M WIMS8A HELIOS MULTICELL
0 0.000E+00 0.000E+00 0.000E+00 0.000E+00 0.000E+00 0.000E+00 0.00 0.00 0.00 0.00 0.00 0.00
1 8.714E-11 8.207E-11 8.132E-11 8.000E-11 8.406E-11 8.292E-11 3.35 5.09 -1.02 -1.93 -3.52 1.38
2 1.509E-09 1.352E-09 1.355E-09 1.384E-09 1.451E-09 1.410E-09 4.82 7.00 -4.15 -3.89 -1.84 2.89
3 7.111E-09 6.449E-09 6.466E-09 6.684E-09 6.976E-09 6.737E-09 4.43 5.55 -4.28 -4.02 -0.78 3.54
4 2.071E-08 1.872E-08 1.873E-08 1.948E-08 2.023E-08 1.957E-08 4.54 5.80 -4.35 -4.31 -0.49 3.35
5 4.577E-08 4.159E-08 4.148E-08 4.330E-08 4.471E-08 4.337E-08 4.36 5.53 -4.10 -4.35 -0.17 3.09
6 8.518E-08 7.816E-08 7.771E-08 8.132E-08 8.349E-08 8.117E-08 4.01 4.94 -3.71 -4.26 0.18 2.85
7 1.419E-07 1.311E-07 1.299E-07 1.362E-07 1.391E-07 1.357E-07 3.77 4.61 -3.36 -4.21 0.43 2.54
8 2.178E-07 2.026E-07 2.003E-07 2.103E-07 2.134E-07 2.089E-07 3.51 4.27 -3.00 -4.11 0.68 2.16
9 3.161E-07 2.947E-07 2.907E-07 3.056E-07 3.082E-07 3.031E-07 3.40 4.31 -2.75 -4.09 0.83 1.70
10 4.397E-07 4.092E-07 4.027E-07 4.238E-07 4.252E-07 4.201E-07 3.46 4.66 -2.59 -4.14 0.87 1.21
11 5.904E-07 5.478E-07 5.379E-07 5.665E-07 5.656E-07 5.616E-07 3.59 5.12 -2.47 -4.22 0.86 0.71
12 7.687E-07 7.116E-07 6.974E-07 7.349E-07 7.308E-07 7.287E-07 3.70 5.49 -2.34 -4.29 0.85 0.29
13 9.761E-07 9.018E-07 8.822E-07 9.299E-07 9.215E-07 9.223E-07 3.83 5.83 -2.22 -4.35 0.83 -0.09
14 1.211E-06 1.119E-06 1.093E-06 1.152E-06 1.138E-06 1.143E-06 3.87 5.99 -2.06 -4.36 0.83 -0.40
15 1.474E-06 1.364E-06 1.330E-06 1.402E-06 1.382E-06 1.390E-06 3.87 6.02 -1.89 -4.36 0.84 -0.60
20 3.259E-06 3.011E-06 2.910E-06 3.064E-06 3.001E-06 3.049E-06 4.26 6.89 -1.25 -4.57 0.50 -1.57
25 5.876E-06 5.345E-06 5.126E-06 5.382E-06 5.249E-06 5.396E-06 5.30 8.90 -0.95 -4.99 -0.25 -2.72
30 9.141E-06 8.294E-06 7.908E-06 8.262E-06 8.030E-06 8.327E-06 5.80 9.78 -0.40 -5.03 -0.78 -3.56
35 1.281E-05 1.176E-05 1.116E-05 1.159E-05 1.122E-05 1.171E-05 5.68 9.42 0.47 -4.69 -1.04 -4.16
40 1.683E-05 1.565E-05 1.478E-05 1.524E-05 1.468E-05 1.543E-05 5.64 9.05 1.38 -4.26 -1.28 -4.88
‘
50
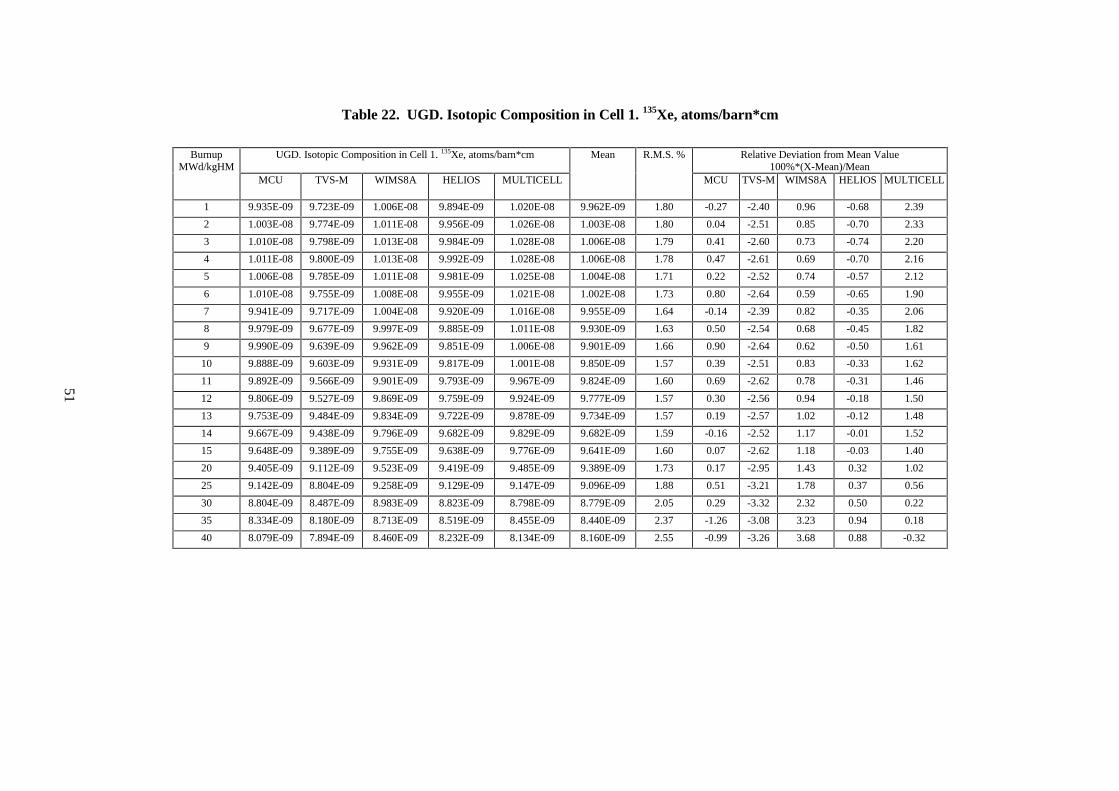
Table 22. UGD. Isotopic Composition in Cell 1. 135Xe, atoms/barn*cm
UGD. Isotopic Composition in Cell 1. 135Xe, atoms/barn*cm Relative Deviation from Mean Value100%*(X-Mean)/Mean
BurnupMWd/kgHM
MCU TVS-M WIMS8A HELIOS MULTICELL
Mean R.M.S. %
MCU TVS-M WIMS8A HELIOS MULTICELL
1 9.935E-09 9.723E-09 1.006E-08 9.894E-09 1.020E-08 9.962E-09 1.80 -0.27 -2.40 0.96 -0.68 2.39
2 1.003E-08 9.774E-09 1.011E-08 9.956E-09 1.026E-08 1.003E-08 1.80 0.04 -2.51 0.85 -0.70 2.33
3 1.010E-08 9.798E-09 1.013E-08 9.984E-09 1.028E-08 1.006E-08 1.79 0.41 -2.60 0.73 -0.74 2.20
4 1.011E-08 9.800E-09 1.013E-08 9.992E-09 1.028E-08 1.006E-08 1.78 0.47 -2.61 0.69 -0.70 2.16
5 1.006E-08 9.785E-09 1.011E-08 9.981E-09 1.025E-08 1.004E-08 1.71 0.22 -2.52 0.74 -0.57 2.12
6 1.010E-08 9.755E-09 1.008E-08 9.955E-09 1.021E-08 1.002E-08 1.73 0.80 -2.64 0.59 -0.65 1.90
7 9.941E-09 9.717E-09 1.004E-08 9.920E-09 1.016E-08 9.955E-09 1.64 -0.14 -2.39 0.82 -0.35 2.06
8 9.979E-09 9.677E-09 9.997E-09 9.885E-09 1.011E-08 9.930E-09 1.63 0.50 -2.54 0.68 -0.45 1.82
9 9.990E-09 9.639E-09 9.962E-09 9.851E-09 1.006E-08 9.901E-09 1.66 0.90 -2.64 0.62 -0.50 1.61
10 9.888E-09 9.603E-09 9.931E-09 9.817E-09 1.001E-08 9.850E-09 1.57 0.39 -2.51 0.83 -0.33 1.62
11 9.892E-09 9.566E-09 9.901E-09 9.793E-09 9.967E-09 9.824E-09 1.60 0.69 -2.62 0.78 -0.31 1.46
12 9.806E-09 9.527E-09 9.869E-09 9.759E-09 9.924E-09 9.777E-09 1.57 0.30 -2.56 0.94 -0.18 1.50
13 9.753E-09 9.484E-09 9.834E-09 9.722E-09 9.878E-09 9.734E-09 1.57 0.19 -2.57 1.02 -0.12 1.48
14 9.667E-09 9.438E-09 9.796E-09 9.682E-09 9.829E-09 9.682E-09 1.59 -0.16 -2.52 1.17 -0.01 1.52
15 9.648E-09 9.389E-09 9.755E-09 9.638E-09 9.776E-09 9.641E-09 1.60 0.07 -2.62 1.18 -0.03 1.40
20 9.405E-09 9.112E-09 9.523E-09 9.419E-09 9.485E-09 9.389E-09 1.73 0.17 -2.95 1.43 0.32 1.02
25 9.142E-09 8.804E-09 9.258E-09 9.129E-09 9.147E-09 9.096E-09 1.88 0.51 -3.21 1.78 0.37 0.56
30 8.804E-09 8.487E-09 8.983E-09 8.823E-09 8.798E-09 8.779E-09 2.05 0.29 -3.32 2.32 0.50 0.22
35 8.334E-09 8.180E-09 8.713E-09 8.519E-09 8.455E-09 8.440E-09 2.37 -1.26 -3.08 3.23 0.94 0.18
40 8.079E-09 7.894E-09 8.460E-09 8.232E-09 8.134E-09 8.160E-09 2.55 -0.99 -3.26 3.68 0.88 -0.32
51
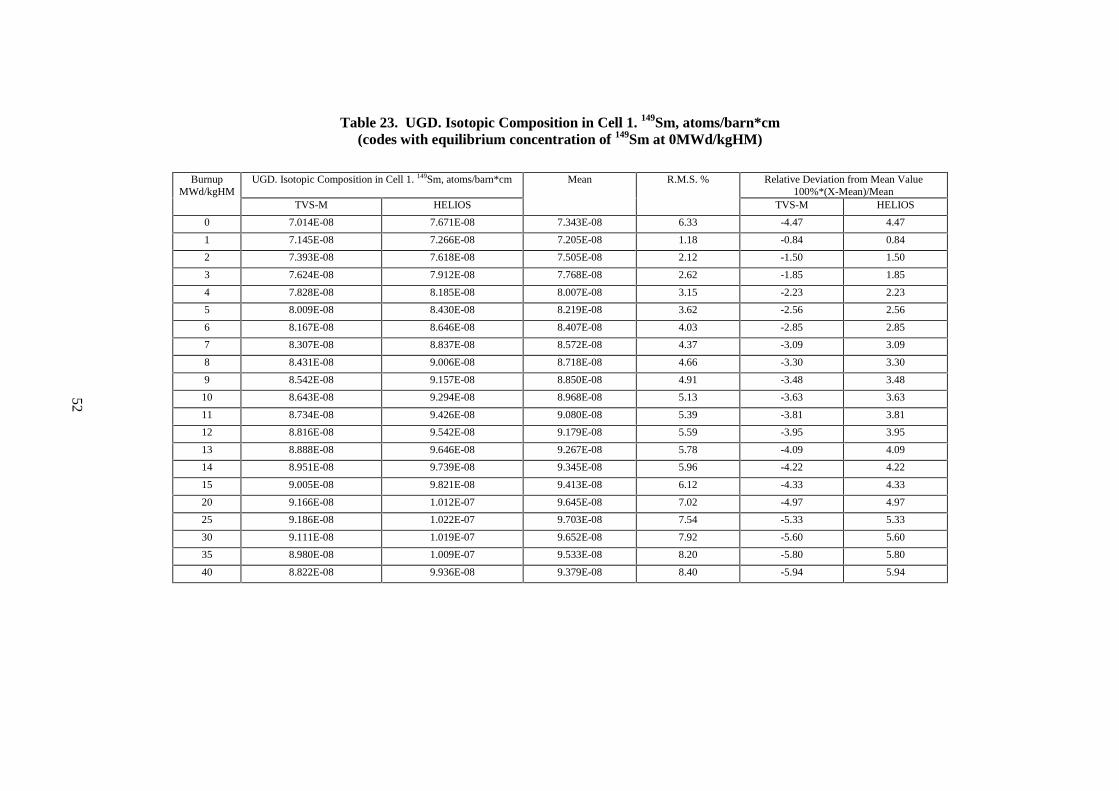
Table 23. UGD. Isotopic Composition in Cell 1. 149Sm, atoms/barn*cm(codes with equilibrium concentration of 149Sm at 0MWd/kgHM)
UGD. Isotopic Composition in Cell 1. 149Sm, atoms/barn*cm Relative Deviation from Mean Value100%*(X-Mean)/Mean
BurnupMWd/kgHM
TVS-M HELIOS
Mean R.M.S. %
TVS-M HELIOS
0 7.014E-08 7.671E-08 7.343E-08 6.33 -4.47 4.47
1 7.145E-08 7.266E-08 7.205E-08 1.18 -0.84 0.84
2 7.393E-08 7.618E-08 7.505E-08 2.12 -1.50 1.50
3 7.624E-08 7.912E-08 7.768E-08 2.62 -1.85 1.85
4 7.828E-08 8.185E-08 8.007E-08 3.15 -2.23 2.23
5 8.009E-08 8.430E-08 8.219E-08 3.62 -2.56 2.56
6 8.167E-08 8.646E-08 8.407E-08 4.03 -2.85 2.85
7 8.307E-08 8.837E-08 8.572E-08 4.37 -3.09 3.09
8 8.431E-08 9.006E-08 8.718E-08 4.66 -3.30 3.30
9 8.542E-08 9.157E-08 8.850E-08 4.91 -3.48 3.48
10 8.643E-08 9.294E-08 8.968E-08 5.13 -3.63 3.63
11 8.734E-08 9.426E-08 9.080E-08 5.39 -3.81 3.81
12 8.816E-08 9.542E-08 9.179E-08 5.59 -3.95 3.95
13 8.888E-08 9.646E-08 9.267E-08 5.78 -4.09 4.09
14 8.951E-08 9.739E-08 9.345E-08 5.96 -4.22 4.22
15 9.005E-08 9.821E-08 9.413E-08 6.12 -4.33 4.33
20 9.166E-08 1.012E-07 9.645E-08 7.02 -4.97 4.97
25 9.186E-08 1.022E-07 9.703E-08 7.54 -5.33 5.33
30 9.111E-08 1.019E-07 9.652E-08 7.92 -5.60 5.60
35 8.980E-08 1.009E-07 9.533E-08 8.20 -5.80 5.80
40 8.822E-08 9.936E-08 9.379E-08 8.40 -5.94 5.94
52
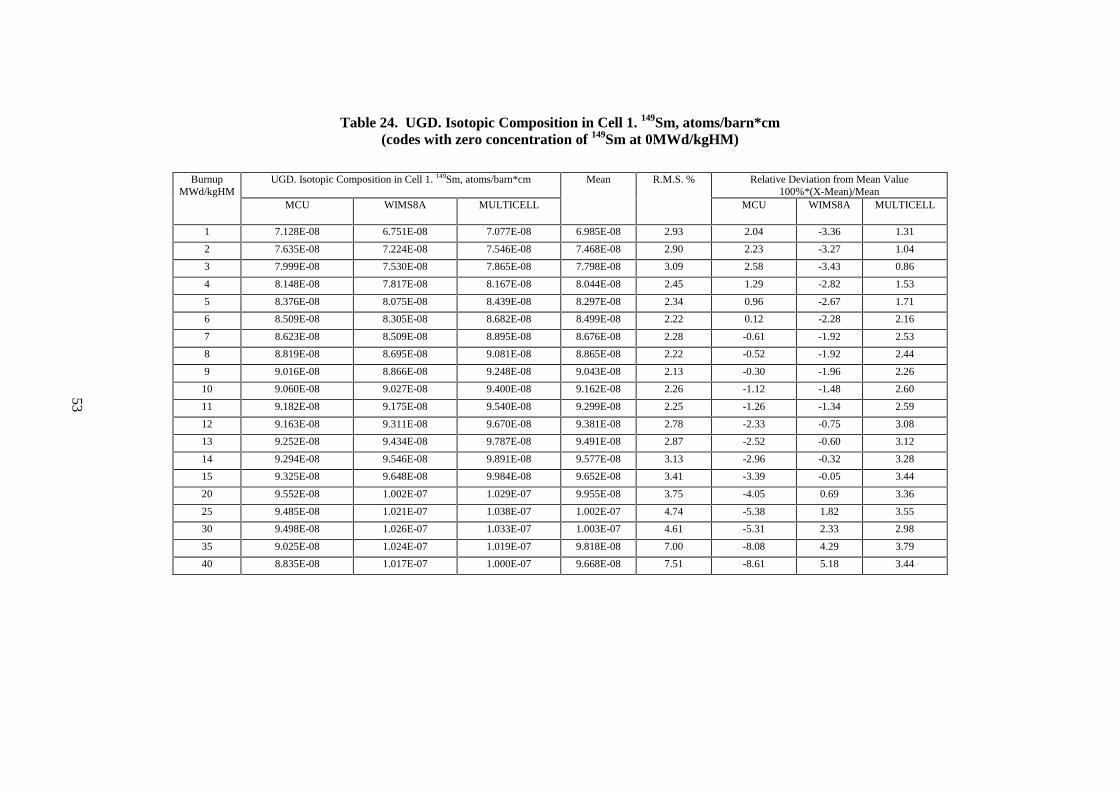
Table 24. UGD. Isotopic Composition in Cell 1. 149Sm, atoms/barn*cm(codes with zero concentration of 149Sm at 0MWd/kgHM)
UGD. Isotopic Composition in Cell 1. 149Sm, atoms/barn*cm Relative Deviation from Mean Value100%*(X-Mean)/Mean
BurnupMWd/kgHM
MCU WIMS8A MULTICELL
Mean R.M.S. %
MCU WIMS8A MULTICELL
1 7.128E-08 6.751E-08 7.077E-08 6.985E-08 2.93 2.04 -3.36 1.31
2 7.635E-08 7.224E-08 7.546E-08 7.468E-08 2.90 2.23 -3.27 1.04
3 7.999E-08 7.530E-08 7.865E-08 7.798E-08 3.09 2.58 -3.43 0.86
4 8.148E-08 7.817E-08 8.167E-08 8.044E-08 2.45 1.29 -2.82 1.53
5 8.376E-08 8.075E-08 8.439E-08 8.297E-08 2.34 0.96 -2.67 1.71
6 8.509E-08 8.305E-08 8.682E-08 8.499E-08 2.22 0.12 -2.28 2.16
7 8.623E-08 8.509E-08 8.895E-08 8.676E-08 2.28 -0.61 -1.92 2.53
8 8.819E-08 8.695E-08 9.081E-08 8.865E-08 2.22 -0.52 -1.92 2.44
9 9.016E-08 8.866E-08 9.248E-08 9.043E-08 2.13 -0.30 -1.96 2.26
10 9.060E-08 9.027E-08 9.400E-08 9.162E-08 2.26 -1.12 -1.48 2.60
11 9.182E-08 9.175E-08 9.540E-08 9.299E-08 2.25 -1.26 -1.34 2.59
12 9.163E-08 9.311E-08 9.670E-08 9.381E-08 2.78 -2.33 -0.75 3.08
13 9.252E-08 9.434E-08 9.787E-08 9.491E-08 2.87 -2.52 -0.60 3.12
14 9.294E-08 9.546E-08 9.891E-08 9.577E-08 3.13 -2.96 -0.32 3.28
15 9.325E-08 9.648E-08 9.984E-08 9.652E-08 3.41 -3.39 -0.05 3.44
20 9.552E-08 1.002E-07 1.029E-07 9.955E-08 3.75 -4.05 0.69 3.36
25 9.485E-08 1.021E-07 1.038E-07 1.002E-07 4.74 -5.38 1.82 3.55
30 9.498E-08 1.026E-07 1.033E-07 1.003E-07 4.61 -5.31 2.33 2.98
35 9.025E-08 1.024E-07 1.019E-07 9.818E-08 7.00 -8.08 4.29 3.79
40 8.835E-08 1.017E-07 1.000E-07 9.668E-08 7.51 -8.61 5.18 3.44
53

Table 25. UGD. Isotopic Composition in Cell 1 Deviation from Average Value, %. Burnup=40 MWd/kgHM
UGD. Isotopic Composition in Cell 1 Deviation from Average Value, %. Burnup=40 MWd/kgHM235U 236U 238U 239Pu 240Pu 241Pu 242Pu 135Xe 149Sm
MCU -2.45 0.45 -0.06 1.08 0.05 1.31 9.05 -0.99 -7.51
TVS-M 0.11 -0.24 0.04 1.06 6.17 -5.29 1.38 -3.26 -7.65
WIMS8A 6.89 -2.69 -0.01 5.11 0.40 4.00 -4.26 3.68 6.45
HELIOS -1.07 2.87 0.01 -3.30 -6.05 1.52 -1.28 0.88 4.02
MULTICELL -3.47 -0.38 0.03 -3.95 -0.57 -1.54 -4.88 -0.32 4.69
R.M.S. % 4.08 1.99 0.04 3.70 4.33 3.55 5.64 2.55 6.97
54

Table 26. UGD. Isotopic Composition in Cell 24. 235U, atoms/barn*cm
UGD. Isotopic Composition in Cell 24. 235U, atoms/barn*cm Relative Deviation from Mean Value100%*(X-Mean)/Mean
BurnupMWd/kgHM
MCU TVS-M WIMS8A HELIOS MULTICELL
Mean R.M.S. %
MCU TVS-M WIMS8A HELIOS MULTICELL
0 7.288E-04 7.288E-04 7.288E-04 7.288E-04 7.288E-04 7.288E-04 0.00 0.00 0.00 0.00 0.00 0.00
1 7.195E-04 7.196E-04 7.192E-04 7.191E-04 7.195E-04 7.194E-04 0.03 0.02 0.02 -0.03 -0.04 0.02
2 7.093E-04 7.094E-04 7.086E-04 7.086E-04 7.094E-04 7.091E-04 0.06 0.03 0.05 -0.06 -0.07 0.05
3 6.979E-04 6.982E-04 6.970E-04 6.970E-04 6.983E-04 6.977E-04 0.10 0.04 0.08 -0.10 -0.10 0.09
4 6.854E-04 6.859E-04 6.842E-04 6.842E-04 6.860E-04 6.851E-04 0.13 0.04 0.11 -0.14 -0.13 0.13
5 6.717E-04 6.723E-04 6.702E-04 6.704E-04 6.727E-04 6.715E-04 0.17 0.04 0.13 -0.19 -0.16 0.19
6 6.568E-04 6.575E-04 6.550E-04 6.553E-04 6.582E-04 6.565E-04 0.21 0.03 0.14 -0.24 -0.19 0.25
7 6.405E-04 6.412E-04 6.385E-04 6.391E-04 6.425E-04 6.404E-04 0.25 0.02 0.13 -0.29 -0.20 0.33
8 6.232E-04 6.238E-04 6.211E-04 6.218E-04 6.258E-04 6.231E-04 0.29 0.01 0.10 -0.33 -0.21 0.43
9 6.050E-04 6.055E-04 6.031E-04 6.040E-04 6.082E-04 6.052E-04 0.32 -0.03 0.06 -0.33 -0.20 0.50
10 5.868E-04 5.870E-04 5.851E-04 5.859E-04 5.903E-04 5.870E-04 0.34 -0.04 -0.01 -0.33 -0.19 0.56
11 5.687E-04 5.686E-04 5.672E-04 5.681E-04 5.724E-04 5.690E-04 0.35 -0.05 -0.07 -0.31 -0.17 0.60
12 5.510E-04 5.506E-04 5.497E-04 5.505E-04 5.548E-04 5.513E-04 0.36 -0.07 -0.13 -0.29 -0.15 0.63
13 5.336E-04 5.330E-04 5.327E-04 5.334E-04 5.375E-04 5.340E-04 0.37 -0.08 -0.19 -0.25 -0.12 0.65
14 5.165E-04 5.158E-04 5.161E-04 5.167E-04 5.207E-04 5.172E-04 0.39 -0.12 -0.25 -0.21 -0.10 0.69
15 5.000E-04 4.991E-04 4.999E-04 5.003E-04 5.043E-04 5.007E-04 0.41 -0.14 -0.32 -0.17 -0.08 0.71
20 4.238E-04 4.219E-04 4.251E-04 4.248E-04 4.281E-04 4.247E-04 0.53 -0.21 -0.67 0.08 0.01 0.80
25 3.567E-04 3.541E-04 3.595E-04 3.583E-04 3.609E-04 3.579E-04 0.73 -0.32 -1.06 0.44 0.10 0.84
30 2.984E-04 2.949E-04 3.021E-04 3.000E-04 3.019E-04 2.995E-04 1.00 -0.34 -1.54 0.89 0.17 0.82
35 2.472E-04 2.434E-04 2.523E-04 2.492E-04 2.504E-04 2.485E-04 1.36 -0.52 -2.04 1.51 0.29 0.76
40 2.029E-04 1.992E-04 2.092E-04 2.054E-04 2.059E-04 2.045E-04 1.82 -0.79 -2.60 2.29 0.42 0.67
55
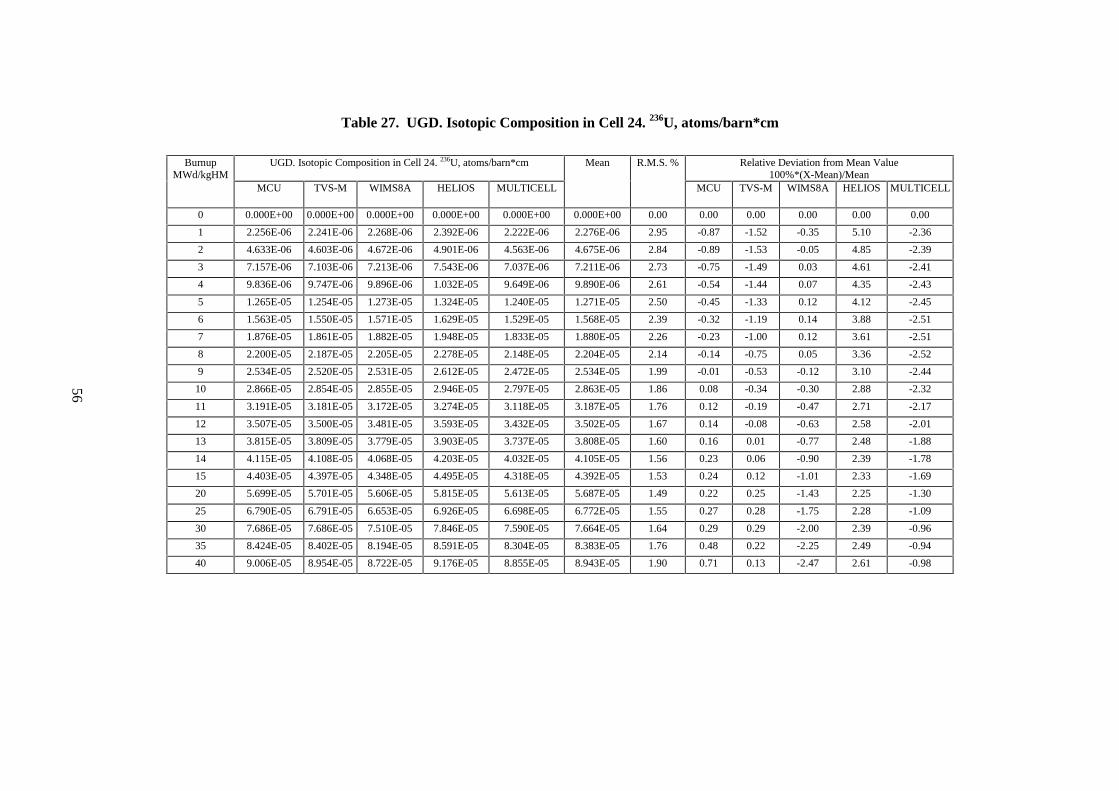
Table 27. UGD. Isotopic Composition in Cell 24. 236U, atoms/barn*cm
UGD. Isotopic Composition in Cell 24. 236U, atoms/barn*cm Relative Deviation from Mean Value100%*(X-Mean)/Mean
BurnupMWd/kgHM
MCU TVS-M WIMS8A HELIOS MULTICELL
Mean R.M.S. %
MCU TVS-M WIMS8A HELIOS MULTICELL
0 0.000E+00 0.000E+00 0.000E+00 0.000E+00 0.000E+00 0.000E+00 0.00 0.00 0.00 0.00 0.00 0.00
1 2.256E-06 2.241E-06 2.268E-06 2.392E-06 2.222E-06 2.276E-06 2.95 -0.87 -1.52 -0.35 5.10 -2.36
2 4.633E-06 4.603E-06 4.672E-06 4.901E-06 4.563E-06 4.675E-06 2.84 -0.89 -1.53 -0.05 4.85 -2.39
3 7.157E-06 7.103E-06 7.213E-06 7.543E-06 7.037E-06 7.211E-06 2.73 -0.75 -1.49 0.03 4.61 -2.41
4 9.836E-06 9.747E-06 9.896E-06 1.032E-05 9.649E-06 9.890E-06 2.61 -0.54 -1.44 0.07 4.35 -2.43
5 1.265E-05 1.254E-05 1.273E-05 1.324E-05 1.240E-05 1.271E-05 2.50 -0.45 -1.33 0.12 4.12 -2.45
6 1.563E-05 1.550E-05 1.571E-05 1.629E-05 1.529E-05 1.568E-05 2.39 -0.32 -1.19 0.14 3.88 -2.51
7 1.876E-05 1.861E-05 1.882E-05 1.948E-05 1.833E-05 1.880E-05 2.26 -0.23 -1.00 0.12 3.61 -2.51
8 2.200E-05 2.187E-05 2.205E-05 2.278E-05 2.148E-05 2.204E-05 2.14 -0.14 -0.75 0.05 3.36 -2.52
9 2.534E-05 2.520E-05 2.531E-05 2.612E-05 2.472E-05 2.534E-05 1.99 -0.01 -0.53 -0.12 3.10 -2.44
10 2.866E-05 2.854E-05 2.855E-05 2.946E-05 2.797E-05 2.863E-05 1.86 0.08 -0.34 -0.30 2.88 -2.32
11 3.191E-05 3.181E-05 3.172E-05 3.274E-05 3.118E-05 3.187E-05 1.76 0.12 -0.19 -0.47 2.71 -2.17
12 3.507E-05 3.500E-05 3.481E-05 3.593E-05 3.432E-05 3.502E-05 1.67 0.14 -0.08 -0.63 2.58 -2.01
13 3.815E-05 3.809E-05 3.779E-05 3.903E-05 3.737E-05 3.808E-05 1.60 0.16 0.01 -0.77 2.48 -1.88
14 4.115E-05 4.108E-05 4.068E-05 4.203E-05 4.032E-05 4.105E-05 1.56 0.23 0.06 -0.90 2.39 -1.78
15 4.403E-05 4.397E-05 4.348E-05 4.495E-05 4.318E-05 4.392E-05 1.53 0.24 0.12 -1.01 2.33 -1.69
20 5.699E-05 5.701E-05 5.606E-05 5.815E-05 5.613E-05 5.687E-05 1.49 0.22 0.25 -1.43 2.25 -1.30
25 6.790E-05 6.791E-05 6.653E-05 6.926E-05 6.698E-05 6.772E-05 1.55 0.27 0.28 -1.75 2.28 -1.09
30 7.686E-05 7.686E-05 7.510E-05 7.846E-05 7.590E-05 7.664E-05 1.64 0.29 0.29 -2.00 2.39 -0.96
35 8.424E-05 8.402E-05 8.194E-05 8.591E-05 8.304E-05 8.383E-05 1.76 0.48 0.22 -2.25 2.49 -0.94
40 9.006E-05 8.954E-05 8.722E-05 9.176E-05 8.855E-05 8.943E-05 1.90 0.71 0.13 -2.47 2.61 -0.98
56
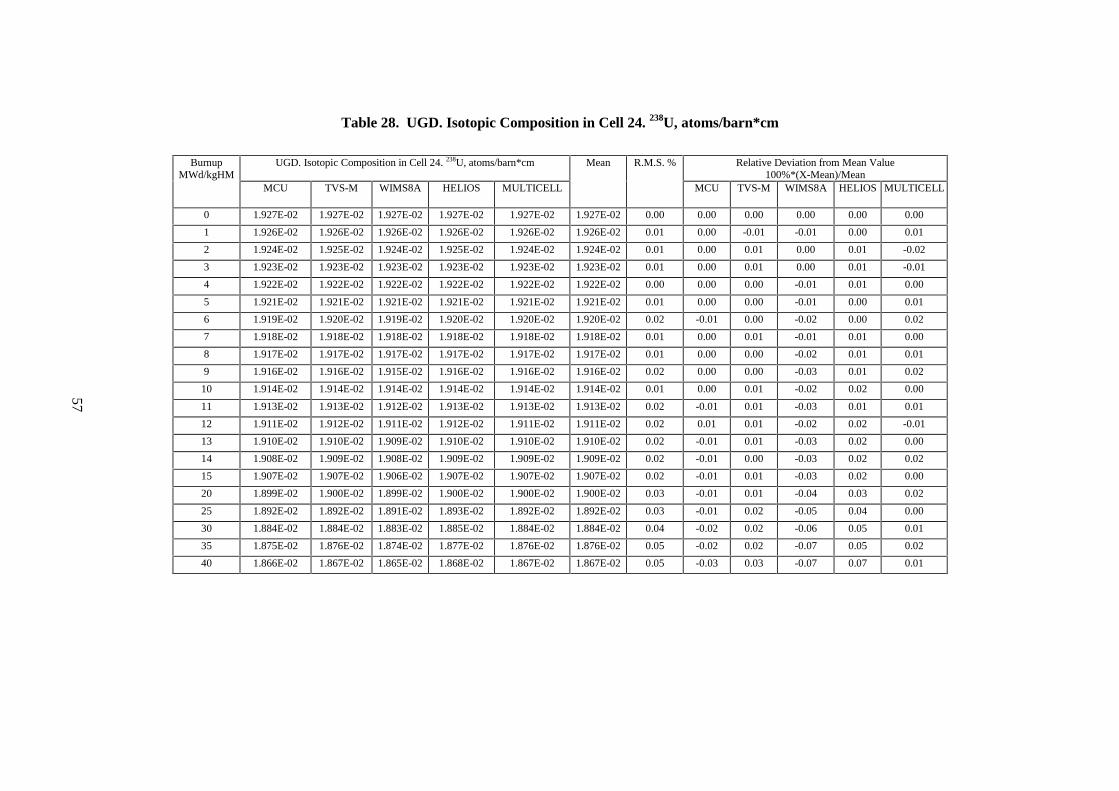
Table 28. UGD. Isotopic Composition in Cell 24. 238U, atoms/barn*cm
UGD. Isotopic Composition in Cell 24. 238U, atoms/barn*cm Relative Deviation from Mean Value100%*(X-Mean)/Mean
BurnupMWd/kgHM
MCU TVS-M WIMS8A HELIOS MULTICELL
Mean R.M.S. %
MCU TVS-M WIMS8A HELIOS MULTICELL
0 1.927E-02 1.927E-02 1.927E-02 1.927E-02 1.927E-02 1.927E-02 0.00 0.00 0.00 0.00 0.00 0.00
1 1.926E-02 1.926E-02 1.926E-02 1.926E-02 1.926E-02 1.926E-02 0.01 0.00 -0.01 -0.01 0.00 0.01
2 1.924E-02 1.925E-02 1.924E-02 1.925E-02 1.924E-02 1.924E-02 0.01 0.00 0.01 0.00 0.01 -0.02
3 1.923E-02 1.923E-02 1.923E-02 1.923E-02 1.923E-02 1.923E-02 0.01 0.00 0.01 0.00 0.01 -0.01
4 1.922E-02 1.922E-02 1.922E-02 1.922E-02 1.922E-02 1.922E-02 0.00 0.00 0.00 -0.01 0.01 0.00
5 1.921E-02 1.921E-02 1.921E-02 1.921E-02 1.921E-02 1.921E-02 0.01 0.00 0.00 -0.01 0.00 0.01
6 1.919E-02 1.920E-02 1.919E-02 1.920E-02 1.920E-02 1.920E-02 0.02 -0.01 0.00 -0.02 0.00 0.02
7 1.918E-02 1.918E-02 1.918E-02 1.918E-02 1.918E-02 1.918E-02 0.01 0.00 0.01 -0.01 0.01 0.00
8 1.917E-02 1.917E-02 1.917E-02 1.917E-02 1.917E-02 1.917E-02 0.01 0.00 0.00 -0.02 0.01 0.01
9 1.916E-02 1.916E-02 1.915E-02 1.916E-02 1.916E-02 1.916E-02 0.02 0.00 0.00 -0.03 0.01 0.02
10 1.914E-02 1.914E-02 1.914E-02 1.914E-02 1.914E-02 1.914E-02 0.01 0.00 0.01 -0.02 0.02 0.00
11 1.913E-02 1.913E-02 1.912E-02 1.913E-02 1.913E-02 1.913E-02 0.02 -0.01 0.01 -0.03 0.01 0.01
12 1.911E-02 1.912E-02 1.911E-02 1.912E-02 1.911E-02 1.911E-02 0.02 0.01 0.01 -0.02 0.02 -0.01
13 1.910E-02 1.910E-02 1.909E-02 1.910E-02 1.910E-02 1.910E-02 0.02 -0.01 0.01 -0.03 0.02 0.00
14 1.908E-02 1.909E-02 1.908E-02 1.909E-02 1.909E-02 1.909E-02 0.02 -0.01 0.00 -0.03 0.02 0.02
15 1.907E-02 1.907E-02 1.906E-02 1.907E-02 1.907E-02 1.907E-02 0.02 -0.01 0.01 -0.03 0.02 0.00
20 1.899E-02 1.900E-02 1.899E-02 1.900E-02 1.900E-02 1.900E-02 0.03 -0.01 0.01 -0.04 0.03 0.02
25 1.892E-02 1.892E-02 1.891E-02 1.893E-02 1.892E-02 1.892E-02 0.03 -0.01 0.02 -0.05 0.04 0.00
30 1.884E-02 1.884E-02 1.883E-02 1.885E-02 1.884E-02 1.884E-02 0.04 -0.02 0.02 -0.06 0.05 0.01
35 1.875E-02 1.876E-02 1.874E-02 1.877E-02 1.876E-02 1.876E-02 0.05 -0.02 0.02 -0.07 0.05 0.02
40 1.866E-02 1.867E-02 1.865E-02 1.868E-02 1.867E-02 1.867E-02 0.05 -0.03 0.03 -0.07 0.07 0.01
57

Table 29. UGD. Isotopic Composition in Cell 24. 239Pu, atoms/barn*cm
UGD. Isotopic Composition in Cell 24. 239Pu, atoms/barn*cm Relative Deviation from Mean Value100%*(X-Mean)/Mean
BurnupMWd/kgHM
MCU TVS-M WIMS8A HELIOS MULTICELL
Mean R.M.S. %
MCU TVS-M WIMS8A HELIOS MULTICELL
0 0.000E+00 0.000E+00 0.000E+00 0.000E+00 0.000E+00 0.000E+00 0.00 0.00 0.00 0.00 0.00 0.00
1 8.943E-06 8.677E-06 8.995E-06 8.595E-06 8.720E-06 8.786E-06 1.98 1.79 -1.25 2.38 -2.18 -0.75
2 1.860E-05 1.827E-05 1.897E-05 1.793E-05 1.840E-05 1.843E-05 2.11 0.89 -0.91 2.94 -2.74 -0.18
3 2.780E-05 2.734E-05 2.839E-05 2.674E-05 2.759E-05 2.757E-05 2.21 0.84 -0.85 2.98 -3.03 0.06
4 3.648E-05 3.585E-05 3.721E-05 3.498E-05 3.623E-05 3.615E-05 2.27 0.90 -0.84 2.93 -3.22 0.22
5 4.444E-05 4.376E-05 4.539E-05 4.264E-05 4.429E-05 4.410E-05 2.29 0.77 -0.79 2.91 -3.32 0.42
6 5.179E-05 5.104E-05 5.292E-05 4.969E-05 5.174E-05 5.143E-05 2.30 0.68 -0.76 2.88 -3.40 0.59
7 5.840E-05 5.770E-05 5.979E-05 5.613E-05 5.854E-05 5.811E-05 2.31 0.49 -0.71 2.89 -3.41 0.74
8 6.457E-05 6.376E-05 6.607E-05 6.200E-05 6.474E-05 6.423E-05 2.33 0.53 -0.73 2.87 -3.47 0.80
9 7.016E-05 6.928E-05 7.181E-05 6.736E-05 7.038E-05 6.980E-05 2.35 0.52 -0.75 2.89 -3.49 0.83
10 7.545E-05 7.433E-05 7.709E-05 7.228E-05 7.553E-05 7.493E-05 2.38 0.69 -0.81 2.87 -3.55 0.80
11 8.018E-05 7.897E-05 8.196E-05 7.681E-05 8.027E-05 7.964E-05 2.39 0.68 -0.84 2.91 -3.55 0.79
12 8.458E-05 8.326E-05 8.647E-05 8.100E-05 8.464E-05 8.399E-05 2.41 0.70 -0.87 2.96 -3.57 0.77
13 8.883E-05 8.724E-05 9.067E-05 8.487E-05 8.869E-05 8.806E-05 2.45 0.87 -0.93 2.96 -3.62 0.72
14 9.259E-05 9.092E-05 9.456E-05 8.847E-05 9.244E-05 9.180E-05 2.47 0.87 -0.95 3.02 -3.63 0.70
15 9.617E-05 9.433E-05 9.819E-05 9.180E-05 9.592E-05 9.528E-05 2.50 0.93 -1.00 3.05 -3.66 0.67
20 1.105E-04 1.079E-04 1.128E-04 1.052E-04 1.098E-04 1.092E-04 2.62 1.15 -1.23 3.25 -3.72 0.54
25 1.206E-04 1.170E-04 1.229E-04 1.143E-04 1.192E-04 1.188E-04 2.79 1.51 -1.49 3.47 -3.82 0.33
30 1.277E-04 1.232E-04 1.300E-04 1.204E-04 1.254E-04 1.253E-04 2.99 1.88 -1.72 3.72 -3.94 0.06
35 1.316E-04 1.271E-04 1.348E-04 1.244E-04 1.293E-04 1.294E-04 3.10 1.65 -1.79 4.14 -3.90 -0.11
40 1.334E-04 1.296E-04 1.381E-04 1.269E-04 1.316E-04 1.319E-04 3.18 1.11 -1.76 4.67 -3.78 -0.23
58

Table 30. UGD. Isotopic Composition in Cell 24. 240Pu, atoms/barn*cm
UGD. Isotopic Composition in Cell 24. 240Pu, atoms/barn*cm Relative Deviation from Mean Value100%*(X-Mean)/Mean
BurnupMWd/kgHM
MCU TVS-M WIMS8A HELIOS MULTICELL
Mean R.M.S. %
MCU TVS-M WIMS8A HELIOS MULTICELL
0 0.000E+00 0.000E+00 0.000E+00 0.000E+00 0.000E+00 0.000E+00 0.00 0.00 0.00 0.00 0.00 0.00
1 9.724E-08 9.343E-08 1.003E-07 8.679E-08 8.114E-08 9.178E-08 8.50 5.95 1.79 9.29 -5.44 -11.60
2 4.146E-07 4.006E-07 4.311E-07 3.890E-07 3.670E-07 4.005E-07 6.11 3.53 0.04 7.66 -2.87 -8.36
3 9.453E-07 9.199E-07 9.847E-07 9.009E-07 8.573E-07 9.216E-07 5.18 2.57 -0.18 6.84 -2.25 -6.98
4 1.686E-06 1.643E-06 1.748E-06 1.610E-06 1.546E-06 1.647E-06 4.64 2.40 -0.21 6.15 -2.23 -6.12
5 2.608E-06 2.562E-06 2.708E-06 2.503E-06 2.425E-06 2.561E-06 4.17 1.84 0.04 5.72 -2.28 -5.31
6 3.714E-06 3.665E-06 3.847E-06 3.563E-06 3.484E-06 3.655E-06 3.83 1.61 0.29 5.27 -2.51 -4.67
7 4.973E-06 4.939E-06 5.145E-06 4.771E-06 4.710E-06 4.908E-06 3.52 1.33 0.64 4.83 -2.78 -4.03
8 6.371E-06 6.356E-06 6.567E-06 6.099E-06 6.080E-06 6.295E-06 3.26 1.21 0.98 4.33 -3.10 -3.41
9 7.824E-06 7.879E-06 8.076E-06 7.512E-06 7.558E-06 7.770E-06 3.02 0.69 1.41 3.94 -3.32 -2.73
10 9.408E-06 9.473E-06 9.639E-06 8.978E-06 9.112E-06 9.322E-06 2.91 0.92 1.62 3.41 -3.69 -2.25
11 1.099E-05 1.111E-05 1.123E-05 1.047E-05 1.071E-05 1.090E-05 2.84 0.85 1.86 3.02 -3.97 -1.76
12 1.260E-05 1.276E-05 1.284E-05 1.197E-05 1.233E-05 1.250E-05 2.82 0.82 2.07 2.69 -4.22 -1.36
13 1.422E-05 1.443E-05 1.444E-05 1.348E-05 1.397E-05 1.411E-05 2.84 0.78 2.26 2.39 -4.46 -0.97
14 1.579E-05 1.610E-05 1.605E-05 1.498E-05 1.560E-05 1.570E-05 2.88 0.56 2.50 2.21 -4.61 -0.66
15 1.747E-05 1.777E-05 1.765E-05 1.648E-05 1.724E-05 1.732E-05 2.96 0.84 2.59 1.91 -4.88 -0.47
20 2.556E-05 2.596E-05 2.552E-05 2.375E-05 2.530E-05 2.522E-05 3.39 1.36 2.95 1.18 -5.82 0.32
25 3.318E-05 3.383E-05 3.293E-05 3.059E-05 3.305E-05 3.272E-05 3.79 1.43 3.41 0.65 -6.51 1.02
30 4.005E-05 4.119E-05 3.976E-05 3.686E-05 4.030E-05 3.963E-05 4.13 1.05 3.93 0.33 -6.99 1.69
35 4.670E-05 4.792E-05 4.595E-05 4.251E-05 4.695E-05 4.601E-05 4.51 1.50 4.16 -0.11 -7.60 2.05
40 5.235E-05 5.395E-05 5.148E-05 4.751E-05 5.291E-05 5.164E-05 4.80 1.38 4.47 -0.32 -8.00 2.46
59

Table 31. UGD. Isotopic Composition in Cell 24. 241Pu, atoms/barn*cm
UGD. Isotopic Composition in Cell 24. 241Pu, atoms/barn*cm Relative deviation from Mean Value100%*(X-Mean)/Mean
BurnupMWd/kgHM
MCU TVS-M WIMS8A HELIOS MULTICELL
Mean R.M.S. %
MCU TVS-M WIMS8A HELIOS MULTICELL
0 0.000E+00 0.000E+00 0.000E+00 0.000E+00 0.000E+00 0.000E+00 0.00 0.00 0.00 0.00 0.00 0.00
1 4.377E-09 4.057E-09 4.743E-09 3.982E-09 3.525E-09 4.137E-09 11.01 5.81 -1.93 14.66 -3.74 -14.79
2 3.707E-08 3.504E-08 4.130E-08 3.678E-08 3.284E-08 3.660E-08 8.52 1.27 -4.28 12.82 0.47 -10.28
3 1.272E-07 1.194E-07 1.402E-07 1.276E-07 1.149E-07 1.258E-07 7.66 1.11 -5.16 11.38 1.36 -8.70
4 2.948E-07 2.782E-07 3.250E-07 2.994E-07 2.715E-07 2.938E-07 7.12 0.35 -5.31 10.64 1.90 -7.58
5 5.602E-07 5.265E-07 6.118E-07 5.681E-07 5.185E-07 5.570E-07 6.69 0.58 -5.48 9.84 1.98 -6.92
6 9.309E-07 8.729E-07 1.009E-06 9.424E-07 8.652E-07 9.241E-07 6.33 0.74 -5.54 9.20 1.98 -6.37
7 1.393E-06 1.320E-06 1.518E-06 1.424E-06 1.314E-06 1.394E-06 6.03 -0.04 -5.31 8.92 2.17 -5.74
8 1.968E-06 1.866E-06 2.136E-06 2.011E-06 1.864E-06 1.969E-06 5.76 -0.03 -5.26 8.50 2.13 -5.34
9 2.655E-06 2.504E-06 2.856E-06 2.696E-06 2.509E-06 2.644E-06 5.53 0.42 -5.29 8.02 1.96 -5.11
10 3.371E-06 3.228E-06 3.668E-06 3.470E-06 3.240E-06 3.395E-06 5.37 -0.72 -4.94 8.03 2.20 -4.57
11 4.193E-06 4.026E-06 4.562E-06 4.325E-06 4.048E-06 4.231E-06 5.22 -0.89 -4.83 7.82 2.22 -4.32
12 5.071E-06 4.890E-06 5.525E-06 5.248E-06 4.923E-06 5.132E-06 5.10 -1.18 -4.70 7.68 2.27 -4.06
13 6.026E-06 5.809E-06 6.548E-06 6.228E-06 5.854E-06 6.093E-06 4.98 -1.10 -4.67 7.47 2.21 -3.92
14 7.079E-06 6.771E-06 7.619E-06 7.254E-06 6.832E-06 7.111E-06 4.83 -0.45 -4.78 7.14 2.01 -3.92
15 8.057E-06 7.769E-06 8.727E-06 8.317E-06 7.846E-06 8.143E-06 4.78 -1.06 -4.60 7.17 2.13 -3.65
20 1.352E-05 1.308E-05 1.455E-05 1.394E-05 1.327E-05 1.367E-05 4.28 -1.10 -4.31 6.41 1.95 -2.95
25 1.907E-05 1.835E-05 2.037E-05 1.951E-05 1.867E-05 1.920E-05 4.12 -0.63 -4.42 6.14 1.65 -2.74
30 2.421E-05 2.320E-05 2.578E-05 2.463E-05 2.367E-05 2.430E-05 4.07 -0.36 -4.52 6.10 1.36 -2.58
35 2.838E-05 2.748E-05 3.057E-05 2.910E-05 2.810E-05 2.873E-05 4.12 -1.22 -4.34 6.42 1.31 -2.18
40 3.225E-05 3.114E-05 3.469E-05 3.289E-05 3.189E-05 3.257E-05 4.11 -0.99 -4.38 6.50 0.97 -2.09
60

Table 32. UGD. Isotopic Composition in Cell 24. 242Pu, atoms/barn*cm
UGD. Isotopic Composition in Cell 24. 242Pu, atoms/barn*cm Relative Deviation from Mean Value100%*(X-Mean)/Mean
BurnupMWd/kgHM
MCU TVS-M WIMS8A HELIOS MULTICELL
Mean R.M.S. %
MCU TVS-M WIMS8A HELIOS MULTICELL
0 0.000E+00 0.000E+00 0.000E+00 0.000E+00 0.000E+00 0.000E+00 0.00 0.00 0.00 0.00 0.00 0.00
1 1.379E-11 1.249E-11 1.354E-11 1.100E-11 8.761E-12 1.191E-11 17.44 15.73 4.83 13.63 -7.72 -26.47
2 2.662E-10 2.431E-10 2.665E-10 2.331E-10 1.864E-10 2.390E-10 13.73 11.34 1.71 11.48 -2.51 -22.02
3 1.493E-09 1.376E-09 1.500E-09 1.345E-09 1.091E-09 1.361E-09 12.18 9.68 1.11 10.20 -1.16 -19.83
4 5.066E-09 4.679E-09 5.064E-09 4.599E-09 3.788E-09 4.639E-09 11.25 9.20 0.87 9.15 -0.87 -18.35
5 1.294E-08 1.203E-08 1.292E-08 1.182E-08 9.882E-09 1.192E-08 10.47 8.60 0.95 8.40 -0.86 -17.09
6 2.792E-08 2.590E-08 2.759E-08 2.535E-08 2.150E-08 2.565E-08 9.99 8.83 0.97 7.55 -1.17 -16.18
7 5.271E-08 4.925E-08 5.197E-08 4.794E-08 4.119E-08 4.861E-08 9.43 8.43 1.31 6.90 -1.38 -15.27
8 9.032E-08 8.519E-08 8.897E-08 8.241E-08 7.173E-08 8.373E-08 8.83 7.88 1.75 6.27 -1.58 -14.33
9 1.440E-07 1.365E-07 1.411E-07 1.312E-07 1.157E-07 1.337E-07 8.36 7.73 2.07 5.53 -1.86 -13.47
10 2.146E-07 2.052E-07 2.103E-07 1.963E-07 1.750E-07 2.003E-07 7.83 7.16 2.45 5.00 -2.00 -12.61
11 3.032E-07 2.927E-07 2.979E-07 2.788E-07 2.510E-07 2.847E-07 7.35 6.50 2.81 4.62 -2.08 -11.84
12 4.127E-07 4.003E-07 4.050E-07 3.800E-07 3.448E-07 3.886E-07 7.02 6.21 3.02 4.23 -2.20 -11.26
13 5.429E-07 5.290E-07 5.326E-07 5.008E-07 4.570E-07 5.125E-07 6.77 5.95 3.22 3.93 -2.27 -10.82
14 6.985E-07 6.797E-07 6.815E-07 6.420E-07 5.885E-07 6.580E-07 6.69 6.15 3.29 3.57 -2.44 -10.57
15 8.745E-07 8.533E-07 8.524E-07 8.040E-07 7.398E-07 8.248E-07 6.56 6.02 3.45 3.34 -2.52 -10.30
20 2.111E-06 2.079E-06 2.046E-06 1.938E-06 1.808E-06 1.997E-06 6.21 5.75 4.15 2.47 -2.93 -9.44
25 3.953E-06 3.904E-06 3.800E-06 3.606E-06 3.389E-06 3.730E-06 6.24 5.97 4.66 1.86 -3.34 -9.15
30 6.308E-06 6.283E-06 6.066E-06 5.753E-06 5.433E-06 5.969E-06 6.25 5.69 5.26 1.63 -3.61 -8.97
35 9.176E-06 9.141E-06 8.769E-06 8.303E-06 7.859E-06 8.650E-06 6.54 6.09 5.69 1.38 -4.01 -9.14
40 1.248E-05 1.239E-05 1.182E-05 1.117E-05 1.058E-05 1.169E-05 6.96 6.77 6.04 1.15 -4.48 -9.48
61
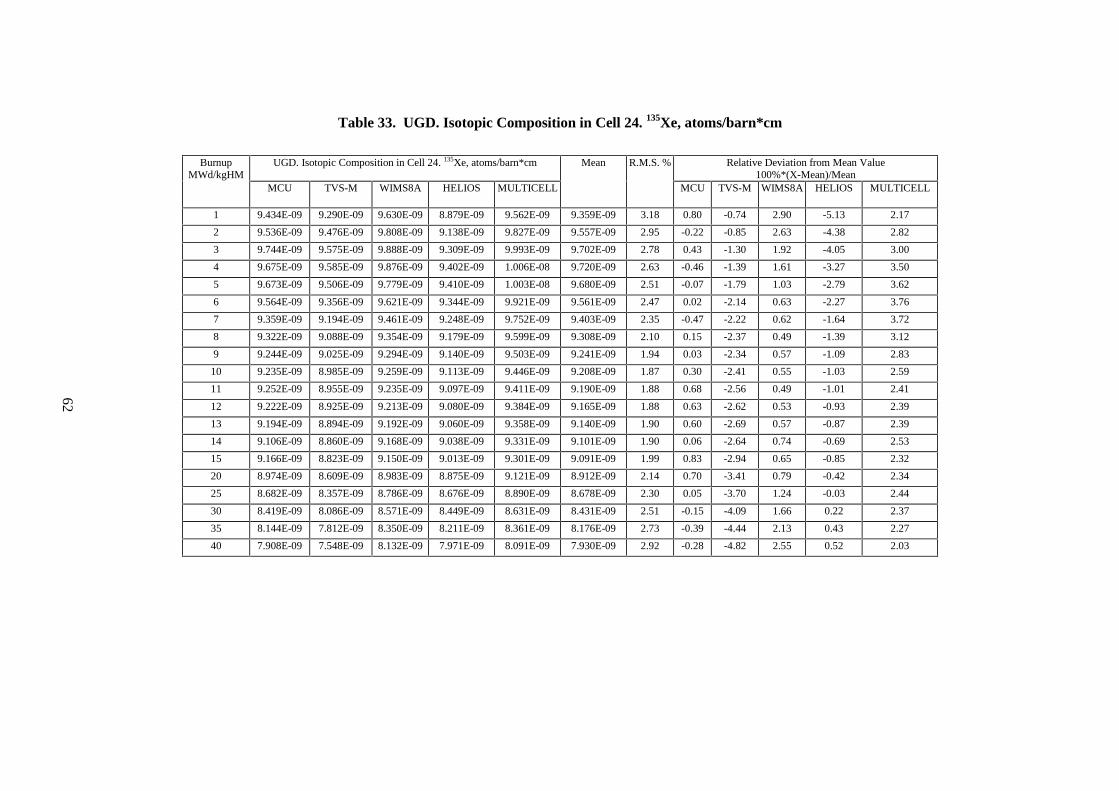
Table 33. UGD. Isotopic Composition in Cell 24. 135Xe, atoms/barn*cm
UGD. Isotopic Composition in Cell 24. 135Xe, atoms/barn*cm Relative Deviation from Mean Value100%*(X-Mean)/Mean
BurnupMWd/kgHM
MCU TVS-M WIMS8A HELIOS MULTICELL
Mean R.M.S. %
MCU TVS-M WIMS8A HELIOS MULTICELL
1 9.434E-09 9.290E-09 9.630E-09 8.879E-09 9.562E-09 9.359E-09 3.18 0.80 -0.74 2.90 -5.13 2.17
2 9.536E-09 9.476E-09 9.808E-09 9.138E-09 9.827E-09 9.557E-09 2.95 -0.22 -0.85 2.63 -4.38 2.82
3 9.744E-09 9.575E-09 9.888E-09 9.309E-09 9.993E-09 9.702E-09 2.78 0.43 -1.30 1.92 -4.05 3.00
4 9.675E-09 9.585E-09 9.876E-09 9.402E-09 1.006E-08 9.720E-09 2.63 -0.46 -1.39 1.61 -3.27 3.50
5 9.673E-09 9.506E-09 9.779E-09 9.410E-09 1.003E-08 9.680E-09 2.51 -0.07 -1.79 1.03 -2.79 3.62
6 9.564E-09 9.356E-09 9.621E-09 9.344E-09 9.921E-09 9.561E-09 2.47 0.02 -2.14 0.63 -2.27 3.76
7 9.359E-09 9.194E-09 9.461E-09 9.248E-09 9.752E-09 9.403E-09 2.35 -0.47 -2.22 0.62 -1.64 3.72
8 9.322E-09 9.088E-09 9.354E-09 9.179E-09 9.599E-09 9.308E-09 2.10 0.15 -2.37 0.49 -1.39 3.12
9 9.244E-09 9.025E-09 9.294E-09 9.140E-09 9.503E-09 9.241E-09 1.94 0.03 -2.34 0.57 -1.09 2.83
10 9.235E-09 8.985E-09 9.259E-09 9.113E-09 9.446E-09 9.208E-09 1.87 0.30 -2.41 0.55 -1.03 2.59
11 9.252E-09 8.955E-09 9.235E-09 9.097E-09 9.411E-09 9.190E-09 1.88 0.68 -2.56 0.49 -1.01 2.41
12 9.222E-09 8.925E-09 9.213E-09 9.080E-09 9.384E-09 9.165E-09 1.88 0.63 -2.62 0.53 -0.93 2.39
13 9.194E-09 8.894E-09 9.192E-09 9.060E-09 9.358E-09 9.140E-09 1.90 0.60 -2.69 0.57 -0.87 2.39
14 9.106E-09 8.860E-09 9.168E-09 9.038E-09 9.331E-09 9.101E-09 1.90 0.06 -2.64 0.74 -0.69 2.53
15 9.166E-09 8.823E-09 9.150E-09 9.013E-09 9.301E-09 9.091E-09 1.99 0.83 -2.94 0.65 -0.85 2.32
20 8.974E-09 8.609E-09 8.983E-09 8.875E-09 9.121E-09 8.912E-09 2.14 0.70 -3.41 0.79 -0.42 2.34
25 8.682E-09 8.357E-09 8.786E-09 8.676E-09 8.890E-09 8.678E-09 2.30 0.05 -3.70 1.24 -0.03 2.44
30 8.419E-09 8.086E-09 8.571E-09 8.449E-09 8.631E-09 8.431E-09 2.51 -0.15 -4.09 1.66 0.22 2.37
35 8.144E-09 7.812E-09 8.350E-09 8.211E-09 8.361E-09 8.176E-09 2.73 -0.39 -4.44 2.13 0.43 2.27
40 7.908E-09 7.548E-09 8.132E-09 7.971E-09 8.091E-09 7.930E-09 2.92 -0.28 -4.82 2.55 0.52 2.03
62
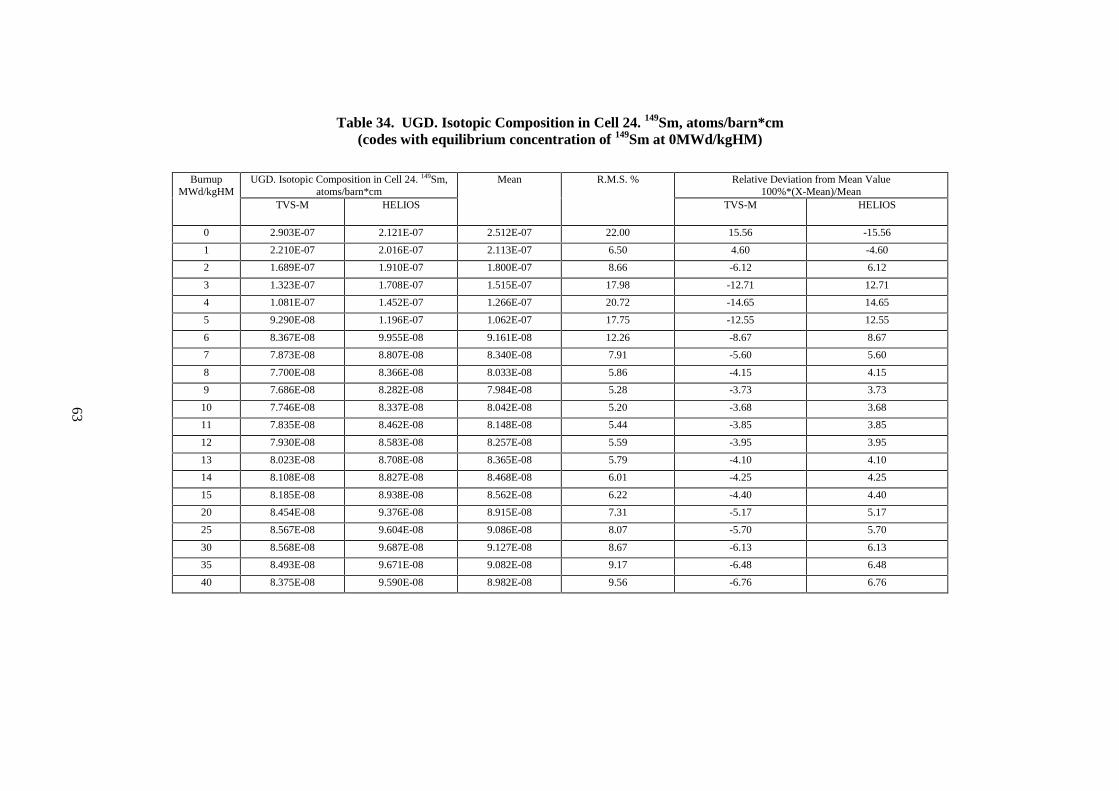
Table 34. UGD. Isotopic Composition in Cell 24. 149Sm, atoms/barn*cm(codes with equilibrium concentration of 149Sm at 0MWd/kgHM)
UGD. Isotopic Composition in Cell 24. 149Sm,atoms/barn*cm
Relative Deviation from Mean Value100%*(X-Mean)/Mean
BurnupMWd/kgHM
TVS-M HELIOS
Mean R.M.S. %
TVS-M HELIOS
0 2.903E-07 2.121E-07 2.512E-07 22.00 15.56 -15.56
1 2.210E-07 2.016E-07 2.113E-07 6.50 4.60 -4.60
2 1.689E-07 1.910E-07 1.800E-07 8.66 -6.12 6.12
3 1.323E-07 1.708E-07 1.515E-07 17.98 -12.71 12.71
4 1.081E-07 1.452E-07 1.266E-07 20.72 -14.65 14.65
5 9.290E-08 1.196E-07 1.062E-07 17.75 -12.55 12.55
6 8.367E-08 9.955E-08 9.161E-08 12.26 -8.67 8.67
7 7.873E-08 8.807E-08 8.340E-08 7.91 -5.60 5.60
8 7.700E-08 8.366E-08 8.033E-08 5.86 -4.15 4.15
9 7.686E-08 8.282E-08 7.984E-08 5.28 -3.73 3.73
10 7.746E-08 8.337E-08 8.042E-08 5.20 -3.68 3.68
11 7.835E-08 8.462E-08 8.148E-08 5.44 -3.85 3.85
12 7.930E-08 8.583E-08 8.257E-08 5.59 -3.95 3.95
13 8.023E-08 8.708E-08 8.365E-08 5.79 -4.10 4.10
14 8.108E-08 8.827E-08 8.468E-08 6.01 -4.25 4.25
15 8.185E-08 8.938E-08 8.562E-08 6.22 -4.40 4.40
20 8.454E-08 9.376E-08 8.915E-08 7.31 -5.17 5.17
25 8.567E-08 9.604E-08 9.086E-08 8.07 -5.70 5.70
30 8.568E-08 9.687E-08 9.127E-08 8.67 -6.13 6.13
35 8.493E-08 9.671E-08 9.082E-08 9.17 -6.48 6.48
40 8.375E-08 9.590E-08 8.982E-08 9.56 -6.76 6.76
63

Table 35. UGD. Isotopic Composition in Cell 24. 149Sm, atoms/barn*cm(codes with zero concentration of 149Sm at 0MWd/kgHM)
UGD. Isotopic Composition in Cell 24. 149Sm,atoms/barn*cm
Relative Deviation from Mean Value100%*(X-Mean)/Mean
BurnupMWd/kgHM
MCU WIMS8A MULTICELL
Mean R.M.S. %
MCU WIMS8A MULTICELL
1 6.599E-08 6.673E-08 6.687E-08 6.653E-08 0.71 -0.81 0.30 0.51
2 1.090E-07 1.094E-07 1.113E-07 1.099E-07 1.13 -0.83 -0.46 1.29
3 1.235E-07 1.231E-07 1.286E-07 1.251E-07 2.46 -1.23 -1.60 2.83
4 1.191E-07 1.178E-07 1.274E-07 1.214E-07 4.30 -1.91 -3.01 4.92
5 1.075E-07 1.037E-07 1.158E-07 1.090E-07 5.68 -1.39 -4.85 6.24
6 9.357E-08 9.003E-08 1.013E-07 9.497E-08 6.07 -1.47 -5.20 6.67
7 8.364E-08 8.202E-08 9.016E-08 8.527E-08 5.05 -1.92 -3.81 5.73
8 8.128E-08 7.943E-08 8.470E-08 8.180E-08 3.27 -0.64 -2.90 3.54
9 8.052E-08 7.945E-08 8.336E-08 8.111E-08 2.49 -0.73 -2.04 2.77
10 8.180E-08 8.049E-08 8.380E-08 8.203E-08 2.03 -0.28 -1.88 2.16
11 8.306E-08 8.192E-08 8.498E-08 8.332E-08 1.86 -0.31 -1.68 1.99
12 8.409E-08 8.343E-08 8.643E-08 8.465E-08 1.86 -0.66 -1.44 2.10
13 8.422E-08 8.489E-08 8.790E-08 8.567E-08 2.29 -1.69 -0.91 2.60
14 8.468E-08 8.628E-08 8.930E-08 8.675E-08 2.71 -2.39 -0.55 2.94
15 8.675E-08 8.756E-08 9.061E-08 8.831E-08 2.30 -1.76 -0.85 2.61
20 8.921E-08 9.259E-08 9.559E-08 9.246E-08 3.45 -3.52 0.14 3.38
25 8.954E-08 9.558E-08 9.831E-08 9.447E-08 4.75 -5.23 1.17 4.06
30 8.892E-08 9.712E-08 9.934E-08 9.512E-08 5.77 -6.52 2.09 4.43
35 8.682E-08 9.765E-08 9.918E-08 9.455E-08 7.13 -8.18 3.28 4.90
40 8.569E-08 9.752E-08 9.823E-08 9.381E-08 7.51 -8.66 3.95 4.71
64

Table 36. UGD. Isotopic Composition in Cell 24. 155Gd, atoms/barn*cm
UGD. Isotopic Composition in Cell 24. 155Gd, atoms/barn*cm Relative Deviation from Mean Value100%*(X-Mean)/Mean
BurnupMWd/kgHM
MCU TVS-M WIMS8A HELIOS MULTICELL
Mean R.M.S. %
MCU TVS-M WIMS8A HELIOS MULTICELL
0 1.854E-04 1.854E-04 1.854E-04 1.854E-04 1.854E-04 1.854E-04 0.00 0.00 0.00 0.00 0.00 0.00
1 1.649E-04 1.658E-04 1.647E-04 1.648E-04 1.657E-04 1.652E-04 0.32 -0.16 0.38 -0.28 -0.25 0.31
2 1.400E-04 1.417E-04 1.396E-04 1.402E-04 1.421E-04 1.407E-04 0.79 -0.49 0.69 -0.80 -0.39 0.99
3 1.130E-04 1.152E-04 1.125E-04 1.137E-04 1.164E-04 1.142E-04 1.41 -1.01 0.91 -1.44 -0.42 1.96
4 8.599E-05 8.869E-05 8.563E-05 8.737E-05 9.081E-05 8.770E-05 2.42 -1.95 1.13 -2.35 -0.37 3.55
5 6.112E-05 6.364E-05 6.044E-05 6.269E-05 6.669E-05 6.292E-05 3.90 -2.85 1.14 -3.93 -0.36 6.00
6 3.931E-05 4.124E-05 3.830E-05 4.086E-05 4.510E-05 4.096E-05 6.34 -4.04 0.69 -6.49 -0.26 10.10
7 2.148E-05 2.288E-05 2.081E-05 2.317E-05 2.699E-05 2.306E-05 10.41 -6.89 -0.82 -9.78 0.46 17.02
8 9.760E-06 1.043E-05 9.477E-06 1.108E-05 1.364E-05 1.088E-05 15.31 -10.26 -4.14 -12.86 1.85 25.42
9 3.717E-06 4.019E-06 3.755E-06 4.571E-06 5.838E-06 4.380E-06 20.18 -15.15 -8.24 -14.27 4.37 33.29
10 1.351E-06 1.439E-06 1.412E-06 1.755E-06 2.248E-06 1.641E-06 22.78 -17.67 -12.32 -13.95 6.95 36.99
11 5.335E-07 5.573E-07 5.767E-07 7.058E-07 8.698E-07 6.486E-07 21.66 -17.74 -14.08 -11.09 8.81 34.10
12 2.682E-07 2.794E-07 2.988E-07 3.424E-07 3.941E-07 3.166E-07 16.35 -15.28 -11.75 -5.62 8.16 24.50
13 1.899E-07 1.942E-07 2.087E-07 2.208E-07 2.376E-07 2.102E-07 9.32 -9.69 -7.63 -0.74 5.03 13.02
14 1.647E-07 1.679E-07 1.794E-07 1.804E-07 1.868E-07 1.759E-07 5.25 -6.34 -4.50 2.03 2.59 6.23
15 1.563E-07 1.593E-07 1.695E-07 1.667E-07 1.700E-07 1.644E-07 3.78 -4.92 -3.06 3.15 1.39 3.43
20 1.492E-07 1.498E-07 1.599E-07 1.550E-07 1.566E-07 1.541E-07 2.97 -3.20 -2.79 3.79 0.56 1.63
25 1.403E-07 1.427E-07 1.536E-07 1.486E-07 1.496E-07 1.469E-07 3.65 -4.50 -2.90 4.50 1.10 1.81
30 1.332E-07 1.353E-07 1.468E-07 1.418E-07 1.422E-07 1.399E-07 3.98 -4.79 -3.26 4.98 1.41 1.67
35 1.244E-07 1.279E-07 1.400E-07 1.350E-07 1.347E-07 1.324E-07 4.70 -6.06 -3.40 5.75 1.97 1.75
40 1.181E-07 1.206E-07 1.332E-07 1.282E-07 1.273E-07 1.255E-07 4.86 -5.88 -3.90 6.16 2.18 1.44
65
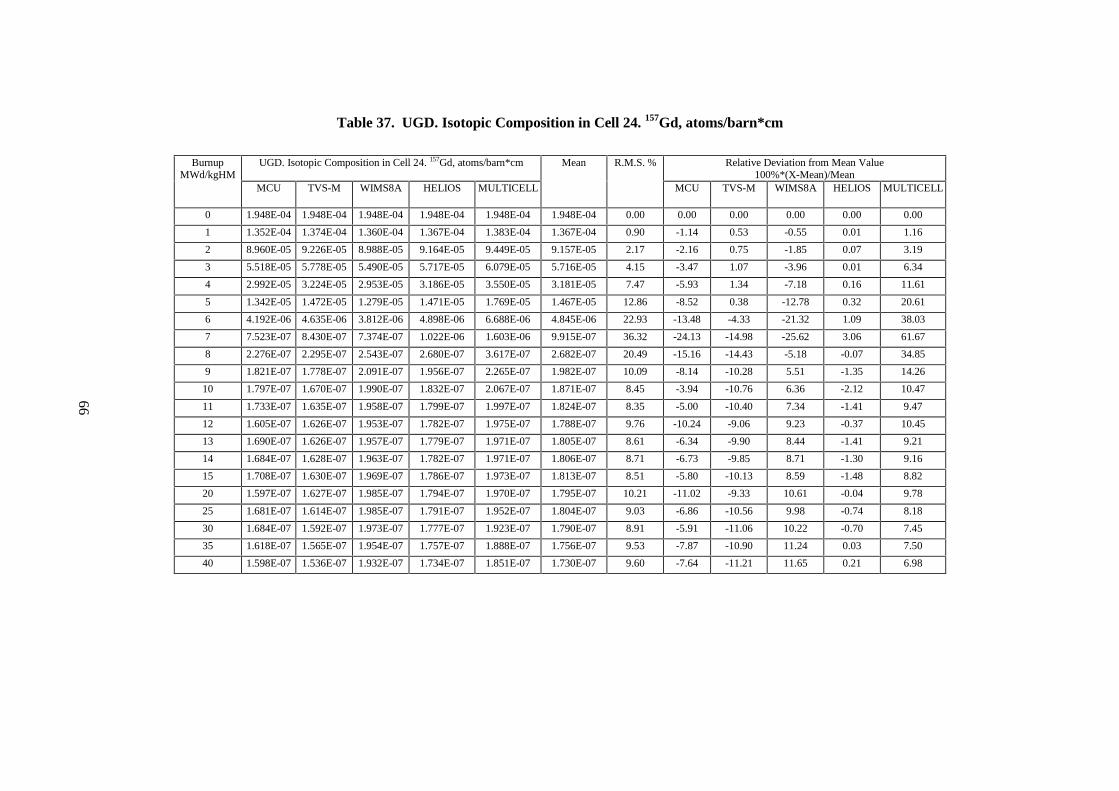
Table 37. UGD. Isotopic Composition in Cell 24. 157Gd, atoms/barn*cm
UGD. Isotopic Composition in Cell 24. 157Gd, atoms/barn*cm Relative Deviation from Mean Value100%*(X-Mean)/Mean
BurnupMWd/kgHM
MCU TVS-M WIMS8A HELIOS MULTICELL
Mean R.M.S. %
MCU TVS-M WIMS8A HELIOS MULTICELL
0 1.948E-04 1.948E-04 1.948E-04 1.948E-04 1.948E-04 1.948E-04 0.00 0.00 0.00 0.00 0.00 0.00
1 1.352E-04 1.374E-04 1.360E-04 1.367E-04 1.383E-04 1.367E-04 0.90 -1.14 0.53 -0.55 0.01 1.16
2 8.960E-05 9.226E-05 8.988E-05 9.164E-05 9.449E-05 9.157E-05 2.17 -2.16 0.75 -1.85 0.07 3.19
3 5.518E-05 5.778E-05 5.490E-05 5.717E-05 6.079E-05 5.716E-05 4.15 -3.47 1.07 -3.96 0.01 6.34
4 2.992E-05 3.224E-05 2.953E-05 3.186E-05 3.550E-05 3.181E-05 7.47 -5.93 1.34 -7.18 0.16 11.61
5 1.342E-05 1.472E-05 1.279E-05 1.471E-05 1.769E-05 1.467E-05 12.86 -8.52 0.38 -12.78 0.32 20.61
6 4.192E-06 4.635E-06 3.812E-06 4.898E-06 6.688E-06 4.845E-06 22.93 -13.48 -4.33 -21.32 1.09 38.03
7 7.523E-07 8.430E-07 7.374E-07 1.022E-06 1.603E-06 9.915E-07 36.32 -24.13 -14.98 -25.62 3.06 61.67
8 2.276E-07 2.295E-07 2.543E-07 2.680E-07 3.617E-07 2.682E-07 20.49 -15.16 -14.43 -5.18 -0.07 34.85
9 1.821E-07 1.778E-07 2.091E-07 1.956E-07 2.265E-07 1.982E-07 10.09 -8.14 -10.28 5.51 -1.35 14.26
10 1.797E-07 1.670E-07 1.990E-07 1.832E-07 2.067E-07 1.871E-07 8.45 -3.94 -10.76 6.36 -2.12 10.47
11 1.733E-07 1.635E-07 1.958E-07 1.799E-07 1.997E-07 1.824E-07 8.35 -5.00 -10.40 7.34 -1.41 9.47
12 1.605E-07 1.626E-07 1.953E-07 1.782E-07 1.975E-07 1.788E-07 9.76 -10.24 -9.06 9.23 -0.37 10.45
13 1.690E-07 1.626E-07 1.957E-07 1.779E-07 1.971E-07 1.805E-07 8.61 -6.34 -9.90 8.44 -1.41 9.21
14 1.684E-07 1.628E-07 1.963E-07 1.782E-07 1.971E-07 1.806E-07 8.71 -6.73 -9.85 8.71 -1.30 9.16
15 1.708E-07 1.630E-07 1.969E-07 1.786E-07 1.973E-07 1.813E-07 8.51 -5.80 -10.13 8.59 -1.48 8.82
20 1.597E-07 1.627E-07 1.985E-07 1.794E-07 1.970E-07 1.795E-07 10.21 -11.02 -9.33 10.61 -0.04 9.78
25 1.681E-07 1.614E-07 1.985E-07 1.791E-07 1.952E-07 1.804E-07 9.03 -6.86 -10.56 9.98 -0.74 8.18
30 1.684E-07 1.592E-07 1.973E-07 1.777E-07 1.923E-07 1.790E-07 8.91 -5.91 -11.06 10.22 -0.70 7.45
35 1.618E-07 1.565E-07 1.954E-07 1.757E-07 1.888E-07 1.756E-07 9.53 -7.87 -10.90 11.24 0.03 7.50
40 1.598E-07 1.536E-07 1.932E-07 1.734E-07 1.851E-07 1.730E-07 9.60 -7.64 -11.21 11.65 0.21 6.98
66

Table 38. UGD. Isotopic Composition in Cell 24 Deviation from Average Value, %.Burnup=40 MWd/kgHM
UGD. Isotopic Composition in Cell 24 Deviation from Average Value, %. Burnup=40 MWd/kgHM235U 236U 238Pu 239Pu 240Pu 241Pu 242Pu 135Xe 149Sm 155Gd 157Gd
MCU -0.79 0.71 -0.03 1.11 1.38 -0.99 6.77 -0.28 -7.08 -5.88 -7.64
TVS-M -2.60 0.13 0.03 -1.76 4.47 -4.38 6.04 -4.82 -9.18 -3.90 -11.21
WIMS8A 2.29 -2.47 -0.07 4.67 -0.32 6.50 1.15 2.55 5.75 6.16 11.65
HELIOS 0.42 2.61 0.07 -3.78 -8.00 0.97 -4.48 0.52 3.99 2.18 0.21
MULTICELL 0.67 -0.98 0.01 -0.23 2.46 -2.09 -9.48 2.03 6.52 1.44 6.98
R.M.S. % 1.82 1.90 0.05 3.18 4.80 4.11 6.96 2.92 7.52 4.86 9.60
67

Table 39. UGD. Isotopic Composition in Cell 24 vs Radius, Burnup=40 MWd/kgHM. 235U, atoms/barn*cm
UGD. Isotopic Composition in Cell 24 vs Radius, Burnup=40 MWd/kgHM. 235U, atoms/barn*cmRadius, cm 0.173 0.244 0.299 0.345 0.386Zone No. 1 2 3 4 5 AverageMCU 2.170E-04 2.103E-04 2.035E-04 1.967E-04 1.870E-04 2.029E-04TVS-M 2.142E-04 2.077E-04 2.000E-04 1.918E-04 1.823E-04 1.992E-04WIMS8A 2.243E-04 2.173E-04 2.100E-04 2.020E-04 1.925E-04 2.092E-04HELIOS 2.185E-04 2.128E-04 2.062E-04 1.991E-04 1.903E-04 2.054E-04MULTICELL 2.226E-04 2.149E-04 2.067E-04 1.978E-04 1.874E-04 2.059E-04Mean 2.193E-04 2.126E-04 2.053E-04 1.975E-04 1.879E-04 2.045E-04R.M.S. % 1.87 1.77 1.83 1.89 2.05 1.82
Table 40. UGD. Isotopic Composition in Cell 24 vs Radius, Burnup=40 MWd/kgHM. 239Pu, atoms/barn*cm
UGD. Isotopic Composition in Cell 24 vs Radius, Burnup=40 MWd/kgHM. 239Pu, atoms/barn*cmRadius, cm 0.173 0.244 0.299 0.345 0.386Zone No. 1 2 3 4 5 AverageMCU 1.084E-04 1.101E-04 1.171E-04 1.282E-04 2.030E-04 1.334E-04TVS-M 1.079E-04 1.104E-04 1.146E-04 1.250E-04 1.900E-04 1.296E-04WIMS8A 1.148E-04 1.174E-04 1.218E-04 1.334E-04 2.030E-04 1.381E-04HELIOS 1.021E-04 1.049E-04 1.100E-04 1.225E-04 1.951E-04 1.269E-04Mean 1.083E-04 1.107E-04 1.159E-04 1.273E-04 1.978E-04 1.320E-04R.M.S. % 4.79 4.63 4.23 3.70 3.22 3.67
68
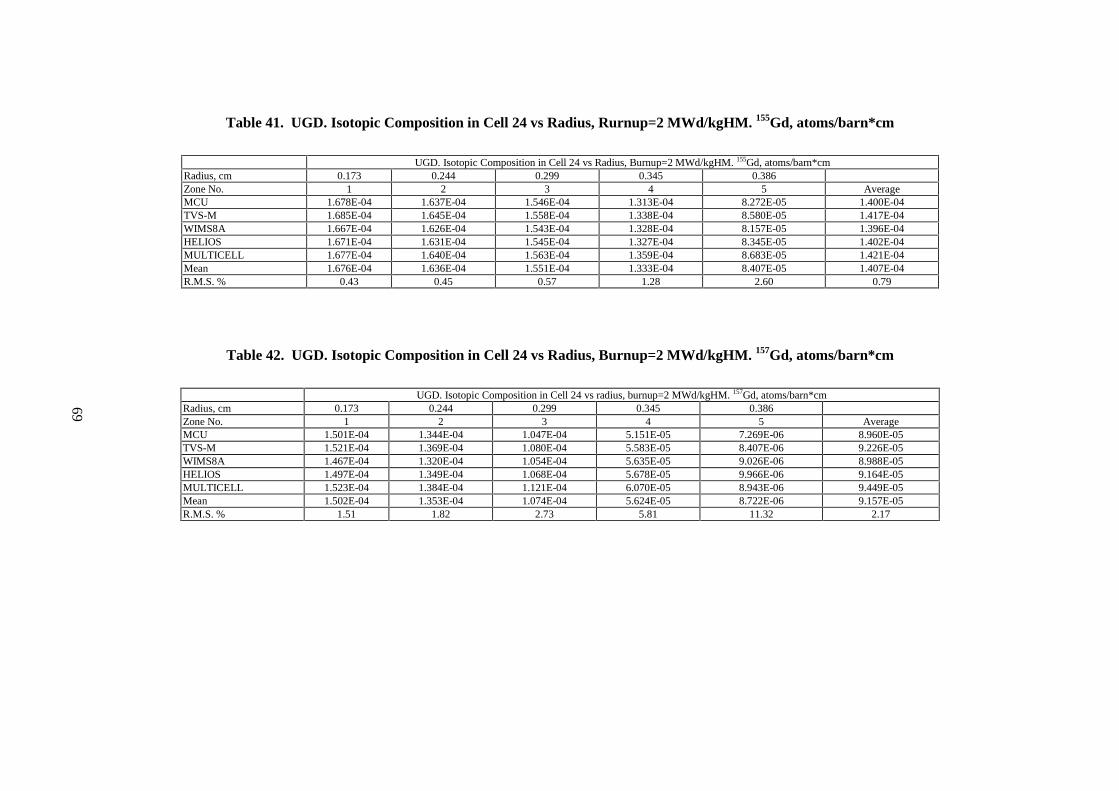
Table 41. UGD. Isotopic Composition in Cell 24 vs Radius, Rurnup=2 MWd/kgHM. 155Gd, atoms/barn*cm
UGD. Isotopic Composition in Cell 24 vs Radius, Burnup=2 MWd/kgHM. 155Gd, atoms/barn*cmRadius, cm 0.173 0.244 0.299 0.345 0.386Zone No. 1 2 3 4 5 AverageMCU 1.678E-04 1.637E-04 1.546E-04 1.313E-04 8.272E-05 1.400E-04TVS-M 1.685E-04 1.645E-04 1.558E-04 1.338E-04 8.580E-05 1.417E-04WIMS8A 1.667E-04 1.626E-04 1.543E-04 1.328E-04 8.157E-05 1.396E-04HELIOS 1.671E-04 1.631E-04 1.545E-04 1.327E-04 8.345E-05 1.402E-04MULTICELL 1.677E-04 1.640E-04 1.563E-04 1.359E-04 8.683E-05 1.421E-04Mean 1.676E-04 1.636E-04 1.551E-04 1.333E-04 8.407E-05 1.407E-04R.M.S. % 0.43 0.45 0.57 1.28 2.60 0.79
Table 42. UGD. Isotopic Composition in Cell 24 vs Radius, Burnup=2 MWd/kgHM. 157Gd, atoms/barn*cm
UGD. Isotopic Composition in Cell 24 vs radius, burnup=2 MWd/kgHM. 157Gd, atoms/barn*cmRadius, cm 0.173 0.244 0.299 0.345 0.386Zone No. 1 2 3 4 5 AverageMCU 1.501E-04 1.344E-04 1.047E-04 5.151E-05 7.269E-06 8.960E-05TVS-M 1.521E-04 1.369E-04 1.080E-04 5.583E-05 8.407E-06 9.226E-05WIMS8A 1.467E-04 1.320E-04 1.054E-04 5.635E-05 9.026E-06 8.988E-05HELIOS 1.497E-04 1.349E-04 1.068E-04 5.678E-05 9.966E-06 9.164E-05MULTICELL 1.523E-04 1.384E-04 1.121E-04 6.070E-05 8.943E-06 9.449E-05Mean 1.502E-04 1.353E-04 1.074E-04 5.624E-05 8.722E-06 9.157E-05R.M.S. % 1.51 1.82 2.73 5.81 11.32 2.17
69

Table 43. UGD. Reactivity Effects, 100*(Kinit-Kfin)
Initial State Final State Comment Burnup MCU TVS-M WIMS8A HELIOS MULTICELL MCNP4B Mean R.M.S. %
0 -4.26 -4.15 -3.67 -3.95 -4.13 -4.03 -5.69
20 -4.06 -3.76 -3.98 -3.92 -4.08 -3.96 -3.23
S1 S2 Xe+SmCb>0
40 -3.41 -3.00 -3.33 -3.30 -3.39 -3.29 -5.02
0 -6.00 -6.04 -5.88 -5.96 -5.99 -6.06 -5.99 -1.10
20 -5.46 -5.56 -5.36 -5.48 -5.54 -5.48 -1.39
S3 S4 Boron0.6 g/kg
40 -5.01 -4.94 -4.75 -4.91 -4.96 -4.91 -2.04
0 1.20 1.32 1.50 1.44 1.43 1.25 1.36 8.74
20 1.41 1.47 1.60 1.60 1.54 1.52 5.55
S3 S2 T fuelCb>0
40 1.30 1.35 1.44 1.50 1.41 1.40 5.57
0 -6.98 -7.09 -6.89 -6.91 -6.46 -7.04 -6.90 -3.27
20 -6.96 -6.54 -6.95 -6.63 -6.49 -6.72 -3.36
S4 S5 T allCb=0
40 -5.69 -5.16 -5.63 -5.15 -5.00 -5.33 -5.87
70
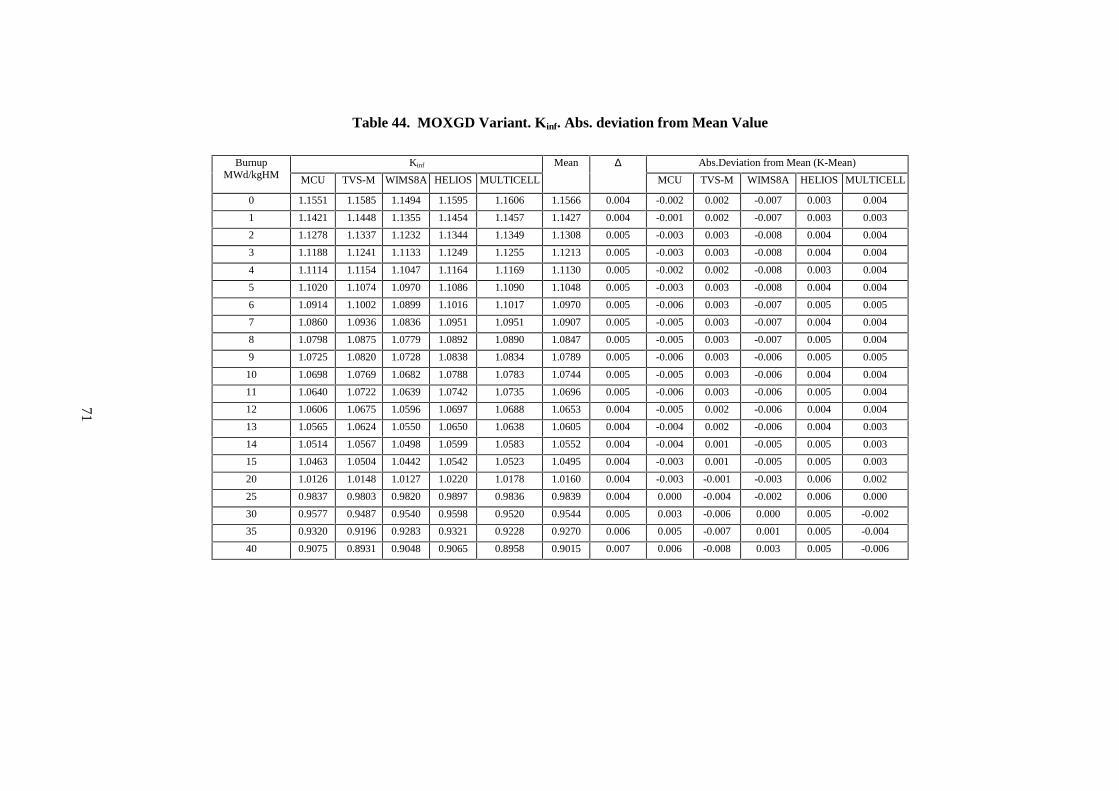
Table 44. MOXGD Variant. Kinf. Abs. deviation from Mean Value
Kinf Abs.Deviation from Mean (K-Mean)BurnupMWd/kgHM MCU TVS-M WIMS8A HELIOS MULTICELL
Mean ∆MCU TVS-M WIMS8A HELIOS MULTICELL
0 1.1551 1.1585 1.1494 1.1595 1.1606 1.1566 0.004 -0.002 0.002 -0.007 0.003 0.004
1 1.1421 1.1448 1.1355 1.1454 1.1457 1.1427 0.004 -0.001 0.002 -0.007 0.003 0.003
2 1.1278 1.1337 1.1232 1.1344 1.1349 1.1308 0.005 -0.003 0.003 -0.008 0.004 0.004
3 1.1188 1.1241 1.1133 1.1249 1.1255 1.1213 0.005 -0.003 0.003 -0.008 0.004 0.004
4 1.1114 1.1154 1.1047 1.1164 1.1169 1.1130 0.005 -0.002 0.002 -0.008 0.003 0.004
5 1.1020 1.1074 1.0970 1.1086 1.1090 1.1048 0.005 -0.003 0.003 -0.008 0.004 0.004
6 1.0914 1.1002 1.0899 1.1016 1.1017 1.0970 0.005 -0.006 0.003 -0.007 0.005 0.005
7 1.0860 1.0936 1.0836 1.0951 1.0951 1.0907 0.005 -0.005 0.003 -0.007 0.004 0.004
8 1.0798 1.0875 1.0779 1.0892 1.0890 1.0847 0.005 -0.005 0.003 -0.007 0.005 0.004
9 1.0725 1.0820 1.0728 1.0838 1.0834 1.0789 0.005 -0.006 0.003 -0.006 0.005 0.005
10 1.0698 1.0769 1.0682 1.0788 1.0783 1.0744 0.005 -0.005 0.003 -0.006 0.004 0.004
11 1.0640 1.0722 1.0639 1.0742 1.0735 1.0696 0.005 -0.006 0.003 -0.006 0.005 0.004
12 1.0606 1.0675 1.0596 1.0697 1.0688 1.0653 0.004 -0.005 0.002 -0.006 0.004 0.004
13 1.0565 1.0624 1.0550 1.0650 1.0638 1.0605 0.004 -0.004 0.002 -0.006 0.004 0.003
14 1.0514 1.0567 1.0498 1.0599 1.0583 1.0552 0.004 -0.004 0.001 -0.005 0.005 0.003
15 1.0463 1.0504 1.0442 1.0542 1.0523 1.0495 0.004 -0.003 0.001 -0.005 0.005 0.003
20 1.0126 1.0148 1.0127 1.0220 1.0178 1.0160 0.004 -0.003 -0.001 -0.003 0.006 0.002
25 0.9837 0.9803 0.9820 0.9897 0.9836 0.9839 0.004 0.000 -0.004 -0.002 0.006 0.000
30 0.9577 0.9487 0.9540 0.9598 0.9520 0.9544 0.005 0.003 -0.006 0.000 0.005 -0.002
35 0.9320 0.9196 0.9283 0.9321 0.9228 0.9270 0.006 0.005 -0.007 0.001 0.005 -0.004
40 0.9075 0.8931 0.9048 0.9065 0.8958 0.9015 0.007 0.006 -0.008 0.003 0.005 -0.006
71

Figure 2. MOXGD Variant. Kinf vs Burnup
�����
������
������
������
������
������
������
������
������
� � �� �� �� �� �� �� ��
%XUQXS��0:G�NJ
.LQI
0&8
796�0
:,06�$
+(/,26
08/7,&(//
72
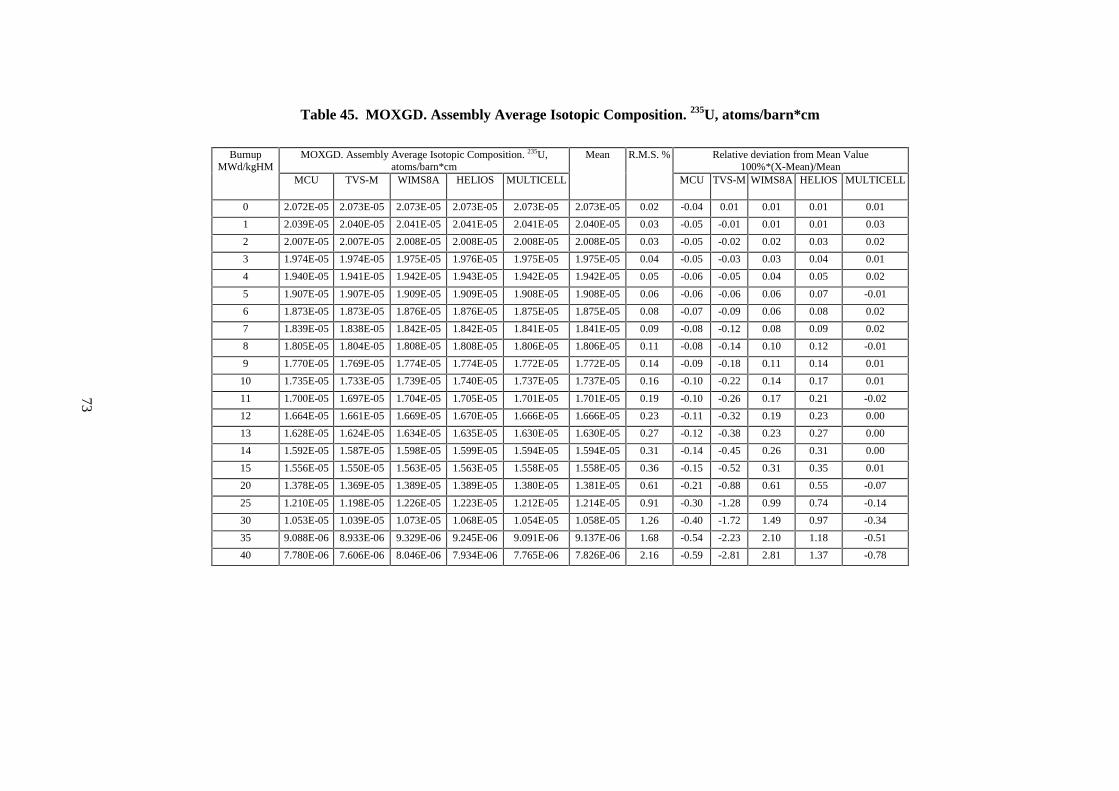
Table 45. MOXGD. Assembly Average Isotopic Composition. 235U, atoms/barn*cm
MOXGD. Assembly Average Isotopic Composition. 235U,atoms/barn*cm
Relative deviation from Mean Value100%*(X-Mean)/Mean
BurnupMWd/kgHM
MCU TVS-M WIMS8A HELIOS MULTICELL
Mean R.M.S. %
MCU TVS-M WIMS8A HELIOS MULTICELL
0 2.072E-05 2.073E-05 2.073E-05 2.073E-05 2.073E-05 2.073E-05 0.02 -0.04 0.01 0.01 0.01 0.01
1 2.039E-05 2.040E-05 2.041E-05 2.041E-05 2.041E-05 2.040E-05 0.03 -0.05 -0.01 0.01 0.01 0.03
2 2.007E-05 2.007E-05 2.008E-05 2.008E-05 2.008E-05 2.008E-05 0.03 -0.05 -0.02 0.02 0.03 0.02
3 1.974E-05 1.974E-05 1.975E-05 1.976E-05 1.975E-05 1.975E-05 0.04 -0.05 -0.03 0.03 0.04 0.01
4 1.940E-05 1.941E-05 1.942E-05 1.943E-05 1.942E-05 1.942E-05 0.05 -0.06 -0.05 0.04 0.05 0.02
5 1.907E-05 1.907E-05 1.909E-05 1.909E-05 1.908E-05 1.908E-05 0.06 -0.06 -0.06 0.06 0.07 -0.01
6 1.873E-05 1.873E-05 1.876E-05 1.876E-05 1.875E-05 1.875E-05 0.08 -0.07 -0.09 0.06 0.08 0.02
7 1.839E-05 1.838E-05 1.842E-05 1.842E-05 1.841E-05 1.841E-05 0.09 -0.08 -0.12 0.08 0.09 0.02
8 1.805E-05 1.804E-05 1.808E-05 1.808E-05 1.806E-05 1.806E-05 0.11 -0.08 -0.14 0.10 0.12 -0.01
9 1.770E-05 1.769E-05 1.774E-05 1.774E-05 1.772E-05 1.772E-05 0.14 -0.09 -0.18 0.11 0.14 0.01
10 1.735E-05 1.733E-05 1.739E-05 1.740E-05 1.737E-05 1.737E-05 0.16 -0.10 -0.22 0.14 0.17 0.01
11 1.700E-05 1.697E-05 1.704E-05 1.705E-05 1.701E-05 1.701E-05 0.19 -0.10 -0.26 0.17 0.21 -0.02
12 1.664E-05 1.661E-05 1.669E-05 1.670E-05 1.666E-05 1.666E-05 0.23 -0.11 -0.32 0.19 0.23 0.00
13 1.628E-05 1.624E-05 1.634E-05 1.635E-05 1.630E-05 1.630E-05 0.27 -0.12 -0.38 0.23 0.27 0.00
14 1.592E-05 1.587E-05 1.598E-05 1.599E-05 1.594E-05 1.594E-05 0.31 -0.14 -0.45 0.26 0.31 0.00
15 1.556E-05 1.550E-05 1.563E-05 1.563E-05 1.558E-05 1.558E-05 0.36 -0.15 -0.52 0.31 0.35 0.01
20 1.378E-05 1.369E-05 1.389E-05 1.389E-05 1.380E-05 1.381E-05 0.61 -0.21 -0.88 0.61 0.55 -0.07
25 1.210E-05 1.198E-05 1.226E-05 1.223E-05 1.212E-05 1.214E-05 0.91 -0.30 -1.28 0.99 0.74 -0.14
30 1.053E-05 1.039E-05 1.073E-05 1.068E-05 1.054E-05 1.058E-05 1.26 -0.40 -1.72 1.49 0.97 -0.34
35 9.088E-06 8.933E-06 9.329E-06 9.245E-06 9.091E-06 9.137E-06 1.68 -0.54 -2.23 2.10 1.18 -0.51
40 7.780E-06 7.606E-06 8.046E-06 7.934E-06 7.765E-06 7.826E-06 2.16 -0.59 -2.81 2.81 1.37 -0.78
73

Table 46. MOXGD. Assembly Average Isotopic Composition. 236U, atoms/barn*cm
MOXGD. Assembly Average Isotopic Composition. 236U,atoms/barn*cm
Relative Deviation from Mean Value100%*(X-Mean)/Mean
BurnupMWd/kgHM
MCU TVS-M WIMS8A HELIOS MULTICELL
Mean R.M.S. %
MCU TVS-M WIMS8A HELIOS MULTICELL
0 0.000E+00 0.000E+00 0.000E+00 0.000E+00 0.000E+00 0.000E+00 0.00 0.00 0.00 0.00 0.00 0.00
1 7.415E-08 7.427E-08 7.368E-08 7.673E-08 7.414E-08 7.459E-08 1.63 -0.59 -0.43 -1.23 2.86 -0.61
2 1.484E-07 1.483E-07 1.473E-07 1.532E-07 1.481E-07 1.490E-07 1.57 -0.43 -0.50 -1.19 2.76 -0.63
3 2.222E-07 2.221E-07 2.206E-07 2.292E-07 2.219E-07 2.232E-07 1.54 -0.44 -0.51 -1.17 2.70 -0.58
4 2.960E-07 2.956E-07 2.935E-07 3.050E-07 2.955E-07 2.971E-07 1.51 -0.38 -0.52 -1.20 2.64 -0.54
5 3.692E-07 3.688E-07 3.662E-07 3.803E-07 3.687E-07 3.706E-07 1.49 -0.38 -0.51 -1.20 2.61 -0.52
6 4.423E-07 4.417E-07 4.384E-07 4.552E-07 4.417E-07 4.439E-07 1.47 -0.36 -0.49 -1.22 2.56 -0.49
7 5.150E-07 5.143E-07 5.103E-07 5.298E-07 5.144E-07 5.168E-07 1.45 -0.35 -0.47 -1.24 2.52 -0.46
8 5.871E-07 5.867E-07 5.819E-07 6.039E-07 5.868E-07 5.893E-07 1.43 -0.37 -0.44 -1.26 2.48 -0.42
9 6.590E-07 6.588E-07 6.530E-07 6.776E-07 6.589E-07 6.615E-07 1.42 -0.38 -0.40 -1.27 2.44 -0.39
10 7.307E-07 7.306E-07 7.238E-07 7.509E-07 7.306E-07 7.333E-07 1.40 -0.36 -0.37 -1.30 2.39 -0.37
11 8.022E-07 8.022E-07 7.942E-07 8.238E-07 8.021E-07 8.049E-07 1.38 -0.33 -0.33 -1.33 2.34 -0.35
12 8.734E-07 8.736E-07 8.642E-07 8.962E-07 8.732E-07 8.761E-07 1.36 -0.31 -0.29 -1.36 2.29 -0.33
13 9.440E-07 9.445E-07 9.337E-07 9.681E-07 9.440E-07 9.468E-07 1.34 -0.31 -0.24 -1.39 2.24 -0.30
14 1.014E-06 1.015E-06 1.002E-06 1.039E-06 1.014E-06 1.017E-06 1.33 -0.28 -0.20 -1.43 2.20 -0.29
15 1.083E-06 1.085E-06 1.070E-06 1.110E-06 1.084E-06 1.086E-06 1.32 -0.30 -0.16 -1.48 2.16 -0.22
20 1.411E-06 1.413E-06 1.391E-06 1.445E-06 1.414E-06 1.415E-06 1.36 -0.26 -0.11 -1.68 2.11 -0.07
25 1.705E-06 1.706E-06 1.678E-06 1.746E-06 1.710E-06 1.709E-06 1.41 -0.21 -0.18 -1.81 2.15 0.06
30 1.962E-06 1.961E-06 1.929E-06 2.010E-06 1.970E-06 1.966E-06 1.48 -0.22 -0.30 -1.89 2.23 0.18
35 2.183E-06 2.177E-06 2.145E-06 2.238E-06 2.193E-06 2.187E-06 1.54 -0.18 -0.45 -1.94 2.32 0.26
40 2.368E-06 2.357E-06 2.326E-06 2.430E-06 2.379E-06 2.372E-06 1.60 -0.17 -0.64 -1.93 2.44 0.30
74

Table 47. MOXGD. Assembly Average Isotopic Composition. 238U, atoms/barn*cm
MOXGD. Assembly Average Isotopic Composition. 238U,atoms/barn*cm
Relative Deviation from Mean Value100%*(X-Mean)/Mean
BurnupMWd/kgHM
MCU TVS-M WIMS8A HELIOS MULTICELL
Mean R.M.S. %
MCU TVS-M WIMS8A HELIOS MULTICELL
0 6.254E-03 6.257E-03 6.257E-03 6.257E-03 6.257E-03 6.256E-03 0.02 -0.03 0.01 0.01 0.01 0.01
1 6.250E-03 6.253E-03 6.253E-03 6.253E-03 6.253E-03 6.252E-03 0.02 -0.04 0.01 0.01 0.01 0.01
2 6.245E-03 6.248E-03 6.248E-03 6.249E-03 6.248E-03 6.248E-03 0.02 -0.04 0.01 0.01 0.01 0.01
3 6.241E-03 6.244E-03 6.244E-03 6.244E-03 6.244E-03 6.243E-03 0.02 -0.04 0.01 0.00 0.01 0.01
4 6.237E-03 6.240E-03 6.239E-03 6.240E-03 6.240E-03 6.239E-03 0.02 -0.04 0.01 0.00 0.01 0.01
5 6.232E-03 6.235E-03 6.235E-03 6.236E-03 6.236E-03 6.235E-03 0.02 -0.04 0.01 0.00 0.01 0.02
6 6.228E-03 6.231E-03 6.230E-03 6.232E-03 6.231E-03 6.230E-03 0.02 -0.04 0.01 0.00 0.02 0.01
7 6.223E-03 6.227E-03 6.226E-03 6.227E-03 6.227E-03 6.226E-03 0.02 -0.04 0.01 0.00 0.02 0.02
8 6.219E-03 6.222E-03 6.221E-03 6.223E-03 6.222E-03 6.221E-03 0.02 -0.04 0.02 0.00 0.02 0.01
9 6.214E-03 6.218E-03 6.217E-03 6.218E-03 6.218E-03 6.217E-03 0.03 -0.04 0.01 -0.01 0.02 0.02
10 6.210E-03 6.213E-03 6.212E-03 6.214E-03 6.214E-03 6.213E-03 0.03 -0.05 0.01 -0.01 0.02 0.02
11 6.205E-03 6.209E-03 6.207E-03 6.209E-03 6.209E-03 6.208E-03 0.03 -0.05 0.01 -0.01 0.02 0.02
12 6.201E-03 6.204E-03 6.203E-03 6.205E-03 6.205E-03 6.203E-03 0.03 -0.05 0.01 -0.01 0.02 0.02
13 6.196E-03 6.200E-03 6.198E-03 6.201E-03 6.200E-03 6.199E-03 0.03 -0.05 0.01 -0.02 0.03 0.02
14 6.191E-03 6.195E-03 6.193E-03 6.196E-03 6.196E-03 6.194E-03 0.03 -0.05 0.01 -0.02 0.03 0.03
15 6.187E-03 6.191E-03 6.188E-03 6.191E-03 6.191E-03 6.190E-03 0.03 -0.05 0.02 -0.02 0.03 0.02
20 6.163E-03 6.167E-03 6.164E-03 6.168E-03 6.168E-03 6.166E-03 0.04 -0.05 0.02 -0.03 0.03 0.03
25 6.138E-03 6.142E-03 6.139E-03 6.144E-03 6.143E-03 6.141E-03 0.04 -0.06 0.02 -0.03 0.04 0.03
30 6.112E-03 6.117E-03 6.113E-03 6.119E-03 6.118E-03 6.116E-03 0.05 -0.06 0.02 -0.04 0.05 0.03
35 6.086E-03 6.091E-03 6.087E-03 6.093E-03 6.093E-03 6.090E-03 0.06 -0.07 0.02 -0.05 0.05 0.05
40 6.058E-03 6.064E-03 6.060E-03 6.067E-03 6.066E-03 6.063E-03 0.06 -0.07 0.01 -0.05 0.06 0.05
75

Table 48. MOXGD. Assembly Average Isotopic Composition. 239Pu, atoms/barn*cm
MOXGD. Assembly Average Isotopic Composition. 239Pu,atoms/barn*cm
Relative Deviation from Mean Value100%*(X-Mean)/Mean
BurnupMWd/kgHM
MCU TVS-M WIMS8A HELIOS MULTICELL
Mean R.M.S. %
MCU TVS-M WIMS8A HELIOS MULTICELL
0 2.056E-04 2.057E-04 2.057E-04 2.057E-04 2.057E-04 2.057E-04 0.02 -0.04 0.01 0.01 0.01 0.00
1 1.998E-04 1.999E-04 2.000E-04 2.000E-04 1.999E-04 1.999E-04 0.04 -0.06 0.01 0.04 0.02 -0.01
2 1.946E-04 1.948E-04 1.949E-04 1.948E-04 1.948E-04 1.948E-04 0.06 -0.07 0.00 0.08 -0.01 0.01
3 1.896E-04 1.897E-04 1.900E-04 1.896E-04 1.897E-04 1.897E-04 0.08 -0.08 -0.01 0.14 -0.04 -0.01
4 1.846E-04 1.847E-04 1.851E-04 1.846E-04 1.847E-04 1.848E-04 0.11 -0.08 -0.02 0.20 -0.07 -0.03
5 1.797E-04 1.798E-04 1.804E-04 1.797E-04 1.799E-04 1.799E-04 0.15 -0.10 -0.04 0.25 -0.10 -0.01
6 1.750E-04 1.751E-04 1.757E-04 1.749E-04 1.751E-04 1.752E-04 0.19 -0.10 -0.05 0.32 -0.13 -0.03
7 1.703E-04 1.704E-04 1.712E-04 1.702E-04 1.704E-04 1.705E-04 0.23 -0.10 -0.07 0.40 -0.16 -0.06
8 1.658E-04 1.658E-04 1.667E-04 1.656E-04 1.658E-04 1.659E-04 0.27 -0.11 -0.09 0.48 -0.20 -0.08
9 1.613E-04 1.613E-04 1.624E-04 1.611E-04 1.613E-04 1.615E-04 0.32 -0.11 -0.11 0.56 -0.23 -0.11
10 1.570E-04 1.569E-04 1.581E-04 1.567E-04 1.570E-04 1.571E-04 0.36 -0.12 -0.15 0.63 -0.28 -0.09
11 1.527E-04 1.526E-04 1.540E-04 1.524E-04 1.527E-04 1.529E-04 0.41 -0.11 -0.18 0.73 -0.31 -0.12
12 1.486E-04 1.484E-04 1.500E-04 1.482E-04 1.485E-04 1.487E-04 0.47 -0.11 -0.21 0.82 -0.35 -0.15
13 1.445E-04 1.443E-04 1.460E-04 1.441E-04 1.444E-04 1.447E-04 0.53 -0.11 -0.24 0.92 -0.38 -0.19
14 1.406E-04 1.403E-04 1.422E-04 1.401E-04 1.404E-04 1.407E-04 0.59 -0.11 -0.27 1.03 -0.42 -0.22
15 1.367E-04 1.364E-04 1.384E-04 1.362E-04 1.365E-04 1.369E-04 0.65 -0.11 -0.31 1.14 -0.46 -0.26
20 1.191E-04 1.187E-04 1.214E-04 1.184E-04 1.186E-04 1.192E-04 1.03 -0.09 -0.44 1.80 -0.74 -0.53
25 1.042E-04 1.036E-04 1.068E-04 1.031E-04 1.033E-04 1.042E-04 1.48 -0.03 -0.60 2.55 -1.06 -0.85
30 9.152E-05 9.088E-05 9.465E-05 9.026E-05 9.039E-05 9.154E-05 1.98 -0.02 -0.73 3.40 -1.40 -1.26
35 8.108E-05 8.046E-05 8.460E-05 7.971E-05 7.977E-05 8.112E-05 2.49 -0.06 -0.82 4.29 -1.74 -1.67
40 7.303E-05 7.207E-05 7.645E-05 7.119E-05 7.118E-05 7.278E-05 3.00 0.34 -0.99 5.04 -2.19 -2.20
76

Table 49. MOXGD. Assembly Average Isotopic Composition. 240Pu, atoms/barn*cm
MOXGD. Assembly Average Isotopic Composition. 240Pu,atoms/barn*cm
Relative Deviation from Mean Value100%*(X-Mean)/Mean
BurnupMWd/kgHM
MCU TVS-M WIMS8A HELIOS MULTICELL
Mean R.M.S. %
MCU TVS-M WIMS8A HELIOS MULTICELL
0 1.321E-05 1.322E-05 1.322E-05 1.322E-05 1.322E-05 1.322E-05 0.03 -0.05 0.01 0.01 0.01 0.03
1 1.545E-05 1.551E-05 1.543E-05 1.539E-05 1.545E-05 1.545E-05 0.27 0.05 0.39 -0.09 -0.38 0.03
2 1.758E-05 1.769E-05 1.753E-05 1.745E-05 1.757E-05 1.757E-05 0.51 0.10 0.73 -0.18 -0.67 0.02
3 1.961E-05 1.979E-05 1.953E-05 1.941E-05 1.959E-05 1.959E-05 0.70 0.14 1.02 -0.27 -0.91 0.02
4 2.154E-05 2.179E-05 2.143E-05 2.127E-05 2.153E-05 2.151E-05 0.87 0.13 1.28 -0.37 -1.12 0.08
5 2.338E-05 2.370E-05 2.324E-05 2.304E-05 2.337E-05 2.335E-05 1.03 0.15 1.51 -0.46 -1.30 0.09
6 2.514E-05 2.553E-05 2.496E-05 2.473E-05 2.513E-05 2.510E-05 1.17 0.16 1.72 -0.55 -1.47 0.13
7 2.680E-05 2.728E-05 2.660E-05 2.633E-05 2.681E-05 2.676E-05 1.30 0.13 1.93 -0.63 -1.61 0.18
8 2.839E-05 2.895E-05 2.815E-05 2.786E-05 2.841E-05 2.835E-05 1.42 0.13 2.11 -0.71 -1.74 0.21
9 2.990E-05 3.054E-05 2.962E-05 2.930E-05 2.993E-05 2.986E-05 1.53 0.14 2.28 -0.79 -1.87 0.24
10 3.133E-05 3.206E-05 3.102E-05 3.067E-05 3.138E-05 3.129E-05 1.64 0.12 2.45 -0.86 -1.99 0.29
11 3.268E-05 3.350E-05 3.234E-05 3.196E-05 3.276E-05 3.265E-05 1.74 0.09 2.60 -0.93 -2.09 0.34
12 3.396E-05 3.487E-05 3.360E-05 3.319E-05 3.406E-05 3.393E-05 1.84 0.07 2.75 -1.00 -2.20 0.37
13 3.517E-05 3.617E-05 3.478E-05 3.435E-05 3.530E-05 3.515E-05 1.93 0.06 2.89 -1.07 -2.30 0.42
14 3.632E-05 3.740E-05 3.589E-05 3.543E-05 3.647E-05 3.630E-05 2.02 0.04 3.02 -1.13 -2.39 0.46
15 3.739E-05 3.856E-05 3.694E-05 3.645E-05 3.757E-05 3.738E-05 2.11 0.03 3.15 -1.19 -2.48 0.50
20 4.169E-05 4.330E-05 4.117E-05 4.058E-05 4.204E-05 4.176E-05 2.46 -0.16 3.71 -1.41 -2.82 0.68
25 4.449E-05 4.654E-05 4.398E-05 4.325E-05 4.504E-05 4.466E-05 2.78 -0.38 4.21 -1.52 -3.16 0.85
30 4.602E-05 4.846E-05 4.557E-05 4.467E-05 4.675E-05 4.629E-05 3.08 -0.59 4.68 -1.56 -3.51 0.98
35 4.651E-05 4.927E-05 4.616E-05 4.504E-05 4.737E-05 4.687E-05 3.37 -0.76 5.11 -1.51 -3.90 1.07
40 4.600E-05 4.916E-05 4.595E-05 4.458E-05 4.711E-05 4.656E-05 3.67 -1.21 5.59 -1.31 -4.26 1.18
77
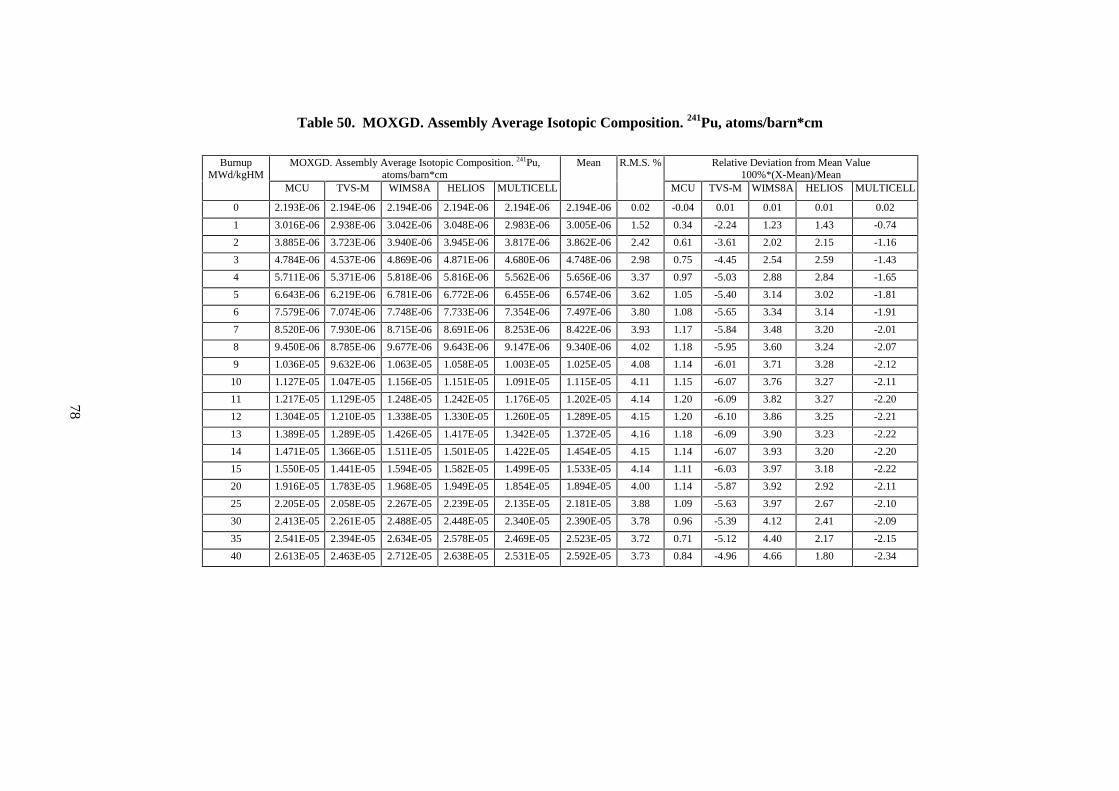
Table 50. MOXGD. Assembly Average Isotopic Composition. 241Pu, atoms/barn*cm
MOXGD. Assembly Average Isotopic Composition. 241Pu,atoms/barn*cm
Relative Deviation from Mean Value100%*(X-Mean)/Mean
BurnupMWd/kgHM
MCU TVS-M WIMS8A HELIOS MULTICELL
Mean R.M.S. %
MCU TVS-M WIMS8A HELIOS MULTICELL
0 2.193E-06 2.194E-06 2.194E-06 2.194E-06 2.194E-06 2.194E-06 0.02 -0.04 0.01 0.01 0.01 0.02
1 3.016E-06 2.938E-06 3.042E-06 3.048E-06 2.983E-06 3.005E-06 1.52 0.34 -2.24 1.23 1.43 -0.74
2 3.885E-06 3.723E-06 3.940E-06 3.945E-06 3.817E-06 3.862E-06 2.42 0.61 -3.61 2.02 2.15 -1.16
3 4.784E-06 4.537E-06 4.869E-06 4.871E-06 4.680E-06 4.748E-06 2.98 0.75 -4.45 2.54 2.59 -1.43
4 5.711E-06 5.371E-06 5.818E-06 5.816E-06 5.562E-06 5.656E-06 3.37 0.97 -5.03 2.88 2.84 -1.65
5 6.643E-06 6.219E-06 6.781E-06 6.772E-06 6.455E-06 6.574E-06 3.62 1.05 -5.40 3.14 3.02 -1.81
6 7.579E-06 7.074E-06 7.748E-06 7.733E-06 7.354E-06 7.497E-06 3.80 1.08 -5.65 3.34 3.14 -1.91
7 8.520E-06 7.930E-06 8.715E-06 8.691E-06 8.253E-06 8.422E-06 3.93 1.17 -5.84 3.48 3.20 -2.01
8 9.450E-06 8.785E-06 9.677E-06 9.643E-06 9.147E-06 9.340E-06 4.02 1.18 -5.95 3.60 3.24 -2.07
9 1.036E-05 9.632E-06 1.063E-05 1.058E-05 1.003E-05 1.025E-05 4.08 1.14 -6.01 3.71 3.28 -2.12
10 1.127E-05 1.047E-05 1.156E-05 1.151E-05 1.091E-05 1.115E-05 4.11 1.15 -6.07 3.76 3.27 -2.11
11 1.217E-05 1.129E-05 1.248E-05 1.242E-05 1.176E-05 1.202E-05 4.14 1.20 -6.09 3.82 3.27 -2.20
12 1.304E-05 1.210E-05 1.338E-05 1.330E-05 1.260E-05 1.289E-05 4.15 1.20 -6.10 3.86 3.25 -2.21
13 1.389E-05 1.289E-05 1.426E-05 1.417E-05 1.342E-05 1.372E-05 4.16 1.18 -6.09 3.90 3.23 -2.22
14 1.471E-05 1.366E-05 1.511E-05 1.501E-05 1.422E-05 1.454E-05 4.15 1.14 -6.07 3.93 3.20 -2.20
15 1.550E-05 1.441E-05 1.594E-05 1.582E-05 1.499E-05 1.533E-05 4.14 1.11 -6.03 3.97 3.18 -2.22
20 1.916E-05 1.783E-05 1.968E-05 1.949E-05 1.854E-05 1.894E-05 4.00 1.14 -5.87 3.92 2.92 -2.11
25 2.205E-05 2.058E-05 2.267E-05 2.239E-05 2.135E-05 2.181E-05 3.88 1.09 -5.63 3.97 2.67 -2.10
30 2.413E-05 2.261E-05 2.488E-05 2.448E-05 2.340E-05 2.390E-05 3.78 0.96 -5.39 4.12 2.41 -2.09
35 2.541E-05 2.394E-05 2.634E-05 2.578E-05 2.469E-05 2.523E-05 3.72 0.71 -5.12 4.40 2.17 -2.15
40 2.613E-05 2.463E-05 2.712E-05 2.638E-05 2.531E-05 2.592E-05 3.73 0.84 -4.96 4.66 1.80 -2.34
78

Table 51. MOXGD. Assembly Average Isotopic Composition. 242Pu, atoms/barn*cm
MOXGD. Assembly Average Isotopic Composition. 242Pu,atoms/barn*cm
Relative Deviation from Mean Value100%*(X-Mean)/Mean
BurnupMWd/kgHM
MCU TVS-M WIMS8A HELIOS MULTICELL
Mean R.M.S. %
MCU TVS-M WIMS8A HELIOS MULTICELL
0 0.000E+00 0.000E+00 0.000E+00 0.000E+00 0.000E+00 0.000E+00 0.00 0.00 0.00 0.00 0.00 0.00
1 3.256E-08 3.215E-08 2.920E-08 2.870E-08 2.904E-08 3.033E-08 6.15 7.35 6.01 -3.71 -5.39 -4.25
2 7.609E-08 7.435E-08 6.852E-08 6.737E-08 6.749E-08 7.076E-08 5.85 7.53 5.06 -3.17 -4.80 -4.63
3 1.312E-07 1.272E-07 1.186E-07 1.166E-07 1.159E-07 1.219E-07 5.65 7.62 4.37 -2.72 -4.36 -4.91
4 1.984E-07 1.913E-07 1.798E-07 1.768E-07 1.747E-07 1.842E-07 5.55 7.74 3.84 -2.37 -4.04 -5.16
5 2.783E-07 2.669E-07 2.526E-07 2.482E-07 2.442E-07 2.580E-07 5.51 7.87 3.43 -2.11 -3.82 -5.37
6 3.709E-07 3.544E-07 3.372E-07 3.311E-07 3.245E-07 3.436E-07 5.50 7.95 3.15 -1.88 -3.64 -5.57
7 4.765E-07 4.541E-07 4.336E-07 4.257E-07 4.159E-07 4.412E-07 5.50 8.02 2.93 -1.71 -3.51 -5.72
8 5.953E-07 5.660E-07 5.421E-07 5.319E-07 5.184E-07 5.507E-07 5.52 8.08 2.78 -1.56 -3.42 -5.87
9 7.270E-07 6.904E-07 6.627E-07 6.498E-07 6.320E-07 6.724E-07 5.53 8.12 2.68 -1.44 -3.36 -6.00
10 8.715E-07 8.272E-07 7.952E-07 7.794E-07 7.566E-07 8.060E-07 5.55 8.13 2.63 -1.33 -3.30 -6.13
11 1.029E-06 9.765E-07 9.398E-07 9.206E-07 8.923E-07 9.516E-07 5.57 8.14 2.61 -1.25 -3.27 -6.24
12 1.200E-06 1.138E-06 1.096E-06 1.073E-06 1.039E-06 1.109E-06 5.60 8.17 2.61 -1.19 -3.25 -6.34
13 1.383E-06 1.312E-06 1.264E-06 1.237E-06 1.196E-06 1.279E-06 5.65 8.20 2.63 -1.13 -3.24 -6.46
14 1.579E-06 1.498E-06 1.444E-06 1.412E-06 1.364E-06 1.460E-06 5.68 8.21 2.67 -1.08 -3.24 -6.55
15 1.788E-06 1.697E-06 1.635E-06 1.598E-06 1.542E-06 1.652E-06 5.72 8.22 2.72 -1.04 -3.25 -6.65
20 3.006E-06 2.859E-06 2.747E-06 2.684E-06 2.580E-06 2.775E-06 5.90 8.31 3.01 -1.00 -3.29 -7.03
25 4.496E-06 4.290E-06 4.103E-06 4.005E-06 3.834E-06 4.146E-06 6.17 8.45 3.48 -1.02 -3.39 -7.52
30 6.208E-06 5.950E-06 5.659E-06 5.518E-06 5.251E-06 5.717E-06 6.52 8.58 4.07 -1.01 -3.49 -8.16
35 8.082E-06 7.786E-06 7.364E-06 7.170E-06 6.769E-06 7.434E-06 6.93 8.71 4.73 -0.94 -3.55 -8.95
40 1.000E-05 9.739E-06 9.165E-06 8.907E-06 8.324E-06 9.227E-06 7.24 8.40 5.54 -0.68 -3.47 -9.79
79

Table 52. MOXGD. Assembly Average Isotopic Composition. 135Xe, atoms/barn*cm
MOXGD. Assembly Average Isotopic Composition. 135Xe,atoms/barn*cm
Relative Deviation from Mean Value100%*(X-Mean)/Mean
BurnupMWd/kgHM
MCU TVS-M WIMS8A HELIOS MULTICELL
Mean R.M.S. %
MCU TVS-M WIMS8A HELIOS MULTICELL
1 5.250E-09 5.032E-09 5.032E-09 5.122E-09 5.267E-09 5.141E-09 2.21 2.12 -2.10 -2.11 -0.37 2.46
2 5.199E-09 4.972E-09 4.985E-09 5.068E-09 5.215E-09 5.088E-09 2.26 2.18 -2.28 -2.02 -0.39 2.50
3 5.133E-09 4.910E-09 4.933E-09 5.013E-09 5.157E-09 5.029E-09 2.24 2.06 -2.37 -1.91 -0.32 2.54
4 5.072E-09 4.848E-09 4.879E-09 4.957E-09 5.096E-09 4.970E-09 2.24 2.04 -2.46 -1.84 -0.26 2.53
5 5.004E-09 4.785E-09 4.825E-09 4.901E-09 5.034E-09 4.910E-09 2.21 1.92 -2.54 -1.74 -0.18 2.53
6 4.952E-09 4.722E-09 4.784E-09 4.844E-09 4.971E-09 4.855E-09 2.20 2.00 -2.72 -1.46 -0.21 2.40
7 4.879E-09 4.659E-09 4.728E-09 4.787E-09 4.908E-09 4.792E-09 2.16 1.81 -2.78 -1.34 -0.10 2.42
8 4.819E-09 4.595E-09 4.671E-09 4.729E-09 4.844E-09 4.732E-09 2.18 1.84 -2.89 -1.28 -0.05 2.38
9 4.760E-09 4.530E-09 4.614E-09 4.671E-09 4.780E-09 4.671E-09 2.22 1.91 -3.02 -1.22 0.00 2.34
10 4.686E-09 4.464E-09 4.556E-09 4.611E-09 4.714E-09 4.606E-09 2.19 1.73 -3.08 -1.10 0.11 2.34
11 4.626E-09 4.398E-09 4.497E-09 4.551E-09 4.648E-09 4.544E-09 2.23 1.80 -3.21 -1.03 0.16 2.29
12 4.566E-09 4.333E-09 4.439E-09 4.491E-09 4.581E-09 4.482E-09 2.26 1.88 -3.33 -0.96 0.20 2.21
13 4.495E-09 4.270E-09 4.383E-09 4.432E-09 4.516E-09 4.419E-09 2.23 1.72 -3.38 -0.82 0.29 2.19
14 4.421E-09 4.209E-09 4.329E-09 4.375E-09 4.453E-09 4.357E-09 2.19 1.46 -3.41 -0.65 0.40 2.19
15 4.367E-09 4.150E-09 4.277E-09 4.320E-09 4.392E-09 4.301E-09 2.21 1.53 -3.51 -0.56 0.43 2.11
20 4.084E-09 3.887E-09 4.021E-09 4.110E-09 4.121E-09 4.045E-09 2.38 0.97 -3.90 -0.58 1.62 1.89
25 3.845E-09 3.646E-09 3.812E-09 3.874E-09 3.869E-09 3.809E-09 2.47 0.93 -4.28 0.08 1.70 1.57
30 3.609E-09 3.425E-09 3.619E-09 3.653E-09 3.635E-09 3.588E-09 2.58 0.58 -4.54 0.86 1.80 1.31
35 3.400E-09 3.224E-09 3.440E-09 3.447E-09 3.419E-09 3.386E-09 2.73 0.41 -4.79 1.60 1.80 0.98
40 3.252E-09 3.043E-09 3.277E-09 3.259E-09 3.223E-09 3.211E-09 2.99 1.28 -5.23 2.06 1.50 0.39
80
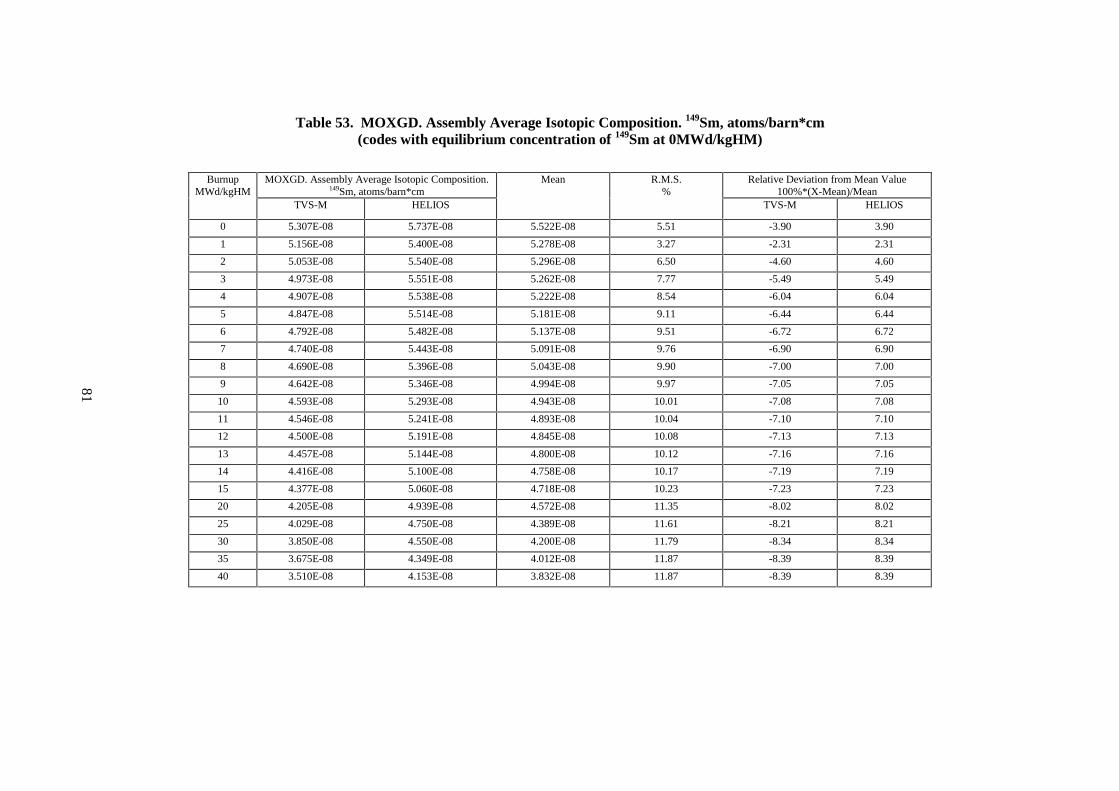
Table 53. MOXGD. Assembly Average Isotopic Composition. 149Sm, atoms/barn*cm(codes with equilibrium concentration of 149Sm at 0MWd/kgHM)
MOXGD. Assembly Average Isotopic Composition.149Sm, atoms/barn*cm
Relative Deviation from Mean Value100%*(X-Mean)/Mean
BurnupMWd/kgHM
TVS-M HELIOS
Mean R.M.S.%
TVS-M HELIOS
0 5.307E-08 5.737E-08 5.522E-08 5.51 -3.90 3.90
1 5.156E-08 5.400E-08 5.278E-08 3.27 -2.31 2.31
2 5.053E-08 5.540E-08 5.296E-08 6.50 -4.60 4.60
3 4.973E-08 5.551E-08 5.262E-08 7.77 -5.49 5.49
4 4.907E-08 5.538E-08 5.222E-08 8.54 -6.04 6.04
5 4.847E-08 5.514E-08 5.181E-08 9.11 -6.44 6.44
6 4.792E-08 5.482E-08 5.137E-08 9.51 -6.72 6.72
7 4.740E-08 5.443E-08 5.091E-08 9.76 -6.90 6.90
8 4.690E-08 5.396E-08 5.043E-08 9.90 -7.00 7.00
9 4.642E-08 5.346E-08 4.994E-08 9.97 -7.05 7.05
10 4.593E-08 5.293E-08 4.943E-08 10.01 -7.08 7.08
11 4.546E-08 5.241E-08 4.893E-08 10.04 -7.10 7.10
12 4.500E-08 5.191E-08 4.845E-08 10.08 -7.13 7.13
13 4.457E-08 5.144E-08 4.800E-08 10.12 -7.16 7.16
14 4.416E-08 5.100E-08 4.758E-08 10.17 -7.19 7.19
15 4.377E-08 5.060E-08 4.718E-08 10.23 -7.23 7.23
20 4.205E-08 4.939E-08 4.572E-08 11.35 -8.02 8.02
25 4.029E-08 4.750E-08 4.389E-08 11.61 -8.21 8.21
30 3.850E-08 4.550E-08 4.200E-08 11.79 -8.34 8.34
35 3.675E-08 4.349E-08 4.012E-08 11.87 -8.39 8.39
40 3.510E-08 4.153E-08 3.832E-08 11.87 -8.39 8.39
81

Table 54. MOXGD. Assembly Average Isotopic Composition. 149Sm, atoms/barn*cm(codes with zero concentration of 149Sm at 0MWd/kgHM)
MOXGD. Assembly Average Isotopic Composition. 149Sm,atoms/barn*cm
Relative Deviation from Mean Value100%*(X-Mean)/Mean
BurnupMWd/kgHM
MCU WIMS8A MULTICELL
Mean R.M.S. %
MCU WIMS8A MULTICELL
1 3.826E-08 3.837E-08 3.726E-08 3.796E-08 1.61 0.79 1.06 -1.85
2 4.950E-08 4.920E-08 4.776E-08 4.882E-08 1.90 1.39 0.78 -2.17
3 5.214E-08 5.181E-08 5.035E-08 5.143E-08 1.85 1.37 0.74 -2.11
4 5.277E-08 5.260E-08 5.120E-08 5.219E-08 1.65 1.11 0.79 -1.90
5 5.287E-08 5.287E-08 5.155E-08 5.243E-08 1.46 0.84 0.84 -1.68
6 5.286E-08 5.290E-08 5.168E-08 5.248E-08 1.32 0.72 0.80 -1.53
7 5.374E-08 5.277E-08 5.166E-08 5.272E-08 1.98 1.93 0.08 -2.02
8 5.329E-08 5.251E-08 5.150E-08 5.243E-08 1.71 1.63 0.15 -1.78
9 5.267E-08 5.216E-08 5.125E-08 5.203E-08 1.38 1.23 0.26 -1.49
10 5.191E-08 5.177E-08 5.093E-08 5.154E-08 1.03 0.73 0.45 -1.18
11 5.130E-08 5.135E-08 5.058E-08 5.108E-08 0.84 0.43 0.54 -0.97
12 5.065E-08 5.094E-08 5.021E-08 5.060E-08 0.73 0.10 0.67 -0.77
13 5.004E-08 5.056E-08 4.986E-08 5.015E-08 0.72 -0.23 0.81 -0.58
14 4.930E-08 5.020E-08 4.953E-08 4.968E-08 0.95 -0.76 1.06 -0.30
15 4.889E-08 4.988E-08 4.922E-08 4.933E-08 1.02 -0.89 1.11 -0.22
20 4.681E-08 4.846E-08 4.786E-08 4.771E-08 1.75 -1.89 1.57 0.32
25 4.449E-08 4.689E-08 4.625E-08 4.588E-08 2.71 -3.03 2.22 0.81
30 4.196E-08 4.521E-08 4.445E-08 4.387E-08 3.88 -4.37 3.05 1.31
35 3.958E-08 4.350E-08 4.255E-08 4.188E-08 4.88 -5.48 3.88 1.60
40 3.818E-08 4.183E-08 4.067E-08 4.023E-08 4.64 -5.09 3.99 1.10
82

Table 55. MOXGD. Assembly Average Isotopic Composition. 155Gd, atoms/barn*cm
MOXGD. Assembly Average Isotopic Composition. 155Gd,atoms/barn*cm
Relative Deviation from Mean Value100%*(X-Mean)/Mean
BurnupMWd/kgHM
MCU TVS-M WIMS8A HELIOS MULTICELL
Mean R.M.S. %
MCU TVS-M WIMS8A HELIOS MULTICELL
0 2.158E-06 2.159E-06 2.159E-06 2.159E-06 2.159E-06 2.159E-06 0.02 -0.04 0.01 0.01 0.01 0.00
1 2.023E-06 2.024E-06 2.021E-06 2.022E-06 2.020E-06 2.022E-06 0.08 0.03 0.10 -0.05 0.01 -0.09
2 1.873E-06 1.873E-06 1.867E-06 1.872E-06 1.870E-06 1.871E-06 0.13 0.09 0.13 -0.19 0.03 -0.06
3 1.709E-06 1.707E-06 1.701E-06 1.709E-06 1.706E-06 1.707E-06 0.20 0.15 0.05 -0.32 0.16 -0.04
4 1.533E-06 1.530E-06 1.526E-06 1.539E-06 1.531E-06 1.532E-06 0.31 0.07 -0.12 -0.37 0.46 -0.04
5 1.352E-06 1.347E-06 1.346E-06 1.364E-06 1.353E-06 1.352E-06 0.53 -0.02 -0.43 -0.45 0.85 0.04
6 1.170E-06 1.162E-06 1.166E-06 1.188E-06 1.174E-06 1.172E-06 0.85 -0.16 -0.84 -0.53 1.38 0.15
7 9.914E-07 9.813E-07 9.885E-07 1.015E-06 9.978E-07 9.949E-07 1.29 -0.34 -1.37 -0.64 2.05 0.30
8 8.179E-07 8.063E-07 8.169E-07 8.477E-07 8.283E-07 8.234E-07 1.90 -0.67 -2.08 -0.80 2.95 0.59
9 6.547E-07 6.405E-07 6.541E-07 6.883E-07 6.681E-07 6.611E-07 2.73 -0.98 -3.11 -1.06 4.10 1.05
10 5.015E-07 4.870E-07 5.034E-07 5.396E-07 5.195E-07 5.102E-07 3.93 -1.70 -4.54 -1.34 5.76 1.82
11 3.642E-07 3.492E-07 3.685E-07 4.048E-07 3.854E-07 3.744E-07 5.70 -2.72 -6.74 -1.59 8.12 2.93
12 2.490E-07 2.321E-07 2.542E-07 2.876E-07 2.691E-07 2.584E-07 8.13 -3.62 -10.19 -1.62 11.30 4.14
13 1.582E-07 1.417E-07 1.647E-07 1.921E-07 1.752E-07 1.664E-07 11.31 -4.91 -14.82 -1.02 15.45 5.31
14 9.387E-08 8.011E-08 1.007E-07 1.207E-07 1.065E-07 1.004E-07 14.98 -6.48 -20.19 0.31 20.26 6.10
15 5.258E-08 4.272E-08 5.890E-08 7.208E-08 6.131E-08 5.752E-08 18.88 -8.59 -25.72 2.39 25.32 6.59
20 4.122E-09 3.280E-09 5.791E-09 5.991E-09 4.965E-09 4.830E-09 23.59 -14.65 -32.08 19.91 24.03 2.80
25 2.352E-09 2.256E-09 3.676E-09 3.164E-09 2.990E-09 2.888E-09 20.44 -18.54 -21.86 27.30 9.55 3.55
30 2.136E-09 2.083E-09 3.584E-09 3.080E-09 2.869E-09 2.750E-09 23.28 -22.32 -24.27 30.31 11.97 4.31
35 1.970E-09 1.929E-09 3.558E-09 3.086E-09 2.792E-09 2.667E-09 26.61 -26.13 -27.66 33.39 15.71 4.68
40 1.876E-09 1.785E-09 3.536E-09 3.103E-09 2.714E-09 2.603E-09 29.32 -27.93 -31.40 35.84 19.23 4.27
83

Table 56. MOXGD. Assembly Average Isotopic Composition. 157Gd, atoms/barn*cm
MOXGD. Assembly Average Isotopic Composition. 155Gd,atoms/barn*cm
Relative Deviation from Mean Value100%*(X-Mean)/Mean
BurnupMWd/kgHM
MCU TVS-M WIMS8A HELIOS MULTICELL
Mean R.M.S. %
MCU TVS-M WIMS8A HELIOS MULTICELL
0 2.267E-06 2.269E-06 2.269E-06 2.269E-06 2.269E-06 2.268E-06 0.03 -0.04 0.01 0.01 0.00 0.03
1 1.896E-06 1.892E-06 1.898E-06 1.910E-06 1.901E-06 1.899E-06 0.34 -0.16 -0.37 -0.09 0.53 0.08
2 1.558E-06 1.551E-06 1.561E-06 1.583E-06 1.569E-06 1.564E-06 0.78 -0.41 -0.85 -0.23 1.19 0.30
3 1.257E-06 1.248E-06 1.260E-06 1.290E-06 1.273E-06 1.266E-06 1.28 -0.67 -1.37 -0.45 1.93 0.57
4 9.920E-07 9.838E-07 9.953E-07 1.031E-06 1.014E-06 1.003E-06 1.90 -1.12 -1.94 -0.79 2.78 1.07
5 7.631E-07 7.538E-07 7.644E-07 8.036E-07 7.868E-07 7.743E-07 2.63 -1.45 -2.66 -1.29 3.78 1.61
6 5.672E-07 5.562E-07 5.661E-07 6.066E-07 5.910E-07 5.774E-07 3.59 -1.77 -3.68 -1.97 5.06 2.35
7 4.030E-07 3.899E-07 3.995E-07 4.392E-07 4.251E-07 4.113E-07 4.91 -2.03 -5.21 -2.88 6.77 3.34
8 2.667E-07 2.545E-07 2.643E-07 3.008E-07 2.884E-07 2.749E-07 6.92 -2.99 -7.44 -3.87 9.41 4.89
9 1.616E-07 1.498E-07 1.603E-07 1.912E-07 1.806E-07 1.687E-07 9.94 -4.21 -11.21 -4.97 13.32 7.06
10 8.578E-08 7.574E-08 8.690E-08 1.099E-07 1.012E-07 9.190E-08 14.73 -6.65 -17.59 -5.44 19.56 10.12
11 3.946E-08 3.123E-08 4.176E-08 5.579E-08 4.929E-08 4.350E-08 21.64 -9.29 -28.22 -4.02 28.24 13.30
12 1.688E-08 1.125E-08 1.913E-08 2.553E-08 2.158E-08 1.887E-08 28.25 -10.54 -40.39 1.37 35.24 14.33
13 8.566E-09 5.248E-09 1.034E-08 1.220E-08 1.060E-08 9.391E-09 28.22 -8.78 -44.12 10.09 29.93 12.88
14 5.943E-09 3.888E-09 7.657E-09 7.707E-09 7.387E-09 6.516E-09 25.11 -8.80 -40.33 17.51 18.27 13.36
15 5.407E-09 3.498E-09 6.898E-09 6.442E-09 6.526E-09 5.754E-09 23.94 -6.03 -39.21 19.88 11.95 13.42
20 4.872E-09 3.052E-09 6.312E-09 5.710E-09 5.809E-09 5.151E-09 24.89 -5.42 -40.74 22.55 10.85 12.77
25 4.397E-09 2.880E-09 6.195E-09 5.511E-09 5.629E-09 4.922E-09 26.71 -10.66 -41.49 25.86 11.95 14.36
30 4.100E-09 2.722E-09 6.139E-09 5.422E-09 5.524E-09 4.781E-09 28.65 -14.26 -43.06 28.38 13.40 15.53
35 3.809E-09 2.571E-09 6.114E-09 5.381E-09 5.471E-09 4.669E-09 31.00 -18.43 -44.93 30.94 15.24 17.17
40 3.708E-09 2.429E-09 6.123E-09 5.383E-09 5.464E-09 4.622E-09 32.78 -19.76 -47.43 32.48 16.48 18.23
84

Table 57. MOXGD. Assembly Average Isotopic Composition Deviation from Average Value, %.Burnup=40 MWd/kgHM
MOXGD. Assembly Average Isotopic Composition Deviation from Average Value, %. Burnup=40 MWd/kgHM235U 236U 238Pu 239Pu 240Pu 241Pu 242Pu 135Xe 149Sm
MCU -0.59 -0.17 -0.07 0.34 -1.21 0.84 8.40 1.28 -3.25
TVS-M -2.81 -0.64 0.01 -0.99 5.59 -4.96 5.54 -5.23 -11.05
WIMS8A 2.81 -1.93 -0.05 5.04 -1.31 4.66 -0.68 2.06 6.01
HELIOS 1.37 2.44 0.06 -2.19 -4.26 1.80 -3.47 1.50 5.24
MULTICELL -0.78 0.30 0.05 -2.20 1.18 -2.34 -9.79 0.39 3.06
R.M.S. % 2.16 1.60 0.06 3.00 3.67 3.73 7.24 2.99 7.17
85
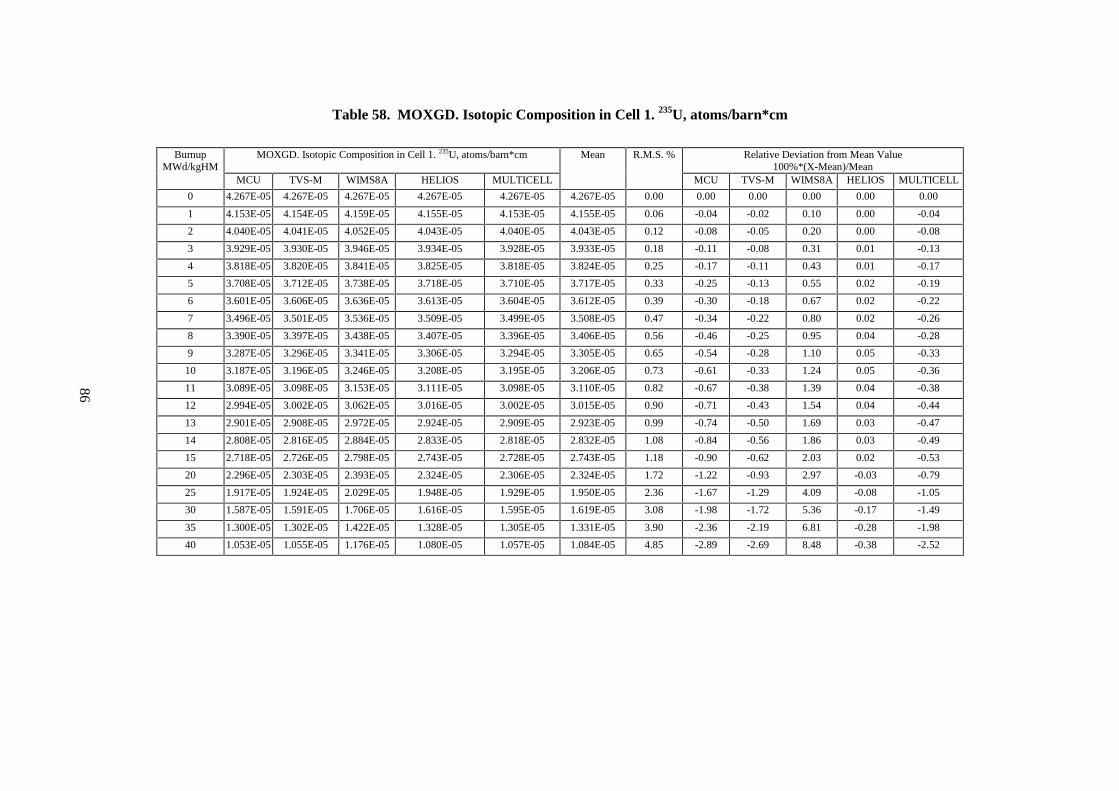
Table 58. MOXGD. Isotopic Composition in Cell 1. 235U, atoms/barn*cm
MOXGD. Isotopic Composition in Cell 1. 235U, atoms/barn*cm Relative Deviation from Mean Value100%*(X-Mean)/Mean
BurnupMWd/kgHM
MCU TVS-M WIMS8A HELIOS MULTICELL
Mean R.M.S. %
MCU TVS-M WIMS8A HELIOS MULTICELL
0 4.267E-05 4.267E-05 4.267E-05 4.267E-05 4.267E-05 4.267E-05 0.00 0.00 0.00 0.00 0.00 0.00
1 4.153E-05 4.154E-05 4.159E-05 4.155E-05 4.153E-05 4.155E-05 0.06 -0.04 -0.02 0.10 0.00 -0.04
2 4.040E-05 4.041E-05 4.052E-05 4.043E-05 4.040E-05 4.043E-05 0.12 -0.08 -0.05 0.20 0.00 -0.08
3 3.929E-05 3.930E-05 3.946E-05 3.934E-05 3.928E-05 3.933E-05 0.18 -0.11 -0.08 0.31 0.01 -0.13
4 3.818E-05 3.820E-05 3.841E-05 3.825E-05 3.818E-05 3.824E-05 0.25 -0.17 -0.11 0.43 0.01 -0.17
5 3.708E-05 3.712E-05 3.738E-05 3.718E-05 3.710E-05 3.717E-05 0.33 -0.25 -0.13 0.55 0.02 -0.19
6 3.601E-05 3.606E-05 3.636E-05 3.613E-05 3.604E-05 3.612E-05 0.39 -0.30 -0.18 0.67 0.02 -0.22
7 3.496E-05 3.501E-05 3.536E-05 3.509E-05 3.499E-05 3.508E-05 0.47 -0.34 -0.22 0.80 0.02 -0.26
8 3.390E-05 3.397E-05 3.438E-05 3.407E-05 3.396E-05 3.406E-05 0.56 -0.46 -0.25 0.95 0.04 -0.28
9 3.287E-05 3.296E-05 3.341E-05 3.306E-05 3.294E-05 3.305E-05 0.65 -0.54 -0.28 1.10 0.05 -0.33
10 3.187E-05 3.196E-05 3.246E-05 3.208E-05 3.195E-05 3.206E-05 0.73 -0.61 -0.33 1.24 0.05 -0.36
11 3.089E-05 3.098E-05 3.153E-05 3.111E-05 3.098E-05 3.110E-05 0.82 -0.67 -0.38 1.39 0.04 -0.38
12 2.994E-05 3.002E-05 3.062E-05 3.016E-05 3.002E-05 3.015E-05 0.90 -0.71 -0.43 1.54 0.04 -0.44
13 2.901E-05 2.908E-05 2.972E-05 2.924E-05 2.909E-05 2.923E-05 0.99 -0.74 -0.50 1.69 0.03 -0.47
14 2.808E-05 2.816E-05 2.884E-05 2.833E-05 2.818E-05 2.832E-05 1.08 -0.84 -0.56 1.86 0.03 -0.49
15 2.718E-05 2.726E-05 2.798E-05 2.743E-05 2.728E-05 2.743E-05 1.18 -0.90 -0.62 2.03 0.02 -0.53
20 2.296E-05 2.303E-05 2.393E-05 2.324E-05 2.306E-05 2.324E-05 1.72 -1.22 -0.93 2.97 -0.03 -0.79
25 1.917E-05 1.924E-05 2.029E-05 1.948E-05 1.929E-05 1.950E-05 2.36 -1.67 -1.29 4.09 -0.08 -1.05
30 1.587E-05 1.591E-05 1.706E-05 1.616E-05 1.595E-05 1.619E-05 3.08 -1.98 -1.72 5.36 -0.17 -1.49
35 1.300E-05 1.302E-05 1.422E-05 1.328E-05 1.305E-05 1.331E-05 3.90 -2.36 -2.19 6.81 -0.28 -1.98
40 1.053E-05 1.055E-05 1.176E-05 1.080E-05 1.057E-05 1.084E-05 4.85 -2.89 -2.69 8.48 -0.38 -2.52
86

Table 59. MOXGD. Isotopic Composition in Cell 1. 236U, atoms/barn*cm
MOXGD. Isotopic Composition in Cell 1. 236U, atoms/barn*cm Relative Deviation from Mean Value100%*(X-Mean)/Mean
BurnupMWd/kgHM
MCU TVS-M WIMS8A HELIOS MULTICELL
Mean R.M.S. %
MCU TVS-M WIMS8A HELIOS MULTICELL
0 0.000E+00 0.000E+00 0.000E+00 0.000E+00 0.000E+00 0.000E+00 0.00 0.00 0.00 0.00 0.00 0.00
1 2.256E-07 2.230E-07 2.155E-07 2.289E-07 2.262E-07 2.238E-07 2.28 0.79 -0.38 -3.72 2.25 1.05
2 4.468E-07 4.419E-07 4.273E-07 4.534E-07 4.482E-07 4.435E-07 2.25 0.74 -0.36 -3.66 2.22 1.06
3 6.628E-07 6.564E-07 6.348E-07 6.732E-07 6.656E-07 6.586E-07 2.21 0.64 -0.33 -3.60 2.22 1.07
4 8.759E-07 8.662E-07 8.380E-07 8.883E-07 8.782E-07 8.693E-07 2.21 0.76 -0.36 -3.60 2.18 1.02
5 1.085E-06 1.071E-06 1.037E-06 1.098E-06 1.086E-06 1.075E-06 2.21 0.89 -0.39 -3.61 2.13 0.98
6 1.290E-06 1.272E-06 1.231E-06 1.304E-06 1.288E-06 1.277E-06 2.21 1.04 -0.40 -3.62 2.10 0.88
7 1.486E-06 1.467E-06 1.420E-06 1.504E-06 1.486E-06 1.472E-06 2.18 0.92 -0.38 -3.58 2.11 0.92
8 1.683E-06 1.657E-06 1.604E-06 1.698E-06 1.678E-06 1.664E-06 2.20 1.14 -0.42 -3.60 2.05 0.84
9 1.871E-06 1.842E-06 1.784E-06 1.888E-06 1.865E-06 1.850E-06 2.19 1.14 -0.42 -3.58 2.04 0.82
10 2.052E-06 2.022E-06 1.958E-06 2.072E-06 2.046E-06 2.030E-06 2.16 1.08 -0.39 -3.54 2.06 0.79
11 2.228E-06 2.197E-06 2.128E-06 2.251E-06 2.223E-06 2.205E-06 2.15 1.03 -0.39 -3.51 2.06 0.81
12 2.398E-06 2.366E-06 2.292E-06 2.424E-06 2.394E-06 2.375E-06 2.13 0.97 -0.38 -3.47 2.07 0.80
13 2.563E-06 2.530E-06 2.452E-06 2.592E-06 2.559E-06 2.539E-06 2.10 0.93 -0.36 -3.43 2.09 0.77
14 2.726E-06 2.689E-06 2.607E-06 2.755E-06 2.720E-06 2.700E-06 2.10 0.98 -0.39 -3.42 2.07 0.76
15 2.879E-06 2.843E-06 2.758E-06 2.913E-06 2.875E-06 2.854E-06 2.07 0.89 -0.36 -3.37 2.09 0.75
20 3.579E-06 3.539E-06 3.441E-06 3.629E-06 3.583E-06 3.554E-06 1.99 0.70 -0.43 -3.18 2.10 0.81
25 4.163E-06 4.117E-06 4.017E-06 4.226E-06 4.177E-06 4.140E-06 1.91 0.56 -0.55 -2.97 2.07 0.90
30 4.626E-06 4.582E-06 4.489E-06 4.708E-06 4.660E-06 4.613E-06 1.80 0.28 -0.67 -2.68 2.06 1.01
35 4.990E-06 4.941E-06 4.864E-06 5.083E-06 5.037E-06 4.983E-06 1.70 0.14 -0.85 -2.38 2.01 1.08
40 5.267E-06 5.201E-06 5.150E-06 5.359E-06 5.318E-06 5.259E-06 1.61 0.15 -1.10 -2.08 1.90 1.12
87

Table 60. MOXGD. Isotopic Composition in Cell 1. 238U, atoms/barn*cm
MOXGD. Isotopic Composition in Cell 1. 238U, atoms/barn*cm Relative deviation from Mean Value100%*(X-Mean)/Mean
BurnupMWd/kgHM
MCU TVS-M WIMS8A HELIOS MULTICELL
Mean R.M.S. %
MCU TVS-M WIMS8A HELIOS MULTICELL
0 2.103E-02 2.103E-02 2.103E-02 2.103E-02 2.103E-02 2.103E-02 0.01 0.01 -0.01 -0.01 -0.01 0.01
1 2.101E-02 2.101E-02 2.101E-02 2.101E-02 2.101E-02 2.101E-02 0.00 0.00 0.00 0.00 0.00 0.00
2 2.099E-02 2.100E-02 2.099E-02 2.100E-02 2.100E-02 2.099E-02 0.02 -0.02 0.00 0.00 0.00 0.02
3 2.098E-02 2.098E-02 2.098E-02 2.098E-02 2.098E-02 2.098E-02 0.00 0.00 0.00 -0.01 0.00 0.00
4 2.096E-02 2.097E-02 2.096E-02 2.096E-02 2.097E-02 2.096E-02 0.02 -0.02 0.00 -0.01 0.00 0.03
5 2.095E-02 2.095E-02 2.095E-02 2.095E-02 2.095E-02 2.095E-02 0.01 0.01 0.00 -0.01 0.00 0.01
6 2.093E-02 2.093E-02 2.093E-02 2.093E-02 2.093E-02 2.093E-02 0.01 -0.01 0.01 -0.01 0.01 -0.01
7 2.091E-02 2.092E-02 2.091E-02 2.092E-02 2.092E-02 2.092E-02 0.02 -0.03 0.01 -0.01 0.01 0.02
8 2.090E-02 2.090E-02 2.090E-02 2.090E-02 2.090E-02 2.090E-02 0.01 0.00 0.01 -0.01 0.01 0.00
9 2.088E-02 2.089E-02 2.088E-02 2.089E-02 2.089E-02 2.088E-02 0.02 -0.02 0.01 -0.02 0.01 0.03
10 2.087E-02 2.087E-02 2.087E-02 2.087E-02 2.087E-02 2.087E-02 0.01 0.00 0.00 -0.02 0.00 0.00
11 2.085E-02 2.085E-02 2.085E-02 2.085E-02 2.086E-02 2.085E-02 0.02 -0.02 0.00 -0.02 0.00 0.03
12 2.083E-02 2.084E-02 2.083E-02 2.084E-02 2.084E-02 2.084E-02 0.02 -0.03 0.01 -0.02 0.01 0.02
13 2.081E-02 2.082E-02 2.082E-02 2.082E-02 2.083E-02 2.082E-02 0.04 -0.05 0.01 -0.02 0.01 0.05
14 2.080E-02 2.081E-02 2.080E-02 2.081E-02 2.081E-02 2.080E-02 0.02 -0.02 0.01 -0.03 0.01 0.03
15 2.078E-02 2.079E-02 2.078E-02 2.079E-02 2.079E-02 2.079E-02 0.02 -0.03 0.02 -0.02 0.01 0.02
20 2.069E-02 2.071E-02 2.070E-02 2.071E-02 2.071E-02 2.070E-02 0.04 -0.06 0.02 -0.02 0.02 0.04
25 2.061E-02 2.062E-02 2.061E-02 2.062E-02 2.063E-02 2.062E-02 0.04 -0.04 0.01 -0.04 0.01 0.06
30 2.051E-02 2.053E-02 2.052E-02 2.053E-02 2.054E-02 2.053E-02 0.06 -0.07 0.02 -0.04 0.02 0.07
35 2.042E-02 2.044E-02 2.042E-02 2.044E-02 2.046E-02 2.044E-02 0.08 -0.08 0.01 -0.06 0.01 0.12
40 2.032E-02 2.034E-02 2.033E-02 2.034E-02 2.036E-02 2.034E-02 0.08 -0.09 0.02 -0.05 0.02 0.11
88

Table 61. MOXGD. Isotopic Composition in Cell 1. 239Pu, atoms/barn*cm
MOXGD. Isotopic Composition in Cell 1. 239Pu, atoms/barn*cm Relative Deviation from Mean Value100%*(X-Mean)/Mean
BurnupMWd/kgHM
MCU TVS-M WIMS8A HELIOS MULTICELL
Mean R.M.S. %
MCU TVS-M WIMS8A HELIOS MULTICELL
0 4.241E-04 4.241E-04 4.241E-04 4.241E-04 4.241E-04 4.241E-04 0.01 -0.01 0.00 0.00 0.00 -0.01
1 4.063E-04 4.069E-04 4.077E-04 4.064E-04 4.059E-04 4.066E-04 0.17 -0.08 0.06 0.26 -0.06 -0.18
2 3.913E-04 3.921E-04 3.938E-04 3.910E-04 3.903E-04 3.917E-04 0.34 -0.10 0.10 0.54 -0.18 -0.36
3 3.768E-04 3.779E-04 3.806E-04 3.763E-04 3.754E-04 3.774E-04 0.53 -0.16 0.14 0.84 -0.30 -0.53
4 3.628E-04 3.644E-04 3.679E-04 3.622E-04 3.611E-04 3.637E-04 0.73 -0.24 0.19 1.16 -0.41 -0.71
5 3.496E-04 3.514E-04 3.558E-04 3.487E-04 3.475E-04 3.506E-04 0.92 -0.29 0.23 1.48 -0.53 -0.89
6 3.374E-04 3.390E-04 3.442E-04 3.359E-04 3.345E-04 3.382E-04 1.11 -0.24 0.24 1.78 -0.68 -1.10
7 3.255E-04 3.272E-04 3.332E-04 3.237E-04 3.222E-04 3.264E-04 1.31 -0.27 0.26 2.10 -0.81 -1.28
8 3.142E-04 3.160E-04 3.228E-04 3.122E-04 3.104E-04 3.151E-04 1.52 -0.29 0.28 2.44 -0.94 -1.49
9 3.035E-04 3.053E-04 3.128E-04 3.012E-04 2.993E-04 3.044E-04 1.72 -0.30 0.30 2.76 -1.07 -1.68
10 2.935E-04 2.952E-04 3.034E-04 2.907E-04 2.888E-04 2.943E-04 1.91 -0.28 0.30 3.08 -1.22 -1.88
11 2.840E-04 2.856E-04 2.944E-04 2.809E-04 2.788E-04 2.847E-04 2.12 -0.26 0.30 3.40 -1.36 -2.08
12 2.755E-04 2.765E-04 2.859E-04 2.715E-04 2.693E-04 2.758E-04 2.32 -0.09 0.27 3.69 -1.53 -2.34
13 2.674E-04 2.679E-04 2.779E-04 2.627E-04 2.604E-04 2.673E-04 2.52 0.05 0.23 3.98 -1.69 -2.57
14 2.592E-04 2.597E-04 2.703E-04 2.544E-04 2.520E-04 2.591E-04 2.71 0.03 0.24 4.30 -1.82 -2.75
15 2.521E-04 2.520E-04 2.631E-04 2.466E-04 2.440E-04 2.516E-04 2.92 0.21 0.19 4.58 -1.98 -3.01
20 2.201E-04 2.199E-04 2.327E-04 2.138E-04 2.108E-04 2.195E-04 3.83 0.29 0.19 6.03 -2.56 -3.94
25 1.956E-04 1.962E-04 2.100E-04 1.900E-04 1.865E-04 1.957E-04 4.58 -0.03 0.28 7.33 -2.90 -4.68
30 1.793E-04 1.791E-04 1.933E-04 1.730E-04 1.690E-04 1.787E-04 5.16 0.32 0.22 8.14 -3.23 -5.45
35 1.680E-04 1.670E-04 1.811E-04 1.610E-04 1.567E-04 1.668E-04 5.55 0.74 0.14 8.62 -3.47 -6.03
40 1.596E-04 1.585E-04 1.723E-04 1.526E-04 1.481E-04 1.582E-04 5.78 0.89 0.16 8.91 -3.57 -6.38
89
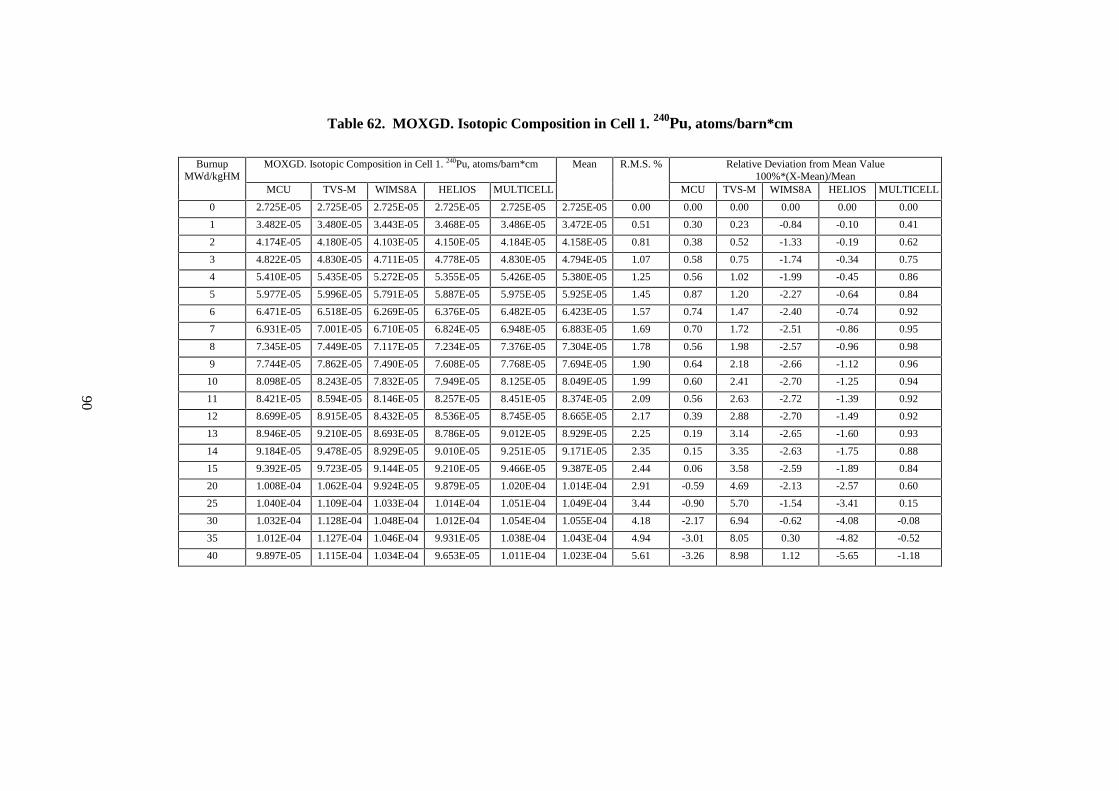
Table 62. MOXGD. Isotopic Composition in Cell 1. 240Pu, atoms/barn*cm
MOXGD. Isotopic Composition in Cell 1. 240Pu, atoms/barn*cm Relative Deviation from Mean Value100%*(X-Mean)/Mean
BurnupMWd/kgHM
MCU TVS-M WIMS8A HELIOS MULTICELL
Mean R.M.S. %
MCU TVS-M WIMS8A HELIOS MULTICELL
0 2.725E-05 2.725E-05 2.725E-05 2.725E-05 2.725E-05 2.725E-05 0.00 0.00 0.00 0.00 0.00 0.00
1 3.482E-05 3.480E-05 3.443E-05 3.468E-05 3.486E-05 3.472E-05 0.51 0.30 0.23 -0.84 -0.10 0.41
2 4.174E-05 4.180E-05 4.103E-05 4.150E-05 4.184E-05 4.158E-05 0.81 0.38 0.52 -1.33 -0.19 0.62
3 4.822E-05 4.830E-05 4.711E-05 4.778E-05 4.830E-05 4.794E-05 1.07 0.58 0.75 -1.74 -0.34 0.75
4 5.410E-05 5.435E-05 5.272E-05 5.355E-05 5.426E-05 5.380E-05 1.25 0.56 1.02 -1.99 -0.45 0.86
5 5.977E-05 5.996E-05 5.791E-05 5.887E-05 5.975E-05 5.925E-05 1.45 0.87 1.20 -2.27 -0.64 0.84
6 6.471E-05 6.518E-05 6.269E-05 6.376E-05 6.482E-05 6.423E-05 1.57 0.74 1.47 -2.40 -0.74 0.92
7 6.931E-05 7.001E-05 6.710E-05 6.824E-05 6.948E-05 6.883E-05 1.69 0.70 1.72 -2.51 -0.86 0.95
8 7.345E-05 7.449E-05 7.117E-05 7.234E-05 7.376E-05 7.304E-05 1.78 0.56 1.98 -2.57 -0.96 0.98
9 7.744E-05 7.862E-05 7.490E-05 7.608E-05 7.768E-05 7.694E-05 1.90 0.64 2.18 -2.66 -1.12 0.96
10 8.098E-05 8.243E-05 7.832E-05 7.949E-05 8.125E-05 8.049E-05 1.99 0.60 2.41 -2.70 -1.25 0.94
11 8.421E-05 8.594E-05 8.146E-05 8.257E-05 8.451E-05 8.374E-05 2.09 0.56 2.63 -2.72 -1.39 0.92
12 8.699E-05 8.915E-05 8.432E-05 8.536E-05 8.745E-05 8.665E-05 2.17 0.39 2.88 -2.70 -1.49 0.92
13 8.946E-05 9.210E-05 8.693E-05 8.786E-05 9.012E-05 8.929E-05 2.25 0.19 3.14 -2.65 -1.60 0.93
14 9.184E-05 9.478E-05 8.929E-05 9.010E-05 9.251E-05 9.171E-05 2.35 0.15 3.35 -2.63 -1.75 0.88
15 9.392E-05 9.723E-05 9.144E-05 9.210E-05 9.466E-05 9.387E-05 2.44 0.06 3.58 -2.59 -1.89 0.84
20 1.008E-04 1.062E-04 9.924E-05 9.879E-05 1.020E-04 1.014E-04 2.91 -0.59 4.69 -2.13 -2.57 0.60
25 1.040E-04 1.109E-04 1.033E-04 1.014E-04 1.051E-04 1.049E-04 3.44 -0.90 5.70 -1.54 -3.41 0.15
30 1.032E-04 1.128E-04 1.048E-04 1.012E-04 1.054E-04 1.055E-04 4.18 -2.17 6.94 -0.62 -4.08 -0.08
35 1.012E-04 1.127E-04 1.046E-04 9.931E-05 1.038E-04 1.043E-04 4.94 -3.01 8.05 0.30 -4.82 -0.52
40 9.897E-05 1.115E-04 1.034E-04 9.653E-05 1.011E-04 1.023E-04 5.61 -3.26 8.98 1.12 -5.65 -1.18
90

Table 63. MOXGD. Isotopic Composition in Cell 1. 241Pu, atoms/barn*cm
MOXGD. Isotopic Composition in Cell 1. 241Pu, atoms/barn*cm Relative Deviation from Mean Value100%*(X-Mean)/Mean
BurnupMWd/kgHM
MCU TVS-M WIMS8A HELIOS MULTICELL
Mean R.M.S. %
MCU TVS-M WIMS8A HELIOS MULTICELL
0 4.523E-06 4.523E-06 4.523E-06 4.523E-06 4.523E-06 4.523E-06 0.00 0.00 0.00 0.00 0.00 0.00
1 6.982E-06 6.665E-06 6.959E-06 7.034E-06 6.932E-06 6.914E-06 2.09 0.98 -3.60 0.64 1.73 0.26
2 9.665E-06 9.012E-06 9.636E-06 9.765E-06 9.561E-06 9.528E-06 3.12 1.44 -5.42 1.14 2.49 0.35
3 1.237E-05 1.149E-05 1.245E-05 1.263E-05 1.231E-05 1.225E-05 3.61 0.97 -6.22 1.66 3.10 0.48
4 1.529E-05 1.404E-05 1.535E-05 1.557E-05 1.512E-05 1.508E-05 3.97 1.42 -6.85 1.84 3.28 0.30
5 1.810E-05 1.663E-05 1.829E-05 1.853E-05 1.796E-05 1.790E-05 4.14 1.10 -7.09 2.15 3.53 0.32
6 2.103E-05 1.923E-05 2.122E-05 2.149E-05 2.077E-05 2.075E-05 4.29 1.37 -7.33 2.28 3.57 0.11
7 2.391E-05 2.180E-05 2.412E-05 2.440E-05 2.354E-05 2.355E-05 4.38 1.52 -7.46 2.41 3.59 -0.05
8 2.683E-05 2.432E-05 2.697E-05 2.725E-05 2.625E-05 2.632E-05 4.47 1.93 -7.61 2.45 3.51 -0.28
9 2.949E-05 2.678E-05 2.974E-05 3.001E-05 2.888E-05 2.898E-05 4.48 1.76 -7.59 2.62 3.56 -0.35
10 3.208E-05 2.917E-05 3.243E-05 3.268E-05 3.141E-05 3.155E-05 4.49 1.67 -7.55 2.77 3.57 -0.45
11 3.467E-05 3.147E-05 3.501E-05 3.524E-05 3.384E-05 3.405E-05 4.51 1.83 -7.57 2.84 3.50 -0.61
12 3.712E-05 3.367E-05 3.749E-05 3.768E-05 3.615E-05 3.642E-05 4.52 1.91 -7.55 2.94 3.45 -0.75
13 3.949E-05 3.578E-05 3.986E-05 4.000E-05 3.835E-05 3.870E-05 4.54 2.05 -7.54 3.01 3.37 -0.89
14 4.167E-05 3.778E-05 4.211E-05 4.220E-05 4.043E-05 4.084E-05 4.53 2.04 -7.49 3.12 3.33 -1.00
15 4.368E-05 3.968E-05 4.425E-05 4.426E-05 4.239E-05 4.285E-05 4.51 1.94 -7.41 3.25 3.30 -1.08
20 5.242E-05 4.764E-05 5.319E-05 5.279E-05 5.051E-05 5.131E-05 4.47 2.16 -7.16 3.66 2.89 -1.56
25 5.794E-05 5.302E-05 5.933E-05 5.830E-05 5.577E-05 5.687E-05 4.42 1.88 -6.77 4.31 2.51 -1.94
30 6.183E-05 5.619E-05 6.305E-05 6.126E-05 5.860E-05 6.019E-05 4.59 2.73 -6.63 4.77 1.77 -2.64
35 6.291E-05 5.765E-05 6.489E-05 6.226E-05 5.958E-05 6.146E-05 4.64 2.36 -6.19 5.58 1.30 -3.06
40 6.197E-05 5.790E-05 6.536E-05 6.191E-05 5.927E-05 6.128E-05 4.68 1.12 -5.51 6.65 1.03 -3.28
91
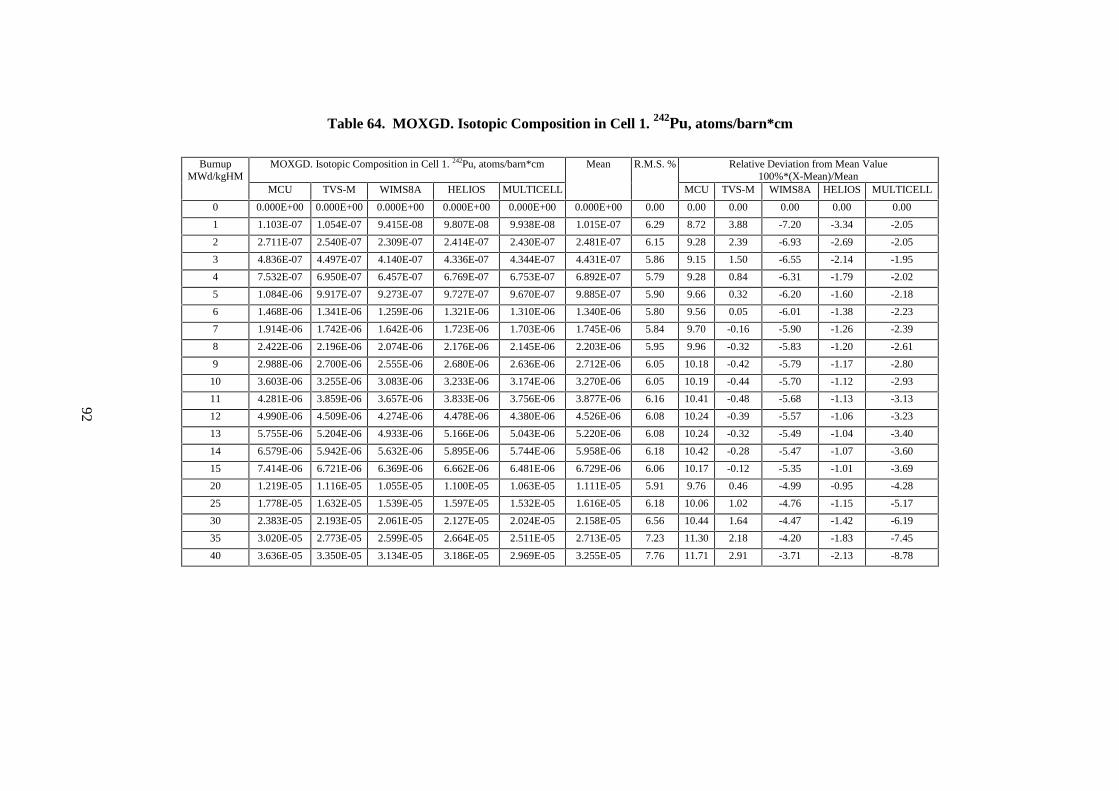
Table 64. MOXGD. Isotopic Composition in Cell 1. 242Pu, atoms/barn*cm
MOXGD. Isotopic Composition in Cell 1. 242Pu, atoms/barn*cm Relative Deviation from Mean Value100%*(X-Mean)/Mean
BurnupMWd/kgHM
MCU TVS-M WIMS8A HELIOS MULTICELL
Mean R.M.S. %
MCU TVS-M WIMS8A HELIOS MULTICELL
0 0.000E+00 0.000E+00 0.000E+00 0.000E+00 0.000E+00 0.000E+00 0.00 0.00 0.00 0.00 0.00 0.00
1 1.103E-07 1.054E-07 9.415E-08 9.807E-08 9.938E-08 1.015E-07 6.29 8.72 3.88 -7.20 -3.34 -2.05
2 2.711E-07 2.540E-07 2.309E-07 2.414E-07 2.430E-07 2.481E-07 6.15 9.28 2.39 -6.93 -2.69 -2.05
3 4.836E-07 4.497E-07 4.140E-07 4.336E-07 4.344E-07 4.431E-07 5.86 9.15 1.50 -6.55 -2.14 -1.95
4 7.532E-07 6.950E-07 6.457E-07 6.769E-07 6.753E-07 6.892E-07 5.79 9.28 0.84 -6.31 -1.79 -2.02
5 1.084E-06 9.917E-07 9.273E-07 9.727E-07 9.670E-07 9.885E-07 5.90 9.66 0.32 -6.20 -1.60 -2.18
6 1.468E-06 1.341E-06 1.259E-06 1.321E-06 1.310E-06 1.340E-06 5.80 9.56 0.05 -6.01 -1.38 -2.23
7 1.914E-06 1.742E-06 1.642E-06 1.723E-06 1.703E-06 1.745E-06 5.84 9.70 -0.16 -5.90 -1.26 -2.39
8 2.422E-06 2.196E-06 2.074E-06 2.176E-06 2.145E-06 2.203E-06 5.95 9.96 -0.32 -5.83 -1.20 -2.61
9 2.988E-06 2.700E-06 2.555E-06 2.680E-06 2.636E-06 2.712E-06 6.05 10.18 -0.42 -5.79 -1.17 -2.80
10 3.603E-06 3.255E-06 3.083E-06 3.233E-06 3.174E-06 3.270E-06 6.05 10.19 -0.44 -5.70 -1.12 -2.93
11 4.281E-06 3.859E-06 3.657E-06 3.833E-06 3.756E-06 3.877E-06 6.16 10.41 -0.48 -5.68 -1.13 -3.13
12 4.990E-06 4.509E-06 4.274E-06 4.478E-06 4.380E-06 4.526E-06 6.08 10.24 -0.39 -5.57 -1.06 -3.23
13 5.755E-06 5.204E-06 4.933E-06 5.166E-06 5.043E-06 5.220E-06 6.08 10.24 -0.32 -5.49 -1.04 -3.40
14 6.579E-06 5.942E-06 5.632E-06 5.895E-06 5.744E-06 5.958E-06 6.18 10.42 -0.28 -5.47 -1.07 -3.60
15 7.414E-06 6.721E-06 6.369E-06 6.662E-06 6.481E-06 6.729E-06 6.06 10.17 -0.12 -5.35 -1.01 -3.69
20 1.219E-05 1.116E-05 1.055E-05 1.100E-05 1.063E-05 1.111E-05 5.91 9.76 0.46 -4.99 -0.95 -4.28
25 1.778E-05 1.632E-05 1.539E-05 1.597E-05 1.532E-05 1.616E-05 6.18 10.06 1.02 -4.76 -1.15 -5.17
30 2.383E-05 2.193E-05 2.061E-05 2.127E-05 2.024E-05 2.158E-05 6.56 10.44 1.64 -4.47 -1.42 -6.19
35 3.020E-05 2.773E-05 2.599E-05 2.664E-05 2.511E-05 2.713E-05 7.23 11.30 2.18 -4.20 -1.83 -7.45
40 3.636E-05 3.350E-05 3.134E-05 3.186E-05 2.969E-05 3.255E-05 7.76 11.71 2.91 -3.71 -2.13 -8.78
92

Table 65. MOXGD. Isotopic Composition in Cell 1. 135Xe, atoms/barn*cm
MOXGD. Isotopic Composition in Cell 1. 135Xe, atoms/barn*cm Relative Deviation from Mean Value100%*(X-Mean)/Mean
BurnupMWd/kgHM
MCU TVS-M WIMS8A HELIOS MULTICELL
Mean R.M.S. %
MCU TVS-M WIMS8A HELIOS MULTICELL
1 1.213E-08 1.155E-08 1.165E-08 1.210E-08 1.226E-08 1.194E-08 2.65 1.61 -3.27 -2.38 1.34 2.70
2 1.189E-08 1.129E-08 1.146E-08 1.183E-08 1.199E-08 1.169E-08 2.58 1.69 -3.44 -1.99 1.19 2.55
3 1.153E-08 1.104E-08 1.123E-08 1.158E-08 1.171E-08 1.142E-08 2.40 0.98 -3.28 -1.65 1.39 2.56
4 1.137E-08 1.081E-08 1.103E-08 1.133E-08 1.144E-08 1.120E-08 2.39 1.55 -3.47 -1.49 1.23 2.18
5 1.111E-08 1.058E-08 1.084E-08 1.110E-08 1.119E-08 1.097E-08 2.29 1.32 -3.48 -1.14 1.25 2.05
6 1.095E-08 1.037E-08 1.070E-08 1.088E-08 1.095E-08 1.077E-08 2.29 1.67 -3.72 -0.67 1.04 1.67
7 1.064E-08 1.016E-08 1.052E-08 1.067E-08 1.072E-08 1.054E-08 2.13 0.91 -3.60 -0.18 1.20 1.67
8 1.036E-08 9.968E-09 1.036E-08 1.047E-08 1.050E-08 1.033E-08 2.06 0.28 -3.52 0.27 1.34 1.63
9 1.022E-08 9.781E-09 1.020E-08 1.028E-08 1.028E-08 1.015E-08 2.07 0.67 -3.65 0.49 1.23 1.26
10 1.013E-08 9.602E-09 1.005E-08 1.009E-08 1.008E-08 9.991E-09 2.20 1.39 -3.89 0.60 1.02 0.89
11 9.936E-09 9.431E-09 9.907E-09 9.917E-09 9.890E-09 9.816E-09 2.20 1.22 -3.92 0.93 1.02 0.75
12 9.781E-09 9.270E-09 9.771E-09 9.750E-09 9.707E-09 9.656E-09 2.26 1.30 -4.00 1.20 0.97 0.53
13 9.526E-09 9.117E-09 9.644E-09 9.591E-09 9.533E-09 9.482E-09 2.21 0.46 -3.85 1.70 1.15 0.54
14 9.501E-09 8.974E-09 9.524E-09 9.443E-09 9.370E-09 9.362E-09 2.41 1.48 -4.15 1.73 0.86 0.08
15 9.369E-09 8.839E-09 9.413E-09 9.303E-09 9.218E-09 9.228E-09 2.49 1.52 -4.22 2.00 0.81 -0.11
20 8.785E-09 8.282E-09 8.906E-09 8.810E-09 8.596E-09 8.676E-09 2.85 1.26 -4.54 2.66 1.54 -0.92
25 8.393E-09 7.849E-09 8.544E-09 8.336E-09 8.107E-09 8.246E-09 3.30 1.79 -4.82 3.62 1.09 -1.68
30 8.020E-09 7.508E-09 8.248E-09 7.961E-09 7.721E-09 7.892E-09 3.61 1.63 -4.87 4.52 0.88 -2.16
35 7.632E-09 7.238E-09 8.003E-09 7.662E-09 7.414E-09 7.590E-09 3.80 0.56 -4.64 5.44 0.95 -2.31
40 7.416E-09 7.022E-09 7.798E-09 7.420E-09 7.168E-09 7.365E-09 4.01 0.70 -4.65 5.88 0.75 -2.67
93
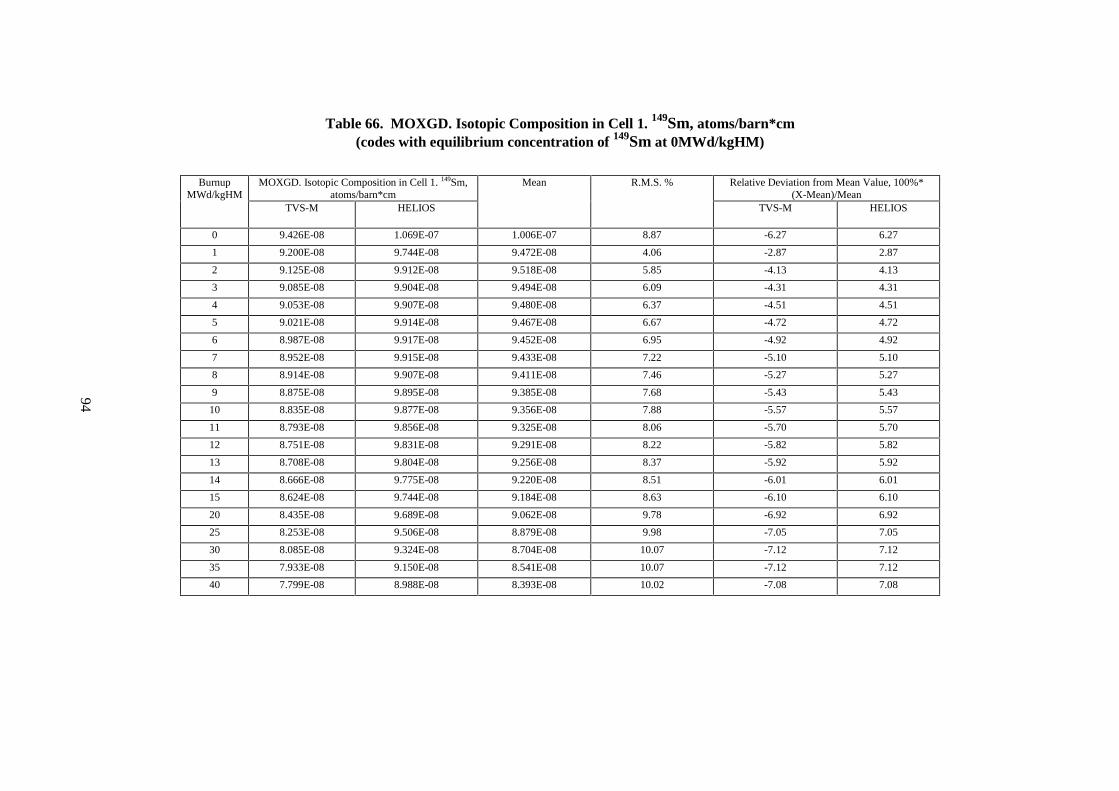
Table 66. MOXGD. Isotopic Composition in Cell 1. 149Sm, atoms/barn*cm(codes with equilibrium concentration of 149Sm at 0MWd/kgHM)
MOXGD. Isotopic Composition in Cell 1. 149Sm,atoms/barn*cm
Relative Deviation from Mean Value, 100%*(X-Mean)/Mean
BurnupMWd/kgHM
TVS-M HELIOS
Mean R.M.S. %
TVS-M HELIOS
0 9.426E-08 1.069E-07 1.006E-07 8.87 -6.27 6.27
1 9.200E-08 9.744E-08 9.472E-08 4.06 -2.87 2.87
2 9.125E-08 9.912E-08 9.518E-08 5.85 -4.13 4.13
3 9.085E-08 9.904E-08 9.494E-08 6.09 -4.31 4.31
4 9.053E-08 9.907E-08 9.480E-08 6.37 -4.51 4.51
5 9.021E-08 9.914E-08 9.467E-08 6.67 -4.72 4.72
6 8.987E-08 9.917E-08 9.452E-08 6.95 -4.92 4.92
7 8.952E-08 9.915E-08 9.433E-08 7.22 -5.10 5.10
8 8.914E-08 9.907E-08 9.411E-08 7.46 -5.27 5.27
9 8.875E-08 9.895E-08 9.385E-08 7.68 -5.43 5.43
10 8.835E-08 9.877E-08 9.356E-08 7.88 -5.57 5.57
11 8.793E-08 9.856E-08 9.325E-08 8.06 -5.70 5.70
12 8.751E-08 9.831E-08 9.291E-08 8.22 -5.82 5.82
13 8.708E-08 9.804E-08 9.256E-08 8.37 -5.92 5.92
14 8.666E-08 9.775E-08 9.220E-08 8.51 -6.01 6.01
15 8.624E-08 9.744E-08 9.184E-08 8.63 -6.10 6.10
20 8.435E-08 9.689E-08 9.062E-08 9.78 -6.92 6.92
25 8.253E-08 9.506E-08 8.879E-08 9.98 -7.05 7.05
30 8.085E-08 9.324E-08 8.704E-08 10.07 -7.12 7.12
35 7.933E-08 9.150E-08 8.541E-08 10.07 -7.12 7.12
40 7.799E-08 8.988E-08 8.393E-08 10.02 -7.08 7.08
94

Table 67. MOXGD. Isotopic Composition in Cell 1. 149Sm, atoms/barn*cm(codes with zero concentration of 149Sm at 0MWd/kgHM)
MOXGD. Isotopic Composition in Cell 1. 149Sm,atoms/barn*cm
Relative Deviation from Mean Value100%*(X-Mean)/Mean
BurnupMWd/kgHM
MCU WIMS8A MULTICELL
Mean R.M.S. %
MCU WIMS8A MULTICELL
1 8.997E-08 8.869E-08 8.665E-08 8.844E-08 1.89 1.73 0.29 -2.02
2 9.867E-08 9.808E-08 9.458E-08 9.711E-08 2.28 1.61 1.00 -2.60
3 9.892E-08 9.860E-08 9.504E-08 9.752E-08 2.21 1.44 1.11 -2.54
4 9.751E-08 9.892E-08 9.532E-08 9.725E-08 1.86 0.27 1.71 -1.98
5 9.805E-08 9.926E-08 9.561E-08 9.764E-08 1.90 0.42 1.66 -2.08
6 9.662E-08 9.957E-08 9.584E-08 9.734E-08 2.02 -0.74 2.29 -1.55
7 9.655E-08 9.982E-08 9.599E-08 9.745E-08 2.12 -0.93 2.43 -1.50
8 9.457E-08 1.000E-07 9.607E-08 9.688E-08 2.90 -2.39 3.22 -0.84
9 9.519E-08 1.001E-07 9.607E-08 9.713E-08 2.71 -1.99 3.08 -1.09
10 9.495E-08 1.002E-07 9.600E-08 9.705E-08 2.85 -2.16 3.24 -1.08
11 9.605E-08 1.002E-07 9.587E-08 9.737E-08 2.51 -1.36 2.90 -1.54
12 9.453E-08 1.002E-07 9.568E-08 9.679E-08 3.08 -2.34 3.49 -1.15
13 9.313E-08 1.001E-07 9.545E-08 9.623E-08 3.70 -3.22 4.04 -0.81
14 9.236E-08 1.000E-07 9.519E-08 9.586E-08 4.05 -3.65 4.36 -0.70
15 9.349E-08 9.995E-08 9.490E-08 9.611E-08 3.53 -2.73 3.99 -1.26
20 9.264E-08 9.923E-08 9.344E-08 9.510E-08 3.78 -2.59 4.34 -1.75
25 9.105E-08 9.827E-08 9.174E-08 9.369E-08 4.25 -2.81 4.89 -2.08
30 8.728E-08 9.712E-08 8.996E-08 9.145E-08 5.56 -4.56 6.19 -1.63
35 8.336E-08 9.591E-08 8.822E-08 8.916E-08 7.10 -6.51 7.57 -1.06
40 8.181E-08 9.475E-08 8.659E-08 8.772E-08 7.46 -6.73 8.02 -1.28
95

Table 68. MOXGD. Isotopic Composition in Cell 1 Deviation from Average Value, %. Burnup=40 MWd/kgHM
MOXGD. Isotopic Composition in Cell 1 Deviation from Average Value, %. Burnup=40 MWd/kgHM235U 236U 238U 239Pu 240Pu 241Pu 242Pu 135Xe 149Sm
MCU -2.89 0.15 -0.09 0.89 -3.26 1.12 11.71 0.70 -5.10
TVS-M -2.69 -1.10 0.02 0.16 8.98 -5.51 2.91 -4.65 -9.53
WIMS8A 8.48 -2.08 -0.05 8.91 1.12 6.65 -3.71 5.88 9.91
HELIOS -0.38 1.90 0.02 -3.57 -5.65 1.03 -2.13 0.75 4.26
MULTICELL -2.52 1.12 0.11 -6.38 -1.18 -3.28 -8.78 -2.67 0.45
R.M.S. % 4.85 1.61 0.08 5.78 5.61 4.68 7.76 4.01 7.64
96

Table 69 MOXGD. Isotopic Composition in Cell 24. 235U, atoms/barn*cm
MOXGD. Isotopic Composition in Cell 24. 235U, atoms/barn*cm Relative deviation from Mean Value100%*(X-Mean)/Mean
BurnupMWd/kgHM
MCU TVS-M WIMS8A HELIOS MULTICELL
Mean R.M.S. %
MCU TVS-M WIMS8A HELIOS MULTICELL
0 7.288E-04 7.288E-04 7.288E-04 7.288E-04 7.288E-04 7.288E-04 0.00 0.00 0.00 0.00 0.00 0.00
1 7.211E-04 7.211E-04 7.210E-04 7.210E-04 7.212E-04 7.211E-04 0.01 0.00 0.01 -0.01 -0.01 0.02
2 7.130E-04 7.132E-04 7.129E-04 7.129E-04 7.134E-04 7.131E-04 0.03 -0.01 0.02 -0.03 -0.02 0.04
3 7.047E-04 7.050E-04 7.044E-04 7.046E-04 7.053E-04 7.048E-04 0.05 -0.02 0.03 -0.05 -0.03 0.07
4 6.959E-04 6.964E-04 6.956E-04 6.959E-04 6.968E-04 6.961E-04 0.07 -0.03 0.04 -0.07 -0.04 0.10
5 6.868E-04 6.874E-04 6.865E-04 6.868E-04 6.879E-04 6.871E-04 0.08 -0.04 0.04 -0.09 -0.04 0.12
6 6.773E-04 6.779E-04 6.769E-04 6.773E-04 6.786E-04 6.776E-04 0.10 -0.05 0.05 -0.11 -0.04 0.15
7 6.674E-04 6.680E-04 6.669E-04 6.675E-04 6.689E-04 6.678E-04 0.11 -0.05 0.04 -0.13 -0.04 0.17
8 6.571E-04 6.577E-04 6.565E-04 6.572E-04 6.587E-04 6.574E-04 0.13 -0.05 0.04 -0.15 -0.03 0.19
9 6.462E-04 6.468E-04 6.456E-04 6.465E-04 6.481E-04 6.466E-04 0.15 -0.07 0.02 -0.17 -0.02 0.23
10 6.347E-04 6.354E-04 6.342E-04 6.353E-04 6.370E-04 6.353E-04 0.17 -0.09 0.01 -0.18 0.00 0.26
11 6.228E-04 6.234E-04 6.223E-04 6.237E-04 6.254E-04 6.235E-04 0.19 -0.11 -0.02 -0.20 0.03 0.30
12 6.104E-04 6.109E-04 6.099E-04 6.116E-04 6.133E-04 6.112E-04 0.21 -0.13 -0.06 -0.21 0.05 0.34
13 5.976E-04 5.979E-04 5.972E-04 5.990E-04 6.008E-04 5.985E-04 0.24 -0.15 -0.10 -0.22 0.09 0.39
14 5.844E-04 5.845E-04 5.842E-04 5.862E-04 5.879E-04 5.854E-04 0.27 -0.18 -0.17 -0.21 0.13 0.42
15 5.712E-04 5.708E-04 5.711E-04 5.732E-04 5.748E-04 5.722E-04 0.30 -0.18 -0.24 -0.19 0.17 0.45
20 5.054E-04 5.033E-04 5.067E-04 5.085E-04 5.099E-04 5.068E-04 0.51 -0.28 -0.69 0.00 0.35 0.62
25 4.428E-04 4.397E-04 4.462E-04 4.473E-04 4.483E-04 4.449E-04 0.80 -0.47 -1.16 0.30 0.55 0.77
30 3.853E-04 3.810E-04 3.902E-04 3.905E-04 3.909E-04 3.876E-04 1.12 -0.59 -1.70 0.68 0.75 0.86
35 3.323E-04 3.271E-04 3.388E-04 3.381E-04 3.379E-04 3.348E-04 1.50 -0.76 -2.30 1.18 0.96 0.92
40 2.844E-04 2.784E-04 2.920E-04 2.902E-04 2.894E-04 2.869E-04 1.93 -0.87 -2.97 1.79 1.16 0.88
97

Table 70. MOXGD. Isotopic Composition in Cell 24. 236U, atoms/barn*cm
MOXGD. Isotopic Composition in Cell 24. 236U, atoms/barn*cm Relative Deviation from Mean Value100%*(X-Mean)/Mean
BurnupMWd/kgHM
MCU TVS-M WIMS8A HELIOS MULTICELL
Mean R.M.S. %
MCU TVS-M WIMS8A HELIOS MULTICELL
0 0.000E+00 0.000E+00 0.000E+00 0.000E+00 0.000E+00 0.000E+00 0.00 0.00 0.00 0.00 0.00 0.00
1 2.048E-06 2.032E-06 2.041E-06 2.136E-06 1.984E-06 2.048E-06 2.69 -0.02 -0.79 -0.34 4.28 -3.13
2 4.144E-06 4.095E-06 4.125E-06 4.303E-06 4.004E-06 4.134E-06 2.63 0.24 -0.94 -0.22 4.09 -3.16
3 6.275E-06 6.196E-06 6.245E-06 6.506E-06 6.064E-06 6.257E-06 2.57 0.29 -0.97 -0.19 3.97 -3.09
4 8.457E-06 8.338E-06 8.402E-06 8.744E-06 8.165E-06 8.421E-06 2.51 0.43 -0.99 -0.23 3.83 -3.04
5 1.067E-05 1.052E-05 1.060E-05 1.102E-05 1.031E-05 1.062E-05 2.43 0.46 -0.96 -0.26 3.71 -2.95
6 1.291E-05 1.275E-05 1.283E-05 1.333E-05 1.250E-05 1.286E-05 2.35 0.36 -0.89 -0.26 3.63 -2.83
7 1.518E-05 1.502E-05 1.511E-05 1.568E-05 1.473E-05 1.514E-05 2.29 0.23 -0.80 -0.26 3.56 -2.74
8 1.750E-05 1.734E-05 1.742E-05 1.808E-05 1.700E-05 1.747E-05 2.23 0.20 -0.72 -0.26 3.48 -2.69
9 1.989E-05 1.972E-05 1.979E-05 2.051E-05 1.933E-05 1.985E-05 2.16 0.22 -0.66 -0.31 3.35 -2.61
10 2.233E-05 2.214E-05 2.220E-05 2.299E-05 2.170E-05 2.227E-05 2.09 0.26 -0.59 -0.34 3.23 -2.57
11 2.482E-05 2.462E-05 2.465E-05 2.551E-05 2.412E-05 2.474E-05 2.03 0.29 -0.50 -0.38 3.11 -2.52
12 2.735E-05 2.715E-05 2.714E-05 2.808E-05 2.659E-05 2.726E-05 1.97 0.33 -0.41 -0.45 2.99 -2.46
13 2.991E-05 2.972E-05 2.965E-05 3.067E-05 2.909E-05 2.981E-05 1.91 0.34 -0.29 -0.52 2.88 -2.41
14 3.250E-05 3.232E-05 3.218E-05 3.328E-05 3.162E-05 3.238E-05 1.85 0.39 -0.18 -0.63 2.77 -2.34
15 3.505E-05 3.492E-05 3.469E-05 3.588E-05 3.414E-05 3.494E-05 1.81 0.34 -0.04 -0.72 2.70 -2.28
20 4.739E-05 4.734E-05 4.660E-05 4.839E-05 4.626E-05 4.720E-05 1.74 0.41 0.30 -1.26 2.53 -1.98
25 5.846E-05 5.841E-05 5.723E-05 5.968E-05 5.719E-05 5.819E-05 1.77 0.45 0.37 -1.65 2.55 -1.73
30 6.806E-05 6.807E-05 6.652E-05 6.964E-05 6.680E-05 6.782E-05 1.83 0.35 0.37 -1.92 2.69 -1.50
35 7.642E-05 7.631E-05 7.448E-05 7.829E-05 7.511E-05 7.612E-05 1.92 0.39 0.25 -2.16 2.85 -1.33
40 8.344E-05 8.317E-05 8.116E-05 8.565E-05 8.211E-05 8.311E-05 2.03 0.40 0.08 -2.34 3.06 -1.20
98

Table 71. MOXGD. Isotopic Composition in Cell 24. 238U, atoms/barn*cm
MOXGD. Isotopic Composition in Cell 24. 238U, atoms/barn*cm Relative Deviation from Mean Value100%*(X-Mean)/Mean
BurnupMWd/kgHM
MCU TVS-M WIMS8A HELIOS MULTICELL
Mean R.M.S. %
MCU TVS-M WIMS8A HELIOS MULTICELL
0 1.927E-02 1.927E-02 1.927E-02 1.927E-02 1.927E-02 1.927E-02 0.01 0.01 0.00 0.00 0.00 0.01
1 1.926E-02 1.926E-02 1.926E-02 1.926E-02 1.926E-02 1.926E-02 0.01 0.00 -0.01 -0.01 -0.01 0.01
2 1.924E-02 1.924E-02 1.924E-02 1.924E-02 1.924E-02 1.924E-02 0.01 0.00 0.00 0.00 0.00 -0.02
3 1.923E-02 1.923E-02 1.923E-02 1.923E-02 1.923E-02 1.923E-02 0.01 0.00 0.00 0.00 0.00 -0.01
4 1.922E-02 1.922E-02 1.922E-02 1.922E-02 1.922E-02 1.922E-02 0.01 0.00 0.00 -0.01 0.00 0.00
5 1.921E-02 1.921E-02 1.920E-02 1.921E-02 1.921E-02 1.921E-02 0.01 -0.01 0.00 -0.01 0.00 0.02
6 1.919E-02 1.920E-02 1.919E-02 1.920E-02 1.919E-02 1.919E-02 0.01 0.00 0.01 -0.01 0.01 -0.02
7 1.918E-02 1.918E-02 1.918E-02 1.918E-02 1.918E-02 1.918E-02 0.01 0.00 0.01 -0.01 0.01 0.00
8 1.917E-02 1.917E-02 1.916E-02 1.917E-02 1.917E-02 1.917E-02 0.01 0.00 0.00 -0.02 0.01 0.01
9 1.916E-02 1.916E-02 1.915E-02 1.916E-02 1.916E-02 1.916E-02 0.02 0.00 0.00 -0.03 0.01 0.02
10 1.914E-02 1.914E-02 1.914E-02 1.914E-02 1.914E-02 1.914E-02 0.02 -0.01 0.01 -0.02 0.02 0.00
11 1.913E-02 1.913E-02 1.912E-02 1.913E-02 1.913E-02 1.913E-02 0.02 -0.01 0.01 -0.03 0.02 0.01
12 1.911E-02 1.912E-02 1.911E-02 1.912E-02 1.912E-02 1.911E-02 0.02 -0.01 0.01 -0.03 0.01 0.03
13 1.910E-02 1.910E-02 1.909E-02 1.910E-02 1.910E-02 1.910E-02 0.02 -0.01 0.01 -0.03 0.02 0.00
14 1.908E-02 1.909E-02 1.908E-02 1.909E-02 1.909E-02 1.909E-02 0.02 -0.01 0.01 -0.03 0.02 0.02
15 1.907E-02 1.907E-02 1.907E-02 1.908E-02 1.907E-02 1.907E-02 0.02 -0.01 0.02 -0.03 0.03 -0.01
20 1.899E-02 1.900E-02 1.899E-02 1.901E-02 1.900E-02 1.900E-02 0.03 -0.03 0.02 -0.04 0.04 0.01
25 1.892E-02 1.893E-02 1.891E-02 1.893E-02 1.893E-02 1.892E-02 0.04 -0.03 0.02 -0.05 0.04 0.03
30 1.884E-02 1.885E-02 1.884E-02 1.886E-02 1.885E-02 1.885E-02 0.04 -0.03 0.02 -0.06 0.05 0.02
35 1.876E-02 1.877E-02 1.875E-02 1.878E-02 1.877E-02 1.877E-02 0.05 -0.04 0.02 -0.06 0.06 0.02
40 1.867E-02 1.869E-02 1.867E-02 1.870E-02 1.869E-02 1.868E-02 0.06 -0.06 0.02 -0.07 0.07 0.03
99

Table 72. MOXGD. Isotopic Composition in Cell 24. 239Pu, atoms/barn*cm
MOXGD. Isotopic Composition in Cell 24. 239Pu, atoms/barn*cm Relative Deviation from Mean Value100%*(X-Mean)/Mean
BurnupMWd/kgHM
MCU TVS-M WIMS8A HELIOS MULTICELL
Mean R.M.S.%
MCU TVS-M WIMS8A HELIOS MULTICELL
0 0.000E+00 0.000E+00 0.000E+00 0.000E+00 0.000E+00 0.000E+00 0.00 0.00 0.00 0.00 0.00 0.00
1 8.820E-06 8.767E-06 9.148E-06 8.704E-06 8.811E-06 8.850E-06 1.96 -0.34 -0.94 3.37 -1.65 -0.44
2 1.916E-05 1.878E-05 1.965E-05 1.849E-05 1.891E-05 1.900E-05 2.31 0.84 -1.15 3.45 -2.69 -0.46
3 2.918E-05 2.852E-05 2.987E-05 2.800E-05 2.875E-05 2.886E-05 2.45 1.09 -1.19 3.49 -3.00 -0.40
4 3.885E-05 3.795E-05 3.976E-05 3.721E-05 3.829E-05 3.841E-05 2.50 1.15 -1.21 3.51 -3.14 -0.32
5 4.814E-05 4.703E-05 4.928E-05 4.608E-05 4.750E-05 4.761E-05 2.52 1.13 -1.21 3.52 -3.21 -0.22
6 5.699E-05 5.573E-05 5.841E-05 5.459E-05 5.634E-05 5.641E-05 2.52 1.03 -1.20 3.54 -3.24 -0.13
7 6.556E-05 6.403E-05 6.711E-05 6.271E-05 6.479E-05 6.484E-05 2.54 1.12 -1.25 3.50 -3.29 -0.08
8 7.355E-05 7.190E-05 7.536E-05 7.042E-05 7.283E-05 7.281E-05 2.53 1.02 -1.25 3.50 -3.29 0.02
9 8.117E-05 7.932E-05 8.315E-05 7.770E-05 8.042E-05 8.035E-05 2.54 1.02 -1.29 3.48 -3.30 0.08
10 8.819E-05 8.627E-05 9.046E-05 8.455E-05 8.755E-05 8.740E-05 2.52 0.90 -1.30 3.50 -3.26 0.17
11 9.490E-05 9.274E-05 9.728E-05 9.094E-05 9.421E-05 9.401E-05 2.53 0.95 -1.36 3.47 -3.27 0.21
12 1.011E-04 9.873E-05 1.036E-04 9.688E-05 1.004E-04 1.001E-04 2.53 0.95 -1.42 3.46 -3.26 0.25
13 1.068E-04 1.043E-04 1.095E-04 1.024E-04 1.061E-04 1.058E-04 2.53 0.93 -1.46 3.48 -3.23 0.28
14 1.121E-04 1.094E-04 1.149E-04 1.075E-04 1.114E-04 1.111E-04 2.55 0.95 -1.53 3.49 -3.22 0.30
15 1.174E-04 1.141E-04 1.200E-04 1.122E-04 1.163E-04 1.160E-04 2.59 1.22 -1.67 3.45 -3.26 0.26
20 1.366E-04 1.329E-04 1.404E-04 1.313E-04 1.359E-04 1.354E-04 2.62 0.86 -1.88 3.71 -3.06 0.37
25 1.497E-04 1.455E-04 1.544E-04 1.441E-04 1.492E-04 1.486E-04 2.72 0.73 -2.08 3.93 -3.00 0.42
30 1.586E-04 1.534E-04 1.635E-04 1.522E-04 1.575E-04 1.570E-04 2.86 1.01 -2.33 4.10 -3.07 0.29
35 1.641E-04 1.576E-04 1.687E-04 1.566E-04 1.620E-04 1.618E-04 3.05 1.40 -2.58 4.27 -3.21 0.12
40 1.670E-04 1.592E-04 1.711E-04 1.582E-04 1.635E-04 1.638E-04 3.29 1.98 -2.83 4.43 -3.40 -0.18
100

Table 73. MOXGD. Isotopic Composition in Cell 24. 240Pu, atoms/barn*cm
MOXGD. Isotopic Composition in Cell 24. 240Pu, atoms/barn*cm Relative Deviation from Mean Value100%*(X-Mean)/Mean
BurnupMWd/kgHM
MCU TVS-M WIMS8A HELIOS MULTICELL
Mean R.M.S. %
MCU TVS-M WIMS8A HELIOS MULTICELL
0 0.000E+00 0.000E+00 0.000E+00 0.000E+00 0.000E+00 0.000E+00 0.00 0.00 0.00 0.00 0.00 0.00
1 6.229E-08 6.211E-08 6.541E-08 5.149E-08 5.024E-08 5.831E-08 11.89 6.83 6.51 12.18 -11.68 -13.84
2 2.614E-07 2.583E-07 2.731E-07 2.329E-07 2.287E-07 2.509E-07 7.66 4.20 2.95 8.87 -7.18 -8.84
3 6.048E-07 5.894E-07 6.209E-07 5.438E-07 5.367E-07 5.791E-07 6.44 4.44 1.78 7.22 -6.11 -7.32
4 1.076E-06 1.055E-06 1.105E-06 9.809E-07 9.728E-07 1.038E-06 5.63 3.64 1.64 6.46 -5.48 -6.26
5 1.679E-06 1.653E-06 1.721E-06 1.541E-06 1.535E-06 1.625E-06 5.15 3.27 1.66 5.86 -5.22 -5.57
6 2.403E-06 2.380E-06 2.465E-06 2.219E-06 2.221E-06 2.338E-06 4.78 2.81 1.82 5.43 -5.08 -4.99
7 3.235E-06 3.235E-06 3.332E-06 3.012E-06 3.028E-06 3.169E-06 4.46 2.10 2.11 5.17 -4.94 -4.44
8 4.205E-06 4.215E-06 4.320E-06 3.916E-06 3.955E-06 4.122E-06 4.29 2.01 2.26 4.79 -5.01 -4.06
9 5.291E-06 5.317E-06 5.423E-06 4.927E-06 4.999E-06 5.191E-06 4.16 1.92 2.42 4.46 -5.10 -3.70
10 6.492E-06 6.537E-06 6.636E-06 6.039E-06 6.156E-06 6.372E-06 4.07 1.88 2.59 4.14 -5.22 -3.39
11 7.787E-06 7.871E-06 7.953E-06 7.248E-06 7.421E-06 7.656E-06 3.99 1.72 2.80 3.88 -5.33 -3.07
12 9.165E-06 9.308E-06 9.360E-06 8.544E-06 8.786E-06 9.033E-06 3.92 1.47 3.05 3.62 -5.41 -2.73
13 1.060E-05 1.084E-05 1.084E-05 9.914E-06 1.024E-05 1.049E-05 3.85 1.09 3.33 3.40 -5.46 -2.35
14 1.212E-05 1.244E-05 1.238E-05 1.134E-05 1.176E-05 1.201E-05 3.83 0.91 3.58 3.13 -5.55 -2.07
15 1.370E-05 1.410E-05 1.397E-05 1.281E-05 1.334E-05 1.358E-05 3.82 0.88 3.76 2.84 -5.67 -1.80
20 2.217E-05 2.270E-05 2.220E-05 2.042E-05 2.153E-05 2.180E-05 4.03 1.68 4.11 1.81 -6.35 -1.25
25 3.062E-05 3.145E-05 3.048E-05 2.808E-05 2.992E-05 3.011E-05 4.18 1.70 4.44 1.23 -6.75 -0.63
30 3.836E-05 4.006E-05 3.855E-05 3.553E-05 3.823E-05 3.814E-05 4.29 0.57 5.01 1.06 -6.87 0.22
35 4.580E-05 4.830E-05 4.622E-05 4.258E-05 4.622E-05 4.582E-05 4.49 -0.04 5.40 0.86 -7.08 0.87
40 5.219E-05 5.597E-05 5.331E-05 4.907E-05 5.372E-05 5.285E-05 4.77 -1.25 5.89 0.86 -7.15 1.64
101
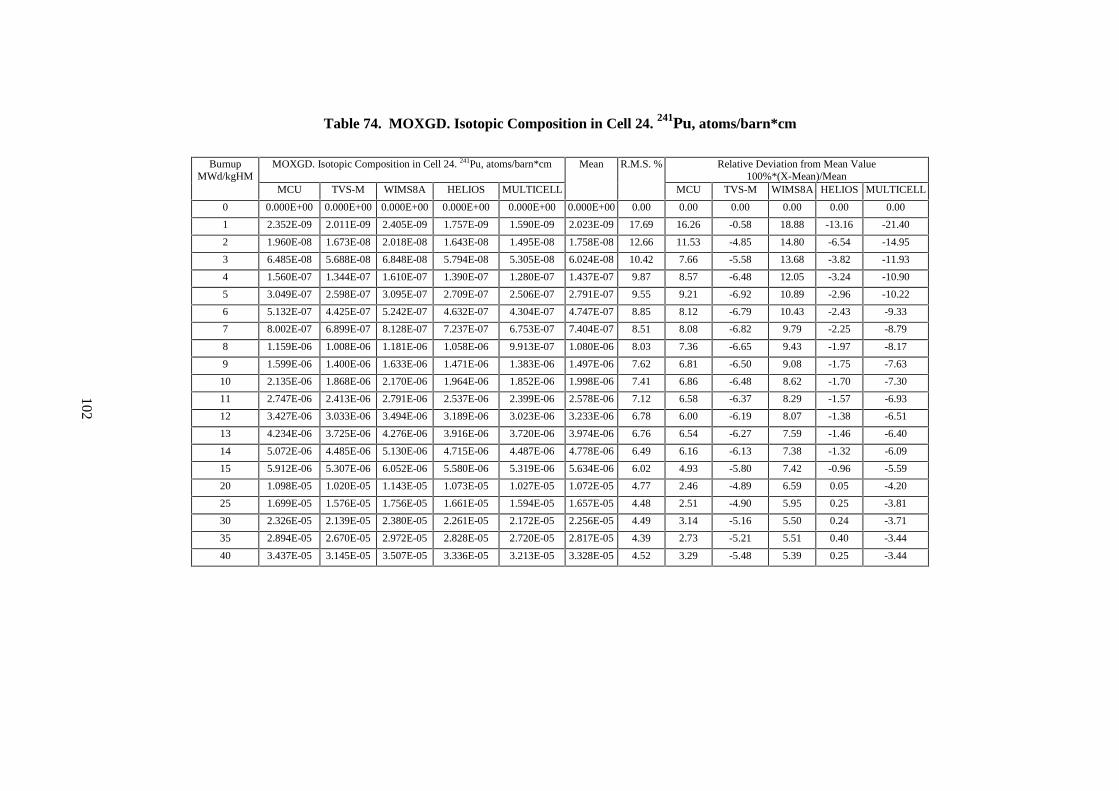
Table 74. MOXGD. Isotopic Composition in Cell 24. 241Pu, atoms/barn*cm
MOXGD. Isotopic Composition in Cell 24. 241Pu, atoms/barn*cm Relative Deviation from Mean Value100%*(X-Mean)/Mean
BurnupMWd/kgHM
MCU TVS-M WIMS8A HELIOS MULTICELL
Mean R.M.S. %
MCU TVS-M WIMS8A HELIOS MULTICELL
0 0.000E+00 0.000E+00 0.000E+00 0.000E+00 0.000E+00 0.000E+00 0.00 0.00 0.00 0.00 0.00 0.00
1 2.352E-09 2.011E-09 2.405E-09 1.757E-09 1.590E-09 2.023E-09 17.69 16.26 -0.58 18.88 -13.16 -21.40
2 1.960E-08 1.673E-08 2.018E-08 1.643E-08 1.495E-08 1.758E-08 12.66 11.53 -4.85 14.80 -6.54 -14.95
3 6.485E-08 5.688E-08 6.848E-08 5.794E-08 5.305E-08 6.024E-08 10.42 7.66 -5.58 13.68 -3.82 -11.93
4 1.560E-07 1.344E-07 1.610E-07 1.390E-07 1.280E-07 1.437E-07 9.87 8.57 -6.48 12.05 -3.24 -10.90
5 3.049E-07 2.598E-07 3.095E-07 2.709E-07 2.506E-07 2.791E-07 9.55 9.21 -6.92 10.89 -2.96 -10.22
6 5.132E-07 4.425E-07 5.242E-07 4.632E-07 4.304E-07 4.747E-07 8.85 8.12 -6.79 10.43 -2.43 -9.33
7 8.002E-07 6.899E-07 8.128E-07 7.237E-07 6.753E-07 7.404E-07 8.51 8.08 -6.82 9.79 -2.25 -8.79
8 1.159E-06 1.008E-06 1.181E-06 1.058E-06 9.913E-07 1.080E-06 8.03 7.36 -6.65 9.43 -1.97 -8.17
9 1.599E-06 1.400E-06 1.633E-06 1.471E-06 1.383E-06 1.497E-06 7.62 6.81 -6.50 9.08 -1.75 -7.63
10 2.135E-06 1.868E-06 2.170E-06 1.964E-06 1.852E-06 1.998E-06 7.41 6.86 -6.48 8.62 -1.70 -7.30
11 2.747E-06 2.413E-06 2.791E-06 2.537E-06 2.399E-06 2.578E-06 7.12 6.58 -6.37 8.29 -1.57 -6.93
12 3.427E-06 3.033E-06 3.494E-06 3.189E-06 3.023E-06 3.233E-06 6.78 6.00 -6.19 8.07 -1.38 -6.51
13 4.234E-06 3.725E-06 4.276E-06 3.916E-06 3.720E-06 3.974E-06 6.76 6.54 -6.27 7.59 -1.46 -6.40
14 5.072E-06 4.485E-06 5.130E-06 4.715E-06 4.487E-06 4.778E-06 6.49 6.16 -6.13 7.38 -1.32 -6.09
15 5.912E-06 5.307E-06 6.052E-06 5.580E-06 5.319E-06 5.634E-06 6.02 4.93 -5.80 7.42 -0.96 -5.59
20 1.098E-05 1.020E-05 1.143E-05 1.073E-05 1.027E-05 1.072E-05 4.77 2.46 -4.89 6.59 0.05 -4.20
25 1.699E-05 1.576E-05 1.756E-05 1.661E-05 1.594E-05 1.657E-05 4.48 2.51 -4.90 5.95 0.25 -3.81
30 2.326E-05 2.139E-05 2.380E-05 2.261E-05 2.172E-05 2.256E-05 4.49 3.14 -5.16 5.50 0.24 -3.71
35 2.894E-05 2.670E-05 2.972E-05 2.828E-05 2.720E-05 2.817E-05 4.39 2.73 -5.21 5.51 0.40 -3.44
40 3.437E-05 3.145E-05 3.507E-05 3.336E-05 3.213E-05 3.328E-05 4.52 3.29 -5.48 5.39 0.25 -3.44
102

Table 75. MOXGD. Isotopic Composition in Cell 24. 242Pu, atoms/barn*cm
MOXGD. Isotopic Composition in Cell 24. 242Pu, atoms/barn*cm Relative Deviation from Mean Value100%*(X-Mean)/Mean
BurnupMWd/kgHM
MCU TVS-M WIMS8A HELIOS MULTICELL
Mean R.M.S. %
MCU TVS-M WIMS8A HELIOS MULTICELL
0 0.000E+00 0.000E+00 0.000E+00 0.000E+00 0.000E+00 0.000E+00 0.00 0.00 0.00 0.00 0.00 0.00
1 5.107E-12 4.128E-12 4.426E-12 2.923E-12 2.582E-12 3.833E-12 27.53 33.24 7.69 15.46 -23.75 -32.64
2 8.616E-11 7.323E-11 7.961E-11 6.143E-11 5.283E-11 7.065E-11 19.12 21.95 3.64 12.69 -13.06 -25.22
3 4.661E-10 3.975E-10 4.312E-10 3.493E-10 3.014E-10 3.891E-10 16.78 19.78 2.16 10.83 -10.23 -22.54
4 1.535E-09 1.329E-09 1.432E-09 1.189E-09 1.032E-09 1.303E-09 15.24 17.81 1.97 9.84 -8.81 -20.82
5 3.974E-09 3.400E-09 3.633E-09 3.062E-09 2.681E-09 3.350E-09 14.94 18.63 1.49 8.45 -8.59 -19.97
6 8.551E-09 7.336E-09 7.779E-09 6.623E-09 5.845E-09 7.227E-09 14.42 18.32 1.52 7.64 -8.36 -19.12
7 1.618E-08 1.407E-08 1.481E-08 1.270E-08 1.130E-08 1.381E-08 13.65 17.16 1.86 7.21 -8.05 -18.18
8 2.844E-08 2.473E-08 2.585E-08 2.230E-08 2.000E-08 2.426E-08 13.38 17.22 1.91 6.52 -8.08 -17.57
9 4.638E-08 4.066E-08 4.222E-08 3.662E-08 3.308E-08 3.979E-08 12.89 16.56 2.18 6.09 -7.96 -16.87
10 7.232E-08 6.340E-08 6.542E-08 5.699E-08 5.185E-08 6.200E-08 12.71 16.65 2.27 5.51 -8.07 -16.37
11 1.077E-07 9.467E-08 9.706E-08 8.489E-08 7.777E-08 9.242E-08 12.48 16.54 2.43 5.02 -8.15 -15.85
12 1.536E-07 1.363E-07 1.388E-07 1.218E-07 1.124E-07 1.326E-07 12.02 15.84 2.78 4.69 -8.09 -15.21
13 2.131E-07 1.899E-07 1.921E-07 1.693E-07 1.572E-07 1.843E-07 11.76 15.60 3.02 4.23 -8.13 -14.72
14 2.868E-07 2.571E-07 2.584E-07 2.287E-07 2.136E-07 2.489E-07 11.44 15.21 3.29 3.81 -8.12 -14.19
15 3.737E-07 3.393E-07 3.387E-07 3.010E-07 2.826E-07 3.271E-07 10.94 14.27 3.73 3.56 -7.97 -13.59
20 1.074E-06 1.002E-06 9.754E-07 8.827E-07 8.415E-07 9.551E-07 9.77 12.41 4.95 2.12 -7.59 -11.89
25 2.265E-06 2.149E-06 2.059E-06 1.886E-06 1.808E-06 2.034E-06 9.22 11.40 5.70 1.27 -7.28 -11.09
30 3.999E-06 3.826E-06 3.629E-06 3.345E-06 3.212E-06 3.602E-06 9.07 11.03 6.21 0.75 -7.15 -10.83
35 6.251E-06 6.034E-06 5.683E-06 5.256E-06 5.048E-06 5.654E-06 8.96 10.55 6.71 0.50 -7.04 -10.72
40 8.909E-06 8.742E-06 8.189E-06 7.587E-06 7.276E-06 8.140E-06 8.71 9.44 7.39 0.59 -6.80 -10.62
103

Table 76. MOXGD. Isotopic Composition in Cell 24. 135Xe, atoms/barn*cm
MOXGD. Isotopic Composition in Cell 24. 135Xe, atoms/barn*cm Relative Deviation from Mean Value100%*(X-Mean)/Mean
BurnupMWd/kgHM
MCU TVS-M WIMS8A HELIOS MULTICELL
Mean R.M.S. %
MCU TVS-M WIMS8A HELIOS MULTICELL
1 9.606E-09 9.393E-09 9.589E-09 8.723E-09 9.432E-09 9.349E-09 3.87 2.76 0.47 2.57 -6.69 0.89
2 9.963E-09 9.681E-09 9.891E-09 9.030E-09 9.777E-09 9.668E-09 3.86 3.05 0.13 2.30 -6.60 1.12
3 1.024E-08 9.933E-09 1.015E-08 9.312E-09 1.008E-08 9.943E-09 3.72 3.01 -0.10 2.05 -6.35 1.38
4 1.044E-08 1.015E-08 1.037E-08 9.567E-09 1.034E-08 1.017E-08 3.49 2.63 -0.22 1.91 -5.95 1.64
5 1.058E-08 1.033E-08 1.055E-08 9.794E-09 1.057E-08 1.036E-08 3.24 2.10 -0.33 1.77 -5.51 1.98
6 1.072E-08 1.047E-08 1.069E-08 9.987E-09 1.075E-08 1.052E-08 3.04 1.87 -0.52 1.59 -5.10 2.15
7 1.086E-08 1.057E-08 1.079E-08 1.015E-08 1.089E-08 1.065E-08 2.91 2.01 -0.80 1.29 -4.74 2.25
8 1.088E-08 1.061E-08 1.084E-08 1.026E-08 1.098E-08 1.072E-08 2.67 1.55 -0.95 1.14 -4.22 2.47
9 1.107E-08 1.062E-08 1.084E-08 1.034E-08 1.103E-08 1.078E-08 2.83 2.70 -1.52 0.60 -4.10 2.31
10 1.094E-08 1.058E-08 1.081E-08 1.038E-08 1.102E-08 1.074E-08 2.47 1.80 -1.57 0.63 -3.43 2.56
11 1.091E-08 1.050E-08 1.076E-08 1.038E-08 1.098E-08 1.071E-08 2.41 1.87 -1.89 0.49 -3.04 2.57
12 1.087E-08 1.043E-08 1.071E-08 1.037E-08 1.091E-08 1.066E-08 2.32 1.97 -2.13 0.47 -2.69 2.38
13 1.081E-08 1.038E-08 1.067E-08 1.036E-08 1.086E-08 1.062E-08 2.22 1.81 -2.26 0.55 -2.39 2.30
14 1.076E-08 1.034E-08 1.066E-08 1.037E-08 1.083E-08 1.059E-08 2.13 1.61 -2.37 0.63 -2.12 2.25
15 1.076E-08 1.032E-08 1.066E-08 1.038E-08 1.081E-08 1.059E-08 2.12 1.66 -2.52 0.74 -1.99 2.11
20 1.087E-08 1.028E-08 1.070E-08 1.039E-08 1.082E-08 1.061E-08 2.48 2.43 -3.12 0.83 -2.09 1.96
25 1.079E-08 1.018E-08 1.067E-08 1.041E-08 1.077E-08 1.056E-08 2.50 2.14 -3.66 1.00 -1.47 1.98
30 1.054E-08 9.982E-09 1.055E-08 1.032E-08 1.063E-08 1.040E-08 2.52 1.29 -4.06 1.39 -0.79 2.17
35 1.024E-08 9.720E-09 1.036E-08 1.015E-08 1.040E-08 1.017E-08 2.67 0.64 -4.47 1.81 -0.20 2.22
40 1.007E-08 9.411E-09 1.011E-08 9.918E-09 1.011E-08 9.924E-09 3.00 1.44 -5.17 1.92 -0.06 1.87
104

Table 77. MOXGD. Isotopic Composition in Cell 24. 149Sm, atoms/barn*cm(codes with equilibrium concentration of 149Sm at 0MWd/kgHM)
MOXGD. Isotopic Composition in Cell 24. 149Sm,atoms/barn*cm
Relative Deviation from Mean Value100%*(X-Mean)/Mean
BurnupMWd/kgHM
TVS-M HELIOS
Mean R.M.S. %
TVS-M HELIOS
0 4.183E-07 3.341E-07 3.762E-07 15.82 11.18 -11.18
1 3.658E-07 3.236E-07 3.447E-07 8.65 6.12 -6.12
2 3.172E-07 3.183E-07 3.177E-07 0.25 -0.18 0.18
3 2.734E-07 3.079E-07 2.906E-07 8.39 -5.94 5.94
4 2.356E-07 2.925E-07 2.640E-07 15.24 -10.77 10.77
5 2.038E-07 2.726E-07 2.382E-07 20.42 -14.44 14.44
6 1.777E-07 2.490E-07 2.133E-07 23.65 -16.72 16.72
7 1.567E-07 2.232E-07 1.900E-07 24.74 -17.49 17.49
8 1.404E-07 1.969E-07 1.686E-07 23.72 -16.77 16.77
9 1.277E-07 1.722E-07 1.500E-07 20.97 -14.83 14.83
10 1.181E-07 1.511E-07 1.346E-07 17.34 -12.26 12.26
11 1.111E-07 1.352E-07 1.231E-07 13.83 -9.78 9.78
12 1.066E-07 1.248E-07 1.157E-07 11.15 -7.88 7.88
13 1.041E-07 1.191E-07 1.116E-07 9.52 -6.73 6.73
14 1.029E-07 1.165E-07 1.097E-07 8.74 -6.18 6.18
15 1.025E-07 1.155E-07 1.090E-07 8.39 -5.94 5.94
20 1.049E-07 1.190E-07 1.119E-07 8.91 -6.30 6.30
25 1.067E-07 1.220E-07 1.144E-07 9.46 -6.69 6.69
30 1.070E-07 1.233E-07 1.151E-07 10.00 -7.07 7.07
35 1.060E-07 1.230E-07 1.145E-07 10.47 -7.40 7.40
40 1.042E-07 1.215E-07 1.129E-07 10.84 -7.67 7.67
105

Table 78. MOXGD. Isotopic Composition in Cell 24. 149Sm, atoms/barn*cm(codes with zero concentration of 149Sm at 0MWd/kgHM)
MOXGD. Isotopic Composition in Cell 24. 149Sm,atoms/barn*cm
Relative Deviation from Mean Value100%*(X-Mean)/Mean
BurnupMWd/kgHM
MCU WIMS8A MULTICELL
Mean R.M.S. %
MCU WIMS8A MULTICELL
1 6.379E-08 6.308E-08 6.226E-08 6.305E-08 1.22 1.19 0.06 -1.25
2 1.212E-07 1.196E-07 1.178E-07 1.195E-07 1.41 1.37 0.07 -1.44
3 1.610E-07 1.586E-07 1.565E-07 1.587E-07 1.41 1.45 -0.07 -1.38
4 1.844E-07 1.816E-07 1.802E-07 1.821E-07 1.19 1.29 -0.26 -1.04
5 1.949E-07 1.910E-07 1.914E-07 1.924E-07 1.11 1.28 -0.74 -0.53
6 1.936E-07 1.893E-07 1.923E-07 1.917E-07 1.14 0.97 -1.25 0.29
7 1.843E-07 1.796E-07 1.854E-07 1.831E-07 1.69 0.66 -1.92 1.25
8 1.691E-07 1.650E-07 1.731E-07 1.690E-07 2.40 0.01 -2.41 2.40
9 1.524E-07 1.488E-07 1.583E-07 1.532E-07 3.12 -0.51 -2.83 3.34
10 1.382E-07 1.342E-07 1.435E-07 1.386E-07 3.36 -0.33 -3.18 3.51
11 1.268E-07 1.232E-07 1.310E-07 1.270E-07 3.08 -0.13 -3.01 3.14
12 1.183E-07 1.164E-07 1.221E-07 1.189E-07 2.45 -0.54 -2.13 2.67
13 1.131E-07 1.130E-07 1.171E-07 1.144E-07 2.05 -1.15 -1.21 2.36
14 1.121E-07 1.117E-07 1.149E-07 1.129E-07 1.53 -0.73 -1.03 1.76
15 1.111E-07 1.116E-07 1.142E-07 1.123E-07 1.48 -1.09 -0.60 1.69
20 1.131E-07 1.164E-07 1.184E-07 1.160E-07 2.29 -2.44 0.35 2.09
25 1.175E-07 1.203E-07 1.223E-07 1.200E-07 2.00 -2.10 0.21 1.88
30 1.144E-07 1.223E-07 1.240E-07 1.202E-07 4.24 -4.82 1.69 3.13
35 1.120E-07 1.227E-07 1.239E-07 1.195E-07 5.47 -6.29 2.62 3.67
40 1.120E-07 1.219E-07 1.225E-07 1.188E-07 4.94 -5.70 2.59 3.11
106
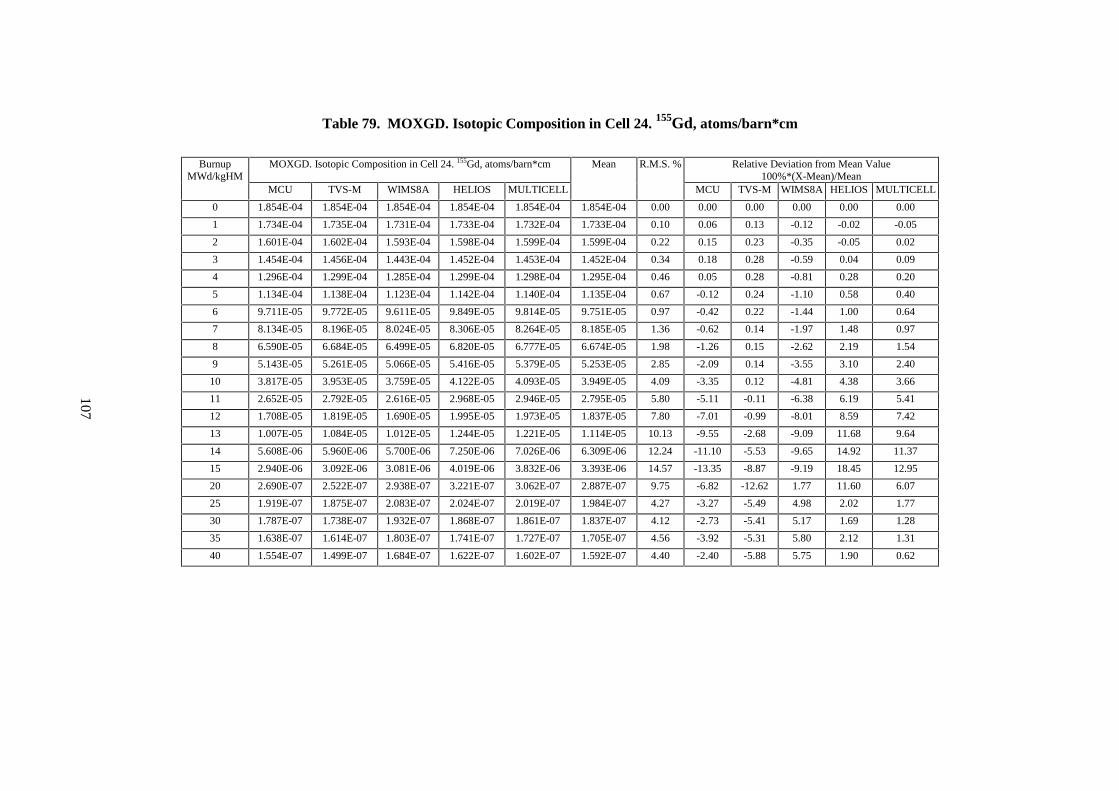
Table 79. MOXGD. Isotopic Composition in Cell 24. 155Gd, atoms/barn*cm
MOXGD. Isotopic Composition in Cell 24. 155Gd, atoms/barn*cm Relative Deviation from Mean Value100%*(X-Mean)/Mean
BurnupMWd/kgHM
MCU TVS-M WIMS8A HELIOS MULTICELL
Mean R.M.S. %
MCU TVS-M WIMS8A HELIOS MULTICELL
0 1.854E-04 1.854E-04 1.854E-04 1.854E-04 1.854E-04 1.854E-04 0.00 0.00 0.00 0.00 0.00 0.00
1 1.734E-04 1.735E-04 1.731E-04 1.733E-04 1.732E-04 1.733E-04 0.10 0.06 0.13 -0.12 -0.02 -0.05
2 1.601E-04 1.602E-04 1.593E-04 1.598E-04 1.599E-04 1.599E-04 0.22 0.15 0.23 -0.35 -0.05 0.02
3 1.454E-04 1.456E-04 1.443E-04 1.452E-04 1.453E-04 1.452E-04 0.34 0.18 0.28 -0.59 0.04 0.09
4 1.296E-04 1.299E-04 1.285E-04 1.299E-04 1.298E-04 1.295E-04 0.46 0.05 0.28 -0.81 0.28 0.20
5 1.134E-04 1.138E-04 1.123E-04 1.142E-04 1.140E-04 1.135E-04 0.67 -0.12 0.24 -1.10 0.58 0.40
6 9.711E-05 9.772E-05 9.611E-05 9.849E-05 9.814E-05 9.751E-05 0.97 -0.42 0.22 -1.44 1.00 0.64
7 8.134E-05 8.196E-05 8.024E-05 8.306E-05 8.264E-05 8.185E-05 1.36 -0.62 0.14 -1.97 1.48 0.97
8 6.590E-05 6.684E-05 6.499E-05 6.820E-05 6.777E-05 6.674E-05 1.98 -1.26 0.15 -2.62 2.19 1.54
9 5.143E-05 5.261E-05 5.066E-05 5.416E-05 5.379E-05 5.253E-05 2.85 -2.09 0.14 -3.55 3.10 2.40
10 3.817E-05 3.953E-05 3.759E-05 4.122E-05 4.093E-05 3.949E-05 4.09 -3.35 0.12 -4.81 4.38 3.66
11 2.652E-05 2.792E-05 2.616E-05 2.968E-05 2.946E-05 2.795E-05 5.80 -5.11 -0.11 -6.38 6.19 5.41
12 1.708E-05 1.819E-05 1.690E-05 1.995E-05 1.973E-05 1.837E-05 7.80 -7.01 -0.99 -8.01 8.59 7.42
13 1.007E-05 1.084E-05 1.012E-05 1.244E-05 1.221E-05 1.114E-05 10.13 -9.55 -2.68 -9.09 11.68 9.64
14 5.608E-06 5.960E-06 5.700E-06 7.250E-06 7.026E-06 6.309E-06 12.24 -11.10 -5.53 -9.65 14.92 11.37
15 2.940E-06 3.092E-06 3.081E-06 4.019E-06 3.832E-06 3.393E-06 14.57 -13.35 -8.87 -9.19 18.45 12.95
20 2.690E-07 2.522E-07 2.938E-07 3.221E-07 3.062E-07 2.887E-07 9.75 -6.82 -12.62 1.77 11.60 6.07
25 1.919E-07 1.875E-07 2.083E-07 2.024E-07 2.019E-07 1.984E-07 4.27 -3.27 -5.49 4.98 2.02 1.77
30 1.787E-07 1.738E-07 1.932E-07 1.868E-07 1.861E-07 1.837E-07 4.12 -2.73 -5.41 5.17 1.69 1.28
35 1.638E-07 1.614E-07 1.803E-07 1.741E-07 1.727E-07 1.705E-07 4.56 -3.92 -5.31 5.80 2.12 1.31
40 1.554E-07 1.499E-07 1.684E-07 1.622E-07 1.602E-07 1.592E-07 4.40 -2.40 -5.88 5.75 1.90 0.62
107

Table 80. MOXGD. Isotopic Composition in Cell 24. 157Gd, atoms/barn*cm
MOXGD. Isotopic Composition in Cell 24. 157Gd, atoms/barn*cm Relative deviation from Mean Value100%*(X-Mean)/Mean
BurnupMWd/kgHM
MCU TVS-M WIMS8A HELIOS MULTICELL
Mean R.M.S. %
MCU TVS-M WIMS8A HELIOS MULTICELL
0 1.948E-04 1.948E-04 1.948E-04 1.948E-04 1.948E-04 1.948E-04 0.00 0.00 0.00 0.00 0.00 0.00
1 1.616E-04 1.615E-04 1.613E-04 1.625E-04 1.620E-04 1.618E-04 0.28 -0.12 -0.16 -0.29 0.42 0.14
2 1.317E-04 1.316E-04 1.312E-04 1.333E-04 1.327E-04 1.321E-04 0.68 -0.32 -0.39 -0.69 0.94 0.46
3 1.051E-04 1.053E-04 1.045E-04 1.074E-04 1.067E-04 1.058E-04 1.15 -0.67 -0.51 -1.21 1.54 0.86
4 8.185E-05 8.240E-05 8.119E-05 8.461E-05 8.405E-05 8.282E-05 1.76 -1.17 -0.51 -1.97 2.16 1.49
5 6.194E-05 6.265E-05 6.103E-05 6.475E-05 6.437E-05 6.295E-05 2.52 -1.61 -0.47 -3.05 2.87 2.26
6 4.483E-05 4.580E-05 4.391E-05 4.771E-05 4.749E-05 4.595E-05 3.60 -2.43 -0.32 -4.44 3.84 3.35
7 3.096E-05 3.174E-05 2.976E-05 3.342E-05 3.334E-05 3.184E-05 4.93 -2.79 -0.34 -6.53 4.96 4.70
8 1.949E-05 2.040E-05 1.856E-05 2.184E-05 2.185E-05 2.043E-05 7.08 -4.57 -0.15 -9.13 6.90 6.96
9 1.089E-05 1.175E-05 1.028E-05 1.293E-05 1.297E-05 1.176E-05 10.21 -7.45 -0.12 -12.57 9.89 10.26
10 5.079E-06 5.760E-06 4.842E-06 6.649E-06 6.683E-06 5.802E-06 14.77 -12.47 -0.74 -16.55 14.58 15.18
11 1.927E-06 2.282E-06 1.915E-06 2.851E-06 2.852E-06 2.365E-06 19.76 -18.52 -3.51 -19.05 20.51 20.57
12 7.296E-07 8.097E-07 7.656E-07 1.079E-06 1.079E-06 8.925E-07 19.32 -18.25 -9.27 -14.22 20.84 20.90
13 4.059E-07 4.012E-07 4.514E-07 5.038E-07 5.225E-07 4.570E-07 12.10 -11.17 -12.20 -1.22 10.24 14.34
14 3.172E-07 3.127E-07 3.764E-07 3.655E-07 3.915E-07 3.527E-07 10.11 -10.05 -11.32 6.72 3.64 11.01
15 2.954E-07 2.851E-07 3.499E-07 3.279E-07 3.536E-07 3.224E-07 9.66 -8.38 -11.55 8.53 1.71 9.69
20 2.771E-07 2.510E-07 3.129E-07 2.898E-07 3.083E-07 2.878E-07 8.72 -3.72 -12.79 8.71 0.69 7.11
25 2.532E-07 2.373E-07 2.968E-07 2.727E-07 2.903E-07 2.701E-07 9.23 -6.25 -12.12 9.89 0.98 7.50
30 2.329E-07 2.250E-07 2.825E-07 2.589E-07 2.743E-07 2.547E-07 9.87 -8.55 -11.67 10.90 1.63 7.69
35 2.154E-07 2.134E-07 2.690E-07 2.459E-07 2.593E-07 2.406E-07 10.52 -10.48 -11.32 11.82 2.20 7.78
40 2.120E-07 2.026E-07 2.566E-07 2.338E-07 2.456E-07 2.301E-07 9.81 -7.86 -11.97 11.50 1.60 6.73
108

Table 81. MOXGD. Isotopic Composition in Cell 24 Deviation from Average Value, %. Burnup=40 MWd/kgHM
MOXGD. Isotopic Composition in Cell 24 Deviation from Average Value, %. Burnup=40 MWd/kgHM235U 236U 238U 239Pu 240Pu 241Pu 242Pu 135Xe 149Sm 155Gd 157Gd
MCU -0.87 0.40 -0.06 1.98 -1.25 3.29 9.44 1.44 -3.77 -2.40 -7.86
TVS-M -2.97 0.08 0.02 -2.83 5.89 -5.48 7.39 -5.17 -10.50 -5.88 -11.97
WIMS8A 1.79 -2.34 -0.07 4.43 0.86 5.39 0.59 1.92 4.68 5.75 11.50
HELIOS 1.16 3.06 0.07 -3.40 -7.15 0.25 -6.80 -0.06 4.37 1.90 1.60
MULTICELL 0.88 -1.20 0.03 -0.18 1.64 -3.44 -10.62 1.87 5.21 0.62 6.73
R.M.S. % 1.93 2.03 0.06 3.29 4.77 4.52 8.71 3.00 6.94 4.40 9.81
109

Table 82. MOXGD. Isotopic Composition in Cell 24 vs Radius, Burnup=40 MWd/kgHM. 235U, atoms/barn*cm
MOXGD. Isotopic Composition in Cell 24 vs Radius, Burnup=40 MWd/kgHM. 235U, atoms/barn*cmRadius, cm 0.173 0.244 0.299 0.345 0.386Zone No. 1 2 3 4 5 AverageMCU 3.021E-04 2.936E-04 2.853E-04 2.764E-04 2.646E-04 2.844E-04TVS-M 2.976E-04 2.893E-04 2.794E-04 2.690E-04 2.566E-04 2.784E-04WIMS8A 3.096E-04 3.016E-04 2.931E-04 2.836E-04 2.722E-04 2.920E-04HELIOS 3.056E-04 2.990E-04 2.913E-04 2.829E-04 2.724E-04 2.902E-04MULTICELL 3.090E-04 3.001E-04 2.905E-04 2.800E-04 2.676E-04 2.894E-04Mean 3.048E-04 2.967E-04 2.879E-04 2.784E-04 2.667E-04 2.869E-04R.M.S. % 1.64 1.73 1.93 2.15 2.44 1.93
Table 83. MOXGD. Isotopic Composition in Cell 24 vs Radius, Burnup=40 MWd/kgHM. 239Pu, atoms/barn*cm
MOXGD. Isotopic Composition in Cell 24 vs Radius, Burnup=40 MWd/kgHM. 239Pu, atoms/barn*cmRadius, cm 0.173 0.244 0.299 0.345 0.386Zone No. 1 2 3 4 5 AverageMCU 1.352E-04 1.384E-04 1.439E-04 1.590E-04 2.587E-04 1.670E-04TVS-M 1.320E-04 1.349E-04 1.400E-04 1.530E-04 2.360E-04 1.592E-04WIMS8A 1.415E-04 1.446E-04 1.501E-04 1.648E-04 2.543E-04 1.711E-04HELIOS 1.258E-04 1.294E-04 1.361E-04 1.524E-04 2.475E-04 1.582E-04MULTICELL 1.671E-04 1.655E-04 1.637E-04 1.618E-04 1.595E-04 1.635E-04Mean 1.403E-04 1.426E-04 1.468E-04 1.582E-04 2.312E-04 1.638E-04R.M.S. % 11.40 9.79 7.36 3.45 17.72 3.29
110
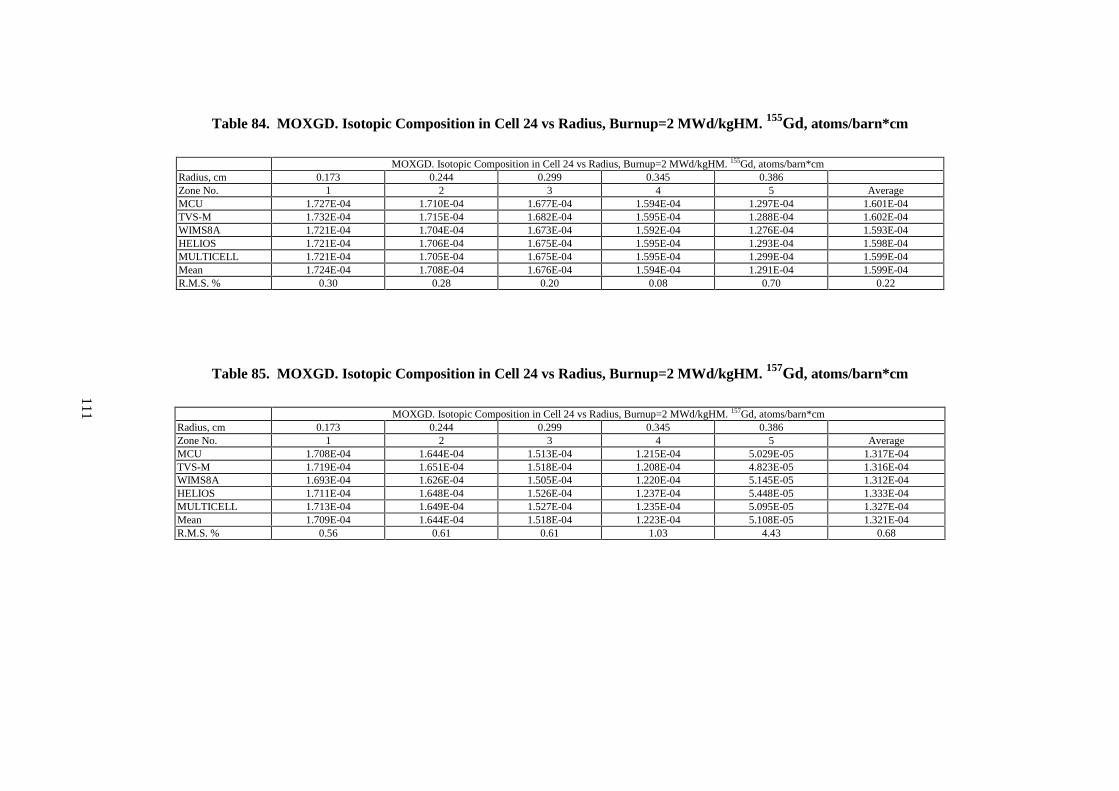
Table 84. MOXGD. Isotopic Composition in Cell 24 vs Radius, Burnup=2 MWd/kgHM. 155Gd, atoms/barn*cm
MOXGD. Isotopic Composition in Cell 24 vs Radius, Burnup=2 MWd/kgHM. 155Gd, atoms/barn*cmRadius, cm 0.173 0.244 0.299 0.345 0.386Zone No. 1 2 3 4 5 AverageMCU 1.727E-04 1.710E-04 1.677E-04 1.594E-04 1.297E-04 1.601E-04TVS-M 1.732E-04 1.715E-04 1.682E-04 1.595E-04 1.288E-04 1.602E-04WIMS8A 1.721E-04 1.704E-04 1.673E-04 1.592E-04 1.276E-04 1.593E-04HELIOS 1.721E-04 1.706E-04 1.675E-04 1.595E-04 1.293E-04 1.598E-04MULTICELL 1.721E-04 1.705E-04 1.675E-04 1.595E-04 1.299E-04 1.599E-04Mean 1.724E-04 1.708E-04 1.676E-04 1.594E-04 1.291E-04 1.599E-04R.M.S. % 0.30 0.28 0.20 0.08 0.70 0.22
Table 85. MOXGD. Isotopic Composition in Cell 24 vs Radius, Burnup=2 MWd/kgHM. 157Gd, atoms/barn*cm
MOXGD. Isotopic Composition in Cell 24 vs Radius, Burnup=2 MWd/kgHM. 157Gd, atoms/barn*cmRadius, cm 0.173 0.244 0.299 0.345 0.386Zone No. 1 2 3 4 5 AverageMCU 1.708E-04 1.644E-04 1.513E-04 1.215E-04 5.029E-05 1.317E-04TVS-M 1.719E-04 1.651E-04 1.518E-04 1.208E-04 4.823E-05 1.316E-04WIMS8A 1.693E-04 1.626E-04 1.505E-04 1.220E-04 5.145E-05 1.312E-04HELIOS 1.711E-04 1.648E-04 1.526E-04 1.237E-04 5.448E-05 1.333E-04MULTICELL 1.713E-04 1.649E-04 1.527E-04 1.235E-04 5.095E-05 1.327E-04Mean 1.709E-04 1.644E-04 1.518E-04 1.223E-04 5.108E-05 1.321E-04R.M.S. % 0.56 0.61 0.61 1.03 4.43 0.68
111

Table 86. MOXGD Reactivity Effects, 100*(Kinit-Kfin)
Initial State Final State Comment Burnup MCU TVS-M WIMS8A HELIOS MULTICELL MCNP4B Mean R.M.S. %
0 -3.22 -3.57 -3.18 -3.28 -3.38 -3.33 -4.70
20 -3.56 -3.31 -3.40 -3.38 -3.54 -3.44 -3.15
S1 S2 Xe+SmCb>0
40 -3.15 -2.84 -3.13 -3.10 -3.19 -3.08 -4.58
0 -3.39 -3.61 -3.41 -3.45 -3.53 -3.39 -3.46 -2.57
20 -3.79 -3.96 -3.73 -3.80 -3.89 -3.83 -2.32
S3 S4 Boron 0.6 g/kg
40 -4.04 -4.05 -3.85 -3.96 -4.02 -3.98 -2.10
0 1.72 1.62 1.81 1.75 1.86 1.69 1.74 4.90
20 1.44 1.46 1.68 1.65 1.54 1.55 6.88
S3 S2 T fuelCb>0
40 1.39 1.30 1.46 1.51 1.36 1.40 5.76
0 -7.92 -7.64 -8.14 -7.98 -7.66 -8.27 -7.93 -3.18
20 -7.34 -6.58 -7.37 -6.97 -6.90 -7.03 -4.68
S4 S5 T allCb=0
40 -5.89 -5.00 -5.75 -5.27 -5.16 -5.41 -7.14
112
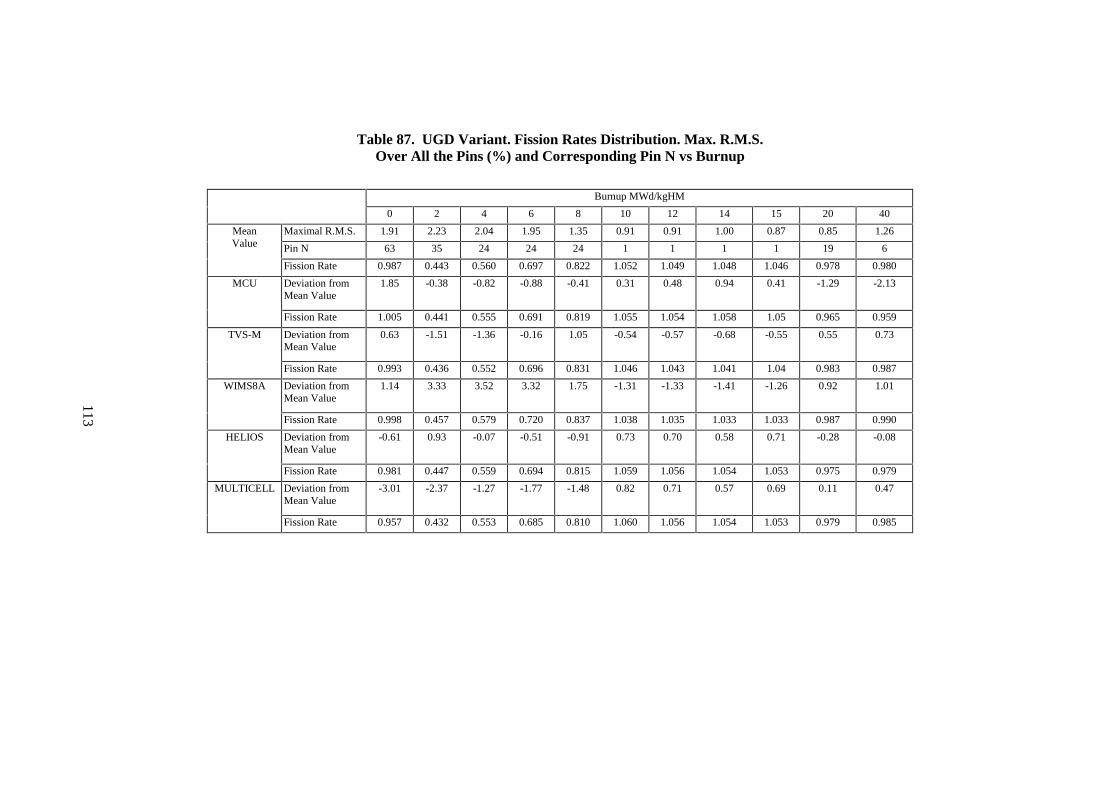
Table 87. UGD Variant. Fission Rates Distribution. Max. R.M.S.Over All the Pins (%) and Corresponding Pin N vs Burnup
Burnup MWd/kgHM
0 2 4 6 8 10 12 14 15 20 40
Maximal R.M.S. 1.91 2.23 2.04 1.95 1.35 0.91 0.91 1.00 0.87 0.85 1.26
Pin N 63 35 24 24 24 1 1 1 1 19 6
MeanValue
Fission Rate 0.987 0.443 0.560 0.697 0.822 1.052 1.049 1.048 1.046 0.978 0.980
Deviation fromMean Value
1.85 -0.38 -0.82 -0.88 -0.41 0.31 0.48 0.94 0.41 -1.29 -2.13MCU
Fission Rate 1.005 0.441 0.555 0.691 0.819 1.055 1.054 1.058 1.05 0.965 0.959
Deviation fromMean Value
0.63 -1.51 -1.36 -0.16 1.05 -0.54 -0.57 -0.68 -0.55 0.55 0.73TVS-M
Fission Rate 0.993 0.436 0.552 0.696 0.831 1.046 1.043 1.041 1.04 0.983 0.987
Deviation fromMean Value
1.14 3.33 3.52 3.32 1.75 -1.31 -1.33 -1.41 -1.26 0.92 1.01WIMS8A
Fission Rate 0.998 0.457 0.579 0.720 0.837 1.038 1.035 1.033 1.033 0.987 0.990
Deviation fromMean Value
-0.61 0.93 -0.07 -0.51 -0.91 0.73 0.70 0.58 0.71 -0.28 -0.08HELIOS
Fission Rate 0.981 0.447 0.559 0.694 0.815 1.059 1.056 1.054 1.053 0.975 0.979
Deviation fromMean Value
-3.01 -2.37 -1.27 -1.77 -1.48 0.82 0.71 0.57 0.69 0.11 0.47MULTICELL
Fission Rate 0.957 0.432 0.553 0.685 0.810 1.060 1.056 1.054 1.053 0.979 0.985
113

Table 88. UGD Variant. Fission Rates Distribution. Max. R.M.S.Over All the Pins (%) and Corresponding Pin N for Different States
Burnup MWd/kgHM
State - S1 State - S2 State - S3 State - S4 State - S5
0 20 40 0 20 40 0 20 40 0 20 40 0 20 40
Maximal R.M.S. 1.91 0.85 1.26 2.55 0.88 1.17 2.25 1.13 1.39 2.37 0.96 1.36 2.48 1.37 1.80
Pin N 63 19 6 35 1 6 35 64 6 35 58 6 35 1 6
MeanValue
Fission Rate 0.987 0.978 0.980 0.324 1.040 0.982 0.323 1.041 0.981 0.312 0.967 0.980 0.220 1.068 0.970
Deviation fromMean Value
1.85 -1.29 -2.13 -1.75 0.77 -1.95 -0.86 2.00 -2.37 -1.38 -1.47 -2.32 -0.96 1.54 -2.82MCU
Fission Rate 1.005 0.965 0.959 0.318 1.048 0.963 0.32 1.062 0.958 0.308 0.953 0.957 0.218 1.084 0.943
Deviation fromMean Value
0.63 0.55 0.73 -1.44 -0.77 0.70 -1.48 -0.40 0.79 -1.38 0.50 0.75 -1.41 0.23 0.07TVS-M
Fission Rate 0.993 0.983 0.987 0.319 1.032 0.989 0.318 1.037 0.989 0.308 0.972 0.987 0.217 1.07 0.971
Deviation fromMean Value
1.14 0.92 1.01 3.76 -1.13 0.98 3.32 -0.84 1.09 3.52 1.13 1.14 3.82 -1.67 1.53WIMS8A
Fission Rate 0.998 0.987 0.990 0.336 1.028 0.992 0.333 1.032 0.992 0.323 0.978 0.991 0.229 1.050 0.985
Deviation fromMean Value
-0.61 -0.28 -0.08 1.52 0.63 -0.14 1.21 -0.30 -0.03 1.34 -0.11 -0.04 1.00 1.02 -0.36HELIOS
Fission Rate 0.981 0.975 0.979 0.329 1.047 0.981 0.327 1.038 0.981 0.317 0.966 0.979 0.222 1.078 0.967
Deviation fromMean Value
-3.01 0.11 0.47 -2.09 0.50 0.40 -2.19 -0.45 0.52 -2.11 -0.05 0.47 -2.46 -1.13 1.58MULTICELL
Fission Rate 0.957 0.979 0.985 0.317 1.045 0.986 0.316 1.037 0.986 0.306 0.967 0.984 0.215 1.056 0.986
114

Table 89. MOXGD Variant. Fission Rates Distribution. Max. R.M.S.Over All the Pins (%) and Corresponding Pin N vs Burnup
Burnup MWd/kgHM
0 2 4 6 8 10 12 14 15 20 40
Maximal R.M.S. 1.82 1.65 1.49 1.51 1.86 2.41 2.93 2.97 2.89 2.19 1.59
Pin N 1 36 36 45 35 35 35 35 35 35 35
MeanValue
Fission Rate 0.991 1.093 1.100 1.119 0.521 0.590 0.664 0.730 0.756 0.828 0.954
Deviation fromMean Value
1.13 -2.29 -1.81 -1.58 -0.72 -0.42 -0.58 -0.54 -0.76 -0.28 -0.91MCU
Fission Rate 1.002 1.068 1.08 1.101 0.517 0.588 0.66 0.726 0.75 0.826 0.945
Deviation fromMean Value
-0.89 0.64 0.37 0.20 1.97 2.97 3.93 3.98 3.87 2.37 1.09TVS-M
Fission Rate 0.982 1.1 1.104 1.121 0.531 0.608 0.69 0.759 0.785 0.848 0.964
Deviation fromMean Value
-2.78 -0.97 -1.04 -0.97 0.29 -0.22 -0.66 -1.07 -1.12 -1.18 -0.83WIMS8A
Fission Rate 0.963 1.082 1.089 1.108 0.522 0.589 0.659 0.722 0.747 0.819 0.946
Deviation fromMean Value
0.92 0.64 0.45 0.00 -2.80 -3.55 -4.03 -3.94 -3.70 -2.87 -1.58HELIOS
Fission Rate 1.000 1.100 1.105 1.119 0.506 0.570 0.637 0.701 0.728 0.805 0.939
Deviation fromMean Value
1.62 1.98 2.03 2.36 1.26 1.22 1.34 1.58 1.71 1.95 2.23MULTICELL
Fission Rate 1.007 1.115 1.122 1.145 0.527 0.598 0.673 0.742 0.769 0.845 0.975
115
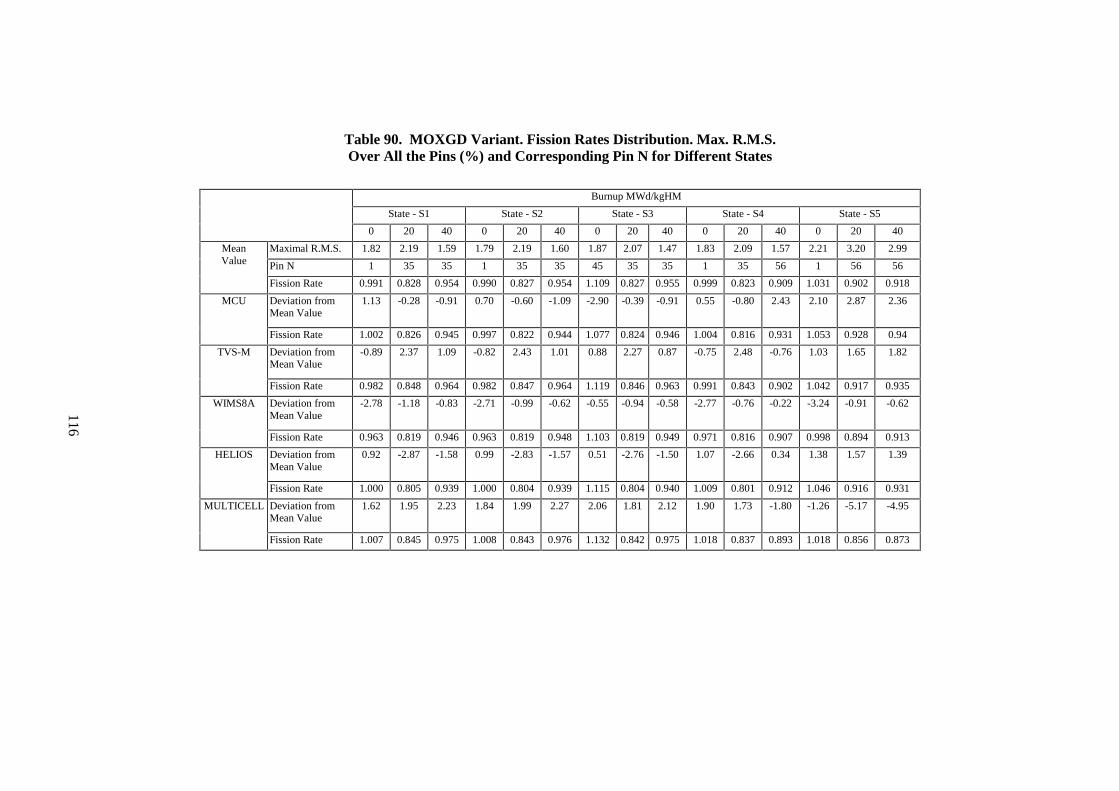
Table 90. MOXGD Variant. Fission Rates Distribution. Max. R.M.S.Over All the Pins (%) and Corresponding Pin N for Different States
Burnup MWd/kgHM
State - S1 State - S2 State - S3 State - S4 State - S5
0 20 40 0 20 40 0 20 40 0 20 40 0 20 40
Maximal R.M.S. 1.82 2.19 1.59 1.79 2.19 1.60 1.87 2.07 1.47 1.83 2.09 1.57 2.21 3.20 2.99
Pin N 1 35 35 1 35 35 45 35 35 1 35 56 1 56 56
MeanValue
Fission Rate 0.991 0.828 0.954 0.990 0.827 0.954 1.109 0.827 0.955 0.999 0.823 0.909 1.031 0.902 0.918
Deviation fromMean Value
1.13 -0.28 -0.91 0.70 -0.60 -1.09 -2.90 -0.39 -0.91 0.55 -0.80 2.43 2.10 2.87 2.36MCU
Fission Rate 1.002 0.826 0.945 0.997 0.822 0.944 1.077 0.824 0.946 1.004 0.816 0.931 1.053 0.928 0.94
Deviation fromMean Value
-0.89 2.37 1.09 -0.82 2.43 1.01 0.88 2.27 0.87 -0.75 2.48 -0.76 1.03 1.65 1.82TVS-M
Fission Rate 0.982 0.848 0.964 0.982 0.847 0.964 1.119 0.846 0.963 0.991 0.843 0.902 1.042 0.917 0.935
Deviation fromMean Value
-2.78 -1.18 -0.83 -2.71 -0.99 -0.62 -0.55 -0.94 -0.58 -2.77 -0.76 -0.22 -3.24 -0.91 -0.62WIMS8A
Fission Rate 0.963 0.819 0.946 0.963 0.819 0.948 1.103 0.819 0.949 0.971 0.816 0.907 0.998 0.894 0.913
Deviation fromMean Value
0.92 -2.87 -1.58 0.99 -2.83 -1.57 0.51 -2.76 -1.50 1.07 -2.66 0.34 1.38 1.57 1.39HELIOS
Fission Rate 1.000 0.805 0.939 1.000 0.804 0.939 1.115 0.804 0.940 1.009 0.801 0.912 1.046 0.916 0.931
Deviation fromMean Value
1.62 1.95 2.23 1.84 1.99 2.27 2.06 1.81 2.12 1.90 1.73 -1.80 -1.26 -5.17 -4.95MULTICELL
Fission Rate 1.007 0.845 0.975 1.008 0.843 0.976 1.132 0.842 0.975 1.018 0.837 0.893 1.018 0.856 0.873
116

117
Appendix A
BENCHMARK SPECIFICATION


119
LEU AND MOX VVER CALCULATIONAL BENCHMARKS SPECIFICATION
Systems to be calculated are as follows:
• Uniform LEU fuel assembly with 12 U-Gd Burnable Absorbers (BA) rods (UGD variant);
• Profiled MOX fuel assembly with 12 U-Gd BA rods (MOXGD variant).
1. Material specification
Table A.1. Material description
MaterialName
Comment* Isotopic content, (atoms/barn cm3)
Fuel materialsU1 LEU fuel of 3.7 w/o enrichment 235U
238U8.6264E-42.2169E-2
16O 4.6063E-2
PU1 MOX fuel with 2.0 w/o of fissile Pu 235U238U16O
4.2672E-52.1025E-24.3047E-2
239Pu240Pu241Pu
4.2414E-42.7250E-54.5228E-6
PU2 MOX fuel with 3.0 w/o of fissile Pu 235U238U16O
4.2209E-52.0797E-24.3045E-2
239Pu240Pu241Pu
6.3621E-44.0875E-56.7842E-6
PU3 MOX fuel with 4.2 w/o of fissile Pu 235U238U16O
4.1652E-52.0522E-24.3043E-2
239Pu240Pu241Pu
8.9071E-45.7225E-59.4980E-6
GD1 LEU fuel of 3.6 w/o of 235Ucontaining 4 w/o of Gd2O3
235U238U16O152Gd154Gd
7.2875E-41.9268E-24.1854E-22.5159E-62.7303E-5
155Gd156Gd157Gd158Gd160Gd
1.8541E-42.5602E-41.9480E-43.0715E-42.6706E-4
Non-fuel materialsCL1 Zirconium alloy Zr
Nb4.259E-24.225E-4
Hf 6.597E-6
MOD1 Moderator, 0.6 g/kg of boron,Tm=575K, γ= 0.7235 g/cm3
H16O
4.843E-22.422E-2
10B11B
4.794E-61.942E-5
MOD2 Moderator, without boron,Tm=575K, γ= 0.7235 g/cm3
H16O
4.843E-22.422E-2
10B11B
0.00.0
MOD3 Moderator, without boron,Tm=300K, γ= 1.0033 g/cm3
H16O
6.717E-23.358E-2
10B11B
0.00.0
* The information in this column is given only as comments. For calculations it is necessary touse the data from “Isotopic content” column.
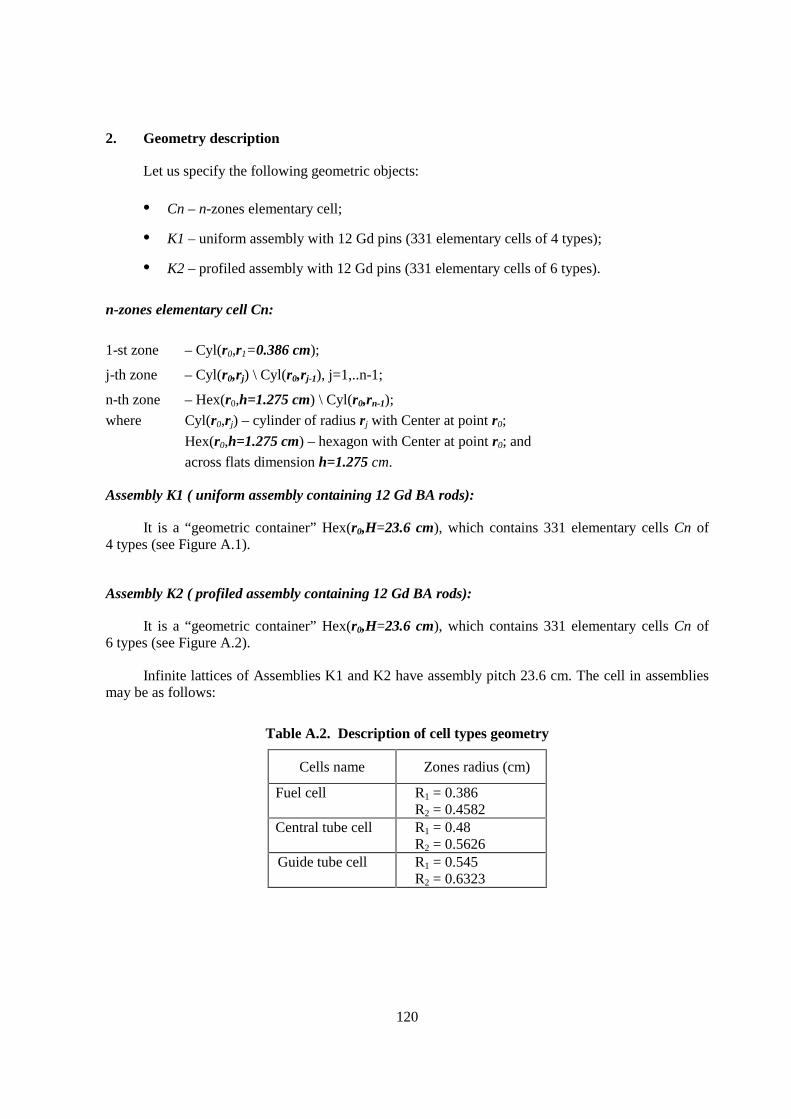
120
2. Geometry description
Let us specify the following geometric objects:
• Cn – n-zones elementary cell;
• K1 – uniform assembly with 12 Gd pins (331 elementary cells of 4 types);
• K2 – profiled assembly with 12 Gd pins (331 elementary cells of 6 types).
n-zones elementary cell Cn:
1-st zone – Cyl(r0,r1=0.386 cm);
j-th zone – Cyl(r0,rj) \ Cyl(r0,rj-1), j=1,..n-1;
n-th zone – Hex(r0,h=1.275 cm) \ Cyl(r0,rn-1);
where Cyl(r0,rj) – cylinder of radius rj with Center at point r0;
Hex(r0,h=1.275 cm) – hexagon with Center at point r0; and
across flats dimension h=1.275 cm.
Assembly K1 ( uniform assembly containing 12 Gd BA rods):
It is a “geometric container” Hex(r0,H=23.6 cm), which contains 331 elementary cells Cn of4 types (see Figure A.1).
Assembly K2 ( profiled assembly containing 12 Gd BA rods):
It is a “geometric container” Hex(r0,H=23.6 cm), which contains 331 elementary cells Cn of6 types (see Figure A.2).
Infinite lattices of Assemblies K1 and K2 have assembly pitch 23.6 cm. The cell in assembliesmay be as follows:
Table A.2. Description of cell types geometry
Cells name Zones radius (cm)
Fuel cell R1 = 0.386R2 = 0.4582
Central tube cell R1 = 0.48R2 = 0.5626
Guide tube cell R1 = 0.545R2 = 0.6323
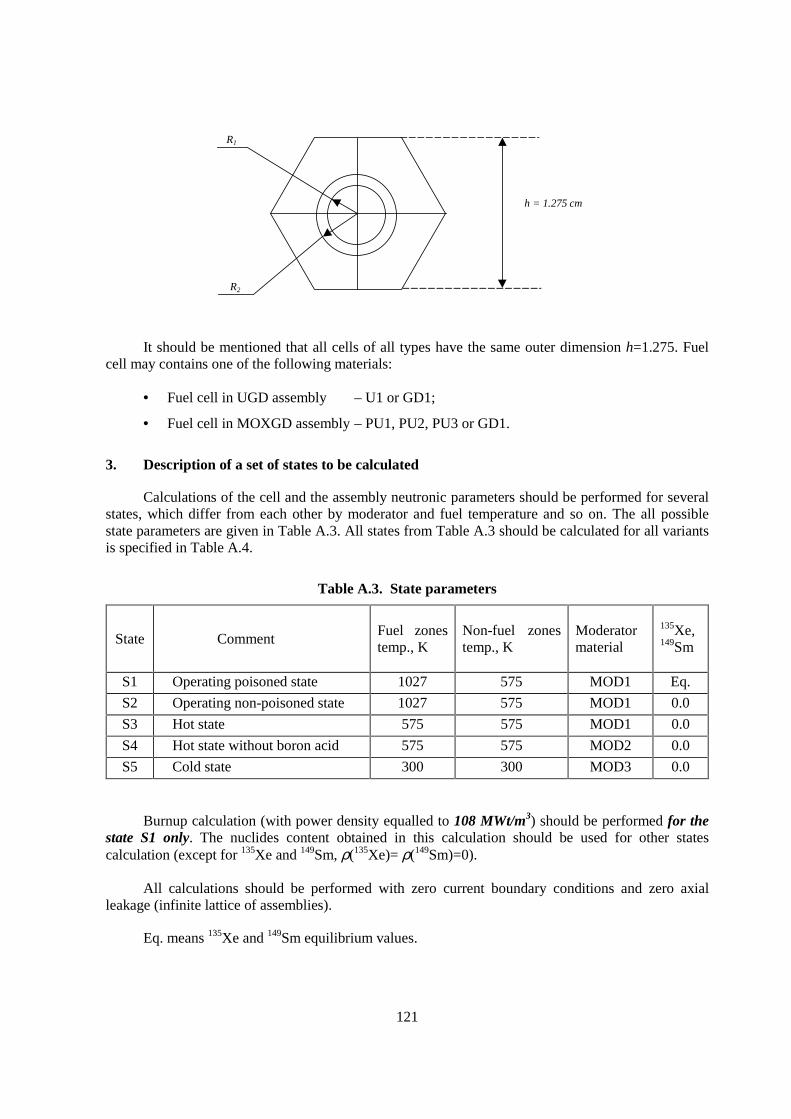
121
h = 1.275 cm
R1
R2
It should be mentioned that all cells of all types have the same outer dimension h=1.275. Fuelcell may contains one of the following materials:
• Fuel cell in UGD assembly – U1 or GD1;
• Fuel cell in MOXGD assembly – PU1, PU2, PU3 or GD1.
3. Description of a set of states to be calculated
Calculations of the cell and the assembly neutronic parameters should be performed for severalstates, which differ from each other by moderator and fuel temperature and so on. The all possiblestate parameters are given in Table A.3. All states from Table A.3 should be calculated for all variantsis specified in Table A.4.
Table A.3. State parameters
State CommentFuel zonestemp., K
Non-fuel zonestemp., K
Moderatormaterial
135Xe,149Sm
S1 Operating poisoned state 1027 575 MOD1 Eq.
S2 Operating non-poisoned state 1027 575 MOD1 0.0
S3 Hot state 575 575 MOD1 0.0
S4 Hot state without boron acid 575 575 MOD2 0.0
S5 Cold state 300 300 MOD3 0.0
Burnup calculation (with power density equalled to 108 MWt/m3) should be performed for thestate S1 only. The nuclides content obtained in this calculation should be used for other statescalculation (except for 135Xe and 149Sm, ρ(135Xe)= ρ(149Sm)=0).
All calculations should be performed with zero current boundary conditions and zero axialleakage (infinite lattice of assemblies).
Eq. means 135Xe and 149Sm equilibrium values.
122
4. Parameters to be calculated
For the state S1 the following parameters should be calculated as a function of assemblyaverage burnup (burnup step − 1 MWd/kgHM in the interval 0-15 MWd/kgHM and 5 MWd/kgHMin the interval 15-40 MWd/kgHM):
1. Kinf ;
2. average fuel concentrations of 232U, 235U, 236U, 238U, 236Pu, 238Pu, 239Pu, 240Pu, 241Pu, 242Pu,137Ce, 244Cm,135Xe, 149Sm, total fission products without 135Xe and 149Sm as well as 155Gdand 157Gd (if they are contained) in the cells 1 and 24 (see Figure 3);
3. averaged over all the fuel in assembly concentrations of 232U, 235U, 236U, 238U, 236Pu, 238Pu,239Pu, 240Pu, 241Pu, 242Pu, 137Ce, 244Cm,135Xe, 149Sm, total fission products without 135Xe and149Sm as well as 155Gd and 157Gd (if they are contained) in assembly (see Figure 3);
4. 235U, 239Pu, 155Gd and 157Gd zone averaged concentrations in the cell 24 (5 annular zones ofequal volume. Zone 1 - inner and zone 5 – outer).
In addition, the following results are required at burnups 0, 2, 4, 6, 8, 10, 12, 14, 15, 20,40 MWd/kgHM:
1. pin by pin fission rate distribution (normalised to 1, that is sum total fission rate overassembly must be equal to 1) and local peaking factor. Pins numeration is given in Figure 3(see below).
For states S2-S5 only parameters mentioned in items a) and e) should be calculated at burnups0, 20, 40 MWd/kgHM. States S2-S5 in 20, 40 MWd/kgHM burnup points should be calculated usingisotopic composition obtained in burnup calculation for state S1.

123
5. Description of sets of calculation variants
Table A.4. Set of calculation variants
Var CommentGeneral
geometrytype
Cell typeZone
numberZone
material
1 MOD#2 CL11 – Central tube cell3 MOD#1 U12 CL12 – Fuel cell (with U1)3 MOD#1 MOD#2 CL13 – Guide tube cell3 MOD#1 GD1
2 CL1
UGDLEU fuel assembly of3.7 w/o enrichmentcontaining 12 Gd pins
K1
4 – Fuel cell (with GD1)
3 MOD#
1 MOD#2 CL11 – Central tube cell3 MOD#1 PU32 CL12 – Fuel cell (with PU3)3 MOD#1 MOD#2 CL13 – Guide tube cell3 MOD#1 PU22 CL14 – Fuel cell (with PU2)3 MOD#1 PU12 CL15 – Fuel cell (with PU1)3 MOD#1 GD12 CL1
MOXGDProfiled MOX fuelassembly containing12 Gd pins
K2
6 – Fuel cell (with GD1)3 MOD#
# material depends on state number and is given in Table A.3.
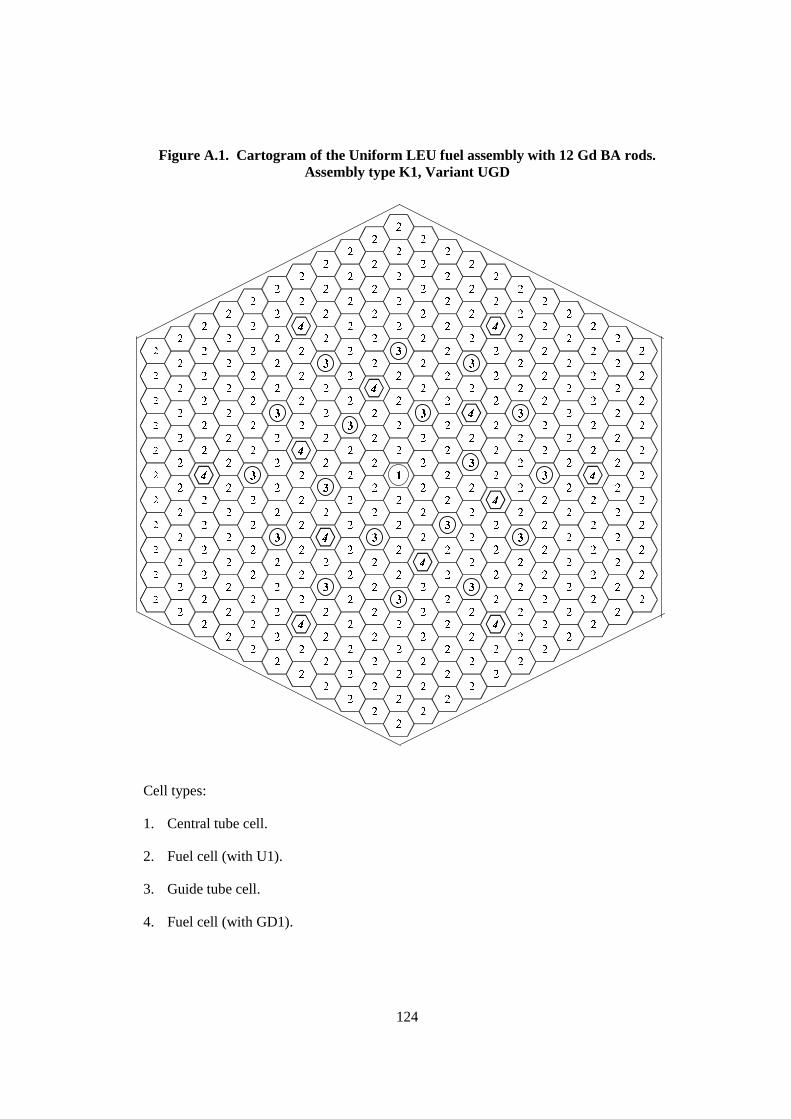
124
Figure A.1. Cartogram of the Uniform LEU fuel assembly with 12 Gd BA rods.Assembly type K1, Variant UGD
�
�
�
�
�
�
�
�
�
�
�
�
�
�
�
�
�
�
�
�
�
�
�
�
�
�
�
�
�
�
�
�
�
�
�
�
�
�
�
�
�
�
�
�
�
�
�
�
�
�
�
�
�
�
�
�
�
�
�
�
�
�
�
�
�
�
�
�
�
�
�
�
�
�
�
�
�
�
�
�
�
�
�
�
�
�
�
�
�
�
�
�
�
�
�
�
�
�
�
�
�
�
�
�
�
�
�
�
�
�
�
�
�
�
�
�
�
�
�
�
�
�
�
�
�
�
�
�
�
�
�
�
� �
�
�
�
�
�
�
�
�
�
�
�
�
�
�
�
�
�
�
�
�
�
�
�
�
�
�
�
�
�
�
�
�
�
�
�
�
�
�
�
�
�
�
�
�
�
�
�
�
�
�
�
�
�
�
�
�
�
�
�
�
�
�
�
�
�
�
�
�
�
�
�
�
�
�
�
�
�
�
�
�
�
�
�
�
�
�
�
�
�
�
�
�
�
�
�
�
�
�
�
�
�
�
�
�
�
�
�
�
�
�
�
�
�
�
�
�
�
�
�
�
�
�
�
�
�
�
�
�
�
�
�
�
�
�
�
�
�
�
�
�
�
�
�
�
�
�
�
�
�
�
�
�
�
�
�
�
�
�
�
�
�
�
�
�
�
�
�
�
�
�
�
�
�
�
�
�
�
�
�
�
�
�
�
�
�
�
�
�
�
�
�
�
�
�
�
�
�
Cell types:
1. Central tube cell.
2. Fuel cell (with U1).
3. Guide tube cell.
4. Fuel cell (with GD1).

125
Figure A.2. Cartogram of the Profiled MOX fuel assembly with 12 Gd BA rods.Assembly type K2. Variant MOXGD
5
5
2
45
4
55
5
45
4
45
46
2
4
4
55
5
5
5
5
5
5
5
5
5
54
45
54
5
4
4
5
5
4
4
4
4
4
4
4
4
5
2
4
5
4
4
4
4
4
6
5
2
2
2
2
2
2
5
4
4
4
5
4
4
2
2
2
2
2
3
2
2
2
4
2
3
2
4
4
5
4
4
2
2
2
2
2
3
2
2
4
2
6
2
2
2
2
2
2
5
4
6
2
2
6
2
5
4
4
2
3
3
2
2
2
22
2
2
2
2
2
2
2
5
4
4
2
5
4
4
2
2
2
2
2
3
2
2
2
2
62
4
4
2
2
2
2
2
4
2
5
5
4
4
2
2
2
2
6
5
4
4
2
2
2
2
2
2
2
5
4
4
2
4
2
2
2
2
4
2
2
3
5
5
4
4
2
55
5
4
44
2
2
3
4
6
6
2
44
3
32
2
2
4
2
2
2
2
54
4
45
2
3
3
2
2
2
2
2
2
2
2
2
22
2
3
3
33
3
2
2
2
22
2
3
22
2
6
5
4
4
2
5
4
6
2
5
4
4
2
2
4
4
4
2
22
2
2
2
2
2
2
5
2
2
2
2
2
2
5
4
4
4
4
4
4
4
4
4
5
5
4
4
4
4
4
6
4
4
4
4
5
5
4
4
5
5
5
5
5
1
5
5
5
5
52
2
5
Cell types:
1. Central tube cell.
2. Fuel cell (with PU3).
3. Guide tube cell.
4. Fuel cell (with PU2).
5. Fuel cell (with PU1).
6. Fuel cell (with GD1).
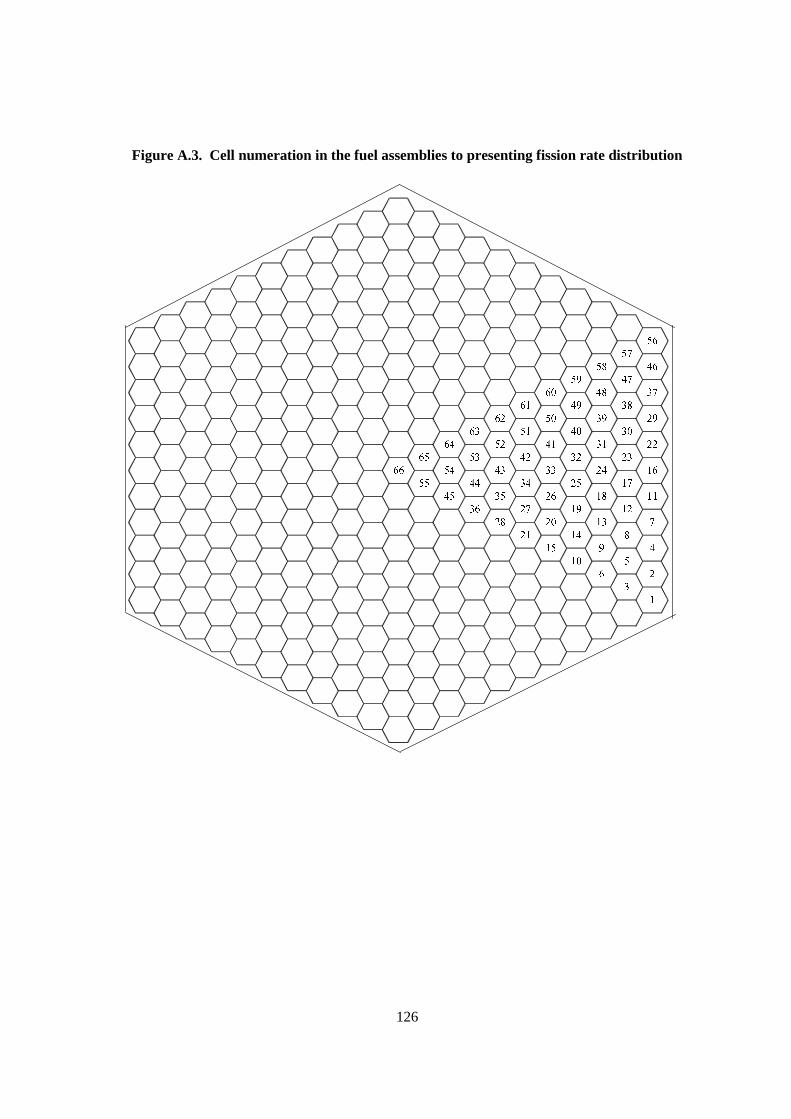
126
Figure A.3. Cell numeration in the fuel assemblies to presenting fission rate distribution
��
��
��
��
��
��
��
�
�
��
��
��
��
��
��
��
��
��
�
�
�
�
��
��
��
��
��
��
��
��
��
��
��
��
��
��
��
��
��
��
��
��
��
��
��
��
��
��
��
��
��
��
��
��
��
��
��
��
��
��
�
�
��
��
�
��

127
Appendix B
CALCULATIONAL DETAILS PROVIDED BY THE PARTICIPANTS

129
MCU-REA CODE
The MCU-REA computer code was used in the calculations.
MCU-REA is a general-purpose continuous energy Monte Carlo code for solving the neutrontransport problems including the depletion ones. It is used with both pointwise and step functionrepresentations of cross sections.
For neutron-nuclear interaction modelling the code permits to take into account:
• the laws of inelastic scattering from evaluated nuclear data files;
• cross section temperature dependence in unresolved resonance region in subgroupapproximation;
• Doppler broadening of resonance cross sections in resolved resonance region using infinitenumber of energetic points;
• scattering law S(α,β) depending on temperature.
The geometry module of the code is the combination of the following approaches:
• combinatorial method, body technique, hierarchy description;
• special algorithm to model fuel elements with thousands of micro-spheres included in to onefuel element.
The hierarchy option permits one to describe full scale 3-D reactor model (VVER, PWR, BWR,RBMK, etc.) using only 0.25 MB of RAM.
To model the change of isotopic composition of reactor materials the special module wasdeveloped. It permits one to take into account 39 actinides and 165 fission products.
The commercially available versions of the code and library of the developer Russian ResearchCenter “Kurchatov Institute” have been used.
More than 500 of 3D benchmark experiments published in the Handbook of InternationalCriticality Safety Evaluation Benchmark Project and Russian literature were calculated. Thediscrepancy between calculation and experiment results lied inside the experiment errors estimated.The full scale 3-D models of the different reactors (transport, production, space, research, energeticVVER and RBMK) are elaborated and used widely to estimate their parameters and to verify thedesign codes.
MCU data libraries is DLC/MCUDAT-2.1 based on:
• ENDF/B-VI; JENDL-3.2; BROND.
• MCU group own evaluations and compilations.
• LIPAR – parameters of the fully resolved resonances.

130
• BFS – phonon spectra library including the ENDF data.
• KORT – cross-sections for E=0.0253 eV, resonance integrals etc.
The following data processing codes were used to obtain the cross-section data used:
• NJOY.
• GRUCON (IPPE, Russia).
• MCU group elaborations.
• TERMAC – generation of the S(α,β) multigroup library.
• STEN – generation of the S(α,β) pointwise library.
• RAPAN – generation of the resonance cross sections.
• SET OF MODULES for evaluating and analysing the resonance parameters.
MCU Kinf results are calculated with statistical error less than 0.1% (1σ).

131
TVS-M CODE
The code is intended for generation of few-group neutron constant libraries for codes BIPR andPERMAK which include the multiparametric dependencies of cross-sections for FAs and theirconstituent cells (fuel rods, absorber rods, burnable absorber rods and other cells) as well asderivatives of these cross sections as functions of reactor state and fuel burnup.
Nuclear data libraries
The nuclear data library is based on the same files of estimated nuclear data as precision codeMCU-RFFI, which uses the Monte Carlo method.
In the epithermal energy region (E>0.625 eV) the calculation is based on slightly modifiedmicro-cross section library BNAB (see, e.g., [1]) with 24 energy groups. The nuclide libraries cancontain both the group and subgroup constants and for some nuclides with temperature dependence.
For the calculation of neutron spectrum in the energy region of resolved resonances En<1 keV(15 and higher BNAB group) the library includes files of resonance parameters of individual nuclidesobtained on the base of the LIPAR library. For all fissile nuclei the library contains prompt anddelayed neutron spectra, group β values and decay constants for six groups of delayed neutrons.
The thermal energy region is divided into 24 groups. For the nuclides with the “l/v” cross-section behaviour the absorption cross sections at 2200 m/s are used, for the rest ones the group valuesof the absorption, scattering and fission cross sections are specified. In addition, for oxygen andcarbon the scattering matrices obtained in terms of gas model at 300, 373, 473, 558, 623K are given.For hydrogen bonded in water molecule the scattering matrix is obtained from the ENDF/Brecommended data in terms of the Koppel model at the same temperatures.
The library contains the files of cross sections and yields of 98 fission products including 135Xeand 149Sm. The files of fission product yields are based on the ENDF/B-VI data [2].
Uniform lattice
In the energy region of epithermal neutrons (10.5MeV<En<0.625 eV, BNAB groups 1-24) adetailed calculation of group spatial-energy distribution of neutron flux is performed. Each group isdivided into an arbitrary number of intervals equal in lethargy, and then the calculation is performed ateach point of group division. The of elastic scattering process is calculated without use of anyapproximations when the scattering is isotropic in the inertia centre system (i.e.s.), otherwise thescattering anisotropy is taken into account by the term not higher than linear in cosine of scatteringangle. The slowing down due to inelastic scattering is taken into account via the matrix of inelastictransitions under the assumption of uniform energy distribution of neutrons scattering into the givengroup.
For nuclides with the subgroup description of cross sections the heterogeneous subgroupcalculation of their micro cross sections is performed.

132
In the energy region of resolved resonances (groups 13-24 BNAB) for resonance nuclides thecalculation of all types of cross sections is performed with the use of nuclide resonance parameters. Inso doing it is possible to take into account temperature dependence of resonance cross sections.
In the thermal energy region the standard calculation technique is used. It suggests solving themulti-group equation of thermalisation with the neutron sources from the epithermal energy regionformed when calculation for this energy range was performed. The model of the thermalisation matrixconstruction is described above.
Calculation of neutron spatial distribution is carried out by dividing the cells into an arbitrarynumber of annular material zones and by the use of the passing through probability (PTP) method. Inthe calculation the actual form of the cell boundary is taken into account.
The calculation of the point kinetics parameters βeff., is made by the standard formulas usingthe value function ψ with respect to Keff and with six groups of delayed neutrons.
The calculation of the fuel nuclide composition during fuel burnup is performed for heavynuclides from 232 Th to 244Cm and for 98 fission products from 82Kr to 163Dy. The burnup equations canbe solved both by the Runge-Kutta method.
Calculation of supercells and fuel assemblies
For the determination of FA neutronic characteristics the code uses the diffusion fine-meshcalculation with an arbitrary number of groups from 4 to 48 and with the mesh width equal to the pitchbetween fuel rods in the FA. For the boundary mesh cells the compression coefficient is used. Alongwith the standard six-point scheme the refined scheme whose principles of construction are describedin can be used. The use of this scheme permits keeping of the accurate (i.e. obtained from solving oftransport equation for the cell) connection between cell averaged neutron flux and values of flux andcurrent at the cell boundary. In this way it becomes possible to avoid errors peculiar to the standardcalculation scheme associated with the finite size and heterogeneous structure of mesh points.
Each mesh point pertains to a definite type: fuel rod, cell with absorber rod, cell correspondingto the gap between FAs, etc. The constants for the background type are always calculated in theasymptotic mode, i.e. as for the uniform fuel cell. The constants for non-fuel cells are calculated in themode of supercell. For the non-background fuel cells including those with the U-Gd fuel rods thecalculation can be performed both in the asymptotic and supercell modes. The homogenisedbackground cell is always considered as the external zone of supercell.
References
[1] Abagyan, L.P., N.O. Bezazyents, N.N. Nikolaev, A.M. Tsiboulia, “Neutron Group Constantsfor Reactors and Shicloling Calculations”, Atomizdat, Moscow, 1981.
[2] Rose, P.F., “GNDF-201, ENDF/B-VI Summary Documentation”, BNL-NSC-17541, 4th Edition,1991.
133
WIMS8A CODE
Name of the computer code(s) used, description of method and references
Name: WIMS8A, developed by AEA Technology.
Type of calculation: heterogeneous calculation.
Theory used: transport.
Method used: characteristics method.
1. Basic data library version:
WIMS97 library based on JEF-2.2, composed of 172 energy groups.
2. Data processing code/method used to obtain the cross section data used:
WIMS97 is the default data library used by the WIMS codes.
3. Spectral calculations and data reduction methods used:
The calculation scheme is divided into seven principal modules (Figure B.1.).
References
[1] Halsall, M.J., “The WIMS Characteristics Method in a Subgroup Resonance Treatment”,Reactor Physics & Reactor Computations, Tel Aviv, January 1994.
[2] Halsall, M.J., and J.L. Hutton, and R.D. Fry, and C.J. Dean and D.J. Powney, “An Introductionto WIMS6”, ANS Topical Meeting, Knoxville, April 1994.
[3] Hutton, J.L., and A.W. Butement, and S. Watt, and S.D. Shatbolt, “Applications of a MonteCarlo Whole Core Microscopic Depletion Method” (extended version), ANS Meeting,Philadelphia, 1995.
[4] Halsall, M.J., “The WIMS Subgroup Method for Resonance Absorption”, ANS Meeting,Philadelphia, 1995.
[5] Halsall, M.J., “WIMS7, an Overview”, PHYSOR Meeting, Japan, 1996.
[6] Hutton, J.L. and S. Walley, “Advanced Modelling Methods in Monte Carlo”, PHYSOR Meeting,Japan, 1996.
[7] Dean, C. J., and R.J. Perry, and A.W. Butement and J.L. Hutton, “A Comparison of UK Codesfor Analysing DIMPLE S01A with JEF2.2 Data”, PHYSOR Meeting, Japan, 1996.

134
[8] Webster, E.B., “The Treatment of Fuel Depletion in the Reactor Physics Code WIMS7 and theNuclide Inventory Code FISPIN7”, PHYSOR Meeting, Japan, 1996.
[9] Powney, D.J. and B.M. Franklin, “LWR Modelling Capabilities of WIMS7 and the Applicationof WIMS7 and PANTHER to KALININ VVER 1000 Benchmark”, PHYSOR Meeting, Japan,1996.
[10] Halsall, M.J., “WIMS8 – Speed with Accuracy”, PHYSOR Meeting, Long Island, 1998.
[11] Armishaw, M.J., and J.L. Hutton, and N.R. Smith and J. Sidell, “Features of the Monte CarloCode MONK8”, PHYSOR Meeting, Long Island, 1998.
[12] Powney, D.J. and B.M. Franklin, “Benchmarking of Square and Hexagonal Pitch CriticalAssemblies Using WIMS”, PHYSOR Meeting, Long Island, 1998.
[13] Dean, C.J., and D. Hanlon and R.J. Perry, “Benchmark Calculations for Uranium 235”,PHYSOR Meeting, Long Island, 1998.
[14] Powney, D.J. and B.M. Franklin, “Benchmarking of the ZR-6 Critical Assemblies UsingWIMS, 8th AER Symposium on VVER Reactor Physics and Reactor Safety”, September 1998.

135
Figure B.1. WIMS8A. Calculation scheme for the VVER benchmarks
WIMS97 library
↓
Introduction of the general geometry and nuclide concentrations
↓
Particular treatment of the resonance shielding of 235U, 238U, 239Pu and 240Pu
↓
Calculation of the collision probabilities associated to each pin type
↓
Approximate flux solution in a detailed 172 energy groups structure
↓
Condensation to 6 groups
↓
Accurate flux solution in the 6 energy groups structure
↓
Burnup
The WIMS codes allow to calculate a VVER assembly, taking advantage of the 6-fold rotationalsymmetry. In a first step, the global geometry is introduced and the rod types are defined: each rodtype defined in the benchmark’s specifications forms a rod type for the WIMS calculation, exceptedfor the Gd-rods which are defined as two distinct rods. That is to say that we define 5 rod types for theLEU VVER assembly (Central tube, fuel cell, guide tube, Gd rod in cell 35 and Gd rod in cell 24) and7 rod types for the MOX VVER (Central tube, fuel cell PU3, guide tube, fuel cell PU2, fuel cell PU1,Gd rod for cell 35, Gd rod for cell 24), each rod type being characterised by its own spectrum.
A special step is devoted to the treatment of resonance shielding due to the isotopes 235U, 238U,239Pu and 240Pu.
Then the collision probabilities are calculated for each cell considered in the problem. Theseprobabilities, along with the cross sections, permit to get an approximate flux solution in the detailed172 energy groups structure.
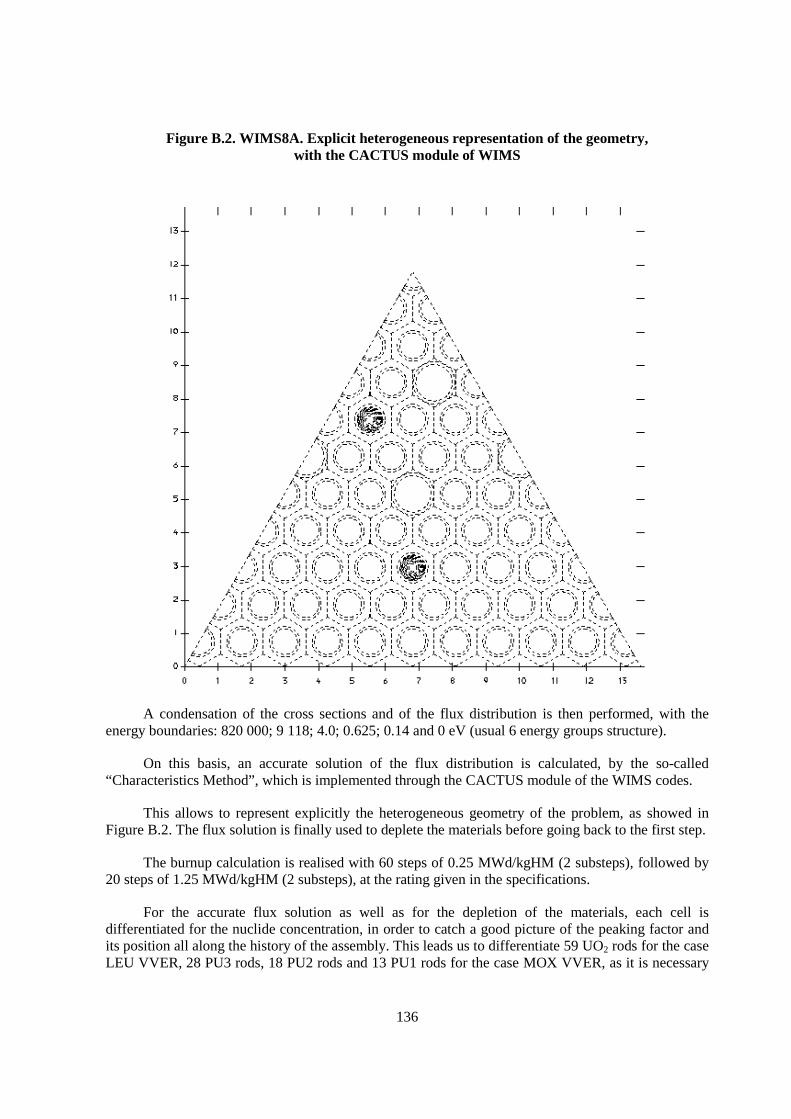
136
Figure B.2. WIMS8A. Explicit heterogeneous representation of the geometry,with the CACTUS module of WIMS
A condensation of the cross sections and of the flux distribution is then performed, with theenergy boundaries: 820 000; 9 118; 4.0; 0.625; 0.14 and 0 eV (usual 6 energy groups structure).
On this basis, an accurate solution of the flux distribution is calculated, by the so-called“Characteristics Method”, which is implemented through the CACTUS module of the WIMS codes.
This allows to represent explicitly the heterogeneous geometry of the problem, as showed inFigure B.2. The flux solution is finally used to deplete the materials before going back to the first step.
The burnup calculation is realised with 60 steps of 0.25 MWd/kgHM (2 substeps), followed by20 steps of 1.25 MWd/kgHM (2 substeps), at the rating given in the specifications.
For the accurate flux solution as well as for the depletion of the materials, each cell isdifferentiated for the nuclide concentration, in order to catch a good picture of the peaking factor andits position all along the history of the assembly. This leads us to differentiate 59 UO2 rods for the caseLEU VVER, 28 PU3 rods, 18 PU2 rods and 13 PU1 rods for the case MOX VVER, as it is necessary

137
to distinct the half rods placed at the borders of the 1/6th assembly. Moreover the Gd rods are describedin 10 annuli of equal area.
Number of energy groups (fast/thermal)/continuous energy
• 172 groups for the shielding corrections and the approximate flux solution;
• 6 groups for the accurate flux solution: 820 000; 9118; 4.0; 0.625; 0.14 and 0 eV (usual6 energy groups structure).
Assumptions made for the cross-sections such as (n, 2n)
The (n, 2n) cross sections are only used in the burnup sequence of the calculation. At this step,the (n,γ) cross sections are calculated from the absorption, fission and (n, 2n) cross sections.
Self-shielding and mutual resonance shielding applied to each nuclide
Each rod type defined in the benchmark’s specification forms a rod type for the WIMScalculation, excepted for the Gd-rods which are defined as two distinct rods. For instance, in the caseof the MOX VVER assembly, we have:
• Rod type 1: central tube cell.
• Rod type 2: fuel cell PU3.
• Rod type 3: guide tube cell.
• Rod type 4: fuel cell PU2.
• Rod type 5: fuel cell PU1.
• Rod type 6: fuel cell GD1 for cell 35.
• Rod type 7: fuel cell GD1 for cell 24.
Cell, lattice, etc. calculation methods used. (See also points 3, 6 and 9)
Each UOX and MOX rod is explicitly represented with its fuel region (1 region), its claddingand its moderator (see also Figure B.2). No additional radial and azimuthal cut is applied.
The Gd rods are divided into 10 annuli of equal area in order to account for the shielding effectdue to the Gd isotopes. This permits us to easily calculate the nuclides concentrations as a function ofthe radial position (5 regions requested).

138
Other information
• Some “requested” isotopes are not present in the used WIMS97 data library. These are:152Gd, 160Gd, 232U, 236Pu and 137Ce. This is why some columns lack in the reported results.
• The presence of the Hf isotopes contained in the cladding are explicitly taken into accountfor the shielding, through the 174Hf (0.16 w/o), 176Hf (5.20 w/o), 177Hf (18.60 w/o), 178Hf(27.30 w/o), 179Hf (13.63 w/o) and 180Hf (35.11 w/o).
• The 10B isotope is supposed to be unburnable (constant atomic concentration).

139
HELIOS CODE
Name of computer code(s) used
1. Name: HELIOS (version 1.4) developed by Studsvik ScandPower.
Methods based on current coupling and collision probability for neutron transport and subgroupmethod for resonance treatment.
Description of method
2. Basic data library version: ENDF/B-VI with adjustments to the 238U absorption cross section(The 238U resonance integral has been reduced by 3.4% to match integral experiments).
3. Data processing code/method used to obtain the cross-section data used: Basic library obtainedusing NJOY and RABBLE along with other utility codes.
4. Spectral calculations and data reduction methods used: None.
5. Number of groups (fast, thermal)/continuous energy: 190 (128 fast, 62 thermal).
6. Assumptions made for some cross-sections such as (n,2n): HELIOS-1.4 has n,2n cross sectionsfor only the following isotopes: 90 232, 92 233, 92 238, 96 244.
7. Self shielding and mutual resonance shielding applied to which nuclides.
8. 31 Resonance isotopes, mutual resonance shielding applied to all resonance nuclides:
• 95mMo, 99mTc, 108mPd, 107Ag, 109Ag, 113In, 115In, 131mXe, 133mCs, 155Gd, 156Gd, 157Gd, 158Gd,166Er, 167Er, 169Tm, 170Tm, 176Hf, 177Hf, 178Hf, 179Hf, 180Hf, 232Th, 233U, 235U, 236U, 238U,239Pu, 240Pu, 241Pu, 242Pu.
9. Cell, lattice, etc. calculation method used: See item 3 above.
10. Other information that would be helpful to identify possible sources of discrepancies, especiallydeviations (hopefully none) from the specification:
• These calculations were performed with the adjusted ENDF/B-VI library.
• HELIOS does not compute equilibrium samarium-149 concentration. Therefore,calculation at 0 MWd/kgHM has no 149Sm.
• HELIOS-1.4 does not have the necessary n,2n reactors required for the production of 232Uand 236Pu. The concentrations have been set to zero.
• Reported 155Gd and 157Gd include contributions from the burnable absorber and fissionproducts.
140
• Made assumption that request for 137Ce in benchmark specifications was a typographicalerror. 137Cs values are given.
References
[1] Casal, J.J. et. al, “HELIOS: Geometric Capabilities of a New Fuel-Assembly Program”, Proc.Int. Topl. Mtg. Advances in Mathematics, Computations, and Reactor Physics, Pittsburgh,Pennsylvania, April 28-May 2, 1991, Vol. 2, p. 10.2.1-1.
[2] Villarino, E.A., and R.J.J. Stamm’ler, and A.A. Ferri, and J.J. Casal, “HELIOS: AngularlyDependent Collision Probabilities”, Nuc. Sci. Eng., 112, 16-31, (1992).
[3] “FMS: The Scandpower Fuel Management System, HELIOS Documentation”, ScandpowerA/S (1995).

141
MCNP-4B CODE
Name of the computer code used including description of method and reference
Name: Winfried Zwermann
Organisation: Gesellschaft für Anlagen- und Reaktorsicherheit (GRS) mbH
Part of the calculations were performed in the framework of the “French – German – RussianTrilateral Project on Civil Uses of Plutonium from Dismantled Russian Nuclear Weapons Subject toArms Reduction”, sponsored by the German Foreign Office.
Description:
Code System: MCNP-4B
Transport Code – Version 4B, LA-12625-M, March 1997.
Cross Section Data:
Point data generated by IKE Stuttgart with NJOY mainly from JEF 2.2: 1H, 16O, natZr,152Gd: ENDF/B-VI.4.
All other materials: JEF-2.2.
Spectral Calculations etc.: None.
Energy Groups: Continuous.
Special assumptions: None.
Assembly Calculations: Monte Carlo transport, continuous energy, 1,000,000 histories, fresh fuelstates only.
Other Information
Nuclear data are available at certain temperatures (293, 600, 900, 1200 K). When another temperature(here: 575, 1027 K) is required, each isotope is mixed from the corresponding data at the next lowerand the next higher temperatures with appropriate weighting factors.
Calculated cases (UOX and MOX):
• S2: T-fuel = 1027 K, T-mod = 575 K, no Xe/Sm, 600 ppm Boron;
• S3: T-fuel = 575 K, T-mod = 575 K, no Xe/Sm, 600 ppm Boron;
• S4: T-fuel = 575 K, T-mod = 575 K, no Xe/Sm, 0 ppm Boron;

142
• S5: T-fuel = 293 K, T-mod = 293 K, no Xe/Sm, 0 ppm Boron.
Reference
[1] Briesmeister J.F. (Editor), “MCNP – A General Monte Carlo N-Particle”.

143
MULTICELL CODE
Name of the computer code used including reference and description of method
Name: Cs. Maráczy.
Organisation: KFKI Atomic Energy Research Institute.
Method: MULTICELL collision probability transport code tested against measurements on the ZR6critical assembly [1, 2].
Basic data library version: ENDF/B-VI.
Codes: NJOY [3] and PEACO [4] codes.
The thermal scattering is described by the Nelkin-model. The cross sections of three resonanceisotopes and the Bell-factors are tabulated as a function of the dilution cross section of a homogeneousmaterial and the temperature. The equivalence theory is used for the calculation of the shieldedmultigroup cross sections for the heterogeneous case, where the Dancoff factor is determined from thefirst flight collision probabilities.
35 epithermal and 35 thermal energy groups, thermal cut-off: 1.84eV
The (n,2n) reaction is taken into account in the cross sections, but no (n,2n) burnup chains.
235U, 238U, 239Pu. The 240Pu resonance is treated explicitly in the thermal region taking intoaccount the Doppler broadening.
Spectral calculations: multigroup collision probability equations. The collision probabilities areobtained as a combination of the cell transmission and escape probabilities and the collisionprobabilities inside the cylindrical cells. Fuel burnup calculations: 18 actinide and 145 fission productisotopes.
The MULTICELL code can be used for periodic boundary condition problems. Though thespecified 0 current boundary condition in the benchmark does not correspond to the periodic one, theerror originating from this deviation is negligible. The radial concentration distribution of the 239Puisotope in the UGd pin does not show the rim effect because the fuel pin treated as one region from thepoint of view of resonances. (For fuel behaviour calculations a special version of the code is used withfine energy groups in the resonance region which allows to calculate the rim effect.)
References
[1] ��� ��et al., “KARATE — A Code for VVER-440 Core Calculation”, Transactions of ANSWinter Meeting, Washington DC, November 13-17,1994, p. 485, Vol. 71.
[2] Gy. Hegyi, et al., “Benchmark on Integral Parameters and Pin-Wise Energy Distributions ofHeterogeneous Lattices”, Proc. of the third Symposium of AER, Piestany, Slovakia,27 September — 1 October 1993, p. 241.
144
[3] MacFarlane, D. and W. Muir, “The NJOY Nuclear Data Processing System”, LA-12740-M,1994.
[4] Ishiguro, Y. and H. Takano, “PEACO – A Code for Calculation of Group Constants ofResonance Energy Region in Heterogeneous Systems”, JAERI 1219 Report, 1971.

145
Appendix C
ADDITIONAL RESULTS


147
Table C.1 UGD Variant. Kinf. States S1, S2, S3, S4, S5.Burnup=0, 20, 40 MWd/kgHM
S1 S2 S3 S4 S5MCU
0 1.1353 1.1779 1.1899 1.2499 1.3197
20 1.0403 1.0809 1.0950 1.1496 1.2192
40 0.9091 0.9432 0.9562 1.0063 1.0632
TVS0 1.1353 1.1768 1.1900 1.2504 1.3213
20 1.0405 1.0781 1.0928 1.1484 1.213840 0.9025 0.9325 0.9460 0.9954 1.0470
WIMS8A0 1.1328 1.1695 1.1845 1.2433 1.3122
20 1.0383 1.0781 1.0941 1.1477 1.217340 0.9088 0.9422 0.9566 1.0041 1.0604
HELIOS0 1.1355 1.1750 1.1894 1.2490 1.3181
20 1.0436 1.0828 1.0988 1.1535 1.219840 0.9092 0.9422 0.9572 1.0063 1.0577
MCNP4B0 1.1800 1.1925 1.2531 1.3235
2040
MULTICELL0 1.1363 1.1776 1.1919 1.2518 1.3164
20 1.0427 1.0835 1.0989 1.1543 1.219240 0.9029 0.9368 0.9509 1.0005 1.0505

148
Table C.2 MOXGD Variant. Kinf. States S1, S2, S3, S4, S5.Burnup=0, 20, 40 MWd/kgHM
S1 S2 S3 S4 S5MCU
0 1.1551 1.1873 1.2045 1.2384 1.3176
20 1.0126 1.0482 1.0626 1.1005 1.1739
40 0.9075 0.9390 0.9529 0.9933 1.0522
TVS0 1.1585 1.1942 1.2104 1.2465 1.3229
20 1.0148 1.0479 1.0625 1.1021 1.167940 0.8931 0.9215 0.9345 0.9750 1.0249
WIMS8A0 1.1494 1.1811 1.1993 1.2334 1.3148
20 1.0127 1.0467 1.0635 1.1008 1.174540 0.9048 0.9360 0.9506 0.9891 1.0465
HELIOS0 1.1595 1.1923 1.2098 1.2443 1.3241
20 1.0220 1.0558 1.0723 1.1103 1.180140 0.9065 0.9375 0.9526 0.9922 1.0449
MCNP4B0 1.1922 1.2091 1.2430 1.3256
2040
MULTICELL0 1.1606 1.1944 1.213 1.2483 1.3249
20 1.0178 1.0532 1.0686 1.1075 1.176540 0.8958 0.9277 0.9413 0.9815 1.0331
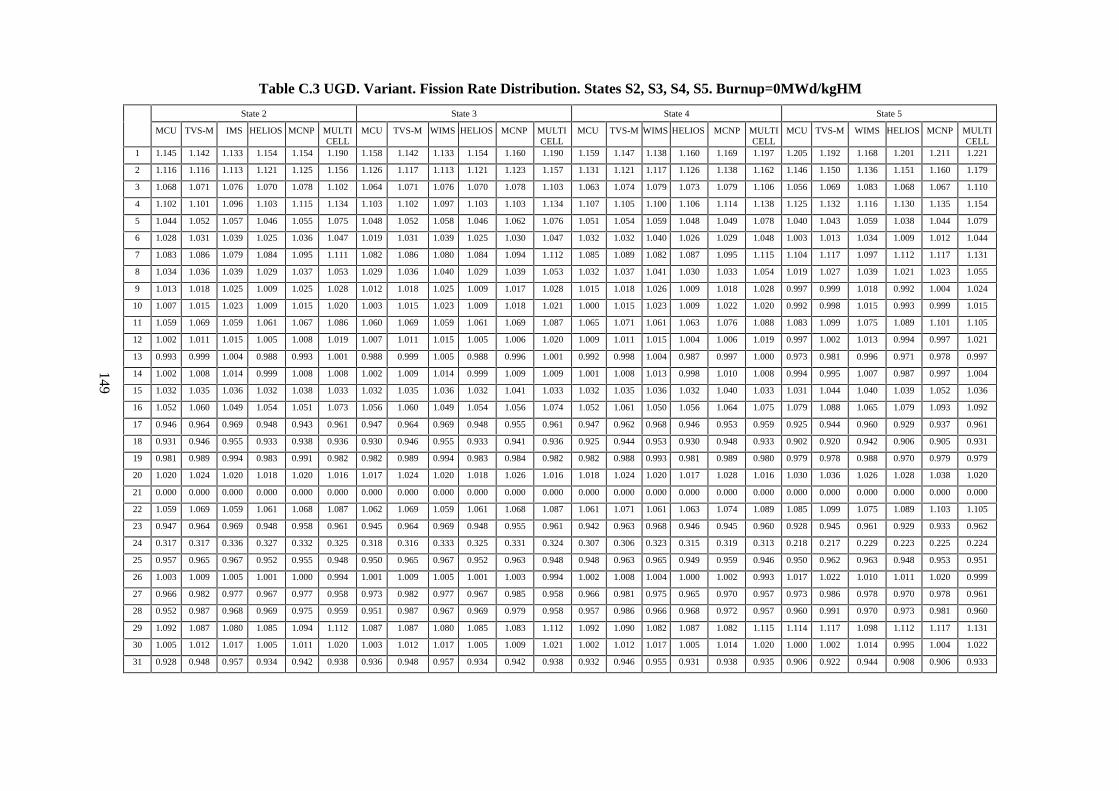
Table C.3 UGD. Variant. Fission Rate Distribution. States S2, S3, S4, S5. Burnup=0MWd/kgHM
State 2 State 3 State 4 State 5
MCU TVS-M IMS HELIOS MCNP MULTICELL
MCU TVS-M WIMS HELIOS MCNP MULTICELL
MCU TVS-M WIMS HELIOS MCNP MULTICELL
MCU TVS-M WIMS HELIOS MCNP MULTICELL
1 1.145 1.142 1.133 1.154 1.154 1.190 1.158 1.142 1.133 1.154 1.160 1.190 1.159 1.147 1.138 1.160 1.169 1.197 1.205 1.192 1.168 1.201 1.211 1.221
2 1.116 1.116 1.113 1.121 1.125 1.156 1.126 1.117 1.113 1.121 1.123 1.157 1.131 1.121 1.117 1.126 1.138 1.162 1.146 1.150 1.136 1.151 1.160 1.179
3 1.068 1.071 1.076 1.070 1.078 1.102 1.064 1.071 1.076 1.070 1.078 1.103 1.063 1.074 1.079 1.073 1.079 1.106 1.056 1.069 1.083 1.068 1.067 1.110
4 1.102 1.101 1.096 1.103 1.115 1.134 1.103 1.102 1.097 1.103 1.103 1.134 1.107 1.105 1.100 1.106 1.114 1.138 1.125 1.132 1.116 1.130 1.135 1.154
5 1.044 1.052 1.057 1.046 1.055 1.075 1.048 1.052 1.058 1.046 1.062 1.076 1.051 1.054 1.059 1.048 1.049 1.078 1.040 1.043 1.059 1.038 1.044 1.079
6 1.028 1.031 1.039 1.025 1.036 1.047 1.019 1.031 1.039 1.025 1.030 1.047 1.032 1.032 1.040 1.026 1.029 1.048 1.003 1.013 1.034 1.009 1.012 1.044
7 1.083 1.086 1.079 1.084 1.095 1.111 1.082 1.086 1.080 1.084 1.094 1.112 1.085 1.089 1.082 1.087 1.095 1.115 1.104 1.117 1.097 1.112 1.117 1.131
8 1.034 1.036 1.039 1.029 1.037 1.053 1.029 1.036 1.040 1.029 1.039 1.053 1.032 1.037 1.041 1.030 1.033 1.054 1.019 1.027 1.039 1.021 1.023 1.055
9 1.013 1.018 1.025 1.009 1.025 1.028 1.012 1.018 1.025 1.009 1.017 1.028 1.015 1.018 1.026 1.009 1.018 1.028 0.997 0.999 1.018 0.992 1.004 1.024
10 1.007 1.015 1.023 1.009 1.015 1.020 1.003 1.015 1.023 1.009 1.018 1.021 1.000 1.015 1.023 1.009 1.022 1.020 0.992 0.998 1.015 0.993 0.999 1.015
11 1.059 1.069 1.059 1.061 1.067 1.086 1.060 1.069 1.059 1.061 1.069 1.087 1.065 1.071 1.061 1.063 1.076 1.088 1.083 1.099 1.075 1.089 1.101 1.105
12 1.002 1.011 1.015 1.005 1.008 1.019 1.007 1.011 1.015 1.005 1.006 1.020 1.009 1.011 1.015 1.004 1.006 1.019 0.997 1.002 1.013 0.994 0.997 1.021
13 0.993 0.999 1.004 0.988 0.993 1.001 0.988 0.999 1.005 0.988 0.996 1.001 0.992 0.998 1.004 0.987 0.997 1.000 0.973 0.981 0.996 0.971 0.978 0.997
14 1.002 1.008 1.014 0.999 1.008 1.008 1.002 1.009 1.014 0.999 1.009 1.009 1.001 1.008 1.013 0.998 1.010 1.008 0.994 0.995 1.007 0.987 0.997 1.004
15 1.032 1.035 1.036 1.032 1.038 1.033 1.032 1.035 1.036 1.032 1.041 1.033 1.032 1.035 1.036 1.032 1.040 1.033 1.031 1.044 1.040 1.039 1.052 1.036
16 1.052 1.060 1.049 1.054 1.051 1.073 1.056 1.060 1.049 1.054 1.056 1.074 1.052 1.061 1.050 1.056 1.064 1.075 1.079 1.088 1.065 1.079 1.093 1.092
17 0.946 0.964 0.969 0.948 0.943 0.961 0.947 0.964 0.969 0.948 0.955 0.961 0.947 0.962 0.968 0.946 0.953 0.959 0.925 0.944 0.960 0.929 0.937 0.961
18 0.931 0.946 0.955 0.933 0.938 0.936 0.930 0.946 0.955 0.933 0.941 0.936 0.925 0.944 0.953 0.930 0.948 0.933 0.902 0.920 0.942 0.906 0.905 0.931
19 0.981 0.989 0.994 0.983 0.991 0.982 0.982 0.989 0.994 0.983 0.984 0.982 0.982 0.988 0.993 0.981 0.989 0.980 0.979 0.978 0.988 0.970 0.979 0.979
20 1.020 1.024 1.020 1.018 1.020 1.016 1.017 1.024 1.020 1.018 1.026 1.016 1.018 1.024 1.020 1.017 1.028 1.016 1.030 1.036 1.026 1.028 1.038 1.020
21 0.000 0.000 0.000 0.000 0.000 0.000 0.000 0.000 0.000 0.000 0.000 0.000 0.000 0.000 0.000 0.000 0.000 0.000 0.000 0.000 0.000 0.000 0.000 0.000
22 1.059 1.069 1.059 1.061 1.068 1.087 1.062 1.069 1.059 1.061 1.068 1.087 1.061 1.071 1.061 1.063 1.074 1.089 1.085 1.099 1.075 1.089 1.103 1.105
23 0.947 0.964 0.969 0.948 0.958 0.961 0.945 0.964 0.969 0.948 0.955 0.961 0.942 0.963 0.968 0.946 0.945 0.960 0.928 0.945 0.961 0.929 0.933 0.962
24 0.317 0.317 0.336 0.327 0.332 0.325 0.318 0.316 0.333 0.325 0.331 0.324 0.307 0.306 0.323 0.315 0.319 0.313 0.218 0.217 0.229 0.223 0.225 0.224
25 0.957 0.965 0.967 0.952 0.955 0.948 0.950 0.965 0.967 0.952 0.963 0.948 0.948 0.963 0.965 0.949 0.959 0.946 0.950 0.962 0.963 0.948 0.953 0.951
26 1.003 1.009 1.005 1.001 1.000 0.994 1.001 1.009 1.005 1.001 1.003 0.994 1.002 1.008 1.004 1.000 1.002 0.993 1.017 1.022 1.010 1.011 1.020 0.999
27 0.966 0.982 0.977 0.967 0.977 0.958 0.973 0.982 0.977 0.967 0.985 0.958 0.966 0.981 0.975 0.965 0.970 0.957 0.973 0.986 0.978 0.970 0.978 0.961
28 0.952 0.987 0.968 0.969 0.975 0.959 0.951 0.987 0.967 0.969 0.979 0.958 0.957 0.986 0.966 0.968 0.972 0.957 0.960 0.991 0.970 0.973 0.981 0.960
29 1.092 1.087 1.080 1.085 1.094 1.112 1.087 1.087 1.080 1.085 1.083 1.112 1.092 1.090 1.082 1.087 1.082 1.115 1.114 1.117 1.098 1.112 1.117 1.131
30 1.005 1.012 1.017 1.005 1.011 1.020 1.003 1.012 1.017 1.005 1.009 1.021 1.002 1.012 1.017 1.005 1.014 1.020 1.000 1.002 1.014 0.995 1.004 1.022
31 0.928 0.948 0.957 0.934 0.942 0.938 0.936 0.948 0.957 0.934 0.942 0.938 0.932 0.946 0.955 0.931 0.938 0.935 0.906 0.922 0.944 0.908 0.906 0.933
149

Table C.3 UGD. Variant. Fission Rate Distribution. States S2, S3, S4, S5. Burnup=0MWd/kgHM (continued)
State 2 State 3 State 4 State 5
MCU TVS-M IMS HELIOS MCNP MULTICELL
MCU TVS-M WIMS HELIOS MCNP MULTICELL
MCU TVS-M WIMS HELIOS MCNP MULTICELL
MCU TVS-M WIMS HELIOS MCNP MULTICELL
32 0.958 0.968 0.969 0.954 0.957 0.952 0.952 0.968 0.969 0.954 0.961 0.952 0.949 0.966 0.968 0.952 0.962 0.950 0.949 0.965 0.967 0.951 0.959 0.955
33 0.000 0.000 0.000 0.000 0.000 0.000 0.000 0.000 0.000 0.000 0.000 0.000 0.000 0.000 0.000 0.000 0.000 0.000 0.000 0.000 0.000 0.000 0.000 0.000
34 0.966 0.980 0.978 0.969 0.974 0.953 0.973 0.979 0.977 0.969 0.970 0.952 0.969 0.978 0.976 0.968 0.975 0.951 0.973 0.983 0.980 0.970 0.976 0.955
35 0.318 0.319 0.336 0.329 0.335 0.317 0.320 0.318 0.333 0.327 0.332 0.316 0.308 0.308 0.323 0.317 0.320 0.306 0.218 0.217 0.229 0.222 0.226 0.215
36 0.968 0.990 0.972 0.978 0.983 0.953 0.969 0.989 0.971 0.978 0.981 0.952 0.963 0.989 0.970 0.977 0.986 0.951 0.960 0.992 0.972 0.979 0.989 0.950
37 1.103 1.102 1.097 1.103 1.111 1.134 1.102 1.102 1.098 1.103 1.106 1.134 1.105 1.105 1.101 1.107 1.114 1.138 1.139 1.132 1.117 1.130 1.135 1.154
38 1.029 1.037 1.042 1.030 1.039 1.053 1.026 1.037 1.042 1.030 1.033 1.054 1.035 1.038 1.043 1.031 1.032 1.055 1.017 1.028 1.041 1.022 1.039 1.055
39 0.990 1.000 1.007 0.990 0.998 1.003 0.989 1.001 1.007 0.990 0.996 1.003 0.988 1.000 1.007 0.989 0.997 1.003 0.978 0.982 0.999 0.973 0.980 0.999
40 0.989 0.995 0.999 0.988 0.999 0.988 0.985 0.995 1.000 0.988 0.993 0.989 0.981 0.994 0.999 0.987 0.998 0.987 0.977 0.984 0.995 0.976 0.980 0.985
41 1.023 1.026 1.020 1.016 1.019 1.015 1.021 1.026 1.020 1.017 1.025 1.015 1.020 1.026 1.020 1.016 1.027 1.014 1.031 1.042 1.029 1.032 1.041 1.020
42 1.023 1.025 1.020 1.021 1.030 1.005 1.017 1.024 1.020 1.021 1.021 1.005 1.021 1.024 1.019 1.021 1.031 1.004 1.036 1.043 1.031 1.035 1.045 1.009
43 0.973 0.986 0.980 0.971 0.983 0.952 0.973 0.985 0.980 0.971 0.981 0.951 0.974 0.984 0.979 0.970 0.971 0.950 0.973 0.989 0.984 0.973 0.979 0.950
44 0.975 0.994 0.985 0.978 0.991 0.954 0.980 0.993 0.985 0.978 0.981 0.954 0.977 0.993 0.984 0.976 0.979 0.953 0.979 0.995 0.987 0.979 0.986 0.950
45 1.030 1.045 1.029 1.040 1.046 1.010 1.036 1.045 1.029 1.040 1.043 1.010 1.037 1.045 1.029 1.041 1.048 1.010 1.049 1.060 1.038 1.053 1.059 1.006
46 1.122 1.116 1.115 1.122 1.128 1.157 1.124 1.117 1.116 1.122 1.132 1.157 1.121 1.121 1.120 1.126 1.138 1.162 1.153 1.150 1.139 1.152 1.161 1.179
47 1.046 1.052 1.058 1.047 1.058 1.076 1.050 1.052 1.058 1.047 1.052 1.076 1.048 1.054 1.060 1.049 1.056 1.078 1.031 1.043 1.059 1.039 1.049 1.079
48 1.014 1.019 1.026 1.010 1.016 1.029 1.010 1.019 1.027 1.011 1.013 1.029 1.006 1.019 1.027 1.011 1.020 1.029 0.994 1.000 1.019 0.993 0.997 1.025
49 1.009 1.011 1.015 1.004 1.006 1.012 1.003 1.011 1.016 1.004 1.015 1.012 1.000 1.011 1.015 1.003 1.011 1.011 0.990 0.998 1.010 0.991 0.999 1.007
50 1.029 1.036 1.033 1.034 1.033 1.030 1.032 1.036 1.033 1.034 1.045 1.030 1.036 1.036 1.033 1.034 1.037 1.029 1.050 1.050 1.041 1.045 1.054 1.034
51 1.024 1.035 1.030 1.026 1.026 1.019 1.026 1.035 1.030 1.027 1.029 1.019 1.027 1.035 1.030 1.026 1.033 1.019 1.047 1.054 1.042 1.044 1.059 1.024
52 1.019 1.024 1.020 1.017 1.023 0.997 1.013 1.023 1.020 1.017 1.020 0.996 1.012 1.023 1.020 1.016 1.015 0.996 1.036 1.040 1.032 1.030 1.033 0.998
53 0.000 0.000 0.000 0.000 0.000 0.000 0.000 0.000 0.000 0.000 0.000 0.000 0.000 0.000 0.000 0.000 0.000 0.000 0.000 0.000 0.000 0.000 0.000 0.000
54 1.051 1.054 1.043 1.045 1.060 1.020 1.045 1.054 1.043 1.045 1.059 1.020 1.051 1.055 1.044 1.046 1.050 1.021 1.068 1.071 1.055 1.060 1.082 1.015
55 1.073 1.074 1.062 1.068 1.080 1.041 1.070 1.074 1.062 1.068 1.088 1.040 1.064 1.076 1.064 1.070 1.069 1.042 1.084 1.094 1.077 1.086 1.102 1.035
56 1.151 1.142 1.144 1.154 1.154 1.190 1.155 1.142 1.145 1.154 1.160 1.190 1.151 1.147 1.150 1.160 1.169 1.197 1.201 1.192 1.177 1.201 1.211 1.221
57 1.069 1.071 1.076 1.070 1.078 1.102 1.066 1.071 1.077 1.070 1.078 1.103 1.072 1.074 1.080 1.073 1.079 1.106 1.060 1.069 1.083 1.068 1.067 1.110
58 1.025 1.031 1.039 1.025 1.036 1.047 1.025 1.031 1.039 1.025 1.030 1.047 1.026 1.032 1.040 1.026 1.029 1.048 1.008 1.013 1.033 1.009 1.012 1.044
59 1.013 1.015 1.021 1.009 1.015 1.020 1.006 1.015 1.021 1.009 1.018 1.021 1.013 1.015 1.022 1.009 1.022 1.020 0.996 0.998 1.015 0.993 0.999 1.015
60 1.027 1.035 1.033 1.032 1.038 1.033 1.039 1.035 1.033 1.032 1.041 1.033 1.034 1.035 1.033 1.032 1.040 1.033 1.032 1.044 1.038 1.039 1.052 1.036
61 0.000 0.000 0.000 0.000 0.000 0.000 0.000 0.000 0.000 0.000 0.000 0.000 0.000 0.000 0.000 0.000 0.000 0.000 0.000 0.000 0.000 0.000 0.000 0.000
150

Table C.3 UGD. Variant. Fission Rate Distribution. States S2, S3, S4, S5. Burnup=0MWd/kgHM (continued)
State 2 State 3 State 4 State 5
MCU TVS-M IMS HELIOS MCNP MULTICELL
MCU TVS-M WIMS HELIOS MCNP MULTICELL
CU TVS-M IMS ELIOS MCNP MULTICELL
MCU TVS-M WIMS ELIOS MCNP MULTICELL
62 0.991 0.987 0.998 0.969 0.975 0.959 0.982 0.987 0.998 0.969 0.979 0.958 0.982 0.986 0.997 0.968 0.972 0.957 0.987 0.991 1.002 0.973 0.981 0.960
63 0.999 0.990 0.998 0.978 0.983 0.953 0.998 0.989 0.998 0.978 0.981 0.952 0.993 0.989 0.997 0.977 0.986 0.951 1.007 0.992 1.006 0.979 0.989 0.950
64 1.047 1.045 1.042 1.040 1.046 1.010 1.046 1.045 1.042 1.040 1.043 1.010 1.049 1.045 1.042 1.041 1.048 1.010 1.065 1.060 1.054 1.053 1.059 1.006
65 1.066 1.074 1.057 1.068 1.080 1.041 1.074 1.074 1.057 1.068 1.088 1.040 1.078 1.076 1.058 1.070 1.069 1.042 1.080 1.094 1.072 1.086 1.102 1.035
66 0.000 0.000 0.000 0.000 0.000 0.000 0.000 0.000 0.000 0.000 0.000 0.000 0.000 0.000 0.000 0.000 0.000 0.000 0.000 0.000 0.000 0.000 0.000 0.000
Pin N 56 1 56 56 1 56 1 1 56 56 1 56 1 1 56 56 1 56 1 1 56 56 1 56
151

Table C.4 MOXGD. Variant. Fission Rate Distribution. States S2, S3, S4, S5. Burnup=0MWd/kgHMState 2 State 3 State 4 State 5
MCU TVS-M WIMS ELIOS MCNP MULTICELL
MCU TVS-M WIMS HELIOS MCNP MULTICELL
MCU TVS-M WIMS HELIOS MCNP MULTICELL
MCU TVS-M WIMS HELIOS MCNP MULTICELL
1 0.997 0.982 0.963 1.000 1.004 1.008 0.994 0.983 0.963 1.000 0.990 1.007 1.004 0.991 0.971 1.009 1.004 1.018 1.053 1.042 0.998 1.046 1.053 1.018
2 0.943 0.946 0.931 0.949 0.952 0.958 0.947 0.946 0.931 0.949 0.952 0.957 0.951 0.953 0.937 0.956 0.965 0.965 0.984 0.992 0.955 0.983 0.982 0.967
3 0.866 0.878 0.869 0.865 0.864 0.871 0.862 0.878 0.869 0.865 0.867 0.870 0.869 0.883 0.874 0.870 0.871 0.877 0.878 0.898 0.883 0.881 0.886 0.880
4 0.912 0.922 0.903 0.918 0.920 0.926 0.918 0.923 0.903 0.918 0.918 0.925 0.919 0.928 0.908 0.924 0.913 0.933 0.952 0.963 0.923 0.947 0.956 0.935
5 1.068 1.067 1.074 1.069 1.087 1.076 1.067 1.068 1.074 1.070 1.079 1.074 1.076 1.072 1.079 1.075 1.088 1.081 1.089 1.075 1.090 1.080 1.088 1.087
6 0.998 1.006 1.011 1.000 1.012 1.000 1.009 1.006 1.011 1.000 0.997 0.999 0.996 1.009 1.014 1.003 1.014 1.003 0.994 1.001 1.019 0.998 1.001 1.010
7 0.901 0.908 0.887 0.901 0.904 0.909 0.897 0.909 0.887 0.901 0.904 0.908 0.905 0.914 0.891 0.906 0.900 0.914 0.934 0.948 0.904 0.930 0.935 0.916
8 1.025 1.039 1.040 1.034 1.038 1.040 1.035 1.039 1.041 1.035 1.044 1.038 1.044 1.042 1.044 1.038 1.053 1.044 1.044 1.043 1.053 1.042 1.050 1.050
9 0.957 0.969 0.972 0.952 0.963 0.955 0.953 0.969 0.972 0.952 0.961 0.954 0.957 0.970 0.973 0.953 0.962 0.956 0.947 0.959 0.973 0.946 0.950 0.963
10 0.911 0.935 0.934 0.914 0.923 0.915 0.903 0.936 0.935 0.914 0.914 0.914 0.906 0.935 0.935 0.913 0.912 0.914 0.905 0.923 0.932 0.904 0.904 0.922
11 0.889 0.899 0.876 0.890 0.896 0.897 0.895 0.899 0.876 0.890 0.904 0.896 0.897 0.903 0.880 0.894 0.896 0.901 0.919 0.937 0.891 0.917 0.924 0.902
12 1.019 1.021 1.021 1.016 1.018 1.018 1.020 1.021 1.021 1.016 1.031 1.017 1.013 1.024 1.024 1.019 1.024 1.020 1.015 1.023 1.029 1.021 1.024 1.025
13 0.926 0.947 0.945 0.926 0.945 0.928 0.926 0.947 0.946 0.927 0.926 0.927 0.925 0.947 0.946 0.927 0.927 0.928 0.920 0.935 0.943 0.917 0.918 0.933
14 1.089 1.100 1.125 1.093 1.096 1.096 1.095 1.100 1.125 1.093 1.089 1.098 1.095 1.098 1.124 1.091 1.085 1.097 1.074 1.076 1.117 1.077 1.092 1.101
15 1.125 1.122 1.138 1.122 1.129 1.126 1.129 1.122 1.139 1.122 1.131 1.128 1.118 1.120 1.137 1.120 1.112 1.125 1.120 1.115 1.137 1.119 1.126 1.132
16 0.883 0.895 0.871 0.887 0.893 0.892 0.881 0.895 0.871 0.887 0.896 0.890 0.895 0.899 0.874 0.891 0.894 0.896 0.907 0.932 0.885 0.913 0.927 0.896
17 0.992 0.998 0.997 0.990 0.997 0.991 0.987 0.998 0.997 0.990 1.011 0.989 0.994 1.000 0.999 0.992 0.992 0.992 0.985 0.991 0.997 0.985 1.001 0.991
18 0.906 0.923 0.919 0.903 0.901 0.901 0.899 0.923 0.919 0.903 0.917 0.900 0.903 0.922 0.918 0.902 0.902 0.899 0.882 0.903 0.910 0.883 0.895 0.898
19 1.082 1.085 1.104 1.076 1.083 1.078 1.085 1.085 1.104 1.076 1.082 1.080 1.075 1.082 1.102 1.074 1.095 1.077 1.052 1.060 1.094 1.058 1.069 1.079
20 1.107 1.112 1.118 1.110 1.126 1.114 1.104 1.112 1.118 1.110 1.114 1.116 1.107 1.109 1.116 1.107 1.121 1.112 1.108 1.106 1.116 1.106 1.111 1.117
21 0.000 0.000 0.000 0.000 0.000 0.000 0.000 0.000 0.000 0.000 0.000 0.000 0.000 0.000 0.000 0.000 0.000 0.000 0.000 0.000 0.000 0.000 0.000 0.000
22 0.892 0.899 0.876 0.890 0.895 0.897 0.884 0.899 0.876 0.890 0.898 0.896 0.887 0.903 0.880 0.894 0.888 0.901 0.915 0.937 0.891 0.917 0.932 0.902
23 0.994 0.998 0.996 0.990 0.999 0.991 0.988 0.998 0.996 0.990 1.002 0.990 0.985 1.000 0.998 0.992 0.998 0.992 0.987 0.991 0.997 0.985 1.008 0.991
24 0.306 0.304 0.314 0.308 0.315 0.305 0.307 0.303 0.312 0.306 0.314 0.302 0.300 0.297 0.306 0.300 0.307 0.297 0.227 0.226 0.234 0.229 0.234 0.228
25 1.096 1.101 1.113 1.100 1.100 1.101 1.101 1.100 1.113 1.100 1.101 1.103 1.099 1.097 1.110 1.097 1.102 1.099 1.081 1.084 1.101 1.083 1.083 1.096
26 1.105 1.108 1.113 1.103 1.108 1.109 1.105 1.108 1.113 1.103 1.110 1.111 1.102 1.104 1.110 1.100 1.129 1.107 1.100 1.102 1.108 1.099 1.111 1.110
27 1.084 1.092 1.094 1.086 1.093 1.095 1.089 1.091 1.094 1.086 1.094 1.097 1.084 1.087 1.090 1.082 1.098 1.091 1.070 1.081 1.084 1.075 1.092 1.090
28 1.082 1.093 1.083 1.084 1.095 1.098 1.075 1.092 1.083 1.084 1.103 1.100 1.075 1.088 1.079 1.080 1.090 1.093 1.067 1.083 1.073 1.075 1.094 1.092
29 0.902 0.908 0.887 0.901 0.900 0.909 0.903 0.909 0.888 0.901 0.916 0.908 0.911 0.914 0.892 0.906 0.917 0.914 0.927 0.948 0.904 0.930 0.933 0.916
30 1.013 1.021 1.022 1.016 1.020 1.018 1.012 1.021 1.022 1.016 1.020 1.017 1.016 1.024 1.024 1.019 1.021 1.021 1.017 1.023 1.029 1.021 1.033 1.025
31 0.890 0.923 0.919 0.903 0.911 0.901 0.907 0.923 0.919 0.903 0.901 0.900 0.895 0.922 0.919 0.902 0.902 0.899 0.882 0.904 0.910 0.883 0.884 0.899
152

Table C.4 MOXGD. Variant. Fission Rate Distribution. States S2, S3, S4, S5. Burnup=0MWd/kgHM (continued)State 2 State 3 State 4 State 5
MCU TVS-M WIMS ELIOS MCNP MULTICELL
MCU TVS-M WIMS HELIOS MCNP MULTICELL
MCU TVS-M WIMS HELIOS MCNP MULTICELL
MCU TVS-M WIMS HELIOS MCNP MULTICELL
32 1.101 1.102 1.113 1.101 1.111 1.102 1.107 1.101 1.113 1.101 1.116 1.104 1.094 1.099 1.110 1.097 1.111 1.101 1.089 1.085 1.102 1.084 1.089 1.097
33 0.000 0.000 0.000 0.000 0.000 0.000 0.000 0.000 0.000 0.000 0.000 0.000 0.000 0.000 0.000 0.000 0.000 0.000 0.000 0.000 0.000 0.000 0.000 0.000
34 1.090 1.091 1.092 1.089 1.098 1.095 1.088 1.091 1.092 1.089 1.064 1.096 1.085 1.087 1.088 1.085 1.099 1.090 1.075 1.081 1.085 1.077 1.087 1.089
35 0.303 0.300 0.308 0.301 0.310 0.304 0.300 0.299 0.306 0.300 0.307 0.301 0.295 0.293 0.300 0.293 0.304 0.294 0.227 0.224 0.230 0.226 0.229 0.227
36 1.063 1.093 1.074 1.091 1.092 1.101 1.063 1.093 1.073 1.091 1.092 1.102 1.063 1.088 1.068 1.086 1.092 1.095 1.044 1.084 1.066 1.081 1.071 1.093
37 0.918 0.923 0.905 0.918 0.915 0.926 0.914 0.923 0.905 0.918 0.922 0.925 0.923 0.929 0.910 0.924 0.913 0.933 0.953 0.964 0.923 0.947 0.954 0.935
38 1.038 1.039 1.042 1.035 1.035 1.040 1.037 1.039 1.042 1.035 1.040 1.039 1.036 1.043 1.046 1.038 1.044 1.044 1.045 1.043 1.053 1.042 1.054 1.050
39 0.934 0.947 0.947 0.927 0.929 0.929 0.931 0.948 0.947 0.927 0.940 0.928 0.926 0.948 0.948 0.927 0.932 0.928 0.912 0.936 0.945 0.918 0.931 0.934
40 1.078 1.087 1.106 1.078 1.087 1.080 1.071 1.087 1.106 1.078 1.088 1.083 1.069 1.085 1.104 1.075 1.077 1.080 1.052 1.063 1.097 1.060 1.067 1.083
41 1.117 1.115 1.121 1.109 1.126 1.118 1.116 1.115 1.121 1.109 1.118 1.120 1.108 1.112 1.118 1.106 1.125 1.115 1.105 1.111 1.118 1.108 1.120 1.120
42 1.107 1.113 1.116 1.110 1.117 1.119 1.122 1.113 1.116 1.110 1.116 1.120 1.117 1.110 1.112 1.106 1.120 1.115 1.104 1.113 1.115 1.110 1.118 1.119
43 1.087 1.092 1.096 1.085 1.093 1.099 1.097 1.092 1.095 1.085 1.098 1.100 1.082 1.088 1.091 1.081 1.095 1.093 1.074 1.083 1.086 1.076 1.063 1.091
44 1.085 1.095 1.094 1.085 1.104 1.103 1.087 1.094 1.093 1.085 1.101 1.104 1.086 1.090 1.088 1.080 1.093 1.097 1.074 1.086 1.084 1.077 1.077 1.095
45 1.094 1.119 1.103 1.115 1.132 1.131 1.077 1.119 1.103 1.115 1.121 1.132 1.089 1.115 1.099 1.111 1.110 1.125 1.092 1.121 1.104 1.118 1.110 1.129
46 0.947 0.946 0.934 0.949 0.950 0.958 0.946 0.946 0.934 0.949 0.953 0.957 0.953 0.953 0.940 0.956 0.953 0.966 0.996 0.992 0.957 0.983 0.986 0.967
47 1.062 1.067 1.074 1.070 1.073 1.076 1.072 1.068 1.075 1.070 1.082 1.074 1.081 1.073 1.080 1.075 1.084 1.081 1.089 1.075 1.090 1.080 1.086 1.088
48 0.956 0.969 0.972 0.952 0.958 0.955 0.963 0.970 0.972 0.953 0.971 0.954 0.957 0.971 0.974 0.954 0.967 0.956 0.952 0.960 0.973 0.946 0.957 0.963
49 1.096 1.101 1.124 1.095 1.109 1.097 1.098 1.101 1.124 1.095 1.102 1.100 1.092 1.099 1.123 1.093 1.107 1.098 1.076 1.077 1.117 1.079 1.085 1.103
50 1.109 1.116 1.122 1.116 1.114 1.119 1.113 1.116 1.123 1.116 1.122 1.121 1.106 1.114 1.120 1.114 1.111 1.118 1.104 1.112 1.123 1.113 1.126 1.124
51 1.116 1.117 1.120 1.112 1.116 1.123 1.114 1.117 1.120 1.112 1.107 1.124 1.110 1.113 1.117 1.108 1.120 1.119 1.117 1.117 1.121 1.113 1.117 1.125
52 1.107 1.111 1.115 1.107 1.099 1.119 1.110 1.111 1.115 1.106 1.107 1.120 1.100 1.107 1.111 1.102 1.101 1.114 1.106 1.111 1.116 1.107 1.110 1.117
53 0.000 0.000 0.000 0.000 0.000 0.000 0.000 0.000 0.000 0.000 0.000 0.000 0.000 0.000 0.000 0.000 0.000 0.000 0.000 0.000 0.000 0.000 0.000 0.000
54 1.124 1.123 1.124 1.116 1.121 1.136 1.121 1.123 1.123 1.116 1.117 1.137 1.116 1.119 1.119 1.112 1.132 1.130 1.123 1.126 1.126 1.120 1.127 1.135
55 1.123 1.133 1.136 1.128 1.126 1.149 1.126 1.133 1.136 1.128 1.132 1.150 1.121 1.130 1.132 1.124 1.129 1.143 1.139 1.138 1.141 1.135 1.143 1.149
56 0.993 0.982 0.982 1.000 1.004 1.008 0.995 0.983 0.982 1.000 0.990 1.007 1.006 0.991 0.990 1.009 1.004 1.018 1.046 1.042 1.010 1.046 1.053 1.018
57 0.868 0.878 0.870 0.865 0.864 0.871 0.868 0.878 0.871 0.865 0.867 0.870 0.869 0.883 0.875 0.870 0.871 0.877 0.886 0.898 0.883 0.881 0.886 0.880
58 0.998 1.006 1.013 1.000 1.012 1.000 0.992 1.006 1.013 1.000 0.997 0.999 1.003 1.009 1.016 1.003 1.014 1.003 0.999 1.001 1.019 0.998 1.001 1.010
59 0.912 0.935 0.932 0.914 0.923 0.915 0.911 0.936 0.932 0.914 0.914 0.914 0.914 0.935 0.933 0.913 0.912 0.914 0.903 0.923 0.931 0.904 0.904 0.922
60 1.123 1.122 1.129 1.122 1.129 1.126 1.118 1.122 1.129 1.122 1.131 1.128 1.122 1.120 1.127 1.120 1.112 1.125 1.121 1.115 1.130 1.119 1.126 1.132
61 0.000 0.000 0.000 0.000 0.000 0.000 0.000 0.000 0.000 0.000 0.000 0.000 0.000 0.000 0.000 0.000 0.000 0.000 0.000 0.000 0.000 0.000 0.000 0.000
153

Table C.4 MOXGD. Variant. Fission Rate Distribution. States S2, S3, S4, S5. Burnup=0MWd/kgHM (continued)State 2 State 3 State 4 State 5
MCU TVS-M WIMS ELIOS MCNP MULTICELL
MCU TVS-M WIMS HELIOS MCNP MULTICELL
MCU TVS-M WIMS HELIOS MCNP MULTICELL
MCU TVS-M WIMS HELIOS MCNP MULTICELL
62 1.102 1.093 1.111 1.084 1.095 1.098 1.094 1.092 1.111 1.084 1.103 1.100 1.098 1.088 1.107 1.080 1.090 1.093 1.084 1.083 1.103 1.075 1.094 1.092
63 1.124 1.093 1.110 1.091 1.092 1.101 1.114 1.093 1.110 1.091 1.092 1.102 1.118 1.088 1.105 1.086 1.092 1.095 1.110 1.084 1.108 1.081 1.071 1.093
64 1.134 1.119 1.133 1.115 1.132 1.131 1.130 1.119 1.132 1.115 1.121 1.132 1.127 1.115 1.128 1.111 1.110 1.125 1.138 1.121 1.136 1.118 1.110 1.129
65 1.127 1.133 1.127 1.128 1.126 1.149 1.128 1.133 1.127 1.128 1.132 1.150 1.130 1.130 1.122 1.124 1.129 1.143 1.130 1.138 1.132 1.135 1.143 1.149
66 0.000 0.000 0.000 0.000 0.000 0.000 0.000 0.000 0.000 0.000 0.000 0.000 0.000 0.000 0.000 0.000 0.000 0.000 0.000 0.000 0.000 0.000 0.000 0.000
Pin N 64 55 15 65 45 65 64 55 15 65 55 65 65 55 15 65 54 65 55 55 55 65 55 65
154
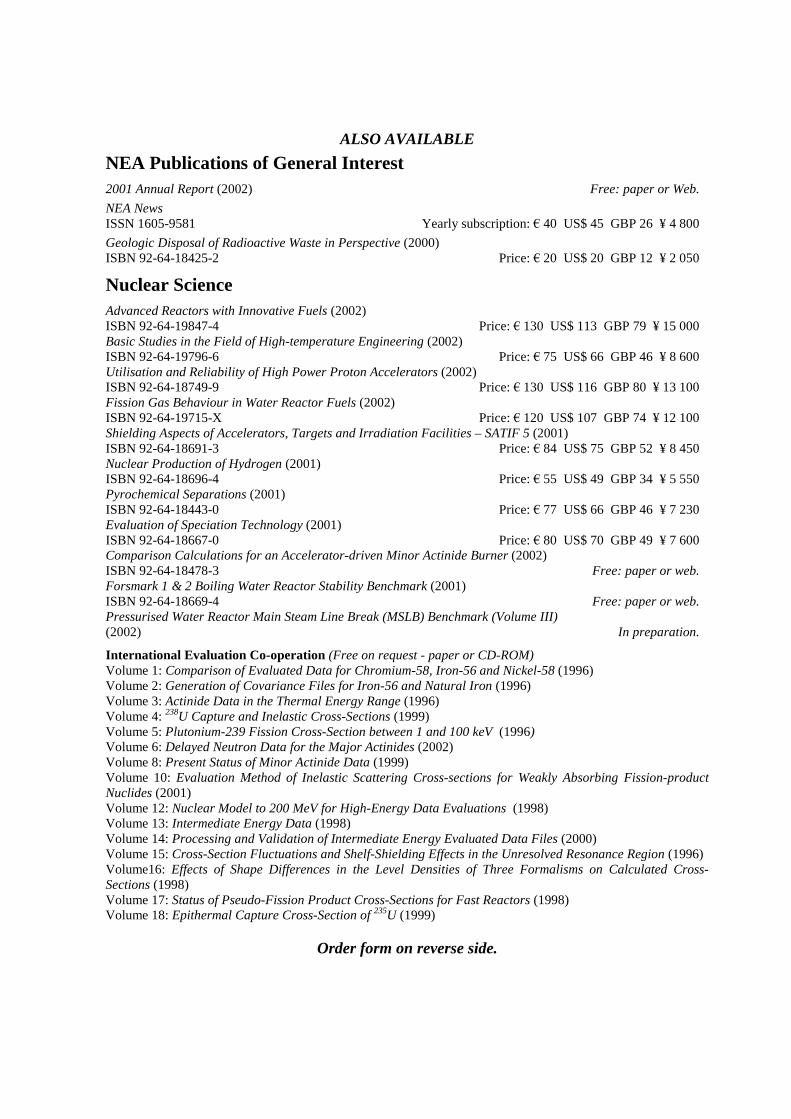
ALSO AVAILABLE
NEA Publications of General Interest2001 Annual Report (2002) Free: paper or Web.
NEA NewsISSN 1605-9581 Yearly subscription: ��40 US$ 45 GBP 26 ¥ 4 800
Geologic Disposal of Radioactive Waste in Perspective (2000)ISBN 92-64-18425-2 Price: ��20 US$ 20 GBP 12 ¥ 2 050
Nuclear ScienceAdvanced Reactors with Innovative Fuels (2002)ISBN 92-64-19847-4 Price: ��130 US$ 113 GBP 79 ¥ 15 000Basic Studies in the Field of High-temperature Engineering (2002)ISBN 92-64-19796-6 Price: ��75 US$ 66 GBP 46 ¥ 8 600Utilisation and Reliability of High Power Proton Accelerators (2002)ISBN 92-64-18749-9 Price: ��130 US$ 116 GBP 80 ¥ 13 100Fission Gas Behaviour in Water Reactor Fuels (2002)ISBN 92-64-19715-X Price: ��120 US$ 107 GBP 74 ¥ 12 100Shielding Aspects of Accelerators, Targets and Irradiation Facilities – SATIF 5 (2001)ISBN 92-64-18691-3 Price: ��84 US$ 75 GBP 52 ¥ 8 450Nuclear Production of Hydrogen (2001)ISBN 92-64-18696-4 Price: ��55 US$ 49 GBP 34 ¥ 5 550Pyrochemical Separations (2001)ISBN 92-64-18443-0 Price: ��77 US$ 66 GBP 46 ¥ 7 230Evaluation of Speciation Technology (2001)ISBN 92-64-18667-0 Price: ��80 US$ 70 GBP 49 ¥ 7 600Comparison Calculations for an Accelerator-driven Minor Actinide Burner (2002)ISBN 92-64-18478-3 Free: paper or web.Forsmark 1 & 2 Boiling Water Reactor Stability Benchmark (2001)ISBN 92-64-18669-4 Free: paper or web.Pressurised Water Reactor Main Steam Line Break (MSLB) Benchmark (Volume III)(2002) In preparation.
International Evaluation Co-operation (Free on request - paper or CD-ROM)Volume 1: Comparison of Evaluated Data for Chromium-58, Iron-56 and Nickel-58 (1996)Volume 2: Generation of Covariance Files for Iron-56 and Natural Iron (1996)Volume 3: Actinide Data in the Thermal Energy Range (1996)Volume 4: 238U Capture and Inelastic Cross-Sections (1999)Volume 5: Plutonium-239 Fission Cross-Section between 1 and 100 keV (1996)Volume 6: Delayed Neutron Data for the Major Actinides (2002)Volume 8: Present Status of Minor Actinide Data (1999)Volume 10: Evaluation Method of Inelastic Scattering Cross-sections for Weakly Absorbing Fission-productNuclides (2001)Volume 12: Nuclear Model to 200 MeV for High-Energy Data Evaluations (1998)Volume 13: Intermediate Energy Data (1998)Volume 14: Processing and Validation of Intermediate Energy Evaluated Data Files (2000)Volume 15: Cross-Section Fluctuations and Shelf-Shielding Effects in the Unresolved Resonance Region (1996)Volume16: Effects of Shape Differences in the Level Densities of Three Formalisms on Calculated Cross-Sections (1998)Volume 17: Status of Pseudo-Fission Product Cross-Sections for Fast Reactors (1998)Volume 18: Epithermal Capture Cross-Section of 235U (1999)
Order form on reverse side.

ORDER FORM
OECD Nuclear Energy Agency, 12 boulevard des Iles, F-92130 Issy-les-Moulineaux, FranceTel. 33 (0)1 45 24 10 15, Fax 33 (0)1 45 24 11 10, E-mail: [email protected], Internet: www.nea.fr
Qty Title ISBN Price Amount
Total*
* Prices include postage fees.
� Payment enclosed (cheque payable to OECD Publications).
Charge my credit card � VISA � Mastercard � Eurocard � American Express
Card No. Expiration date Signature
Name
Address Country
Telephone Fax
OECD PUBLICATIONS, 2 rue André-Pascal, 75775 PARIS CEDEX 16Printed in France.