A Vision for Diagrammatic Ontology Engineeringceur-ws.org/Vol-1299/paper1.pdfA Vision for...
13
A Vision for Diagrammatic Ontology Engineering Gem Stapleton 1 , John Howse 1 , Adrienne Bonnington 2 , and Jim Burton 1 1 University of Brighton, UK, {g.e.stapleton,john.howse,j.burton}@brighton.ac.uk, 2 Horizons Regional Council, NZ, [email protected] Abstract. Ontology engineering is becoming more important, given the rapid rise of data in this information age. To better understand and rea- son about this data, ontologies provide us with insight into its structure. With this comes the involvement of a wide range of stakeholders, such as information analysts, software engineers, lawyers, and domain experts, alongside specialist ontology engineers. These specialists are likely to be adept at using existing approaches to ontology development, typically description logic or one of its various stylized forms. However, not all stakeholders can readily access such notations, which often have a very mathematical style. Many stakeholders, even including fluent ontology engineers, could benefit from visual approaches to ontology engineering, provided those approaches are accessible. This paper presents ongoing re- search into a diagrammatic approach to ontology engineering, outlining key research advances that are required. Keywords: ontology engineering, diagrams, visualization 1 Introduction Ontologies are used as structural frameworks for organizing information and are a form of knowledge representation. Ontology engineering - the process of producing ontologies - is becoming increasingly important and ubiquitous in society as a way of understanding the vast deluge of data that now exists in this information age. Notable examples include the semantic web, medicine (including SAPPHIRE for public health, SNOMED-CT for healthcare) and bioinformatics (e.g. the gene ontology GenNav). Indeed, there are various large repositories of freely available ontologies such as the Manchester OWL Corpus which contains over 4500 ontologies including, between them, over 3 million axioms [4], the Swoogle repository contains over 10000 ontologies [7] and BioPortal contains nearly 400 ontologies from the biomedical domain [3]. Ontology engineering requires the involvement of domain experts, who need to be able to communicate domain knowledge to ontology engineers. In turn, ontology engineers need to verify ontological choices with the domain experts and amend or refine the ontology based on feedback. Thus, the process of pro- ducing ontologies is very much bidirectional and depends on cross-disciplinary 1
Transcript of A Vision for Diagrammatic Ontology Engineeringceur-ws.org/Vol-1299/paper1.pdfA Vision for...

A Vision for Diagrammatic OntologyEngineering
Gem Stapleton1, John Howse1, Adrienne Bonnington2, and Jim Burton1
1 University of Brighton, UK,{g.e.stapleton,john.howse,j.burton}@brighton.ac.uk,
2 Horizons Regional Council, NZ,[email protected]
Abstract. Ontology engineering is becoming more important, given therapid rise of data in this information age. To better understand and rea-son about this data, ontologies provide us with insight into its structure.With this comes the involvement of a wide range of stakeholders, such asinformation analysts, software engineers, lawyers, and domain experts,alongside specialist ontology engineers. These specialists are likely to beadept at using existing approaches to ontology development, typicallydescription logic or one of its various stylized forms. However, not allstakeholders can readily access such notations, which often have a verymathematical style. Many stakeholders, even including fluent ontologyengineers, could benefit from visual approaches to ontology engineering,provided those approaches are accessible. This paper presents ongoing re-search into a diagrammatic approach to ontology engineering, outliningkey research advances that are required.
Keywords: ontology engineering, diagrams, visualization
1 Introduction
Ontologies are used as structural frameworks for organizing information andare a form of knowledge representation. Ontology engineering - the process ofproducing ontologies - is becoming increasingly important and ubiquitous insociety as a way of understanding the vast deluge of data that now exists in thisinformation age. Notable examples include the semantic web, medicine (includingSAPPHIRE for public health, SNOMED-CT for healthcare) and bioinformatics(e.g. the gene ontology GenNav). Indeed, there are various large repositories offreely available ontologies such as the Manchester OWL Corpus which containsover 4500 ontologies including, between them, over 3 million axioms [4], theSwoogle repository contains over 10000 ontologies [7] and BioPortal containsnearly 400 ontologies from the biomedical domain [3].
Ontology engineering requires the involvement of domain experts, who needto be able to communicate domain knowledge to ontology engineers. In turn,ontology engineers need to verify ontological choices with the domain expertsand amend or refine the ontology based on feedback. Thus, the process of pro-ducing ontologies is very much bidirectional and depends on cross-disciplinary
1

communication. Barriers to communication can lead to errors, compounding analready difficult task.
Description logics and OWL are the commonly used (symbolic) notationsfor ontology engineering, and the latter is often seen as a stylized form of theformer; the W3C’s most recent specification of the web ontology language, calledOWL 2.0 [5] is a decidable description logic [9]. Description logics promote a hi-erarchical taxonomy of concepts (called classes in OWL) as a primary modellingfeature. Individuals can be members of concepts. Binary relations over concepts,called roles in description logic and properties in OWL, are used to relate in-dividuals and concepts. In particular, individuals, concepts and roles form thevocabulary over which the axioms that form the ontology are defined. The termdescription logic actually refers to a family of logics, with the simplest such logicof significance being called ALC and perhaps the most practically used beingcalled SHOIN (D). The latter description logic is supported in the prominentontology engineering tool called Protege [6], which has a strong community ofusers including academics, governments and corporations [6].
As well as Protege, other software tools have been implemented to supportthe creation of symbolically specified ontologies. However, when people meetto develop conceptual structures, including models of knowledge intended tobecome ontologies, they sometimes quickly move to sketching images to commu-nicate their thoughts; see Howse et al. [16]. The inaccessibility of the DL familyof symbolic notations is recognised by Rector et al. [18]: “Understanding thelogical meaning of any description logic or similar formalism is difficult for mostpeople, and OWL-DL is no exception.”
Warren et al. back this insight up with an empirical study of the mostcommonly used OWL constructs, including class subsumption, disjointness andequivalence alongside All Values From and other role restrictions [24]. Theyfound that “despite training, users are prone to certain misconceptions” andthey observed that “one-third of [participants] commented on the value of draw-ing a diagram ... In the context of [description logics], diagrams offer a strategyto overcome misconceptions and generally support reasoning.” Warren et al.further recognise that existing visualizations are “chiefly aimed at viewing thestructure of the overall ontology or parts of the ontology rather than the morecognitively difficult features of Description Logics” and they identify that con-cept diagrams [16] are the exception. A major aim of our research is to addressthis identified shortcoming of symbolic notations by providing a diagrammaticalternative based on concept diagrams.
This paper presents an overview of the challenges that must be addressed inorder to deliver a practical framework for using concept diagrams for ontologyengineering. Key challenges include
1. devising a novel pattern-driven diagrammatic method for ontology engineer-ing,
2. producing a heterogeneous logic that allows diagrams and symbols to beused in combination, and
3. developing techniques for automatically visualizing symbolically ontologies.
A Vision for Diagrammatic Ontology Engineering
2

Throughout this paper we discuss the advances necessary to address thesechallenges. To begin, we present a brief overview of the state-of-the-art in on-tology visualization research. We then discuss the design of concept diagrams,showing how they reflect known theories of what constitutes a good diagram.This motivates them as a suitable choice of notation for approaching the chal-lenges set out above. We recognise the need for extensive empirical evaluationsto ensure that concept diagrams are an accessible alternative to notations suchas description logic, but for space reasons we do not discuss this further.
Our ambition is not only to visualize ontologies, but to enable them to beengineered and maintained visually, placing diagrams on an equal footing withtraditional approaches. Throughout the paper, we illustrate key points usinga real world ontology concerning cemeteries and burials. Ontology engineersinterested in using concept diagrams are able to download a free practical userguide from http://www.ontologyengineering.org, under downloads.
2 State-of-the-Art Ontology Visualization Research
Ontology visualization improves access to information by ontology engineers,domain experts and other end-users. Benefits of visualization include reveal-ing information that could be somewhat hidden, or unapparent, when usingtraditional symbolic notations. Such benefits have long been recognised in therelated area of software engineering, as has the need to ensure that softwaremodels (akin to ontologies) are accessible to as wide a range of stakeholders aspossible [8]. Katifori et al. survey the state-of-the-art in ontology visualizationtechniques up to 2007 [17], with examples including OWLViz [2], OntoGraf [1],and CMap Tools [14]. Like OWLViz, OntoGraf exploits node-link diagrams (alsocalled graphs) to visualize subsumption relationships between concepts, but doesnot depict disjointness relationships. There is potential, therefore, for confusionto arise because of the partial information given. CMap Tools also exploit node-link diagrams and, as with OntoGraf, uses directed edges (arrows) to representboth subsumption relationships and role restrictions. Consequently, the saliencyof these two different types of information is significantly reduced.
An example produced using CMAP Tools can be seen in figure 1. The factthat each Deceased is also a Person is asserted by the arrow labelled is a betweenDeceased and Person. The fact that each Deceased has a memorial of some sort isasserted by the use of the same syntactic device: the arrow labelled hasMemorialbetween Deceased and Memorial. CMaps are also capable of depicting disjointnessinformation via arrows, though none is shown in figure 1. Thus, node-link-basedvisualizations such as CMaps and OntoGraf use arrows for role restrictions,subsumption and (where these can be depicted) disjointness relationships.
Similarity theory tells us that saliency is an important visual factor and,in particular, that different syntactic devices should represent different types ofinformation [11]. This is because when visually searching for particular typesof information, increasing degrees of similarity between the target syntax (rep-
A Vision for Diagrammatic Ontology Engineering
3

Fig. 1. A CMap visualization. Fig. 2. A concept diagram.
resenting the required information) and distracter syntax (representing otherinformation) leads to an increase in the time taken to perform tasks.
Concept diagrams aid information saliency by avoiding the use of identicalsyntactic types for different informational types: dots (or, in general, node-linkdiagrams), closed curves, and arrows represent individuals, concepts and rolesrespectively. An example concept diagram, expressing similar information to theCMap visualization, is in figure 2. The placement of (the curve labelled) Deceasedinside Person expresses that Deceased is subsumed by Person. Since Person andMemorial do not overlap, the diagram also expresses that these two conceptsare disjoint (have no individuals in common). The arrow labelled firstName,sourced on Person and targeting the unlabelled curve inside Name asserts thatpeople’s first names are all names (in DL, this is an All Values From restriction:Person v ∀firstName.Name). Here, the unlabelled curve represents an anonymousconcept containing precisely the names that are people’s first names. The othertwo arrows are interpreted in the same way.
One visualization technique which was developed specifically as a diagram-matic logic equivalent to the simple description logic ALC is a variation onexistential graphs by Dau and Eklund [10]. An example of an existential graphis given in figure 3 that expresses the All Values From restriction Person v∀firstName.Name. The existential graph literally translates to ‘it is not the casethat there is a person who has a first name that is not a Name’; curves rep-resent negation, lines represent anonymous individuals and the written wordscorrespond to concepts and roles. Existential graphs are not readily accessiblesince their syntax is somewhat restrictive: they have the flavour of a minimalfirst-order logic with only existential quantification, negation and conjunction.
Fig. 3. An existential graph. Fig. 4. Representing individuals.
A Vision for Diagrammatic Ontology Engineering
4

3 The Design of Concept Diagrams
The design of concept diagrams has been informed by theories as to what con-stitutes an effective visualization. We have already seen that similarity theoryleads us to use different syntactic items for different kinds of constructions. Thisis consistent with the Gestalt principle of good form, which tells us that thereis a tendency for people to group together graphical objects that share someproperty, such as colour or shape. In concept diagrams, individuals are visual-ized using nodes, concepts by closed curves and role restrictions by arrows. Wehave already seen the use of curves and arrows; figure 4 shows how individualsare represented. This diagram asserts that Clifton is a Cemetery but not a Plot,with the same being true of the other seven individuals. Using different types ofgraphical objects ensures the same type of syntax is used to represent the sametype of semantic property. Further, we use shape to partition the curves into twodistinct sets: those which represent named concepts and, respectively, unnamedconcepts are represented using rounded rectangles and, respectively, circles.
Similarly, graphical objects that have different properties will typically beconsidered as being in different groups by people. This suggests that differentsemantic constructs should be represented by different graphical objects, consis-tent with similarity theory. Colour could also be used to good effect, if we wantto give visual clues about some semantic commonality or distinctness. We haveadopted the convention, when colouring concept diagrams, that nodes, curves,and arrows are assigned different colours (in this paper, red, blue and greenrespectively). Rectangles, which identify diagram boundaries, are all black.
The way in which concept diagrams use this syntax to make statements hasbeen carefully considered. In particular, the spatial relationship between curvesreflects the semantic relationships that they convey: concept subsumption, dis-jointness and intersection are represented by enclosure, disjointness and overlapof curves respectively. Likewise, the location of nodes either inside or outside ofcurves corresponds to the individuals represented being either members of, or notmembers of respectively, the corresponding concepts. Properties are directionalrelationships which are captured by arrows, indicating direction. These types offeatures, embodied in concept diagrams’ design, are known as well-matched [13].
An important feature of concept diagrams is that they are fully formal-ized [22]. As is standard with visual languages [12, 15], concept diagrams areformalized using an abstract syntax (sometimes called type syntax). Their se-mantics are defined using a standard model-theoretic approach, akin to thatused for description logics. Due to space reasons, we refer the reader to [22] forthe full details on the formalization of concept diagrams.
4 Patterns
We believe that concept diagrams are able to readily express commonly occur-ring symbolic axioms, for which we have devised a set of simple diagrammaticpatterns [23]. Such an approach is thought to aid building ontologies (i.e. defining
A Vision for Diagrammatic Ontology Engineering
5

the axioms), since the patterns will, essentially, be standard templates for com-monly occurring constraints. However, using a separate diagram for each pieceof information does not allow the exploitation of many important diagrammaticfeatures. In particular, single diagrams that express rich information can do soin an accessible way and such diagrams can correspond to many symbolic ax-ioms (discussed further in section 5). To this end, we demonstrate how simplediagrammatic patterns can be merged to produce informationally rich diagrams.
4.1 Simple Patterns
A series of simple patterns was presented in [23], expressing concept subsump-tion and disjointness as well as All Values From and Some Values From rolerestrictions. Here, we illustrate eight of these simple patterns.
Figures 5 and 6 show instances of patterns for asserting that individuals areand, respectively, are not members of concepts. In particular, figure 5 assertsthat M (short for ‘male’) is a Gender whereas figure 6 asserts that M is not anOccupation. Figures 7 and 8 are instances of the concept subsumption and con-cept disjointness patterns. The former figure tells us that Deceased is subsumedby Person whereas the latter expresses that Person and Gender are disjoint.
Fig. 5. Inclusion. Fig. 6. Exclusion.
Fig. 7. Subsumption. Fig. 8. Disjointness.
Turning our attention to roles, figure 9 diagrammatically expresses an AllValues From restriction. In particular, it tells us that under the role gender, Per-son has all values from the concept Gender. This concept diagram illustrates theuse of multiple boundary rectangles. The spatial relationships between syntacticitems are only of semantic importance within innermost boundary rectangles. Inthis case, the two innermost rectangles mean that the diagram does not tell usthat Person and Gender are disjoint (even though this happens to be true, giventhe information in figure 8).
A Vision for Diagrammatic Ontology Engineering
6
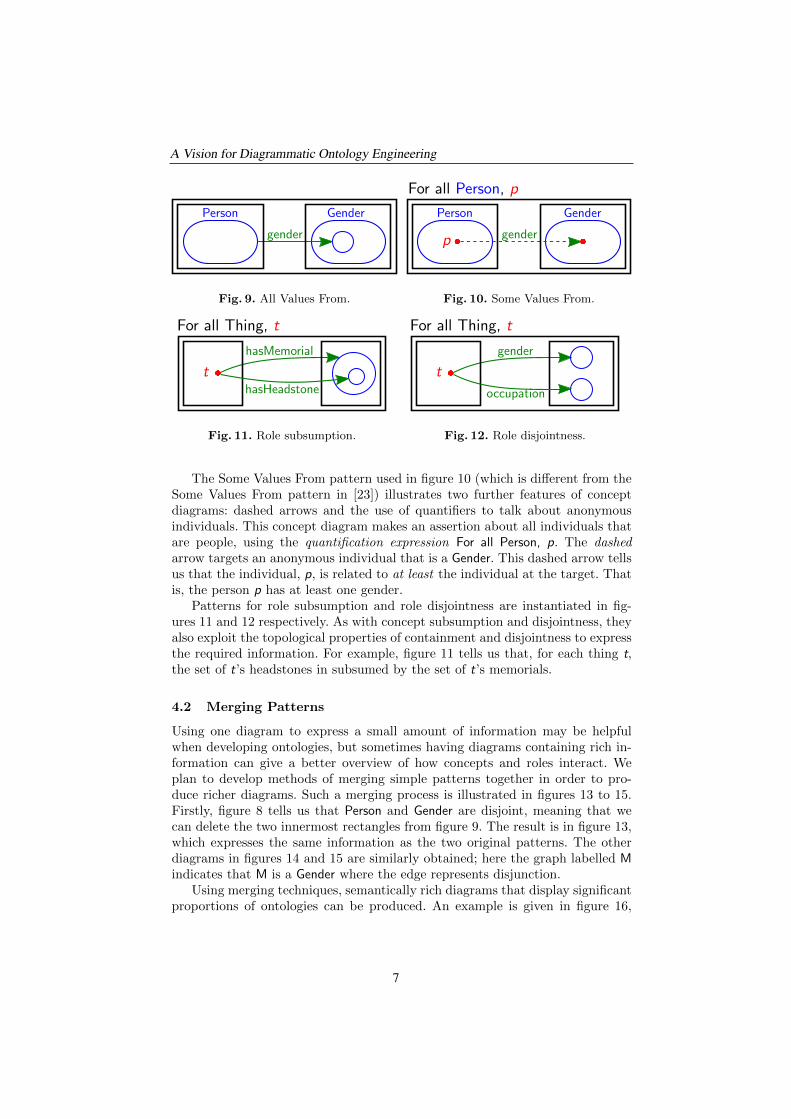
Fig. 9. All Values From. Fig. 10. Some Values From.
Fig. 11. Role subsumption. Fig. 12. Role disjointness.
The Some Values From pattern used in figure 10 (which is different from theSome Values From pattern in [23]) illustrates two further features of conceptdiagrams: dashed arrows and the use of quantifiers to talk about anonymousindividuals. This concept diagram makes an assertion about all individuals thatare people, using the quantification expression For all Person, p. The dashedarrow targets an anonymous individual that is a Gender. This dashed arrow tellsus that the individual, p, is related to at least the individual at the target. Thatis, the person p has at least one gender.
Patterns for role subsumption and role disjointness are instantiated in fig-ures 11 and 12 respectively. As with concept subsumption and disjointness, theyalso exploit the topological properties of containment and disjointness to expressthe required information. For example, figure 11 tells us that, for each thing t,the set of t’s headstones in subsumed by the set of t’s memorials.
4.2 Merging Patterns
Using one diagram to express a small amount of information may be helpfulwhen developing ontologies, but sometimes having diagrams containing rich in-formation can give a better overview of how concepts and roles interact. Weplan to develop methods of merging simple patterns together in order to pro-duce richer diagrams. Such a merging process is illustrated in figures 13 to 15.Firstly, figure 8 tells us that Person and Gender are disjoint, meaning that wecan delete the two innermost rectangles from figure 9. The result is in figure 13,which expresses the same information as the two original patterns. The otherdiagrams in figures 14 and 15 are similarly obtained; here the graph labelled Mindicates that M is a Gender where the edge represents disjunction.
Using merging techniques, semantically rich diagrams that display significantproportions of ontologies can be produced. An example is given in figure 16,
A Vision for Diagrammatic Ontology Engineering
7
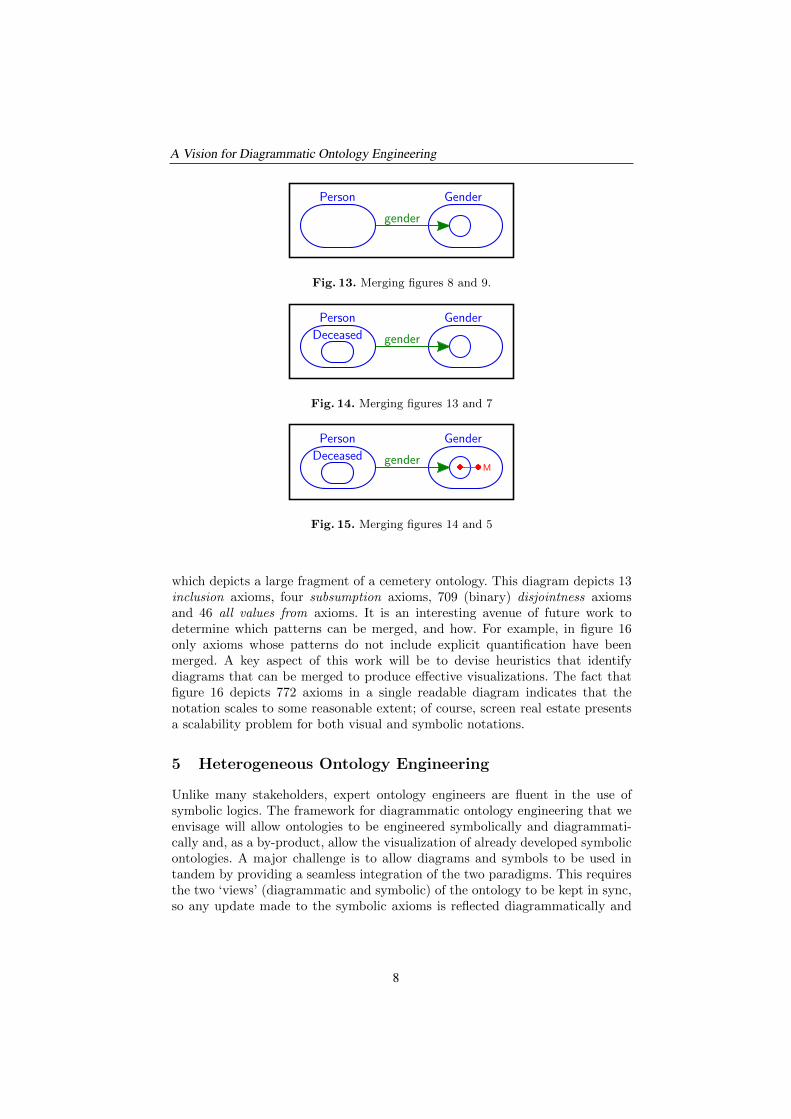
Fig. 13. Merging figures 8 and 9.
Fig. 14. Merging figures 13 and 7
Fig. 15. Merging figures 14 and 5
which depicts a large fragment of a cemetery ontology. This diagram depicts 13inclusion axioms, four subsumption axioms, 709 (binary) disjointness axiomsand 46 all values from axioms. It is an interesting avenue of future work todetermine which patterns can be merged, and how. For example, in figure 16only axioms whose patterns do not include explicit quantification have beenmerged. A key aspect of this work will be to devise heuristics that identifydiagrams that can be merged to produce effective visualizations. The fact thatfigure 16 depicts 772 axioms in a single readable diagram indicates that thenotation scales to some reasonable extent; of course, screen real estate presentsa scalability problem for both visual and symbolic notations.
5 Heterogeneous Ontology Engineering
Unlike many stakeholders, expert ontology engineers are fluent in the use ofsymbolic logics. The framework for diagrammatic ontology engineering that weenvisage will allow ontologies to be engineered symbolically and diagrammati-cally and, as a by-product, allow the visualization of already developed symbolicontologies. A major challenge is to allow diagrams and symbols to be used intandem by providing a seamless integration of the two paradigms. This requiresthe two ‘views’ (diagrammatic and symbolic) of the ontology to be kept in sync,so any update made to the symbolic axioms is reflected diagrammatically and
A Vision for Diagrammatic Ontology Engineering
8

Fig. 16. A large fragment of the cemetery ontology.
A Vision for Diagrammatic Ontology Engineering
9

vice versa; this idea of two views is illustrated using figure 15 and the DL ax-ioms: Person v ∀gender.Gender, Person u Gender v ⊥, Deceased v Person, andGender(M).
Core to solving this challenge is the derivation of effective translations be-tween diagrammatic axioms and symbolic axioms. It is expected that the pat-terns described above, with the merging results, will form a basis for translat-ing symbolically-specified ontologies into concept diagrams. However, significantadvances are required, using patterns as a starting point. Requirements of thetranslation methods are likely to include, but not be limited to: visualize theentire ontology; visualize all concepts; visualize all axioms involving a particularconcept or set of concepts; and visualize all axioms involving a particular roleor set of roles.
Further, we expect to devise translations that permit multiple levels of visu-alization: top-level overviews, some means of exploring the overview includingzooming and filtering, and drilling down to low-level detail as required. Lastly,when symbolic axioms are altered, as will often happen during the refinementand debugging phases of ontology development, the corresponding diagrammaticaxioms must be updated. Translations from concept diagrams to description logicwill also be devised but, again, finding an optimal symbolic set of axioms willbe difficult; as a trivial example, one must choose between the axioms C1 v C2
and C1 v C3 and the single axiom C1 t C2 v C3.
6 Automated Layout
When devising heterogeneous approaches to ontology engineering, it is impor-tant that one is able to automatically draw – or lay out – concept diagrams.When automatically drawing diagrams, one starts with the abstract syntax ofthe required diagram or diagrams. The problem is to draw effective diagrams,with the given abstract syntax. There is considerable choice of layout, wherefigure 17 shows what we consider to be a bad layout of the diagram shown infigure 2.
Fig. 17. A bad layout.
Indeed, the problem of drawing multiple diagrams, where common parts oftwo or more diagrams should – for effective use – look identical substantially in-creases the difficulty. This is illustrated in figures 18 and 19. Figure 18 presents, in
A Vision for Diagrammatic Ontology Engineering
10

separate diagrams, some relationships involving the classes Memorial and Head-stone. The two diagrams have been drawn so that they have a layout that reflectsthe structurally similar information represented. However, we expect that the di-agrams in figure 19 are a more effective pair of visualizations than those figure 18,since their common parts have the same relative positioning in the plane.
Fig. 18. Some Deceased relationships and some Memorial relationships.
Fig. 19. Memorial relationships redrawn to align with layout of Deceased relationships
The problem of drawing multiple-diagrams when translating between nota-tions, where many diagrams can arise from symbolic axioms. Whilst the drawingproblem is inherently computationally complex, it is necessary to seek drawingand layout algorithms that have acceptable run times for most cases that arisein practice and that produce usable results. Empirical evaluations will be neces-sary to determine what constitutes an effective layout, informing choices aboutdiagram topology and geometry.
As a staring point for a general drawing algorithm for concept diagrams, ex-isting Euler diagram drawing methods such as [19–21] can be extended to simplyadd the extra syntax required (giving primacy to the Euler diagram). However,
A Vision for Diagrammatic Ontology Engineering
11

this approach will require extensive modifications to existing algorithms, sincethe initially drawn Euler diagram may compromise the layout of the subsequentlydrawn syntax. Ideally, the drawing algorithms will consider the entirety of theto-be-drawn diagram when making layout choices, not assigning primacy to anyone syntactic part. Moreover, general drawing algorithms are computationallyexpensive and may not always produce effective layouts. For this reason, we planto devise, first, a layout algorithm for classes of concept diagrams that commonlyarise in practice.
Lastly, drawing algorithms are required that incrementally update diagramswhen edits are made to a symbolically specified ontology, to keep the two views insync. These edits can include: deleting axioms, adding new axioms or amendingexisting axioms (which can be considered as a deletion followed by an addi-tion). When an axiom is deleted, this can have profound effects on the layout ofdiagrams. For instance, deleting a disjointness axiom may require some of the(non-overlapping) curves in a diagram to be re-routed (so they overlap, thus notasserting disjointness). Similarly, adding an axiom can also require significantchanges to parts of the diagrams, such as removing an overlap between curves.When diagrams include a lot of syntax, making such changes to curves is notnecessarily straightforward.
7 Conclusion
Our vision is to produce a fully supported diagrammatic logic for ontology engi-neering, which includes implementing software to support its use. If successful,this diagrammatic logic will provide more accessible ways to develop, update andmaintain ontologies. Since the diagrammatic framework that we envisage will befully integrated with existing symbolic approaches, expert ontology engineerswill be able to effectively collaborate with stakeholders who prefer a diagram-matic approach. We view this integration as necessary for the take-up of conceptdiagrams generally.
Acknowledgements We are indebted to Rangitikei District Council for pro-viding us with access to the cemetery data on which the examples in this paperare based.
References
1. OntoGraf. http://protegewiki.stanford.edu/wiki/OntoGraf (2014), accessed Aug2014
2. OWLViz. http://protegewiki.stanford.edu/wiki/OWLViz (2014), accessed Aug2014
3. The BioPortal ontology repository. http://bioportal.bioontology.org/ (2014), ac-cessed Aug 2014
4. The Manchester OWL Corpus. http://owl.cs.manchester.ac.uk/publications/(2014), accessed Aug 2014
A Vision for Diagrammatic Ontology Engineering
12
5. The OWL 2 Web Ontology Language. http://www.w3.org/TR/owl2-overview/(2014), accessed Aug 2014
6. The Protege web site. http://protege.stanford.edu/ (2014), accessed Aug 20147. The Swoogle ontology repository. http://swoogle.umbc.edu/ (2014), accessed Aug
20148. Atkinson, C., Kuhne, T.: Model-Driven Development: A Metamodeling Founda-
tion. IEEE Softw. 20, 36–41 (Sep 2003)9. Baader, F., Calvanese, D., McGuinness, D., Nadi, D., (eds), P.P.S.: The Description
Logic Handbook. CUP (2003)10. Dau, F., Eklund, P.: A diagrammatic reasoning system for the description logic
ACL. Journal of Visual Languages and Computing 19(5), 539–573 (2008)11. Duncan, J., Humphreys, G.W.: Visual search and stimulus similarity. Psychological
review 96(3), 433 (1989)12. Erwig, M.: Abstract syntax and semantics of visual languages. Journal of Visual
Languages and Computing 9, 461–483 (1998)13. Gurr, C.: Effective diagrammatic communication: Syntactic, semantic and prag-
matic issues. Journal of Visual Languages and Computing 10(4), 317–342 (1999)14. Hayes, P., Eskridge, T.C., Mehrotra, M., Bobrovnikoff, D., Reichherzer, T., Saave-
dra, R.: Coe: Tools for collaborative ontology development and reuse. In: Knowl-edge Capture Conference (K-CAP). vol. 2005 (2005)
15. Howse, J., Molina, F., Shin, S.J., Taylor, J.: Type-syntax and token-syntax indiagrammatic systems. In: Proceedings FOIS-2001. pp. 174–185. ACM Press (2001)
16. Howse, J., Stapleton, G., Taylor, K., Chapman, P.: Visualizing ontologies: A casestudy. In: International Semantic Web Conference. pp. 257–272. Springer (2011)
17. Katifori, A., Halatsis, C., Lepouras, G., Vassilakis, C., Giannopoulou, E.: Ontologyvisualization methods a survey. ACM Comput. Surv. 39(4), 10+ (Nov 2007)
18. Rector, A., Drummond, N., Horridge, M., Rogers, J., Knublauch, H., Stevens, R.,Wang, H., Wroe, C.: OWL Pizzas: Practical Experience of Teaching OWL-DL. In:Motta, E., Shadbolt, N., Stutt, A., Gibbins, N. (eds.) Engineering Knowledge inthe Age of the Semantic Web, LNCS, vol. 3257, chap. 5, pp. 63–81. Springer (2004)
19. Riche, N., Dwyer, T.: Untangling Euler diagrams. IEEE Transactions on Visual-ization and Computer Graphics 16(6), 1090–1099 (2010)
20. Simonetto, P.: Visualisation of Overlapping Sets and Clusters with Euler Diagrams.Ph.D. thesis, Universite Bordeaux (2012)
21. Stapleton, G., Flower, J., Rodgers, P., Howse, J.: Automatically drawing Eulerdiagrams with circles. Journal of Visual Languages and Computing 23(3), 163–193(2012)
22. Stapleton, G., Howse, J., Chapman, P., Delaney, A., Burton, J., Oliver, I.: For-malizing Concept Diagrams. In: Visual Languages and Computing. pp. 182–187.Knowledge Systems Institute (2013)
23. Stapleton, G., Howse, J., Taylor, K., Delaney, A., Burton, J., Chapman, P.: To-wards Diagrammatic Ontology Patterns. In: 4th Workshop on Ontology and Se-mantic Web Patterns. CEUR, Sydney, Australia (Oct 2013)
24. Warren, P., Mulholland, P., Collins, T., Motta, E.: The Usability of DescriptionLogics. In: Presutti, V., d’Amato, C., Gandon, F., d’Aquin, M., Staab, S., Tordai,A. (eds.) The Semantic Web: Trends and Challenges, LNCS, vol. 8465, pp. 550–564.Springer (2014)
A Vision for Diagrammatic Ontology Engineering
13