A vast number of vehicles and vessels move goods over the ... · A vast number of vehicles and...
8
Transcript of A vast number of vehicles and vessels move goods over the ... · A vast number of vehicles and...

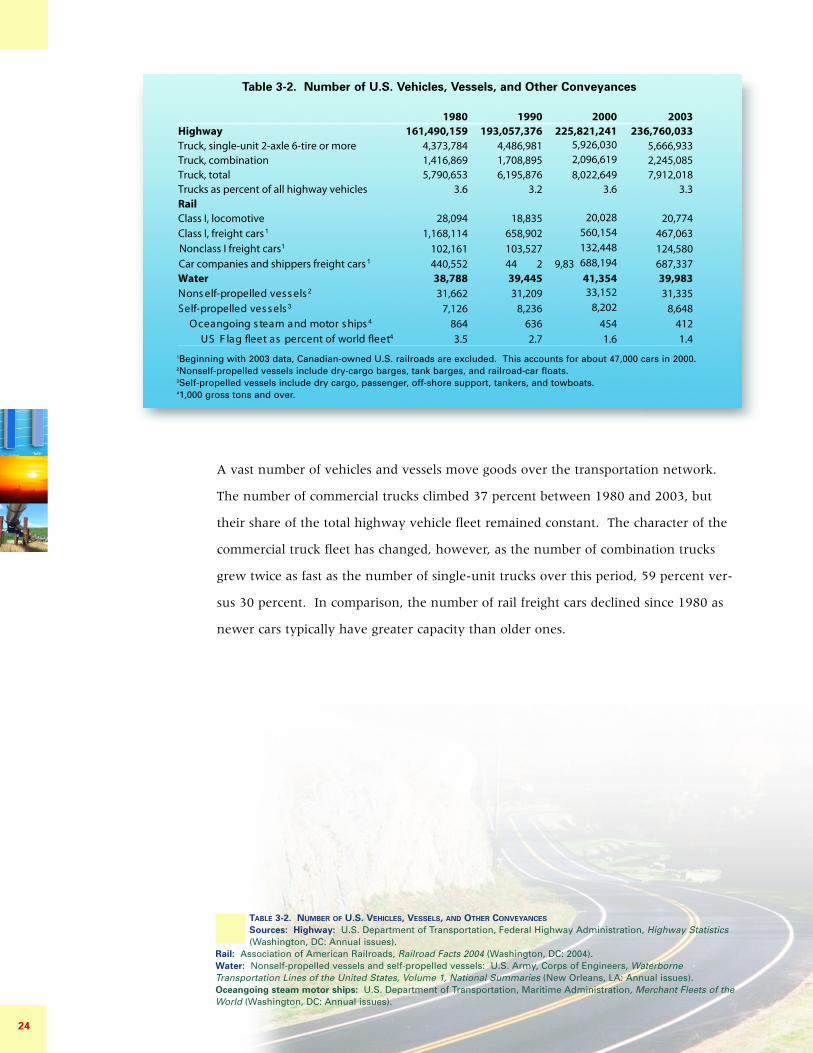
A vast number of vehicles and vessels move goods over the transportation network.
The number of commercial trucks climbed 37 percent between 1980 and 2003, but
their share of the total highway vehicle fleet remained constant. The character of the
commercial truck fleet has changed, however, as the number of combination trucks
grew twice as fast as the number of single-unit trucks over this period, 59 percent ver-
sus 30 percent. In comparison, the number of rail freight cars declined since 1980 as
newer cars typically have greater capacity than older ones.
24
1980 1990 2000 2003Highway 161,490,159 193,057,376 225,821,241 236,760,033Truck, single-unit 2-axle 6-tire or more 4,373,784 4,486,981 5,926,030 5,666,933Truck, combination 1,416,869 1,708,895 2,096,619 2,245,085Truck, total 5,790,653 6,195,876 8,022,649 7,912,018Trucks as percent of all highway vehicles 3.6 3.2 3.6 3.3RailClass I, locomotive 28,094 18,835 20,028 20,774
1,168,114 658,902 560,154 467,063
102,161 103,527 132,448 124,580440,552 44 9,832 688,194 687,337
Water 38,788 39,445 41,354 39,98331,662 31,209 33,152 31,335
7,126 8,236 8,202 8,648864 636 454 412
3.5 2.7 1.6 1.4
Nons elf-propelled vess elsSelf-propelled ves s els
Oceangoing s team and motor s hips
US F lag fleet as percent of world fleet
Class I, freight carsNonclass I freight cars
Car companies and shippers freight cars
TABLE 3-2. NUMBER OF U.S. VEHICLES, VESSELS, AND OTHER CONVEYANCES
Sources: Highway: U.S. Department of Transportation, Federal Highway Administration, Highway Statistics(Washington, DC: Annual issues).
Rail: Association of American Railroads, Railroad Facts 2004 (Washington, DC: 2004).Water: Nonself-propelled vessels and self-propelled vessels: U.S. Army, Corps of Engineers, WaterborneTransportation Lines of the United States, Volume 1, National Summaries (New Orleans, LA: Annual issues).Oceangoing steam motor ships: U.S. Department of Transportation, Maritime Administration, Merchant Fleets of theWorld (Washington, DC: Annual issues).
Table 3-2. Number of U.S. Vehicles, Vessels, and Other Conveyances
1Beginning with 2003 data, Canadian-owned U.S. railroads are excluded. This accounts for about 47,000 cars in 2000.2Nonself-propelled vessels include dry-cargo barges, tank barges, and railroad-car floats.3Self-propelled vessels include dry cargo, passenger, off-shore support, tankers, and towboats. 41,000 gross tons and over.

Most heavy truck miles are made in the
carriage of commodities. Nevertheless,
about 20 percent of truck miles are
made with no product on board.
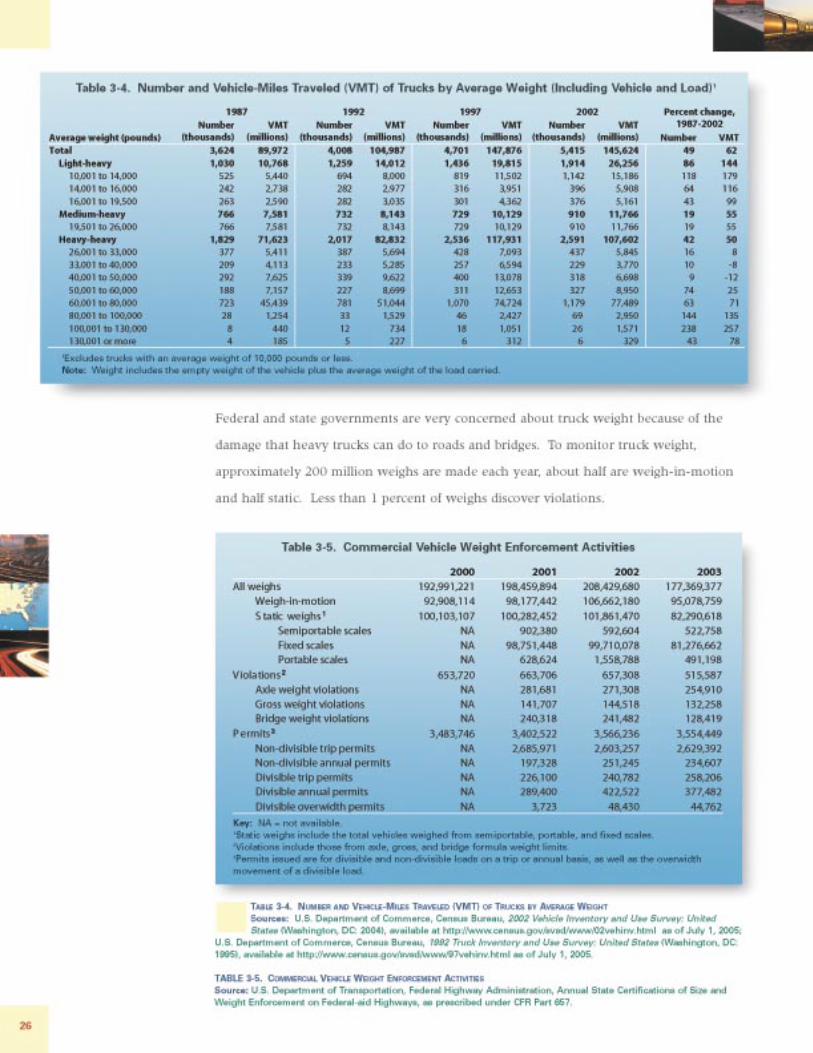
The weight profile of heavy trucks on
the road (those over 10,000 pounds)
changed between 1987 and 2002 with
greater use of trucks at both the lighter
and heavier ends of the spectrum.
Between 1987 and 2002, the number of
light-heavy trucks (between 10,000 and
19,500 pounds) and heavy-heavy
trucks (over 26,000 pounds) increased
86 percent and 42 percent respectively.
Over the same period, the number of
medium-heavy trucks (between 19,501
and 26,000 pounds) grew by only 19
percent. Trucks between 60,000 and
80,000 pounds average weight form the
largest category in both number of
trucks and vmt because in most cases
80,000 pounds is the maximum
allowed on the highway system.
Products carried 145,172
Animals and fish, live 735Animal feed and products of animal origin 2,088Grains, cereal 1,368All other agricultural products 2,661Basic chemicals 876Fertilizers and fertilizer materials 1,666Pharmaceutical products 305All other chemical products and preparations 1,351Alcoholic beverages 1,124Bakery and milled grain products 3,553Meat, seafood, and their preparations 3,056Tobacco products 445All other products foodstuff 7,428Logs and other wood in the rough 1,149Paper or paperboard articles 3,140Printed products 765Pulp, newsprint, paper, paperboard 1,936Wood products 3,561Articles of base metal 3,294Base metal in primary or semifinished forms 2,881Nometallic mineral products 3,049Tools, nonpowered 7,759Tools, powered 6,478Electronic and other electrical equipment 3,024Furniture, mattresses, lamps, etc. 2,043Machinery 3,225Miscellaneous manufactured products 4,008Precision instruments and apparatus 734Textile, leather, and related articles 1,538Vehicles, including parts 3,844All other transportation equipment 636Coal 301Crude petroleum 132Gravel or rushed stone 2,790Metallic ores and concentrates 45Monumental or building stone 462Natural sands 1,089All other nonmetallic minerals 499Fuel oils 1,232Gasoline and aviation turbine fuel 849Plastic and rubber 2,393All other coal and refined petroleum products 1,172Hazardous waste (EPA manifest) 190All other waste and scrape (non-EPA manifest) 2,647Recyclable products 922Mail and courier parcels 4,760Empty shipping containers 794Passengers 274Mixed freight 14,659Products, equipment,or materials not elsewhere classified 265Products not specified 6,358
150No product carried 28,977
Total
Not applica ble
Millions ofmiles
TABLE 3-3. TRUCK MILES BY PRODUCTS CARRIED: 2002Source: U.S. Department of Commerce, CensusBureau, Vehicle Inventory and Use Survey 2002:
United States (Washington, DC: 2004), available athttp://www.census.gov/svsd/www/02vehinv.html as ofJuly 6, 2005.
25
Table 3-3. Truck Miles by Products Carried: 20021
1Excludes pickups, panels, minivans, sport utilities, and station wagons. 2Detail lines may not add to total because multiple products/hazardous mate-rials may be carried at the same time. 3Vehicles not in use. When the respondent had partial-year ownership of thevehicle, annual miles were adjusted to reflect miles traveled when not ownedby the respondent.

In addition to weight, state and
federal governments are also
interested in the length and other
characteristics of commercial
trucks using the road system.
Twenty nine states have semitrail-
er length limitations on the
National Truck Network other
than the 48-foot limit set by
Federal law for a semitrailer oper-
ating in a truck tractor-semitrailer
combination.
TABLE 3-6. SEMITRAILER LENGTH LIMITATIONS ON NATIONAL TRUCK NETWORK BY STATE (48 FEET UNLESS OTHERWISE
SPECIFIED)Source: U.S. Department of Transportation, Federal Highway Administration, Truck Size and Weight, Route
Designations - Length, Width and Weight Limitations, Code of Federal Regulations, Title 23, Part 658.
State Length limitation
(feet and inches) Alabama 53-6 Arizona 57-6 Arkansas 53-6
California 1 48-0 Colorado 57-4 Delaware 53-0 Illinois 53-0
Indiana 2 48-6 Iowa 53-0 Kansas 57-6 Kentucky 53-0 Louisiana 59-6 Mississippi 53-0 Missouri 53-0 Montana 53-0 Nebraska 53-0 Nevada 53-0 New Mexico 57-6 North Dakota 53-0 Ohio 53-0 Oklahoma 59-6 Oregon 53-0 Pennsylvania 53-0 Rhode Island 48-6 South Dakota 53-0 Tennessee 50-0 Texas 59-0
W isconsin 3 48-0 Wyoming 57-4
27
Table 3-6. Semitrailer Length Limitations On National Truck Network by State (48 Feet Unless Otherwise Specified)
1Semitrailers up to 53 feet may also operate without a per-mit by conforming to a kingpin-to-rearmost axle distanceof 38 feet.2Semitrailers up to 53 feet in length may operate without apermit by conforming to a kingpin-to-rearmost axle dis-tance of 40 feet and 6 inches. Semitrailers that are consis-tent with 23 CFR 23 658.13(h) may operate without a per-mit provided the distance from the kingpin to the center ofthe rear axle is 46 feet or less.3Semitrailers up to 53 feet in length may operate without apermit by conforming to a kingpin-to-rearmost axle dis-tance of 41 feet, measured to the center of the rear tan-dem assembly. Semitrailers that are consistent with 23CFR 658.13(h) may operate without a permit provided thedistance from the kingpin to the center of the rear axle is46 feet or less.
Note: The National Truck Network is the composite of theindividual network of highways from each state on whichvehicles authorized by the Surface TransportationAssistance Act of 1982 are allowed to operate.

Fourteen states and six state turnpike authorities allow at least one type of Longer
Combination Vehicle (LCV) on at least some parts of the road network.
28
FIGURE 3-1. PERMITTED LONGER COMBINATION VEHICLES (LCVS) BY STATE AND TRUCK CONFIGURATION
Source: U.S. Department of Transportation, Federal Highway Administration, Comprehensive Truck Size andWeight Study, Volume II (Washington, DC: 2000).
Figure 3-1. Permitted Longer Combination Vehicles (LCVs) by State and Truck Configuration
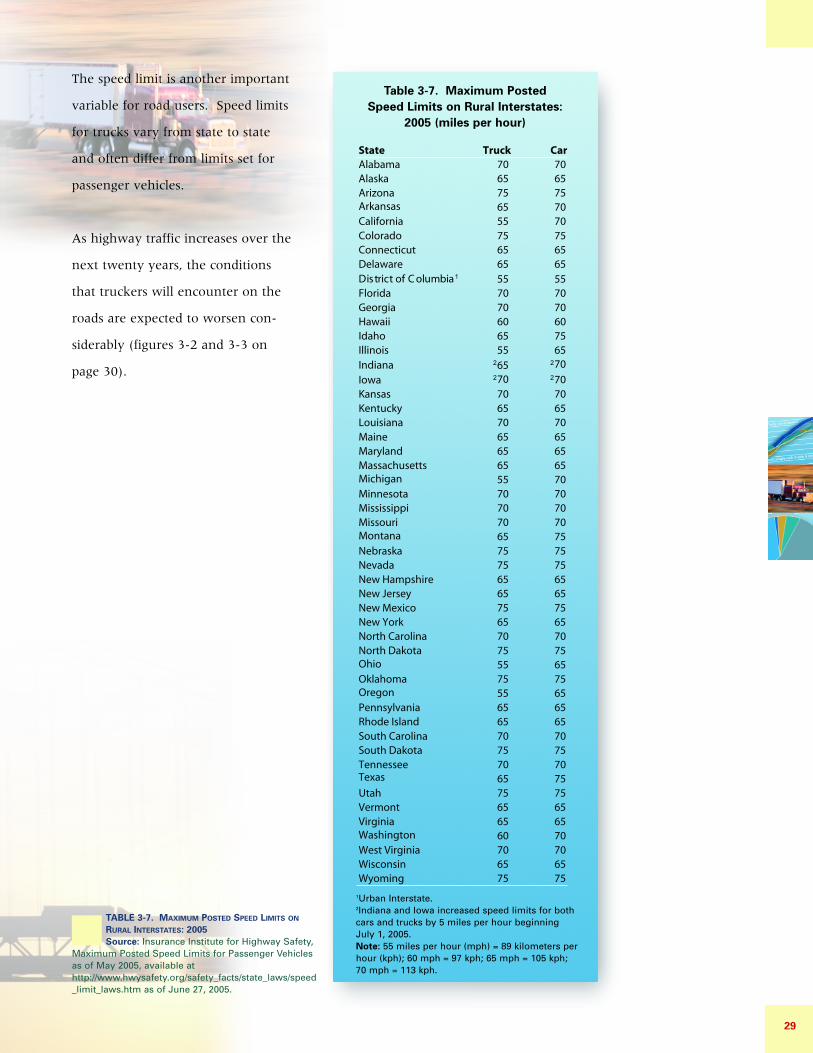
The speed limit is another important
variable for road users. Speed limits
for trucks vary from state to state
and often differ from limits set for
passenger vehicles.
As highway traffic increases over the
next twenty years, the conditions
that truckers will encounter on the
roads are expected to worsen con-
siderably (figures 3-2 and 3-3 on
page 30).
State Truck CarAlabama 70 70Alaska 65 65Arizona 75 75Arkansas 65 70California 55 70Colorado 75 75Connecticut 65 65Delaware 65 65
55 55Florida 70 70Georgia 70 70Hawaii 60 60Idaho 65 75Illinois 55 65IndianaIowaKansas 70 70Kentucky 65 65Louisiana 70 70Maine 65 65Maryland 65 65Massachusetts 65 65Michigan 55 70Minnesota 70 70Mississippi 70 70Missouri 70 70Montana 65 75Nebraska 75 75Nevada 75 75New Hampshire 65 65New Jersey 65 65New Mexico 75 75New York 65 65North Carolina 70 70North Dakota 75 75Ohio 55 65Oklahoma 75 75Oregon 55 65Pennsylvania 65 65Rhode Island 65 65South Carolina 70 70South Dakota 75 75Tennessee 70 70Texas 65 75Utah 75 75Vermont 65 65Virginia 65 65Washington 60 70West Virginia 70 70Wisconsin 65 65Wyoming 75 75
District of C olumbia
6570
70
70
29
Table 3-7. Maximum Posted Speed Limits on Rural Interstates:
2005 (miles per hour)
TABLE 3-7. MAXIMUM POSTED SPEED LIMITS ON
RURAL INTERSTATES: 2005Source: Insurance Institute for Highway Safety,
Maximum Posted Speed Limits for Passenger Vehiclesas of May 2005, available athttp://www.hwysafety.org/safety_facts/state_laws/speed_limit_laws.htm as of June 27, 2005.
1Urban Interstate.2Indiana and Iowa increased speed limits for bothcars and trucks by 5 miles per hour beginning July 1, 2005.Note: 55 miles per hour (mph) = 89 kilometers perhour (kph); 60 mph = 97 kph; 65 mph = 105 kph; 70 mph = 113 kph.

30
Figure 3-3. National Highway System Estimated Peak Period Congestion: 2020
FIGURE 3-2. NATIONAL HIGHWAY SYSTEM ESTIMATED PEAK PERIOD CONGESTION: 1998Source: U.S. Department of Transportation, Federal Highway Administration, Office of Freight Managementand Operations, Freight Analysis Framework.
FIGURE 3-3. NATIONAL HIGHWAY SYSTEM ESTIMATED PEAK PERIOD CONGESTION: 2020Source: U.S. Department of Transportation, Federal Highway Administration, Office of Freight Management andOperations, Freight Analysis Framework.
Figure 3-2. National Highway System Estimated Peak Period Congestion: 1998