A Value-Up Paradigm
26
1 1 A Value-Up Paradigm “A theory should be as simple as possible, but no simpler.” —Albert Einstein Figure 1.1 Einstein’s Theory of Special Relativity was the focal point of a paradigm shift in our understanding of physics. It capped forty years of debate on the most vexing technical challenges of his day—how to synchronize clocks and how to accurately draw maps over long distances. ch01.qxp 4/19/2006 8:30 AM Page 1
Transcript of A Value-Up Paradigm
1
1A Value-Up Paradigm
“A theory should be as simple as possible, but no simpler.”—Albert Einstein
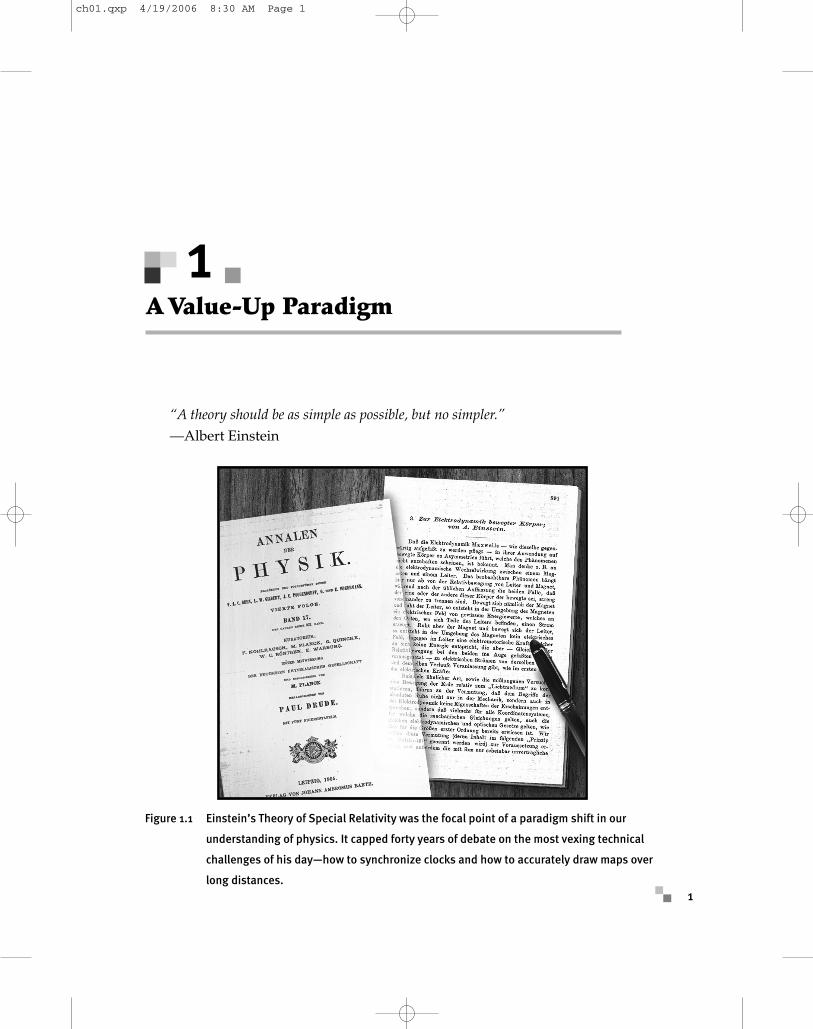
Figure 1.1 Einstein’s Theory of Special Relativity was the focal point of a paradigm shift in our
understanding of physics. It capped forty years of debate on the most vexing technical
challenges of his day—how to synchronize clocks and how to accurately draw maps over
long distances.
ch01.qxp 4/19/2006 8:30 AM Page 1

A Paradigm Shift
Paradigm shifts come in fits and starts, as old theories can no longer explain theworld as observed.1 A poster child for the scientific paradigm shift is Albert Ein-stein’s Theory of Special Relativity, published in 1905. Einstein’s work reduced New-tonian mechanics to a special case, settled forty years of debate on the nature of timeand synchronicity, and set the agenda for much of science, technology, and worldaffairs of the twentieth century.
According to a posthumous legend many of us learned in school, Einstein was asolitary theoretician whose day job reviewing patent applications was a mere dis-traction from his passionate pursuit of physics. Yet this popular view of Einstein ismisguided. In fact, the majority of patent applications that Einstein reviewed con-cerned the very physics problem that fascinated him—how to synchronize time overdistance for multiple practical purposes, such as creating railroad schedules, mar-itime charts, and accurate territorial maps in an age of colonial expansion. Indeed,the synchronization of time was a great technological problem of the age, for whichspecial relativity became a mathematical solution, capping decades of debate.
Einstein was not the only person to solve the mathematical problem in 1905—thefar more prominent Henri Poincaré produced an alternative that has long since beenforgotten.2 Why is Einstein’s solution the one taught in every physics class today?Poincaré’s calculations relied on the “ether,” a supposed medium of space that hadpervaded nineteenth-century physics. Einstein’s Special Relativity, on the otherhand, used much simpler calculations that required no ether. This was the firstnotable example of the principle attributed to Einstein, also posthumously, that “atheory should be as simple as possible, but no simpler.”
Three Forces to Reconcile
A shift similar to the contrasting views of physics 100 years ago has been occurringtoday in software development. On a weekend in 2001, seventeen software lumi-naries convened to discuss “lightweight methods.” At the end of the weekend, theylaunched the Agile Alliance, initially charged around the Agile Manifesto.3 Initially,it was a rallying cry for those who saw contemporary software processes as similar
SOFTWARE ENGINEERING WITH MS VISUAL STUDIO TEAM SYSTEM2
ch01.qxp 4/19/2006 8:30 AM Page 2

to the “ether” of nineteenth-century physics—an unnecessary complexity and animpediment to productivity. Five years later, “agility” is mainstream. Every industryanalyst advocates it, every business executive espouses it, and everyone tries to getmore of it.
At the same time, two external economic factors came into play. One is globalcompetition. The convergence of economic liberalization, increased communicationsbandwidth, and a highly skilled labor force in emerging markets made the out-sourcing of software development to lower-wage countries (especially India) prof-itable.4 The Indian consultancies, in turn, needed to guarantee their quality toAmerican and European customers. Many latched onto Capability Maturity ModelIntegration (CMMI) from the Software Engineering Institute at Carnegie Mellon Uni-versity.5 CMMI epitomized the heavyweight processes against which the agilistsrebelled, and it was considered too expensive to be practical outside of the defenseindustry. The offshorers, with their cost advantage, did not mind the expense andcould turn the credential of a CMMI appraisal into a competitive advantage.
The second economic factor is increased attention to regulatory compliance afterthe lax business practices of the 1990s. In the United States, the Sarbanes-Oxley Actof 2002 (SOX) epitomizes this emphasis by holding business executives criminallyliable for financial misrepresentations. This means that software and systems thatprocess financial information are subject to a level of scrutiny and audit much greaterthan previously known.
These forces—agility, outsourcing/offshoring, and compliance—cannot beresolved without a paradigm shift in the way we approach the software lifecycle.The modern economics require agility with accountability. Closing the gap requiresa new approach, both to process itself and to its tooling.
What Software Is Worth Building?
To overcome the gap, you must recognize that software engineering is not like otherengineering. When you build a bridge, road, or house, for example, you can safelystudy hundreds of very similar examples. Indeed, most of the time, economics dic-tate that you build the current one almost exactly like the last to take the risk out ofthe project.
A VALUE-UP PARADIGM 3
ch01.qxp 4/19/2006 8:30 AM Page 3

With software, if someone has built a system just like you need, or close towhat you need, then chances are you can license it commercially (or even find itas freeware). No sane business is going to spend money on building software thatit can buy more economically. With thousands of software products available forcommercial license, it is almost always cheaper to buy. Because the decision tobuild software must be based on sound return on investment and risk analysis,the software projects that get built will almost invariably be those that are notavailable commercially.
This business context has a profound effect on the nature of software projects. Itmeans that software projects that are easy and low risk, because they’ve been donebefore, don’t get funded. The only new software development projects undertakenare those that haven’t been done before or those whose predecessors are not publiclyavailable. This business reality, more than any other factor, is what makes softwaredevelopment so hard and risky, which makes attention to process so important.6
Contrasting Paradigms
The inherent uncertainty in software projects makes it difficult to estimate tasks cor-rectly, which creates a high variance in the accuracy of the estimates. A common mis-conception is that the variance is acceptable because the positive and negativevariations average out. However, because software projects are long chains ofdependent events, the variation itself accumulates in the form of downstreamdelays.7
Unfortunately, most accepted project management wisdom comes from theworld of roads and bridges. In that world, design risks are low, design cost is smallrelative to build cost, and the opportunity to deliver incremental value is rare. (Youcan’t drive across a half-finished bridge!) With this style of project management, youdetermine an engineering design early, carefully decompose the design into imple-mentation tasks, schedule and resource the tasks according to their dependenciesand resource availability, and monitor the project by checking off tasks as completed(or tracking percentages completed). For simplicity, I’ll call this style of project man-agement the work-down approach because it is easily envisioned as burning down alist of tasks.
SOFTWARE ENGINEERING WITH MS VISUAL STUDIO TEAM SYSTEM4
ch01.qxp 4/19/2006 8:30 AM Page 4

The work-down approach succeeds for engineering projects with low risk, lowvariance, and well-understood design. Many IT projects, for example, are cus-tomizations of commercial-off-the-shelf software (COTS), such as enterpriseresource planning systems. Often, the development is a small part of the project rel-ative to the business analysis, project management, and testing. Typically, these proj-ects have lower variability than new development projects, so the wisdom of roadsand bridges works better for them than for new development.
Since 1992,8 there has been a growing challenge to the work-down wisdom aboutsoftware process. No single term has captured the emerging paradigm, but for sim-plicity, I’ll call this the value-up approach. And as happens with new paradigms, thevalue-up view has appeared in fits and starts (see Figure 1.2).
A VALUE-UP PARADIGM 5
Task 1Plan
Task 3Task 4
Task 2
...
...
...
Work Down Value UpV
alue
Rem
aini
ng W
ork
Figure 1.2 The attitudinal difference between work-down and value-up is in the primary measurement.
Work-down treats the project as a fixed stock of tasks at some cost that need completion
and measures the expenditure against those tasks. Value-up measures value delivered at
each point in time and treats the inputs as variable flows rather than a fixed stock.
An example of the value-up school is the agile project management manifestoDeclaration of Interdependence.9 It states six principles that characterize value-up:
• We increase return on investment by making continuous flow ofvalue our focus.
• We deliver reliable results by engaging customers in frequent inter-actions and shared ownership.
• We expect uncertainty and manage for it through iterations, anticipa-tion, and adaptation.
ch01.qxp 4/19/2006 8:30 AM Page 5

SOFTWARE ENGINEERING WITH MS VISUAL STUDIO TEAM SYSTEM6
• We unleash creativity and innovation by recognizing that individu-als are the ultimate source of value, and creating an environmentwhere they can make a difference.
• We boost performance through group accountability for results andshared responsibility for team effectiveness.
• We improve effectiveness and reliability through situationally spe-cific strategies, processes, and practices.
Behind these principles is a significantly different point of view about practicesbetween the work-down and value-up mindsets. Table 1.1 below summarizes the differences.
CCoorree AAssssuummppttiioonn WWoorrkk--DDoowwnn AAttttiittuuddee VVaalluuee--UUpp AAttttiittuuddee
Planning and changeprocess
Planning and design are themost important activities toget right. You need to dothese initially, establishaccountability to plan, moni-tor against the plan, andcarefully prevent changefrom creeping in.
Change happens; embraceit. Planning and design willcontinue through the proj-ect. Therefore, you shouldinvest in just enough plan-ning and design to under-stand risk and to managethe next small increment.
Primary measurement Task completion. Becausewe know the steps toachieve the end goal, we canmeasure every intermediatedeliverable and computeearned value running as thepercentage of hours plannedto be spent by now versusthe hours planned to bespent to completion.
Only deliverables that thecustomer values (workingsoftware, completed docu-mentation, etc.) count. Youneed to measure the flowof the work streams bymanaging queues thatdeliver customer value andtreat all interim measuresskeptically.
TTaabbllee 11..11 AAttttiittuuddiinnaall DDiiffffeerreenncceess BBeettwweeeenn WWoorrkk--DDoowwnn aanndd VVaalluuee--UUpp PPaarraaddiiggmmss
ch01.qxp 4/19/2006 8:30 AM Page 6

A VALUE-UP PARADIGM 7
CCoorree AAssssuummppttiioonn WWoorrkk--DDoowwnn AAttttiittuuddee VVaalluuee--UUpp AAttttiittuuddee
Definition of quality Conformance to specifica-tion. That’s why you need toget the specs right at thebeginning.
Value to the customer. Thisperception can (and proba-bly will) change. The cus-tomer might not be able toarticulate how to deliver thevalue until working softwareis initially delivered. There-fore, keep options open,optimize for continual deliv-ery, and don’t specify toomuch too soon.
Acceptance of variance Tasks can be identified andestimated in a deterministicway. You don’t need to payattention to variance.
Variance is part of allprocess flows, natural andman-made. To achieve pre-dictability, you need tounderstand and reduce thevariance.
Intermediate work products Documents, models, andother intermediate artifactsare necessary to decomposethe design and plan tasks,and they provide the neces-sary way to measure inter-mediate progress.
Intermediate documentationshould minimize the uncer-tainty and variation in orderto improve flow. Beyondthat, they are unnecessary.
Troubleshooting approach The constraints of time,resource, functionality, andquality determine what youcan achieve. If you adjustone, you need to adjust theothers. Control change care-fully to make sure that thereare no unmanaged changesto the plan.
The constraints may or maynot be related to time,resource, functionality, orquality. Instead, identify theprimary bottleneck in theflow of value, work it until itis no longer the primary one,and then attack the nextone. Keep reducing varianceto ensure smoother flow.
Approach to trust People need to be monitoredand compared to standards.Management should useincentives to reward individ-uals for their performancerelative to the plan.
Pride of workmanship andteamwork are more effectivemotivators than individualincentives. Trustworthy trans-parency, where all team mem-bers can see the overall team’sperformance data, works betterthan management directives.
ch01.qxp 4/19/2006 8:30 AM Page 7

Attention to Flow
Central to the value-up paradigm is an emphasis on flow. There are two discretemeanings of flow, and both are significant in planning software projects.
First, flow is the human experience of performing expertly, as Mihaly Csikszent-mihalyi explains in Flow: The Psychology of Optimal Experience:
We have seen how people describe the common characteristics of opti-mal experience: a sense that one’s skills are adequate to cope with thechallenges at hand, in a goal-directed, rule-bound action system thatprovides clear clues as to how well one is performing. Concentration isso intense that there is no attention left over to think about anythingirrelevant, or to worry about problems. Self-consciousness disappears,and the sense of time becomes distorted. An activity that producessuch experiences is so gratifying that people are willing to do it for itsown sake, with little concern for what they will get out of it, even whenit is difficult, or dangerous.10
This meaning of flow is cited heavily by advocates of eXtreme Programming (XP)and other practices that focus on individual performance.
The second meaning of flow is the flow of customer value as the primary meas-ure of the system of delivery. David J. Anderson summarizes this view in Agile Man-agement for Software Engineering:
Flow means that there is a steady movement of value through the sys-tem. Client-valued functionality is moving regularly through the stagesof transformation—and the steady arrival of throughput—with work-ing code being delivered.11
In this paradigm, you do not measure planned tasks completed as the primary indi-cator of progress; you count units of value delivered. Your rates of progress inthroughput of delivered value and stage of completion at the units of value are theindicators that you use for planning and measurement.
Correspondingly, the flow-of-value approach forces you to understand the con-straints that restrict the flow. You tune the end-to-end flow by identifying the mostsevere bottleneck or inefficiency your process, fixing it, and then tackling the nextmost severe one. As Anderson explains:
SOFTWARE ENGINEERING WITH MS VISUAL STUDIO TEAM SYSTEM8
ch01.qxp 4/19/2006 8:30 AM Page 8

The development manager must ensure the flow of value through thetransformation processes in the system. He is responsible for the rate ofproduction output from the system and the time it takes to process asingle idea through the system. To understand how to improve the rateof production and reduce the lead time, the development managerneeds to understand how the system works, be able to identify the con-straints, and make appropriate decisions to protect, exploit, subordi-nate, and elevate the system processes.12
A flow-based approach to planning and project management requires keeping inter-mediate work-in-process to a minimum, as shown in Figure 1.3. This mitigates therisk of late discovery of problems and unexpected bubbles of required rework.
A VALUE-UP PARADIGM 9N
um
ber
of
Wo
rk It
ems
193 187 179173 166
154
125
88
5943
35
5 10 1829
3849
61 67
715
1618
22
40
68
86
9092
6/1/
2005
6/4/
2005
6/7/
2005
6/10
/200
5
6/13
/200
5
6/16
/200
5
6/19
/200
5
6/22
/200
5
6/25
/200
5
6/28
/200
5
6/30
/200
5
Date
Remaining WorkHow much work is left and when will it be done?
ActiveResolvedClosed
Figure 1.3 Measuring flow of scenario completion on a daily basis shows the rhythm of progress and
quickly identifies bottlenecks that can be addressed as they arise.
Note thebulge in theResolvedscenarioarea, indi-cating a bottleneckin testing.
The slope ofthe Closedline will notapproachthe backlogheight byiterationend.
ch01.qxp 4/19/2006 8:30 AM Page 9

Figure 1.3 shows how the continuous measurement of flow can illuminate bot-tlenecks as they are forming. Planned work for the iteration is progressing wellthrough development (Active turning to Resolved), but is increasingly getting stuckin testing (Resolved to Closed). This accumulates as the bulge of work-in-process inthe middle band. If you tracked development only (the reduction in Active workitems), you would expect completion of the work by the expected end date; butbecause of the bottleneck, you can see that the slope of the Closed triangle is notsteep enough to finish the work on time. This lets you drill into the bottleneck anddetermine whether the problem is inadequate testing resources or poor quality ofwork from development.
Contrast to Work-Down
An icon of the work-down paradigm is the widely taught “iron triangle” view ofproject management. This is the notion that there are only three variables that a proj-ect manager can work with: time, resources (of which people are by far the mostimportant), and functionality. If you acknowledge quality as a fourth dimension(which most people do now), then you have a tetrahedron, as shown in Figure 1.4.
SOFTWARE ENGINEERING WITH MS VISUAL STUDIO TEAM SYSTEM10
Quality
Resources Time
Functionality
Figure 1.4 The “iron triangle” (or tetrahedron) treats a project as a fixed stock of work, in classic
work-down terms. To stretch one face of the tetrahedron, you need to stretch the others.
ch01.qxp 4/19/2006 8:30 AM Page 10

In Rapid Development, Steve McConnell summarizes the iron triangle as follows:
To keep the triangle balanced, you have to balance schedule, cost, andproduct. If you want to load up the product corner of the triangle, youalso have to load up cost or schedule or both. The same goes for theother combinations. If you want to change one of the corners of the triangle, you have to change at least one of the others to keep it in balance.13
According to this view, a project manager has an initial stock of resources and time.Any change to functionality or quality requires a corresponding increase in time orresources. You cannot stretch one face without stretching the others because they areall connected.
Although widely practiced, this paradigm does not work well. Just as Newtonianphysics is now known to be a special case, the iron triangle is a special case thatassumes the process is flowing smoothly to begin with. In other words, it assumesthat resource productivity is quite uniformly distributed, that there is little variancein the effectiveness of task completion, and that no spare capacity exists throughoutthe system. These conditions exist sometimes, notably on low-risk projects. Unfor-tunately, for the types of software projects usually undertaken, they are often untrue.
Many users of agile methods have demonstrated experiences that pleasantly con-tradict to this viewpoint. For example, in many cases, if you improve qualities ofservice, such as reliability, you can shorten time. Significant improvements in flow arepossible within the existing resources and time.14
Transparency
It’s no secret that most software projects are late, both in the execution and in the dis-covery that they are late.15 This phenomenon has many consequences, which are dis-cussed in almost every chapter of this book. One of the consequences is a viciouscycle of groupthink and denial that undermines effective flow. Late delivery leadsto requests for replanning, which lead to pressure for ever more optimistic estimates,which lead to more late delivery, and so on. And most participants in these projectsplan optimistically, replan, and replan further but with little visibility into the effects.Of course, the all-too-frequent result is a death march.
A VALUE-UP PARADIGM 11
ch01.qxp 4/19/2006 8:30 AM Page 11

This is not because people can’t plan or manage their time. The problem is morecommonly the disparity among priorities and expectations of different team mem-bers. Most approaches to software engineering have lots of places to track thework—spreadsheets, Microsoft Project Plans, requirements databases, bug data-bases, test management systems, triage meeting notes, and so on. When the infor-mation is scattered this way, it is pretty hard to get a whole picture of theproject—you need to look in too many sources, and it’s hard to balance all the infor-mation into one schedule. And when there are so many sources, the information youfind is often obsolete when you find it.
Things don’t need to be that way. Some community projects post their develop-ment schedules on the Web, effectively making individual contributors create expec-tations among their community peers about their tasks. Making all the work in aproject visible can create a virtuous cycle. Of course, this assumes that the project isstructured iteratively, the scheduling and estimation are made at the right granular-ity, and triage is effective at keeping the work item priorities in line with the avail-able resources in the iteration.
SCRUM, one of the agile processes, championed the idea of a transparently visi-ble product backlog, as shown in Figure 1.5. Here’s how the founders of SCRUM,Ken Schwaber and Mike Beedle, define the product backlog:
Product Backlog is an evolving, prioritized queue of business and technical functionality that needs to be developed into a system. TheProduct Backlog represents everything that anyone interested in theproduct or process has thought is needed or would be a good idea inthe product. It is a list of all features, functions, technologies, enhance-ments and bug fixes that constitute the changes that will be made to theproduct for future releases. Anything that represents work to be doneon the product is included in Product Backlog.16
This transparency is enormously effective for multiple reasons. It creates a “single setof books,” or in other words, a unique, maintained source of information on thework completed and remaining. Combined with flow measurement, as shown inFigure 1.3, it creates trust among the team because everyone sees the same data andplan. And finally, it creates a virtuous cycle between team responsibility and indi-vidual accountability. After all, an individual is most likely to complete a task whenhe or she knows exactly who is expecting it to be done.17
SOFTWARE ENGINEERING WITH MS VISUAL STUDIO TEAM SYSTEM12
ch01.qxp 4/19/2006 8:30 AM Page 12

One Work Item Database
Visual Studio Team System (VSTS) takes the idea of a transparent product backlogeven further (see Figure 1.6). Team System uses a common product backlog to trackall planned, active, and completed work for the team and a history of the majorityof actions taken and decisions made regarding that work. It calls these units “workitems” and lets the user view and edit them in a database view inside Visual Studio,in Microsoft Excel, and in Microsoft Project, all the while synchronizing them to acommon database.
One database behind the common, familiar tools defragments the information.Instead of cutting and pasting among randomly distributed artifacts, project man-agers, business analysts, developers, and testers all see the same work, whetherplanned in advance or scheduled on the fly, and whether from well-understoodrequirements or discovered while fixing a bug (see Figure 1.7). And unlike separateproject tracking tools and techniques, much of the data collection in VSTS is automatic.
A VALUE-UP PARADIGM 13
Every 24Hours
30 DaysSprint Backlog:Feature(s)assignedto sprint
Product Backlog:Prioritized product features desired by the customer
SCRUM: 15 minute daily meeting.Team members respoing to basics:1) What did you do since last SCRUMMeeting?2) Do you have any obstacles?3) What will you do before nextmeeting?Backlog
ItemsExpanded by Team
New functionalityis demonstrated at end of sprint
Figure 1.5 The central graphic of the SCRUM methodology is a great illustration of flow in the man-
agement sense. Not surprisingly, SCRUM pioneered the concept of a single product back-
log as a management technique.
ch01.qxp 4/19/2006 8:30 AM Page 13

Because VSTS uses a common database to track work items, it exposes them notjust in Team Explorer but also in Microsoft Excel (see Figures 1.8 and 1.9). The useof Excel and Project is convenient but not necessary. All the functionality is availablethrough the Team Explorer, which is the client for Team Foundation. If you’re usingany Visual Studio Team System client edition or Visual Studio Professional, then theTeam Explorer appears as a set of windows inside the development environment.
SOFTWARE ENGINEERING WITH MS VISUAL STUDIO TEAM SYSTEM14
Work Items Scenario
Quality of Service
Development Task
Test Task
Bug
Risk
Excel
Project
Team FoundationClient
Visual Studio
01010101010
101010101011010101010101010101010
SourceCode Test
Work Items
10010101010
010010
0
Portal
Process
Metrics
Figure 1.6 VSTS enacts and instruments the process, tying source code, testing, work items, and met-
rics together. Work items include all the work that needs to be tracked on a project, such
as scenarios, quality of service requirements, development tasks, test tasks, bugs, and
risks. These can be viewed and edited in the Team Explorer, Visual Studio, Microsoft Excel,
or Microsoft Project.
ch01.qxp 4/19/2006 8:30 AM Page 14

A VALUE-UP PARADIGM 15
Figure 1.7 This is an example of the work items as they appear either in the Team Explorer of VSTS or
in Visual Studio. Note that tasks, requirements, and bugs can all be viewed in one place.
Figure 1.8 With VSTS, the same data can be viewed and edited in Microsoft Excel. The work items,
regardless of type, are stored in the same Team Foundation database.
ch01.qxp 4/19/2006 8:30 AM Page 15

The extensibility of Team System makes it possible for Microsoft partners to addfunctionality. For example, Personify Design Teamlook18 provides team members aview of their Team Projects on multiple Team Foundation Servers from withinMicrosoft Office Outlook. Team Foundation Server extensibility enables Teamlook totrack work items with full accountability in the familiar communications tool, Out-look (see Figure 1.10).
SOFTWARE ENGINEERING WITH MS VISUAL STUDIO TEAM SYSTEM16
Offline Editing, Management, and “What-Ifs” of Work Items
For these tasks, use Excel or Project. Your files are stored locally on yourclient machine while you work. The changes are written back in TeamFoundation when you next synchronize with the database, and any poten-tial merge conflicts are highlighted at that time. On the other hand, whenyou use Team Explorer, changes are saved to the database during the session.
Figure 1.9 Microsoft Project lets you plan and manage some or all of the work items with full round
tripping to the Team Foundation database.
ch01.qxp 4/19/2006 8:30 AM Page 16

A VALUE-UP PARADIGM 17
Figure 1.10 With Teamlook from Personify Design, you can also use Outlook as a client for the Team
Foundation server.
Instrument Daily Activities
The transparent backlog relies on accurate data to be useful. Often, collecting thedata becomes a major activity in itself that relies on willing compliance of large num-bers of participants. This disciplined attention to the bookkeeping is rarely sustainedin practice, especially during periods of intense activity.
The irony is that the vast majority of the data that a team needs is directly corre-lated to other actions that are already managed by software. Developers check incode, builds parse that code, testers write and run tests, and all their activities aretracked somewhere—in Project, Excel, the bug database, or timesheets. What if youcould gather all that data automatically, correlate it, and use it to measure theprocess?
ch01.qxp 4/19/2006 8:30 AM Page 17

SOFTWARE ENGINEERING WITH MS VISUAL STUDIO TEAM SYSTEM18
Metric Warehouse Reporting
01010101010
101010101011010101010101010101010
SourceCode Test
Work Items
10010101010
010010
0
Portal
Process
Metrics
Team System takes that approach. It instruments the daily activities of the teammembers to collect process data with no overhead. For example, every time a devel-oper checks updated code into version control, work items are updated to reflect thetasks and scenarios updated by this code. The relationships are captured in a“changeset,” and when the next build runs, it identifies the change sets included andupdates work items again with the build number. When tests execute, they use thesame build number. Then test results, code changes, and work items are all corre-lated automatically by Team System (see Figure 1.11).
Figure 1.11 The metrics warehouse collects the data from all the actions on the project to provide
reports that correlate the different sources and dimensions of data.
ch01.qxp 4/19/2006 8:30 AM Page 18

In addition to keeping the backlog current and visible, this automatic data col-lection populates a data warehouse with metrics that reveal trends and comparisonsof quality from many dimensions on a daily basis. Just like a data warehouse thatprovides business intelligence on functions such as a sales or production process,this one provides intelligence on the software development process.
Simple Observations
With this data warehouse, basic questions become easy to answer: Is the project com-ing in on time, or how far off is it? How much has the plan changed? Who’s over orunder and needs to have work rebalanced? What rates should we use to estimateremaining work? How effective are our tests? Most project managers would love toanswer these basic questions with hard data. When the data collection is automated,the answers become straightforward.
Project “Smells”
More significantly, most project managers would love to find blind spots—placeswhere data indicates a likely problem. It is now common to talk about “smells” forsuspicious areas of code.19 Problems for the project as a whole also appear often ashard-to-pin-down smells, which are not well exposed by existing metrics. I’ll coversmells in some detail in Chapter 9, “Troubleshooting the Project,” but for now I’llshare a common example. Imagine a graph that shows you these bug and test passrates (see Figure 1.12).
Based on Figure 1.12, what would you conclude? Probably that the Instore PickupKiosk code is in great shape, so you should look for problems elsewhere.
At the same time, there’s a danger of relying on too few metrics. Consider thegraph in Figure 1.13, which overlays code churn (the number of lines added, modi-fied, and deleted) and code coverage from testing (the percentage of code lines orblocks exercised during testing) on the same axes.
Suddenly the picture is reversed. There’s really high code churn in Instore PickupKiosk, and the code is not being covered by the tests that supposedly exercise thatcomponent. This picture reveals that we may have stale tests that aren’t exercisingthe new functionality. Could that be why they’re passing and not covering the actualcode in this component?
A VALUE-UP PARADIGM 19
ch01.qxp 4/19/2006 8:30 AM Page 19

Multidimensional Metrics and Smells
The ability to see more dimensions of the project data is a direct benefit of the met-rics warehouse, which collects and correlates data from daily activities. It providesa quantitative, visual tool to pursue the smells. In this way, you can achieve the vis-ibility level needed for the strictest compliance reporting while working in an agilemanner and having the same visibility into a remote project, even outsourced, thatyou would have in a local one.
SOFTWARE ENGINEERING WITH MS VISUAL STUDIO TEAM SYSTEM20
Figure 1.12 The X-axis identifies different components of your project; the bars show you the test
pass rate for each component, while the points and line show the active bug count.
Quality IndicatorsWhat is the quality of software?
100
80
60
40
20
0
100
15
8132
25
5
8335
Instore PickupKiosk
Instore PickupWeb Service
Web App UI Web ComponentIntegration
Co
un
t
VS ProjectActive Bugs (Scale: x1)
Tests Passed (Scale: x1)
Note the hightest pass rateand low bugcount for thiscomponent.
ch01.qxp 4/19/2006 8:30 AM Page 20

Fit the Process to the Project
Instrumenting daily activities and automatically collecting data make it much eas-ier to follow a consistent software process. Team System automates the process guid-ance and instruments the process so that most of the overhead associated withprocess and most of the resistance to compliance are eliminated.
However, this quickly exposes a valid concern, which is that no one process fits allsoftware projects, even within one organization. Regulatory environment, business
A VALUE-UP PARADIGM 21
Figure 1.13 Overlaying code coverage and code churn for the components provides a very different
perspective on the data.
Quality IndicatorsWhat is the quality of software?
100
80
60
40
20
0
100
71
22
81
61
95
56
85
5
83
66
77
Instore PickupKiosk
Instore PickupWeb Service
Web App UI Web ComponentIntegration
Co
un
t
VS ProjectCode Churn (Scale: x.001)Percentage Code CoverageTests Passed (Scale: x1)
0
Note the lowcode coverageand highchurn for thiscomponent.
ch01.qxp 4/19/2006 8:30 AM Page 21

Summary
In practice, most software processes require manual enactment, where collectingdata and tracking progress are expensive. Up front, such processes need lots of
SOFTWARE ENGINEERING WITH MS VISUAL STUDIO TEAM SYSTEM22
risk, business upside, technology risk, team skills, geographic distribution, and projectsize all play a role in determining the right fit of a process to a project.
Team System takes the diversity of process into account, enabling the projectteam to choose or adapt its methodology for contextual realities. When you start ateam project in VSTS, you pick a process template, as shown in Figure 1.14. In effect,you can choose and customize the process further for each project, determining notonly guidance but also workflow, policies, templates, reports, and permissions.
Figure 1.14 When you start a Team Project, your first choice is which “Process Template” to apply for
the project. The Process Template defines the process guidance web site, the work item
types and their workflow, starter work items, the security groups and permissions, and
reports and templates for work products.
ch01.qxp 4/19/2006 8:30 AM Page 22

A VALUE-UP PARADIGM 23
documentation, training, and management, and they have high operating andmaintenance costs. Most significantly, the process artifacts and effort do not con-tribute in any direct way to the delivery of customer value. Project managers canoften spend 40 hours a week cutting and pasting to report status.
This constraint has left process as an exercise for managers, specialist ProgramManagement Offices, and skilled practitioners, who sometimes define metrics andactivities quite divorced from the interests of the practitioners or the tools used toimplement them. The dominant paradigm in this world has been the work-downview, where software engineering is a deterministic exercise, similar to other engi-neering pursuits.
In contrast, the business forces driving software engineering today require a dif-ferent paradigm. In keeping with the dictum “As simple as possible, but no simpler,”a team today needs to embrace the paradigm of customer value, change, variance,and situationally specific actions as a part of everyday practice. This is equally truewhether projects are in-house or outsourced and whether they are local or geo-graphically distributed. Managing such a process usually requires a value-upapproach instead.
Typically, the value-up approach requires tooling. Collecting, maintaining, andreporting the data without overhead is simply not practical otherwise. In situationswhere regulatory compliance and audit are required, the tooling is necessary to pro-vide the change management and audit trails. Team System is designed from theground up to support the value-up approach in an auditable way. The rest of thisbook describes the use of Team System to support this paradigm.
Endnotes
1. Thomas Kuhn, The Structure of Scientific Revolutions (University of ChicagoPress, 1962).
2. Peter Galison, Einstein’s Clocks, Poincaré’s Maps (New York: Norton, 2003), 40.
3. www.agilemanifesto.org
4. See Thomas L. Friedman, The World Is Flat: A Brief History of the Twenty-FirstCentury (New York: Farrar, Strauss & Giroux, 2005) for a discussion of theenabling trends.
ch01.qxp 4/19/2006 8:30 AM Page 23

5. http://www.sei.cmu.edu/cmmi/
6. There are other arguments as well, such as the design complexity of softwarerelative to most engineering pursuits. See, for example, Boris Beizer, “Soft-ware Is Different,” in Software Quality Professional I:1 (American Society forQuality, December 1998).
7. The negative consequence of the interplay of variation and dependent eventsis central to the Theory of Constraints. For example, see Eliyahu M. Goldratt,The Goal (North River Press, 1986).
8. The first major work to highlight what I call the value-up approach is GeraldM. Weinberg, Quality Software Management, Volume I: Systems Thinking (NewYork: Dorset House, 1992).
9. The Agile Project Manifesto is available at http://www.pmdoi.org/. It isanother example of the value-up approach.
10. Mihaly Csikszentmihalyi, Flow: The Psychology of Optimal Experience (NewYork: HarperCollins, 1990), 71.
11. David J. Anderson, Agile Management for Software Engineering: Applying theTheory of Constraints for Business Results (Upper Saddle River, NJ: PrenticeHall, 2004), 77.
12. Ibid., 77.
13. Steve McConnell, Rapid Development (Redmond, WA: Microsoft Press, 1996),126.
14. For a more detailed discussion of this subject, using the nomenclature of theTheory of Constraints, see David J. Anderson and Dragos Dumitriu, “FromWorst to Best in 9 Months: Implementing a Drum-Buffer-Rope Solution inMicrosoft’s IT Department,” presented at the TOCICO Conference, Novem-ber 2005, available at http://www.agilemanagement.net/Articles/Papers/From_Worst_to_Best_in_9_Months_Final_1_2.pdf.
15. The Standish Group (www.standishgroup.com) publishes a biennial surveycalled “The Chaos Report.” According to the 2004 data, 71% of projects werelate, over budget, and/or canceled.
16. Ken Schwaber and Mike Beedle, Agile Software Development with SCRUM(Upper Saddle River, NJ: Prentice Hall, 2001), 32–3.
SOFTWARE ENGINEERING WITH MS VISUAL STUDIO TEAM SYSTEM24
ch01.qxp 4/19/2006 8:30 AM Page 24

A VALUE-UP PARADIGM 25
17. Bellotti, V., Dalal, B., Good, N., Bobrow, D. G., and Ducheneaut, N., “What ato-do: studies of task management towards the design of a personal task listmanager. ” ACM Conference on Human Factors in Computing Systems(CHI2004); 2004 April 24–29; Vienna; Austria. NY: ACM; 2004; 735–742.
18. http://www.personifydesign.com/
19. Originally used for code in Martin Fowler, Refactoring: Improving the Design ofExisting Code (Reading, MA: Addison-Wesley, 1999), 75.
ch01.qxp 4/19/2006 8:30 AM Page 25

ch01.qxp 4/19/2006 8:30 AM Page 26