A Valuation of Novartis including a Real Option Analysis...
86
Master Thesis Marcel Reinders MSc in Finance & International Business A Valuation of Novartis including a Real Option Analysis Based on a Drug R&D Project 01.09.2010 Sign up: April 1 st 2010 Deadline: September 1 st 2010 Academic Advisor: Peter Løchte Jørgensen (PhD) Århus School of Business September 2010
Transcript of A Valuation of Novartis including a Real Option Analysis...

Master Thesis Marcel Reinders MSc in Finance & International Business
A Valuation of Novartis including a Real Option
Analysis Based on a Drug R&D Project
01.09.2010
Sign up: April 1st
2010
Deadline: September 1st
2010
Academic Advisor: Peter Løchte Jørgensen (PhD)
Århus School of Business
September 2010

2 of 130
Table of Contents
Inhalt Table of Contents.......................................................................................................................... 2
List of Figures ................................................................................................................................ 5
List of Tables ................................................................................................................................. 6
Preface .......................................................................................................................................... 7
1 Introduction ............................................................................................................................... 8
1.1 Problem Statement ............................................................................................................. 8
1.2 Methodology and Required Data ........................................................................................ 8
1.3 Introduction of Novartis ...................................................................................................... 9
1.4 Limitation ............................................................................................................................ 9
1.5 Structure ............................................................................................................................ 10
2 Historical Performance ............................................................................................................ 10
2.1 Relevant Accounting Issues ............................................................................................... 10
2.2 Invested Capital ................................................................................................................. 13
2.3 NOPLAT .............................................................................................................................. 13
2.4 Revenue Growth ............................................................................................................... 14
2.5 Return on Invested Capital ................................................................................................ 15
2.6 Free Cash Flow .................................................................................................................. 17
2.7 Credit Health ..................................................................................................................... 17
2.8 Stock Market Performance ............................................................................................... 18
3 Strategic Business Analysis ...................................................................................................... 20
3.1External Analysis ................................................................................................................ 20
3.1.1 PESTEL Analysis .......................................................................................................... 20
3.1.1.1 Political Factors ................................................................................................... 20
3.1.1.2 Economic Factors ................................................................................................ 22
3.1.1.3 Socio-Cultural Factors ......................................................................................... 23
3.1.1.4 Technological Factors .......................................................................................... 24
3.1.1.5 Environmental Factors ........................................................................................ 25
3.1.1.6 Legal Factors ........................................................................................................ 25
3.1.2 Market Definition and Size, Growth and Market Share ............................................. 26
3.1.2.1 Market Definition and Market Size ..................................................................... 26
3.1.2.2 Market Growth .................................................................................................... 27
3.1.2.3 Market Share ....................................................................................................... 28
3.1.3 Porter’s Five Forces Model ......................................................................................... 28
3.1.3.1 Bargaining Power of Suppliers ............................................................................ 29

3 of 130
3.1.3.2 Threat of New Entrants ....................................................................................... 29
3.1.3.3 Bargaining Power of Buyers ................................................................................ 29
3.1.3.4 Threat of Substitute Products ............................................................................. 29
3.1.3.5 Industry Competition .......................................................................................... 30
3.1.4 Key Industry Success Factors ...................................................................................... 30
3.1.4.1 Research and Development ................................................................................ 31
3.1.4.2 Competent Employees ........................................................................................ 31
3.1.4.3 Organizational Efficiency and Product Quality .................................................... 31
3.1.4.4 Financial Strength ................................................................................................ 31
3.1.4.5 Marketing and Sales ............................................................................................ 31
3.1.5 Competitor Analysis ................................................................................................... 31
3.1.5.1 Objectives ............................................................................................................ 32
3.1.5.2 Resources ............................................................................................................ 33
3.1.5.3 Past Performance ................................................................................................ 34
3.1.5.4 Product Portfolio ................................................................................................. 35
3.2 Internal Analysis ................................................................................................................ 37
3.2.1 Corporate Strategy ..................................................................................................... 37
3.2.2 Corporate Culture ...................................................................................................... 38
3.2.3 Value Chain Analysis ................................................................................................... 40
3.2.3.1 Primary Activities ................................................................................................ 40
3.2.3.2 Supporting Activities ........................................................................................... 41
3.2.4 Product Portfolio and Customers ............................................................................... 42
3.3 SWOT Analysis ................................................................................................................... 47
3.3.1 Strengths .................................................................................................................... 47
3.3.2 Weaknesses ................................................................................................................ 48
3.3.3 Opportunities ............................................................................................................. 48
3.3.4 Threats ........................................................................................................................ 49
4 Cost of Capital .......................................................................................................................... 49
4.1 The Cost of Equity ............................................................................................................. 50
4.1.1 The Risk Free Rate ...................................................................................................... 50
4.1.2 The Beta of Novartis ................................................................................................... 51
4.1.3 The Market Risk Premium .......................................................................................... 53
4.2 The after Tax Cost of Debt................................................................................................. 54
4.3 The Capital Structure of Novartis ...................................................................................... 55
4.4 WACC Sensitivity Analysis ................................................................................................. 57
5 Forecasting Performance ........................................................................................................ 58
5.1 Base Case Scenario ............................................................................................................ 59
5.2 Worst Case Scenario.......................................................................................................... 61

4 of 130
5.3 Best Case Scenario ............................................................................................................ 62
6 Valuation of Flexibility-A Real Option Approach.................................................................... 63
6.1 The Value of Flexibility ...................................................................................................... 63
6.2 Development Process ........................................................................................................ 64
6.3 Market and Technical Risk ................................................................................................ 66
5.4 Static NPV .......................................................................................................................... 66
6.5 The Real Options Valuation Approach .............................................................................. 68
6.5.1 Framing the Problem .................................................................................................. 68
6.5.2 Binominal Tree of Underlying Values ......................................................................... 70
6.5.3 The Value of the Option ............................................................................................. 71
7 Calculating and Interpreting Results ....................................................................................... 73
7.1 Value of Operations .......................................................................................................... 74
7.1.1 Discounted Cash Flow ................................................................................................ 74
7.1.2 Continuing Value ........................................................................................................ 74
7.1.3 Value of Operations ................................................................................................... 74
7.2 Equity Value ...................................................................................................................... 75
7.2.1 Value of Non-Operating assets .................................................................................. 75
7.2.2 Value of Non-Equity Claims ........................................................................................ 75
7.2.2.1 Debt ..................................................................................................................... 75
7.2.2.2 Debt Equivalents ................................................................................................. 75
7.2.2.3 Hybrid Claims ...................................................................................................... 76
7.2.2.4 Minority Interest ................................................................................................. 76
7.2.3 Value per Share .......................................................................................................... 76
7.3 Verifying Valuation Results ............................................................................................... 77
7.3.1 Sensitivity Analysis ..................................................................................................... 77
7.3.2 Multiples Analysis ....................................................................................................... 78
7.3.3 Plausibility Analysis .................................................................................................... 80
8 Conclusion ................................................................................................................................ 82
List of Literature ......................................................................................................................... 84
List of Appendices ....................................................................................................................... 87

5 of 130
List of Figures
Figure 1: Invested Capital………………………………………………………… 13
Figure 2: NOPLAT……………………………………………………………….. 13
Figure 3: Total Operating Income………………………………………………... 14
Figure 4 Novartis CAGR…………………………………………………………. 14
Figure 5: Sales by Division………………………………………………………. 15
Figure 6: Return on Invested Capital……………………………………………... 16
Figure 7: Free Cash Flow………………………............................................... 17
Figure 8: Total Shareholder Return………………………………………………. 19
Figure 9: Group Net Sales by Region…………………………………………….. 22
Figure 10: Global Market Sales by Region……………………………………... 26
Figure 11: Total Market Sales……………………………………………………. 27
Figure 12: Market Share………………………………………………………….. 28
Figure 13: Porter’s Five Forces Model…………………………………………… 28
Figure 14: R&D of Net Sales…………………………………………….. ……... 33
Figure 15: Total Assets…………………………………………………............... 34
Figure 16: Pfizer Source of Revenue…………………………………………….. 35
Figure 17: GSK Source of Revenue……………………………………………… 35
Figure 18: Novartis Portfolio Matrix…………………………………………….. 43
Figure 19: Novartis Product Life Cycle………………………………………….. 46
Figure 20: Novartis Scatter Plot………………………………………………….. 51
Figure 21: Novartis Regression Output…………………………………………... 51
Figure 22: Novartis Rolling Beta………………………………………………… 53

6 of 130
List of Tables
Table 1: Sales by Region………………………………………………................. 27
Table 2: R&D Expenditure……………………………………………………….. 33
Table 3: Novartis Pipeline………………………………………………………... 41
Table 4: Novartis Bond Yield……………………………………………………. 55
Table 5: Novartis Capital Structure………………………………………………. 56
Table 6: WACC Sensitivity………………………………………………………. 57
Table 7: Key Figures Base Case Scenario………………………………………... 60
Table 8: Key Figures Worst Case Scenario………………………………………. 61
Table 9: Key Figures Best Case Scenario………………………………………… 62
Table 10: BAF 312 Budget……………………………………………………….. 67
Table 11: BAF 312 Development Cost…………………………………………... 67
Table 12: Value of Operations: DCF Approach………………………………….. 74
Table 13: Value of Equity………………………………………………………… 76
Table 14: Sensitivity Analysis Results…………………………………………… 77
Table 15: Multiples Analysis……………………………………………………... 79

7 of 130
Preface
This thesis has been written as part of the curriculum of the 2-year Master of Science
program in Finance and International Business at the Århus School of Business. The
goal of this paper has been to come up with an estimate of the fair value of the Swiss
pharmaceuticals producer Novartis including a real options approach to value the true
NPV of a new drug development project.
Because the valuation is done from an external perspective no internal information was
available other than what is disclosed by Novartis in annual reports. Additional
information needed for this paper was retrieved from a variety of sources such as
published articles, books, scientific research papers and web pages.
I would like to express my personal gratitude to my supervisor Peter Løchte Jørgensen
for his guidance and assistance during the time the thesis was written. He was always
available and his contribution is highly appreciated.

8 of 130
1 Introduction
Chapter one serves as an introduction to the master thesis providing an outline of the
problem statement, describing the methodology employed as well as the data required.
Furthermore it briefly introduces the company of focus, Novartis, points out the
limitations of thesis and lastly provides a outline of the structure of the thesis.
1.1 Problem Statement
The goal of the paper is the valuation of the pharmaceutical company Novartis and to
estimate its fair market value. To achieve this goal, the historical performance within
the context of its industry and market conditions is analyzed to provide insights into the
company’s future performance and thus its intrinsic value.
Furthermore, a real-option analysis will be conducted based on a research and
development project for a new drug. This process will reveal the value of flexibility that
comes along with research and development for a new drug which cannot be determined
with a common and static NPV analysis. The goal is to show that often a project is
dismissed as value destroying because flexibility is not considered in the calculation
thus foregoing possible value for the company.
1.2 Methodology and Required Data
In order to get a picture of Novartis’ historical performance, a financial analysis will be
performed based on the company’s balance sheet and income statement from the
previous years. A strategic business analysis will also be conducted, including a
PESTEL and competitor analysis, Porter’s 5 forces and finally a SWOT analysis based
on the information generated from the strategic business analysis.
To estimate the enterprise value of the company, the discounted cash flow method will
be used and for calculating the cost of equity the CAPM model is used, whereby the
equity risk premium will be estimated based on historical data from the S&P 500
market index. If need be, the Black and Scholes formula for pricing an option will be
employed to calculate the value of option packages for executive management payment
schemes. In order to value flexibility with real option analysis, a binomial lattice with
risk-neutral-probabilities will be applied.
Data input required for writing the paper are the annual reports from Novartis to
determine past and future performance. Also required is data on the company’s
environment that reveals information about the industry, its participants as well as

9 of 130
possible threats and opportunities for the company. To determine the company’s cost of
equity data from the financial markets is required, such as stock returns, index returns as
well as government bond rates. As far as the data requirements for the real option
analysis is concerned, various assumptions have to be made with regard to the present
value of the drug’s estimated future cash flow, required investments, volatility and steps
of the research and development process. These assumptions are necessary due to
undisclosed information by the company.
1.3 Introduction of Novartis
Novartis is a biotechnology and pharmaceutical company which is headquartered in
Basel, Switzerland (Novartis, 2010).1 The name Novartis has Latin origin (novae artes),
meaning new arts. Novartis was founded in 1996 after the merger of the two Basel
located pharmaceutical and chemical companies Ciba-Geiger AG and Sandoz. In 1996
the merger of these two companies was the biggest merger in the world up to that date.
Today Novartis is the third largest pharmaceutical company in the world with about
100.000 employees worldwide and annual revenues of more than 46 billion USD in
2009. It is also one of the fastest growing companies in the industry which also puts big
effort into research and development of new drugs. In 2008 Novartis was ranked on
second place in Fortunes magazine’s “World’s most admired companies” survey in the
pharmaceutical industry. Novartis has four main business areas which are:
- Pharmaceuticals: innovative drugs which are protected by patents
- Vaccines and diagnostics: vaccines and diagnostics to protect humans against
life-threatening diseases
- Sandoz: generic pharmaceuticals that substitute branded drugs after patent
expiration
- Consumers health: over-the-counter drugs, animal health and CIBA Vision
1.4 Limitation
It is important to note that the valuation was performed from an outside perspective
from which no internal information was available for the valuation process.
Furthermore, the competitor analysis is only based on the two most important
competitors of Novartis due to time and page limit. The pharmaceutical industry is
1 http://www.novartis.com/about-novartis/index.shtml

10 of 130
highly fragmented with hundreds of competitors around the world analyzing all of them
is impossible. Regarding the real option analysis it should be noted that the budget and
key parameters are based on assumption due to lack of inside information. To get an
estimate of volatility the plan for doing a Monte Carlo analysis was abandoned. The
reasoning is that this would not generate additional value since no information was
available in what range revenues of the potential new drug can change.
Nevertheless, the assumptions made during the valuation process where made to the
best of knowledge and are deemed reasonable and largely approximate reality in a
satisfying manner.
1.5 Structure
The thesis structure consists of an introduction in chapter 1 after which the historical
performance of Novartis is discussed in chapter 2. In chapter 3 the strategic business
analysis of Novartis is done after which the weighted average cost of capital of Novartis
is estimated in chapter 4. In chapter 5 the future performance of Novartis is forecasted
and in chapter 6 a real options analysis for a potential new drug of Novartis is
performed. In chapter 7 the final results are calculated and interpreted. In the chapter 8
the thesis is concluded.
2 Historical Performance
In chapter two the historical performance of Novartis is analyzed based on annual
reports of the previous ten years. In order to accurately assess a company’s potential to
generate cash flows in the future and forecast its performance, it is necessary to analyze
the company’s past development and the drivers behind this development. The main
source for an external analysis is thus the financial statements provided by Novartis.
First relevant accounting issues will be addressed which is followed by an analysis of
invested capital, net operating profit less adjusted taxes (NOPLAT), revenue growth,
return on invested capital (ROIC), free cash flow, credit health and stock market
performance.
2.1 Relevant Accounting Issues
In the analysis of Novartis several accounting issues require special attention. These are:

11 of 130
• Accounting standards: Novartis follows the International Financial Reporting
Standards (IFRS) since 2001 which are published by the International
Accounting Standards Board (IASB). Before 2001 Novartis had been following
International Accounting Standards (IAS) published by the International
Accounting Standards Committee (IASC) which was succeeded by the IASB
which largely adopted the IAS standards as a basis for further development.
• Acquisitions and goodwill: Novartis has acquired a number of companies over
the years in order to acquire new technologies, product rights and diversify its
product portfolio. Acquisitions are consolidated into the financial statements
while the excess purchase price over the fair value of net assets acquired is
recorded as goodwill in the balance sheet (Novartis, 2009, p. 187). Since 2005
Goodwill is not subject to amortization but considered to have indefinite life
which is tested annually for impairment.
• Operating leases: Novartis is in engaged in a number of operating lease contracts
to finance tangible assets which do not appear on the balance sheet but are part
of operating activities. The value of these leases was calculated by using the
following formula:
����� ����� ����� ������
�� � 1����� ����
The rental expenses were taken from the annual reports as disclosed by Novartis
and the average asset life was estimated to be 10 years. The calculation of the
company’s cost of debt is explained in chapter 4.
• Operating cash: Novartis holds enormous amounts of cash and cash equivalents.
The amount of operating cash was estimated at 2% of total annual revenues
which seems to be reasonable according to Koller, Goedhart and Wessels (2005,
p.171). The remaining cash is considered to be excess cash.
• Marginal tax rate: With the information provided by Novartis on tax rates a
precise calculation of the marginal tax rate was not possible. Marginal tax rate is
defined as the tax rate on an additional dollar of income and therefore the
average tax rate reported by Novartis was used to approximate the marginal tax
rate. Reason for this is the fact that Novartis operates in many different countries
worldwide with different tax rates making an average of these tax rates a

12 of 130
reasonable proxy for a tax rate on the next dollar of income. The marginal tax
rate used for calculations is 15.22%.
• Research and development costs: According to IFRS Novartis expenses all
research and development (R&D) costs through the income statement for which
uncertainties exist whether or not future sales can be generated. R&D costs will
only be capitalized as intangible assets by Novartis when approval has been
granted by authorities in a major market (Novartis, 2010, p.191). However, for
technology companies as well as pharmaceutical companies such as Novartis,
research and development is very important and failure to recognize these costs
as intangible assets can lead to an understatement of invested capital. This would
result in an overstatement of return on invested capital (Koller, Goedhart and
Wessels, 2005, p.200). Therefore, to get a more accurate estimate of invested
capital, research and development costs will be capitalized.
• Pension plan: Novartis offers both defined contribution as well as defined
benefit pension schemes. As far as defined benefit plans are concerned, which
are important for valuation purposed, the fair value of plan assets in 2008 and
2008 was less than defined benefit obligations required thus resulting in net
liabilities of $ 428 million (Novartis, 2010, p.232). These liabilities have to be
subtracted from enterprise value when calculating equity value.
• Share split: In 2001 a 40:1 share split was approved by shareholders at the
annual general meeting, becoming effective on May 7th, 2001. Thus,
shareholders exchange one share with a nominal value of 20 Swiss Francs
(CHF) for 40 shares with a nominal value of 0,50 CHF per share. All share
related data has been adjusted to the changes of the share split (Novartis, 2002,
p.72).
• Change of reporting currency: In 2003 the reporting currency of consolidated
financial statements of Novartis was changed from CHF to U.S. Dollars from
January 1st, 2003. Reasons for the change of reporting currency are the increased
importance of sales in the United States as well easier comparison of financial
statements between peer companies of the pharmaceutical industry (Novartis,
2004, p.111).
• Dividends: Since the foundation of Novartis, the company has paid out annual
dividends to shareholders on a continuous basis. In 2009 board of directors

13 of 130
Source: own design
Source: own design
0
10.000
20.000
30.000
40.000
50.000
60.000
70.000
2000 2001 2002 2003 2004 2005 2006 2007 2008 2009
14.117
29.724
54.853
68.983
Figure 1: Invested Capital ($ Mio.)
0,00
2.000,00
4.000,00
6.000,00
8.000,00
10.000,00
12.000,00
14.000,00
2001 2002 2003 2004 2005 2006 2007 2008 2009
5.805,98
8.653,71
11.316,17 12.068,75
Figure 2: NOPLAT (in Mio.)
proposed a 5% increase in dividend payment at the Annual General Meeting.
This would be the 13th consecutive dividend increase since 1996.
2.2 Invested Capital
Invested capital represents operating assets less operating liabilities (Koller, Goedhart
and Wessels, 2005, p.165). In the case of Novartis research and developments costs
were capitalized since they represent significant intangible assets for a pharmaceutical
company such as Novartis. Operating
invested capital including goodwill and
intangible assets increased continuously
from 2001 until 2009 by 454%. As
depicted in figure 1 invested capital
increased significantly due to increased
research and development activities and
acquisitions in the period 2004 to 2009.
Notable acquisitions in this period were Hexal, Eon Labs and Chiron. In 2009 invested
capital totaled about 68.9 billion USD of which 20,4% can be attributed to net property,
plant and equipment and 73,8% to goodwill and intangible assets. For more detailed
information refer to appendix 1.
2.3 NOPLAT
NOPLAT represents total income generated from company operations that are available
to investors of Novartis. As can be seen from the figure 2 Novartis was able to increase
NOPLAT continuously over the years from 2001 until 2009. NOPLAT increased from
2001 to 2009 by 208%. Reason for the
positive development of NOPLAT over the
years is the steady growth in net income due
to increasing revenues. The increasing
development of NOPLAT was interrupted in
2005 and then increased again sharply in 2006.
Reason for this development was a change in
deferred tax assets and deferred tax liabilities. In 2008 and 2009 NOPLAT even kept
growing despite negative influence of currency effects. For more detailed information
on NOPLAT, please refer to appendix 1.

14 of 130
Source: own design
0
10.000
20.000
30.000
40.000
50.000
2000 2001 2002 2003 2004 2005 2006 2007 2008 2009
22.199 24.864
36.749
45.103
Figure 3:Total Operating Revenue (in Mio.)
11,1%
12,0%
9,4%
8,6%
6,8%
0,0%
2,0%
4,0%
6,0%
8,0%
10,0%
12,0%
14,0%
2005 2006 2007 2008 2009
Figure 4: CAGR - Novartis
Source: own design
2.4 Revenue Growth
The group sales of Novartis have been
constantly increasing since 2001 as visible
in figure 3. Reason for the constant
increase in sales is the increasing need of
aging people for reliable and effective
medicines as well as strong product
growth and the launch of additional new
medicines. Also important is the fact that Novartis has put considerable effort in the past
to expand its business worldwide and has established a diversified portfolio of health
care products. In 2009, group sales increased by 11% in local currencies and by 7% in
USD to roughly 44.3 billion USD, making Novartis one of the strongest growing
companies in the industry (Novartis, 2010, p.7).
When looking at the five year compound annual growth rate (CAGR) for the last five
years the picture is a different one. From
2005 until 2009 the CAGR shrunk from
11,1% to 6,8% as depicted in figure 4.
Possible explanations for this
development are increasing
governmental pressure to lower prices,
currency fluctuations, as well as
increased competition from other generic
drugs and illegal copies and other
pharmaceutical companies. Global economic downturn in the last 3 years has also
effected the revenue growth of Novartis to some extent. Revenue growth has been
mostly generated internally, however partially growth has been generated by acquisition
of companies such as Hexal, Eon Labs and Chiron.
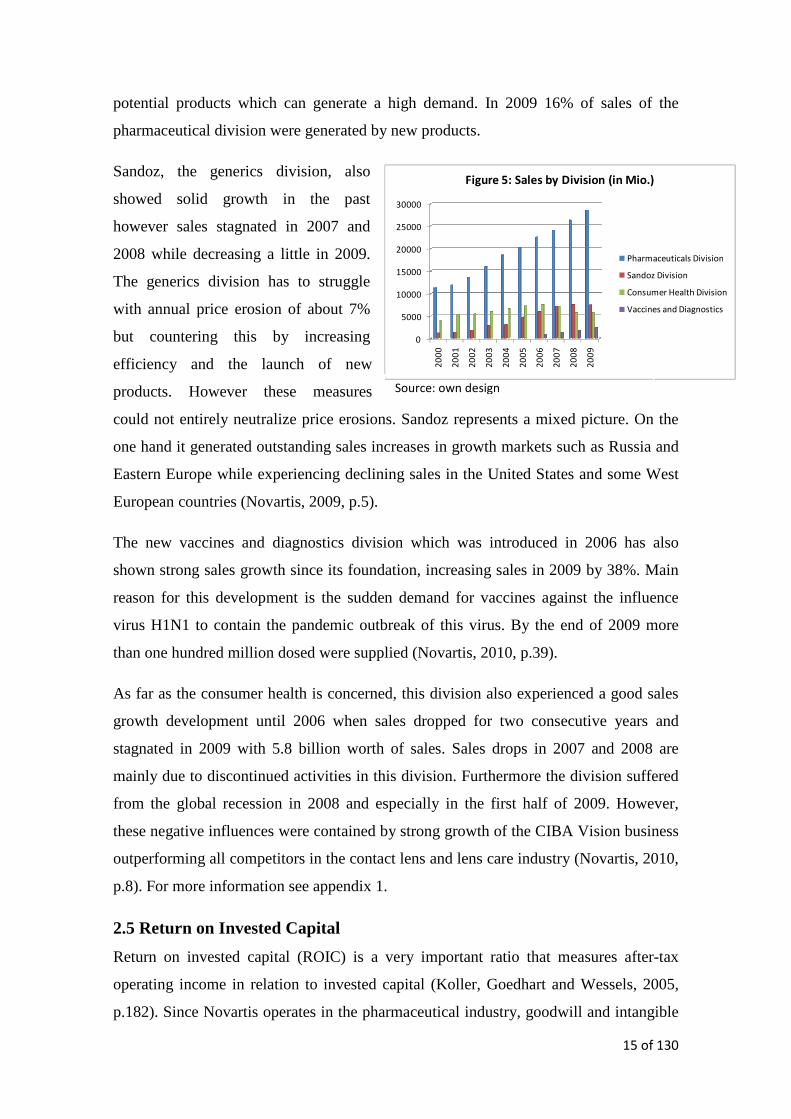
When taking a closer look at sales on the divisional level as depicted in figure 5 is
becomes evident that the pharmaceuticals division (drugs that are protected by patents)
generated the lion share of sales in the past. The products sold by this division are high-
tech products which are very expensive and usually have high margins. Another reason
for the positive sales development of this division is that it regularly launches new high
15 of 130
0
5000
10000
15000
20000
25000
30000
20
00
20
01
20
02
20
03
20
04
20
05
20
06
20
07
20
08
20
09
Figure 5: Sales by Division (in Mio.)
Pharmaceuticals Division
Sandoz Division
Consumer Health Division
Vaccines and Diagnostics
Source: own design
potential products which can generate a high demand. In 2009 16% of sales of the
pharmaceutical division were generated by new products.
Sandoz, the generics division, also
showed solid growth in the past
however sales stagnated in 2007 and
2008 while decreasing a little in 2009.
The generics division has to struggle
with annual price erosion of about 7%
but countering this by increasing
efficiency and the launch of new
products. However these measures
could not entirely neutralize price erosions. Sandoz represents a mixed picture. On the
one hand it generated outstanding sales increases in growth markets such as Russia and
Eastern Europe while experiencing declining sales in the United States and some West
European countries (Novartis, 2009, p.5).
The new vaccines and diagnostics division which was introduced in 2006 has also
shown strong sales growth since its foundation, increasing sales in 2009 by 38%. Main
reason for this development is the sudden demand for vaccines against the influence
virus H1N1 to contain the pandemic outbreak of this virus. By the end of 2009 more
than one hundred million dosed were supplied (Novartis, 2010, p.39).
As far as the consumer health is concerned, this division also experienced a good sales
growth development until 2006 when sales dropped for two consecutive years and
stagnated in 2009 with 5.8 billion worth of sales. Sales drops in 2007 and 2008 are
mainly due to discontinued activities in this division. Furthermore the division suffered
from the global recession in 2008 and especially in the first half of 2009. However,
these negative influences were contained by strong growth of the CIBA Vision business
outperforming all competitors in the contact lens and lens care industry (Novartis, 2010,
p.8). For more information see appendix 1.
2.5 Return on Invested Capital
Return on invested capital (ROIC) is a very important ratio that measures after-tax
operating income in relation to invested capital (Koller, Goedhart and Wessels, 2005,
p.182). Since Novartis operates in the pharmaceutical industry, goodwill and intangible

16 of 130
0,0%
10,0%
20,0%
30,0%
40,0%
50,0%
60,0%
70,0%
80,0%
90,0%
100,0%
Figure 6: Return on Invested Capital
ROIC (w/o intangible
assets)
ROIC (w/ intangible
assets)
Source: own design
assets are very important and R&D expenditure should be capitalized. Therefore ROIC
is calculated including intangible assets (Koller, Goedhart and Wessels, 2005, p. 200).
As can be seen from figure 6 the
difference between ROIC with and
without intangible assets its very
significant showing that a significant
part of Novartis’ invested capital results
from intangible assets. ROIC has been
decreasing over the years due to rapid
investment in research and development
and goodwill even though sales could be increased in every year since 2001.
To find out how the operational drivers affect the return on invested capital for the last
five years a ROIC tree has to be set up (see appendix 2). The ROIC tree reveals that
Novartis’ ROIC is primarily driven by its high operating margin which in turn is driven
by its high gross margin. Here Novartis can clearly profit from its pharmaceutical
division which markets new drugs which are protected by patents that enable the
company to generate high margins. This is a likely source of competitive advantage for
Novartis, which is able to get approval from authorities on a regular basis to market new
drugs which are protected by patents.
With regard to average capital turns, it is obvious that efficient use of capital is not a
source that drives return on invested capital. Due to high research and development
expenditures, which increased over the years and that are considered part of invested
capital, average capital turns actually have a negative effect on ROIC. However,
without a significant research and development effort Novartis would not be able to
develop new highly effective drugs that could generate high margins. Another important
factor in determining ROIC is the cash tax rate. Novartis benefits from low cash tax
rates that positively influence ROIC. The cash tax rate varied significantly over the last
five years mainly due to big annual differences in deferred tax liabilities. In 2004 the
cash tax rate was even negative due to a massive increase in deferred tax liabilities.
Finally, at the end of the ROIC tree, the final ROIC is presented for each given year.
ROIC decreased from 2005 until 2008 mainly due to increases in intangible fixed assets
that resulted in low average capital turns in spite of a constantly high operating margin.

17 of 130
Source: own design
-4000,0
-2000,0
0,0
2000,0
4000,0
6000,0
8000,0
2001 2002 2003 2004 2005 2006 2007 2008 2009
4743,2
1283,9
3549,93442,7
-2610,8
-3583,3
5100,4
6120,2
7427,8
Figure 7: Free Cash Flow (in mio.)
2.6 Free Cash Flow
Free Cash Flow is the after-tax cash flow
available to debt and equity holders. It is
defined as NOPLAT plus noncash operating
expenses net of investments in invested
capital (Koller, Goedhart and Wessels, p.164).
As can be seen from figure 7 free cash flow
generated by Novartis underwent a kind of
mixed development in the past nine years. After 2001, free cash flow dropped
significantly mainly due to increased investments in working capital and capital
expenditures. Furthermore in 2002 investments in operating leases were introduced
which further reduced free cash flow.
In 2003 and 2004 free cash flow increased to almost 5.6 billion USD mainly because of
increased NOPLAT and less working capital even though investments in intangible
assets and goodwill increased. In 2005 and 2006 Novartis generated negative free cash
flow of $2.6 and $3.6 billion. Main cause for this negative development was intangible
assets and acquisitions related costs.
In the following years of 2007 until 2009 Novartis was able to generate positive cash
flows again which increased from $5.4 billion in 2007 to $7.4 billion in 2009. The
increased positive cash flows were mainly caused by higher sales and NOPLAT as well
as lower gross investment and lower investment in intangibles. For more detailed
information refer to appendix 1.
2.7 Credit Health
In the past Novartis has maintained a conservative financing strategy using little
external financing and maintaining a solid creditworthiness and a strong ability to meet
its debt obligations. Proof for this is the credit rating by various rating agencies, such as
Standard & Poor’s or Fitch. Until 2008 Novartis was rated with AAA certifying
Novartis excellent creditworthiness making Novartis one of only a few non-financial
companies worldwide to achieve the highest rating (Novartis, 2008, p.171). Reason for
this is the company’s capability to generate strong earnings together with employing
low levels of external financing.

18 of 130
In 2008 and 2009 however, rating agencies downgraded Novartis lower their ratings by
three steps from AAA to AA-. The rating agencies justified their action with Novartis’s
purchase of 77% of Alcon share for 39 billion USD which according to Novartis would
be mostly financed by issuing debt. This decision also affected the interest coverage
ratio. From 2007 to 2009 the interest coverage decreased from 45 to 24.5 due to a
significant increase in interest expenses from 237 million USD in 2007 to 551 million
USD in 2009.
According to Moody’s Analyst Novartis will require additional external financing to
ensure adequate liquidity and moreover the Novartis blockbuster Diovan, which is the
company’s highest sales generating drug, will lose patent protection in Europe as of
May 2011 (Stocks, 2010)2.
2.8 Stock Market Performance
The first ten years of the new century have been an experience of mixed feeling and
mediocre performance for the Novartis share with a lot of ups and downs (see appendix
3). After the burst of the internet bubble at the beginning of the decade equity markets
were pressured on a global scale and the share of Novartis dropped in value by 16%
from 71.63CHF to 60.00 CHF. Other pharmaceutical companies were also affected
since the MSCI World Pharmaceutical Index decreased by 15%. In 2002 the situation
did not improve with equity markets still under pressure. Again, the stocks of Novartis
decreased by 16% from 60 CHF to 50.45 CHF. In 2003 however, situation improved
with equity markets recovering from a difficult period between 2000 and 2002. The
MSCI World Pharmaceutical Index increased by 14%. Novartis share also recovered
over the year, increasing broadly together with industry peers by 11% from 50.45 CHF
to 56.15 CHF. After a bit of a deadlock in 2004 where markets faced a challenging
environment and the Novartis share increased by 2%, global equity markets further
recovered in 2005 which saw the Novartis share increasing by 21% from 57.30 CHF to
69.05 CHF due to continued strong earnings, a good product portfolio and appropriate
strategic direction (Novartis, 2006, p.6). With this performance, the company
outperformed the majority of its global pharmaceutical peers (Novartis, 2006, p.134).
2http://www.stocks.ch/nachricht/KREDITRATING_Novartis_Moody_s_bestaetigt_Aa2__senkt_Ausblick_
auf_negative__37251

19 of 130
Source: own design
-15%
-14%
13%
4%
23%
4%
-9%
-12%
11%
-0,2 -0,15 -0,1 -0,05 0 0,05 0,1 0,15 0,2 0,25
2000
2001
2002
2003
2004
2005
2006
2007
2008
2009
Figure 8: Total Shareholder Return
In 2006 equity markets kept recovering despite a sharp mid-year recession. The
Novartis share has increased only by 2% to 70.25 CHF, despite outstanding
performance in 2006 with a 15% rise in group net sales and a 17% increase in net
income. In 2007, Novartis shares have declined by a whopping 12% to 62.10 CHF.
Most pharmaceutical companies experience negative share price performance due to
volatility of equity markets as well as lack of interest by investors in the pharmaceutical
industry. Despite record results of the company, the performance was not reflected in
the share price. The pharmaceutical industry seems to suffer from devaluation resulting
sharp declines of price/earnings ratios. Reasons for this are the increasing suspicion of
financial markets towards the industry as well as the fact that governments are trying to
cut health care costs by forcing the pharmaceutical industry to lower drug prices
(Novartis, 2008, p.10).
In 2008 the financial crisis that originated in the United States hit the global markets
which also caused the Novartis share to drop by 15% from 62.10 CHF to 52.70 CHF.
However, the stock perceived by investors as a defensive investment, offered protection
from global market turmoil which led to unseen losses in decades. Thus Novartis was
the top performing stock in the pharmaceutical industry in 2008 and even outperformed
the Morgan Stanley World Pharmaceutical Index which fell by 20% (Novartis, 2009,
p.11 and p.174).
2009 saw an improved performance of
the Novartis share which increased by
7% to 56.50 CHF reflecting the
consistent good performance of the
company and its ability to cope with
adverse economic situations as caused by
the financial crisis in 2008 and 2009.
Furthermore, since the company’s
founding 1996, Novartis has consistently delivered a good performance providing
investors with a 9% annual total shareholder return compared to 7.5% of large industry
peers (Novartis, 20010, p.179). As can be seen from figure 8 total shareholder return
underwent a mixed development from 2000 until 2009 however negative returns could
have even been higher if it were not for the constant high dividends paid by Novartis to
its shareholders.
20 of 130
3 Strategic Business Analysis
In this chapter the strategic business environment of Novartis is analyzed. First an
analysis of the external business environment of Novartis is conducted which is
followed by an internal analysis of Novartis. The strategic business analysis is then
concluded with a SWOT analysis.
3.1External Analysis
In order to analyze the external business environment of Novartis a PESTEL analysis is
done and the global pharmaceutical market’s size and growth is determined. Then
Porter’s five forces are analyzed followed by a key industry success factors analysis.
Finally, the competitors of Novartis are analyzed.
3.1.1 PESTEL Analysis
The PESTEL framework is a method to analyze the macro environment of a company.
It assists in understanding the external factors that influence the development of a
company. There a six such type of factors: political, economical, socio-cultural,
technological, environmental and legal. These factors are not mutually exclusive and
can affect a company from more than just one angle (Lynch, 2006, p.84-85).
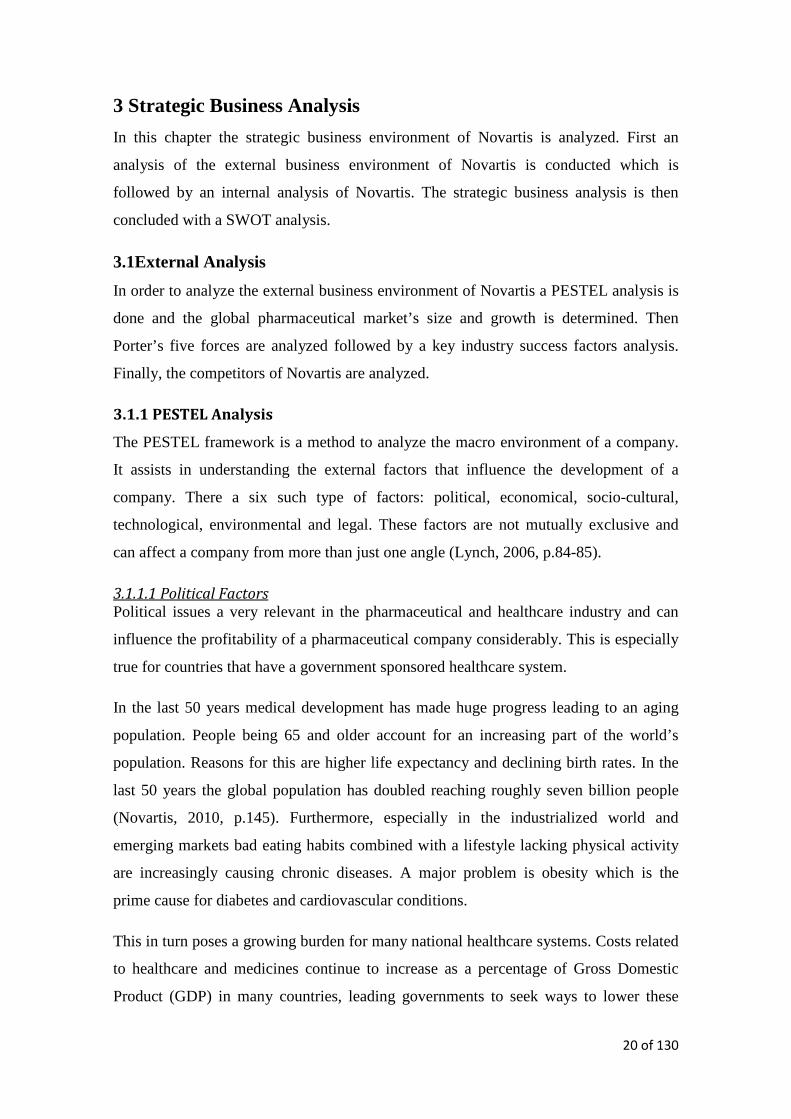
3.1.1.1 Political Factors Political issues a very relevant in the pharmaceutical and healthcare industry and can
influence the profitability of a pharmaceutical company considerably. This is especially
true for countries that have a government sponsored healthcare system.
In the last 50 years medical development has made huge progress leading to an aging
population. People being 65 and older account for an increasing part of the world’s
population. Reasons for this are higher life expectancy and declining birth rates. In the
last 50 years the global population has doubled reaching roughly seven billion people
(Novartis, 2010, p.145). Furthermore, especially in the industrialized world and
emerging markets bad eating habits combined with a lifestyle lacking physical activity
are increasingly causing chronic diseases. A major problem is obesity which is the
prime cause for diabetes and cardiovascular conditions.
This in turn poses a growing burden for many national healthcare systems. Costs related
to healthcare and medicines continue to increase as a percentage of Gross Domestic
Product (GDP) in many countries, leading governments to seek ways to lower these

21 of 130
costs (Novartis, 2010, p.144). Possible ways to cut these costs are increased usage of
generic medicines, restricted access to new medicines, price regulations, changes in
patent-protection periods and forcing patients to pay a bigger portion of healthcare costs
(Rheinische Post, 2010)3. In the United States, the biggest market for pharmaceuticals,
70 per cent of total prescription volume is accountable to generic medicines severely
limiting sales growth of new medicines (Novartis, 2010, p.145). Whatever decisions
will be made in the future, the pressure of insurances and regulators on pharmaceutical
companies is likely to rise.
Especially prices and patent periods for new innovative medicines generate rising
controversy and political discussion worldwide due to growing healthcare expenditure
while global economic growth is slow and the overall economic situation being fragile.
But also important to note is the fact, that costs per drug approved have risen
dramatically in recent years. According to the Tufts Center for the Study of Drug
Development, worldwide pharmaceutical companies have spent nearly $50 billion in
2010 on R&D activities. R&D spending for a new molecular entity approved has
increased by more than 200 per cent to $3,7 billion for the period of 2006-2008
compared to only $1,2 billion for the period between 1998 and 2000 (Novartis, 2010,
p.145). This is a result of increased and more rigorous safety requirements by health
authorities especially in the United States. In recent years regulators demanded more
clinical trial data with higher number of participants making regulatory approvals more
costly and more challenging as well as increasing the risk of recalls.
Despite the heated debate about healthcare costs, people and regulators (who still
demand effective and a high quality medicines) easily forget that developing new drugs
is a lengthy, risky and costly process that is far from certain which often does not result
in a desired outcome, namely a new approved drug (Schwartz and Moon, 2000, pp.87-
88). Regulatory Approval for new drugs might take up to ten years and can involve
costs of over one billion USD but productive R&D activities remain vital to the success
of Novartis (Novartis, 2007, p.132). Therefore long patent protection periods are
necessary to enable innovative pharmaceutical companies, such as Novartis, that do not
just produce generics, to get compensation for their investments in research and
development. Furthermore, if healthcare authorities will start to regulate prices for new
3http://www.rp-online.de/politik/deutschland/Roesler-fordert-Beitrag-der- Pharmaindustrie_aid_821926.html

22 of 130
Source: own design
32%
42%
18%
8%
Figure 9: Group Net Sales by Region
United States
Europe
Asia/Africa/Australasia
Canada Latin America
medicines, as suggested by politicians in Europe and the United States, in order to lower
prices and thus costs to the healthcare systems, Novartis and it peers will face further
problems to recover their initial product development costs.
As can be seen from the information provided above political factors can have a huge
impact on the operations of Novartis and its profitability. Should the development keep
heading in this direction that prices will have to be further lowered and that even current
patent-periods be shortened than developing new effective drugs will become extremely
difficult. As a result the number of new drugs that will become available to patients in
need might be severely reduced.
3.1.1.2 Economic Factors Economic factors also play an important role, that effect a pharmaceutical company
such as Novartis. Maintaining a healthcare system that provides effective treatment and
medicines costs a lot of money. Therefore it is not surprising that Novartis generates
about three quarters of its group net sales in countries of the developed world, such as
the US, EU and Japan, that generate considerable economic strength. This is depicted in
figure 9.
These countries also generate the highest GDP (see appendix 4). This economic wealth
is also reflected in Novartis’ sales by
region record. However, one should not
neglect the strong and stable economic
growth of emerging markets despite effects
of the global financial crisis. IMS Health
forecasts between 12 and 15% growth in
2010 and the coming years in these areas,
presenting Novartis with extremely
lucrative sales opportunities (Novartis, 2010, p.143).
As far as economic volatility is concerned, pharmaceutical companies are also affected
by economic downturn and recession but not as severely as other industries such as
consumer goods or luxury goods industries. Reason for this is the fact that patients
cannot give up medication they rely on when the overall economy is in recession.
Demand for drugs is more independent from the economic situation than other goods
since they cover a basic need.

23 of 130
Thus the pharmaceutical industry is considered a non-cyclic industry. Investors perceive
Novartis as a defensive investment with strong performance despite turmoil on stock
markets proven by the fact that Novartis outperformed other indices such as the Swiss
Market Index and MSCI Pharma Index during the crisis in 2008 (Novartis, 2009, p.174)
(see also appendix 5).This is also supported by the pharmaceutical industry’s average
beta of 0,7 4 showing that the industry is not very sensitive to economic volatility. If the
market changes by one per cent the pharmaceutical industry would only change by
0,7%.
Another important factor that affects Novartis in some way is the situation on global
capital markets. Even though financial markets have recovered to a somewhat stable
situation after the global financial crisis the ex-ante situation where corporations had
almost unlimited access to money will unlikely be restored. This however, does not
pose too much of a problem for Novartis since it follows a more conservative capital
structure.
Novartis is a worldwide operating company and thus faces exchange rate exposure
which might have significant effect on the company’s operating results as well as
reported value of assets. Transaction exposure is not too much of challenge because
most operating costs are incurred where necessary local currencies are generated
through sales (see appendix 6). Nevertheless Novartis still has to engage in hedging
activities to manage currency exposure.
3.1.1.3 Socio-Cultural Factors Socio-cultural factors are fundamental growth drivers for Novartis and they remain
strong for the foreseeable future increasing demand for healthcare products. Main
drivers are demographic and socio-economic developments such as increasing
population, higher life expectancy as well as changing lifestyle due to increased
prosperity. Novartis expects to keep expanding in the next years both in traditional
markets such as the United States, Europe, Japan and emerging markets. Emerging
markets are considered by IMS Health as Brazil, China, India, Mexico, Russia, South
Korea and Turkey (Novartis, 2010, p.143-145).
4 Demadoran beta by industries
http://pages.stern.nyu.edu/~adamodar/

24 of 130
The world population is expected to surpass nine billion in 2050 with increase portion
of the population being 65 years or older. A study by the US State Department in 2007
forecasted that in 2030 one billion people worldwide will be 65 years or older. Studies
show that disease occurrence and drug consumption rise with age (Novartis, 2010,
p.143). Furthermore economic growth, increased automation and changing lifestyle and
eating habits will continue to cause chronic diseases such as cardiovascular diseases,
diabetes, cancer and serious other diseases. A World Health Organization (WHO) study
in 2006 reported that obesity and overweight are not only a problem of wealthy
countries but are also increasing dramatically in low and middle income countries.
Obesity is a prime cause for diabetes and cardiovascular diseases. The WHO predicts
that diabetes will increase to 330 million people worldwide compared to only 30 million
in 1985 (Novartis, 2010, p.144).
Novartis is able to provide many different products in order to help patients with their
diseases and will continue to invest heavily in research and development. The predicted
developments mentioned above represent high future income potential for Novartis and
will remain a distinguishing characteristic of the healthcare industry in the future.
3.1.1.4 Technological Factors Technological progress is very important for pharmaceutical companies, especially for
those like Novartis that follow a strategy of differentiation and innovation.
Technological progress has been astonishing in the last 20 to 30 years and will keep
advancing in the future. This is a clear result of a tenfold increase in R&D investment
by the global pharmaceutical industry in the last 20 years according to the PhRMA, a
US industry trade association (Novartis, 2010, p.144).
Technological progress and advanced understanding of many diseases are a basis for the
ongoing development of better ways of treatment. Recent advances in the analysis of
human genome data will further improve information on the role of genes and proteins
within the human body. Based on this information it is expected that the number of drug
developments will continue rise even further (Novartis, 2009, p. 140). Of course, no
miracles can be expected over night but steady research will pay off in the future with
new breakthroughs in knowledge and treatment.

25 of 130
3.1.1.5 Environmental Factors Environmental factors are important external aspects that cannot be ignored by
companies, especially pharmaceutical companies. Increased environmental awareness
among patients, consumers and people in general, combined with global warming and
other environmental hazards have forced companies to make adjustments. Increasingly
consumers do not only request high quality and safe medicines from producers but also
environmental friendly production procedures and plans to reduce energy and resource
consumption. This has led pharmaceutical companies and companies from other
industries to create environmental friendly images as well as plans for sustainable
development. Failure to follow this trend could have serious consequences on the
company’s image leading people to belief that the company is polluting the
environment and ruthlessly exploiting the resources of the planet
As a result Novartis has early on included environmental issues in his code of ethical
business conduct in which it commits itself to the conservation of energy and other
resources. Furthermore, Novartis recognizes the rights of animals. Animal testing is an
indispensable part of experimental studies for new drugs without which the
development of new drugs would be nearly impossible. Despite the fact that Novartis
abides to the highest standards for its animals and reduces animal testing whenever
possible the company and its employees are frequently harassed by militant animal
rights activists in an almost terroristic manner (Novartis, 2010, p.66).
With regards to carbon dioxide emissions, Novartis was one of the early signatories of
the Kyoto protocol in 2005. Since then Novartis has constantly put effort into reducing
greenhouse emission, increasing energy efficiency and increasing usage of renewable
energy resources. Novartis is constantly increasing the Group’s solar power capacity on
a worldwide scale for example (Novartis, 2010, pp.83-84). Novartis’ environmental
efforts are frequently honored by appearing at the top of Fortune magazine’s list of most
admired companies among others.
3.1.1.6 Legal Factors Companies active in the pharmaceutical industry face already strict and rigid legal
regulation around the world, especially in the United States and Europe. There, the local
health authorities responsible for drugs approvals and related matters are the Food and
Drug Administration (FDA) and the European Medicines Agency (EMEA) respectively.
These agencies have immense political and legal power and are pressuring Novartis and

26 of 130
Source: own design
323,8
263,9
106,6
9547,9
Figure 10: Global Market Sales by Region
North America
Europe
Asia/Africa/Australia
Japan
Latin America
other industry peers to lower prices and provide enormous loads of information on
safety, efficiency and risk/benefit profile for evaluation and approval purposes. This
development is likely to continue and even increase with requirements and legislation
getting stricter and more involved. Proof for this is the Food and Drug Administration
Amendments Acts 2007 signed by former President George W. Bush5 .
As a result, the drug approval rate in general is expected to decline. For Novartis and
other industry peers this means that research and approval activities will get
increasingly expensive and will further elevate the risk of recalls, setback and possible
loss of market share (Novartis, 2010, p.145).
Along with increases in regulation, a trend of increasing litigation against the
pharmaceutical industry can be recognized. As a result Novartis is increasingly involved
in legal proceedings due to various causes that could lead to substantial liabilities which
might not be covered by insurance in total. Since legal proceedings are very
unpredictable, negative effects on results of operations are probable (Novartis, 2010,
p.146).
3.1.2 Market Definition and Size, Growth and Market Share
In this section the market in which Novartis operates is defined. Furthermore market
size, growth and share will be analyzed.
3.1.2.1 Market Definition and Market Size The pharmaceutical industry is a multi-billion
dollar industry made up of about 200 major
companies. The market is not controlled by a
single company that has overwhelming market
share. However, the most profitable companies
control market share of mid single digit market
share (Castner, Hayes, Shankle, 2007)6. The
global pharmaceutical market in which
Novartis operates is defined as patent-protected pharmaceuticals, generic
pharmaceuticals, vaccines and diagnostic tools and over-the-counter medicines. In 2009
the global pharmaceutical market’ size amounted to about $837 billion in sales 5 US Food and Drug Administration:
http://www.fda.gov/ForConsumers/ConsumerUpdates/ucm061229.htm 6 http://www.duke.edu/web/soc142/team2/firms.html

27 of 130
Source: own design
Table 1: Sales by Region
Region Sales 2009 Growth 2009 Forecast 2010 CAGR 2009-2014
North America 323,8 5,5% 3-5% 3-6%
Europe 263,9 4,8% 3-5% 3-6%
Asia/Africa/Australia 106,6 15,9% 13-15% 12-15%
Japan 95 7,6% 0-2% 2-5%
Latin America 47,9 10,6% 10-12% 12-15%
Total 837,2 7,0% 4-6% 5-8%
Source: Data from IMS Health
0
100
200
300
400
500
600
700
800
900
515562
605650
694742
782837
Figure 11: Total market sales (USD billion)
revenues. Of this, about 70% are accountable to North America, which is the largest
market for pharmaceuticals and Europe as seen in figure 10.
3.1.2.2 Market Growth In the year 2009 total global
pharmaceutical sales amounted to $837
billion as mentioned before. In 2002 total
market sales in this industry amounted to
$515billion yielding an increase of about
63% over eight years. The compound
annual growth rate (CAGR) from 2004 to
2009 was 6,7%. As can be seen from figure 11 total global sales in the pharmaceutical
industry were able to grow annually from 2002 to 2009. As depicted in table 1 North
America and Europe are still the largest markets, however the growth rates of these
markets have slowed down to about 5% in recent years. Meanwhile, markets such as
Asia and Latin America are increasing with double digit growth and are considered the
markets of the future. They
consists of emerging
markets such as China,
India, Russia, Brazil will
become of strategic
importance in the near future due to growing economic wealth. As for the future, North
American and European markets are expected to grow at moderate rate of 3-5% while
Asia and Latin America are expected to keep growing fast with growth rates in excess
of 10%. At times of decreasing pharmaceutical sales growth in many developed
countries, the long-term economic expansion in many emerging markets has led to
higher growth rates contributing to the industry’s global performance (Novartis, 2010,
p.143). The CAGR for total industry sales for the period 2009-2014 is forecasted to be
between five and eight per cent. All market related data mentioned above is based on
IMS Health data7.
7IMS Health Incorporated (2010)
http://www.imshealth.com/portal/site/imshealth/menuitem.a46c6d4df3db4b3d88f611019418c22a/?v
gnextoid=e599410b6c718210VgnVCM100000ed152ca2RCRD&cpsextcurrchannel=1

28 of 130
Source: own design
Figure 13: Porter’s Five Forces
7,3% 7,0% 6,5% 6,2% 6,0%
5,9% 6,5% 6,0% 4,5% 5,5%4,3% 4,9% 5,6% 5,4% 5,7%5,0% 5,3% 5,3% 5,4% 5,4%5,1% 5,4% 5,5% 4,9% 5,0%
72,4% 71,0% 71,1% 73,5% 72,5%
0%
10%
20%
30%
40%
50%
60%
70%
80%
90%
100%
2005 2006 2007 2008 2009
Figure 12: Market Share
Others
Sanofi-Aventis
Novartis
Roche
GlaxoSmithKline
Pfizer
3.1.2.3 Market Share With regard to market share it can be
concluded that no single company controls
an overwhelming portion of the market.
Together the five biggest companies in the
industry Pfizer, Roche, Novartis,
GlaxoSmithKline and Sanofi-Aventis make
up about 28% of the total global
pharmaceutical market. The difference in
market share between these companies is very small and lies within 1%. Pfizer has the
largest market share with 6% as figure 12 is showing. The remaining a 72% of market
share are attributable to various other pharmaceutical companies around the world. The
figure also shows that the situation has not changed significantly over the last five years.
However, some small developments are noteworthy. Novartis, for example, was able to
increase its market share while Pfizer apparently lost more than 1% of market share
over the last 5 years.
3.1.3 Porter’s Five Forces Model
In the figure 13 Porter’s Five Forces Model is depicted. The model assissts in
understanding the competitive
environment of a company which
can have various implications. The
goal of the Five Forces Analysis is
to investigate how a company can
develop opportunities in its
environment while protecting
itself against market competition
as well as other threats. Thus this
analysis is concerned with the
forces that determine industry
competition (Lynch, 2006, pp.93-
94). The model employs five parameters that influence competition in a given industry.
These parameters are: bargaining power of suppliers, threats of potential new entrants,
bargaining power of buyers, threats of substitute products as well as rivalry among

29 of 130
existing firms. In the following these five key parameters are explained with regard to
the pharmaceutical industry.
3.1.3.1 Bargaining Power of Suppliers Novartis is a very large corporation with operations worldwide which also enables the
company to source necessary suppliers from different areas. Furthermore, the necessary
ingredients for drugs are largely of commodity nature where the real competence lies in
the exact chemical composition. Due to these reasons Novartis is estimated to have a
very good negotiating power. However, it should be noted that whenever a strategic
cooperation is entered with a supplier, dependence on this supplier increases and thus
the bargaining power of the supplier.
3.1.3.2 Threat of New Entrants The threat of potential new entrants in the pharmaceutical industry is estimated to be
small. Reasons for this assessment are the high initial costs, especially for research and
development and the years of experience and trust that existing industry participants
have. In the pharmaceutical industry it is important for companies to be perceived as
reliable and trustworthy by patients. Building such an image requires a long time and a
lot of financial effort.
3.1.3.3 Bargaining Power of Buyers Buyers in the pharmaceutical industry are considered to be governmental and public
healthcare institutions of various types and patients as end consumers. Bargaining
power of patients is assessed to be low to medium because if a patient relies on a certain
medicine that is even protected by a patent, bargaining power is relatively low. The only
power the patient has is to make is opinion public in case he is dissatisfied with the
product or the company and thus try to get some leverage over the image of the
company. Governmental and public healthcare institutions have more negotiating power
because of the size of their organization. Especially governmental healthcare institutions
put more pressure on pharmaceutical companies to lower prices and increase product
safety and availability.
3.1.3.4 Threat of Substitute Products The threat posed to Novartis and other industry peers based on substitution by other
products is considered to be low. First of all if substitution means product copies, patent
laws protect new pharmaceutical products for extensive periods of time. Furthermore,
enforcement of patent laws throughout the world has become more effective due to

30 of 130
agreed treaties between many countries to protect intellectual property. Secondly, if
substitution means to substitute one medicine for another from a rival company,
problems can occur with patient’s tolerance. Some patients cannot tolerate other equal
medicines due to various problems such as side effects, making a switch of products
difficult or impossible.
3.1.3.5 Industry Competition The pharmaceutical industry has various fields of special expertise, such as
pharmaceuticals, generics, vaccines or over-the-counter medicines that make it
impossible to make an overall assessment of competition. In the vaccines and patent-
protected pharmaceuticals part of the industry competition is low to medium because
products are very diversified. On the other hand competition in the generic
pharmaceutical industry is very high and intense (Novartis, 2010, p.145). In this
segment of the industry competition is mostly based on prices because these products
are considered commodities. Furthermore, efforts to shift more healthcare costs to
patients further intensify competition based on price. In the over-the-counter medicines
niche, competition is also high but focuses more on consumer brand acceptance and
loyalty than on price.
In conclusion, it can be summarized that industry forces from suppliers, new entrants,
buyers and substitution are low to medium. However, internal industry competition is
high in many parts of the industry and is expected to increase further in the future.
3.1.4 Key Industry Success Factors
Key factors for success in an industry are resources, skills that are essential to achieve
success where success if often measured in profitability. Key factors of success are
common to all companies in an industry and do not differ from one company to another
(Lynch, 2006, p.92). Determining key success factors for the pharmaceutical industry
helps to assess whether or not Novartis has competitive advantage in these areas and
whether it is able to generate and sustain future profitability. For the pharmaceutical
industry key success factors are determined to be Research and Development,
competent employees, organizational efficiency and product quality, financial strength
as well as marketing and sales.

31 of 130
3.1.4.1 Research and Development Successful research and development activities are necessary to bring new approved
medicines to the market and to keep the pipeline filled with potential new medicines.
Only if a company is successful in its research and development of new drugs it will be
able to receive new patents which enable the company to receive high rates of return.
These in turn are necessary to finance research and development activities continuously.
3.1.4.2 Competent Employees For a pharmaceutical company it is especially important to attract and hire highly
qualified employees because the pharmaceutical business has high technological and
scientific requirements. Furthermore, talented people are necessary to market and sell
new medicines and convince patients and physicians of the benefits of the new drugs.
3.1.4.3 Organizational Efficiency and Product Quality Organizational efficiency is becoming increasingly important because external pressure
from governments and other health institutions to reduce healthcare costs and prices for
medicines has been increasing significantly in recent years. To cope with these
requirements pharmaceutical companies have to streamline their processes and reduce
costs. This however cannot be achieved at the expense of product quality or safety.
Inadequate quality and safety could have disastrous effects on the image of the company
and thus customer loyalty.
3.1.4.4 Financial Strength Financial strength is also considered to be a key success factor. Financial strength is
required to finance the increasing costs for research and development. Furthermore,
strategic acquisitions to acquire needed technologies or to set up new strategic business
units require large amounts of capital and financial strength. The same is true for market
expansion into emerging markets that will be of strategic importance in the near future.
3.1.4.5 Marketing and Sales Marketing and sales is also an important area necessary for success. Patients and
physicians have to be convinced of the benefits of new medicines and distribution
networks have to be set up in order to market products in emerging markets.
3.1.5 Competitor Analysis
In this section two competitors that are similar to Novartis are analyzed. In an ever
complex economic situation analyzing and understanding immediate competitors is very
important. In the global pharmaceutical industry there are many competitors but it is not

32 of 130
possible to analyze all of them. Therefore a choice has to be made and usually the one
or two organizations that pose the most direct threat are selected. With regard to this,
Pfizer and GlaxoSmithKline have been selected since they closely resemble Novartis in
terms of size, turnover and product portfolio.
The competitors analysis is conducted according to Lynch (2006, p.103-104) where the
competitor’s organizations are scrutinized regarding aspects such as objectives and
strategies, resources, past record of performance and current products.
3.1.5.1 Objectives The objectives and strategies of Pfizer and GlaxoSmithKline (GSK) are similar to those
of Novartis seeking sales and market share growth, especially in emerging markets,
increase investments in R&D and set up a diversified portfolio of healthcare products
while improving organization efficiency. They also pursue the strategy of innovation to
develop new and effective drugs for various diseases.
GSK has three strategic priorities, which are growth, delivery and simplification
(GlaxoSmithKline, 2010, p.4)8. The company wants to grow a diversified global
business with a balanced product portfolio such as Novartis focusing on patent-
protected pharmaceuticals, vaccines and consumer healthcare products. Furthermore
GSK plans on investing heavily in key growth areas in order to aggressively expand
into emerging markets. GSK wants to deliver more products of value by sustaining a
competitive pipeline in the industry that creates value for patients and shareholders by
investing in R&D. Because GSK is a large and complex organization, the company is
seeking to transform its operations to reduce complexities, increase efficiency and
reduce costs.
As far as Pfizer is concerned objectives and strategies are similar. The company’s
objective is to increased sales and gain further market share. Pfizer is trying to
accomplish this goal by accelerating sales growth in emerging markets and invest in
R&D activities in order to enhance the pipeline by focusing on areas with unmet
medical needs such as oncology, pain, Alzheimer’ disease, diabetes and vaccines among
others. Pfizer wants to keep investing in complementary businesses and become a more
diversified healthcare company providing products in areas such as human, animal and
consumer health, vaccines, biologics and nutritions. Pfizer also wants to improve its
8http://www.gsk.com/mission-strategy/index.htm

33 of 130
Source: own design
Table 2: R&D Expenditure
year 2005 2006 2007 2008 2009
Pfizer 7,3 7,6 8,1 7,9 7,9
GSK 5,5 6,8 6,5 5,4 6,6
Novartis 4,9 5,4 6,4 7,2 7,5
Source: own design
0,0%
2,0%
4,0%
6,0%
8,0%
10,0%
12,0%
14,0%
16,0%
18,0%
20,0%
2005 2006 2007 2008 2009
Figure 14: R&D % of Sales
Pfizer
GSK
Novartis
organizational efficiency by creating a lower and more flexible cost base for the entire
company (Pfizer, 2010, p.4)9.
From this information it can be concluded that both companies have similar objectives
and strategies as Novartis, increasing the level of competition.
3.1.5.2 Resources The size of a company’s resources is an important indicator of its ability to pose a
competitive threat. In the case of Pfizer
and GSK, parameters of resources are the
following: number of employees, total
assets, R&D expenses and amount of
equity.
With regard to employees Pfizer is clearly leading with 116,500 employees globally
while GSK and Novartis have about the same employee force with 100,000 and 99,834
respectively. The ability to finance research and development activities is also an
important resource especially if development of new pharmaceuticals is part of the
company’s strategy. As table 2 shows
Pfizer has invested the most over the
years in its research and development
operations. R&D expenditures of GSK
have dropped off a little whereas
Novartis’ expenditures have increased
steadily over the years. Novartis is the
only company that was able or found it
necessary to increase R&D activities over the years. However, it can be concluded that
in general the differences are not too big and that all three companies are more or less
on the same level in terms of intensity of R&D activities. Looking at R&D in relation to
net sales in figure 14, this view is supported. Investing in R&D between 15 and 18
percent of net sales is considered to be a high rate in the industry showing that both
Pfizer and GSK represent a formidable competitive threat to Novartis with their R&D
programs. Novartis however, has significantly increased its R&D efforts over the last
five years to improve its pipeline, approval rates and thus industry competitiveness.
9http://www.pfizer.com/investors/financial_reports/financial_reports.jsp

34 of 130
Source: own design
0
50
100
150
200
250
2005 2006 2007 2008 2009
Figure 15: Total assets (Bio. USD)
Pfizer
GSK
Novartis
In terms of total assets available to the organization Pfizer clearly has more resources at
its disposition as the world largest
pharmaceutical company. Novartis ranks
second and steadily increased its assets basis
while GSK owns the least amount of assets.
Figure 15 clearly shows that Pfizer is still
significantly larger than Novartis and more
than double its assets base in 2009 due to the
Wyeth takeover.
Another indicator for resources and size is the amount of total shareholder equity. Here
the differences are more significant than for the other parameters. Pfizer has equity of
about 90 billion USD, Novartis 57 billion USD while GSK’s equity only amounts to 17
billion USD. Equity is a good indicator of how able a company is to finance its R&D
activities for example internally. Pfizer and Novartis have a clear competitive advantage
in this area compared to GSK.
3.1.5.3 Past Performance Past performance of competitors is a poor indicator for future performance but none the
less may help to understand the broad picture. Looking at revenues from 2005 until
2009 it can be noted that Pfizer is leading in sales amount. In 2009 Pfizer generated $50
bio. in sales while GSK generated $45,7 bio. . Novartis in 2005 was not able to generate
as much sales as Pfizer and GSK but managed to catch up via organic sales growth as
well as growth by acquisition (see appendix 7).
In terms of operating margin the picture looks a little different (see appendix 8). GSK
had in the last five years a significantly higher operating margin than Pfizer and
Novartis even though it decreased a little from 33,6% in 2007 to 29,1% in 2008. The
reduction in operating margin was caused by lower pharmaceutical sales due to stronger
generics competition GSK patented products (GlaxoSmithKline, 2010, p.3). In 2009,
GSK operating margin improved slightly to 29.8% due to a return to sales growth,
caused mainly by increased influenza sales related to the H1N1 pandemic, and
improved organization efficiency that delivered more than a billion USD in savings
(GlaxoSmithKline, 2010, p.3).
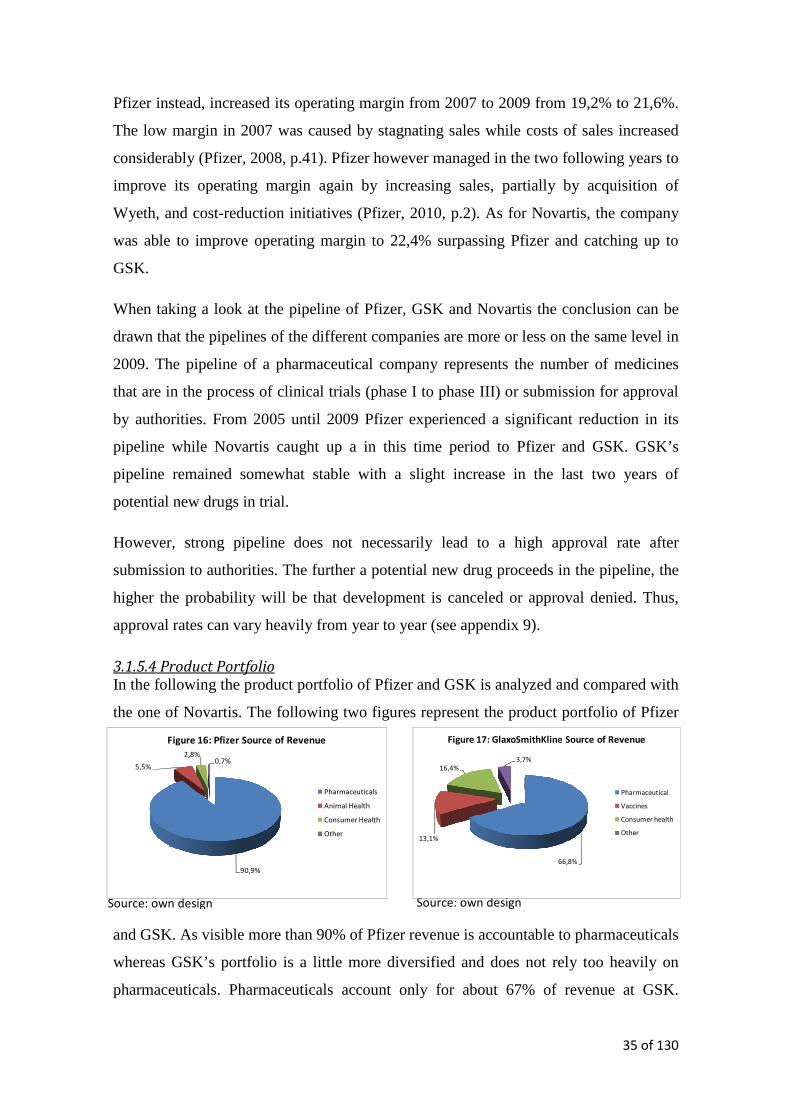
35 of 130
Source: own design Source: own design
90,9%
5,5%
2,8%0,7%
Figure 16: Pfizer Source of Revenue
Pharmaceuticals
Animal Health
Consumer Health
Other
66,8%
13,1%
16,4%3,7%
Figure 17: GlaxoSmithKline Source of Revenue
Pharmaceutical
Vaccines
Consumer health
Other
Pfizer instead, increased its operating margin from 2007 to 2009 from 19,2% to 21,6%.
The low margin in 2007 was caused by stagnating sales while costs of sales increased
considerably (Pfizer, 2008, p.41). Pfizer however managed in the two following years to
improve its operating margin again by increasing sales, partially by acquisition of
Wyeth, and cost-reduction initiatives (Pfizer, 2010, p.2). As for Novartis, the company
was able to improve operating margin to 22,4% surpassing Pfizer and catching up to
GSK.
When taking a look at the pipeline of Pfizer, GSK and Novartis the conclusion can be
drawn that the pipelines of the different companies are more or less on the same level in
2009. The pipeline of a pharmaceutical company represents the number of medicines
that are in the process of clinical trials (phase I to phase III) or submission for approval
by authorities. From 2005 until 2009 Pfizer experienced a significant reduction in its
pipeline while Novartis caught up a in this time period to Pfizer and GSK. GSK’s
pipeline remained somewhat stable with a slight increase in the last two years of
potential new drugs in trial.
However, strong pipeline does not necessarily lead to a high approval rate after
submission to authorities. The further a potential new drug proceeds in the pipeline, the
higher the probability will be that development is canceled or approval denied. Thus,
approval rates can vary heavily from year to year (see appendix 9).
3.1.5.4 Product Portfolio In the following the product portfolio of Pfizer and GSK is analyzed and compared with
the one of Novartis. The following two figures represent the product portfolio of Pfizer
and GSK. As visible more than 90% of Pfizer revenue is accountable to pharmaceuticals
whereas GSK’s portfolio is a little more diversified and does not rely too heavily on
pharmaceuticals. Pharmaceuticals account only for about 67% of revenue at GSK.

36 of 130
Because Pfizer relies heavily on sales of pharmaceuticals the company is under a lot of
pressure to get approval and market new drugs. If it is not able to do so Pfizer will be in
danger of losing sales when major medicines lose their patent-protection.
This will for example be the case next year when the world’s most sold drug, Lipitor,
will lose protection by patent during June of 2011 (Decker 2009)10. Lipidor was
accountable for about 23% of Pfizer’s sales in 2009. That’s about $11.5 billion worth in
sales. Because Lipitor will lose protection it is estimated that in 2012 no product of
Pfizer will account for more than 10% of sales. The heavy reliance of Pfizer on Lipitor
was also a strategic reason to acquire Wyeth because this company has a wide range of
healthcare products (Pfizer, Annual Review 2009, 2010, p.34). The acquisition of
Wyeth will reduce reliance on a single product, increase diversity and lower sales
volatility. Effexor is also major product of Pfizer that faces patent expiration in 2010.
Revenue growth by segment was also somewhat mediocre and was negatively
influenced by unfavorable impact of foreign exchange rates (Pfizer, 2010, p.16) caused
by US Dollar appreciation. The pharmaceuticals segment increased by 2,8% primarily
due to Wyeth products and solid performance of Pfizer products such as Lyrica, Sutent
and Revatio. Animal health sales shrunk by 2,2% due to flat performance and negative
foreign exchange rate effects. Consumer health sales increased by 86%, mainly due to
the acquisition of Wyeth product operations (Pfizer, 2010, pp.18-20).
With regard to GSK, this company’s product portfolio is a little more diversified as
mentioned above and relies less on pharmaceuticals. GSK has three main segments. The
largest segment in terms of sales is pharmaceuticals with 67%, followed by consumer
health and vaccines with 16% and 13%, respectively.
The pharmaceuticals segment sales grew from 2008 to 2009 by 12,2% due to strong
growth of key products such as Seretide/Advair, Avodart, Lovaza and Relenza despite
strong generics competition in the US. Pharmaceutical sales in the US declined by 13%
(GlaxoSmithKline, 2010, p.28). The pharmaceutical division also has to face the patent
expiration of a number of its top-selling medicines in the near future. Among these
medicines are Seretide/Advair which will lose patent protection in the USA in 2010 and
in Europe in 2013 as well as Relenza which patent will expire in 2013 in the USA and
10
http://www.bloomberg.com/apps/news?pid=20601087&sid=aNSygEPe7QWw&refer=home

37 of 130
2014 in Europe (GlaxoSmithKline, 2010, p.12). The vaccines division experienced very
strong growth, increasing by 46%. Sales growth was primarily caused by vaccine sales
to governments as a result of the global H1N1 pandemic as well as strong contribution
by Boostrix, Rotarix, Cervarix (GlaxoSmithKline, 2010, p.28). The Consumer Health
division also generated strong sales growing by 17% in 2009 with growth in all regions
and categories (GlaxoSmithKline, 2010, p.30).
Ultimately, comparing Pfizer’s and GSK’s portfolio to the one of Novartis one can
make the conclusion that Novartis’ and GSK’s portfolio resemble quite a bit in terms of
product portfolio and size of sales. Pfizer’s portfolio instead is less diversified but larger
in terms of overall sales. However, there is one important aspect that separates the
portfolio of Novartis from Pfizer and GSK. Novartis is also conducting operations in the
segment of generic pharmaceuticals. This is becoming of increasing importance and
could be a competitive advantage in the future due to price pressures from governments
around the world and increasing difficulty to get approval from authorities for new
medicines.
3.2 Internal Analysis
In this section the corporate strategy and culture of Novartis are analyzed according
with the company’s value chain to determine competitive advantage. Finally the product
portfolio of Novartis is analyzed.
3.2.1 Corporate Strategy
The corporate strategy of Novartis is one of being a first-mover and innovator.
Innovation is the core-competence of Novartis putting huge emphasis on research and
development and continuing to do so in the future. Through increased research and
development efforts Novartis wants to rejuvenate its product portfolio. In 2009 new
products accounted for 16% of total sales of the pharmaceuticals division, the most
important business unit of the company (Novartis, 2010, p.9). Research and
development activities focus mainly on cardiovascular and metabolic diseases,
oncology and neurology as well as respiratory and infectious diseases.
But research and development is not the only strategic direction Novartis is heading for.
Despite huge investments in R&D in order to market innovative products and provide
patients with clear therapeutic benefits, Novartis has in the past implemented a strategy
of diversification within the healthcare sector but focusing solely on growth areas in the

38 of 130
healthcare market. The company divested among others its agriculture, nutrition,
chemicals and beverage operations. Within healthcare, Novartis diversified by creating
a vaccines and diagnostics division, a generics division with Sandoz and the consumer
health division with over the counter drugs in addition to its pharmaceutical operations.
In fact, Novartis was so successful and acting ahead of time that more and more
competitors are beginning to imitate this strategy of Novartis (Novartis, 2010, p.10).
Novartis regularly assesses its strategic set up to ensure that its strategy will also be
appropriate for the future. This does not only include strategic decision-making but also
improvements on the operational front. The goal is to improve effectiveness and
efficiency of organizational processes in order to avoid unnecessary costs, increase
flexibility and speed. This will make the company more responsive to a continuing
difficult market environment and enable it to invest more in research and development.
Furthermore, Novartis’ corporate strategy recognizes the importance of the emerging
markets such as China, Russia, India, South Korea and Turkey. In 2013 China will be
the third largest market for the pharmaceutical market after the United States and Japan.
China is the market of the future. Novartis recognizes the strategic importance of China
and adjacent eastern markets by having increased investments in these areas
significantly. The company will keep doing so in the future to be prepared for the
inevitable shift.
3.2.2 Corporate Culture
At Novartis the management beliefs that high performance can only be achieved and
sustained if it is built on a strong set of ethical values. As a result, the corporate culture
of Novartis is built around two very important points, which are a permanent focus on
performance as well as a sense of responsibility for patients and society (Novartis, 2010,
p.14). Therefore, according to Jörg Reinhardt, Group Chief Operating Officer, “It is
crucial for all of us to understand that being part of a performance-driven culture does
not mean just making the numbers, but more importantly doing so the right way”.
At Novartis a lot of effort is put into maintaining a corporate culture that enables
employees to raise concerns as well as innovative ideas in order to increase the
performance of the company. All employees of Novartis are expected to follow a
specified code of ethical business conduct and are encouraged to report situations
involving potential or actual behavior that is not in accordance with the code of conduct.

39 of 130
At Novartis, management also beliefs, that the impact of company operations on the
environment should be as small as possible. Novartis made voluntary commitment to
the Kyoto protocol, installing solar energy panels at five sites around the world to
reduce carbon dioxide emissions. Novartis also abides to the highest animal welfare
standards for its animals it uses in studies. This is also true for studies sponsored by
Novartis but performed by external partners. Novartis also works hard to make the
workplace of its employees as safe as possible and at the same time achieve high
employee satisfaction levels. The company has a strong safety mindset and extensively
promotes its zero-accidents goal and provides employee training for on-site safe
behavior. Furthermore, the Novartis corporate culture has a strong commitment to
patients. The company grants access to high-tech medicines for poor patients in the
developing world through its numerous “Access-to Medicine” programs. In 2009 drugs
worth $1,5 billion were distributed to about 80 million patients in need worldwide
(Novartis, 2010, p.5).
As a result of strong emphasis in Novartis’ culture on ethical conduct, sustainability and
its responsibility to society, Novartis was ranked second in “Fortune” magazine’s list of
“Worlds Most Admired Companies” in the pharmaceutical industry and is one of the
leaders in pharmaceutical sector of the Dow Jones Sustainability Index. In 2008 it
received a 100 per cent perfect score in codes of conduct, compliance, corruption and
bribery (Novartis, 2009, p.92).
In conclusion the mission statement gives a good summary of the company’s culture
and core beliefs:
“We want to discover, develop and successfully market innovative products to prevent
and cure diseases, to ease suffering and enhance the quality of life.
“We also want to provide a shareholder return that reflects the outstanding performance
and to adequately reward those who invest ideas and work in our company.” (Novartis,
2010, p.3)
In the following section the value chain of Novartis is analyzed in order to reveal if
Novartis has competitive advantage in any of the key success factor areas identified
above.

40 of 130
3.2.3 Value Chain Analysis
The value chain concept designed by Michael E. Porter is supposed to display and
categorize the activities performed by a company in a value chain. At each stage of the
value chain, the company has the opportunity to perform a process or activity better
than its competitors and thus can create a competitive advantage (Hollensen, 2004,
pp.17-18). If the company is able to sustain and defend this competitive advantage and
if the market values this advantage, then the firm is likely to earn high rates of return.
The value chain represents total value consisting of value activities and margin. Value
activities are distinct activities and processes that a company performs in order to make
a product valuable to buyers. Margin is the difference between total value (price) and
the total costs of performing the value activities. A picture of Porter’s Value Chain is
provided in appendix 10.
3.2.3.1 Primary Activities On the primary level activities consists of production, marketing and sales/service
activities. Novartis is estimated to have a definitive competitive advantage over other
industry peers in marketing and sales activities. The sales and marketing force of
Novartis is very competent and dedicated and Novartis has considerable increased
efforts in pushing into emerging markets to acquire and sustain market share. In China
alone, Novartis will invest over one billion USD over the next five years to improve its
market presence.
The Novartis sales force has grown rapidly in recent years due to geographic expansion
creating five regional sales units (Novartis, 2010, p.20). The Customer Centric Initiative
was launched in 2009 in order to better address diverging customer requirements and
needs (Novartis, 2010, p.148). The sales force of Novartis can be considered to be a
competitive advantage for the company as proven by high annual revenues.
As far as marketing activities are concerned, Novartis has a global distribution network
which reaches over 130 countries worldwide and poses a significant competitive
advantage. Especially complicated is the distribution for vaccines and other sensitive
substances that require a flawless cold chain from storage to transportation that assures
constant cooling of these substances.
Production activities are also important and Novartis has reacted to increasing outside
pressure to improve efficiency of its operations. Under the “Forward” initiative, which

41 of 130
was launched in 2007, cumulative savings in excess of $2,3billion were reached.
Furthermore, organizational efficiency was improved by increasing productivity, higher
efficiency of operations, increased flexibility and speed (Novartis, 2010, p.143). Thus
the simplification of the company structure and redesigning of company operations
resulted in increased value and competitive advantage over industry peers.
3.2.3.2 Supporting Activities Each of the primary activities is linked to supporting activities. With regard to
supporting activities Novartis is assessed to have significant competitive advantage
resulting from these activities. First of all competitive advantage within human
resources management can be identified. Novartis has highly-trained, competent and
dedicated employees and is putting significant effort into training and continued
education of its employees. Because Novartis is ranked as one of the most admired
companies in the world according to Fortune magazine it is able to attract and hire
highly qualified employees on global scale. Moreover its performance driven culture
assures that all activities are performed according to high quality standards.
Highly competent personnel are highly interrelated with innovation and R&D activities
which are also viewed as a source of sustained competitive advantage of Novartis. The
core competence of Novartis is its R&D potential and its innovation capabilities that
enable the company to develop new and effective drugs which can treat various
diseases. In the past Novartis has proven time and time again that it can develop new
drugs and it is likely to keep doing so in the future. Table 3 shows Novartis’ record of
drug development for the past nine years.
As visible Novartis has a continuously high rate of approvals for new drugs on global
markets even though regulatory approval for an innovative new drug may take up to ten
years and can generated costs of over 1 billion U.S. Dollars. For the period between
2000 and 2008 Novartis received the most approvals by the Food and Drug
Administration (FDA) in the United States than any other major pharmaceutical
company (Novartis, 2010, p.32). But not only approval rates show the company’s core
competence but also its pipeline of promising compounds and drugs that are in Phase II
Table 3: Novartis Pipeline
year 2001 2002 2003 2004 2005 2006 2007 2008 2009
Pipeline 50 52 64 52 50 104 140 152 145
Approvals 15 11 7 7 5 8 15 3 30
Source: own design

42 of 130
trials and beyond. Novartis’ pipeline is rated by financial analysts as one of the
strongest in the industry and clearly represents a competitive advantage (Novartis, 2004,
p.11). R&D is vital for a pharmaceutical company such as Novartis. It assures that the
pipeline is able to continue putting out drugs that receive approval from authorities.
Only if this is the case, innovative pharmaceuticals can be marketed which enjoy patent
protection and thus earn high rates of return which will compensate for tedious and
expensive R&D activities. Novartis has also one of the highest R&D investment rates in
the industry compared to net sales.
When looking at the company infrastructure, Novartis’ solid financial basis is
noteworthy. Novartis has very little debt and is able to continue to make acquisitions as
management and the strategic situation demand. However, most pharmaceutical
companies have little debt so this is not really a competitive advantage but generating
high sales and high net income is an advantage that can be attributed to Novartis.
As far as procurement activities are concerned it is not seen that Novartis has a
significant advantage over other competitors. These activities are determined to be on
an equal level.
One important fact should be noted. The value chain is not a sample of independent
activities but rather a concept of interdependent activities that are interlinked with each
other. Novartis has especially worked on this during the Forward initiate by interlinking
various activities thus making the organization more flexible.
In conclusion, the value chain analysis of Novartis allows the judgment that Novartis
has considerable competitive advantage in both primary and supporting activities that
enable the company to earn high rates of return. R&D, organizational efficiency,
marketing and sales and financial strength are key success factors of the industry and
having competitive advantage in these areas will enable Novartis to be successful in the
future.
3.2.4 Product Portfolio and Customers
Novartis has four different divisions that focus on a different sector of healthcare
products. These four divisions are Pharmaceuticals, Sandoz, Vaccines and Diagnostics
and Consumer Health (Novartis, 2010, p.18).

43 of 130
Figure 18: Novartis Portfolio Matrix
40% Star Vaccines and Diagnostics
30%
Pharmaceuticals
15%
Sandoz Consumer Health
0% Cash cow Dog
10% Market share 0%
Source: own design
5%
Sa
les
gro
wth
5%
Question mark
7,5
28,5
2,4
5,8
The Pharmaceuticals division develops new and innovative pharmaceuticals which save
lives and try to influence the development of a patient’s condition in a positive manner.
The pharmaceuticals developed by this division are protected by patent. The drugs
developed by the Pharmaceuticals division focus on therapeutic areas which include
cardiovascular, oncology, neuroscience and ophthalmic, respiratory and auto-
inflammatory diseases (Novartis, 2008, p. 7).
The second division of Novartis is Sandoz. Sandoz is a global leader of generic
pharmaceuticals that have lost patent protection. Sandoz provides affordable, high-
quality products improving access to global patients and healthcare systems.
Another Novartis division is Vaccines and Diagnostics. This division develops and
markets vaccines a global scale in order to prevent the spread of life-threatening
diseases, may they be of bacterial of viral form. In 2009 Novartis was a market leader
with products fighting influenza A (H1N1) virus, seasonal flue, meningitis as well as
other diseases. Furthermore, this division develops diagnostics tools to ensure the
quality of national blood supplies as well as patients safety.
The fourth and last division of Novartis is the Consumer Health division. Consumer
Health develops and markets innovative over-the-counter products that provide patients
treatment by self-medication for common illnesses and conditions. Moreover, this
division provides healthcare products for pets and livestock as well as contact lenses
and lens care products. Despite the four divisions mentioned above, Novartis plans to
set up a fifth division after the merger with Alcon is completed in the second half of
2010. This would make Novartis an instant world leader in eye care satisfying the needs
of an aging population for high quality ophthalmology products.
From a strategic point of view it is
important to do a portfolio analysis based
on the Boston Consulting Group (BCG)
matrix. The matrix consists of four areas
specified by market share and sales
growth which are dog, question mark,
star and cash cow (Drummond and
Ensor, 2001, pp.96-97). The size of the
bubbles indicates the amount of revenue generated while the arrows indicate the general

44 of 130
direction of development. Placing the strategic business units (SBU) of Novartis in this
matrix will provide a strategic overview.
As can be seen from the BCG matrix in figure 18 all of the SBUs of Novartis show
vitalizing growth. The biggest SBU, the pharmaceuticals division, generated double
digit growth in 2009 of 12% in local currencies supported by outstanding performance
of products launched since 2007. The top three products are Diovan ($6 bio.) Gleevec
($4 bio.) and Zometa ($1,5 bio.) which account for more than one third of the division’s
sales. The division is a market leader in pharmaceuticals and has multiple growth
drivers and is not dependent on a limited set of blockbuster products. Therefore it is
located as a star in the BCG matrix. There exist many opportunities to increase growth
and market share in the future due to recently launched products as well as a number of
products that are about to received market approval for major markets. Promising new
launched products are Xolair, Tekturna/Rasilez, Lucentis and Ilaris among others
(Novartis, 2010, p.29) Also noteworthy is the fact that Novartis has some new drugs
that are expected to receive market approval from authorities around the world soon.
These drugs are Onbrez/Breezhaler (QAB149), Gilenia (FTY720) and Zortress. Zortress
is a drug for prevention of transplanted organ rejection. OnbrezBreezhalter is a drug
against chronic obstructive pulmonary disease (COPD) and Gilenia (FTY720) is a very
innovative and new class Multiple Sclerosis (MLS) treatment. Novartis has high hopes
for these new drugs and belief in their potential to generate high revenues. Due to these
reasons it is expected that the division will improve its location in the matrix in terms of
growth and market share.
With regard to Sandoz, Novartis is fortunate to be the only major pharmaceuticals
developer which also has a generic drug capability. Sandoz is a global leader in generic
pharmaceuticals (Novartis, 2010, p.51) increasing sales by 5% in local currencies.
Sandoz launched 25 new products in 2009 expanding its leadership position being
placed in the border area of star and cash cow in the BCG portfolio matrix. In the future
Sandoz recognizes growth opportunities because increased governmental pressure in
drug companies to lower prices and increase drug availability. Thus Sandoz will be of
increased importance in the future as a generics producer thus also improving its
location in the matrix upward.

45 of 130
The consumer health division is the third largest in terms of revenue and has generated
growth of 5% in local currencies in 2009. The three segments over-the-counter
medication (OTC), animal health and CIBA vision all have shown strong performance
in 2009 through innovative products and market expensing. OTC, animal health and
CIBA vision have grown by 5,2%, 3,8% and 5,4% respectively. In their individual
branches they rank 4th, 6th and 2nd respectively and are thus in top ten positions in their
business areas (Novartis, 2010, p.55). The consumer health division is expected to
improve it position towards the star area of the portfolio matrix. Especially CIBA
Vision with a 21% market share is facing considerable growth opportunities and is
currently the fastest growing contact-lens company in the industry. After the merger
with Alcon is completed in 2010, which will result in a fifth separate division
completely devoted to eye-care, Novartis will be an instant global leader of eye-care
products.
Vaccines and Diagnostics is the smallest division in terms of sales but generated the
highest growth rate of all divisions in 2009 with 39% in local currencies and is thus
placed in the upper part of the question mark area. The main reason for this high growth
is the 2009 world influenza (H1N1) pandemic for which Novartis delivered more than a
hundred million vaccine doses in a few months. The division is generating strong
growth in emerging markets and increased its global presence. Pediatric and rabies
vaccines are supporting this trend and help to off-set price pressure on seasonal
influenza vaccines. The division is also a pioneer in innovation leading with modern
cell-culture biotechnologies (Novartis, 2010, p.39). The division is expected to receive
market approval from European and US authorities for its novel Menveo vaccine in
2010 which is a novel vaccine to fight deadly meningococcal disease. The company has
high hopes for this vaccine which is determined to be important for the long-term
success of the division (Novartis, 2010, p.146). Regarding the outlook for this division
growth is expected to decline due to loss of contribution from the influenza pandemic.
The vaccines and diagnostic division is expected to move toward the stars are by
increasing market share albeit with a decreased rate of growth in the future.
In order to get a more detailed picture of the product portfolio a product-life cycle
analysis is conducted. This will reveal information about where the different products of
Novartis are in their life-cycle (Drummond and Ensor, 2001, pp.164-165). The life cycle
of normal Novartis products usually features a fast growth after introduction.

46 of 130
Pharmaceutical companies try to actively promote the growth of products because they
have to make the most of the limited time their new drugs benefit from patent
protection. The growth phase is followed by a period of maturity toward the end of the
patent protection phase where growth slows down or stalls and the peak of sales is
reached (Kellogg and Charnes, 2000, p.78). After maturity, the drug experiences the
phase of declining sales which usually happens when patent protection is lost and the
drug has to compete with generic products. In this phase sales usually decline rapidly.
In figure 19 the top twenty pharmaceuticals of Novartis are placed on a typical product
life cycle curve. As can be seen the majority of drugs are located in the introduction and
growth phase. A few are located in the maturity phase, among them is Diovan the top-
selling drug which will lose patent protection next year. Noteworthy is the fact that only
four top twenty drugs are in the declining phase. This is proof for the success of the
Novartis pipeline in being able to develop and market successful drugs on a continuous
basis thus constantly rejuvenating the product portfolio. As a result Novartis is less
dependent top selling drugs, such as Diovan, to generate revenue in the future.
As far as customers are concerned, Novartis’ target customer group are those patients
that have conditions that belong to Novartis’ research and development focus. Other
than that location or age do not really matter. It is important to note that not only private
patients are customers of Novartis but also national health institution as well as public
non-government institutions and non-profit organizations that are related to healthcare
and humanitarian aid.
Figure 19: Novartis Product Life Cycle
Tegretol
Neoral Tegretol
Aclasta
Source: own design Time
De
clin
e
Intr
od
uct
ion
Gro
ew
th
Sale
s
Ma
turi
ty
Diovan
Voltaren
Lucentis
Neoral
Femara
Exelon
Lescol
Gleevec
Tegretol
Zometa
Exforge
Sandostatin
Exjade
Aclasta
Ritalin
Xolair
Comtan
Foradil
Myfortic
Lotrel

47 of 130
3.3 SWOT Analysis
In this section the information collected previously in the internal and external analysis
is the starting point for conduction a SWOT analysis. Hence, the SWOT analysis can be
considered to be a summary of the internal and external analysis. The SWOT analysis
analyzes the strengths and weaknesses that are currently present within the organization.
Moreover the opportunities and threats Novartis faces by its external environment are
also scrutinized (Lynch, 2006, p.450-451). A table with the SWOT analysis is provided
in appendix 11.
3.3.1 Strengths
An internal strength which is generated by Novartis is for example its strong research
and development capability with a highly productive product pipeline that generates
safe and effective medicines for needy patients. The pipeline is one of the strongest in
the industry and has generated in the past high approval numbers. Successful R&D
activities are a key success factor (KSF) of the industry and Novartis will keep investing
strongly in R&D in the future to assure a successful pipeline. Furthermore Novartis has
created over the years an attractive healthcare product portfolio which is very
diversified. Its portfolio covers patent protect-pharmaceuticals, generic pharmaceuticals,
vaccines and consumer health. With the acquisition of Alcon, which will be completed
in 2010, a new part of the portfolio will be created in the area of eye care. This will
make Novartis a global market leader in this product segment.
Furthermore, Novartis is standing on a solid financial basis with little external financing
and high equity as well as a lot of cash at its disposition. Novartis also recognized the
development in emerging markets early on and is already heavily engaged in these
markets. This is certainly an important aspect for the pharmaceutical industry since the
emerging markets will be the market of the future. Novartis also has very dedicated
employees who are highly competed in the fields of research and development and sales
and marketing. This is also proven by the high market share with over 5% of global
pharmaceutical sales. In terms of market share Novartis is among the top five
companies together with Pfizer and GlaxoSmithKline. Novartis is also concerned about
continuous improvement of its operations in order to avoid complacency. The
“Forward” initiative helped to improve organizational processes such as production and
research and development which resulted in a more efficient and faster organization.

48 of 130
Finally, it can be noted that Novartis has achieved a very good image and high
reputation on a global scale. Novartis has proven that it concerns itself with important
aspects such as environment protection, poverty and patient safety and satisfaction
among many other topics. Novartis has been in the past frequently ranked among the
top companies of Fortune magazine’s most highly admired company’s of the
pharmaceutical industry.
3.3.2 Weaknesses
Even though Novartis is a successful pharmaceutical company, it also has to cope with
some weaknesses. One weakness is the fact that the company is vulnerable to high
currency fluctuation because it operates globally and is doing business in many
countries. Even though the company is trying to hedge this risk, currency fluctuation
can have significant impact on operating results. Another weakness in the past has been
the company’s mediocre share performance despite strong operating results. Even
though share prices increased in 2009, probably due to the global economy picking up,
investors are distrusting the pharmaceutical company in general. Low share price
performance can make the company vulnerable to external takeover.
3.3.3 Opportunities
With regard to the external environment, there are a number of aspects that might
influence Novartis in a positive way in the way of opportunities. One example are
changing demographics and lifestyle. The global population is growing and also aging.
This means that the circle of potential patients that require medicines by Novartis is also
increasing. Aging of the population also has a positive effect in that older people need
more medication than younger people. Furthermore, the deteriorating human lifestyle of
less physical activity combined with an unhealthy diet is increasingly leading to more
people having problems with diabetes or cardiovascular diseases. These people will
require effective and advanced medication.
The growing economic wealth of countries in emerging markets will present
opportunities for Novartis because these countries will be able to afford high quality
medical treatment and medicines. At the same time the overall global economic
situation seems to stabilize and eventually improve in the coming years leading to
global economic recovery. Even though Novartis is somewhat more independent of
economic cycles than other industries, global economic growth will add positive

49 of 130
impulses. Further opportunities can be derived from advances in new technologies that
will enable Novartis to develop new medicines and moreover be able to seek
approaches to development of new drugs that were not possible up to today. Another
important point is that opportunities may lie in acquisitions or strategic alliances in
order to gain access to new technologies, markets or to benefit from shared cost burden
in research and development for example.
3.3.4 Threats
External threats that Novartis has to face are more stringent regulations that have to be
complied with making drug development even more expensive and time consuming,
possibly leading to less drugs approved. Furthermore, pharmaceutical companies
including Novartis will face increasing pressure in the future from governments around
the world to lower drug prices and increase availability to patients. This might have
significant effect on sales and margins making it even harder for Novartis to recover the
investments in drug development. Illegal copies in emerging markets, generics
competition and better drugs developed by competitors are also possible threats that
have to be monitored. Furthermore, the number of lawsuit and legal litigation has also
increased over the past possibly leading to a loss of image that might be more harmful
than the cost caused by legal procedures.
Overall it can be concluded that Novartis can face the future optimistically if the
company does not neglect its weaknesses and external threats. With a promising market
and a good pipeline providing the company with a first-mover advantage Novartis has
the means to be successful. It has been shown that Novartis has significant competences
in all key success factors of the industry. This provides Novartis with the potential for
high future earnings and thus economic success.
4 Cost of Capital
In this chapter the cost of capital of Novartis is estimated. When a company is valued
using the discounted cash flow method (DCF), the free cash flows have to be discounted
by the weighted average cost of capital (WACC). The WACC represents the
opportunity cost that investors face for investing their funds in a similar investment with
the same free cash flows and similar level of risk.

50 of 130
The weighted average cost of capital is the market based weighted average of the after-
tax cost of debt and cost of equity. The formula is presented in the following:
���� ��
���� � !" �#�
�$
Hence, the parameters required to estimate Novartis’ cost of capital are the following:
the company’s after tax cost of debt, cost of equity as well as the company’s target
capital structure. Since none of these parameters are directly observable, different
models were employed to estimate each of these parameters. The chapter is structured in
such a way that first the cost of equity is estimated, which is followed by the after tax
cost of debt. Finally the target capital structure of Novartis is determined.
4.1 The Cost of Equity
Estimating the cost of equity of Novartis implies determining the expected rate of return
of the Novartis stock. Because expected returns are not directly observable, the Capital
Assets Pricing Model (CAPM) is employed in order to convert the risk of the Novartis
traded stock into and expected return (Koller, Goedhart and Wessels, 2005, p. 294).
#�%&" '( � )&*#�%!" � '(+
Where: E(Ri)= security I’s expected return
Rf = the risk free rate
Βi= the stock’s sensitivity to the market
E(Rm)= expected return of the market
E�R." � r0 equity risk premium
4.1.1 The Risk Free Rate
The risk free rate is the return on a portfolio which has no covariance with the market.
Hypothetically, it would be possible to construct a zero-beta portfolio but the cost and
complexity of performing this task would make it impracticable. Therefore, Koller,
Goedhart and Wessels (2005, p.294) recommend using 10 year default-free government
bond yields that provide the best estimate of the risk free rate. Even though bonds are
not necessarily risk free, long-term government bonds in the United States and Western
Europe have very low betas and thus represent a good estimate. Furthermore, these
authors also recommend using 10-year German government bond when valuing
European companies such as Novartis. Follwing their recommendation a 10 year
German government bond was used as an estiamte for the risk free rate. The yield of

51 of 130
Source: own design Source: own design
Figure 20: Novartis Scatter Plot Figure 21: Novartis Regression Output
such a bond in April 2010 was 3,08 per cent11 and thus will be used as the risk free rate
to calculate the WACC of Novartis for the forecast period.
4.1.2 The Beta of Novartis
According to the CAPM the expected return of a stock is driven by beta (Koller,
Goedhart and Wessels, 2005, p. 306). A company’s beta represents the degree to which
the company’s stock and the market move together. The beta of Novartis is not readily
observable and therefore has to be estimated. A raw beta can be estimated using
regression analysis. The most common method to do this is the market model which is
depicted in the following:
1 2 � 34 � 5
As can be seen, the raw beta of Novartis is estimated in the market model by regressing
the stock’s return against the market’s return where the coefficient of the independent
variable is the raw beta of Novartis. When the market model is implemented there are a
number of decisions that have to be taken in advance.
The first decision is the one about an appropriate market proxy for the market model.
Because the market portfolio represents a value-weighted portfolio which consists of all
assets both traded and not traded, it is not readily observable. The standard solution is to
select a well diversified market index. Koller, Goedhart and Wessels (2005, p. 310)
recommend the S&P 500 index which is the most commonly used proxy for the market
portfolio when estimating betas. Since Novartis is also traded on the New York Stock
Exchange and a high correlation exists with the S&P 500 index, this index is selected as
the market proxy.
11
Bloomberg, 2010
http://www.bloomberg.com/markets/rates/germany.html

52 of 130
The next decision is concerned with the measurement period and the frequency of
measurement of the returns used in the regression. Several recommendations exist that
consider various trade-offs. With regard to the measurement period the trade-off is
between decreased variance and thus more precision and the risk of including
significant changes in risk due to company’s operations. When deciding on the
frequency of measurement problems are encountered with regard to precision and
illiquity bias. It was finally decided to follow the method of Daves, Ehrhardt and
Kunkel (2000, p.8) who recommend using daily returns for a period of three years. This
method will increase precision without the danger of incorporating structural changes
which could falsify the result. Additionally, it was ensured that trade volume of the
stock was different from zero on all trading days in the estimation window in order to
avoid an illiquidity bias.
Thus a period of three years with daily data was used for the estimate, starting from
April 23rd 2007 until April 22nd 2010. The historic returns were calculated using closing
prices for Novartis stock and the S&P 500 index which were adjusted for any dividends
or stock splits. The regression resulted in raw beta for Novartis of 0,479 and the
regression results are depicted in figure 20. The coefficient of the market portfolio has a
p-value of almost zero and hence is highly statistically significant. R² of the regression
is only 0,31, meaning that only 31% of the variance of Novartis is due to systematic or
market risk and about 69% to idiosyncratic or firm-specific risk (Verbeek, 2008, p.40).
Taking into account the effect that betas revert toward 1, a smoothing process used by
Bloomberg is employed to improve the beta estimate (Koller, Goedhart and Wessels,
2005, p. 314). Using this method results in an adjusted beta presented in the following:
678����7 9��� 0.33 � 0.67 ? 0,479 C 0,651
Estimating beta is an imprecise procedure. There is also an alternative method to
estimating beta from historical regression which can improve the precision of beta
estimates. This alternative is using industry betas instead of company specific betas
(Koller, Goedhart and Wessels, 2005, p. 311). Companies in the same industry face
resembling operating risks and should therefore have resembling operating betas or
unlevered betas. Beta is not only a funtion of operating risks but also of financial risks
as a result of leverage. To strip out the effect of leverage the theories of Franco
Modigliani and Merton Miller are relied on as mentioned by Koller, Goedhart and
Wessels (2005, pp. 312-313).

53 of 130
Source: own design
0
0,1
0,2
0,3
0,4
0,5
0,6
0,7
Figure 22: Novartis Rolling Beta
As a result the unlevered beta of the pharmaceutical industry is 0,5912. Relevering this
beta with a target debt to equity ratio of 10% to receive the equity beta of Novartis
results in a beta of 0,65 which is about the same as the adjusted raw beta from the
market model regression.
Furthermore, the estimation period has to be
scrutinized to see whether structural changes
have lead to a change in risk. A rolling beta
calculation was therefore conducted. Novartis’ 3
year beta for a 10year period is plotted in figure
22 showing that Novartis’ beta from 2002 to
2010 increased from 0,3 to about 0,5. During the
last three years it has been fairly stable hovering around 0,5. During the tumultuous
times of the financial crisis of 2008 the beta of Novartis experienced a shift but
recovered to its pre-crisis level again in 2009. Moreover, if a measurement period of
five years would have been used the risk of Novartis and thus its beta would have been
overestimated because from 2005 until 2007 the beta hovered between 0,5 and 0,6.
4.1.3 The Market Risk Premium
Estimating the market risk premium, the difference between the market’s expected
return and the risk free rate, is one of the most debated issues in finance (Koller,
Goedhart and Wessels, 2005, p. 297). Similar to a stock’s expected return, the expected
return on the market is unobservable. There are a number of methods for estimating the
market risk premium which can be put into three categories. Estimating risk premiums
by:
1. Extrapolating historical levels
2. Means of regression analysis to link current market variables
3. Reverse engineering the market’s cost of capital using DCF valuation, estimates
of return on investment and growth
All three methods have certain advantages and disadvantages but none of them can
estimate the market risk premium exactly. Due to low availability of data and time
12
http://pages.stern.nyu.edu/~adamodar/

54 of 130
resources the method estimating the market risk premium by extrapolating historical
level was selected.
In order to do so, the S&P 500 index is used again as a proxy for the market. The
arithmetic average of 703 monthly returns of the S&P 500 index between June 1950 and
April 2010 were used to determine the average annual return of the market. This
resulted in an average annual return of 8,63%. By deducting the risk free rate of 3,08%
a market risk premium of 5,55% is calculated. However, statistical difficulties have to
be considered that exist with historical premium. According to Brown, Goetzmann and
Ross (1995, pp.853-855), properly measured historical premiums cannot predict future
returns because the sample includes only countries with strong historical returns. This
phenomenon is referred to as survivorship bias. Therefore the historical arithmetic
average market risk premium has to be adjusted downward. According to Koller,
Goedhart and Wessels (2005, p. 303), subtracting between one and two percent
survivorship bias will enhance the estimate of future market risk premiums. Subtracting
one percent survivorship bias from the long-term arithmetic average of 5,55% will
result in an adjusted market risk premium of 4,55 %. This is in line with the findings
Koller, Goedhart and Wessels (2005, p.303) and Dimson, Marsh and Staunton (2003,
p.38). Plugging in the values calculated above into the CAPM results in a cost of equity
for Novartis of about 6,04%.
4.2 The after Tax Cost of Debt
In order to estimate the cost of debt for Novartis, the yield to maturity of the company’s
long term, option-free bonds is used. The yield to maturity is a proxy for expected
return on a company’s debt because the yield is only a promised rate of return in case all
coupons and the debt are paid in full and on time (Koller, Goedhart and Wessels, 2005,
p. 318). However, this is only the case if the company’s debt is of investment grade
(BBB or better) because otherwise expected free cash flows should not be discounted by
promised yields. This inconsistency is negligible for companies such as Novartis that
have highly rated debt.

55 of 130
Novartis’ long-term bonds with a maturity at April 2010 and an annual coupon rate of
4,4% and semi-annual coupon payments are currently trading at $107,3. The resulting
yield-to-maturity is 3,53%.13 The calculation is presented in the following table.
The yield to maturity can also be calculated indirectly using bond ratings and the
resulting yield spread over long-term government bonds. As mentioned above the yield
to maturity on 10 year German government bonds its 3,08%. Novartis is currently rated
by S&P with an AA- rating which results in a yield spread of 0,75%.14 Adding the yield
spread to the government bond yield results in an approximate cost of debt for Novartis
of 3,83%. This calculating however was only done as a check. The selected pre tax cost
of debt is the yield-to-maturity of Novartis’ long-term bonds since this is the direct
approach.
In order to incorporate the value of the tax shield in the valuation of Novartis, the cost
of debt is included after deducting taxes in the calculation of the WACC. This is shown
in the following formula:
6���E � F�� GH�� H� I�J� GH�� H� I�J� K �1 � F4",
where Tm is the marginal tax rate (15,22%) of Novartis. Plugging the numbers into the
formula results in an after-tax cost of debt for Novartis of 2,99%.
4.3 The Capital Structure of Novartis
Now that estimates for the cost of debt and cost of equity are available, these two
expected returns can now be put together to get the weighted average cost of capital for
Novartis. The weights used to calculate the WACC should be based on the target market
value weights. Following the Koller, Goedhart and Wessels (2005, p.323)
recommendation, a combination of three approaches is used to find the target capital
structure of Novartis. The three approaches are:
13
YahooFinance.com
http://reports.finance.yahoo.com/z1?b=1&is=novartis&sf=y&so=d 14
Damodaran Online
http://pages.stern.nyu.edu/~adamodar/
Table 4: Novartis bond yield
# of Payments Present Value Coupon Payment Face Value Ytm Ytm p.a.
20 -107,3 2,2 100 1,76% 3,53%
Source: own design

56 of 130
1. Estimate the company’s current market-value-based capital structure
2. Check the capital structure of comparable companies
3. Review management’s approach to financing the company’s operations and its
implications for the target capital structure.
In the first approach the current capital structure of Novartis is estimated. The debt of
Novartis consists of a mixture of straight bonds and bank loans and whenever possible
market values were used. Furthermore debt equivalent claims such as operating leases
and pension liabilities are included the debt of Novartis. The following table 5 presents
the evolution of Novartis’ capital structure.
Looking at the table it can be concluded that the capital structure of Novartis has been
somewhat constant pending between seven and ten per cent from 2002 until 2008. A
possible reason for this is the fact that up to 2008 Novartis used mostly short-term debt
as external financing. In 2009 the value of debt increased significantly to 13,55% as a
result of increased long-term debt in the form of straight bonds. This trend already
started in 2008 and is mainly caused by the merger with Alcon in order to expand into
the strategic growth area of eye care. It is estimated that Novartis’ current capital
structure consists of 13,55% D/V and 86,45% E/V.
Another approach is checking the capital structure of comparable industry peer
companies. Industry averages also help determining the target capital structure of
Novartis by providing an overall picture. For example industry peer companies such as
Pfizer and GlaxoSmithKline also have fairly low debt/value ratios. Pfizer’s debt account
for about 11,53% of total value while GlaxoSmithKline’s debt account’s for 22,53% of
total values which is considerably higher. As far as industry averages are concerned
there is a difference between European and American companies. Average debt to total
capitalization in Europe is about 17% while in the US it is only 11,2% thus the
Table 5: Novartis Capital Structure
year 2001 2002 2003 2004 2005 2006 2007 2008 2009
D/V ratio 5,80% 8,24% 7,37% 7,73% 9,65% 8,24% 7,48% 9,74% 13,55%
E/V ratio 94,20% 91,76% 92,63% 92,27% 90,35% 91,76% 92,52% 90,26% 86,45%
Source: own design

57 of 130
Table 6: WACC sesitivity (in %)beta/Kd 3,53 4 5
0,651 5,74 5,78 5,860,75 6,14 6,18 6,27
1 7,17 7,21 7,291,2 7,99 8,03 8,11
Source: own design
conclusion can be drawn that European companies rely more on external financing than
their peers in the US.15
The last aspect of determining the target capital structure of Novartis is the management
philosophy toward financing which plays an important role. Unfortunately, little explicit
information is available with regard to the target capital structure of Novartis or
management’s view of what the target capital structure of Novartis should look like. It
is estimated however, that the management of Novartis prefers a more conservative
capital structure relying mostly on internal capital resources. Indications for this are the
low debt levels of the past up to the point when the Alcon merger started and the way
the first 25% of Alcon were financed. The first 25% of Alcon worth $10,4 billion were
financed by internal cash reserves and short-term debt (Novartis, 2009, p.146).
Taking everything into account the target capital structure of Novartis is estimated to be
at 10% D/V and 90% E/V. Reason for this estimate is the belief that Novartis relied
heavily in the past on internal cash reserves and short term debt to finance market
expansion and strategic takeovers. Furthermore the increase in debt is only a short-term
occasion due to the Alcon takeover. Furthermore, Novartis has a strong ability to
generate cash and will therefore in the future be able to use internal resources as a major
means of financing. It is possible every now and then that the debt/value ratio will
increase a few percentage points due to major investments such as takeovers but will
revert back to the 10% D/V target.
Combining all the information provided above, the weighted average cost of capital of
Novartis is estimated to be 5,74%.
4.4 WACC Sensitivity Analysis
In the following a WACC sensitivity analysis is provided where the key parameters beta
and cost of debt are changed. As can be seen changing the cost of debt to 5% does not
cause a significant change in the level of WACC. Currently interest rates are very low
due to the weak global economic
situation. It is estimated that interest rates
will rise once the global economy starts to
15
averages are based on Damodaran Online 2010
http://pages.stern.nyu.edu/~adamodar/

58 of 130
recover in order to counter inflation. Higher costs of debt, resulting from this
development, would thus only affect the WACC of Novartis in a limited way. However,
a small change in beta causes WACC to change significantly making WACC very
sensitive to beta. This is especially true because Novartis relies more heavily on equity
financing than debt financing.
5 Forecasting Performance
In this chapter the future performance of Novartis is forecasted. Based on the strategic
situation of Novartis and the pharmaceutical industry three different scenarios are
defined which are the base case scenario, a best case scenario and a worst case scenario.
The weights of the scenarios are 80 per cent for the base case scenario, 10 per cent for
the best case scenario and 10 per cent for the worst case scenario. For each scenario a
five year detailed forecast from 2010 to 2014 was used combined with a ten year
summary forecast based on key drivers until 2024. The continuing value from 2025 on
is also calculated for each scenario.
The purpose of the scenario analysis is to forecast the future performance of Novartis
and to determine the effects of this performance on the share price. With the help of the
scenarios a share price is estimated based on various assumptions and certain
parameters that represent the company’s future performance. The forecast of the future
performance of Novartis is done under the assumption that Novartis will continue to
employ its current strategy. Under this strategy Novartis will continue to invest heavily
in research and development activities in order to be able to develop innovative and
highly effective drugs in various growth areas of medical treatment such oncology,
infectious diseases, diabetes, etc. Furthermore Novartis will maintain a diversified
portfolio of healthcare products and will keep diversifying by means of acquisition as
the situation requires and as new opportunities present themselves. Additionally,
Novartis will try to benefit from the high growth in demand for medical products in the
emerging markets which is fueled by economic growth and an increasing middle class.
The scenario analysis is conducted in the way that only the most important parameters
are changed between scenarios such as sales growth, EBITA margin as well as the
inputs for the continuing value. Other parameters such as WACC, tax rates, interest
rates or cost of goods sold are estimated to remain more stable and independent of

59 of 130
scenarios. Investments in acquisitions for example also remain the same throughout
scenarios because these are sought vital for the competitiveness of Novartis. Even
though it is hard to predict how high they will be and when they will take place, it is
deemed necessary to consider these investments in some way.
5.1 Base Case Scenario
The base case of Novartis’ forecast is assumed to be the most probable value estimate.
This scenario forecasts solid growth and a strong return on invested capital just like
Novartis has delivered in the past 10 years. This forecast is rooted in the conclusions
that were drawn from the strategic business analysis and the outstanding record of past
financial performance. The historic financial analysis has revealed that Novartis is
capable of generating huge profits in a very difficult and competitive market
environment. It has also been shown that Novartis has become a top five pharmaceutical
producer and that the company has attained a favorable market position by diversifying
its product portfolio thus benefiting from growth areas in the healthcare industry. This is
deemed a solid base for good future financial performance with medium to high growth
rates. The pharmaceutical division which develops new patent protected
pharmaceuticals will also in the future be the main generator of sales and growth,
accountable for over 60% of sales.
Also important is the fact that Novartis is expected to be able to keep up a high approval
rate of new innovative drugs thus continuing to rejuvenate its portfolio. Because of that
Novartis will not have to rely on old blockbuster products that face the loss of patent
protection such as Diovan, Novartis’ top sales drug, and other significant drugs. Thus
newly launched products such as Galvus and Tekturna play an important part and have
shown good performance and are expected to do so in the future. Also important is the
outcome of the registration processes for new products such OnbrezBreezhaler
(QAB149) FTY720 and Menveo vaccine and Zortress submitted to the FDA, European
authorities and other healthcare authorities around the world. In this scenario it is
expected that all these products receive approval and that they will undergo an average
to good economic development. Furthermore Novartis can maintain its past average
approval rate for phase III products and those that are registered with authorities for
approval (Novartis, 2010, pp.23-33).

60 of 130
Sales of new products can thus be kept high bypassing problems due to loss of patent
protection. Other areas of the product portfolio such as vaccines, consumer health, eye
care and Sandoz are also expected to contribute significantly to growth. Growth in the
future is estimated to be generated primarily by sales from emerging markets such as
China, Brasil, India, etc.
In table 7 the key figures of the base case scenario are presented.
As can be seen sales revenue is forecasted with moderate growth growing at a mid-
single percentage rate. This is also the expectation of the Novartis management as stated
in the annual report of 2009 (Novartis, 2010, p.14). With regard to EBITA margin, the
level is expected to remain stable at 33% and 31% but is estimated to decrease
significantly after the detailed forecast period to about 20% and even further to 15%
toward the end of the estimation period. Reason for this is the fact that more and more
countries will have to deal with rising healthcare cost caused by an aging population
and changing life styles. Therefore, governments will put a lot of pressure on
pharmaceutical companies to lower prices thus cutting costs. Competition is also likely
to increase thus further reducing margins. ROIC is expected to remain stable in the short
term but in the long-term ROIC will decrease to about 10 % due to lower NOPLAT
growth and an increased invested capital. This in turn is caused by activation of R&D
activities and expected strategic investments to remain competitive in a difficult
business environment. However, ROIC will still be almost twice as high as the
estimated WACC making Novartis a value generating company.
Continuing value is estimated in this scenario to have a present value of $231.024.000
which is about 77,6% of operating value. Parameters used to derive this estimate were a
NOPLAT growth of 4% and a ROIC of 9%. Reasons for these assumptions are the past
performance as well as the forecasted future performance of Novartis. The company has
proved that it is capable of solid growth and high ROIC due to its excellent R&D
operations that can develop drugs which benefit from patent protection. Also, according
Table 7: Key Figures Base Case Scenario
year 2010 2011 2012 2013 2014 2015-2024
Revenue growth 5% 6% 6% 7% 7% 7%
EBITA margin 32,8% 32,7% 32,5% 31,5% 31,4% 15-20%
ROIC 19,7% 19,5% 19,5% 19,0% 19,3% 10-20%
FCF 9.093,4 9.970,4 10.164,1 11.847,1 11.272,1
WACC 5,74% 5,74% 5,74% 5,74% 5,74% 5,74%
Source: own design

61 of 130
Table 8: Key Figures Worst Case Scenario
year 2010 2011 2012 2013 2014 2015-2024
Revenue growth 5% 5% 5% 5% 5% 3-4%
EBITA margin 33,0% 32,9% 32,8% 30,7% 30,6% 10-20%
ROIC 19,7% 19,3% 19,2% 17,7% 17,9% 5-11%
FCF 9.093,4 10.012,2 9.577,7 11.615,5 10.743,6
WACC 5,74% 5,74% 5,74% 5,74% 5,74% 5,74%
Source: own design
to IMS Health the world market is expected to grow between 5%-8% annually until
2014.
The valuation in this scenario estimates an equity value of $328.241 billion and a value
per share of $144,32. For more information see appendix 12.
5.2 Worst Case Scenario
This scenario is the worst possible scenario that could transpire in the future but is not
very likely and thus is only weighted with 0,1. In this scenario a significant number of
possible new products fail to receive approval from regulatory authorities in the US and
Europe and other markets. Products that Novartis has high expectations for and that are
currently submitted to authorities are Zortess, OnbrezBreezhalter and FTY720 and
Menveo vaccine. It is estimates that at least two of these products will fail to receive
regulatory approval. Furthermore, a significant number of phase II and III pipeline
products develop undesired properties and turn out to be not appropriate for
employment in human medicine.
As a result of this development Novartis has to rely for longer period of time on old
products that face the loss of patent protection which have a negative effect on sales
growth due to increased price competition. This scenario also assumes that economic
conditions around the world develop more slowly than expected and that rising
healthcare costs increasingly force governments to pressure pharmaceuticals firms to
lower prices. This will have negative effects especially on the margins of Novartis and
its industry peers. Despite these adverse effects revenue growth is forecasted to decrease
but will still grow by 3% due to expected increased demand for medicines in emerging
markets. ROIC will start decreasing in 2013 and will keep decreasing significantly until
2025 to 4,6% thus falling below the level of WACC and resulting in a destruction of
value. Key figures of this scenario are presented in table 8.
Continuing value is estimated in this scenario to have a present value of $46,353 billion
which is about 49,3% of operating value and about 80% less than in the base case.

62 of 130
Table 9: Key Figures Best Case Scenario
year 2010 2011 2012 2013 2014 2015-2024
Revenue growth 7% 7% 7% 8% 8% 8-10%
EBITA margin 32,8% 32,7% 32,5% 31,4% 31,3% 20%
ROIC 20,0% 19,9% 19,9% 19,5% 20,0% 15%
FCF 9.900,9 10.194,8 10.523,1 11.893,9 12.458,0
WACC 5,74% 5,74% 5,74% 5,74% 5,74% 5,74%
Source: own design
Parameters used to derive this estimate were a NOPLAT growth of 3% and a ROIC
including goodwill of 5%. Reason for these assumptions is the fact that under this
scenario Novartis is not able to maintain the performance mentioned in the base case
scenario for reasons mentioned above. In this scenario the present value of continuing
value is only 14% of continuing value estimated in the base case scenario.
The valuation in this scenario estimates an equity value of $115.664 billion and a value
per share of $50,86.
5.3 Best Case Scenario
In this scenario the best possible future performance is assumed in which Novartis will
benefit from favorable conditions. However, this scenario is equally unlikely as the
worst case scenario and thus only weighted with 0,1.
In this scenario the filings of drugs such as Zortress, Onbrez Breezhaler, FTY720 and
Menveo are assumed to be successful and are expected to have a quick market launch
with strong sales growth. Beyond that, future drug development is expected to be over
proportionally successful compared to the base case scenario thus further strengthening
sales growth and the rejuvenation of the product portfolio. Sales of the top selling drug
Diovan will not decline as fast as anticipated after the loss of patent protection in 2011.
Furthermore, emerging markets are assumed to generate very strong economic growth
helping to boost company sales and even the stagnating markets such as the US, Japan
and Europe show better sales potential than expected. As a result sales growth is
continuously increasing from 7% to 10%.
Nevertheless, operating margins are still expected to decline over the years to 20% as a
result of governmental actions around the world to lower healthcare costs. But this
decline is estimated to be slower and not as big as is expected in the other scenarios.
ROIC is estimated to remain stable in the short run but will decrease in the long run to
about 15% because of decreasing margins and increasing invested capital due to
activated R&D expenditures. The WACC is expected to remain at the same level of
5,74% making ROIC almost three times as high enabling Novartis to keep increasing
value.
63 of 130
Continuing value is estimated in this scenario to have a value of $569 billion which is
about 85,5% of operating value. Compared to the continuing value of the base case
scenario, continuing value increases by 146%. Parameters used to derive this estimate
were a NOPLAT growth of 4,5% and a ROIC including goodwill of 10%. Reason for
these assumptions is the fact that under this scenario Novartis is expected to enjoy very
favorable conditions that enable the company to achieve higher sales growth and a
return on invested capital that is higher than the weighted average cost of capital. The
world pharmaceutical market is also expected to experience higher growth than
expected.
The valuation in this scenario estimates an equity value of $711.674 billion and a value
per share of $312,91.
6 Valuation of Flexibility-A Real Option Approach
In this chapter a real option analysis will be conducted based on a research and
development project for a new drug developed by Novartis. This process will reveal the
value of flexibility that cannot be determined with a static NPV calculation. The goal is
to show that often a project is dismissed as value destroying because flexibility is not
considered in the calculation, thus foregoing possible value for the company. The
chapter is structured in the way that first the value of flexibility is explained followed by
an introduction of the R&D process which is followed by a discussion of market and
technical risk. Then the static NPV of the project is calculated and finally the drug is
valued using a real options valuation approach.
6.1 The Value of Flexibility
A potential project’s net present value (NPV) measures the wealth created or destroyed
if a company would proceed to invest in such an opportunity. The true NPV would thus
be the difference of the true financial market value of the project’s future conditional
mean cash flows and the costs that would result from investing in the project. One
method to calculate the true financial market value of a corporate project is by
discounted cash flow method (DCF). However, the DCF method assumes that the
proper substitute portfolio of the financial market (tracking portfolio) is static and does
not change over time. This will be the case when the project generates no new future

64 of 130
flexibilities and is a now or never decision. Only in this case is the DCF a good estimate
of the project’s true NPV (Shockley, 2007, pp.30-31).
As a result, the DCF method which calculates a static NPV can be very misleading if
the project creates future flexibility and the management has the option to expand,
abandon or delay. Reason for this is the fact that in this situation the DCF method forces
the management to make a now or never decision (Dixit and Pindyck, 1995, p.107).
Options can be encountered in many corporate investment projects. And such an
investment that bears options is the R&D process of a new pharmaceutical product.
When a DCF calculations is done in this situation one will most likely come to the
conclusion that the project is of negative value and thus value destroying because this
static approach will neglect the high level of flexibility of management decision that
occur throughout the R&D process. Only an options approach that considers flexibility
after each stage in the R&D process will capture the value flexibility to learn and
respond. As a result, when the situation looks promising management can invest in
further R&D and when things look unfavorable the investment can be avoided. So the
investment for example in going from preclinical trial to phase I trials buys a call option
to keep on going to phase II trials based on a certain strike price. However, the
investment in this option will only be done if the option is worth more than its cost.
The new molecule that Novartis discovered is called BAF312 and treats Multiple
Sclerosis, a disease that causes the deterioration of the nerve system. Novartis has to
decide whether to develop the molecule or not. This depends on the value of the option.
Because a lot of information is required to value such a project, which is not disclosed
by Novartis, assumptions have to be made with regard to key parameters such as
revenue, volatility, success probability, etc. assumptions were made to the best of
knowledge and available information. In the next section the general process of a drug
development is briefly explained.
6.2 Development Process
In the following the development process of a new drug is shortly introduced. The
process of development of a new drug is a lengthy, difficult and highly risky
undertaking. Before new drug can be sold on open market in Europe, Japan or the
United States, it has to be approved by authorities such as the Food and Drug
Administration (FDA) in the US. Even though the process is somewhat standardized,

65 of 130
the potential new drug has to match several requirements with regard to safety and
effectiveness which makes the development of the new drug highly uncertain and
complex. Due to the risks involved only about 20% of pharmaceuticals that enter Phase
I clinical trials are also ultimately approved by the FDA to be sold on the market
(Schwartz and Moon, 2000, p.87). The entire development process can take up to 10
years and even longer and can cost more than 1billion US Dollars (Novartis, 2007,
p.132). In general this process consists of five stages once a suitable molecule has been
discovered which are explained in short in the following:
1. Preclinical trials: In preclinical trial scientists will test the safety and
effectiveness of the compound trough laboratory and animal trials. This stage
lasts about one to two years to complete and based on historical information the
industry-wide success rate is about 75% (Shockley, 2007, p.327).16
2. Phase I clinical trials and IND: In this stage small-scale trials (20-80 subjects) on
humans are conducted to test for toxicity and safety. Furthermore, the
Investigational New Drug (IND) application to the FDA is prepared. Phase I
clinical trial usually last up to two years and the historical failure rate due to
technical reasons is rate is about 50%.
3. Phase II clinical trials: If the FDA approves the IND application the drug is
tested on patients with the targeted disease. The goal is to analyze the biological
effectiveness of the drugs, potential side-effects, and the effectiveness of
different dosages. These trials are considerable larger (100-300 subjects) than
phase I trials (Schwartz and Moon, 2000, p.88). The length of this stage is about 2
years and usually 67% of the compounds make it to the next phase of clinical
trials.
4. Phase III clinical trials: In this phase large-scale double-blind and placebo-
controlled studies are conducted in order to determine the statistical significance
and the safety of the drug. The data from these trials are presented to the FDA.
This phase is usually the longest phase and takes about three years. It is also the
largest trial consisting of up to 3000 sick patients. Historically, about 50% of the
drugs continue to the next phase of submission to the FDA to gain market
approval.
16
All success percentages of the different development stages are based on Shockley, 2007.
66 of 130
5. New Drug Application (NDA) filing: In this phase the documentation of the
success of the drug during clinical trials is prepares and submitted to the FDA.
This approximately takes one year. About 5% of the drugs are rejected by the
FDA at this stage.
Once market approval has been granted the new drug is usually launched on the market
as fast as the manufacturing and logistics situation permits. A fast market launch is
important because patents are usually registered before clinical trials and are therefore
already effective (Lehman, 2003, p.7-9). Because patents last only 20 years, usually half
of the patent protection has expired when the drug is ready to be launched (FDA, 2009).
6.3 Market and Technical Risk
The difficulty of valuating these projects is based on the fact that the risk of these
projects comes from two sources of risk, namely market risk and technical risk. The
market risk is based on the uncertainty of how cash flows that are generated by the drug
will develop over time (Shockley, 2007, p.325). Estimating cash flows of a potential
new drug is hard to do and requires solid information on the number of people that
suffer from a certain disease that the drug can cure, number of people that will be
inflicted with the disease in the future, number of people that will receive the new drug,
etc. As the development of the drug progresses the company can learn about the market
potential of the drug and use this information to decide whether or not to press forward
the development each time a new decision has to be made.
The other source of risk is technical risk also called private risk. Technical risk in the
development process of a new drug is the uncertainty whether or not the new molecule
has the desired attributes and effects on the patients. Due to technical risk the project of
developing a new drug is in danger of being terminated at each tollgate of the
development process (Shockley, 2007, p.326).
5.4 Static NPV
In this section the static NPV of the project will be calculated. In order to do that, the
expected cash flows of the project are estimated as well as the expected required
expenditures for developing a new drug. Due to lack of inside information from
Novartis the real options analysis is based on assumed numbers.

67 of 130
Table 10: BAF312 Budget
marginal tax rate 16% Expected costs 54,83
% direct expenses 27% Expected CF 52,95
annual hurdle rate 15,00% Expected NPV -1,88
6 month hurdle rate 7,24%
perpetual growth -20%
Decison Launch
Sep 2010 Mar 2020 2020 2021 2022 2023 2024 2025 2026 2027 2028 2029 2030
Sales Revenue 200,00$ 300,00$ 400,00$ 450,00$ 500,00$ 550,00$ 600,00$ 650,00$ 650,00$ 650,00$ 650,00$
Direct Expenses 54,00$ 81,00$ 108,00$ 121,50$ 135,00$ 148,50$ 162,00$ 175,50$ 175,50$ 175,50$ 175,50$
Gross Margin 146,00$ 219,00$ 292,00$ 328,50$ 365,00$ 401,50$ 438,00$ 474,50$ 474,50$ 474,50$ 474,50$
Taxes 23,36$ 35,04$ 46,72$ 52,56$ 58,40$ 64,24$ 70,08$ 75,92$ 75,92$ 75,92$ 75,92$
FCF 122,64$ 183,96$ 245,28$ 275,94$ 306,60$ 337,26$ 367,92$ 398,58$ 398,58$ 398,58$ 398,58$
Continuing Value 1.138,80$
Exp. Value at Launch 1.673,91$ 106,64$ 139,10$ 161,28$ 157,77$ 152,43$ 145,81$ 138,31$ 130,30$ 113,30$ 98,52$ 330,45$
PV Today 443,71$
Source: own design
Table 11: BAF 312 Development Costs
Phase
Preclinical 1 75% 5 100% 5 5
IND filing / phase I 2 50% 15 75% 11,25 10,91
Phase II 2,5 67% 30 38% 11,25 10,27
Phase III 3 50% 100 25% 25,13 21,26
FDA Submission 1 95% 30 13% 3,77 2,91
Launch 50 11,93% 5,97 4,47
54,83
risk-free rate 3,08%
NPV -1,88
Source: own design
probability of
expenditure
Likelihood
of success
Length
(years)
Cost in
(Mio.)
discounted
exp. Costs
expected
costs
In table 10 the assumptions are depicted that were necessary to come up with a value for
the underlying asset, namely the molecule BAF312. The decision to start developing the
new drug is made on September 1st 2010. If it is decided that the drug should be
developed the process to do so is estimated to take nine and a half years. Should this
process be successful and market approval be gained, the product is launched
immediately on the market.
As can be seen the drug will generate strong sales growth in the first couple of years as
it becomes increasingly available. After three years sales growth declines somewhat and
stabilizes at about 650 million of annual sales. After 2030 the drug will lose patent
protection and the growth is estimated to be at -20% annual growth due to generics
competition. This estimate is incorporated in the continuing value calculation by means
of a growing perpetuity. The present value in September 2010 of estimated cash flows
generated by the drug is about 444 million USD. The hurdle rate used to discount the
cash flows is assumed to be 15% based on Shockley (2007, p.329) and Grabowski,
Vernon and DiMasi (2002, p.13). The marginal tax rate and direct expenses are based
on the Novartis valuation.
With regard to the development costs of the drug, these are estimated to have a present
value of about 55 million USD as presented in the table11.

68 of 130
Assumptions underlying this calculation are the length of the development process
which is estimated to be 9.5 years, likelihood of success of each stage of development
and estimated costs for each development stage. The probability of expenditure is the
probability that the next stage is reached conditional on the successful development of
the prior stage. With the help of the probability of expenditure, the expected
development costs can be estimated. The expected costs are then discounted to present
value in September 2010 depending on their point in time with the risk free rate of
3,08%.
As a result, the present value of expected development costs amounts to $54,83 mio. In
order to calculate the static NPV the expected present value cash flows generated by the
drug has to be calculated. Since the probability of launching the drug is only 11,93%
expected cash flows only amount to $52,95 mio.. Subtracting the expected costs from
the expected cash flows yields a negative NPV of $1,88 mio. Following the NPV rule
the decision should be made to abandon the development process of this drug in order to
avoid destroying value. However, this method totally neglects the value of flexibility
thus leading to false conclusions. If the value of flexibility is taken into consideration
the result is totally different has will be shown in the next section.
6.5 The Real Options Valuation Approach
In this section a real options valuation will be conducted. It will show that the project of
developing a new drug will create value in this case and that Novartis would forego this
value if the company would not commit itself to developing the new drug.
6.5.1 Framing the Problem
In order to put more structure on the problem in the following section it will be briefly
specified what the flexibilities are that Novartis face in the development process of
BAF312 and at what point in time they occur and how much has to be spend to pass a
tollgate.
Now that Novartis has discovered the new molecule BAF312 the company can develop
it into a new drug to fight multiple sclerosis. To do this requires the successful
completion of five different R&D phases, which were mentioned above. After each
stage Novartis has to decide to either press on or abandon the molecule.

69 of 130
Assuming that Novartis decides to enter preclinical trials, which would cost $5 mio.,
after one year Novartis has to decide whether to go on to phase I or terminate the
project. If the molecule passes all tests and its marketability is still promising then
Novartis will spend $15 mio. to finish phase I. this phase takes two years and after two
years if phase I is successfully completed and the drug still looks profitable Novartis
will spend $30 Mio. to go to phase II trials. If not than Novartis can abandon the
project. Assuming everything looks well after a period of two and a half years Novartis
has to decide whether to spend $100 mio. to proceed to phase III or abandon the project.
Again, if the marketability of the project still looks good and all tests in phase II are
successful Novartis will go to phase III. This phase will take about 3 years after which
the company either abandons or goes on to submit the drug to regulatory authorities to
gain market approval. If phase III trials are successful and the drug is still profitable
Novartis can submit the drug spending $30 mio. The FDA will take about one year to
process the submission of the drug. After a year Novartis can again decide whether to
go on and launch the new drug on the market or still terminate it. If the FDA approves
BAF312 and there is still enough demand for the new drug then Novartis has the
opportunity to spend $50 mio. and launch the new drug. In appendix 15 a decision tree
is depicted.
From the description above it becomes obvious that Novartis is investing in an option
each time it decides to keep on developing the new drug. For example in March 2019
Novartis has to decide whether or not to spend $30 Mio. to submit the drug to the FDA
for market approval. If it invests $30 mio. then Novartis purchases a call option on the
market launch of BAF312 with a maturity of one year and a strike price of $50 mio.(see
appendix 16). Likewise at the next earlier decision point in March 2016, if Novartis
decides to invest $100 Mio. in phase III trials the company purchases a three year call
option on submitting the drug to the FDA with a strike price of $30 Mio.. The
difference here is that the underlying asset is not a cash flow but an option to launch the
drug on the market for strike price of $50 Mio.. Thus, the $100 mio. investment in
phase III buys an option on an option or compound option. And Novartis will only
purchase this option if its value is more than $100 mio. on March 1st 2016. The next
earlier decision regarding phase II and phase I trials add even more optionality leading
to the current status in September 2010 and the decision to start preclinical trial or not.
So ultimately Novartis will proceed with preclinical trials if the compound option on the

70 of 130
market launch of BAF312 is more valuable than the costs to initiate preclinical trials for
$5 mio. on September 1st 2010. Valuation of this compound option requires a binominal
tree of underlying asset values which is set up in the next section.
6.5.2 Binominal Tree of Underlying Values
In order to be able to do a real option analysis a recombining binominal tree of
underlying values has to be created that shows how the value of the underlying asset
develops in the various up and down states. To do that five parameters are required.
These are: the risk free rate, the volatility of changes in the value of the underlying
asset, time to maturity, steps per time period and current value of the underlying asset.
The current value of the underlying asset is 443,71 as calculated above in the static
NPV approach. This is the starting point from where the binominal tree is grown. Time
to maturity is 9,5 years after which the drug can be launched if everything is favorable.
Steps per time period are 0,5 years which will lead to a 19 step binominal tree,
providing the model with enough precision. According to Shockley (2005, p. 279) after
five steps the terminal distribution of asset values increasingly approximates a log-
normal distribution leading to higher precision of the binominal model (relative to the
Black and Scholes theoretical value). Also required is the risk-free rate which is
estimated to be at 3,08% based on a 10 year German Government bond. The volatility
of the underlying asset is an important variable because the higher the volatility the
higher/lower the values of the underlying asset in the binominal will be thus affecting
the value of the option. Unfortunately, no detailed information on the volatility of the
cash flows generated by the drug is available. However, the volatility of such a drug is
assumed to be high. Inspired by Shockley (2007, p.337) the volatility is assumed to be
50%. With this information a recombining binominal tree can be started. The up-state
value of the underlying assets is calculated with the following formula:
L еN√∆Q еR,S√R,S 1,424
at the same time a down step is calculate with the following formula:
I 1L
Combining these parameters with the starting value of 443,71 mio. USD yields a
binominal tree of underlying asset values which is depicted in appendix 17.

71 of 130
The binominal tree of underlying values models how the management of Novartis will
learn about the value of the drug. The extreme values at both ends of the tree have very
small probabilities and are there because the assumption of continuous distribution
implies that there is a small probability of any large or small value (Shockley, 2007,
p.337)
6.5.3 The Value of the Option
Now that the binominal tree is built it is possible to see what Novartis will get back if
the company spends $5 mio. to enter the preclinical trials. To estimate the value of the
compound option it is necessary to start at the end of the tree. Starting in March 2020
the value of the underlying asset has to be properly adjusted for risk through the risk
neutral probabilities and discounted by the risk free factor (Shockley, 2007, p.337).
Considering a risk-free rate of 3,08% and time steps of a half year the risk-free time
value factor is calculated as:
E��� � �E�� ��U�HE еV?∆Q еR,RWRX?R,S 1,0155
With this in hand it now also possible to calculate the risk neutral probabilities with the
following formula for the up state:
Y еV?∆Q � I
L � I
1,0155 � 0,7021,424 � 0,702
0,4340
Because the risk-neutral probabilities always sum to one, the probability for the down
state is calculated as:
1 � Y 1 � 0,4340 0,5660
These two probabilities lead to what is called the risk-neutral pricing formula for pricing
a derivative which is derived as:
I Z�R Y ? I Z�[\ � �1 � Y" � I Z��]^_
еV?∆Q
Q and 1 – q are called risk-neutral probabilities because when the risk-neutral
probabilities are used as actual probabilities to calculate the expected return on a risky
asset the result will be the risk-free rate of return thus it seems that the risk premium on
a risky asset goes away. Furthermore, they sum to one just like subjective probabilities.
The risk-neutral probabilities are actually the prices of state securities which are used in

72 of 130
a tracking portfolio compounded by one plus the risk-free rate (Shockley, 2007, p.348).
They adjust for risk in the numerator of the risk-neutral pricing formula while the
denominator only adjusts for the time value of money. Risk-neutral probabilities are not
equal to the subjective probabilities that are used when estimating the probability that a
certain event will happen. They are a mathematical convenience to adjust the cash flows
so that they can be discounted by the risk-free rate (Copeland and Antikarov, 2001,
p.98). Also important is the fact that the risk neutral-probabilities stay the same trough
out the binominal tree as long as the underlying asset does not change (Shockley, 2007,
p.348). Using risk-neutral probabilities the value of the compound option can be
calculated for each step in the binominal tree. However, depending on the place in time
other factors have to be considered such as the costs to proceed to the next stage as well
as technical risk that the development of the drug might have to be terminated.
In appendix 18 the values of the compound option are depicted. Starting at the end of
the tree in March 2020 adjustments have to be made for technical risk and the
investment to launch the product in all states of nature. The probability that the FDA
approves the new drug application for market launch is 95% and it will require an
investment of 50 million Dollars to launch the new drug. Novartis will do this in all
states in which the market value is higher than the required investment of 50 million
Dollars. The value of the option in March 2020 considering the probability of technical
success and the required investment to follow on is calculated using the following
formula:
�Q`abc max�LgI � hc , 0"
Where �Q`abc is the probability of technical success, hc is the required investment
and LgI is the value of the underlying asset. As can be noticed, only the conditional
mean payoffs associated with market risk are considered. Firm-specific risk related to
the drug development process is idiosyncratic (conditional mean zero) and has no value
in all states of nature (Shockley, 2007, p.344 and p.346).
Now working back in the tree one time step to September 2019 the expected present
value of two outcomes that can occur over the next period is calculated using the risk-
neutral pricing formula and adjusted for the time value of money with the risk-free rate.
In the states where a zero is visible the value might still have value but it is
economically not optimal to continue or the option just does not have any value at all.

73 of 130
Going back one step further to March 2019 a new decision has to be made. It is
assumed that 50% of the drugs that reach phase III trial will be successful in going to
the new drug approval phase. If this is the case, Novartis has the opportunity to invest
$30 mio. to submit the new drug to the FDA for approval. In order to work back, the
optimal continue/abandon decision given technical success in phase III trials has to be
calculated, using the risk-neutral pricing formula, which is then multiplied by the
probability of technical success in phase III. The payoff from the optimal decision given
that technical success is achieved is just the maximum of the value of the option less the
required investment of $30 mio. to submit the drug to the FDA or zero. This calculation
is shown in the following.
i�0,4340 ? 244.688,26 � 0,5660 ? 120.614,55"/ 1,0155l � 30 171.760,03
0,50 ? max �171.760,03 , 0" 85.880,01
The option value in turn in the various states of March 2019 is just the expected present
value of the two things that can unfold until September 2019. Working back the tree
like that, the value of the compound option as of September 2010 can be calculated. In
September 2010 the value of the compound option is $16,15 Mio. which is what
Novartis will get if it invests in preclinical trials. Because the required investment to
start preclinical trials is only $5 Million, the true NPV is $11,15 Million. Novartis
would do the right thing if it initiated preclinical trials.
Comparing the negative NPV calculated by the static approach with the real option
valuation approach that considers flexibility it can be concluded that Novartis would
forego value if it did not proceed with the development of the new drug. Since the true
NPV is the value created by the project, its value would have to be added to equity
value for valuation purposes.
7 Calculating and Interpreting Results
After the completion of financial forecast and the estimation of continuing value this
chapter will conclude the valuation of Novartis by determining the value of operations
and the enterprise value. In order to calculate the equity value of Novartis, non-equity
claims are deducted making it possible to derive share price of Novartis. The results

74 of 130
Value of Operations: DCF approachFree Cash Discount PV
Year Flow Factor of FCF2010 9.093 0,946 8.600 2011 9.970 0,894 8.917 2012 10.164 0,846 8.600 2013 11.847 0,800 9.480 2014 11.272 0,757 8.530 2015 7.165 0,716 5.128 2016 6.415 0,677 4.342 2017 3.903 0,640 2.498 2018 (6.544) 0,605 (3.961) 2019 5.048 0,572 2.890 2020 5.681 0,541 3.076 2021 6.359 0,512 3.256 2022 (3.916) 0,484 (1.896) 2023 7.860 0,458 3.599 2024 8.690 0,433 3.764
Cont. Value 533.437 0,433 231.024 Operating Value 16 297.848
Continuing value % Operating value 77,6%
Mid -Year Adjustment Factor 1,067 Operating Value (Adjusted) 317.804
Table 12: Value of Operations: DCF Approach
Source: own design
presented below focus only on the base case scenario since this scenario is estimated to
be the most likely one to unfold.
7.1 Value of Operations
In the following the value of operation of Novartis is calculated by discounting the cash
flows from operations and adding continuing value.
7.1.1 Discounted Cash Flow
The cash flows from 2010 to 2024 are discounted by using a constant WACC of 5,74%.
The present value of all cash flows from operations amounts to $66.823 mio.. In 2018
and 2022 negative cash flows are generated due to investments in product portfolio.
7.1.2 Continuing Value
The present value of the continuing value of Novartis amounts to $231.024 mio.
Continuing value was estimated using a WACC of 5,74%, a growth rate of 4% and
ROIC rate of 9%. These assumptions are based the past and forecasted performance of
Novartis as well on the IMS Health growth forecast for the
pharmaceutical industry.
7.1.3 Value of Operations
Combining the present value of cash flows with the present
value of the continuing value yields a value of operations of
$297.848 mio. This value is adjusted with a mid-year
adjustment factor of 1,067 which takes into account that cash
flows occur throughout the whole year and that the valuation
is based on September 1st, 2010. The adjustment factor is
calculated using the following formula:
�78���m��� ��U�HE �1 � n6GG"o
pq · �1 � n6GG"psW
WtSq
After adjustment, the value of operations amounts to $317.804 mio. .Continuing value
is accountable for 77,6% of that value which means that more than two thirds of the
operating value is generated after Novartis has reached a stable situation. A detailed
discussion about continuing value and its parameters is provided in a plausibility
analysis in section 7.3.3.

75 of 130
7.2 Equity Value
The calculation of the equity value of Novartis is not as straightforward as calculating
the operating value. In a first step the enterprise value is calculated adding non-
operating items to the operating value. In a second step the equity value is derived by
deducting non-equity claims from the enterprise value which will result in the value of
equity.
7.2.1 Value of Non-Operating assets
In the case of Novartis, the value of non-operating assets consists of marketable
securities and financial investments. Novartis does not have excess pension assets
because the company recorded a pension liability in 2009. Excess marketable securities
amount to $16.547 mio. at fair market value where the majority of that is accountable
to securities such as financial instruments and only about $2.000 mio. to excess cash.
Financial investments amount to $20.754 mio. and about $18.000 mio. of that is
accountable to investments in associated companies and represent balance sheet values.
Adding excess marketable securities and financial investments to operating value yields
an enterprise value of $355.105 Mio. .
7.2.2 Value of Non-Equity Claims
For Novartis three categories of non-equity claims apply namely: debt, debt equivalents
and hybrid claims and minority interest. These claims are discussed in the following.
7.2.2.1 Debt The debt of Novartis is valued at $14.512 mio. and consists of $5.313 mio. of short term
debt which is mostly fixed debt bank loans. Here book values seem to be a reasonable
approximation because the company is not in financial distress. $9.199 mio. are
accountable to long term debt which consist mostly of straight bonds and are valued at
fair market value.
7.2.2.2 Debt Equivalents Under debt equivalents Novartis recognizes operating leases, retirement related
liabilities, long-term operating provisions and restructuring provisions. Value of
operating leases is estimated to be $2.186 Mio. while the value of long-term operating
provisions and restructuring provisions are based on book values and are valued at $952
mio. and $97 mio. respectively. Retirement related liabilities amount to $3.245 mio. .

76 of 130
Value of EquityOperating Value 317.804 Excess Mkt Securities 16.547
Financial Investments 20.754 Excess Pension Assets 0
Enterprise Value 355.105 (14.512) (2.186) (3.245)
Preferred Stock 0 (565) (952) (97)
Future Stock Options 0 (5.306)
328.241
2.274 144,32
Equity ValueStock options
Value per ShareNo. shares (thousands)
Long-Term Operating Provision
DebtCapitalized Operating LeasesRetirement Related Liability
Minority Interest
Restructuring Provision
Table 13: Value of Equity
Source: own design
Novartis also has ongoing-operating provisions but these are already accounted for in
the cash flow calculation hence these are not deducted from enterprise value.
7.2.2.3 Hybrid Claims Novartis uses executive stock options as part of management compensation. Stock
options represent a type of debt equivalent. Employing the Black and Scholes option
pricing model for options on dividend paying stocks, the value of the outstanding
options was estimated to be about $5.306 mio. . Required inputs for the options pricing
model such as strike price and time to maturity are based on information provided by
Novartis in its Annual Report 2009 note 26. The volatility of the share was estimated
based on daily returns over the last 12 years. The value of options was then multiplied
by the number of outstanding options. Due to lack of detailed information this is only a
rough approximation.
7.2.2.4 Minority Interest Minority claims are claims by outside shareholders on a portion of Novartis’ business
(Koller, Goedhart and Wessels, 2005, p.325). At Novartis all of the minority interests
are claims on Novartis branch companies in countries around the world. Since minority
interest is not publicly traded, income accountable to minority interest is multiplied by
the Novartis forward looking price-earnings multiple. This is possible because minority
interest only exists in Novartis businesses across various countries around the world.
This results in an approximation of market value of minority interest of $565 mio.
7.2.3 Value per Share
The last step to calculate a value per share is to deduct all non-equity claims from
enterprise value which will result in the equity value of
Novartis. Dividing the equity value by the number of
undiluted share outstanding will yield the value per share. In
the case of Novartis the equity value amounts to $328.241
mio. while the number of undiluted shares outstanding is
2.274.353. This results in a value per share for the base case
scenario of $144,32 as depicted in table 13.
The final share price is calculated using the value per share of
the other scenarios and multiplying it with their respective
probabilities. The value per share of the three different

77 of 130
Table 14: Sensitivity Analysis Results
-20% -10% no change 10% 20% -20% -10% no change 10% 20%
-1% 224,71 196,90 175,39 158,24 144,32 55,7% 36,4% 21,5% 9,6% 0,0%
-0,5% 192,46 174,20 158,24 145,07 134,69 33,4% 20,7% 9,6% 0,5% -6,7%
no change 169,63 155,41 144,32 134,69 126,37 17,5% 7,7% 0,0% -6,7% -12,4%
1% 136,08 129,44 123,45 118,02 112,61 -5,7% -10,3% -14,5% -18,2% -22,0%
2% 114,52 111,23 107,71 104,82 102,10 -20,6% -22,9% -25,4% -27,4% -29,3%
-20% -10% no change 10% 20% -20% -10% no change 10% 20%
D/V 5% 155,41 143,49 133,34 124,60 117,00 7,7% -0,6% -7,6% -13,7% -18,9%
no change 169,63 155,41 144,32 134,69 126,37 17,5% 7,7% 0,0% -6,7% -12,4%
D/V 15% 185,50 170,75 158,24 146,69 137,49 28,5% 18,3% 9,6% 1,6% -4,7%
D/V 20% 206,46 188,22 174,20 161,19 150,05 43,1% 30,4% 20,7% 11,7% 4,0%
Source: own design
Beta
R
isk-
fre
e r
ate
Beta
Ca
pit
al s
tru
ctu
re
Change in %
Change in %
scenarios and their probabilities are:
• Base case scenario: $144,32 – 80%
• Best case scenario: $312,91 – 10%
• Worst case scenario: $50,86 – 10%
Combining these values the final share price is calculated to be $151,83.
Regarding the true NPV of the new drug development project, using a real options
approach, this value would have to be added to the equity value of Novartis should the
company decide to go ahead with pre clinical trials. However, since the true NPV is a
fairly small amount, it would not have a significant impact on equity value and thus on
the share price.
7.3 Verifying Valuation Results
7.3.1 Sensitivity Analysis
In order to check if the model is solid under different assumptions a sensitivity analysis
based on the base case scenario is undertaken. To do so key parameters are changed to
find out how the value per share reacts to these changes and how sensitive the value per
share is to these parameters. Because WACC as the discount rate has a huge impact on
equity value three components of the WACC, beta, risk-free rate and capital structure,
are changed in order to reveal sensitivity of the equity value to these parameters.
In table 14 the results of the sensitivity analysis are depicted when beta and the risk-free
rate are changed. The presented figures show that share prices move in the expected
direction. Everything else being equal, an increase of the risk-free rate will increase the
discount rate and
thus lower the value
of the company. The
same is true for beta.
A higher beta will
increase the discount
rate and will thus
lead to a lower value
of Novartis. It is visible that if these parameters are changed, significant changes can
occur ranging from a plus 56% to minus 30% change in equity value. When only beta is

78 of 130
changed and the risk-free rate kept constant, changes from 17,5% to minus 12,4%
occur. Holding beta constant and changing the risk-free rate, equity value changes from
21,5% to minus 25,4%. As can be seen, changes in the risk-free rate and beta can have
significant impact on the discount rate and thus on the fair value of Novartis.
The other important parameter is capital structure. Table 14 shows that the share price
moves in the expected direction. Because debt is less expensive than equity, everything
else being equal, a higher portion of debt results in higher value per share due to a lower
discount rate. As can be seen capital structure can also have a big impact on equity
value but not as much as the risk-free rate. Proof for this is the somewhat smaller
variation from $133,34 to $174,20. Furthermore, capital structure bears less uncertainty
and is also easier to predict.
The sensitivity analysis provided above suggests that the valuation of Novartis is
extremely sensitive to changes in the weighted average cost of capital and to the input
parameters WACC is computed from. The intricacy of a discounted cash flow model is
also shown by the fact that more than 70% of the value of Novartis is generated by
continuing value. Thus WACC is extremely important and can cause significant change
in the present value of future cash flows and continuing value.
7.3.2 Multiples Analysis
Multiples analysis is often used to verify the results of the DCF analysis. In order to do
so Novartis is compared with its closest competitors and a peer group median. To
perform a multiples analysis the chosen companies that Novartis is compared with
should have similar capital structure, growth rates, risk and profitability. (Koller,
Goedhart and Wessels, 2005, pp.366-367). In practice however, this is very hard to do
and peer companies usually do not have the same characteristics as the company that
they should be compared with.
Nevertheless, a multiples analysis is conducted. Novartis is compared to its closest
competitors Pfizer and GlaxoSmithKline as well as to the median of a peer group
consisting of 15 peers, Novartis not included. The selected multiples are the forward
looking EV/Net sales, EV/EBITDA and EV/EBIT multiples. These multiples have the
advantage that they are not affected by capital structure unlike Price/Earnings multiples
which are commonly used (Koller, Goedhart and Wessels, 2005, p.369). Furthermore,
EV/EBITDA has the advantage over EV/EBIT that it is not influenced by differing

79 of 130
Table 15: Multiples Analysis
EV/Net Sales EV/Net Sales EV/EBITDA EV/EBITDA EV/EBIT EV/EBIT
2010e 2011e 2010e 2011e 2010e 2011e
Novartis homemade 7,8 7,38 22,1 20,97 25,99 24,6
Novartis 2,22 1,97 6,87 6,26 8,37 7,52
Pfizer 2,09 2,15 4,50 4,39 5,36 5,23
GSK 2,45 2,45 6,59 6,34 7,65 7,41
Peer Median 2,45 2,36 6,95 6,62 8,88 8,14
218% 213% 218% 217% 193% 202%
-9% -17% -1% -5% -6% -8%
39,04 40,07 38,94 39,31 43,47 41,81
Source: own design
Novartis homemade
vs. peer median
Novartis vs peer
group
stock price based on
peer median
depreciation practices that may vary from peer to peer. EV/EBITDA is also superior to
multiples based on sales because margins can vary significantly across peers making
comparison very difficult.
For conducting the multiples analysis professional forward looking estimates were used
(InFinancials, 2010).17 These are recommended by Koller, Goedhart and Wessels (2005,
pp.368-369) and Lui, Nissim and Thomas (2002, p.163) because they provide better
results and more accuracy than multiples based on historical data. In table 15 the results
from the multiples analysis are presented.
As can be seen, compared to its
direct competitor Pfizer, Novartis
usually trades at a premium
which is also partially true when
Novartis is compared to
GlaxoSmithKline (GSK) but
GSK is higher valued in terms of EV/Sales. The premium can be explained by the fact
that Novartis has an extremely successful pipeline which will launch many new
products in the coming years. Furthermore, Novartis has less products that face patent
expiration unlike major competitors such as Pfizer. Also noteworthy is the fact that
Novartis maintains a diversified healthcare product portfolio and thus is the only major
pharmaceutical company which also produces generic pharmaceuticals lowering the
volatility of revenue.
However, when compared to the median of industry peers Novartis is valued at a
discount between 1% and 17% which might be due to the patent expiration for Diovan
in 2011. Diovan is the top selling pharmaceutical of the company which generated
about 6 billion USD in sales in 2009. Based on the industry peer multiple the stock price
of Novartis should be priced somewhere in the region of $38,94 and $43,97 which is not
in accordance with the current market price and the multiple computed by the valuation
in this report and thus represents an undervaluation of Novartis. The big difference in
multiples obtained from professionals and the homemade ones can be attributed to
different expectations for the future performance of Novartis in terms of growth,
17
www.infinancials.com

80 of 130
profitability and pipeline success and portfolio rejuvenation. As a consequence,
operating value is estimated to be more valuable resulting in higher enterprise value.
In conclusion, it is determined that the multiples valuation is not of much additional
value for the valuation because Novartis has a more diversified product portfolio than
its competitors as well as different growth, profitability and pipeline expectations.
7.3.3 Plausibility Analysis
In this section the results that were obtained from the valuation are put into perspective
and discussed. As mentioned above the combined share price for Novartis is estimated
to be to be $151,83 and the large difference to the current share price of $50 is mainly
due to the large continuing value. Continuing value is estimated to be worth presently
$231 billion which is 77.6% of operating value. In order to explain the huge continuing
value the parameters selected for the calculation of the continuing value are discussed
and justified in the following.
The key parameters in the continuing value formula are NOPLAT growth, ROIC and
WACC. In order to find value for these parameters, market information as well as past
and forecasted performance were used as a basis. The WACC of Novartis, as a starting
point, is estimated to be low due to low current interest rates and a low beta. Novartis is
also rated highly by rating agencies, providing the company with a low default risk
spread. As a result the WACC of Novartis is estimated to be at 5,74%. With regard to
growth, NOPLAT growth is estimated to be 4%. This estimate is deemed reasonable
based on the fact that Novartis has in the past on average generated NOPLAT growth of
10% and the fact that the company is forecast grow NOPLAT until 2024 at 7% while
the market is expected to grow between 5% and 8%. Based on this data perpetual
growth of 4% is deemed reasonable. As far ROIC is concerned 9% is thought
reasonable because Novartis as an innovative pharmaceutical company is constantly
developing new drugs with patents and thus can sustain a ROIC higher than WACC. In
the past Novartis had proofed capable of generating high ROIC and for the future ROIC
is forecasted to remain stable at 9%. NOPLAT in 2025 is estimated to be $16,7 billion
generated by sales growth between 5% and 7% even though margins are expected to
shrink as a result of increased competition and political pressure to lower prices.
When these parameters, which at the present seem reasonable, are put into the
continuing value formula, a large continuing value, namely $231 billion, will be the

81 of 130
result leading to a very high value per share which is much higher than the current
market price. There are three reasons for that. First of all, NOPLAT in year 2025 is high
($16,7 bio.). Second, the ROIC estimate of 9% combined with the lower growth make it
possible that almost 56% of the perpetual NOPLAT has to be discounted. The last
reason for a big terminal value is the fact that WACC is fairly low, leading to a small
discount factor when 4% growth is subtracted. If one would reason now that the year
2025 NOPLAT estimate of $16,7 billion is too high, a perpetual NOPLAT of $10
billion of the 2007 level would result in share price almost twice as high as the current
market price of about $49 and thus would still be way off.
In a different and more result-oriented approach it was tried to select parameters that
yield a share value which is more in accordance with the current market price. Choosing
a growth rate of 8% and a ROIC of 7% would result in a share price around $60 per
share. But when the parameters are “fixed” this way than two problems are encountered:
first of all these inputs would be less realistic and second, the sensitivity analysis would
not move in the expected direction when parameters are changed.
With regard to the first problem, WACC and NOPLAT would stay the same but a
perpetual growth rate of 8% seems a little over confident because growth of Novartis
has been slowing down and the world pharmaceutical market is expected to grow only
between 5% and 8% until 2014. Furthermore, a ROIC of 7% seems a little too low
because Novartis has been able to generate a ROIC beyond 10% and is expected to
stabilize at 9% in 2025, the starting point of continuing value.
The second problem has to do with the growth rate being bigger than the WACC
resulting in a negative denominator. Usually, in a sensitivity analysis, lowering the
WACC would result in higher continuing value. However, in this special case, lowering
the WACC results in a bigger denominator, due to a higher growth rate. The same is
true for the growth rate. Increasing the growth rate should normally increase terminal
value but here the denominator would increase, leading to a lower terminal value.
Moreover, because the denominator is negative the ROIC input is restricted to being
lower than the growth rate so that the nominator is also negative. If this is not
considered than a negative terminal value will be the result. Therefore it seems that the
continuing value formula provides only good results if the WACC is bigger than the
growth rate. But because the goal of this report is to find the most realistic estimates the
approach using less realistic inputs to get a better share price was abandoned.

82 of 130
In conclusion it should be noted, that of $50,86 (53,45 CHF) seems to be undervalued.
Reason for this is the good global pharmaceutical market outlook and Novartis’
diversified product portfolio focused which is focused on growth areas in the
pharmaceutical industry. Moreover, Novartis has a very capable and promising drug
pipeline. Thus, many analysts carry Novartis with a “buy” recommendation and a share
price target of 63CHF to 70 CHF for 2010 (S Broker, 2010).
8 Conclusion
The aim of this report has been to analyze the past and future performance of Novartis
to estimate the company’s fair market value. Furthermore, the true NPV of a drug
development project was calculated using a real options valuation approach.
The analysis of the past performance of Novartis revealed that the company performed
well in the last ten years consistently increasing sales NOPLAT and cash flows. ROIC
however, decreased over the years due to significant increase in invested capital.
The external business environment analysis revealed that Novartis benefits from a
growing global pharmaceuticals market. Growth is caused by new emerging markets,
aging global population and more diseases caused by changing lifestyles. On the other
hand, governments put increasingly pressure on pharmaceutical companies to lower
prices and increase drug availability. In terms of sales and market share, Novartis is
currently one of the top five largest pharmaceuticals producers in the world with a
market share of about 5%.
From the internal analysis it can be concluded that Novartis has an attractive, diversified
and rejuvenated product portfolio with many recently launched new products that are
still in the introduction and growth phase, making Novartis less reliant on Diovan. It is
noteworthy that Novartis is the only major pharmaceuticals producer that also has the
capability to market generic drugs. This might become more important in the future as
governments around the world try to lower health care costs. The analysis also showed
that Novartis has considerable competitive advantage in key industry success factors
such as R&D, competent employees, financial strength, marketing and sales and
organizational efficiency. This is vital for Novartis to maintain its strategy of
developing new and effective drugs and while focusing on growth areas in the
pharmaceuticals industry.

83 of 130
With regard to Novartis’ cost of capital, the company’s WACC was estimated to be
5,74%. The WACC was calculated with a target capital structure of 10% debt and 90%
equity, an after-tax cost of debt of 2,99% and a cost of equity of 6,04%. The cost of
equity was calculated using a risk-free rate of 3,08%, an adjusted beta of 0,651 and a
market risk premium of 4,55%.
The future performance of Novartis was forecasted by using a discounted cash flow
model. Three different scenarios were employed to model possible external as well as
company specific risks that Novartis might have to face. The base case scenario resulted
in a value per share of $144,32. The worst case scenario projects value per share of
$50,86 while the best case scenario resulted in a value per share of $312,91. Probability
weighting the different scenarios resulted in a combined value per share of $151,83.
The sensitivity analysis revealed that the equity value of Novartis and thus its share
price is highly sensitive to changes in WACC and the parameters it is computed from,
especially beta and the risk free rate. Changing these parameters can cause changes in
equity value between plus 56% and minus 30%. Capital structure was found to have less
of an impact on equity value than the risk-free rate.
Verifying the results of the DCF analysis a multiples analysis was done which generated
the result that Novartis trades at a premium compared to Pfizer but at a discount
compared to GSK and an industry peer median. Based on the peer median multiple the
value per share of Novartis is about $40. According to the homemade multiples
Novartis trades at a premium of about 200% compared to the peer median multiples.
The big difference between the obtained Novartis multiples and the homemade ones is
attributable to different expectations about the future in terms of growth, profitability
and pipeline success.
As far as the valuation of the new drug development project for BAF312 is concerned, a
static NPV approach would suggest that the project is value destroying resulting in a
negative NPV of $1,88 mio.. However, when a real-options approach is employed,
considering flexibility, a true NPV of $11,15 mio. is calculated, suggesting the project
would create value. If Novartis decided to proceed with the project, the true NPV would
have to be added to equity value but would not have a significant impact on the share
price.

84 of 130
List of Literature
Barclay, M. J., & Smith, C. W. (2005). The Capital Structure Puzzle: The Evidence Revisited.
Journal of Applied Corporate Finance , Vol. 17, Iss.1, pp. 8-17.
Berk, J., & DeMarzo, P. (2007). Corporate Finance. Pearson Education Inc.
Bloomberg. (2010). Retrieved April 28, 2010, from German Government Bonds:
http://www.bloomberg.com/markets/rates-bonds/government-bonds/germany/
Brown, S., Goetzmann, W., & Ross, S. (1995, July). Survivorship Bias. Journal of Finance , pp.
853-873.
Castner, M., Hayes, J., & Shankle, D. (2007, April 15). Retrieved from The Global
Pharmaceutical Industry: http://www.duke.edu/web/soc142/team2/firms.html
Copeland, T., & Antikarov, V. (2001). Real Options, A Practitioner's Guide. New York (USA):
Texere LLC.
Damodaran, A. (2010, May 15th). Retrieved from Damodaran Online - updated data:
http://pages.stern.nyu.edu/~adamodar/
Damodaran, A. (2010). Retrieved from Damodaran Online - updated data - Ratings, Interest
coverage Ratios and default spread: http://pages.stern.nyu.edu/~adamodar/
Daves, P. E. (2000). Estimating Systematic Risk: The Choice of Return Interval. Journal of
Financial and Strategic Decisions , pp.7-13.
Decker, S. (2009, January 6). Retrieved from Pfizer Wins New Lipitor Patent Expiring in June
2011:
http://www.bloomberg.com/apps/news?pid=newsarchive&sid=aNSygEPe7QWw&refer=home
Dimson, E. M. (2003). Global Evidence on The Equity Risk Premium. Journal of Applied
Corporate Finance , 27-38.
Dimson, E., Marsh, P., & Staunton, M. (2003). Global Evidence on the Equity Risk Premium.
Journal of Applied Corporate Finance , pp. 27-38.
Dixit, A. K., & Pindyck, R. S. (June 1995). The Options Approach to Capital Investment. Harvard
Business Review , Vol. 73, Iss. 3, pp. 105-115.
Drummond, G., & Ensor, J. (2001). Strategic Marketing - Planning and Control 2nd Edition.
Elsevier Butterworth-Heinemann.
Eiteman, D. K., Stonehill, A., & Moffet, M. H. (2007). Multinational Business Finance. Pearson
Education Inc.
Glaxo-Smith-Kline. (2008). Annual Report 2007. Brentford (UK).
Glaxo-Smith-Kline. (2010). Annual Report 2009. Brentford (UK).
Goedhart, M. H. (2002). The Real Cost of Equity. McKinsey on Finance , pp. 11-15.
Grabowski, H., Vernon, J., & DiMasi, J. (2002). Returns on Research and Development for 1990s
New Drug Introductions. PharmacEconomics , pp. 11-30.

85 of 130
Hillier, D., Grinblatt, M., & Titman, S. (2008). Financial Markets and Corporate Strategy.
McGraw-Hill.
Hollensen, S. (2004). Global Marketing - A Decision-oriented Approach 3rd Edition. Prentice
Hall.
IMS-Health-Incorporated. (2010). Retrieved from Top Line Industry Data:
http://www.imshealth.com/portal/site/imshealth/menuitem.a46c6d4df3db4b3d88f61101941
8c22a/?vgnextoid=e599410b6c718210VgnVCM100000ed152ca2RCRD&cpsextcurrchannel=1
InFinancials. (2010, July). Retrieved from Valuation Multiples:
http://www.infinancials.com/en/financial%20ratio,Novartis%20AG,30033ES.html
Kellogg, D., & Charnes, J. M. (2000). Real-Options Valuation for a Biotechnology Company.
Financial Analysts Journal , Vol. 56, Iss. 3, pp.76-84.
Koller, T., Goedhart, M., & David, W. (2005). Valuation Measuring and Managing the Value of
Companies. Hoboken, New Jersey: John Wiley & Sons.
Lehman, B. (2003). The Pharmaceutical Industry and the Patent System. International
Intellectual Property Institute.
Luehrmann, T. A. (1998). Investment Opportunities as Real Options: Getting Started on the
Numbers. Harvard Business Review , Vol. 76, Iss.4, pp. 51-67.
Lui, J., Nissim, D., & Thomas, J. (2002). Equity Valuation Using Multiples. Journal of Accounting
Research , Vol. 40, Iss.1, pp. 135-172.
Lynch, R. (2006). Corporate Strategy 4th Edition. Prentice Hall.
Mun, J. ( 2007). Real Option Analysis: Tools and Techniques for Valuing Strategic Investments
and Decisions. John Wiley & Sons.
Novartis-International-AG. (2010, May). About Novartis. Retrieved from
http://www.novartis.com/about-novartis/index.shtml
Novartis-International-AG. (2002). Annual Report 2001. Basel (CH).
Novartis-International-AG. (2003). Annual Report 2002. Basel (CH).
Novartis-International-AG. (2004). Annual Report 2003. Basel (CH).
Novartis-International-AG. (2005). Annual Report 2004. Basel (CH).
Novartis-International-AG. (2006). Annual Report 2005. Basel (CH).
Novartis-International-AG. (2007). Annual Report 2006. Basel (CH).
Novartis-International-AG. (2007). Annual Report 2006. Basel (CH).
Novartis-International-AG. (2008). Annual Report 2007. Basel (CH).
Novartis-International-AG. (2009). Annual Report 2008. Basel (CH).
Novartis-International-AG. (2010). Annual Report 2009. Basel (CH).
Pfizer. (2008). 2007 Financial Report.

86 of 130
Pfizer. (2010). 2009 Financial Report.
Pfizer. (2010). Annual Review 2009.
Rheinische-Post. (2010, Februrary 18th). Retrieved from Rösler fordert Beitrag der
Pharmaindustrie: http://www.rp-online.de/politik/deutschland/Roesler-fordert-Beitrag-der-
Pharmaindustrie_aid_821926.html
Roche. (2008). Annual Report 2007.
Roche. (2010). Annual Report 2009.
S-Broker. (2010, August). Retrieved from NOVARTIS AG NAMENS-AKTIEN SF 0,50:
http://www.sbroker.de/sbl/wpapiere_handel/aktien_portrait_nae?IS_PARAMS=%26ID_OSI%3
D90609%26ID_EXCHANGE%3DPNK%26ID_NOTATION%3D9491964%26LANG%3Dde&ioContid=
2719
Schwartz, E., & Moon, M. (2000). Evaluating Research and Development Investments. In M.
Brennan, & L. Trigeorgis, Project Flexibility, Agency and Competition (pp. 85-106). Oxford
University Press.
Shockley, R. L. (2007). An Applied Course in Real Options Valuation. Thomson South-Western.
Stocks. (2010, January 4). Retrieved from KREDITRATING/Novartis: Moody's bestätigt "Aa2" -
senkt Ausblick auf "negative":
http://www.stocks.ch/nachricht/KREDITRATING_Novartis_Moody_s_bestaetigt_Aa2__senkt_A
usblick_auf_negative__37251
U.S.-Food-and-Drug-Administration. (2007, September 27). Retrieved from Renewed
Legislation Improves Safety of FDA-regulated Products:
http://www.fda.gov/ForConsumers/ConsumerUpdates/ucm061229.htm
U.S.-Food-and-Drug-Administration. (2009, September 2). Retrieved from Frequently Asked
Questions on Patents and Exclusivity:
http://www.fda.gov/Drugs/DevelopmentApprovalProcess/ucm079031.htm
Verbeek, M. (2008). A Guide to Modern Econometrics. Chichester (UK): John Wiley & Sons, Ltd.
Yahoo!-Inc. (2010). Retrieved from Bond Screener Results:
http://reports.finance.yahoo.com/z1?b=1&is=novartis&sf=y&so=d