A Validation Tool for Traffic Signs Recognition Systems
6
A Validation tool for Traffic Signs Recognition systems Daniele Marenco, Davide Fontana, Guido Ghisio, Gianluca Monchiero Magneti Marelli s.p.a.Electronic Systems Advanced Driver Assistance System I-10078 Venaria, Italy {daniele.marenco, davide.fontana, guido.ghisio, gianluca.monchiero}@mmarelli-se.com Elena Cardarelli, Paolo Medici, Pier Paolo Porta VisLab Dipartimento di ingegneria dell’Informazione Università di Parma I-43100 Parma, Italy {cardar,medici,porta}@vislab.it Abstract—During the last few years many Advanced Driver Assistant Systems have been developed and a larger number of new car models every year is going to be equipped with these systems. However the product/function scenario lacks of common evaluation methodologies and tools for testing and improving performances of these systems. In this paper a validation methodology and a tool for Traffic Sign Recognition Systems evaluation (TSRs) is described. Keywords: traffic sign recognition, performance evaluation, automatic report generator. I. INTRODUCTION Traffic Sign Recognition (TSR) as Advanced Driver Assistance System (ADAS) helps the driver detecting and classifying traffic signs that define dangers and limitations on roads. TSR systems can be distinguished in systems working on a traffic sign specific subset (e.g. speed limitation signs) [1], [2] and systems working on almost the complete set of signs ([3], [4], [5], [6], [7] the last two related with Italian and Spanish traffic signs). Even if the research community is very active on the topic of TSR, no wide accepted evaluation methodologies and tools have been developed yet. Sometimes the performance analysis are computed related to a specific TSR system under test which strongly biases the method [8]. Another item to be considered is the errors rising from the subjective evaluations. This paper will explain how the proposed tool (Validation tool for Traffic Sign Recognition system - VTSR) can be used for an objective evaluation of the TSR performances. One of the most important feature of the proposed system is the high flexibility: it can be used for all TSR, either grayscale or color camera based and can be customized to cope with the sign database of every country. The paper is structured as follows: in Section II the hardware and software architecture of VTSR is explained. In Section III how to manage real application is described; In Section IV some formulas about the statistics used are given. In Section V the tool’s performances are proposed in terms of timing parameters. In Section VI the next steps of VTSR development are depicted. Finally, in Section VII summary and conclusions are provided. II. VTSR DESCRIPTION To have an objective performance measures of traffic sign recognition systems, a methodology and a proper hardware / software have been studied and deployed. The architecture has been thought to have high flexibility and to avoid interferences with the TSR system under test as shown in Fig.1. Fig.1. Block Schematic of the VTSR Hardware Architecture The hardware structure is composed by: • a color camera module (e.g. a webcam) to monitor the road and the traffic signs encountered; • a GPS module to record the position of the signs; • a PC based system to get and process the information coming from the camera module and the other serial interfaces (using transceivers, CAN cards, etc…). Proceedings of the 12th International IEEE Conference on Intelligent Transportation Systems, St. Louis, MO, USA, October 3-7, 2009 TuBT2.3 426 978-1-4244-5521-8/09/$26.00 ©2009 IEEE Authorized licensed use limited to: Universita degli Studi di Parma. Downloaded on December 28, 2009 at 03:47 from IEEE Xplore. Restrictions apply.
Transcript of A Validation Tool for Traffic Signs Recognition Systems

A Validation tool for
Traffic Signs Recognition systems
Daniele Marenco, Davide Fontana, Guido Ghisio,
Gianluca Monchiero
Magneti Marelli s.p.a.Electronic Systems
Advanced Driver Assistance System
I-10078 Venaria, Italy
{daniele.marenco, davide.fontana, guido.ghisio,
gianluca.monchiero}@mmarelli-se.com
Elena Cardarelli, Paolo Medici, Pier Paolo Porta
VisLab
Dipartimento di ingegneria dell’Informazione
Università di Parma
I-43100 Parma, Italy
{cardar,medici,porta}@vislab.it
Abstract—During the last few years many Advanced Driver
Assistant Systems have been developed and a larger number of
new car models every year is going to be equipped with these
systems. However the product/function scenario lacks of common
evaluation methodologies and tools for testing and improving
performances of these systems. In this paper a validation
methodology and a tool for Traffic Sign Recognition Systems
evaluation (TSRs) is described.
Keywords: traffic sign recognition, performance evaluation,
automatic report generator.
I. INTRODUCTION
Traffic Sign Recognition (TSR) as Advanced Driver Assistance System (ADAS) helps the driver detecting and classifying traffic signs that define dangers and limitations on roads.
TSR systems can be distinguished in systems working on a traffic sign specific subset (e.g. speed limitation signs) [1], [2] and systems working on almost the complete set of signs ([3], [4], [5], [6], [7] the last two related with Italian and Spanish traffic signs).
Even if the research community is very active on the topic of TSR, no wide accepted evaluation methodologies and tools have been developed yet. Sometimes the performance analysis are computed related to a specific TSR system under test which strongly biases the method [8].
Another item to be considered is the errors rising from the subjective evaluations.
This paper will explain how the proposed tool (Validation tool for Traffic Sign Recognition system - VTSR) can be used for an objective evaluation of the TSR performances. One of the most important feature of the proposed system is the high flexibility: it can be used for all TSR, either grayscale or color camera based and can be customized to cope with the sign database of every country.
The paper is structured as follows: in Section II the hardware and software architecture of VTSR is explained. In Section III how to manage real application is described; In Section IV
some formulas about the statistics used are given. In Section V the tool’s performances are proposed in terms of timing parameters. In Section VI the next steps of VTSR development are depicted. Finally, in Section VII summary and conclusions are provided.
II. VTSR DESCRIPTION
To have an objective performance measures of traffic sign recognition systems, a methodology and a proper hardware / software have been studied and deployed.
The architecture has been thought to have high flexibility and to avoid interferences with the TSR system under test as shown in Fig.1.
Fig.1. Block Schematic of the VTSR Hardware Architecture
The hardware structure is composed by:
• a color camera module (e.g. a webcam) to monitor the road and the traffic signs encountered;
• a GPS module to record the position of the signs;
• a PC based system to get and process the information coming from the camera module and the other serial interfaces (using transceivers, CAN cards, etc…).
Proceedings of the 12th International IEEE Conferenceon Intelligent Transportation Systems, St. Louis, MO,USA, October 3-7, 2009
TuBT2.3
426978-1-4244-5521-8/09/$26.00 ©2009 IEEE
Authorized licensed use limited to: Universita degli Studi di Parma. Downloaded on December 28, 2009 at 03:47 from IEEE Xplore. Restrictions apply.

The validation process is mainly based on two different steps:
1. Data Capture;
2. Analysis.
The software architecture chosen to perform the above tasks is organized in the following structure:
1.A Mapping Traffic Sign on the Road Tool (MTSR);
1.B Data Capture Tool (DC);
2.A Performance Analyzer Tool (PA);
2.B Automatic Reports Generator Tool (ARG).
These tools are used in the order shown in Fig.2: first of all the traffic signs in a defined test route are mapped using MTSR Tool. This is the common base for the further analysis and has to be done only once. Then, for all test sessions to be done, on the same route, the DC Tool is used to capture data coming from the TSR systems under test, then the PA Tool is used to analyze the performances and finally the ARG Tool is used to automatically produce the general and specific statistics.
Fig.2. Operation flowchart
1.A Mapping Traffic Signs on the Road Tool
In order to have a common reference on which compare different TSR systems or different release of the same TSR system, a road signs database creation is needed. This tool uses a GPS module (NMEA Protocol [9]) for the database creation.
With the interface shown in Fig.3, it is possible to set data exchange with the GPS module and, using the data collected, to manually fix the presence and position of road signs.
Furthermore it is possible to add information and data (see section V) like Latitude (°, ‘, “), Longitude (°, ‘, “), Altitude
(m) (useful to avoid false alarms in steep roads with some traffic signs) and so on.
Fig.3. Mapping Traffic Signs on the Road Tool Interface
All the information collected in the previous description are stored for evaluation purpose in a specific file and can be exported, also for other applications (e.g. DOC format, …), like the one in Fig.4.
Fig.4. Generated Documentation by the Mapping Traffic Sign on the Road Tool
1.B Data Captured Tool
This tool allows the synchronous acquisition of the video stream coming from a camera as well as the data from the independent serial busses: this allows to capture data simultaneously from different traffic sign recognition systems.
An important key to ensure data coherence is to have a synchronous (in term of the different data sources) data capture
427
Authorized licensed use limited to: Universita degli Studi di Parma. Downloaded on December 28, 2009 at 03:47 from IEEE Xplore. Restrictions apply.

system; in the DC tool a link between the video stream coming from camera and the data coming from the TSR under test (available for example through a serial CAN interface) is present.
As shown in Fig.5, in a periodic task a single frame is captured and named with an up counting name: this is the common data time frame at witch the TSR result data are referred to and data buffers is empted.
All these information are reorganized following this logical structure in a specific file. This will guarantee the correct synchronization and storage of all the information coming from systems and devices.
Fig.5. Synchonous data capture – camera video and CAN busses
A first embodiment of the tool interface is shown in Fig.6. It is easy and user friendly and allows to monitor current activity status of the TSR system under test.
Fig.6. Data Capture Tool Interface
In order to identify each TSR system a specific ID is assigned..
2.A Performance Analyzer Tool
The PA Tool uses the information coming from the tools
used in the previous steps (MTSR and DC tools) to show to
the user the scenario captured in order to analyze it.
Unlike from the work of Schneiders [8], a more complete
classification of the traffic signs status has been defined and it
is summarized in Table 1.
TABLE1 ATTRIBUTES AND CLASSIFICATION OF THE TRAFFIC SIGNS
Hidden Not Hidden
Not Temporary Temporary
• TRUE
• MISSING
• FALSE
- MISMATCH
- NO SIGN
• TRUE
• MISSING
• FALSE
- MISMATCH
- NO SIGN
The target is to classify all the road signs in clusters like
the ones listed in Tab.1. Due to the experience coming from
TSR system developing and testing activities, the
classification reported could be considered exhaustive and
cover all the real situations.
Here follows a brief description of the classification
attributes:
• True: sign is present and TSR detects it correctly;
• Missing: sign is present and the TSR system doesn’t
detect it;
• False mismatch: the sign is confused with an other;
• False no sign: a sign not present in the scene is
detected;
These sign topologies can be classified as:
• Not Temporary: the sign is fixed;
• Temporary: the sign is mobile.
Finally, a further hierarchical classification is Not Hidden
or Hidden. A sign is defined Hidden if it is completely hidden
by something.
The user is supported in the validation of the TSR system
by an interface (shown in Fig.7) that allows a presentation of
the scene, of the collected data and of the validation data.
The user can compare both real situation and TSR results
using the different sections of the interface, that are:
• Real sign: shows the next road sign (database);
• Detected sign: shows the results of TSR system
under test;
• File Report: allows to manage the analysis and
the automatic report generation file;
• Validation status of sign: allows to define the
status of the signs detected;
428
Authorized licensed use limited to: Universita degli Studi di Parma. Downloaded on December 28, 2009 at 03:47 from IEEE Xplore. Restrictions apply.

• Video acquisition: shows the real scene captured;
Video control: offers the possibility to have a control on the
video and the related data information, more this control
allows to go in the significant points (frame) where the signs
has been detected by the TSR system.
Fig.7. Performance Analyzer Tool Interface
In case of false, missing or hidden sign, it is possible to define the mismatch sign or the real sign not recognized using the Validate Status of Sign section. Another field that allows the user to indicate both comments and take care of special cases (using one of the keywords of Table 2) is the field named Note.
Using one of this keyword it is possible to build up specific statistic on the special cases that could occur.
TABLE 2 THE KEYWORD FOR THE NOTE FIELD
Keyword Meaning
Multiple Multiple signalization on the same sign.
True Multiple
(#n False)
Multiple signalization on the True same sign
but #n notices are false.
Little Sign A sign smaller than standard dimension
Truck The TSR system has detected a speed limit on
the tail of a Truck.
Tail Light
A false positive has been detected.
The TSR system has recognized a tail light as
a sign.
Vehicle
A false positive has been detected.
The TSR system has recognized a part of a
vehicle as a sign.
Thing
A false positive has been detected.
The TSR system has recognized a thing
different to a car or a speed sign on the tail of
a truck as a sign.
This tool offers also high versatility, allowing to stop and restart the analysis using the save and load functions.
Furthermore the user can add his own keywords in order to have customized simplified statistic and report.
2.B Automatic Reports Generator Tool
The Automatic Report Generator Tool computes the generic and the specific statistics and produces the report files as follows:
• Generic Statistics on the Not Temporary and Not
Hidden Signs;
• Specific Statistics on different topologies such as
Temporary or Not Temporary - Hidden or Not
Hidden Sign, Multiple Sign, FALSE No Sign and
Little Sign.
An important feature of the tool is the automatic generation
of report files, in DOC format. In case of not hidden and not temporary signs also single sign specific statistics are generated (see Fig.8 and 9).
Fig.8. Example of the Statistic Table with the left dangerous curve
Fig.9. Example of the Statistic Table with the left dangerous intersection
If a false mismatch happens the report gives the information about the specific sign by which the mismatch occurs (Fig.8).
III. APPLICATION
One of the main purposes followed in the development of
the VTSR has been the capability to cope with a plurality of
TSR systems.
429
Authorized licensed use limited to: Universita degli Studi di Parma. Downloaded on December 28, 2009 at 03:47 from IEEE Xplore. Restrictions apply.
We have tested the VTSR by evaluating simultaneously two
different TSR systems. The first one is a color camera based
[6], traffic sign recognition system developed by Magneti
Marelli & Vislab (University of Parma), while the second one
is a greyscale camera based system.
The two TSR systems have different outputs, the first one a
serial RS232, the other one a CAN bus interface. The two
systems work with reference to different cluster of signs.
The VTSR overcomes these issues.
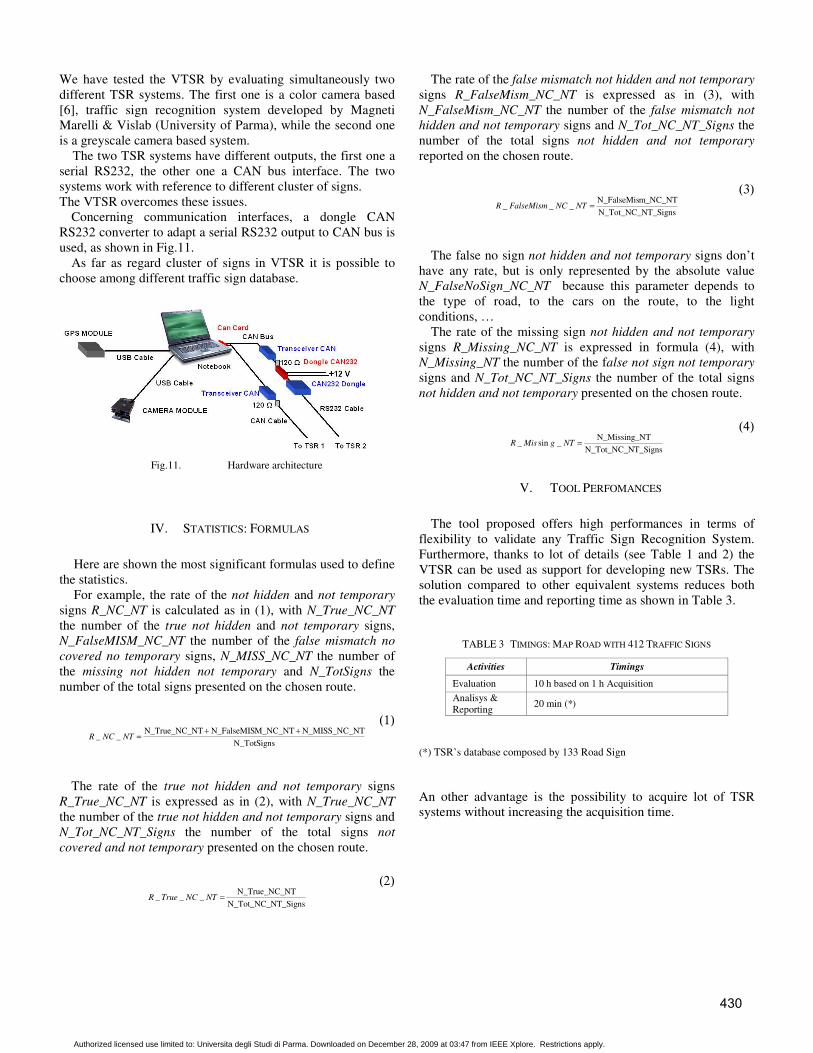
Concerning communication interfaces, a dongle CAN
RS232 converter to adapt a serial RS232 output to CAN bus is
used, as shown in Fig.11.
As far as regard cluster of signs in VTSR it is possible to
choose among different traffic sign database.
Fig.11. Hardware architecture
IV. STATISTICS: FORMULAS
Here are shown the most significant formulas used to define
the statistics.
For example, the rate of the not hidden and not temporary
signs R_NC_NT is calculated as in (1), with N_True_NC_NT
the number of the true not hidden and not temporary signs,
N_FalseMISM_NC_NT the number of the false mismatch no
covered no temporary signs, N_MISS_NC_NT the number of
the missing not hidden not temporary and N_TotSigns the
number of the total signs presented on the chosen route.
N_TotSigns
NTN_MISS_NC_M_NC_NTN_FalseMISNTN_True_NC___
++=NTNCR
(1)
The rate of the true not hidden and not temporary signs
R_True_NC_NT is expressed as in (2), with N_True_NC_NT
the number of the true not hidden and not temporary signs and
N_Tot_NC_NT_Signs the number of the total signs not
covered and not temporary presented on the chosen route.
T_SignsN_Tot_NC_N
NTN_True_NC____ =NTNCTrueR
(2)
The rate of the false mismatch not hidden and not temporary
signs R_FalseMism_NC_NT is expressed as in (3), with
N_FalseMism_NC_NT the number of the false mismatch not
hidden and not temporary signs and N_Tot_NC_NT_Signs the
number of the total signs not hidden and not temporary
reported on the chosen route.
T_SignsN_Tot_NC_N
m_NC_NTN_FalseMis___ =NTNCFalseMismR
(3)
The false no sign not hidden and not temporary signs don’t
have any rate, but is only represented by the absolute value
N_FalseNoSign_NC_NT because this parameter depends to
the type of road, to the cars on the route, to the light
conditions, …
The rate of the missing sign not hidden and not temporary
signs R_Missing_NC_NT is expressed in formula (4), with
N_Missing_NT the number of the false not sign not temporary
signs and N_Tot_NC_NT_Signs the number of the total signs
not hidden and not temporary presented on the chosen route.
T_SignsN_Tot_NC_N
NTN_Missing__sin_ =NTgMisR
(4)
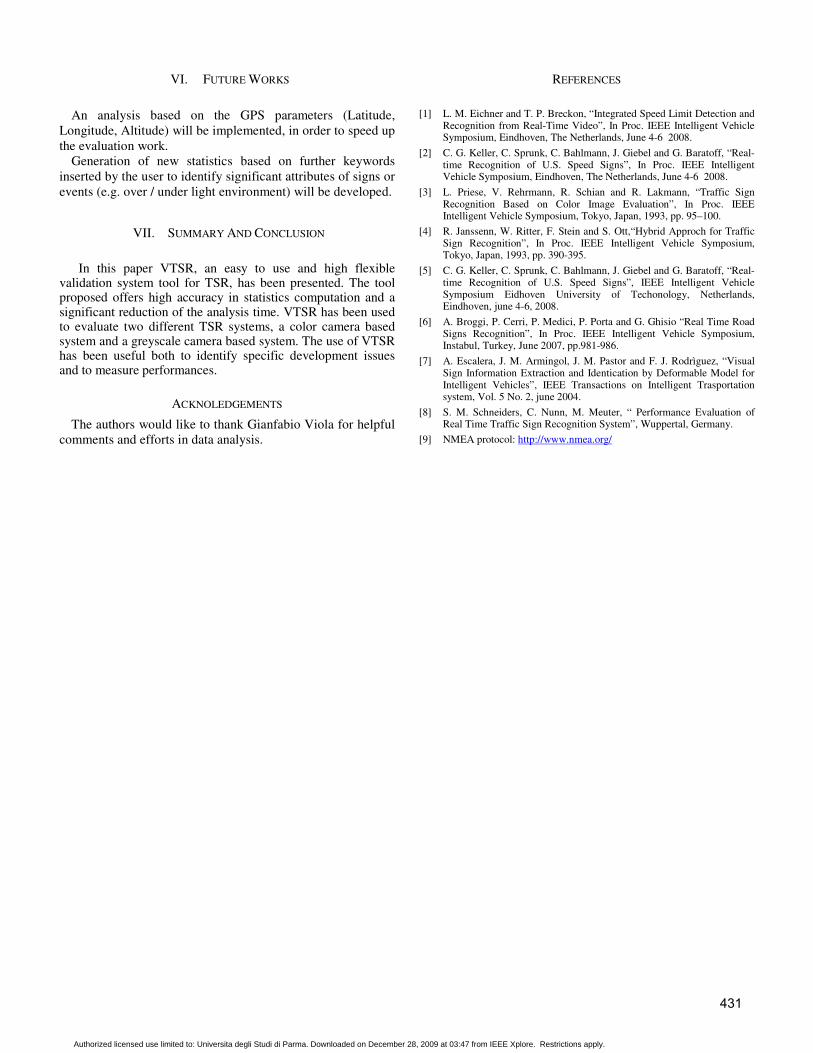
V. TOOL PERFOMANCES
The tool proposed offers high performances in terms of
flexibility to validate any Traffic Sign Recognition System.
Furthermore, thanks to lot of details (see Table 1 and 2) the
VTSR can be used as support for developing new TSRs. The
solution compared to other equivalent systems reduces both
the evaluation time and reporting time as shown in Table 3.
TABLE 3 TIMINGS: MAP ROAD WITH 412 TRAFFIC SIGNS
Activities Timings
Evaluation 10 h based on 1 h Acquisition
Analisys &
Reporting 20 min (*)
(*) TSR’s database composed by 133 Road Sign
An other advantage is the possibility to acquire lot of TSR
systems without increasing the acquisition time.
430
Authorized licensed use limited to: Universita degli Studi di Parma. Downloaded on December 28, 2009 at 03:47 from IEEE Xplore. Restrictions apply.
VI. FUTURE WORKS
An analysis based on the GPS parameters (Latitude,
Longitude, Altitude) will be implemented, in order to speed up
the evaluation work.
Generation of new statistics based on further keywords
inserted by the user to identify significant attributes of signs or
events (e.g. over / under light environment) will be developed.
VII. SUMMARY AND CONCLUSION
In this paper VTSR, an easy to use and high flexible
validation system tool for TSR, has been presented. The tool proposed offers high accuracy in statistics computation and a significant reduction of the analysis time. VTSR has been used to evaluate two different TSR systems, a color camera based system and a greyscale camera based system. The use of VTSR has been useful both to identify specific development issues and to measure performances.
ACKNOLEDGEMENTS
The authors would like to thank Gianfabio Viola for helpful
comments and efforts in data analysis.
REFERENCES
[1] L. M. Eichner and T. P. Breckon, “Integrated Speed Limit Detection and
Recognition from Real-Time Video”, In Proc. IEEE Intelligent Vehicle Symposium, Eindhoven, The Netherlands, June 4-6 2008.
[2] C. G. Keller, C. Sprunk, C. Bahlmann, J. Giebel and G. Baratoff, “Real-time Recognition of U.S. Speed Signs”, In Proc. IEEE Intelligent Vehicle Symposium, Eindhoven, The Netherlands, June 4-6 2008.
[3] L. Priese, V. Rehrmann, R. Schian and R. Lakmann, “Traffic Sign Recognition Based on Color Image Evaluation”, In Proc. IEEE Intelligent Vehicle Symposium, Tokyo, Japan, 1993, pp. 95–100.
[4] R. Janssenn, W. Ritter, F. Stein and S. Ott,“Hybrid Approch for Traffic Sign Recognition”, In Proc. IEEE Intelligent Vehicle Symposium, Tokyo, Japan, 1993, pp. 390-395.
[5] C. G. Keller, C. Sprunk, C. Bahlmann, J. Giebel and G. Baratoff, “Real-time Recognition of U.S. Speed Signs”, IEEE Intelligent Vehicle Symposium Eidhoven University of Techonology, Netherlands, Eindhoven, june 4-6, 2008.
[6] A. Broggi, P. Cerri, P. Medici, P. Porta and G. Ghisio “Real Time Road Signs Recognition”, In Proc. IEEE Intelligent Vehicle Symposium, Instabul, Turkey, June 2007, pp.981-986.
[7] A. Escalera, J. M. Armingol, J. M. Pastor and F. J. Rodrìguez, “Visual Sign Information Extraction and Identication by Deformable Model for Intelligent Vehicles”, IEEE Transactions on Intelligent Trasportation system, Vol. 5 No. 2, june 2004.
[8] S. M. Schneiders, C. Nunn, M. Meuter, “ Performance Evaluation of Real Time Traffic Sign Recognition System”, Wuppertal, Germany.
[9] NMEA protocol: http://www.nmea.org/
431
Authorized licensed use limited to: Universita degli Studi di Parma. Downloaded on December 28, 2009 at 03:47 from IEEE Xplore. Restrictions apply.