A validation of an operational wave and surge prediction ... · A validation of an operational wave...
12
Nat. Hazards Earth Syst. Sci., 15, 1231–1242, 2015 www.nat-hazards-earth-syst-sci.net/15/1231/2015/ doi:10.5194/nhess-15-1231-2015 © Author(s) 2015. CC Attribution 3.0 License. A validation of an operational wave and surge prediction system for the Dutch coast L. Sembiring 1,2 , M. van Ormondt 2 , A. van Dongeren 2 , and D. Roelvink 1,2 1 UNESCO-IHE Institute for Water Education, Delft, the Netherlands 2 Deltares, Delft, the Netherlands Correspondence to: L. Sembiring ([email protected]) Received: 12 March 2014 – Published in Nat. Hazards Earth Syst. Sci. Discuss.: 9 May 2014 Revised: 21 May 2015 – Accepted: 22 May 2015 – Published: 16 June 2015 Abstract. Knowledge of the actual condition of hydrody- namics in the nearshore and coastal area is essential for coastal monitoring activities. To this end, a coastal opera- tional model system can serve as a tool in providing re- cent and up-to-date, state-of-the-art hydrodynamics along the coast. In this paper, we apply CoSMoS (Coastal Storm Mod- eling System), a generic operational wave and tide-surge modelling system applied here to predict waves and water levels along the Dutch coast. The CoSMoS application is not limited to storm impact prediction on the Dutch coast, but can also be applied to other coastal hazards such as rip currents and coastal flooding, in other environments. In this paper, we present the set-up of the CoSMoS system and a validation of the wave and surge model, with deep-water wave buoy data and tidal gauge measurements as ground truth validation ma- terial. The evaluation is presented as monthly error measures between computed parameters and observed ones. Hindcast results over the whole year of 2009 show that the simulated wave parameters and surge elevation from the CoSMoS are in good agreement with data, with average root mean square (rms) error over the year of 0.14 m for the surge elevation and 0.24 m for the significant wave height. It is noted that there is a tendency of the wave model to underestimate the height of northerly waves with lower frequencies (swell). Addition- ally, when a wave separation algorithm is applied on the over- all spectrum, results show consistent underestimation of the swell component by the model, which for the Dutch coast will mainly come from the north, where the North Sea is open to the Atlantic Ocean. In the proposed model system, the swell boundary can have a significant effect on the simu- lated wave results, suggesting room for improvement for the swell boundary conditions to the north and the swell propa- gation within the Dutch Continental Shelf Model. Finally, we show that in forecast mode, CoSMoS can provide reasonably good wave and surge prediction. 1 Introduction Knowledge of the actual condition of nearshore and coastal hydrodynamics is an essential point in coastal risk manage- ment and monitoring activities. Using this knowledge, the risk of coastal hazards, such as coastal inundation, beach and dune erosion, and rip currents can be predicted and mitigated. To this end, a coastal operational model system can serve as a key tool in providing recent and up-to-date information about the hydrodynamic and morphodynamic state of the coast. Output from such a model system can be valuable for coastal stake holders and decision makers. In this paper, we present validation results of CoSMoS (Coastal Storm Modeling Sys- tem; Baart et al., 2009; Barnard et al., 2009; Van Ormondt et al., 2012), an operational coupled wave and tide-surge mod- elling system. The CoSMoS model system is generic, and its application is not limited to storm events, but can also be used for daily condition applications such as operational workable weather forecast for marine and offshore industry, as well as for rip-current predictions for swimmer safety application. Nowadays, many models are already available with which coastal processes and circulation can be simulated (Stelling, 1984; Van Dongeren et al., 1994; Wei et al., 1995; Roelvink et al., 2009). Model systems like CoSMoS can provide such coastal models with boundary information from larger area models in an efficient way and with low logistical efforts. In addition, meteorological data as input for CoSMoS can Published by Copernicus Publications on behalf of the European Geosciences Union.
-
Upload
truongngoc -
Category
Documents
-
view
214 -
download
0
Transcript of A validation of an operational wave and surge prediction ... · A validation of an operational wave...

Nat. Hazards Earth Syst. Sci., 15, 1231–1242, 2015
www.nat-hazards-earth-syst-sci.net/15/1231/2015/
doi:10.5194/nhess-15-1231-2015
© Author(s) 2015. CC Attribution 3.0 License.
A validation of an operational wave and surge prediction system for
the Dutch coast
L. Sembiring1,2, M. van Ormondt2, A. van Dongeren2, and D. Roelvink1,2
1UNESCO-IHE Institute for Water Education, Delft, the Netherlands2Deltares, Delft, the Netherlands
Correspondence to: L. Sembiring ([email protected])
Received: 12 March 2014 – Published in Nat. Hazards Earth Syst. Sci. Discuss.: 9 May 2014
Revised: 21 May 2015 – Accepted: 22 May 2015 – Published: 16 June 2015
Abstract. Knowledge of the actual condition of hydrody-
namics in the nearshore and coastal area is essential for
coastal monitoring activities. To this end, a coastal opera-
tional model system can serve as a tool in providing re-
cent and up-to-date, state-of-the-art hydrodynamics along the
coast. In this paper, we apply CoSMoS (Coastal Storm Mod-
eling System), a generic operational wave and tide-surge
modelling system applied here to predict waves and water
levels along the Dutch coast. The CoSMoS application is not
limited to storm impact prediction on the Dutch coast, but can
also be applied to other coastal hazards such as rip currents
and coastal flooding, in other environments. In this paper, we
present the set-up of the CoSMoS system and a validation of
the wave and surge model, with deep-water wave buoy data
and tidal gauge measurements as ground truth validation ma-
terial. The evaluation is presented as monthly error measures
between computed parameters and observed ones. Hindcast
results over the whole year of 2009 show that the simulated
wave parameters and surge elevation from the CoSMoS are
in good agreement with data, with average root mean square
(rms) error over the year of 0.14 m for the surge elevation and
0.24 m for the significant wave height. It is noted that there
is a tendency of the wave model to underestimate the height
of northerly waves with lower frequencies (swell). Addition-
ally, when a wave separation algorithm is applied on the over-
all spectrum, results show consistent underestimation of the
swell component by the model, which for the Dutch coast
will mainly come from the north, where the North Sea is
open to the Atlantic Ocean. In the proposed model system,
the swell boundary can have a significant effect on the simu-
lated wave results, suggesting room for improvement for the
swell boundary conditions to the north and the swell propa-
gation within the Dutch Continental Shelf Model. Finally, we
show that in forecast mode, CoSMoS can provide reasonably
good wave and surge prediction.
1 Introduction
Knowledge of the actual condition of nearshore and coastal
hydrodynamics is an essential point in coastal risk manage-
ment and monitoring activities. Using this knowledge, the
risk of coastal hazards, such as coastal inundation, beach and
dune erosion, and rip currents can be predicted and mitigated.
To this end, a coastal operational model system can serve as a
key tool in providing recent and up-to-date information about
the hydrodynamic and morphodynamic state of the coast.
Output from such a model system can be valuable for coastal
stake holders and decision makers. In this paper, we present
validation results of CoSMoS (Coastal Storm Modeling Sys-
tem; Baart et al., 2009; Barnard et al., 2009; Van Ormondt et
al., 2012), an operational coupled wave and tide-surge mod-
elling system. The CoSMoS model system is generic, and its
application is not limited to storm events, but can also be used
for daily condition applications such as operational workable
weather forecast for marine and offshore industry, as well as
for rip-current predictions for swimmer safety application.
Nowadays, many models are already available with which
coastal processes and circulation can be simulated (Stelling,
1984; Van Dongeren et al., 1994; Wei et al., 1995; Roelvink
et al., 2009). Model systems like CoSMoS can provide such
coastal models with boundary information from larger area
models in an efficient way and with low logistical efforts.
In addition, meteorological data as input for CoSMoS can
Published by Copernicus Publications on behalf of the European Geosciences Union.

1232 L. Sembiring et al.: A validation of an operational wave and surge prediction system for the Dutch coast
Table 1. List of variables used in the paper.
Variable Description Unit
erms Root mean square error m (wave height)
s (wave period)
enorm Normalized root mean square error –
CC Circular correlation –
CB Circular bias degree
R Mean resultant vector of the plane component (directional data) –
E Variance density spectrum m2 Hz−1
θ Wave direction degree
f Wave frequency Hz
Hs,Hm0 Wave height m
Tp Peak wave period second
σ Directional width of the wave spectrum (Gaussian function) degree
fc Critical frequency between swell and wind sea energy Hz
δ Angle between wind sea and swell degree
U Wind speed ms−1
α Constant in wave separation algorithm –
Table 2. Model set-up for DCSM
SWAN Delft3D Flow
Grid size ∼15× 20 km2∼7.5× 10 km2
Open boundary WAVEWATCH III Global Tide model TPX072
Meteo input HIRLAM HIRLAM
Source term:
Wind growth
Whitecapping
Bottom friction
Depth-induced breaking
Westhuysen et al. (2007)
Westhuysen et al. (2007)
JONSWAP
(Hasselman et al., 1973)
Battjes and Janssen (1978)
–
be obtained from well-established meteorological models,
most of which are run in operational mode, e.g. GFS (Global
Forecast System, operated by National Oceanic and Atmo-
spheric Administration, USA), HIRLAM (High-resolution
limited area model; Unden et al., 2002), and ECMWF (Eu-
ropean centre for medium-range weather forecast; Janssen et
al., 1997).
Application of such model systems for wave forecasting
has been demonstrated previously. On a global scale, Han-
son et al. (2009) presented a skill assessment of three differ-
ent regional wave models: WAM (Gunther, 2002), WAVE-
WATCH III (Tolman, 2009), and WAVAD (Resio and Perrie,
1989). They performed multi-decadal hindcasts for the Pa-
cific Ocean, and found that in general, all three models show
good skill, with WAVEWATCH III performing slightly bet-
ter than the other two. For semi-enclosed basin scale mod-
elling, some studies show that wave conditions can be well
simulated in serious storm events (Mazarakis et al., 2012;
Bertotti et al., 2011; Bertotti and Cavaleri, 2009; Cherneva
et al., 2008). However, the quality of the wave model de-
creases substantially when the wind condition shows strong
temporal and spatial gradients. This is particularly true for
Table 3. Model version and parameter settings.
SWAN, model version 4072
Source term Value
Whitecapping; Westhuysen et al. (2007)
BR (threshold saturation level)
C′ds
(proportionality coefficient)
0.00175
0.00005
Bottom friction; Hasselman et al. (1973)
C(bottom friction coefficient)
0.067 m2s−3
Depth-induced breaking;
Battjes and Janssen (1978)
Gamma (breaker parameter)
Alpha (dissipation coefficient)
0.73
1.0
DELFT 3D FLOW, model version 4.01
Bed roughness Chezy coefficient 90 m1/2 s−1
Wind drag coefficient A, B, C
(see Delft3D User Manual)
0.00063,
0.00723,
0.00723
Nat. Hazards Earth Syst. Sci., 15, 1231–1242, 2015 www.nat-hazards-earth-syst-sci.net/15/1231/2015/
L. Sembiring et al.: A validation of an operational wave and surge prediction system for the Dutch coast 1233
enclosed basins where an underestimation of wind speed
by the atmospheric model is often found (Ponce de Leon
and Soares, 2008; Cavaleri and Bertotti, 2004, 2006). In ad-
dition, wave models are very sensitive to small variations
within the wind fields which act as forcing input (Bertotti
and Cavaleri, 2009). Moreover, Cherneva et al. (2008) re-
ported an underestimation by the WAM Cycle 4 model of
significant wave heights in the case of low wind energy input
and during combined swell-wind wave conditions. In con-
trast, the model shows relatively better performance for the
case of high energy input. For the North Sea area, Behrens
and Gunther (2009) demonstrated that the WAM model that
covers the North Sea and Baltic Sea was capable to pro-
vide a forecast 2 days ahead of the winter storms Britta and
Kyrill in 2006 with satisfactory results. As improvements to
the model, they suggest further development on the atmo-
spheric model (developed by the German Weather Service).
In addition to that, the model does not take into account
depth-induced wave breaking as one of the source terms in
the model equation, which is a required further improvement
necessary for a nearshore prediction system (Behrens and
Gunther, 2009). The application of model systems for storm
surge and tide prediction has also been demonstrated. For the
Netherlands, Verlaan et al. (2005) make use of the hydrody-
namic model, DCSM (Dutch Continental Shelf Model; Ger-
ritsen et al., 1995) and forced it using meteorological model
HIRLAM, to provide tide and storm surge forecasts. More-
over, they implemented an update to the Kalman filter config-
uration to improve quality of forecast, initially implemented
by Heemink and Kloosterhuis (1990). This approach now
has been applied in the operational prediction system Delft-
FEWS (Delft – Flood Early Warning System; Werner et al.,
2013), which has flexibility in integrating different models
and data in a comprehensive way to provide forecast infor-
mation. Specifically for coastal forecasting, De Kleermaeker
et al. (2012) present an operational model system for the
Dutch coast under the framework of the FEWS system, com-
bining data from different sources to provide a reliable fore-
cast. They use the hydrodynamic model of Delft3D-FLOW
to compute tides and surge and SWAN (Booij et al., 1999) for
the waves. Preliminary results from the model system give a
wave height bias of 10 % and rms error of 3.7 cm for the wa-
ter levels.
Coupling wave and tide-surge modelling has been found
to be an important key to improve prediction skill of water
level and waves (Brown and Wolf, 2009; Wolf, 2009). Appli-
cation of this coupling approach for the Mediterranean Sea
using a 3-D finite element hydrodynamic model SHYFEM
shows that the modelling system Kassandra predicts water
level and wave height very well, with the rms error range
of ∼4 until 8 cm and ∼22 until 33 cm for total water level
and wave height, respectively (Ferrarin et al., 2013). A simi-
lar approach has also been implemented for the Irish Sea by
Brown et al. (2010), where they use the one-way nested ap-
proach of the North Atlantic model and the Irish Sea region.
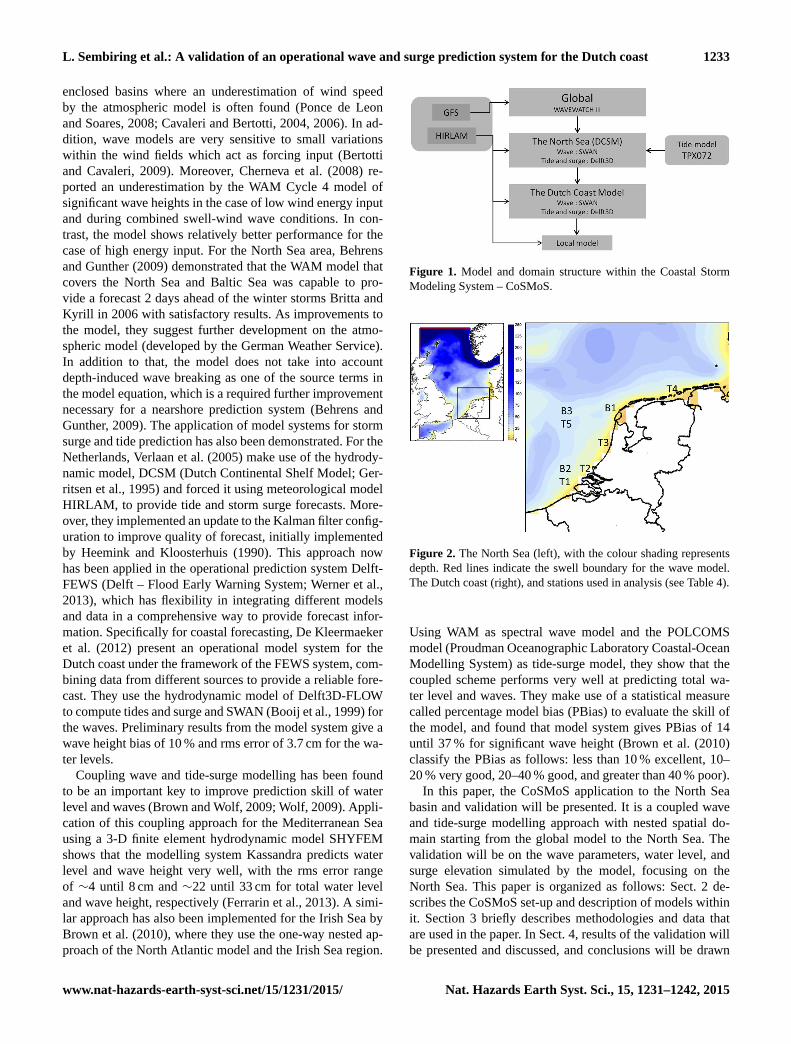
Figure 1. Model and domain structure within the Coastal Storm
Modeling System – CoSMoS.
Figure 2. The North Sea (left), with the colour shading represents
depth. Red lines indicate the swell boundary for the wave model.
The Dutch coast (right), and stations used in analysis (see Table 4).
Using WAM as spectral wave model and the POLCOMS
model (Proudman Oceanographic Laboratory Coastal-Ocean
Modelling System) as tide-surge model, they show that the
coupled scheme performs very well at predicting total wa-
ter level and waves. They make use of a statistical measure
called percentage model bias (PBias) to evaluate the skill of
the model, and found that model system gives PBias of 14
until 37 % for significant wave height (Brown et al. (2010)
classify the PBias as follows: less than 10 % excellent, 10–
20 % very good, 20–40 % good, and greater than 40 % poor).
In this paper, the CoSMoS application to the North Sea
basin and validation will be presented. It is a coupled wave
and tide-surge modelling approach with nested spatial do-
main starting from the global model to the North Sea. The
validation will be on the wave parameters, water level, and
surge elevation simulated by the model, focusing on the
North Sea. This paper is organized as follows: Sect. 2 de-
scribes the CoSMoS set-up and description of models within
it. Section 3 briefly describes methodologies and data that
are used in the paper. In Sect. 4, results of the validation will
be presented and discussed, and conclusions will be drawn
www.nat-hazards-earth-syst-sci.net/15/1231/2015/ Nat. Hazards Earth Syst. Sci., 15, 1231–1242, 2015

1234 L. Sembiring et al.: A validation of an operational wave and surge prediction system for the Dutch coast
in Sect. 5. A list of variables used in the paper are shown in
Table 1.
2 The CoSMoS model system
The CoSMoS system is set up for the North Sea basin, where
regional wave and tide-surge models are integrated with local
(high-resolution) models (Baart et al., 2009; van Ormondt et
al., 2012). The model and domain structure of CoSMoS ap-
pears in Fig. 1. For the global model, Wave Watch III (WW3
henceforth) is used and forced by a 6-hourly GFS meteo
model, with a resolution of 1 ◦× 1.25◦. This global model
generates 2-D wave spectra as output and will be used as
swell boundary conditions for the nested models, as indicated
in Fig. 1 by the arrows.
The next nested model is the Dutch Continental Shelf
Model (DCSM), which comprises the wave model SWAN
and the tide-surge model Delft3D-FLOW. The spatial res-
olution of the surge model is approximately 7.5× 10 km,
while the resolution of the wave model is approximately
15× 20 km. The surge model is driven by meteo data from
HIRLAM, which are 3-hourly data with approximately 9 x
14 km resolution. In addition, amplitude and phase of several
relevant tidal constituents are assigned using the tide model
TPX072 (Egbert and Erofeeva, 2002). The SWAN model is
forced by wind field from HIRLAM and the swell boundary
conditions (area indicated by red lines in Fig. 2) are obtained
from the global WW3 model. The models are run simulta-
neously, allowing for wave and tide-surge interactions. The
model set-up of the DCSM model within CoSMoS is summa-
rized in Table 2, and model version as well as the parameter
settings used in the model are presented in Table 3. For the
wave model, whitecapping is modelled based on Westhuysen
et al. (2007), the bottom friction formula is from Hasselman
et al. (1973), and the depth-induced breaking model is from
Battjes and Janssen (1978). For the Delft3D FLOW model,
uniform bed roughness coefficient is used, and wind drag co-
efficient is determined by a linear function of three break
points and the corresponding wind speed (Delft3D FLOW
User Manual). In this paper, The Dutch coast model and the
local model will not be part of the analysis as we will focus
on the application of CoSMoS for the North Sea.
The system is designed in a MATLAB platform, where the
initiation and operational run are performed every 12 hours,
and managed by the so-called timer loop. There are two timer
loops in the system that dictates the operational run. First,
the main loop, which defines the starting time and end time
of model run, triggers the overall initiation of the system, and
downloads necessary wind and air pressure data to be used by
the models. The second time loop is the model loop, in which
model runs will be executed in sequence, starting from global
and regional models followed by higher-resolution models.
Downloaded forcing data and simulation results from the
models are stored on a local OPeNDAP server (OPeNDAP:
Open-source Project for a Network Data Access Protocol;
Cornillon et al., 2003).
3 Data and method
The validation is carried out by comparing simulated param-
eters obtained from the model with the observed ones as
ground truth. Statistical error measures are used to quantify
the error between simulated and observed data. Here, root
mean square error (erms error), bias, and normalized error
(enorm) are used. The expressions are as follows:
erms =
[1
N
N∑i=1
(xi − yi)2
] 12
(1)
bias=1
N
N∑i=1
xi −1
N
N∑i=1
yi (2)
enorm =
[1N
N∑i=1
[(xi − x)− (yi − y)
]2] 12
y. (3)
In Eqs. (1)–(3), N is the length of the time series parameter,
x and y are simulated and observed parameter respectively,
x and y are mean value of x and y respectively. For direc-
tional data, circular correlation and circular bias are used as
statistical error measures. The circular bias is defined by sub-
tracting the mean angular of the computed parameter from
the mean angular of the observed. Here, the mean angular
is computed by transforming the directional data into two
vector components with magnitude of unity, and then taking
the four quadrant inverse tangent of the resultant of the vec-
tors as the mean angular (Berens, 2009). Circular correlation
is computed by defining correlation coefficient of the direc-
tional data by also making use of the mean angular measures.
Circular correlation (CC) and circular bias (CB) are defined
as follows (Berens, 2009; Fisher, 1996):
CC=
N∑i=1
sin(xi − x)sin(yi − y)√N∑i=1
sin2(xi − x)sin2(yi − y)
(4)
CB= x− y (5)
x = arctan(R) (6)
R =1
N
N∑i=1
[cos(mi)
sin(ni)
]. (7)
In Eqs. (4)–(7), x and y are the mean angular of simulated
and observed parameter respectively, (m, n) is the plane com-
ponent of the directional data (unit vector), and R is the mean
resultant vector.
Nat. Hazards Earth Syst. Sci., 15, 1231–1242, 2015 www.nat-hazards-earth-syst-sci.net/15/1231/2015/

L. Sembiring et al.: A validation of an operational wave and surge prediction system for the Dutch coast 1235
Table 4. Stations used in validation.
Station Name Abbreviation in this paper Type
B1 Eierlandse Gat EIELSGT Directional wave buoy
B2 Euro platform EURPFM Directional wave buoy
B3 K13 platform K13APFM Directional wave buoy
T1 Euro platform EUR Tidal gauge
T2 Hoek van Holland HvH Tidal gauge
T3 IJmuiden IJM Tidal gauge
T4 Huibergat HUI Tidal gauge
T5 K13 platform K13 Tidal gauge
Figure 3. Water elevation for IJmuiden (IJM) during the storm in
November 2009: blue – observed water level; green – computed
water level; black – observed surge; red – computed surge; grey –
astronomical prediction.
Figure 4. Monthly rms error (left) and bias (right) of surge eleva-
tion.
As the ground truth, data from deep-water directional
wave buoys and tidal gauge record are used, of stations lo-
cated near the Dutch coast. A total of three wave buoys
are considered: Eierlandse Gat (EIELSGT), K13 Platform
(K13APFM), and Euro Platform (EURPFM). For water lev-
els, five gauges are used: Euro platform, Hoek van Holland,
IJmuiden, Huibertgat, and K13 platform (Table 4 and Fig. 2).
Data obtained from the buoys are processed, stored and re-
trievable as wave energy density, mean wave direction, and
directional spreading as function of frequency, rather than the
full 2-D spectra. Therefore, quasi 2-D wave energy spectrum
is constructed using the following expressions:
E(f,θ)= E(f ) ·D(θ,f ), (8)
where E(f,O) is the wave energy as a function of frequency
and direction and D is directional spreading. Since∫ ∫E(f,θ)df dθ =
∫E(f )df ; (9)
therefore,∫D(θ,f )dθ = 1. (10)
For the directional spreading, a normal distribution function
is used:
D(θ,f )=1
σ√
2πexp
[[θ − θ0(f )
]22σ(f )2
], (11)
whereO0(f ) is mean direction as function of frequency, σ is
directional spreading as function of frequency, and O is the
running wave direction. Here we have to keep in mind that
the shape of the directional spreading function is assumed
to be Gaussian, and directional bimodality is not significant
over the period of the data (Longuet-Higgins et al., 1963;
Wenneker and Smale, 2013).
Since the wave model SWAN returns output as 2-D wave
spectra as well, consistent parameter definitions can be used
for both simulated and observed data. The integral wave pa-
rameters then will be calculated as follows:
Hm0 = 4
√∫ ∫E(f,θ)df dθ (12)
Tp =1
fp. (13)
For the mean wave direction, formula from Kuik et al. (1988)
is used:
θmean = arctan
[ ∫ ∫sinθE(f,θ)df dθ∫ ∫cosθE(f,θ)df dθ
]. (14)
www.nat-hazards-earth-syst-sci.net/15/1231/2015/ Nat. Hazards Earth Syst. Sci., 15, 1231–1242, 2015

1236 L. Sembiring et al.: A validation of an operational wave and surge prediction system for the Dutch coast
Figure 5. Tidal amplitude comparison for six tidal constituents:
black – observation; red – computed.
Figure 6. Tidal phase comparison for six tidal constituents: black –
observation; red – computed.
For analysis purposes, in addition to bulk wave parameters,
wind sea and swell components will also be computed. To
this end, an algorithm will be applied on the total wave spec-
trum to differentiate between energy that belongs to wind
sea and swell. The algorithm will largely follow Portilla et
al. (2009) and Hanson et al. (2009). Here, for simplification
we make an assumption that the total energy content in the
spectrum only consists of one system of wind sea and one
system of swell. The demarcation line between sea and swell
is defined as follows:
fc =g
2π[αU cos(δ)]−1 (15)
0≤ δ ≤π
2, (16)
where fc is the critical frequency, α is a constant, U is wind
speed, and δ is the angle between wind sea and the wind.
Energy content above this line will be counted as wind sea
spectrum while below it is swell. The calibration parameter
α of 1.8 is used.
Figure 7. Time series of wave parameters: blue – model results;
red circles – observations. Wave height (upper panel), peak period
(middle), and mean wave direction (lower). Location: K13 platform.
4 Results and discussion
4.1 Hindcast
A hindcast was performed for the calendar year of 2009,
where the forcing for the model system is provided by the
analyzed wind fields. In general, the year 2009 exhibited typ-
ical yearly wave conditions for the North Sea without any
particular significant storm event. As we are also interested
in operational daily performance rather than specific extreme
event analysis, this particular year is thus a representative
one. Weekly averaged observed significant wave height var-
ied from 0.5 m during week 27 (month of July) up to 2.8 m
during week 48 (month of November). For the latter period,
the maximum observed wave height was 4.79 m. These wave
heights are approximately in the same range for the three
buoys considered.
4.1.1 Water level and surge validation
Model performance for water level and surge is analyzed by
comparing both the simulated tidal signal and the surge with
the observations. The surge levels were determined by sub-
tracting astronomical prediction from the tidal signal. Re-
sults show that simulated tide and surge levels are in good
agreement with observations. Figure 3 presents water levels
plot for location IJmuiden during the storm that occurred in
the last week of November 2009, where the computed water
level (green) and observed water level (blue) elevates from
astronomical prediction (grey). This water level raising is
clearly seen from the observed surge level (black) which is
Nat. Hazards Earth Syst. Sci., 15, 1231–1242, 2015 www.nat-hazards-earth-syst-sci.net/15/1231/2015/

L. Sembiring et al.: A validation of an operational wave and surge prediction system for the Dutch coast 1237
Figure 8. Monthly errors of wave parameters: (a) – wave height; (b) – peak period; (c) – mean wave direction.
in a good agreement with the computed surge (red). Monthly
error plots for the surge levels appear in Fig. 4. Root mean
square error (left panel) vary from 0.09 m for station K13
platform for the month of September, until 0.21 m for sta-
tion Europlatform for the month of March. For the bias (right
panel), the highest positive value is found at station Huibert-
gat for the month of February with a bias of 0.12 m, while the
strongest negative bias of −0.08 m is given by station K13
platform for the month of June. The relatively higher surge
rms error coincides with the winter period where stormier
and higher wind speeds are expected. This seasonal trend
is clearly seen in Fig. 4, where all the tidal gauges consid-
ered show a similar tendency of lower rms error during sum-
mer months with relatively higher rms error during the winter
months. An exception is station K13 platform, where the rms
error is relatively constant around 0.05–0.1 m over the year.
This is due to the location of K13 platform which is rela-
tively far offshore, which makes it less prone to the variabil-
ity of wind-driven surge. In addition, the results also show
that stronger positive bias is found mainly during the winter
period, while during calmer months the absolute bias is rela-
tively smaller with a tendency of being negative. Overall, the
surge is in good agreement with observations over the year.
A tidal analysis was performed towards the computed wa-
ter level where the amplitude and the phase of several rele-
vant tidal constituents are compared with observations. Fig-
ure 5 presents a bar-plot of the tidal amplitude for six most
dominant tidal constituents at the Dutch coast. For the most
important constituent, the M2, model (red) tends to slightly
over predict the observations (black), except for stations K13
platform. Relative error is from 0.4 % for IJmuiden until 9 %
for K13 platform. Similar to Fig. 5, in Fig. 6 the bar-plot
of tidal phase is presented. Tidal phase is predicted well by
the model, with higher error tendency appears in diurnal con-
stituents K1 and O1. Absolute differences between computed
phase and observations for the most important constituent
M2 is 2◦ for K13 platform until 8◦ for IJmuiden.
The error measures shown by the model verify that tide
and total water level can be predicted very well by CoSMoS
model. For the purpose of comparison with the similar cou-
pled wave and tide-surge modelling approach, we calculate
error metrics cost function CF and PBias (after Brown et al.,
2010) of the CoSMoS model in predicting total water level
and the surge. Over the whole tidal gauges used in the anal-
ysis, CoSMoS gives a PBias range of −1.68 until −13.75 %
for total water level and −5.9 until −41 % for the surge. An
11-year hindcast of POLCOMS-WAM model applied for the
Irish Sea by Brown et al. (2010) gives ∼−1 to −14.9 % for
total water level and −3 to −52 % for the surge. Note that
in Brown et al. (2010), a negative value of PBias suggests
an overestimation tendency and vice versa, in contrast with
one used in this paper. Error metric CF also gives good per-
formance evaluation for CoSMoS. For total water level and
surge, the ranges of CF value are 0.18–0.27 and 0.61–0.74,
respectively (CF < 1 means the model has a chance of pre-
www.nat-hazards-earth-syst-sci.net/15/1231/2015/ Nat. Hazards Earth Syst. Sci., 15, 1231–1242, 2015

1238 L. Sembiring et al.: A validation of an operational wave and surge prediction system for the Dutch coast
Figure 9. Scatter plot of observed significant wave height Hs ver-
sus computed, for every 60◦ of observed incoming mean wave di-
rection, for different peak wave period, Tp. Green – observed Hs
with Tp < 7 s; red – 7 < Tp < 9 s; blue – Tp> 9 s. (a) month of July,
(b) month of November. Location: K13 platform.
dicting skill, CF < 0.4 means the models simulated the vari-
ables well).
4.1.2 Wave validation
In general, the wave model shows good skill in reproduc-
ing the wave parameters for the hindcast period. Examples
of time series plots with simulated and observed wave pa-
rameters for K13 platform are presented in Fig. 7, where a
storm occurred at the end of November. The wave height,
peak period and mean wave direction computed by the
wave model (blue) are in good agreement with the obser-
vations (red dots) over the 2-week period that is shown,
with a slight overestimation tendency of the observed wave
height by the model. Monthly wave parameter errors are
given in Fig. 8 for all the buoys considered. Over the whole
year, the rms error (Fig. 8a, left panel) ranges from 0.16 m
(Eierlandse Gat, month of May) until 0.35 m (Europlatform,
month of November). The normalized error for the wave
height (Fig. 8a, right panel) is consistently below 0.3 with
bias in a range of −0.15 to 0.15 m (Fig. 8a, middle panel).
For the peak wave period (Fig. 8b), the rms error ranges from
1 s at the Europlatform buoy for the month of November, to
2.1 s at Eierlandse Gat for the month of September (Fig. 8b,
left panel). The bias for the peak wave period is consistently
negative (Fig. 8b, middle panel), ranging from −1.05 up to
−0.08 s for all buoys considered, suggesting that the model
gives a consistent underestimation of peak wave period over
the hindcast time. For the mean wave direction, model results
show a significant agreement with the observations (Fig. 8c).
The circular correlation varies from 0.7 at Europlatform and
Eierlandse Gat during the month of January, up to 0.9 for
the most of the months, showing a high correlation between
the model result and the observation. Bias varies between
−16◦ and 9◦ with most of the months give bias approxi-
mately ± 10◦.
The error measures show consistently low values, which
are within the range of error metrics reported by Ferrarin et
al. (2013) which uses a similar approach of coupling wave
and tide-surge modelling. In addition, these results also show
comparable skill with ones from Brown et al. (2010) whose
applying similar coupling method to the Irish Sea. We cal-
culate the error metrics CF for CoSMoS, and obtain a rela-
tively constant value of ∼0.3 for Hs, and ∼0.7 for Tp, over
the 3 buoys analyzed, whilst Brown et al. (2010) obtain CF
in the ranges of 0.4–0.6 and 1.4–4.0 for Hs and Tp, respec-
tively. This shows that CoSMoS demonstrates very good pre-
dictability skill. In Fig. 9, scatter plots of observed and com-
puted wave height are presented, with different colours indi-
cating different peak wave periods, for the station K13 plat-
form during a relatively calm period (the month of June,
Fig. 9a) and a stormy period (the month of November,
Fig. 9b). Six panels scatter plot in (a) and (b) indicate 60◦ bin
of observed incoming wave direction. The results show that
the wave model tends to underestimate northerly waves with
peak wave period greater than 7 s (blue and red scatter dots
in Fig. 9a top-left panel, in Fig. 9b top-left and bottom-right
panel). For semi enclosed seas like the North Sea, the wave
climate will be dominated by wind waves while occasional
swells can be expected to be present that mainly come from
the north, where the shelf is open to the northern part of the
Atlantic Ocean. From the results, it is shown that for waves
with peak period greater than 7 s and coming from the north
(between 330 and 30 nautical degrees), there is a consis-
tent tendency of the wave model to underestimate the wave
height. In contrast, waves that come from west/south-west do
not suffer from this underestimation (direction between 150
and 210◦ and between 210 and 270◦ in both Fig. 9a and b).
This tendency is observed in all the buoys considered.
When the wave separation algorithm is applied, the swell
and wind sea component results show fairly good agreement
with observations. In Fig. 10 monthly error and bias of swell
height component (upper row) and wind sea height compo-
nent (lower row) are presented. For the wind sea component,
the bias is between −0.14 and 0.19 m (middle panel lower
row in Fig. 10), which is in contrast with the swell height bias
Nat. Hazards Earth Syst. Sci., 15, 1231–1242, 2015 www.nat-hazards-earth-syst-sci.net/15/1231/2015/

L. Sembiring et al.: A validation of an operational wave and surge prediction system for the Dutch coast 1239
Figure 10. Monthly errors of swell height (first row) and wind sea component (second row).
Figure 11. Significant wave height Hs for Eierlandse Gat for the
month of June (left) and November (right): black – observed; blue
– with swell boundary; red – without swell boundary.
Figure 12. Surge elevation for IJmuiden during the November 2009
storm: blue – analyzed HIRLAM; red – 24 h HIRLAM; green – 48 h
HIRLAM; black dots – observation.
that remains negative over the whole year (middle panel up-
per row in Fig. 10). This suggests again that the wave model
underestimates swells, which may result in underestimation
of northerly waves at the Dutch coast.
The lower frequency part of the total wave energy can be
an important component for both daily normal conditions as
Figure 13. Monthly errors of surge elevation for different HIRLAM
for location IJmuiden.
Figure 14. Significant wave heightHs for different HIRLAM input:
blue – analyzed; red – 24 h forecast; green – 48 h forecast; black
circles – buoy. Location: K13 platform.
well as storm periods. For normal conditions, several studies
use swell-component height as one of the parameters in their
statistical predictions system of rip currents, which were built
based on the correlation between wave conditions and num-
ber of beach rescue due to drowning (Lushine, 1991; Las-
cody, 1998; Engle et al., 2002). This opens doors for the fu-
ture works on improving the wave model as well as the swell
boundary.
www.nat-hazards-earth-syst-sci.net/15/1231/2015/ Nat. Hazards Earth Syst. Sci., 15, 1231–1242, 2015

1240 L. Sembiring et al.: A validation of an operational wave and surge prediction system for the Dutch coast
Figure 15. Monthly error of significant wave height Hs for different HIRLAM input. Location: K13 platform.
4.1.3 Effect of swell boundary as model system
component
The CoSMoS system applies the global WAVEWATCH III
model to derive the swell boundary conditions for the DCSM
model (red lines in Fig. 2). Here, a simulation is performed
where we ignore the swell boundary and use only wind forc-
ing from HIRLAM as the main input into the wave model to
see the effect of such a scenario. The result shows that model
performance degrades after removal of the swell boundary
with different reactions from the model for different periods.
Figure 11 presents time series of wave height with and with-
out the swell boundary for the month of June (left panel)
and the month of November (right panel) for station Eier-
landse Gat. During the month of June (Fig. 11 left panel), the
degradation after ignoring the swell boundary is fairly sig-
nificant, where the simulation result (red) suffers more un-
derestimation compared to the default setting of the model
system (blue). The normalized rms error increases (on aver-
age over the buoys) by 34 %. In contrast, during the month
of November (Fig. 11 right panel), the effect on negating the
swell boundary is 2 times less than the month of June, with a
15 % increase in normalized rms error.
4.2 Validation in forecast mode
In order to assess the capability of CoSMoS to predict events
a number of days into the future, a forecast mode vali-
dation is performed where the model system is forced by
HIRLAM forecast winds of the year 2009. Two types of fore-
cast HIRLAM wind fields are considered: a 24 h forecast and
a 48 h forecast. Figure 12 shows an example of surge ele-
vation plots for different HIRLAM inputs together with the
observations for IJmuiden during November 2009. Results
using the HIRLAM forecasts both for 24 and 48 h ahead (red
and green line respectively) retain good agreement with ob-
servations (black dots). Differences are relatively small be-
tween results using analyzed wind (blue) and results using
either the 24 or 48 h forecasted wind. Monthly error plots of
surge elevation for different HIRLAM are shown in Fig. 13
for station IJmuiden. A strong seasonal feature is retained
where a relatively lower rms error and bias exhibited dur-
ing the summer season while stronger bias is seen during the
summer period. This greatest rms error increase is 33 percent
(from analyzed to 48 h) for the month of December. On aver-
age, the rms error increases by 11 % (from analyzed to 24 h)
and 25 % (from analyzed to 48 hours) for all stations.
For the wave model, time series of wave heights for differ-
ent HIRLAM forcings are presented in Fig. 14, for 5 days in
the last week of November for location K13 platform, when
the highest weekly averaged wave heights were observed.
The forecast results (red: 24 h, green: 48 h) are also in good
agreement with observations (black dots). However, there are
clear differences, especially with the 48 hour HIRLAM fore-
casts, while results using analyzed and 24 h HIRLAM look
relatively similar. Monthly errors of significant wave height
for different HIRLAM are shown in Fig. 15 for location K13
platform. The rms error tends to increase as the forecast hori-
zon increases. For instance at K13 platform for the month of
November, the rms error was 0.31 m with analyzed wind, and
further increased to 0.46 and 0.56 m with 24 and 48 h winds,
respectively. On average, stronger error increments are more
prominent during the winter period. In contrast, the monthly
averaged bias does not increase strongly as the forecast hori-
zon increases. On average, the rms error increases by 20 and
40 % for 24 and 48 h forecast, respectively for all locations.
5 Conclusions
A CoSMoS model system covering the North Sea is built
which employ coupled wave and tide-surge modelling ap-
proach to hindcast and forecast wave conditions and water
levels for the area along the Dutch coast. The system is de-
signed in a generic way to accommodate and integrate dif-
ferent regional and local models. A validation is performed
of the Dutch Continental Shelf Model (DCSM) covering the
North Sea, using wave buoys and tidal gauges available along
the Dutch coast. Hindcast results show that the surge eleva-
tion produced by the model is in good agreement with the
observations, with rms error ranging from 0.09 to 0.21 m.
On average, the model tends to slightly overestimate surge
levels, especially during the winter months. For the wave
model, simulated wave parameters agree well with observa-
tions, with a relative error of 14 until 30 %. However, model
tends to underestimate swell height. Using default settings of
the model system (swell boundary is included), a consistent
underestimation is found for northerly waves with relatively
Nat. Hazards Earth Syst. Sci., 15, 1231–1242, 2015 www.nat-hazards-earth-syst-sci.net/15/1231/2015/

L. Sembiring et al.: A validation of an operational wave and surge prediction system for the Dutch coast 1241
low frequency, which is also supported by the wave separa-
tion algorithm. This suggests room for improvement for the
swell boundary conditions to the North of the model domain.
In order to test the CoSMoS system in forecast mode, it has
been forced by HIRLAM 24 and 48 h forecasts. The model
system is capable of predicting high wave events and storm
surge up to 2 days in advance. However, the performance
does degrade as the forecast horizon increases. A smaller
error increase is found for the surge elevation than for the
wave heights. For surge elevation, on average, the rms error
increases by 11 % (from analyzed to 24 h) and 25 % (from
analysed to 48 h) for all stations. On the other hand, for the
wave model, the rms error increases on average by 20 and
40 % for 24 and 48 h forecast, respectively.
To summarize, we conclude that the CoSMoS Dutch Con-
tinental Shelf Model is a fit-for-purpose regional model to
simulate waves, tide and surge, including the interactions,
and to provide boundary conditions for coastal models with
which we can use as coastal monitoring tools.
In the future, merging CoSMoS with a more integrated
operational forecast system like FEWS is recommended in
order to more accurately predict storm surge level because
introducing data assimilation into the system will increase
forecast quality.
Acknowledgements. This research has been carried out in the
framework of project: Real-Time Safety on Sedimentary Coasts
funded by the Flood Control 2015 research program (project code
2010.05), and the Deltares’ strategic research program “Event-
driven Hydro- and Morphodynamics” (project code 1202362).
The authors thank Ivo Wenneker and Alfons Smale for valuable
discussions, also for providing buoy data and useful algorithms that
are used in this work.
Edited by: B. D. Malamud
References
Baart, F., van der Kaaij, T., van Ormondt, M., van Dongeren, A., van
Koningsveld, M., and Roelvink, J. A.: Real-time forecasting of
morphological storm impacts: a case study in The Netherlands,
J. Coast. Res., Special Issue, 56, 1617–1621, 2009.
Barnard, P., O’Reilly, B., van Ormondt, M., Elias, E., Ruggiero, P.,
Erikson, L., Hapke, C., Collins, B. D., Guza, R. T., Adams, P. N.,
and Thomas, J. T.: The framework of a coastal hazards model; a
tool for predicting the impact of severe storms, U.S. Geological
Survey Open-File Report 2009-1073, 21 pp., 2009.
Battjes, J. A. and Janssen, J. P. F. M.: Energy loss and set-up due to
breaking of random waves, 16th Int. Conf. Coast. Eng., ASCE,
569–587, 1978.
Behrens, A. and Günther, H.: Operational wave prediction of ex-
treme storms in Northern Europe, Nat. Hazards, 49, 387–399,
2009.
Berens, P.: CircStat: A MATLAB Toolbox for Circular Statistics, J.
Stat. Softw., 31, 1–21, 2009.
Bertotti, L. and Cavaleri, L.: Wind and wave predictions in the Adri-
atic Sea, J. Marine Syst., 78, S227–S234, 2009.
Bertotti, L., Canestrelli, P., Cavaleri, L., Pastore, F., and Zampato,
L.: The Henetus wave forecast system in the Adriatic Sea, Nat.
Hazards Earth Syst. Sci., 11, 2965–2979, doi:10.5194/nhess-11-
2965-2011, 2011.
Booij, N., Ris, R. C., and Holthuijsen, L. H.: A third-generation
wave model for coastal regions 1. Model description and valida-
tion, J. Geophys. Res., 104, 7649–7666, 1999.
Brown, J. M. and Wolf, J.: Coupled wave and surge modelling
for the eastern Irish Sea and implications for model wind-stress,
Cont. Shelf Res., 29, 1329–1342, 2009.
Brown, J. M., Souza, A. J., and Wolf, J.: An 11-year validation of
wave-surge modelling in the irish sea, using a nested polcoms–
wam modelling system, Ocean Model., 33, 118–128, 2010.
Cavaleri, L. and Bertotti, L.: Accuracy of the modelled wind and
wave fields in enclosed seas, Tellus A-Dyn. Meteorol. Oceanogr.,
56, 167–175, 2004.
Cavaleri, L. and Bertotti, L.: The improvement of modelled wind
and wave fields with increasing resolution, Ocean Eng., 33, 553–
565, 2006.
Cherneva, Z., Andreeva, N., Pilar, P., Valchev, N., Petrova, P., and
Guedes Soares, C.: Validation of the WAMC4 wave model for
the Black Sea, Coast. Eng., 55, 881–893, 2008.
Cornillon, P., Gallagher, J., and Sgouros, T.: OPeNDAP: Accessing
data in a distributed, heterogeneous environment, Data Sci. J., 2,
164–174, 2003.
De Kleermaeker, S., Verlaan, M., Kroos, J., and Zijl, F.: A new
coastal flood forecasting system for The Netherlands, Hydro12
– Taking care of the sea, Rotterdam, 2012.
Deltares: Simulation of multi-dimensional hydrodynamic flows and
transport phenomena, including sediments, DELFT3D-FLOW
User Manual, 2013.
Egbert, G. D. and Erofeeva, S. Y.: Efficient Inverse Modeling of
Barotropic Ocean Tides, J. Atmos. Ocean. Technol., 19, 183–
204, 2002.
Engle, J., MacMahan, J. H., Thieke, R. J., Hanes, D. M., and Dean,
R. G.: Formulation of a rip current predictive index using res-
cue data, National Conference on Beach Preservation Technol-
ogy, Biloxi, 23–25, 2002.
Ferrarin, C., Roland, A., Bajo, M., Umgiesser, G., Cucco, A., Davo-
lio, S., Buzzi, A., Malguzzi, P., and Drofa, O.: Tide-surge-wave
modelling and forecasting in the Mediterranean Sea with focus
on the Italian Coast, Ocean Model., 61, 38–48, 2013.
Fisher, N. I.: Statistical Analysis of Circular Data, Cambridge Uni-
versity Press, 296 pp., 1996.
Gerritsen, H., de Vries, J. W., and Philippart, M. E.: The Dutch
Continental Shelf Model, in: In Quantitative Skill Assesment for
Coastal Ocean, edited by: Lynch, D. and Davies, A., American
Geophysical Union, Washington DC, 425–467, 1995.
Gunther, H.: WAM Cycle 4.5., Institute for Coastal Research,
GKSS Research Centre, Germany, 40 pp., 2002.
Hanson, J. L., Tracy, B. A., Tolman, H. L., and Scott, R. D.: Pacific
Hindcast Performance of Three Numerical Wave Models, Jour-
nal of Atmospheric and Oceanic Technology, 26, 1614–1633,
2009.
Hasselman, K., Barnett, T. P., Bouws, E., Carlson, D. E., and
Hasselmann, P.: Measurements of wind-wave growth and swell
www.nat-hazards-earth-syst-sci.net/15/1231/2015/ Nat. Hazards Earth Syst. Sci., 15, 1231–1242, 2015

1242 L. Sembiring et al.: A validation of an operational wave and surge prediction system for the Dutch coast
decay during the Joint North Sea Wave Project (JONSWAP),
Deutsche Hydrographische Zeitschrift, 8, 95 pp., 1973.
Heemink, A. W. and Kloosterhuis, H.: Data assimilation for non-
linear tidal models, Int. J. Num. Meth. Fluids, 11, 1097–1112,
1990.
Janssen, P. A. E. M., Hansen, B., and Bidlot, J.-R.: Verification of
the ECMWF Wave Forecasting System against Buoy and Al-
timeter Data, Weather Forecast., 12, 763–784, 1997.
Kuik, A. J., van Vledder, G. P., and Holthuijsen, L. H.: A Method
for the Routine Analysis of Pitch-and-Roll Buoy Wave Data, J.
Phys. Oceanogr., 18, 1020–1034, 1988.
Lascody, R. L.: East central florida rip current program, National
Weather Digest, 25–30, 1998.
Longuet-Higgins, M. S. and Stewart, R. W.: A note on wave set-up,
J. of Marine Res., 21, 4–10, 1963.
Lushine, J. B.: A study of rip currents drownings and related
weather factors, National Weather Digest, 13–19, 1991.
Mazarakis, N., Kotroni, V., Lagouvardos, K., and Bertotti, L.:
High-resolution wave model validation over the Greek mar-
itime areas, Nat. Hazards Earth Syst. Sci., 12, 3433–3440,
doi:10.5194/nhess-12-3433-2012, 2012.
Ponce de León, S., and Guedes Soares, C.: Sensitivity of wave
model predictions to wind fields in the Western Mediterranean
sea, Coast. Eng., 55, 920–929, 2008.
Portilla, J., Ocampo-Torres, F. J., and Monbaliu, J.: Spectral Par-
titioning and Identification of Wind Sea and Swell, J. Atmos.
Ocean. Technol., 26, 107–122, 2009.
Resio, D. and Perrie, W.: Implications of an f − 4 Equilibrium
Range for Wind-Generated Waves, J. Phys. Ocean., 19, 193–204,
1989.
Roelvink, D., Reniers, A., van Dongeren, A., van Thiel de Vries,
J., McCall, R., and Lescinski, J.: Modelling storm impacts on
beaches, dunes and barrier islands, Coast. Eng., 56, 1133-1152,
2009.
Stelling, G.: On the construction of computational methods for
shallow water flow problems, Rijkswaterstaat communication,
no. 35, The Hague, 1984.
Tolman, H. L.: User manual and system documentation of
WAVEWATCH-III version 3.14, 2009.
Unden, P., Rontu, L., Jarvinen, H., Lynch, P., Calvo, J., Cats, G.,
Cuxart, J., Eerola, K., Fortelius, C., Garcia-Moya, J., Jones,
C., Lenderlink, G., McDonald, A., McGrath, R., Navascues, B.,
Nielsen, N., Odegaard, V., Rodriguez, E., Rummukainen, M.,
Room, R., Sattler, K., Sass, B., Savijarvi, H., Schreur, B., Sigg,
R. The, H., and Tijm, A.: HIRLAM-5 Scientific Documentation,
144 pp., 2002.
Van Dongeren, A., Sancho, F. E., Svendsen, I. A., and Putrevu,
U.: SHORECIRC: A quasi 3-D Nearshore Model, Coast. Eng.,
2741–2754, 1994.
Van Dongeren, A., Van Ormondt, M., Sembiring, L., Sasso, R.,
Austin, M., Briere, C., Swinkels, C., Roelvink, D., and Van Thiel
de Vries, J.: Rip current predictions through model data assim-
ilation on two distinct beaches, Coastal Dynamics, Bordeaux,
France, 2013.
Van Ormondt, M., Van Dongeren, A., Briere, C., Sembiring, L.,
Winter, G., Lescinski, J., and Swinkels, C.: Simulating storm im-
pacts and coastal flooding along the Netherlands Coast, Flood
Risk 2012, Rotterdam, the Netherlands, 28–29„ 2012.
Verlaan, M., Zijderveld, A., de Vries, H., and Kroos, J.: Operational
storm surge forecasting in the Netherlands: developments in the
last decade, Philosophical Transactions of the Royal Society A:
Mathematical, Phys. Eng. Sci., 363, 1441–1453, 2005.
Wei, G., Kirby, J. T., Grilli, S. T., and Subramanya, R.: A fully non-
linear Boussinesq model for surface waves. Part 1. Highly non-
linear unsteady waves, J. Fluid Mech., 294, 71–92, 1995.
Wenneker, I. and Smale, A.: Measurement of 2D wave spectra dur-
ing a storm in a tidal inlet, Coast. Dynam., France, 2013.
Werner, M., Schellekens, J., Gijsbers, P., van Dijk, M., van den
Akker, O., and Heynert, K.: The Delft-FEWS flow forecasting
system, Environ. Modell. Softw., 40, 65–77, 2013.
Westhuysen, A. J., Zijlema, M., and Battjes, J. A.: Nonlinear
saturation-based whitecapping dissipation in SWAN for deep and
shallow water, Coast. Eng., 54, 151–170, 2007.
Wolf, J.: Coupled wave and surge modelling and implications for
coastal flooding, Adv. Geosci., 17, 19–22, 2008,
http://www.adv-geosci.net/17/19/2008/.
Nat. Hazards Earth Syst. Sci., 15, 1231–1242, 2015 www.nat-hazards-earth-syst-sci.net/15/1231/2015/