A HILIC-Based UPLC/MS Method for the Separation of Lipid Classes from Plasma

1
A UPLC Method for Analysis of Metformin and Related Substances by Hydrophilic Interaction Chromatography (HILIC)Michael D. Jones1 and Ben William2
1 Waters Corporation, Milford, MA, USA2 Valeant Pharmaceuticals International, Steinbach, Manitoba, Canada
IN T RO DU C T IO N
Metformin hydrochloride is an anti-diabetic drug typically administered orally
while treating non-insulin dependant (type 2) diabetes mellitus.1 It is one of
the most widely-used oral antidiabetic drugs worldwide, with over 48 million
generic formulation prescriptions filled in the United States alone.2 Liquid
chromatographic analysis of metformin and related impurities presents a
challenging task due to the highly polar characteristics of the molecules and
the low UV absorbance of the analytes. These challenges limit the options to
manipulate selectivity during method development, especially with reversed-
phase (RP) chromatography. Numerous methods are cited utilizing a variety of
techniques such as ion chromatography, hydrophilic interaction chromatography
(HILIC), and RP LC methodologies reporting run times up to 30 minutes.1,3,4
In this application note, a method was developed on the ACQUITY UPLC H-Class
system using an ACQUITY UPLC BEH Amide sub-2 µm particle stationary phase
in HILIC mode to successfully resolve and analyze metformin and six related
substances. Development of the method was facilitated through the column
and solvent switching capabilities of the ACQUITY UPLC H-Class which allows
automated changes of stationary phase, ionic strength, cation buffer, pH and
temperature. The major contributors to the successful separation of metformin
and the related substances are discussed. A routine use evaluation study was
performed to determine feasibility of the method for use in QC laboratories.
Informatics provided visualization of trending results with intent to identify
deficiencies regarding the developed methodology. The final method will provide
cost reduction improvements in method robustness for routine analysis.
WaT e R s sO lU T IO Ns■■ ACQUITY UPLC® H-Class system
■■ ACQUITY UPLC BEH Amide column
and pre-column filter
■■ Empower™ 2 CDS software
■■ ACQUITY UPLC Columns Calculator
k e y W O R D s
Method transfer, polar basic compounds,
method development, melamine,
cyanoguanidine, pharmaceutical
impurities
a P P l I C aT IO N B e N e F I T s ■■ Reduced development time facilitated by
instrument flexibility
■■ A 6x reduction in chromatographic run
time resulting in a 3.5x reduction of
total required analysis time resulting in
faster throughput and reduced solvent
consumption in routine sample analysis
■■ Utilizing ACQUITY UPLC results in a
savings of $5800/per 1000 injections by
reducing solvent consumption
2
e X P e R IM e N Ta l
Sample Description
Samples were provided by a pharmaceutical
collaborator. Stock solutions of metformin
hydrochloride, as well as impurities A, B, C, D, E and
I were prepared in water. Working standards were
prepared as per the previous HPLC methodology
(70:30 acetonitrile:water). A working standard
mixture was prepared whereas impurity concentrations
were in respect to the metformin concentration:
Impurity A was prepared at 0.05% of metformin
and Impurities B, C, D, E and I were prepared at 0.1%
of metformin. A mixture of the impurities without
addition of metformin was also prepared at the same
concentration as the impurities working standard. In
addition to the working standard and impurity working
standard, two separate preparations consisting of vials
prepared with metformin with and without impurities
spiked into the matrix. Individual standards were also
prepared for each of the analyte constituents.
Method Conditions
Instrument: ACQUITY UPLC H-Class
configured with CM-A,
CM-AUX, SSV, PDA
Buffer: 20 mM potassium
phosphate, pH 2.3
Mobile Phase: 80:20 acetonitrile:buffer
Separation Mode: Isocratic
Detection: UV at 218 nm
Column: ACQUITY UPLC BEH
Amide, 2.1 x 150 mm, 1.7 µm,
part number 186004802
Needle Wash: 90:10 acetonitrile:water
Seal Wash: 90:10 water: methanol
Sample Diluent: 70:30 acetonitrile:water
Flow Rate: 0.5 mL/min
Column Temp.: 40 °C
Injection Volume: 1.0 µL
Data Management: Empower 2 CDS
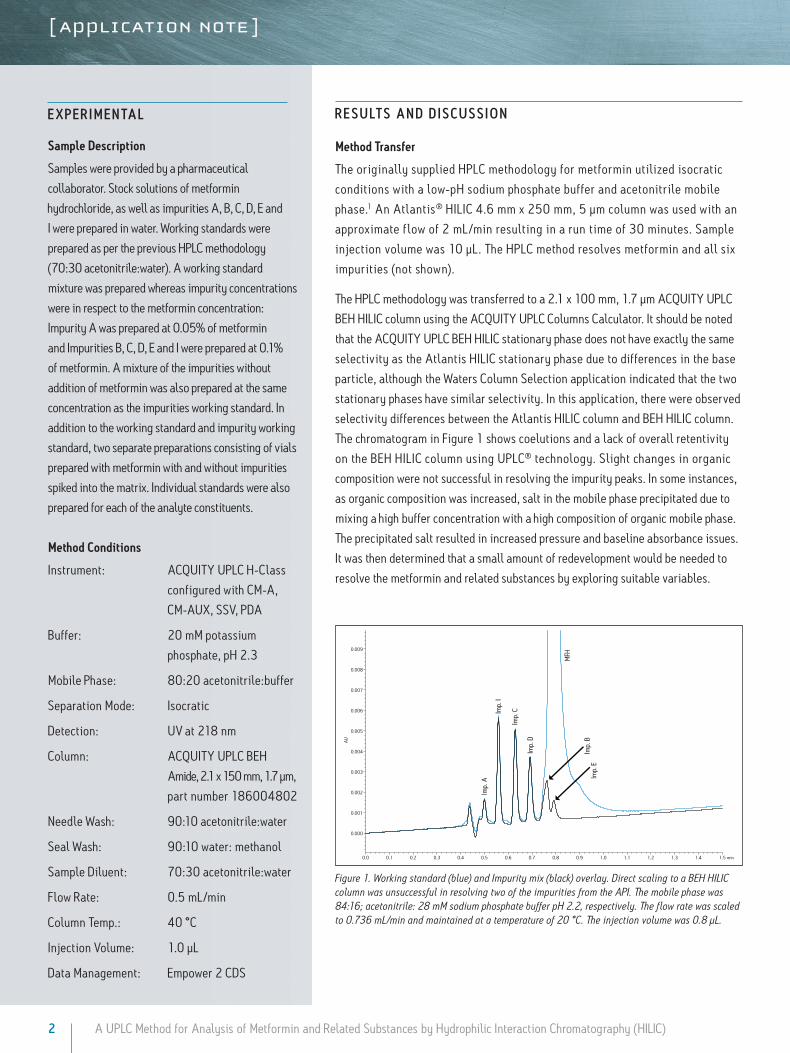
R e sU lT s a N D D Is C U s s IO N
Method Transfer
The originally supplied HPLC methodology for metformin utilized isocratic
conditions with a low-pH sodium phosphate buffer and acetonitrile mobile
phase.1 An Atlantis® HILIC 4.6 mm x 250 mm, 5 µm column was used with an
approximate flow of 2 mL/min resulting in a run time of 30 minutes. Sample
injection volume was 10 µL. The HPLC method resolves metformin and all six
impurities (not shown).
The HPLC methodology was transferred to a 2.1 x 100 mm, 1.7 µm ACQUITY UPLC
BEH HILIC column using the ACQUITY UPLC Columns Calculator. It should be noted
that the ACQUITY UPLC BEH HILIC stationary phase does not have exactly the same
selectivity as the Atlantis HILIC stationary phase due to differences in the base
particle, although the Waters Column Selection application indicated that the two
stationary phases have similar selectivity. In this application, there were observed
selectivity differences between the Atlantis HILIC column and BEH HILIC column.
The chromatogram in Figure 1 shows coelutions and a lack of overall retentivity
on the BEH HILIC column using UPLC® technology. Slight changes in organic
composition were not successful in resolving the impurity peaks. In some instances,
as organic composition was increased, salt in the mobile phase precipitated due to
mixing a high buffer concentration with a high composition of organic mobile phase.
The precipitated salt resulted in increased pressure and baseline absorbance issues.
It was then determined that a small amount of redevelopment would be needed to
resolve the metformin and related substances by exploring suitable variables.
Imp.
A
Imp.
I
Imp.
C
MFH
Imp.
D
Imp.
B
Imp.
E
0.0 0.1 0.2 0.3 0.4 0.5 0.6 0.7 0.8 0.9 1.0 1.1 1.2 1.3 1.4 1.5 min
0.000
0.001
0.002
0.003
0.004
0.005
0.006
0.007
0.008
0.009
AU
Figure 1. Working standard (blue) and Impurity mix (black) overlay. Direct scaling to a BEH HILIC column was unsuccessful in resolving two of the impurities from the API. The mobile phase was 84:16; acetonitrile: 28 mM sodium phosphate buffer pH 2.2, respectively. The flow rate was scaled to 0.736 mL/min and maintained at a temperature of 20 °C. The injection volume was 0.8 µL.
A UPLC Method for Analysis of Metformin and Related Substances by Hydrophilic Interaction Chromatography (HILIC)

3
Manipulating Selectivity on HILIC
A method development scheme to analyze metformin and
related substances presents a challenging task. Limitations
regarding the low UV spectral absorbance of the analytes
at 218 nm inhibit the use of typical MS-friendly buffers
such as ammonium formate and ammonium acetate, since
their UV cutoff approaches 230 nm. Reversed-phase LC
is unsuccessful in retaining the analytes due to the polar
basic characteristics of the compounds.
A method development scheme was employed to investigate
two HILIC stationary phases: ACQUITY UPLC BEH HILIC
and ACQUITY UPLC BEH Amide. Ionic strength, buffer cation
selection, and temperature were determined as the remaining
options to alter selectivity. Based on the poor retentivity and
resolution of these compounds using the ACQUITY UPLC
BEH HILIC stationary phase, the ACQUITY UPLC BEH Amide
column was investigated.
The working standard was injected onto the ACQUITY UPLC
BEH Amide 2.1 x 100 mm, 1.7 µm column. The resulting
chromatogram in Figure 2 resolved all compounds with
the exception of a slight co-elution between Impurity B
and Impurity D. Desired improvements in peak shape and
sensitivity were seen for Impurity E. Due to the isocratic
conditions, changes in flow rate and temperature were
explored individually to improve on these critical impurity
peaks of interest. An experiment utilizing higher mobile-
phase pH was explored but the results yielded little to no
retention of many of the impurity peaks. The following
relationships were observed during development of the
separation on the amide column:
■■ Increases in organic content increased retention of Impurity D
and B to co-elute with impurity E. A flow rate of 400 µL/min
at 25 °C was determined to be optimal when using sodium
phosphate as the aqueous mobile phase (Figure 2).
■■ As temperature increased, retention of impurity E
decreased and co-eluted with impurity B (Figure 3).
■■ As flow rate increased, resolution of Impurity B, D,
and E decreased.
Imp.
A
Imp.
I
Imp.
C
MFH
Imp.
D
Imp.
B
Imp.
E
4.0 4.5 min3.02.52.01.51.00.50.0 3.5
0.0000
0.0025
0.0050
0.0075
0.0100
AU
Figure 2. Injection of WS and Impurity mixture on ACQUITY UPLC BEH Amide column. A generic method was used to begin redevelopment. The conditions were derived from initial method conditions. The mobile phase was 80:20; acetonitrile: 30 mM sodium phosphate buffer pH 2.2, respectively. The flow rate was to 0.4 mL/min and maintained at a temperature of 25 °C. The injection volume was 1.0 µL.
Figure 3. An Increase in temperature to 30 °C shifted retention time of Impurity E to decrease and co-elute with Impurity B. The mobile phase was 80:20; acetonitrile: 30 mM sodium phosphate buffer pH 2.2, respectively. The flow rate was to 0.4 mL/min and maintained at a temperature of 30 °C. The injection volume was 1.0 µL.
Imp.
A
Imp.
I
Imp.
C
Imp.
D
Imp.
B
Imp. E std.
0.0
0.0000
0.0008
AU 0.0016
0.0024
0.0032
0.5 1.0 1.5 2.0 2.5 3.0 3.5 4.0 4.5 5.0 min
A UPLC Method for Analysis of Metformin and Related Substances by Hydrophilic Interaction Chromatography (HILIC)
4
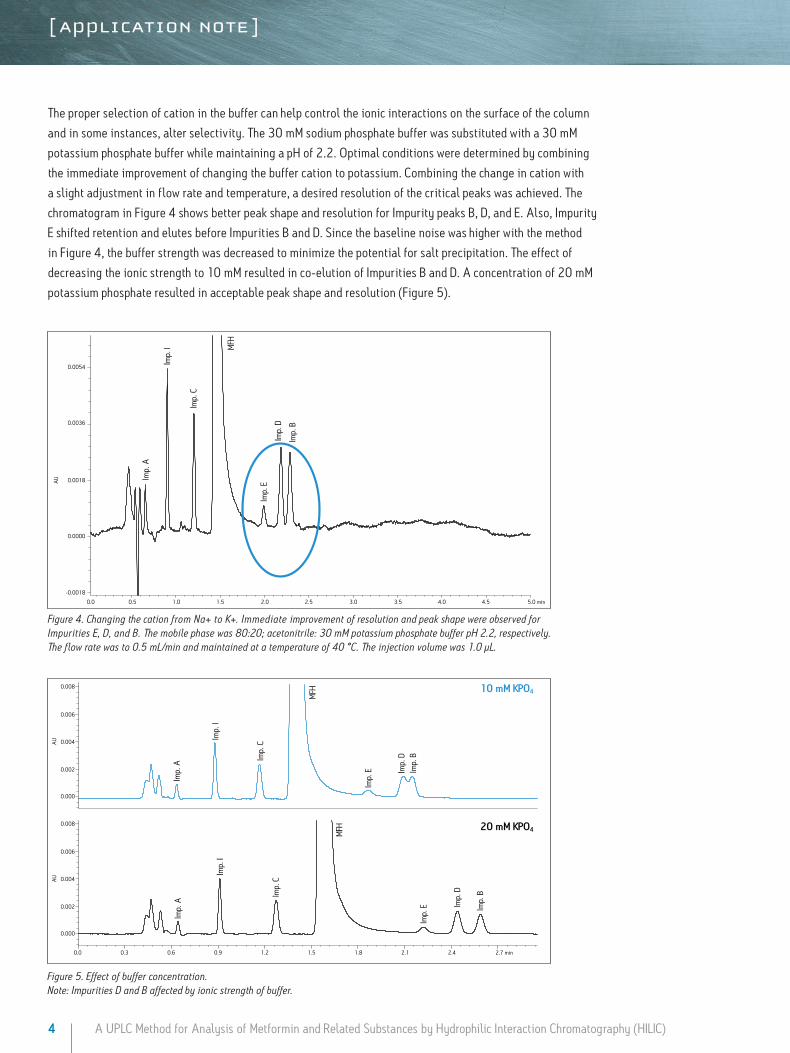
Figure 4. Changing the cation from Na+ to K+. Immediate improvement of resolution and peak shape were observed for Impurities E, D, and B. The mobile phase was 80:20; acetonitrile: 30 mM potassium phosphate buffer pH 2.2, respectively. The flow rate was to 0.5 mL/min and maintained at a temperature of 40 °C. The injection volume was 1.0 µL.
Figure 5. Effect of buffer concentration. Note: Impurities D and B affected by ionic strength of buffer.
A UPLC Method for Analysis of Metformin and Related Substances by Hydrophilic Interaction Chromatography (HILIC)
The proper selection of cation in the buffer can help control the ionic interactions on the surface of the column
and in some instances, alter selectivity. The 30 mM sodium phosphate buffer was substituted with a 30 mM
potassium phosphate buffer while maintaining a pH of 2.2. Optimal conditions were determined by combining
the immediate improvement of changing the buffer cation to potassium. Combining the change in cation with
a slight adjustment in flow rate and temperature, a desired resolution of the critical peaks was achieved. The
chromatogram in Figure 4 shows better peak shape and resolution for Impurity peaks B, D, and E. Also, Impurity
E shifted retention and elutes before Impurities B and D. Since the baseline noise was higher with the method
in Figure 4, the buffer strength was decreased to minimize the potential for salt precipitation. The effect of
decreasing the ionic strength to 10 mM resulted in co-elution of Impurities B and D. A concentration of 20 mM
potassium phosphate resulted in acceptable peak shape and resolution (Figure 5).
Imp.
A
Imp.
I
Imp.
C
MFH
Imp.
D
Imp.
B
Imp.
E
0.0 0.5 1.0 1.5 2.0 2.5 3.0 3.5 4.0 4.5 5.0 min
-0.0018
0.0000
0.0018
0.0036
0.0054
AU
10 mM KPO4
20 mM KPO4
Imp.
A
Imp.
I
Imp.
C
MFH
Imp.
D
Imp.
B
Imp.
E
Imp.
A
Imp.
I
Imp.
C
Imp.
D
Imp.
B
Imp.
E
MFH
0.0
0.000
0.002
0.004AU
0.006
0.008
0.3 0.6 0.9 1.2 1.5 1.8 2.1 2.4 2.7 min
0.000
0.002
0.004AU
0.006
0.008
5
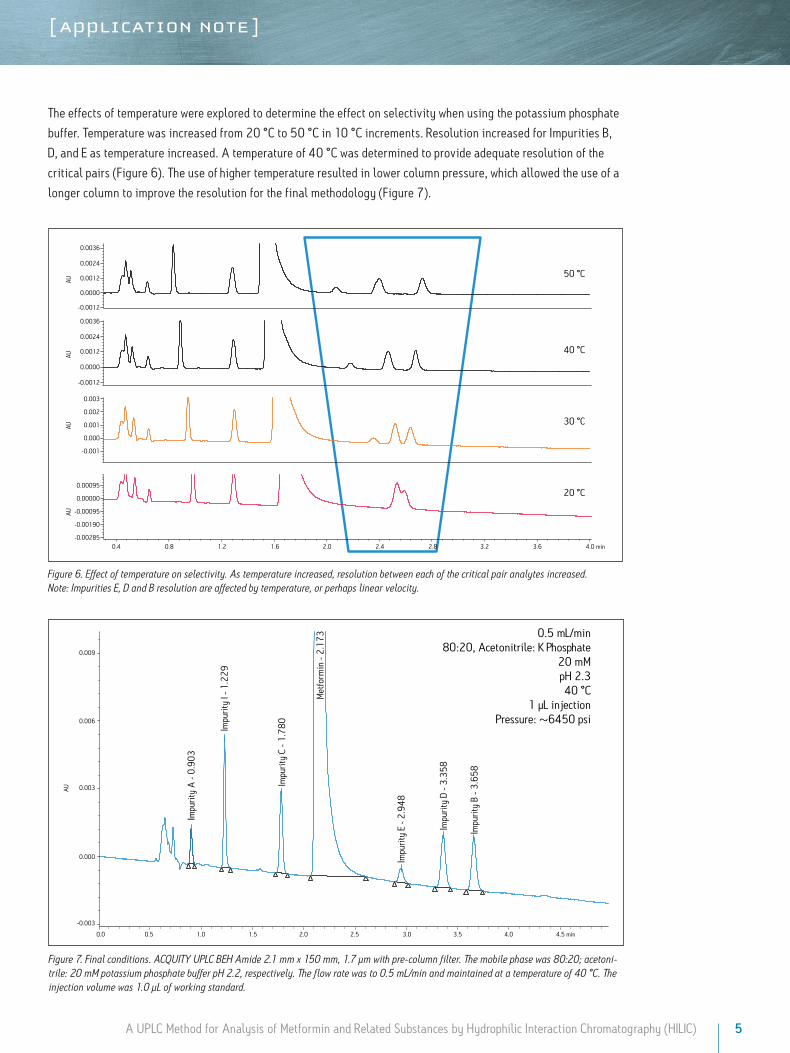
The effects of temperature were explored to determine the effect on selectivity when using the potassium phosphate
buffer. Temperature was increased from 20 °C to 50 °C in 10 °C increments. Resolution increased for Impurities B,
D, and E as temperature increased. A temperature of 40 °C was determined to provide adequate resolution of the
critical pairs (Figure 6). The use of higher temperature resulted in lower column pressure, which allowed the use of a
longer column to improve the resolution for the final methodology (Figure 7).
Figure 6. Effect of temperature on selectivity. As temperature increased, resolution between each of the critical pair analytes increased. Note: Impurities E, D and B resolution are affected by temperature, or perhaps linear velocity.
Figure 7. Final conditions. ACQUITY UPLC BEH Amide 2.1 mm x 150 mm, 1.7 µm with pre-column filter. The mobile phase was 80:20; acetoni-trile: 20 mM potassium phosphate buffer pH 2.2, respectively. The flow rate was to 0.5 mL/min and maintained at a temperature of 40 °C. The injection volume was 1.0 µL of working standard.
A UPLC Method for Analysis of Metformin and Related Substances by Hydrophilic Interaction Chromatography (HILIC)
50 °C
40 °C
30 °C
20 °C
0.4
AU
0.8 1.2 1.6 2.0 2.4 2.8 3.2 3.6 4.0 min-0.00285
-0.00190
-0.00095
0.00000
0.00095
AU
-0.001
0.000
0.001
0.002
0.003
AU
-0.0012
0.0000
0.0012
0.0024
0.0036
AU
-0.0012
0.0000
0.0012
0.0024
0.0036
0.5 mL/min80:20, Acetonitrile: K Phosphate
20 mMpH 2.340 °C
1 µL injectionPressure: ~6450 psi
Impu
rity
A -
0.90
3
Impu
rity
I - 1
.229
Impu
rity
C - 1
.780
Met
form
in -
2.17
3
Impu
rity
E - 2
.948
Impu
rity
D - 3
.358
Impu
rity
B - 3
.658
0.0 0.5 1.0 1.5 2.0 2.5 3.0 3.5 4.0 4.5 min
-0.003
0.000
0.003
0.006
AU
0.009
6
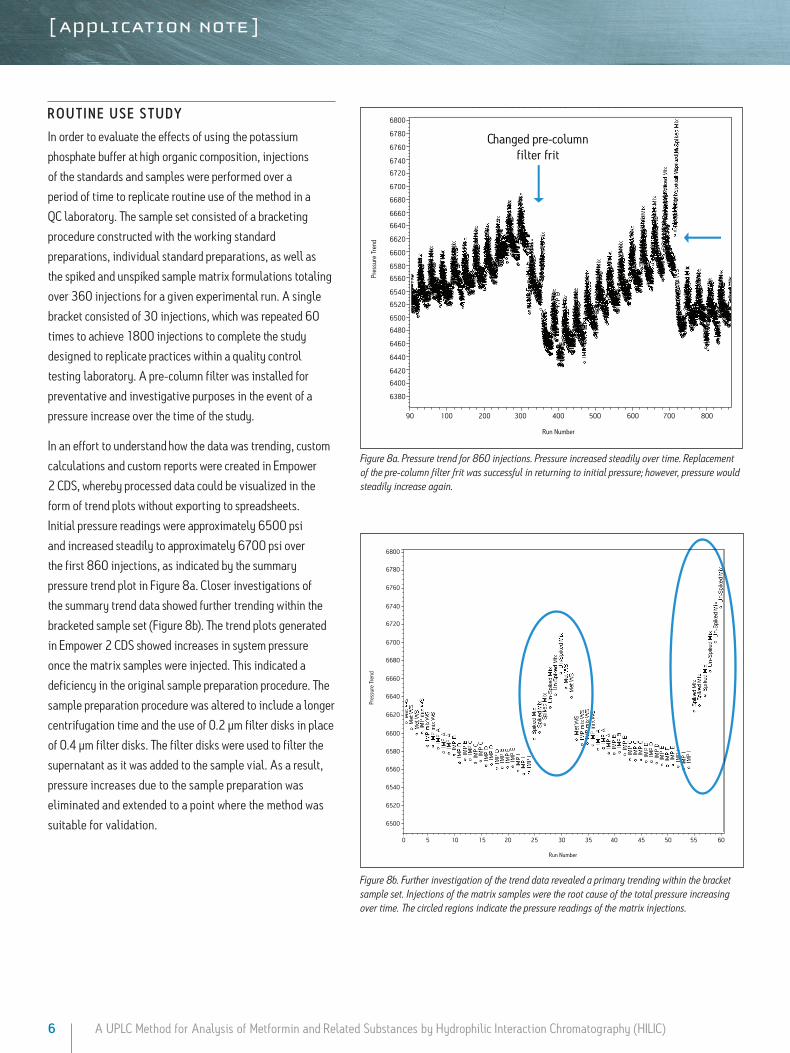
Figure 8a. Pressure trend for 860 injections. Pressure increased steadily over time. Replacement of the pre-column filter frit was successful in returning to initial pressure; however, pressure would steadily increase again.
Figure 8b. Further investigation of the trend data revealed a primary trending within the bracket sample set. Injections of the matrix samples were the root cause of the total pressure increasing over time. The circled regions indicate the pressure readings of the matrix injections.
A UPLC Method for Analysis of Metformin and Related Substances by Hydrophilic Interaction Chromatography (HILIC)
ROU T IN e U s e s T U Dy
In order to evaluate the effects of using the potassium
phosphate buffer at high organic composition, injections
of the standards and samples were performed over a
period of time to replicate routine use of the method in a
QC laboratory. The sample set consisted of a bracketing
procedure constructed with the working standard
preparations, individual standard preparations, as well as
the spiked and unspiked sample matrix formulations totaling
over 360 injections for a given experimental run. A single
bracket consisted of 30 injections, which was repeated 60
times to achieve 1800 injections to complete the study
designed to replicate practices within a quality control
testing laboratory. A pre-column filter was installed for
preventative and investigative purposes in the event of a
pressure increase over the time of the study.
In an effort to understand how the data was trending, custom
calculations and custom reports were created in Empower
2 CDS, whereby processed data could be visualized in the
form of trend plots without exporting to spreadsheets.
Initial pressure readings were approximately 6500 psi
and increased steadily to approximately 6700 psi over
the first 860 injections, as indicated by the summary
pressure trend plot in Figure 8a. Closer investigations of
the summary trend data showed further trending within the
bracketed sample set (Figure 8b). The trend plots generated
in Empower 2 CDS showed increases in system pressure
once the matrix samples were injected. This indicated a
deficiency in the original sample preparation procedure. The
sample preparation procedure was altered to include a longer
centrifugation time and the use of 0.2 µm filter disks in place
of 0.4 µm filter disks. The filter disks were used to filter the
supernatant as it was added to the sample vial. As a result,
pressure increases due to the sample preparation was
eliminated and extended to a point where the method was
suitable for validation.
Changed pre-columnfilter frit
6380
6400
6420
6440
6460
6480
6500
6520
6540
6560
6580
6600
6620
6640
6660
6680
6700
6720
6740
6760
6780
6800
Pres
sure
Tre
nd
10090 200 300 400 500 600 700 800
Run Number
6500
6520
6540
6560
6580
6600
6620
6640
6660
6680
6700
6720
6740
6760
6780
6800
Pres
sure
Tre
nd
50 10 15 20 25 30 35 40 45 50 55 60
Run Number
Waters Corporation 34 Maple Street Milford, MA 01757 U.S.A. T: 1 508 478 2000 F: 1 508 872 1990 www.waters.com
CO N C lU s IO Ns
The complete solution consisting of informatics tools, flexible instrumentation, and a selection of chemistries
resulted in a method providing a six-fold reduction in analysis time compared to the HPLC methodology.
Altering the buffer cation provided a selectivity change between Impurity E and the Impurity pair; B and D. Ionic
strength of the buffer influenced the retentivity of Impurities B and D. Temperature was a useful selectivity
influence for HILIC method development. The informatics solutions within Empower provided trending insight
to effectively troubleshoot issues relating to poor sample preparation. The use of pre-column filters also
contributed towards achieving excellent column performance of over 1500 injections.
In retrospect, a Routine Use Study of the original HPLC methodology would be costly. Comparing the mobile-
phase consumption during 1500 injections on HPLC versus UPLC; HPLC would utilize approximately 65 liters
compared to 11 liters consumed using UPLC. At an average cost of $165 per liter acetonitrile, the resulting
methodology would save approximately $8800 in solvent consumption. Implementing UPLC technology
results in a time savings of 26 days per 1500 injections, or roughly an 80% reduction in analysis time in
which the resources can be better utilized to increase profitability.
References
1. Ali, M.S., Rafiuddin, S., Ghori, M., Khatri, R., Chromatographia 67, 517-525 [2008].
2. The Use of Medicines in the United States: Review of 2010. IMS Institute for Healthcare Informatics (April 2011). Retrieved on April 28, 2011.
3. Tache, F. and Albu, M., Revue Roumaine de Chimie 52(6): 603-609 [2007].
4. Arayne, M.S., Sultana, N., Zuberi, M.H., Pak J Pharm Sci 19(3): 231-5 [2006].
Waters, ACQUITY UPLC, Atlantis, and UPLC are registered trademarks of Waters Corporation. Empower, and The Science of What’s Possible are trademarks of Waters Corporation. All other trademarks are the property of their respective owners..
©2013 Waters Corporation. Printed/Produced in the U.S.A.March 2013 720004080EN VW-PDF