A typology and ecological classification system for Finnish ... · BOREAL ENV. RES. Vol. 10 • A...
21
BOREAL ENVIRONMENT RESEARCH 10: 159–179 ISSN 1239-6095 Helsinki 30 June 2005 © 2005 A typology and ecological classification system for Finnish lakes: applicability of the ECOFRAME scheme Mirva Nykänen 1) , Timo Kairesalo 1) , Suvi Mäkelä 2) , Eeva Huitu 2) , Pasi Ala-Opas 2) and Jaakko Mannio 3) 1) Department of Ecological and Environmental Sciences, University of Helsinki, Niemenkatu 73, FI-15140 Lahti, Finland 2) Lammi Biological Station, University of Helsinki, Pääjärventie 320, FI-16900 Lammi, Finland 3) Finnish Environment Institute, P.O. Box 140, FI-00251 Helsinki, Finland Nykänen, M., Kairesalo, T., Mäkelä, S., Huitu, E., Ala-Opas, P. & Mannio, J. 2005: A typology and ecological classification system for Finnish lakes: applicability of the ECOFRAME scheme. Boreal Env. Res. 10: 159–179. A pan-European typology and ecological classification system for shallow lakes was developed by the EU-funded project ECOFRAME. Here, we tested how the ECO- FRAME typology separates Finnish lakes. Without accounting for division by depth, six different ecotypes resulted, one of which included the majority of the lakes. Sub- division of typology appears necessary, especially for organic types. We also collected data on a set of lakes that were extensively studied for their chemical and biological elements and classified the lakes according to the ECOFRAME classification scheme. In general, the achieved ecological quality status for each lake was less favourable than we had expected. Inspection of individual variables used in the classification highlighted some characteristics of Finnish lakes that need to be addressed in the scheme. Macrophyte variables especially need revision to better reflect the state of Finland’s humic waters. However, many of the ECOFRAME solutions and guidelines were directly applicable. Introduction The European Water Framework Directive (WFD; 2000/60/EC) requires Member States to determine the ecological status of their fresh and saline waters, which should be done in a stepwise process beginning with establishing a typology for surface water bodies. The typol- ogy should reflect the natural differences present between the surface waters and their catchments. Reference conditions indicative of pristine state, or high ecological status, should be determined for each of the ecotypes in the typology along with lower grades of status, i.e. good, moderate, poor and bad. Finally, the status of all bodies of water should be classified according to this new system and all waters falling into the categories moderate, poor or bad, should be restored to at least good status over a specified period. The approach of the Directive differs con- siderably from that of former water quality clas- sifications, which have largely been based on the use of chemical determinants and discharge standards. The concept of ecological quality includes the functioning of the entire ecosys- tem and requires that management of the catch- ments be done in a holistic way. The Directive describes a wide range of not only chemical but
Transcript of A typology and ecological classification system for Finnish ... · BOREAL ENV. RES. Vol. 10 • A...

BOREAL ENVIRONMENT RESEARCH 10: 159–179 ISSN 1239-6095Helsinki 30 June 2005 © 2005
A typology and ecological classification system for Finnish lakes: applicability of the ECOFRAME scheme
Mirva Nykänen1), Timo Kairesalo1), Suvi Mäkelä2), Eeva Huitu2), Pasi Ala-Opas2) and Jaakko Mannio3)
1) Department of Ecological and Environmental Sciences, University of Helsinki, Niemenkatu 73, FI-15140 Lahti, Finland
2) Lammi Biological Station, University of Helsinki, Pääjärventie 320, FI-16900 Lammi, Finland3) Finnish Environment Institute, P.O. Box 140, FI-00251 Helsinki, Finland
Nykänen, M., Kairesalo, T., Mäkelä, S., Huitu, E., Ala-Opas, P. & Mannio, J. 2005: A typology and ecological classification system for Finnish lakes: applicability of the ECOFRAME scheme. Boreal Env. Res. 10: 159–179.
A pan-European typology and ecological classification system for shallow lakes was developed by the EU-funded project ECOFRAME. Here, we tested how the ECO-FRAME typology separates Finnish lakes. Without accounting for division by depth, six different ecotypes resulted, one of which included the majority of the lakes. Sub-division of typology appears necessary, especially for organic types. We also collected data on a set of lakes that were extensively studied for their chemical and biological elements and classified the lakes according to the ECOFRAME classification scheme. In general, the achieved ecological quality status for each lake was less favourable than we had expected. Inspection of individual variables used in the classification highlighted some characteristics of Finnish lakes that need to be addressed in the scheme. Macrophyte variables especially need revision to better reflect the state of Finland’s humic waters. However, many of the ECOFRAME solutions and guidelines were directly applicable.
Introduction
The European Water Framework Directive (WFD; 2000/60/EC) requires Member States to determine the ecological status of their fresh and saline waters, which should be done in a stepwise process beginning with establishing a typology for surface water bodies. The typol-ogy should reflect the natural differences present between the surface waters and their catchments. Reference conditions indicative of pristine state, or high ecological status, should be determined for each of the ecotypes in the typology along with lower grades of status, i.e. good, moderate,
poor and bad. Finally, the status of all bodies of water should be classified according to this new system and all waters falling into the categories moderate, poor or bad, should be restored to at least good status over a specified period.
The approach of the Directive differs con-siderably from that of former water quality clas-sifications, which have largely been based on the use of chemical determinants and discharge standards. The concept of ecological quality includes the functioning of the entire ecosys-tem and requires that management of the catch-ments be done in a holistic way. The Directive describes a wide range of not only chemical but

160 Nykänen et al. • BOREAL ENV. RES. Vol. 10
also biological and hydromorphological vari-ables to be measured. However, it only gives general guidelines as to how the classification system should be established. This raises issues of comparability across the EU states.
The EU project ECOFRAME (hereafter EF) attempted to solve some of these problems. Using expert workshops and subsequent field testing in ten European countries, the project developed a practicable pan-European typology and classification system for shallow lakes that can be extended to all lakes. This EF scheme is minimal but is based on current limnologi-cal knowledge and is thus as cost-effective as possible, given the provisions of the Directive. Moss et al. (2003) offered the scheme for opera-tional testing and further refinement by statutory authorities.
The EF typology (Moss et al. 2003) is based on four climate categories (cold, cool, temperate and warm), defined by the period of annual ice cover and the mean air temperature of the warm-est month. These subsume considerations of lati-tude, longitude and altitude, listed in the Direc-tive, into geographical components and cover the region from the Arctic to the Mediterranean.
The typology uses two lake area categories, with a threshold of 100 km2 separating very large lakes, with major wind effects, from smaller lakes. A further distinction is then made accord-ing to the catchment into organic, peat-based catchments with more than 50% of the area covered by peat deposits and into mineral catch-ments with more than 50% of their area floored by rock or mineral-based soils. Within these categories, three classes of conductivity are used (low, medium and high). These reflect water sup-plied from acid peat or poorly weathered rocks (< 100 µS cm–1), from base-rich peat or soils, often from underlying calcareous rocks (101–800 µS cm–1) and waters with some saline influ-ence, either from natural percolation of marine-derived groundwater or from high evaporation or even endorheicity (> 800 µS cm–1).
This core typology has 48 ecotypes (four climate ¥ two area ¥ two catchment substratum ¥ three conductivity). The scheme is open-ended and allows subdivision of core categories in spe-cific areas, if needed. However, it should remain
robust and comparable across the Member States (Moss et al. 2003).
In the first instance the EF scheme applies to shallow lakes with mean depth < 3 m. In the pristine state the productivity of shallow lakes is dominated by benthic either algal or macro-phytic and their associated periphytic communi-ties, rather than by phytoplankton. The scheme can potentially be extended to all lakes. In the simplest way this could be done by the creation of two depth categories, i.e. mean depth ≤ or > 3 m, and simple replication of the 48 ecotypes (Moss et al. 2003). However, modifications would then be needed for the ecological qual-ity parameters, since assumption of macrophyte dominance under conditions of high ecological status is not valid in deep lakes.
To develop a classification system for eco-logical quality, ECOFRAME translated the gen-eral guidelines of the Directive into specific requirements for each ecotype, based on a mini-mum number of variables. Ultimately, a suite of 28 variables was developed, some of which can be determined by a single visit to the lake. The variables are explained in detail in Moss et al. (2003).
Current interpretation of the Directive sug-gests that all elements, not individual param-eters, must meet the standards set to attain a given quality. The EF scheme differs from this by premising that 80% of all the variables must achieve a particular quality class (or better) for the lake to be placed in that class. The Directive indicates that prime importance should be given to biological variables. The EF assessment notes this by performing the estimations separately for the biological variables alone and for all the vari-ables together. The lower quality level of these two estimates is accepted for the final lake qual-ity status (Moss et al. 2003).
In the present paper we aimed at testing how the EF typology separates Finnish lakes. We also determined the ecological quality of 25 lakes according to the EF scheme to test how much this pan-European classification system is applicable to Finland. Finally, we evaluated the relevance and applicability of each EF variable and developed some refinements in terms of the classification of lakes in Finland.

BOREAL ENV. RES. Vol. 10 • A typology and ecological classification system for Finnish lakes 161
Material and methods
Typology
We used a dataset of 874 lakes in Finland involved in the joint Nordic Lake Survey (Hen-riksen et al. 1996–1998, Mannio et al. 2000) to determine how the EF typology separates these lakes. The lakes for the Nordic Lake Survey were selected at random from national lake reg-isters with the common requirements that a mini-mum of 1% of the number of lakes within any county/region should be included. However, this basic percentage was weighted for larger size classes and, therefore, all the lakes in the largest size class (> 100 km2) were included. Sampling of the lakes was conducted in autumn 1995. Further selection criteria, as well as the sampling methods used, were presented by Henriksen et al. (1996–1998) and Mannio et al. (2000).
In this large dataset, information required for the EF typology was available for 821 lakes: location, surface area, percentage of peatland in the catchment and conductivity. However, no information on depth was available, which can be regarded as a major division criterion of the typology. Without this separation by depth, we grouped the lake data according to the EF typol-ogy to determine which ecotypes exist in Finland and how the lakes are distributed between these ecotypes. Since large lakes were better repre-
sented in the dataset than small lakes, we cor-rected for size classes to obtain a more reliable estimate for the occurrence of each ecotype in Finland. Correction was based on information on the percentage of lakes studied from the total number of lakes in five size classes and five dif-ferent regions in Finland.
Ecological quality classification
To test the applicability of the EF quality classifi-cation system, we examined a set of 25 lakes that had chemical and biological data available for the classification (Table 1). These lakes are situ-ated in southern Finland (Häme region), except one (Lake Kevätön) located in central Finland. The lakes varied from small oligotrophic forest lakes to eutrophic lakes in agricultural or urban areas. Six of these lakes were studied during the ECOFRAME project in 2000–2001 (referred to as EF lakes), while 17 in the Lammi area were studied in 1997–1999 (referred to as Lammi lakes). Data for two lakes were collected from several reports: Kärkjärvi representing the year 1996 (Venetvaara et al. 1996) and Lake Kevätön representing the years 1989–1994 (Lehtinen and Muje 1989, Nybom 1990, Lehtinen 1991, Bibi-ceaunu and Veijola 1995, Anon. 1999).
Since the data were collected from vari-ous sources the sampling methods differed
Table 1. Morphological, chemical and biological characteristics of the 25 test lakes. Fish variables are calculated only for 23 lakes.
Mean Median Minimum Maximum N
Mean depth (m) 3.4 2.5 1.2 11.0 25Area (ha) 143 39 8 933 25Conductivity (µS cm–1) 80 78 20 156 25Alkalinity (mmol l–1) 0.30 0.31 0.04 0.60 25pH 7.1 7.1 5.6 8.1 25Total P (µg l–1) 30 23 5 107 25Total N (µg l–1) 606 550 252 1291 25Secchi depth (m) 2.2 2.0 0.6 6.1 25Chlorophyll a (µg l–1) 20.4 8.6 0.7 208.5 25Species number, hydrophyte vascular plants 11 9 1 26 25Cladocera, large to total ratio by numbers 0.59 0.58 0.26 0.96 25Zooplankton to chlorophyll-a ratio by biomass (µg DW µg–1) 42.1 34.4 3.4 117.1 25Fish biomass as catch per unit effort with Nordic nets (g) 1505 1139 476 4701 23Piscivores to other fish ratio by biomass 1.9 0.4 0.1 31.9 23

162 Nykänen et al. • BOREAL ENV. RES. Vol. 10
between the lakes. To harmonize the dataset we selected those samples that best corresponded to the methods used in the ECOFRAME project (described in Moss et al. 2003, Nõges et al. 2003). In the EF lakes, the chemistry and phy-toplankton samples consisted of pooled tube samples from the nonstratified part of the lake centre taken in July and August in two consecu-tive years. Other lakes had been sampled from the deepest point of the lake, separately from the surface and 1 m above the lake bottom. To avoid the influence of the possibly deoxygenated hypolimnion with distinctive chemical features, we used only the data on the surface water sam-ples. When several relevant measurements were available, we used mean values to avoid excep-tional or extreme values; however, only summer values were used.
Zooplankton samples in the EF lakes were pooled from several sampling points, but only one pooled surface water sample from the deep-est point was taken in the Lammi lakes and Kärkjärvi. Lake Kevätön was sampled from sur-face to bottom at 3-m intervals. In this test we used the mean value of these samples weighted by the area of each depth zone in the lake. The zooplankton data on the Lammi lakes were avail-able only as densities. To convert the numbers to biomasses we used species-specific mean bio-masses derived from the EF lakes. The relevant data on benthic invertebrates were also available only from the EF lakes.
The biomass of fish was difficult to estimate as actual biomass per surface area, even though test fishing was conducted with similar stand-ard multimesh gillnets (NORDIC) in the EF and Lammi lakes. To include this variable, we devised new categories indicating the biomasses and idea of the scheme but without actual values. We performed a biomass estimate for each lake according to these new categories, using all the information available on the fish commu-nity (catch-per-unit-effort, size structure, species composition). The new categories were:
— high and good status: fish stocks natural or near-natural,
— moderate: slightly increased densities,— poor: overdense fish population,— bad: fish kills, decreased stocks.
The poorest quality classes for acidified lakes or lakes polluted with toxic substances included:
— poor: decreased fish stocks, reproduction fails,
— bad: no fish.
The last EF variable deals collectively with specific pollutants listed in the WFD (Moss et al. 2003). However, we had no information on the concentrations of priority or other damag-ing substances in our lake set, which forced us to assume that all the lakes were unpolluted by these substances. This assumption is prob-ably valid, since no lake received considerable amounts of industrial wastewaters.
After we had collected the information for each lake, and for each variable used in the EF scheme, we determined the ecological status according to EF instructions (Moss et al. 2003). Firstly, we selected the appropriate ecotype for each lake. Secondly, we compared the measured values with the range of values given for that eco-type in the EF scheme, and the ecological status (from high to bad) was determined for each vari-able. Thirdly, to determine the final ecological status an assessment (at 80% compliance level) was performed separately, using the biological variables alone and all the variables together. Since this method for determining final ecologi-cal status differs from that given in the Directive, we also attempted to determine whether averag-ing the intraelement parameters and the ‘one-out, all-out principle’ could be applied at the elemen-tal level for the EF scheme.
To evaluate the result of the EF classification, we compared the EF result (1) with an ‘expert judgement’ based on our current knowledge of water chemistry, lake history and catchment use; (2) with the general water quality classifica-tion system for surface waters, widely used by the Finnish Environment Institute (FEI); and (3) with a model based on the total phosphorus concentration of the lake water. Since eutrophi-cation was the main problem in our study lakes, we estimated the natural background phosphorus concentrations for the lakes, using the morpho-edaphic index (MEI; Vighi and Chiaudani 1985), based on the alkalinity (MEIalk) or conductivity (MEIcond) of the water. We estimated the differ-

BOREAL ENV. RES. Vol. 10 • A typology and ecological classification system for Finnish lakes 163
ence between the current situation and ‘the natu-ral level’ according to the ratio between the cal-culated background phosphorus and the current measured phosphorus concentrations. The lakes were ranked according to ratios as follows: high < 1.25, good < 1.5, moderate < 2 and poor > 2.
Results and discussion
Typology
Without division by depth, and assuming that all lakes in Finland belong to the climate category ‘cool’ (ice cover > 2 mo, mean temperature of the warmest month > 10 °C), six different eco-types resulted when we grouped the data of the joint Nordic Lake Survey according to the EF typology (Fig. 1). Since no relevant depth data were available we considered only these six ecotypes, including both shallow and deep lakes. However, the possible number of ecotypes could be 12 if two depth categories were used (mean depth < 3 m and > 3 m), thus resulting in shallow and deep lakes in each ecotype. However, since all large lakes in Finland (> 100 km2) have mean depths of > 3 m, only small lakes would have two depth categories, thus yielding ten possible ecotypes.
The lakes were distributed among the EF ecotypes very unevenly (Figs. 1 and 2). Our rough estimate showed that about 90% of lakes in Finland fall into Ecotype 7, which is a small lake type with mineral catchment and low con-ductivity (ecotype numbers refer to those used in the EF scheme by Moss et al. 2003). If only those lakes larger than 50 ha were considered, the next most common type (5 %) was Ecotype 8, a small lake with mineral catchment and medium water conductivity. Ecotype 10, a small lake with organic catchment and low water con-ductivity, was the third most common type (only 2%). If smaller lakes were also considered (> 4 ha), organic Ecotype 10 was more common than the mineral, medium-conductivity Ecotype 8, with 5% and 3%, respectively. Only a small fraction of Finnish lakes fell into the other lake types, e.g. into Ecotype 9, which is a small, min-eral, high-conductivity type, and into two large lake types, Ecotypes 31 and 32. Both these large
lake types have mineral catchments; in addition Ecotype 31 has low and Ecotype 32 medium levels of water conductivity.
The small, mineral, low-conductivity lakes were scattered throughout Finland (Fig. 1). Similar but large lakes were concentrated in the Finnish Lake District in the central and southeastern parts of the country. Organic lakes were most common in western coastal areas, in
Fig. 1. Areal distribution of the joint Nordic Lake Survey lakes in Finland, grouped according to the ECOFRAME ecotypes.

164 Nykänen et al. • BOREAL ENV. RES. Vol. 10
the Oulu region and northern Karelia. Most of the medium-conductivity lakes were located in southern Finland, although some small, medium-conductivity lakes were also found in calcareous areas of Kuusamo and Kittilä in northern Fin-land. The only lake with high conductivity (Eco-type 9) was located on the southwestern coast. Some young possibly brackish water lakes may be present in coastal areas.
Virtually all large lakes (> 100 km2) were included in the Nordic lake dataset, suggesting that in this size category the only lake types in Finland are Ecotypes 31 and 32. However, only a small fraction of small lakes (< 100 km2) were included, suggesting that Ecotypes 7–10 may also be present in other areas. Two additional ecotypes, Ecotypes 11 and 12 (small, organic lakes with medium or high conductivity) could possibly be found in this size category. How-ever, since the lakes were selected randomly, the dataset used should give a general figure for the distribution of ecotypes.
It is, however, questionable whether this typology is relevant for lakes in Finland. The EF scheme suggests that the typology is only a core scheme and allows subdivisions where needed. In boreal regions, one important subdivision could be the percentage of organic soils in the catchment area (Moss et al. 2003). Division by 50% peatland in the catchment separated only the most coloured lakes in Finland, while the
majority of low-conductivity lakes fell into the mineral type (Ecotype 7), with wide variation in water colour (Fig. 2). Variation was high, espe-cially when small lakes (> 4 ha) were included, but was also high for lakes larger than 50 ha. Further division of mineral types appears nec-essary, especially if clear-water lakes are to be separated from more brownish lakes. Inclusion of a ‘partly organic type’ between the ‘mineral’ and ‘truly organic type’ may therefore be highly relevant.
There was a significant correlation between the percentage of peatland in the catchment and the water colour in this dataset of over 800 lakes. Correlation was, however, rather weak (rs = 0.463, p < 0.001). Both natural and anthropo-genic factors for this weak correlation compli-cate the direct use of water colour or peatland percentage in typology. Water colour may be adopted directly into official typologies in sev-eral countries, although it may change greatly, due to anthropogenic disturbances such as ditch-ing in the catchment. The changes observed in certain lakes occur over a range of values that can easily transform a lake to another ecotype, making the direct use of water colour in typol-ogy questionable. For example, the water colour of rather large and deep Pääjärvi (surface area 13 km2, maximum depth 87 m, catchment area 244 km2) was 40–60 mg Pt l–1 in the 1970s (Ruuhijärvi 1974), but as high as 96 mg Pt l–1 in
Fig. 2. Water colour of the joint Nordic Lake Survey lakes in Finland, grouped according to the ECOFRAME eco-types: — a: > 4 ha, — b: > 50 ha. The figure presents the median values, quartiles, nonoutlier minimum and maxi-mum values, outliers (circles), extremes (asterisks) and the number of lakes (N ) in each ecotype.
34237136700N =
Ecotype
323110987
Col
our
Pt m
g l–1
600
400
200
0
a
3424117218N =
Ecotype
323110987
600
400
200
0
b

BOREAL ENV. RES. Vol. 10 • A typology and ecological classification system for Finnish lakes 165
1999 (Huitu and Mäkelä 1999). However, use of the percentage of peatland in the catchment in typology is likewise not straightforward. The natural source of variance in water colour derives from the distance of peatland from the lake shore. Swampy shores may increase the water colour even though the catchment could be mainly mineral-based. The ratio between the lake area and the catchment area is also an important factor. It would be worth investigat-ing the possible development of a peat index accounting for not only the percentage of peat-land, but also other features involved in the catchment and lake morphometry (e.g. Rasmus-sen et al. 1989).
Another important aspect concerns moun-tain lakes in Finnish Lapland. The current EF division by climate is valid over wide geo-graphic areas, but is not practical if the aim is to separate subarctic lakes from other lakes in Finland. For example, division by altitude (or tree line) could provide a correct separation of subarctic lakes.
Conductivity could divide catchments with acid peat or poorly weathered rocks from base-rich peat or soils with often calcareous rocks, as well as from waters with some saline influ-ence. Conductivity may increase slightly along with the eutrophication process but the three EF conductivity classes should be easy to recognize. The medium-conductivity types (Ecotypes 8 and 32) will group together lakes in calcium-rich areas with those in thick, fine-textured soils, possibly leading to clay turbidity. These lake types may be separated by alkalinity or calcium-concentration. There are also some exceptional lakes that should be treated separately, especially those located in the sulphide-rich soil types on the western coast of Finland.
Further subdivision for surface area catego-ries could also be done because the upper limit for a small lake (100 km2) is quite high. How-ever, each subdivision will increase the number of ecotypes to be described for the ecological quality classification. The classification system finally adopted will determine the need for dif-ferent ecotypes. When we classified 25 lakes according to the EF scheme, it became obvi-ous that certain subdivisions could improve the applicability of the scheme.
Ecological quality classification
Final ecological status
The EF scheme states that ecological status should be determined for biological variables alone, and for all the variables together, and the lower of these two estimates should be accepted as the final ecological quality. The biological variables alone always resulted in equal or less favourable status than all variables and were thus accepted for the final quality grade. These final ecological status assessments corresponded to our own expert judgement in 12 lakes, but were lower in 13 lakes (Table 2).
Lake Ahvenlammi was the only lake whose status was ranked as high in our own expert judgement as by the FEI system and by both MEI models. This lake is a near-pristine, clear-water forest lake and also achieved high status according to the EF system. At the other end, two lakes (Kevätön and Matjärvi) whose status we judged to be poor, were also ranked as such by the EF and FEI classifications and both MEI models. In addition to these lakes at both ends of the quality range, only one moderate-quality lake (Merrasjärvi) was ranked as such by every method (Table 2).
The other lakes, especially those seven we judged to be in high–good or good condition, received less favourable status according to the EF scheme. Kastanajärvi was the only lake whose status was ranked as good in the final EF classification. It is an almost pristine, clear-water lake with no agricultural activities in its catchment. Other lakes were ranked as moderate and Harasjärvi even as poor. Lakes Sammalisto, Riikoisten Valkjärvi and Pyhäjärvi achieved good status according to all variables, but the biological variables downgraded these lakes to moderate class. However, the MEI models sug-gested that our ‘expert judgement’ regarding good quality may have been too optimistic for three lakes in this category (Riikoisten Valkjärvi, Tevänti and Iso Vehkajärvi).
Six lakes of those we judged as good–moder-ate or moderate, also achieved moderate quality status in the EF scheme, but seven lakes achieved only poor status. The results of the MEI models varied, showing poorer status for four lakes than

166 Nykänen et al. • BOREAL ENV. RES. Vol. 10
was achieved in our own classification, but better status for three lakes. Kärkjärvi showed the high-est deviation amongst different assessment meth-ods. We had ranked this lake as good–moderate, as did the FEI system. The MEIalk model ranked the status of this high-alkalinity lake as high, and the MEIcond model as good. However, in the EF scheme this lake achieved only poor status.
In these comparisons, few remarks should be emphasized because the various classifica-tion systems were based on different approaches and none had as wide a scope as the EF scheme. Differences between the ecological quality rates as judged by us and as actually determined may simply have resulted from our too optimistic estimates. In addition, the general water quality
classification system is not truly comparable to the EF grades because the underlying view-point of this system is the usability of waters for human purposes rather than for ecological quality. It also relies almost purely on chemical variables, whereas the final status assessments as determined by the EF scheme were actually based on biological variables alone. The esti-mates based on the MEI model accounted only for total phosphorus, nothing else. In addition, the models between phosphorus concentration and MEIalk or MEIcond (Vighi and Chiaudani 1985) encompass a fairly wide deviation, and the relationship may differ locally from the gen-eral model derived from a large geographical area. These models were not at all applicable to
Table 2. Final ecological status determined by the ECOFRAME scheme, and the results of other water quality clas-sifications. The final ECOFRAME classification followed the biological variables alone, but the determination based on all variables is also shown. ‘Tot P/ref Palk’ and ‘Tot P/ref Pcond’ classifications are based on the ratio between the measured total phosphorus concentration and the ‘reference’ concentration, which was calculated from alkalinity or conductivity according to the MEI models (Vighi and Chiaudani 1985). For comparison, we calculated a mean and standard deviation for all classifications expressed as numbers: 1 = high; 1.5 = high–good; 2 = good; 2.5 = good–moderate; 3 = moderate; 3.5 = moderate–poor; 4 = poor. The EF lakes are indicated with a superscript.
Lake name Final ecological All variables Tot P/ Tot P/ General Expert Mean ± S.D. status (ECOFRAME) ref Palk ref Pcond water quality judgement (ECOFRAME) (MEI) (MEI) classification (FEI)
AhvenlammiEF 1 1 1 1 1 1 1.0 ± 0.0Kastanajärvi 2 1 1 1 2 1.5 1.4 ± 0.5SammalistoEF 3 2 2 1 2 1.5 1.9 ± 0.7Riikoisten Valkjärvi 3 2 4 3 2 1.5 2.6 ± 0.9Pyhäjärvi 3 2 2 1 2 2 2.0 ± 0.6Tevänti 3 3 3 3 2 2 2.7 ± 0.5Iso Vehkajärvi 3 3 3 3 3 2 2.8 ± 0.4Harasjärvi 4 3 2 2 3 2 2.7 ± 0.8Ormajärvi 4 3 4 4 2 2.5 3.3 ± 0.9Kärkjärvi 4 4 1 2 2.5 2.5 2.7 ± 1.2Pakkaselanjärvi 3 3 2 2 3 2.5 2.6 ± 0.5Suolijärvi 3 3 3 3 3 2.5 2.9 ± 0.2Lehee 3 3 1 2 3 2.5 2.4 ± 0.8Kaukasenjärvi 3 3 3 3 3 2.5 2.9 ± 0.2Teuronjärvi 3 3 3 3 2 3 2.8 ± 0.4MerrasjärviEF 3 3 3 3 3 3 3.0 ± 0.0Ekojärvi 4 4 2 2 3 3 3.0 ± 0.9Pannujärvi 4 4 3 3 3 3 3.3 ± 0.5Hervonjärvi 4 4 4 4 3 3 3.7 ± 0.5SylvöjärviEF 4 4 4 4 3 3 3.7 ± 0.5PukalajärviEF 4 4 4 4 3 3 3.7 ± 0.5Kataloistenjärvi 4 4 2 3 3 3.5 3.3 ± 0.8Kyynäröjärvi 4 4 4 4 4 3.5 3.9 ± 0.2Kevätön 4 4 4 4 4 4 4.0 ± 0.0MatjärviEF 4 4 4 4 4 4 4.0 ± 0.0

BOREAL ENV. RES. Vol. 10 • A typology and ecological classification system for Finnish lakes 167
lakes in Norway with their low conductivity (A. Lyche-Solheim pers. comm.). However, when applied to our lake set these models gave results similar to those obtained with our own expert judgement in most cases, although more often with the MEIcond model (16 lakes) than with the MEIalk model (14 lakes). Thus, these models may give some indication of the eutrophication status in lakes, at least in southern Finland, with their relatively wide range of natural conductivities. However, use of the alkalinity-based model may give biased results in lakes exposed to acidifica-tion.
However, based on these comparisons it appeared that the EF scheme was too stringent. The division between moderate and good is extremely crucial, because the Directive requires the Member States to rehabilitate their lakes to at least good status. Authorities will face a diffi-cult future restoration effort if only near-pristine lakes can achieve good quality status.
Phytoplankton variables
To determine why the EF scheme was too strin-gent we examined the variables individually and noted the large differences that became apparent (Table 3). The first biological variable (chloro-phyll a) correlated well with our expert judge-ment (rs = 0.690, p < 0.001) as well as with the chemical variables total phosphorus (rs = 0.654, p < 0.001), total nitrogen (rs = 0.650, p < 0.001) and Secchi depth (rs = 0.698, p < 0.001) (Table 4). The class boundaries of the EF scheme were not strictly applied because the status of most of the lakes was ranked as high or good (Table 3).
In addition to chlorophyll a, phytoplank-ton is included in the scheme as a variable ‘phytoplankton diversity’. This variable largely separates the two poorest quality classes based on the occurrence of surficial blooms of cyano-bacteria (Moss et al. 2003). Thus, it does not require great expertise and time for counting phytoplankton samples. In this respect, the vari-able worked well; however, it does not aid in separating good status from moderate, which is the most critical division for restoration obliga-tion. We suggest the same approach, but a more refined description of the frequency and intensity
of the surficial blooms of cyanobacteria or other harmful algae.
Zooplankton variables
Zooplankton is not included in the provisions of the Directive; however, occupying an intermedi-ate position between phytoplankton and fish and thus being of great importance in the functioning of the lake ecosystem, this group was included in the EF scheme. The first zooplankton variable is the ratio between the large species and total den-sity of Cladocera. This variable rests on the con-cept of the size-efficiency hypothesis (Brooks and Dodson 1965, Hall et al. 1976). In high-quality lakes, predation pressure of fish on zoo-plankton should be relatively low and zooplank-ton grazing pressure on phytoplankton should be high. Furthermore, shallow lakes should have macrophytes providing hiding places for cladocerans against fish predation (Timms and Moss 1984, Schriver et al. 1995, Stansfield et al. 1997, for review see Burks et al. 2002). In deep lakes, cladocerans may escape fish predation by vertical migration into deeper and darker water layers, especially if the hypolimnion is well oxy-genated (Zaret 1975, Zaret and Suffern 1976). In this situation, large cladoceran species can persist and efficient grazing on phytoplankton may prevail. The other zooplankton variable was the ratio between the crustacean zooplankton biomass and that of phytoplankton measured as chlorophyll a. This variable could indicate the potential grazing pressure exerted by zooplank-ton on phytoplankton (Jeppesen et al. 1997).
Our expert judgement correlated well with the lake chemistry and thus reflected the nutrient status of the lake, which we will discuss later (Table 4). However, neither of the zooplankton variables correlated with our expert judgement, they may indicate characteristics and mecha-nisms of the lake ecosystem other than just water quality, e.g. fish predation, invertebrate preda-tion, hiding places and food quantity and quality. These characteristics surely varied in our study lakes, since we examined shallow and deep lakes, and clear- and brown-water lakes. More-over, in most of the study lakes the zooplankton was sampled from only a single point; therefore,

168 Nykänen et al. • BOREAL ENV. RES. Vol. 10T
able
3. C
lass
ifica
tion
of th
e te
st la
kes
acco
rdin
g to
indi
vidu
al v
aria
bles
use
d in
the
EC
OF
RA
ME
sch
eme
(Mos
s et
al.
2003
). 1
= h
igh;
2 =
goo
d; 3
= m
oder
ate;
4 =
poo
r;
and
5 =
bad
eco
logi
cal q
ualit
y. T
he E
F la
kes
are
indi
cate
d w
ith a
sup
ersc
ript.
Ele
men
ts:
Pla
nkto
n M
acro
phyt
es
Mac
roin
vert
ebre
ates
F
ish
Phy
sico
chem
ical
M
orph
olog
ical
H
ydro
logi
cal
Lake
nam
e
Ahv
enla
mm
iEF
7 1
1 1
1 1
3 1
4 1
1 1
1 1
1 1
1 1
1 1
1 1
1 2
1 2
1 1
1K
asta
najä
rvi
7 1
1 1
1 3
3 1
1 1
1 1
1 2
1 1
1 1
1 2
1 1
1 1
1S
amm
alis
toE
F
10
1 1
3 4
1 3
1 5
3 2
1 1
1 1
1 1
1 1
1 1
1 1
1 2
1 1
1 1
Riik
oist
en V
alkj
ärvi
7
1 1
1 4
3 3
1
1
1 1
1 1
2 3
1 1
1 1
1 1
1 1
1 1
Pyh
äjär
vi
8 1
1 1
3 3
1 1
1 1
4 1
1 1
1 1
1 1
1 5
2 1
1 1
1T
evän
ti 7
1 1
3 3
3 3
1
1
1 4
1 2
3 3
1 1
1 1
2 2
2 1
1 1
Iso
Veh
kajä
rvi
7 1
1 3
4 3
3 3
1 1
3 1
1 4
4 1
1 1
1 1
2 1
1 1
1H
aras
järv
i 7
3 1
1 4
3 3
1
1
3 4
1 2
4 3
1 1
1 1
4 2
2 1
1 1
Orm
ajär
vi
8 1
4 1
3 3
1 1
1 1
4 1
1 1
1 1
2 1
1 5
4 2
1 3
3K
ärkj
ärvi
7
1 4
1 4
3 1
1
1
4 4
1 2
4 3
1 2
1 1
4 2
2 1
1 1
Pak
kase
lanj
ärvi
7
2 1
1 3
3 1
1
1
1 4
1 2
4 3
1 1
1 1
2 2
2 1
1 1
Suo
lijär
vi
8 1
1 1
3 3
1 1
1 1
4 1
1 1
3 1
1 1
1 5
2 2
1 1
1Le
hee
8 1
1 1
3 3
1 3
1 1
4 1
1 1
3 1
1 1
1 5
2 2
1 3
3K
auka
senj
ärvi
8
2 1
3 1
3 3
1
1
3 4
1 1
2 4
1 1
1 1
4 4
2 1
1 1
Teu
ronj
ärvi
7
1 1
3 3
3 1
3
1
1 4
1 2
4 3
1 1
1 1
5 2
2 1
1 1
Mer
rasj
ärvi
EF
8 1
1 1
3 3
3 1
2 1
2 4
1 3
4 1
2 2
4 1
1 1
1 4
2 4
1 1
1E
kojä
rvi
7 4
1 1
4 3
3 1
1 1
3 1
2 4
4 1
1 1
1 4
2 2
1 1
1P
annu
järv
i 7
4 4
3 4
1 3
1
1
1 4
1 2
3 3
1 1
1 1
4 2
1 1
1 1
Her
vonj
ärvi
7
1 4
1 4
3 4
1
1
1 1
1 2
4 3
1 1
1 1
5 4
1 1
1 1
Syl
vöjä
rviE
F
7 1
1 3
3 3
1 1
4 2
2 3
1 4
4 1
3 4
4 1
1 1
1 4
4 2
1 1
1P
ukal
ajär
viE
F
10
2 1
3 3
3 4
4 5
1 1
1 1
1 4
1 3
2 3
1 1
1 1
4 4
2 1
4 4
Kat
aloi
sten
järv
i 7
2 4
3 4
3 1
3
1
4 4
1 2
4 4
1 1
1 1
4 4
2 1
1 1
Kyy
närö
järv
i 8
5 4
1 4
3 3
1
1
1 3
1 4
3 5
1 1
1 1
4 4
2 1
1 1
Kev
ätön
7
4 5
3 4
3 1
1
1
4 4
1 4
4 5
1 1
1 1
5 4
2 1
4 4
Mat
järv
iEF
7 3
4 3
3 3
1 1
5 1
1 4
1 4
4 1
5 4
5 1
1 1
1 4
4 2
1 4
4
Ecotype
Chlorophyll a
Phytoplankton diversity
Cladocera large:total ratio
Zoopl.:chlorophyll ratio
Plant community
Plant diversity
Plant abundance
Invertebrate predators %
Naid:Naid+chi ratio
Sensitive taxa %
Oligo:chiro ratio
Fish community
Fish biomass
Piscivore:total ratio
pH
Total P
Total N
Secchi depth
Temperature
Oxygen
Salinity
Toxic pollution
Lake shore
Depth variation
Substrate
Groundwater
Water flow
Residence

BOREAL ENV. RES. Vol. 10 • A typology and ecological classification system for Finnish lakes 169
the patchy distribution of zooplankton may have biased the results.
Despite this natural and methodological vari-ation we found some interesting although weak correlations. The ratio of large species to total density of Cladocera correlated positively with Secchi depth (rs = 0.492, p < 0.05), i.e. large species of Cladocera were found together with high levels of transparency. Furthermore, a nega-tive correlation between chlorophyll a and the ratio between zooplankton and phytoplankton biomass (rs = –0.622, p < 0.01) was indicative of the potential ability for zooplankton to control phytoplankton biomass in lakes with low levels of chlorophyll a.
Even though these zooplankton variables did not correlate with the approximated lake qual-ity status in our lake set, they provided eco-logically important data. To set the correct class boundaries for each ecotype is a demanding task, however, and would need further analyses. For example, top-down control by fish may be more important in shallow lakes than in deep lakes (Jeppesen et al. 1997). The planktonic foodweb may also be more complex in brown-water lakes with large amounts of organic, allochthonous material (Hessen 1989, Salonen et al. 1992, Sar-vala et al. 1999).
Macrophyte variables
All three macrophyte variables raised some issues. The ‘plant community’ variable resulted in moderate status in nearly every lake (Table 3). The EF scheme describes very generally only six plant community types for shallow lakes in Europe, reflecting the downgrading status as eutrophication and water turbidity proceed. The description of these communities is largely a compromise, and it may be necessary to adopt additional community types in different areas of Europe. Some botanical lake types, at least in Finland, were difficult to categorize under any of the EF plant community types. Further descrip-tions are needed, especially for high- and good-quality lakes.
For example, EF typology groups most of the Finnish lakes into Ecotype 7 (small, mineral, low-conductivity lakes), in which ‘Iso’ (isoetids) is the only plant community type described for high and good quality. This same plant com-munity type is described even for Ecotype 10, which is the organic type. As described, this community should be dominated by isoetids which have waxy cuticles and derive much of their carbon dioxide from the sediments through their root systems. However, organic lakes with
Table 4. Relationships among numerical variables and ‘expert judgement’ of the lake status obtained from 25 Finn-ish lakes (for fish variables only 23 lakes). Values are Spearman’s correlation coefficients. Bonferroni-corrected significances (two-tailed) are marked with asterisks.
TP TN Secchi Chphyll Zoopl Zoopl: Plant Fish Pisciv: Expert lge:total phytop diversity biom others judgem
PH ns ns ns ns ns ns 0.639** ns ns nsTP 0.800*** –0.776*** –0.654*** ns ns ns ns –0.584** –0.795***TN –0.794*** –0.650*** ns ns ns ns –0.526** –0.754***Secchi –0.698*** 0.492* ns ns ns ns –0.714***Cphyll ns –0.622** ns ns ns –0.690***Zoopl lge:total ns ns ns ns nsZoopl:phytop ns ns ns nsPlant diversity ns ns nsFish biom ns nsPisciv:others ns
***p < 0.001, **p < 0.01, *p < 0.05; ns, not significant. Abbreviations: TP = total phosphorus concentration; TN = total nitrogen concentration; Secchi = Secchi disc transparency; Chphyll = chlorophyll-a concentration; Zoopl lge:total = ratio of numbers of large species of Cladocera to total density of Cladocera; Zoopl:phytop = ratio of crus-tacean zooplankton biomass as dry weight to chlorophyll a; Plant diversity = number of hydrophyte vascular plant species; Fish biom = biomass of fish as catch per unit effort in Nordic multimesh gillnets; Pisciv:others = ratio of piscivores to the others in the total catch of fish with Nordic multimesh gillnets; Expert judgem = expert evaluation of the lake status as classified from one (high) to five (bad).

170 Nykänen et al. • BOREAL ENV. RES. Vol. 10
brown, poorly transparent water and soft bot-toms are usually characterized by the presence of nympheids with some mosses. Inclusion of this brown-water community type would improve the scheme. Some high-quality Ecotype 7 lakes in Finland are characterized by the presence of isoetids. These lakes are usually located in esker or rocky areas and are relatively small; however, Ecotype 7 also contains lakes that have larger, more diverse catchments with partly organic soil. Organic soil affects the lake vegetation by decreasing the number of isoetids and increasing the nympheids and helophytes. Subdivision of Ecotype 7 to ‘truly mineral’ and ‘partly organic types’ (with new plant community description) would improve the classification. Furthermore, description of a new plant community for large lakes (Ecotype 31) would improve the scheme. In large lakes, the vegetation is zonated and iso-etids may still be common, but other plant life forms, especially helophytes, also become more abundant.
Another example is mineral-based, medium-conductivity lakes (Ecotypes 8 and 32). These ecotypes should include naturally eutrophic lakes with more fertile, often calcareous catch-ments. The EF descriptions suggest that these ecotypes should be dominated by isoetids, or by charophytes with vascular plant species (plant community ‘Char’). Charophytes are abundant in calcareous areas, but not necessarily so in clayish areas with naturally turbid water result-ing from suspended solids. These shallow lakes would need their own description and possi-bly even their own ecotype. Nevertheless, we believe that this variable, based on descriptions of the relative abundance of different life forms, is valid for the scheme, but the plant community descriptions should be refined to better reflect the characteristics of Finnish lakes, following the ideas of Maristo (1941) and Rintanen (1982).
The second macrophyte variable, ‘plant diversity’ (the number of submerged and float-ing-leaved vascular plant species), presumes that many species are present in high-quality lakes and that the number of species decreases with downgrading status. However, in oligotrophic lakes in Finland the species number usually increases with increasing nutrient concentra-tion (Ilmavirta and Toivonen 1986) and only in
highly eutrophicated lakes does the flora become poorer. Due to this unimodal response curve, the use of diversity metrics for naturally oligotrophic lakes in the northern countries is not straightfor-ward. The EF scheme fails to detect the increase in diversity in the early stage of eutrophication. All the lakes (except the large Pyhäjärvi), whose status we judged to be high or good, were ranked as moderate according to this variable, while in contrast almost all the lakes we judged as good–moderate were classified as high.
In general the low numbers of species in our high-quality lakes may also be explained by the fact that most of these lakes were small (< 50 ha), thus below the minimum area considered by the Directive. The surface area and species number were strongly correlated in our lake set (rs = 0.806, p < 0.001), and this relationship has also been found in other studies (Rørslett 1991). The EF scheme does not recognize this correlation, since the class boundaries are the same for large and small lakes. However, in the EF scheme the only division by lake area is 100 km2. The critical area with respect to species number is probably lower, but our data do not allow suggestions to be made.
In our dataset, the species number and pH were also positively correlated (rs = 0.639, p < 0.01). This may be partly due to correlation between pH and surface area (rs = 0.679, p < 0.001). Higher concentrations of base cati-ons and, consequently, higher alkalinity and pH values in large lakes were also observed in the data of the joint Nordic Lake Survey (Mannio et al. 2000). Large lakes are situated at lower eleva-tions surrounded by more weathered, thicker and fine-textured soils. However, the species number may also be directly linked to alkalinity or pH level (Heitto 1990a). The EF scheme recog-nizes the lower species richness for Ecotype 10 (organic lakes with low conductivity), which has brown water but also lower pH due to organic acids. In contrast, lake water in calcium-rich catchments is often alkaline and these lakes may have more plant species (Heitto 1990b, Toivo-nen and Huttunen 1995), especially the number of elodeid taxa which increases with alkalinity (Heitto 1990a, 1990b). This trend should be reflected in the scheme as higher class bounda-ries for medium-conductivity lakes with mineral

BOREAL ENV. RES. Vol. 10 • A typology and ecological classification system for Finnish lakes 171
catchments (Ecotypes 8 and 32).The ‘plant abundance’ variable reflects the
increase in plant abundance in the early stages of eutrophication and later the decrease in abun-dance as eutrophication leads to turbid, algae-rich water. This general approach should also be applicable to shallow lakes in Finland; however, it appeared that our lakes had generally fewer plants than the EF class boundaries would imply. The plant abundance variable, as estimated for the entire lake area, often led to abundance class ‘1’. In the EF scheme, this lowest abundance class is meant for those lakes that have lost most of their plants due to algal turbidity. In our lakes, the presence of brown water, steep shores or oligotrophy resulted in low abundance. Even though the classification is meant for shal-low lakes, we also included a few deep lakes in this test, which would clearly have demanded different class boundaries for plant abundance. The theory of alternative stable states (Schef-fer et al. 1993) and the view that in high-eco-logical quality lakes production is dominated by macrophytes rather than by planktonic algae is applicable only for shallow lakes, since large areas of deep lakes are unavailable for plants. We realized these exceptions and wanted to use the scheme in its original form. Therefore, we did not accept the abundance class ‘1’ as an indica-tion of poor quality, unless derived from human activities. Hence, this variable resulted in high quality in almost every lake. Several lakes, in which vegetation had become more abundant due to eutrophication, were still in high-quality class ‘2’. The abundance in class ‘3’ (Percentage Volume Infested, PVI > 25%, frequency > 70%) is very high for a whole-lake estimate.
The abundance of plants is greatly dependent on the lake’s morphometry. Sheltered lakes with gentle slopes will have more plants than lakes with steep slopes or strong wave action. We suggest that the estimate of abundance should not be done for the lake as a whole but only for the littoral area, preferably with gentle slopes not exposed to strong wave action. In this way, even shallow and deep lakes could be compared. Within this vegetated area, abundance could be estimated as a density of helophytes and nympheids, i.e. those life forms whose density indicates lake trophic status both in clear- and
brown-water lakes. These life forms are easily observed above the water surface, and samples taken with rakes or other less quantitative under-water methods are unnecessary. Possibly, even aerial photographs could be used to monitor and quantify macrophyte cover, although remote sensing does not remove the need for a ground survey (Valta-Hulkkonen et al. 2003).
Invertebrate variables
The EF scheme uses four invertebrate variables. There are several lake zones and habitats from which invertebrates can be sampled, each of them representing structurally and functionally different invertebrate communities. For com-parative purposes, however, it is essential that the habitat on which the classification is based can be sampled in any lake. Sandy or rocky shores are available in only a few lakes. Histori-cally, the sedimentary benthos has been used to characterize lakes but in shallow lakes a true profundal area is not always available. However, one invertebrate variable for soft sediment was included in the EF scheme. For comparative pur-poses, the sampling depth was set to 1 m, a depth that should be found in most shallow lakes. In deep lakes, however, it may be difficult to find soft sediment at this water depth.
For the three other macroinvertebrate vari-ables, the EF scheme uses the invertebrate com-munity on emergent macrophytes that fringe vir-tually all lakes to some extent and are relatively easy to sample (Kornijów and Kairesalo 1994). Unfortunately, this community has not been tra-ditionally sampled and there are only limited data available (Tolonen et al. 2001); in our lake set, this community was sampled only in the EF lakes (Table 3).
Inclusion of macroinvertebrate variables did not change the final classification of the EF lakes. However, the classification based on all variables decreased from high to good in Lake Sammalisto. The variable ‘percentage of preda-tors in invertebrate community’ resulted in poor- and bad-quality status in every lake except Lake Merrasjärvi. Conclusions based only on six lakes are unreliable, but the class boundaries for this variable appeared to be strictly established.

172 Nykänen et al. • BOREAL ENV. RES. Vol. 10
Fish variables
There are three fish variables in the EF scheme. The scheme recognizes that the ‘fish commu-nity’ needs to be specified locally due to wide biogeographic variation. Currently, this variable separates only the presence of native piscivores and the absence of harmful introductions of alien species. In this respect, the status of all of our test lakes was high. More precise local defini-tions of fish communities could improve the resolution power of this variable. For example, known extinctions of native species other than piscivores should also downgrade the status. During acidification, the first species to dis-appear are cyprinids, usually roach (Rask and Tuunainen 1990, Rask et al. 1995). In contrast, during eutrophication the percentage of cyprinid fishes may increase (Olin et al. 2002).
The scheme recognizes the change to cyprinid dominance in the other fish variable, the bio-mass ratio of piscivores to zooplanktivores. Most cyprinid species are nonpiscivores, lowering the value of this ratio when becoming more abun-dant. Since many piscivores are planktivorous or benthivorous in their early stages of life, this variable is also used as a surrogate for age distri-bution, as required by the Directive (Moss et al. 2003). However, the change in fish community caused by acidification could be included in this variable as well by using conditional statements for the poorest quality classes. The scheme uses this method of having two descriptions (depend-ing on pH) for the poorest quality classes. During acidification the ratio may increase as reproduc-tion fails and the sensitive cyprinid fish disap-pear.
In our lakes, the main problem was eutrophi-cation. Use of the biomass ratio of piscivores to zooplanktivores resulted in classification of lake status as high and poor, similar to the results obtained with expert judgements (Table 3). However, almost all the lakes we judged as good or moderate were of poor quality after use of this biomass ratio. The weak negative correla-tion between this variable and our expert judge-ment was not significant. However, the biomass ratio of piscivores to zooplanktivores showed weak negative correlations with total phospho-rous (rs = –0.584, p < 0.01) and total nitrogen
(rs = –0.526, p < 0.05), indicating lower percent-ages of piscivores in eutrophic lakes.
All the fish variables must be very sensitive to the fishing method used. The fishing method should be well standardized, but any passive method will be selective (Kurkilahti 1999). Both the EF lakes and the Lammi lakes were fished with similar standard multimesh gillnets (Nordic), but the total fishing effort differed since the Lammi lakes were fished more inten-sively. No correlation was found between CPUE (as biomass per Nordic net) and approximated quality class. The uncertainties involved in the selective fishing method prevented us from form-ing conclusions of the total fish biomass in lakes, which is the third fish variable in the EF scheme. However, we wanted to include this variable in our classification and made a rough estimate of the biomass; hence, the status of most lakes was classified as high.
Physicochemical variables
The first chemical variable (pH) resulted in high status for all the lakes. No lake had truly high or low pH, but some lakes had low alkalinity indicating slight acidification. The scheme was originally made as minimal as possible, but in those areas where lakes are sensitive to anthro-pogenic acidification, alkalinity should also be measured. This scheme, based on pH change only, recognizes the acidification process quite late. However, in our set of lakes eutrophication was the main problem. The EF scheme sug-gests that a pH > 8 indicates poor conditions in low-conductivity lakes, while in medium- and high-conductivity lakes this upper limit can be as high as 9. The ranges were set wide, due to the high diurnal variation shown by this variable, especially in productive lakes in summer. In our data, there was a slight trend for higher pH in lower quality classes but the correlation was not significant. It would be very difficult to set any class boundaries between the pH values 5.5–8.
There was good correlation between our expert judgement and total phosphorus con-centration (rs = 0.795, p < 0.001), as well as total nitrogen concentration (rs = 0.754, p < 0.001) and Secchi depth (rs = –0.714, p < 0.001)
BOREAL ENV. RES. Vol. 10 • A typology and ecological classification system for Finnish lakes 173
(Table 4); these variables were also strongly cor-related with each other. This result indicates that we had based our expert judgement largely on the nutrient level.
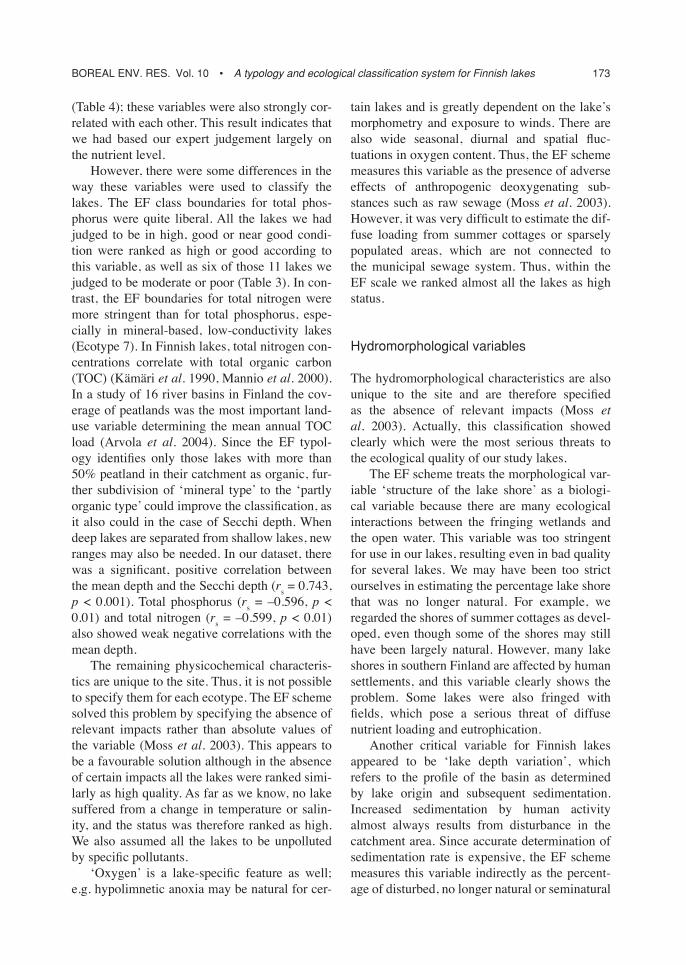
However, there were some differences in the way these variables were used to classify the lakes. The EF class boundaries for total phos-phorus were quite liberal. All the lakes we had judged to be in high, good or near good condi-tion were ranked as high or good according to this variable, as well as six of those 11 lakes we judged to be moderate or poor (Table 3). In con-trast, the EF boundaries for total nitrogen were more stringent than for total phosphorus, espe-cially in mineral-based, low-conductivity lakes (Ecotype 7). In Finnish lakes, total nitrogen con-centrations correlate with total organic carbon (TOC) (Kämäri et al. 1990, Mannio et al. 2000). In a study of 16 river basins in Finland the cov-erage of peatlands was the most important land-use variable determining the mean annual TOC load (Arvola et al. 2004). Since the EF typol-ogy identifies only those lakes with more than 50% peatland in their catchment as organic, fur-ther subdivision of ‘mineral type’ to the ‘partly organic type’ could improve the classification, as it also could in the case of Secchi depth. When deep lakes are separated from shallow lakes, new ranges may also be needed. In our dataset, there was a significant, positive correlation between the mean depth and the Secchi depth (rs = 0.743, p < 0.001). Total phosphorus (rs = –0.596, p < 0.01) and total nitrogen (rs = –0.599, p < 0.01) also showed weak negative correlations with the mean depth.
The remaining physicochemical characteris-tics are unique to the site. Thus, it is not possible to specify them for each ecotype. The EF scheme solved this problem by specifying the absence of relevant impacts rather than absolute values of the variable (Moss et al. 2003). This appears to be a favourable solution although in the absence of certain impacts all the lakes were ranked simi-larly as high quality. As far as we know, no lake suffered from a change in temperature or salin-ity, and the status was therefore ranked as high. We also assumed all the lakes to be unpolluted by specific pollutants.
‘Oxygen’ is a lake-specific feature as well; e.g. hypolimnetic anoxia may be natural for cer-
tain lakes and is greatly dependent on the lake’s morphometry and exposure to winds. There are also wide seasonal, diurnal and spatial fluc-tuations in oxygen content. Thus, the EF scheme measures this variable as the presence of adverse effects of anthropogenic deoxygenating sub-stances such as raw sewage (Moss et al. 2003). However, it was very difficult to estimate the dif-fuse loading from summer cottages or sparsely populated areas, which are not connected to the municipal sewage system. Thus, within the EF scale we ranked almost all the lakes as high status.
Hydromorphological variables
The hydromorphological characteristics are also unique to the site and are therefore specified as the absence of relevant impacts (Moss et al. 2003). Actually, this classification showed clearly which were the most serious threats to the ecological quality of our study lakes.
The EF scheme treats the morphological var-iable ‘structure of the lake shore’ as a biologi-cal variable because there are many ecological interactions between the fringing wetlands and the open water. This variable was too stringent for use in our lakes, resulting even in bad quality for several lakes. We may have been too strict ourselves in estimating the percentage lake shore that was no longer natural. For example, we regarded the shores of summer cottages as devel-oped, even though some of the shores may still have been largely natural. However, many lake shores in southern Finland are affected by human settlements, and this variable clearly shows the problem. Some lakes were also fringed with fields, which pose a serious threat of diffuse nutrient loading and eutrophication.
Another critical variable for Finnish lakes appeared to be ‘lake depth variation’, which refers to the profile of the basin as determined by lake origin and subsequent sedimentation. Increased sedimentation by human activity almost always results from disturbance in the catchment area. Since accurate determination of sedimentation rate is expensive, the EF scheme measures this variable indirectly as the percent-age of disturbed, no longer natural or seminatural

174 Nykänen et al. • BOREAL ENV. RES. Vol. 10
area in the lake catchment (Moss et al. 2003). In addition to clearance of the natural vegetation for agriculture or urban development, intensive for-estry by logging, tilling and ditching processes has also increased erosion in Finland (Kauppi et al. 1990). How the various disturbances should be evaluated in the classification remains to be decided. We suggest that ditched forests or peat bogs could be regarded as seminatural environ-ments, as long as the ditches are not led directly to the lake or to the main ditch. This variable resulted in favourable classification of our lakes as expected, even though the EF class bounda-ries were wide and included only three quality classes for this variable.
The EF scheme describes the variable ‘quan-tity, structure and substrate of the lake bed’ to cover human practices that remove or dump substrates into the lake. In our lake set this usu-ally meant the shore restored for recreational purposes. The littoral may be dredged to deepen the area for boats or swimmers, or sand may be dumped to obtain a more pleasant, hard bottom for swimmers; however, in our lake set this was not a serious problem.
The hydrological variables ‘quantity and dynamics of water flow’ and ‘residence time’ should be measured as deviations from the long-term mean natural water flow-through. We did not have access to this type of information and were thus unable to perform a reliable estimate. However, we knew the water level in some of our study lakes had been lowered in the past, when it was a common way to obtain more land for agri-culture, which must have changed the patterns of water flow-through and residence time. If the change in depth and surface area were large, the nature of the lake could have changed markedly. A new shoreline was developed where there was formerly an open water area, and even the trophic status could have changed. How should these lakes be treated in the classification? One solution is to regard them as ‘heavily modified’, in which case the best ecological status they can achieve is actually an ‘ecological potential’, as the Directive defines in its Annex V. This prob-lem also concerns those lakes in which the water level is regulated. This is a common occurence in Finland and concerns especially large lakes. However, in this test we included the change in
water level with these two EF variables, and very roughly performed the classification according to our past knowledge of the lake. However, our classification may not be in accordance with the class boundaries given in the EF scheme.
One-out, all-out principle
Since the EF method of using an 80% com-pliance level to determine the final ecological status differs in principle from that of the WFD, we tested if the ‘one-out, all-out rule’ could be applied at the elemental level. The first problem was to determine the EF variables as quality ele-ments (Table 3). ‘Structure of the lake shore’ is listed as a morphological element in the Direc-tive. However, the EF scheme treats ‘structure of the lake shore’ as a biological variable, due to the many ecological interactions occurring between the fringing wetlands and the open water. Natural shoreline is evaluated as the pres-ence of natural vegetation and the absence of problematic, invasive, alien emergent species (Moss et al. 2003). Thus, this variable could be treated as a macrophyte parameter; however, we followed the Directive and treated this variable as a morphological parameter. In addition, the EF scheme includes two zooplankton variables not mentioned in the Directive. To overcome this problem we treated the zooplankton and phytoplankton variables together as a ‘plankton’ quality element.
The second problem was to determine the quality status for each element according to intraelement parameters. The Working Group on Common Implementation Strategy for Eco-logical Status (ECOSTAT 2003) suggested that parameters sensitive to different pressures should not be combined, since the averaging results for nonsensitive and sensitive parameters may con-ceal failures to meet the relevant type-specific conditions. However, the results for parameters likely to respond to the same pressure, or a range of pressures, could be combined. Four physi-cochemical parameters (pH, total phosphorus, total nitrogen and Secchi depth) are interrelated and may be averaged. In contrast, the EF scheme treats temperature, oxygen, salinity and pollution with toxic substances as different stress fac-

BOREAL ENV. RES. Vol. 10 • A typology and ecological classification system for Finnish lakes 175
tors, and thus these should be treated separately. Hydrological and morphological variables repre-sent different pressures and cannot be averaged as a whole. However, the hydrological variables alone are interrelated. Combining the morpho-logical variables is questionable, but in our lake set they all represented similar types of human disturbance and were therefore averaged.
In the EF scheme, the number of biological parameters for each quality element is minimal: only three or four. Combining parameters can aid in reducing the risk of misclassification by improving confidence in the assessment, as the ECOSTAT working group outlined (ECOSTAT 2003). We averaged the biological intraelement variables of the EF scheme, since they are all very general and should respond to eutrophica-tion, which was the main problem in our lake set. If any other pressures are evaluated, then individual parameters may have to be assessed separately.
When applying the ‘one-out, all-out princi-ple’ for the EF scheme, no lake achieved high status, according to the biological quality ele-ments (Table 5). However, as many as ten lakes achieved good status and only four fell into poor status. Inclusion of supporting physicochemical and hydromorphological quality elements is not straightforward. ECOSTAT (2003) stated that a certain checking procedure should be done if the physicochemical quality element indicates lower quality status than do the biological quality ele-ments. This was the situation in Pakkaselanjärvi and Teuronjärvi, which both dropped from good to moderate status according to the physico-chemical quality element.
The physicochemical quality element also indicated lower quality status than did the bio-logical quality elements in Matjärvi (moderate–poor). However, if the biological quality element values relevant to moderate, poor or bad status are achieved, then by definition the condition of the physicochemical quality elements must be consistent with that achievement and would not affect the classification of ecological status. Similarly, the values of the hydromorphological quality elements must be taken into account only when assigning high ecological status to bodies of water. Thus, even though the morphologi-cal quality element was more stringent than the
biological elements in as many as five lakes, the final ecological status would follow the result of the biological quality elements. In all, this ‘one-out, all-out method’ was less stringent than the original EF assessment with an 80% compliance level, and was more consistent with our own expert judgements on lake quality status.
Conclusions
The EF scheme offers a workable tool for test-ing the guidelines of the WFD and for develop-ing the final typology and classification system. Many of the variables are well studied, which aids in adopting the scheme. Only the inverte-brate fauna dwelling on emergent macrophytes is seldom and insufficiently studied. Further testing and refinement of the critical variables would improve the applicability of the scheme. Our suggestions for modifications of the EF scheme are summarized in Table 6.
Without division by depth, the EF typology resulted in six different ecotypes for Finland, of which one included the majority of Finland’s lakes. Subdivision of the typology appears neces-sary, especially between the mineral and organic catchment types. This need was also highlighted in the classification of ecological status. Inclu-sion of a ‘partly organic type’ in the typology would improve the classification.
Direct application of the EF classification system was successful in our most pristine and poorest lakes. However, among the good or mod-erate lakes the classification resulted in poorer quality than we assumed. Evaluation of individ-ual variables revealed that some improvements, especially concerning macrophyte variables, are needed to better reflect the characteristics of Finnish lakes. It is also possible to improve the classification strength of the ‘phytoplank-ton diversity’ and ‘fish community’ variables. The method of using an 80% compliance level for determining final ecological status is not in accordance with the WFD but may be replaced with a ‘one-out, all-out principle’ at the elemen-tal level.
The scheme was originally meant for shallow lakes, but we also included deep lakes in this test. New class boundaries were clearly needed,

176 Nykänen et al. • BOREAL ENV. RES. Vol. 10
Tab
le 5
. D
eter
min
atio
n of
fina
l eco
logi
cal s
tatu
s by
ave
ragi
ng in
trae
lem
ent
para
met
ers
and
appl
ying
the
‘one
-out
, al
l-out
rul
e’ a
t el
emen
tal l
evel
. N
umbe
rs f
or e
ach
ele-
men
t ar
e m
ean
valu
es o
f in
trae
lem
ent
para
met
ers,
exc
ept
for
‘oth
er p
hysi
coch
emic
al’
varia
bles
(in
clud
ing
tem
pera
ture
, ox
ygen
, sa
linity
, to
xic
pollu
tion)
, w
hich
wer
e tr
eate
d se
para
tely
, ap
plyi
ng t
he ‘o
ne-o
ut,
all-o
ut r
ule’
at
para
met
er le
vel.
‘Fin
al b
iolo
gica
l’ qu
ality
sta
tus
was
det
erm
ined
by
the
low
est
biol
ogic
al q
ualit
y el
emen
t. ‘F
inal
ec
olog
ical
sta
tus’
als
o in
clud
es s
uppo
rtin
g ph
ysic
oche
mic
al a
nd h
ydro
mor
phol
ogic
al e
lem
ents
. 1 =
hig
h; 1
.5 =
hig
h–go
od; 2
= g
ood;
2.5
= g
ood–
mod
erat
e; 3
= m
oder
ate;
3.
5 =
mod
erat
e–po
or; 4
= p
oor.
Lake
nam
e P
lank
ton
Mac
ro-
Fis
h M
acro
- F
INA
L C
hem
ical
O
ther
M
orph
o-
Hyd
rolo
gica
l F
INA
L E
xper
t
ph
ytes
inve
rte-
bi
olog
ical
phys
ico-
lo
gica
l
ecol
ogic
al
judg
emen
t
br
ates
ch
emic
al
stat
us
Ahv
enla
mm
iEF
1 2
1 2
2 1
1 2
1 2
1K
asta
najä
rvi
1 2
1
2 1
1 1
1 2
1.5
Sam
mal
isto
EF
2 2
1 3
3 1
1 1
1 3
1.5
Riik
oist
en V
alkj
ärvi
2
2 1
2
2 1
1 1
2 1.
5P
yhäj
ärvi
2
2 2
2
1 1
3 1
2 2
Tev
änti
2 2
2
2 2
1 2
1 2
2Is
o V
ehka
järv
i 2
3 2
3
3 1
1 1
3 2
Har
asjä
rvi
2 2
3
3 3
1 3
1 3
2O
rmaj
ärvi
2
2 2
2
1 2
4 2
2 2.
5K
ärkj
ärvi
3
2 3
3
3 2
3 1
3 2.
5P
akka
sela
njär
vi
2 2
2
2 3
1 2
1 3
2.5
Suo
lijär
vi
2 2
2
2 2
1 3
1 2
2.5
Lehe
e 2
2 2
2
2 1
3 2
2 2.
5K
auka
senj
ärvi
2
2 3
3
2 1
3 1
3 2.
5T
euro
njär
vi
2 2
2
2 3
1 3
1 3
3M
erra
sjär
viE
F
2 2
3 2
3 2
1 3
1 3
3E
kojä
rvi
3 2
2
3 3
1 3
1 3
3P
annu
järv
i 4
2 2
4
2 1
2 1
4 3
Her
vonj
ärvi
3
3 1
3
3 1
3 1
3 3
Syl
vöjä
rviE
F
2 2
3 3
3 3
1 3
1 3
3P
ukal
ajär
viE
F
2 4
2 2
4 2
1 3
3 4
3K
atal
oist
enjä
rvi
3 2
3
3 3
1 3
1 3
3.5
Kyy
närö
järv
i 4
2 2
4
3 1
3 1
4 3.
5K
evät
ön
4 2
3
4 4
1 4
3 4
4M
atjä
rviE
F
3 2
3 3
3 4
1 3
3 3
4

BOREAL ENV. RES. Vol. 10 • A typology and ecological classification system for Finnish lakes 177
but otherwise the scheme should also be applica-ble in deep lakes, providing division by depth in the typology.
The national authorities are currently plan-ning official systems for implementation of the WFD, and the EF scheme will likely not be adopted as a whole. However, many of the ECOFRAME solutions were directly applicable, and after some geographical modifications, this scheme provides a useful tool for implementa-tion of the WFD. The scheme at least provides insights for those authorities constructing the final typology and classification scheme, as well as tested elements to be adopted into a national classification system.
Acknowledgements: We thank Siilinjärvi commune and North Savo Regional Environment Centre for providing data on Lake Kevätön. We appreciate three anonymous reviewers for their valuable comments and suggestions. This study was partly financed by Maj and Tor Nessling Foundation.
References
Anon. 1999. Kevättömän ja Pöljänjärven kunnostukseen liittyvät selvitykset. Osa II Kunnostustoimenpiteiden vai-
kutukset veden laatuun. Report, PSV-Maa ja Vesi Oy.Arvola L., Räike A., Kortelainen P. & Järvinen M. 2004. The
effect of climate and landuse on TOC concentrations and loads in Finnish rivers. Boreal Env. Res. 9: 381–387.
Bibiceaunu S. & Veijola H. 1995. Kevättömän ja Pöljän-järvien eläinplankton vuosina 1992 ja 1994. Report, Institute of Environmental Research, University of Jyväskylä.
Brooks J.L. & Dodson S.I. 1965. Predation, body size, and composition of plankton. Science 150: 28–35.
Burks R.L., Lodge D.M., Jeppesen E. & Lauridsen T.L. 2002. Diel horizontal migration of zooplankton: costs and benefits of inhabiting the littoral. Freshwat. Biol. 47: 343–365.
ECOSTAT 2003. Overall approach to the classification of ecological status and ecological potential. Water Frame-work Directive, Common Implementation Strategy Working Group 2 A, Ecological status, (ECOSTAT), Guidance document: 1–47.
European Communities 2000. Directive 2000/60/EC of the European Parliament and the Council of 23 October 2000 establishing a framework for Community action in the field of water policy. Official Journal of the Euro-pean Communities L 327: 1–72.
Hall D.J., Threlkeld S.T., Burns C.W. & Crowley P.H. 1976. The size efficiency hypothesis and the size structure of zooplankton communities. Ann. Rev. Ecol. Syst. 7: 177–208.
Heitto L. 1990a. A macrophyte survey in Finnish forest lakes sensitive to acidification. Verh. Internat. Verein. Limnol. 24: 667–670.
Table 6. Suggestions for modifications of the ECOFRAME scheme to better reflect the characteristics of Finnish lakes.
Parameter Suggested modifications
Typology:climate Separation of subarctic lakes by altitude or tree line instead of climate.Typology:percentage of peatland Subdivision of mineral type to truly mineral and partly organic types. in the catchment Further studies to develop a peat index that would better reflect the natural, background water colour.Typology:conductivity Special cases: subdivision of clear-water calcium-rich lakes and lakes with clay turbidity, separation of sulphide-rich lakes.Typology:surface area Possibly, subdivision of small lakes.Phytoplankton Phytoplankton diversity. More fine-scaled description of algal blooms.Zooplankton Further studies on class boundaries in different ecotypes.Macrophytes Plant community. New community descriptions for high- and good-quality status in large lakes and in organic lake type. Suggested new ecotypes would also need their own plant community descriptions. Plant diversity. Class boundaries in different ecotypes: consideration of unimodal response of diversity in oligotrophic lakes; influence of surface area and conductivity on species number. Plant abundance. Lower class boundaries, possibly new assessment method for plant abundance.Invertebrate variables Further studies on class boundaries in different ecotypes.Fish Fish community. More precise definitions, taking into account also cyprinid fish species. Piscivore:zooplanktivore ratio. Conditional statements in case of acidification.

178 Nykänen et al. • BOREAL ENV. RES. Vol. 10
Heitto L. 1990b. Macrophytes in Finnish lakes and possible effects of airborne acidification. In: Kauppi P., Anttila P. & Kenttämies K. (eds.), Acidification in Finland, Springer, Berlin, pp. 963–972.
Henriksen A., Skjelkvåle B.L., Mannio J., Wilander A., Har-riman R., Curtis C., Jensen J.P., Fjeld E. & Moiseenko T. 1998. Northern European lake survey, 1995. Ambio 27: 80–91.
Henriksen A., Skjelkvåle B.L., Mannio J., Wilander A., Jensen J.P., Moiseenko T., Harriman R., Traaen T.S., Fjeld E., Vuorenmaa J., Kortelainen P. & Forsius M. 1997. Results of national lake surveys (1995) in Fin-land, Norway, Sweden, Denmark, Russian Kola, Russian Karelia, Scotland and Wales. Acid Rain Research Report 47. Norwegian Institute for Water Research, Oslo.
Henriksen A., Skjelkvåle B.L., Lien L., Traaen T., Mannio J., Forsius M., Kämäri J., Mäkinen I., Berntell A., Wiederholm T., Wilander A., Moiseenko T., Lozovik P., Filatov N., Niinioja R., Harriman R. & Jensen J.P. 1996. Regional lake surveys in Finland–Norway–Sweden, Northern Kola–Russian Karelia–Scotland–Wales 1995. Coordination and design. Acid Rain Research Report 40. Norwegian Institute for Water Research, Oslo.
Hessen D.O. 1989. Factors determining the nutritive status and production of zooplankton in a humic lake. J. Plank-ton Res. 11: 649–664.
Huitu E. & Mäkelä S. 1999. Etelähämäläinen järviluonto: nykytila ja tulevaisuuden näkymiä. Maatalouden vesien-suojelun, maatalousympäristön sekä vesiekosysteemin monimuotoisuuden kehittäminen. Report, Lammi Bio-logical Station, University of Helsinki.
Ilmavirta V. & Toivonen H. 1986. Comparative studies on macrophytes and phytoplankton in ten small, brown-water lakes of different trophic status. Aqua Fennica 16: 125–142.
Jeppesen E., Jensen J.P., Søndergaard M. & Lauridsen T. 1997. Top-down control in freshwater lakes: the role of nutrient state, submerged macrophytes and water depth. Hydrobiol. 342/343: 151–164.
Kämäri J., Forsius M. & Kauppi L. 1990. Statistically based lake survey: A representative picture of nutrient status in Finland. Verh. Internat. Verein. Limnol. 24: 663–666.
Kauppi L.H., Knuuttila S.T., Sandman K.O., Eskonen K., Luokkanen S. & Liehu A. 1990. Role of landuse in the occurrence of blue-green algal blooms. Verh. Internat. Verein. Limnol. 24: 671–676.
Kornijów R. & Kairesalo T. 1994. A simple apparatus for sampling epiphytic communities associated with emer-gent macrophytes. Hydrobiol. 294: 141–143.
Kurkilahti M. 1999. Nordic multimesh gillnet — robust gear for sampling fish populations. Ph.D. thesis, Department of Biology, University of Turku.
Lehtinen E. 1991. Kevättömän ja Pöljänjärven kunnostus-suunnitelma. Report, Department of Applied Zoology, University of Kuopio.
Lehtinen E. & Muje P. 1989. Kevättömän ja Pöljänjärven kalastoselvitys. Report, Department of Applied Zoology, University of Kuopio.
Mannio J., Räike A. & Vuoremaa J. 2000. Finnish lake survey 1995: regional characteristics of lake chemistry.
Verh. Internat. Verein. Limnol. 27: 362–367.Maristo L. 1941. Die Seetypen Finnlands auf floristischer
und vegetationsphysiognomischer Grundlage. Ann. Bot. Soc. Vanamo 15: 1–314.
Moss B., Stephen D., Alvarez C., Becares E., van de Bund W., Collings S.E., van Donk E., de Eyto E., Feld-mann T., Fernández-Aláez C., Fernández-Aláez M., Franken R.J.M., Garcia-Criado F., Gross E.M., Gyll-ström M., Hansson L.-A., Irvine K., Järnvalt A., Jenssen J.-P., Jeppesen E., Kairesalo T., Kornijów R., Krause T., Künnap H., Laas A., Lill E., Lorens B., Luup H., Miracle M.R., Nõges P., Nõges T., Nykänen M., Ott I., Peczula W., Peeters E.T.H.M., Phillips G., Romo S., Russell V., Salujõe J., Scheffer M., Siewertsen K., Smal H., Tesch C., Timm H., Tuvikene L., Tonno I., Virro T., Vicente E. & Wilson D. 2003. The determination of ecological status in shallow lakes — a tested system (ECOFRAME) for implementation of the European Water Framework Directive. Aquatic Conserv: Mar. Freshw. Ecosyst. 13: 507–549.
Nõges P., Nõges T., Tuvikene L., Smal H., Ligeza S., Korni-jów R., Wojciech P., Bécares E., Garcia-Criado F., Alva-rez-Carrera C., Fernandez-Alaez C., Ferriol C., Miracle R.M., Vicente E., Romo S., Van Donk E., van de Bund W., Jensen J.P., Gross E.M., Hansson L.-A., Gyllström M., Nykänen M., de Eyto E., Irvine K., Stephen S., Collings S. & Moss B. 2003. Factors controlling hydro-chemical and trophic state variables in 86 shallow lakes in Europe. Hydrobiol. 506–509: 51–58.
Nybom C. 1990. Kevättömän vesi- ja rantakasvillisuus. Report, National Board of Waters and the Environment.
Olin M., Rask M., Ruuhijärvi J., Kurkilahti M., Ala-Opas P. & Ylönen O. 2002. Fish community structure in mesotrophic and eutrophic lakes of southern Finland: the relative abundances of percids and cyprinids along a trophic gradient. J. Fish Biol. 60: 593–612.
Rask M. & Tuunainen P. 1990. Acid-induced changes in fish populations of small Finnish lakes. In: Kauppi P., Ant-tila P. & Kenttämies K. (eds.), Acidification in Finland, Springer, Berlin, pp. 911–927.
Rask M., Mannio J., Forsius M., Posch M. & Vuorinen P.J. 1995. How many fish populations in Finland are affected by acid precipitation. Envir. Biol. Fish. 42: 51–63.
Rasmussen J.B., Godbout L. & Schallenberg M. 1989. The humic content of lake water and its relationship to watershed and lake morphometry. Limnol. Oceanogr. 34: 1336–1343.
Rintanen T. 1982. Botanical lake types in Finnish Lapland. Ann. Bot. Fennici 19: 247–274.
Rørslett B. 1991. Principal determinants of aquatic macro-phyte richness in northern European lakes. Aquat. Bot. 39: 173–193.
Ruuhijärvi R. 1974. Pääjärvi. Luonnon Tutkija 78: 101–107.Salonen K., Kairesalo T. & Jones R.I. (eds.) 1992. Dissolved
organic matter in lacustrine ecosystems: Energy source and system regulator. Dev. of Hydrobiol. 73. Kluwer.
Sarvala J., Kankaala P., Zingel P. & Arvola L. 1999. Zoo-plankton. In: Keskitalo J. & Eloranta P. (eds.), Limnol-ogy of humic waters, Backhuys Publishers, Leiden, pp. 173–191.

BOREAL ENV. RES. Vol. 10 • A typology and ecological classification system for Finnish lakes 179
Scheffer M., Hosper S.H., Meijer M.-L., Moss B. & Jeppesen E. 1993. Alternative equilibria in shallow lakes. TREE 8: 275–279.
Schriver P., Bøgestrand J., Jeppesen E. & Søndergaard M. 1995. Impact of submerged macrophytes on fish–zoo-plankton–phytoplankton interactions: large-scale enclo-sure experiments in a shallow eutrophic lake. Freshwat. Biol. 33: 255–270.
Stansfield J.H., Perrow M.R., Tench L.D., Jowitt A.J.D. & Taylor A.A.L. 1997. Submerged macrophytes as refuges for grazing Cladocera against fish predation: observa-tions on seasonal changes in relation to macrophyte cover and predation pressure. Hydrobiol. 342/343: 229–240.
Timms R.M. & Moss B. 1984. Prevention of growth of potentially dense phytoplankton populations by zoo-plankton grazing, in the presence of zooplanktivorous fish, in a shallow wetland ecosystem. Limnol. Oceanogr. 29: 472–486.
Toivonen H. & Huttunen P. 1995. Aquatic macrophytes and ecological gradients in 57 small lakes in southern Fin-
land. Aquat. Bot. 51: 197–221.Tolonen K.T., Hämäläinen H., Holopainen I.J. & Karjalainen
J. 2001. Influences of habitat type and environmental variables on littoral macroinvertebrate communities in a large lake system. Arch. Hydrobiol. 152: 39–67.
Valta-Hulkkonen K., Pellikka P., Tanskanen H., Ustinov A. & Sandman O. 2003. Digital false colour areal photographs for discrimination of aquatic macrophyte species. Aquat. Bot. 75: 71–88.
Venetvaara J., Lammi E., Sammalkorpi I. & Keto A. 1996. Nastolan Kärkjärven kunnostussuunnitelma. Report, Biologitoimisto Jari Venetvaara Ky.
Vighi M. & Chiaudani G. 1985. A simple method to estimate lake phosphorus concentrations resulting from natural, background, loadings. Water Res. 19: 987–991.
Zaret T.M. 1975. Strategies for existence of zooplankton prey in homogenous environments. Verh. Internat. Verein. Limnol. 19: 1484–1489.
Zaret T.M. & Suffern J.S. 1976. Vertical migration in zoo-plankton as a predator avoidance mechanism. Limnol. Oceanogr. 21: 804–813.
Received 7 May 2004, accepted 8 February 2005