Real Time Operating System. What happens when we power-on the PC??
Upload
marsha-willisCategory
view
213download
0
CHAPTER 2Business
Cycles

CHAPTER 2Unit 1
The composition and Features of Business
Cycles

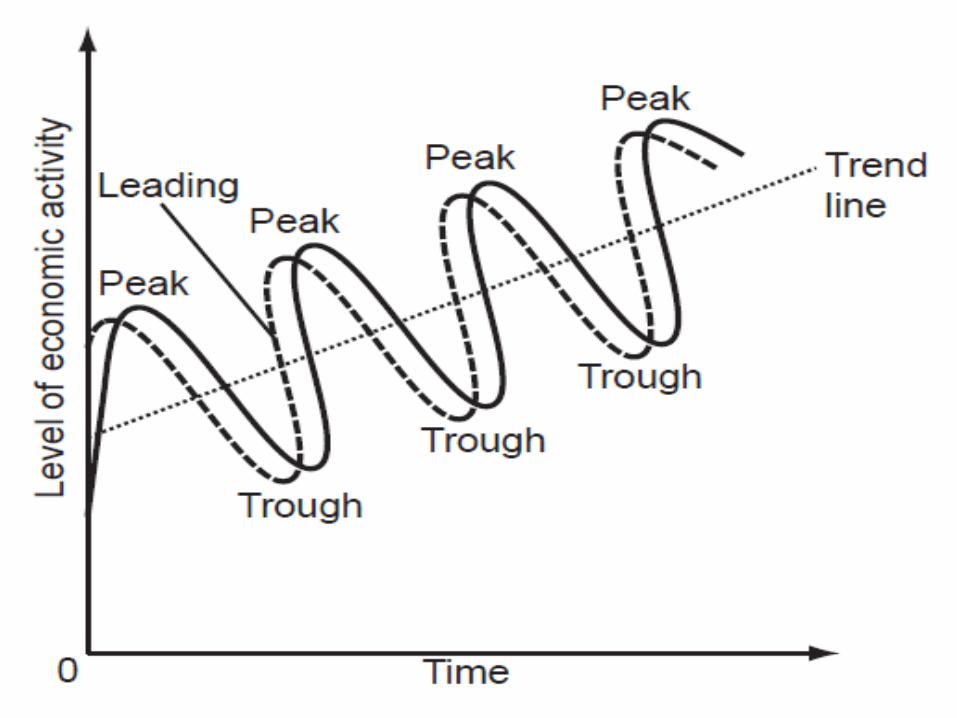
The composition and features ofbusiness cycles
A time series that shows what happens to the value of the domestic output (GDP) of the economy over time.

starts to rise after a long time fallingreaches highest point and then starts to fallclimbingfalling still climbingstarting to rise rising rapidly
falling ‘the sky is the limit’at its lowest rises after a slow start
rising fallingcontinues to rise hits rock bottom
at its lowest rising on all itemsrising, especially on luxury items falls
at its lowest risesrises to highest point falls
rises to its highest point about to go uprises more than previously falls
still climbing starts to fallhits rock bottom rises, but slowly


CHAPTER 2Unit 2
Explanations of the Business Cycle

Explanations of the business cycle
2 schools of thought: ExogenousEndogenous

Exogenous Theory
• Classical Economists – 19th century• market economies are inherently stable• Exogenous factors cause business cycle• William Jevons sunspot theory– business cycle was caused by periodic changes in
solar radiation


Other exogenous variables • changes in the money supply,• government policies• technology– railways 19th century– radio communication in the 1920– Internet in the1990s

Endogenous Theory
• John Maynard Keynes – Keynesian Theory• inherently unstable - caused by endogenous e.g. change in
total spending.
• An increase in total spending • period of expansion
• reinforced by the multiplier• economy reaches its capacity (full employment)
• firms decrease their investment spending• multiplier process goes into reverse• output of the economy to decline

Followers of the endogenous theory believe that gov. SHOULD intervene to minimise effects of cycle.


• Answer Activity 1 - pg 49 Q 1.1 – 1.4• Answer Activity 2 - pg 52 Q 1.1 – 1.3

CHAPTER 2Unit 3
Government Policy

Government Policy SA’s economic system based on Keynesian view so government intervenes.
They apply policies to affect business cycles to ensure that:• economic growth (increase in real GDP) is maintained• inflation and unemployment are as low as possible• periods of expansion last as long as possible• periods of contraction last as short as possible• the troughs and peaks are smoothed out (the economy is
more stable).

Instruments at the gov’s disposal are…
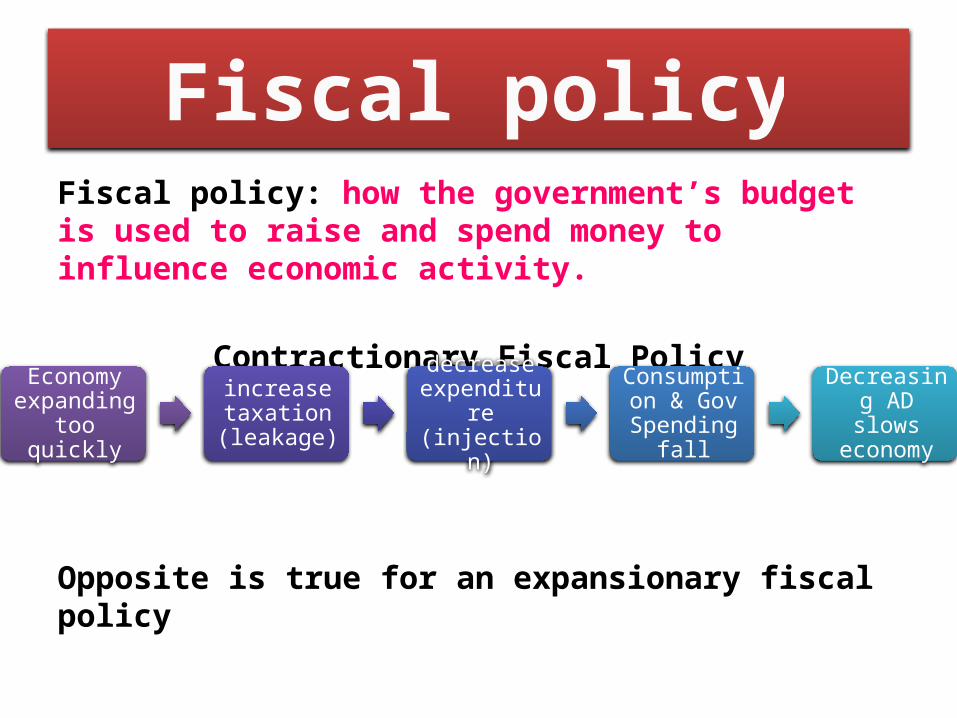
Fiscal policyFiscal policy: how the government’s budget is used to raise and spend money to influence economic activity.
Contractionary Fiscal Policy
Opposite is true for an expansionary fiscal policy
Economy expanding too quickly
increase taxation (leakage)
decrease expenditure (injection)
Consumption & Gov
Spending fall
Decreasing AD slows economy


Monetary policy: policy of central bank regarding money supply and interest rates to influence economic activity.
Supply of money influenced by…• Interest rates• Buying and selling of gov bonds• Increase/decrease cash reserve requirements of
commercial banks• SARB governor can persuade commercial banks to
lend less in booms and more in recessions.
Monetary policy

Expansionary Monetary Policy
SARB decrease
s repo rate -
interest rate
follows
More money is available
Spending increases
Demand increases
Supply increases
Economic activity
increases
Opposite is true for a contractionary monetary policy

CHAPTER 2Unit 4
The New Economic Paradigm

The new Economic Paradigm
New economic paradigm: government focuses less on fine-tuning and more on eliminating uncertainties with regard to fiscal and monetary policy.
WHY???Fine tuning requires precise knowledge at the right time – not always possible.

Instead…• Create ec stability • Encourage high rates of ec growth without
inflation• Combine demand and supply-side policies

Demand-side policies Supply-side policiesMonetary policy Providing infrastructure
Fiscal Policy Decreasing red tape
Subsidies to firms
Decrease corporate tax
Improve quality and mobility of labour force
Free business advisory services
Review competition policy


Answer Activity 3 – pg 56 Q 1.1 – 1.3

CHAPTER 2Unit 5
Features underpinning forecasting with
regard to business cycles

Leading, Lagging and Coincident Indicators
Leading indicators: change before the economy changes.
• Warn of what we can expect in the future - economists use them to forecast.
• Reach peaks/troughs a few months before the business cycle reaches
Examples • volume of mining production• total number of new cars sold• share prices• number of new businesses registered

Lagging indicators: change only after the economy has changed.
• Indicate what has already happened in the economy. • Confirm direction of the economy. • Used to estimate whether individual indicators gave
false signals. • Reach a peak/trough months after the business cycle
Examples…• hours worked in construction• Employment• investment in capital goods

Coincident indicators: change at the same time as the economy.
• Information about the current situation of the economy.• Move simultaneously with the economy. • Reach peak/trough at the same time as the business
cycle • Used to compile business cycle.
Examples …• real GDP• Unemployment• volume of manufacturing• production

Methods of forecastingDone using quantitative or qualitative scientific methods
Quantitative method based on mathematical models, statistics and historical time series data.

Extrapolation and moving averages
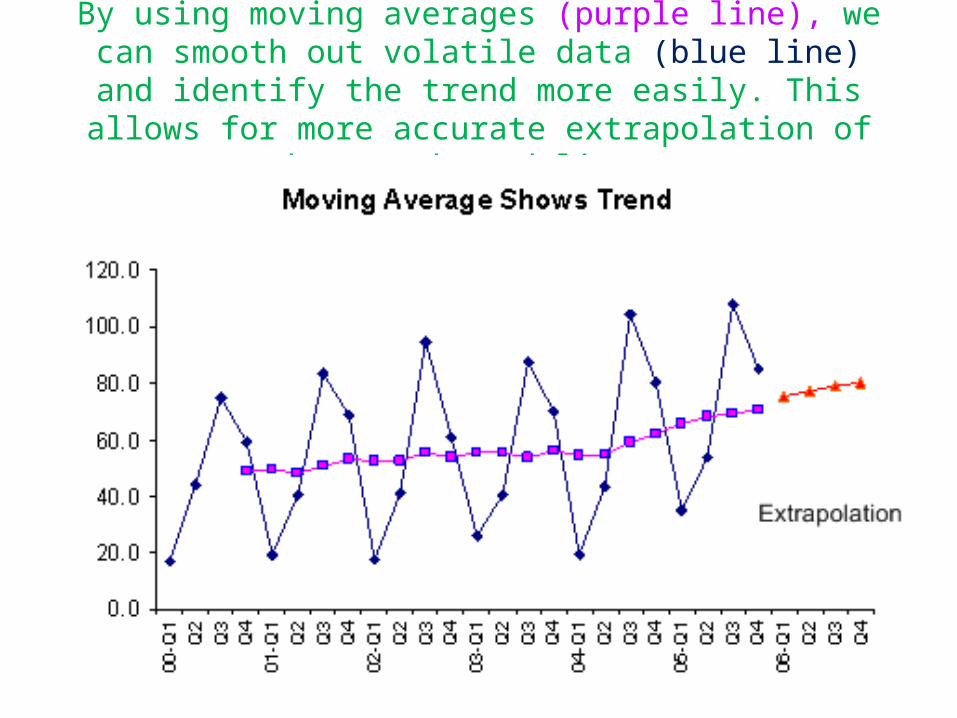
By using moving averages (purple line), we can smooth out volatile data (blue line) and identify the trend more easily. This allows for more accurate extrapolation of the trend (red line).

Answer Activity 4 – pg 60 Q 1 – 3