A Thesis in Ecology by Colbie J. Reed
149
The Pennsylvania State University The Graduate School Intercollege Graduate Degree Program in Ecology THE PHYSIOLOGICAL ECOLOGY OF AN ENTOMOPATHOGENIC FUNGUS: EXAMINING HOST-NICHE THROUGH METABOLIC FOOTPRINTING OF OPHIOCORDYCEPS UNILATERALIS S.L. A Thesis in Ecology by Colbie J. Reed © 2017 Colbie J. Reed Submitted in Partial Fulfillment of the Requirements for the Degree of Master of Science August 2017
Transcript of A Thesis in Ecology by Colbie J. Reed

The Pennsylvania State University
The Graduate School
Intercollege Graduate Degree Program in Ecology
THE PHYSIOLOGICAL ECOLOGY OF AN ENTOMOPATHOGENIC FUNGUS:
EXAMINING HOST-NICHE THROUGH METABOLIC FOOTPRINTING OF
OPHIOCORDYCEPS UNILATERALIS S.L.
A Thesis in
Ecology
by
Colbie J. Reed
© 2017 Colbie J. Reed
Submitted in Partial Fulfillment
of the Requirements
for the Degree of
Master of Science
August 2017

ii
The thesis of Colbie J. Reed was reviewed and approved* by the following:
David P. Hughes
Assistant Professor of Entomology and Biology
Thesis Advisor
John Tooker
Associate Professor of Entomology
Extension Specialist
David Eissenstat
Professor of Woody Plant Physiology
Chair of the Ecology Intercollege Graduate Degree Program
*Signatures are on file in the Graduate School.

iii
TABLE OF CONTENTS
List of Tables………………………………………………………………………………………………………… iv
List of Figures…………………………………………………………………………….…….……………………. v
Acknowledgements……………………………………………………………………………….………………… viii
Chapter 1. BACKGROUND AND FOUNDING QUESTIONS. 1
1.1 Physiological Ecology and Evolution of Host-parasite Relationships and Host-niche Development. 1
1.2 Objectives, Core Questions and Thesis Statement. 3
1.3 Featured Figures. 5
Chapter 2. EXOMETABOLOMIC SIGNATURES OF ENTOMOPATHOGENIC FUNGI IN VITRO… 7
2.1 Abstract. 7
2.2 Introduction. 7
2.2.1 In vitro cultivation of Entomopathogenic Fungi.
2.2.2 Exometabolomics ‒ an ‘Omics’ Approach to “Hacking” the Host-parasite “Cloud”.
2.2.3 Understanding a Parasite and its Host-niche through its Ecophysiological Requisites.
2.3 Materials and Methods. 15
2.3.1 Liquid Fermentation of Blastoconidia for Longitudinal and End-point Assays.
2.3.2 Exometabolomics – Longitudinal and End-point Assays.
2.3.3 Assay of Secreted Protein.
2.3.4 Measurement of Supernatant pH and Differential Calculation.
2.3.5 Figure Generation and Statistics of Exometabolomic Data.
2.4 Results. 19
2.4.1 Longitudinal Exometabolomics of O. kimflemingae, in vitro.
2.4.2 High Productivity with Very Little Input: Lag Phase and Underlying Compositional Dynamics…
2.4.3 Temporally and Magnitudinally Distinguished Metabolites.
2.4.4 Characterization of Substratum-utilization Phenotype by Macronutrient Category.
2.4.5 Follow-up: Supplementation of Ionic Cofactors, Chelation and Phenotype Rescue.
2.4.6 Comparison of Two Hypocrealean Species Using Longitudinal Exometabolomics.
2.4.7 Ophiocordyceps kimflemingae – Extracellular Physical and Chemical Perturbation with Objective of…
2.5 Discussion. 40
2.6 Featured Tables. 46
2.7 Featured Figures. 48
Chapter 3. Summary and Concluding Statements. 85
3.1 Summary of Findings and Implications for Pathogenic Fungi. 85
3.2 Conservation of Biological Interfaces and Broader Impacts. 88
3.3 Future Work. 90
3.4 Featured Figures. 93
Appendix A: Supplemental Results. 97
Appendix B: Supplemental Tables and Figures. 100
Bibliography. 127

iv
LIST OF TABLES
2.0 Grace’s Insect Medium ‒ Official Formulation. 46
2.1 Minimal Media Formulations. 47
B2.0 Experimental Designs ‒ End-point Studies. 100
B2.1 Hexmap Base Index Key ‒ End-point Studies. 102
B2.6 Hexmap Base Index Key ‒ Longitudinal Infraspecific Comparisons. 116

v
LIST OF FIGURES
1.0 Model of Fundamental Niche for a Ruderal, Specialist Entomopathogenic Fungus. 5
2.0a Photographic Diagram of the Life Cycle of O. unilateralis s.l. 48
2.0b Schematic of in vitro Growth Assays. 49
2.1 Longitudinal Exometabolomic Data for O. kimflemingae, in vitro. 51
2.2a Primary Carbon Sources. 53
2.2b TCA Cycle and its Contributors. 54
2.2c Focal Amino Acids. 55
2.2d Urea Cycle and Pyrimidine Synthesis. 56
2.2e Vitamins – Pantothenate and Precursors. 57
2.2f Vitamins – Nicotinate Metabolism Requires Pyridoxine. 58
2.3a End-point Exometabolomic Metaprints for Supplementation and Chelation of Trace Ions. 60
2.3b Heatmap of Metacluster Bases Underlying Suprahexagonal Metaprints. 61
2.3c Metacluster Bases, Node Assignments and Pathway Enrichment Index. 62
2.4 Comparative Metaprints for Two Hypocrealean Species. 64
2.5 Longitudinal Exometabolomic Data for O. camponoti-floridani, in vitro. 66
2.6 Metatracks ‒ Tracing Metabolic Footprints through Time. 68
2.7a Infraspecific Dual-plot – Comparative Carbon-source Utilization. 70
2.7b Infraspecific Dual-plot – Differential Nitrogen-source Utilization. 71
2.7c Infraspecific Dual-plot – Differential Vitamin Utilization. 72
2.7d Infraspecific Dual-plot – Differential Use of Precursors. 73
2.8 End-point Exometabolomic Signatures of Asparagine- and Methionine-fortified Substrata. 75
2.9 End-point Exometabolomic Signatures of Signaling Molecule-mimic. 77
2.10 End-point Exometabolomic Signatures of Altered Substrata Starting pH. 79
2.11 End-point Exometabolomics Confirms Viability of Minimal Medias. 81
2.12 Perturbations Reveal Exometabolomic Signatures of Life and Death. 83
3.0 Model Amendment ‒ Proposed Host-niche and Host-parasite Exchange. 93
3.1 Ecological Model Amendment (full). 95
B2.2 End-point Exometabolomic Trace Ion/Macromineral Hexmap Topologies. 103
B2.3a End-point Exometabolomic Signatures – Trace Ion/Macromineral Supplementation. 105
B2.3b-c End-point Trace Ion Supplementation – Differential pH and Secreted Protein. 106
B2.3d End-point Exometabolomic Signatures – Trace Ion Chelation/Titration. 107
B2.3e-f End-point Trace Ion Chelation/Titration – Differential pH and Secreted Protein. 108

vi
B2.3g End-point Exometabolomic Signatures – Trace Ion Rescues. 109
B2.3h-i End-point Trace Ion Rescues – Differential pH and Secreted Protein. 110
B2.4 Hexagonal Map with Select Labels – Infraspecific Comparisons. 112
B2.5 Longitudinal Exometabolomic Hexmap Topologies. 114
B2.7a-b Asparagine and Methionine ‒ Differential pH and Secreted Protein. 118
B2.7c-d Dibutyryl-cAMP ‒ Differential pH and Secreted Protein. 119
B2.7e-f Adjusted Starting pH ‒ Differential pH and Secreted Protein. 120
B2.7g-h Minimal Medias ‒ Differential pH and Secreted Protein. 121
B2.8 Morphological Changes Between Various Perturbations. 123
B3.0 Traditional SEIR Model and Adjusted Model for a Parasitoid. 125

vii
PREFACE
It is with a reasonable amount of pride and exasperation that I present this completed document. The pursuit
of this achievement was ultimately motivated by my desire to better understand things at their most intimate
and complex level, while using tools that limit bias through their exactness. All of the material and findings
presented in this work were conceived, completed, assembled and polished within the course of six months.
The importance of this preceding statement is based upon just that: the timeline within which it was
completed, as well as the circumstances of which. I had hoped to finish this project to a greater extent of
completion. As a result, I will look forward to hearing of someone else having picked-up this work where I
have left off, as I believe this is an exciting topic worthy of continued study.
Through this process, I have learned a great deal about science and about myself. Despite it all, my passion
for science remains as strong as ever.
viii
ACKNOWLEDGEMENTS
To those that got it all started and stuck around to finish it:
I would like to thank my friends and family. And also to apologize to them for ever wandering into academia.
You all have tolerated my nonsense ramblings, my work-infused acute stress disorder, my incessant need
to find a meaning in every tiny, little detail. I have neglected some of your best advice, but, in those moments
of prodigal epiphany, you still lent an ear, reminding me of the kindness and empathy that exists but is
sometimes far too seldom-expressed in this world. I have a tendency to avoid people, but you all have
continued to remind me that, not only are they necessary, but people are also what make science great.
Anybody can have a brilliant idea, but it’s the people that make them possible.
To the things that made it easier in between, I’d like to thank:
Job offers from not-academia. [Good] coffee. [Great] wine. True crime podcasts. Dream-delivered ‘aha!’
moments. Antihistamines. The internet. Educated guesses. Action Camp. The Brain Pickings of Maria
Popova. Friendly internet trolls. Science drama. Free textbooks. Hot sauce. Snarky statisticians. The long
list of scientific “Mavericks & Heretics” picked apart and put on display by Information Is Beautiful
(https://goo.gl/A8qiiD), as well as their pariah contemporaries. The President’s Council of Advisors on
Science and Technology (PCAST) and their 2016 formal report, Forensic Science in Criminal Courts:
Ensuring Scientific Validity of Feature-Comparison Methods. Biophysics and Physical Biology. Elegant
questions. Uncertainty.
To the people, places and things that made it physically (and metaphysically) possible:
These include, firstly, the Huck Institutes’ Metabolomics Core Facility; without their passion and dedication
to the Facility’s cause and for the impact that it has upon its users campus-wide, the University’s reputation
for research would not be what it is today. I must direct special thanks to the laboratory of Dr. Manuel Llinás
for assistance in completing of this project. I have much gratitude for the wonderful faculty and staff of Penn
State University, and thank the Huck Institutes of the Life Sciences, the Center for Infectious Disease
Dynamics, and the CIDD Graduate Student Association for their having originally provided me the
confidence to pursue academia, as well as the Coalition of Graduate Employees for pursuing ‘a seat at the
table’ for graduate students throughout the Penn State community. I also am extremely grateful for the
Penn State Microbiome Center, as their interdisciplinary team-centric efforts and inclusive attitudes are
inspiring and act to foster young professionals, early career scientists and students across fields interested
in microbial communities. Finally, I would like to thank Dr. Peter Hudson for his continued inspiration,
support and encouragement, and for being a kindred spirit in always seeking to push science forward. May
you never allow—in yourself or in those you influence—extinguishing of the inner restlessness and
determination that, together, prove continuously precipitant of the compulsion to pursue difficult questions.

ix
DEDICATION
For my niece and nephew,
who will grow up being told [by me, at least] that they may pursue any passion, any question or any problem
if they are so compelled.
For those who work to forget the moments in which friends could not find words to wield or when heroes
became hollow.
Only individuals have a sense of responsibility.
—Nietzsche
1
Chapter 1. Background and Founding Questions.
1.1 Physiological Ecology and Evolution of Host-parasite
Relationships and Host-niche Development.
Across all phyla, organisms must adapt to the biotic and abiotic challenges1 of their environment
to maintain fitness and produce viable offspring. Examples of biotic challenge include competition
for resources, predators, and parasites, the influences of which can result in morbidity, loss of
fecundity or death. Abiotic challenges can be the cause of similar ends, but are solely physical or
chemical in nature, examples of which include turbulence, temperature, pH and radiation. Each
type of environmental challenge—independently and together—sculpts both the fundamental and
realized niche of organisms [1]. Adaptations to environmental stresses can be quite diverse and
are often directly connected to the evolutionary histories of species [2]. This biological influence
of evolutionary momentum and the magnitude of its sway in determining an organism’s realized
niche can be illustrated by the examination of a single abiotic environmental feature. To illustrate,
some regions around the globe are noted for their high levels of radiation, whether it be ultraviolet
or infrared (thermal); however, additional facets of their geography play significant roles in
determining how organisms might effectively adapt to these levels of radiation. In polar regions,
solar radiation (ultraviolet radiation) is often ameliorated through the adaptation of white fur, which
selectively enhances the insulation of thermal energy in the far infrared while simultaneously
conferring high-reflectance of ultraviolet spectral wavelengths [3], [4]. Although a drastically
different landscape from the arctic circle, solar radiation must also be combatted by organisms
indigenous to arid regions near the Earth’s equator. A distinct example, the Saharan silver ant
(Cataglyphis bombycine), sports an immensely-reflective ‘silver’ cuticle, which allows it to
maintain its fitness by optimizing its reflectance of thermal radiation, enhancing its emissivity2 [5];
this results in accelerated heat loss, ideal for maintaining lower body temperatures in such a hot
environment. Ultimately, the composite organism and its respective life history traits are the
product of all abiotic environmental features. Thus, the lack of organismal translatability between
niches reminds us that organisms, themselves, represent much larger resultant “wholes”, an n-
dimensional hypervolume, and, therein, are greater than the sum of their individual “parts”, the n-
number of axes comprising said hypervolume [6]. Moreover, this exemplifies the hypothesis that
1 Biotic environmental challenges/stresses are of a living nature; examples of biotic environmental challenges include organisms imposing resource competition or predation pressure. Contrastingly, abiotic environmental challenges/stresses are non-living and are often described as physical or chemical in nature; examples of these include temperature, humidity, pH, or physical/chemical effects that result from biotic activity. 2 Emissivity describes the efficacy with which a surface is able to emit thermal radiation.

2
examining only one environmental factor while in pursuit of ecological-relevance should be
exercised with caution.
Traditionally, the study of ecology views organisms within their environments as distinct,
independent elements within a larger web of interactions. However, an endosymbiont’s
experienced environment is constituted by the viscera and tissues of another animal: a uniquely
biotic environment. This “living” environment also possesses abiotic characteristics which
contribute to a diverse, dynamic landscape, such as the traditional physical factors of pH and
temperature. Naturally, an endosymbiotic lifestyle poses unique challenges for the organisms
living it, but it also provides offsetting benefits. A significant difference to the abiotic repertoire
experienced by endosymbionts is that the host behavior within the external environment can
drastically impact the survival and fitness of the hosted endosymbiont. For example, the
movements of a host can dictate the dispersal success of a given endosymbiont, depending on
the mode through which the hosted organism must exit/dispatch its offspring and how the host
may or may not inhibit this evacuation. Contrastingly and by definition, parasites are dependent
upon their host for resources; ample access to nutrients and optimal microclimate are provided
by and are a function of the host rather than solely that of the parasite. It is the traits characteristic
to these resource-consumer relationships which define a parasite’s host-niche [7]. Due to the
nature of these relationships, it is not exceptional or far-removed to posit that the examination of
host-niche through a lens based upon ecological stoichiometry3,4,5 could result in a more holistic
realization of the fluid economy between organisms. In this way, it may also provide systemic
insight and predictive power to the ways in which we understand the modes and mechanisms of
host-parasite interactions.
The host-parasite system addressed in this work features a ruderal, specialist
entomopathogenic fungus6 (see Chapter 2: Introduction for system and life cycle). To better
understand the ecological context of the organism being examined, I generated a model of its
fundamental and realized niche (Figure 1.0). As a specialist, this parasite has adopted its host as
3 Ecological Stoichiometry ‒ “The balance of multiple chemical substances in ecological interactions and processes, or the study of this balance. Also sometimes refers to the balance of energy and materials.” [254]. An approach which encompasses and integrates biological stoichiometry and nutritional ecology. 4“Biological Stoichiometry is the study of balance of energy and multiple chemical elements in biological systems ranging from molecules to ecosystems. It focuses on key cellular and physiological structures and functions and their associated bio- chemical demands while considering evolutionary change primarily from the perspective of individual fitness.” [255] 5 Nutritional Ecology is the integrated study of organisms, their ecological environments, and respective nutritional determinants of interactions between organisms and their environments. [71] 6 Entomopathogenic fungi (EPFs) are fungal pathogens that are known to infect terrestrial arthropods, either opportunistically or in a highly-specific, obligative fashion, for any or all phases of the fungal species’ life cycle.
3
a primary habitat (i.e., realized host-niche), but, due to the nature of the relationship, experiences
obstacles to transmission, which requires a second habitat outside of the host (i.e., realized
environmental niche). This physical separation between the point of propagation and that of
maturation within the host is a trait of many pathogens; however, in a unique twist characteristic
of only parasitoids, this parasite demonstrates a latency period that extends beyond its incubation
period (i.e., its host only becomes infectious after death). In address of this challenge, this
organism and closely-related species have specially-adapted to optimize the utility of its host by
controlling its host’s movement and orientation upon the climax of infection. This extended
phenotype is understood to enhance dispersal of infectious spores [8], and it has been posited
that this must require observation of abiotic environmental features experienced by both the
parasite and the host (e.g., circadian/circannual rhythm feedback/initiation, or sexual structure
germination determined by degree days) [9], [10]. The model generated, here, will be referenced
as necessary throughout this work to emphasize key findings within the ecological context of this
host-parasite relationship.
1.2 Objectives, Core Questions and Thesis Statement.
To best evaluate and characterize this complex host-parasite system, I began by asking specific
questions and defining key objectives. To understand the role of the parasite in this dynamic
process, a reductionist model was implemented where I removed the host altogether and worked
in vitro to define the nutritional requirements of the parasite. However, the host and the ecological
context of the system were kept in-mind when designing experiments and making the necessary
biological interpretations. My specific objectives were: a) determine key nutritional and select
physical requisites of the parasite, Ophiocordyceps kimflemingae; b) examine the physiological
responses of the parasite occurring under various disturbance regimes; c) utilize the acquired
data to formulate a selective minimal media for improved research methods; and d) utilize the
acquired data to improve an ecological model of the system.
Core orienting questions were derived to provide insight into the rationale behind the
aforementioned objectives. Specifically, are there certain nutritive requirements that make a
parasite a parasite? If so, what factors predispose an organism to parasitism? Does an organism’s
ecology determine the potential for parasitism or is it solely a function of biotic forces? Based on
these conceptual questions and the previously described experimental objectives, as well as the
published literature germane to this project, a formal hypothesis was derived and general,
facilitating warrants were proposed. These two warrants considered in the development of the
proceeding thesis statement were: 1) cross-talk is continuous between the host and the parasite

4
(either indirect or direct); and 2) because of the inherent nature of the parasitic lifestyle, much of
this “cross-talk” must be either about or is constituted by “food”. As a result, the formal thesis
statement was formulated as follows: the nutritional needs of Ophiocordyceps kimflemingae can
provide insight into its ecophysiology and how the parasite successfully colonizes and influences
its host.

5
1.3 Featured Figures.
Figure 1.0 Model of Fundamental Niche for a Ruderal, Specialist
Entomopathogenic Fungus.

6
Figure 1.0 Model of Fundamental Niche for a Ruderal, Specialist
Entomopathogenic Fungus. This figure is intended to illustrate the hypothetical, proposed fundamental and realized niche of O.
kimflemingae, a ruderal specialist entomopathogenic fungus. Here, the environment is represented as that
which is most proximal to the host-parasite relationship. The host is annotated as a biotic microcosm within
the larger habitat. Inside of the host exists the realized host-niche, which, after infection maturity and host
death, expands to nearly comprise the host as a biological whole; however, only select microclimates exist
within the dynamic spatiotemporal mosaic of the larger environment that will effectively facilitate the
parasite’s fitness and spore dispersal after the host has been fixed and consumed. These constitute this
organism’s realized environmental niche. This conceptualization intends to ease the ways with which these
variables and states involved in this complex system are handled, ultimately, to enable a more complete
understanding of what is known and what still needs to be examined; this applies to this and future projects
involving this host-parasite system.
7
Chapter 2. Exometabolomic signatures of entomopathogenic fungi
in vitro: characterization of individual substratum-utilization
phenotypes and interspecific comparison.
2.1 Abstract.
Difficulties persist in the study of host-parasite relationships, and these challenges can be
exacerbated when these pathogenic relationships involve fungi as their causative agents. With
the use of high-resolution technologies, the interstitial spaces between these organisms become
more accessible. Here, a highly-specialized fungal parasite of ants, Ophiocordyceps
kimflemingae, was used to examine the ecophysiological value underlying a parasite’s
biochemical aura, and to determine whether the chemical context surrounding a pathogen might
in some way implicate its corresponding host-niche. Changes in the growth medium were
characterized with the use of targeted exometabolomics and were further extrapolated into a form
of biological heuristic using self-organizing maps. O. kimflemingae was determined to be
immensely resourceful, demonstrating an impressive auxoautotrophic capacity. Only a small
fraction of media metabolites was detectably removed, namely, select sulfur-containing amino
acids and sources of versatile carbon backbones. Additionally, several compounds—indicators of
sulfur metabolism, DNA replication and cell growth—were suggested to be actively-produced by
the organism, despite ample provision in the medium. A single comparative analysis introducing
a second phylogeographically-relevant species demonstrated some similar and other unshared
nutritional requirements, evidencing evolutionary and ecological significance attributable to their
respective host-niches. As demonstrated here, exometabolomics-driven approaches and similar
techniques enable the study of layered or obscured organismal relationships. Ultimately, they
provide opportunities to develop more holistic, translatable understandings of the biochemical
“cloud” constituting the cross-talk between parasites and their hosts.
2.2 Introduction.
Parasites are ubiquitous across ecosystems and often function as governors of their dynamics
[11]. These organisms have demonstrated their importance through a diversity of means, which
include providing balance to predator-prey dynamics and the subduction of colonization by
aggressive invaders [12]–[15]. The nature of a parasite is defined by the relationship that it exhibits
with its host(s); however, just as with other forms of life, it is the abiotic characteristics that prove
to define the biotic ones attributed to any given environment, and this remains true for the players
and interactions inherent of host-parasite relationships. It is these physical and chemical

8
pressures which dictate the coevolutionary histories and resulting predisposition for interactions
of species over time [16]; although, the abiotic facets of an environment are not the sole requisites
for the evolution of a parasite. In addition to demonstrating disparately different sizes,
achievement of candidacy for a parasitic relationship requires that the potential host and parasite-
organisms possess life history traits which facilitate their overlapping in space and time [17]. Each
organism demonstrates mutually-exclusive needs, and it is the overlap of a parasite’s requisites
with that of a host’s supply that further-qualifies a pairing for fostering of a parasitic relationship.
Explicitly, the fundamental niche of a parasite must include traits inherent to the body (or “biotic
landscape/microcosm”) of a host. For a host to fall within a parasite’s realized niche, however,
the biotic/abiotic pressures within the surrounding and host-attributed environments must also be
suitable in a spatial and temporal sense.
Host-parasite interactions are highly complex, layered systems complicated by the
underlying biochemical dynamics and reciprocating physiological systems at-play within
individuals as they interact over time. The resultant communication, or “cross-talk” back and forth
mediating these systems, is a ubiquitous trait of these relationships, acts as a driving force in
parasite evolution [18]–[21], and contributes to the sculpting of the parasite’s host-niche [22]–[24].
Parasite host-niche is defined by the interfaces of these interactions and the environmental
dynamics of host ecoregions within which they occur. This holds true for systems involving
entomopathogenic fungi, which display characteristic interfaces defining of particularly intricate
host-parasite associations.
2.2.1 In vitro cultivation of Entomopathogenic Fungi.
Lab cultivation of entomopathogenic fungi (EPF/EPFs) and its refinement has proven a popular
pursuit for a number of purposes. In addition to the optimization of spore production for biocontrol
applications in agricultural pest maintenance, these imperatives have also included the
improvement of fungal farming yields, whether those yields be fungal biomass, or for the
identification and production of high-value secondary metabolites, particularly in regard to
Hypocreales [25]–[31]. Most laboratory practices for the cultivation of EPFs prioritize contaminant
mitigation, but, in some cases, methodological adaptation for substratum-specialized species is
necessary to enable and facilitate growth. Typical practices consist of isolation, propagule
maintenance/inoculum preparation, quantification, and subsequent methods of infection or
bioassay [32]. Specific to Hypocrealean isolates, these practices anticipate certain requirements
and often reflect this in their tailoring and translation between varieties to avoid contamination or
loss of cultivars. For example, a lag phase is common for this fungal order when applying liquid-
9
fermented blastoconidia to solid substrata, predisposing these inocula to succession and
competitive exclusion; this period requires increased vigilance, for bacteria and other, more
competitive saprotrophic fungi, if given the chance, will more swiftly colonize solid substrata and
result in the loss of blastoconidia. Although many successful methods of cultivation have been
adapted, many more specialized varieties of Hypocrealean taxa have yet to be effectively isolated.
Common mycological practices, which are generalized for the cultivation of non-fastidious
species, have done little to promote the research of specialist fungi or to improve available
varieties of mycological culture medias better-enabling the study of such species. As a result,
media that would allow for reproducible, reliable propagation of these organisms in laboratory
conditions still remain undefined.
A fastidious microorganism is one that is unable to grow on traditional medias, requiring
highly-specific nutrients, growth factors, or an absence of certain environmental antagonists to
develop and replicate effectively [33], [34]. Conversely, non-fastidious microorganisms are often
noted for their insouciant style of growth, demonstrating varying degrees of adaptability to
relatively scant substrata. Select species within the order of Hypocreales have historically
exemplified more fastidious natures [35]–[37], and, considering the ecological context of these
fungi, this does not come as a surprise. Symbioses of any kind, particularly those demonstrating
expansive clade-permeant variability, have a tendency to complicate the process of
understanding an organism [38]–[41]. The order Hypocreales is particularly rich in species
demonstrating varying capacities for symbioses, and, of these, many also exhibit organismal
dualities as a function of host-context. Namely, these fungi have been shown to move between
roles as mutualists while within plant root systems to that of parasites with the introduction to an
invertebrate host-environment [41]–[45]. As a result of these complexities, the known or
suspected symbioses must be appropriately accounted for in the context of proper and
ecologically-relevant in vitro cultivation.
The expansion of EPF research, along with many other similarly-inhibited fields, was timed
with the development of artificial rich medias, many intended specifically for the culture of insect
tissues (e.g., Grace’s Insect Medium). Before this advent, it was routine to collect and pool insect
hemolymph for the constitution of a growth medium that would allow for successful cultivation of
these fungi in laboratory conditions [46]–[48]. Though these developments were crucial in
expansion of the field, the literature pertaining to EPF culture pales in comparison to those
dedicated to study of other parasite-host systems. This is especially true for the cultivation of
species that are known to be highly-specialized to their host [33], [34]. Although select recent

10
publications feature specialists as a facet of discussion, recommendations for in-lab specimen
maintenance only extend to traditional methods, passage and regular cultivation with use of the
host species in-question [32]. Further, the more numerous reviews concerning relevant
information are largely devoted to the resultant phenomena observed with continued use of rich
medias for EPF cultivation (i.e., attenuation of virulence) [46]. It is in the absence of extensive
information that imparts a need for greater effort be put-forth towards the curation and
organization of relevant research. The diversity in life history traits demands that care be applied
when establishing and maintaining viable laboratory specimens for the suitability, sustainability
and reproducibility of work with any one species.
A Study in Specialists: The Hemibiotrophic Fungus, Ophiocordyceps unilateralis s.l.
(Hypocreales: Ophiocordycipitaceae). Within the order of Hypocreales lay several families of fungi which are noted for their relationships
with various organisms, namely, those with plants [41], [49]–[53]. Hypocreales are designated as
Class 2 fungal endophytes, a class known for their abilities to confer habitat-adaptive traits to the
plants with which they are associated [54]. In addition to the order’s documented relationships
with plants, Hypocreales has also accrued a separate but equally-impressive volume of accounts
regarding its diversity of entomogenous7 species, which range from opportunistic to obligative,
and demonstrate varying degrees of symbiotic character (e.g., parasitic, commensal) [55], [56].
As one might subsequently expect, some of these insects have been noted for tendencies to build
and maintain very close relationships with plants [8], [55], [57]–[59]. This implied breadth of host-
range and anticipated host-jumping events have been substantiated through phylogenetic studies
of the fungi, their hosts, and even the viruses found to infect these fungi [60]–[62], [54].
The Hypocrealean family, Ophiocordycipitaceae, has been highlighted for its frequent
pathogenic associations with various insects and arachnids [63]. These associations seem to vary
in host-range as a function of their genus and species. Ophiocordyceps unilateralis s.l., however,
has demonstrated an impressive magnitude of host-specificity, the species of this complex being
known to infect only one species of ant each [64]–[66]. The life cycle of the species complex can
be generalized in five steps (Figure 2.0): 1) exposure of the host to an infectious propagule (i.e.,
ascospores); 2) a one- to two-week incubation period, during which time, fungal blastoconidia
replicate and disseminate throughout the host using the hemolymph; 3) climax of infection,
7 Entomogenous fungi (EGF/EGFs) are those which demonstrate a parasitic relationship with insects and can be assigned to one of three categories defined by the terms of the parasitism: entomogenous ectoparasite, entomogenous endoparasite, or entomopathogen. The former two being defined by an absence of host-termination, despite parasitism, either on the host’s exterior or interior, respectively [256].

11
resulting in the purported “manipulation” of the host for fixation to a surface within the respective
habitat’s canopy; 4) host death followed by hyphal growth and stroma production; 5) finally, after
full maturation of the ascus, ascospores are produced and dispersed over the forest floor below
to infect new hosts [67].
As discussed previously, specialists tend to require more selective medias for successful
cultivation, and this species complex is no exception to this. The host-specificity of this complex
has been observed in the field, and has also been tested under laboratory conditions. This trait
has been further-compounded by the implications of the system’s phylogenies and, even, by the
fossil record [68]. Further-supplementing this hypothesis, species within this complex have
demonstrated preference for particular ratios of carbon-to-nitrogen in artificial substrata, and also
have been shown to possess growth-contingency upon trace metal ions and macromineral salts
present in frequently-used rich medias [35]. Moreover, several species have exhibited drastic
reductions in virulence within only one or two platings/dilutions (unpublished data). Two, in
particular, Ophiocordyceps kimflemingae and O. camponoti-floridani, have exhibited markedly-
low growth rates in the culture medium of choice, PDA (Potato Dextrose Agar), taking
approximately three months to grow from a pinhead-sized tissue plug to that of a dime
(unpublished observations; within-lab correspondence). Subsequent production of blastoconidia
has been determined to be dependent upon the “freshness” of the sample and respective tissue
plug, a similar trait to what has been suggested by literature for other entomopathogens within
the family, Ophiocordycipitaceae; however, the virulence does not appear guaranteed with
successful cultivation.
2.2.2 Exometabolomics ‒ an ‘Omics’ Approach to “Hacking” the Host-parasite
“Cloud”.
Nutritional Immunity and Nutritional Ecology in Host-parasite Interactions. Endoparasites have been shown to demonstrate high-permeability, a trait coinciding with reduced
external defenses. This trade-off is thought to result in improved or facilitated exchange with their
host (e.g., nutritional uptake from the host). These parasites have evolved to optimize exchange
and nutritive curation from their surroundings, effectively minimizing the distance between
themselves and their hosts [69]; however, despite this reduction in distinction, they still maintain
themselves, as distinct individuals. With this, physical and chemical separation between the two
can always be anticipated, and, as a result, leveraged. The spaces occurring between hosts and
parasites can be utilized to improve the characterization of the biochemical environments
attributable to individual host-parasite relationships, in addition to their unique exchanges [70].
12
In evolutionary history, the increasing complexity of organismal development required
adaptations allowing for the accumulation and storage of nutrients [71]. These metabolites are of
high-value across the domains of life and can become a liability to a given host as these resources
are targeted by invading parasites [72]–[74]. Hosts have adopted many modes of response to
combat colonization by parasites, some of which result in the remodeling of the host landscape
and repositioning of its resources being targeted; this is frequently regarded as nutritional
immunity. These responses are used by organisms to prevent parasites from doing what they do
best: sequestering nutrients from their hosts. The maintenance of homeostasis and allocation of
energy sources can further-encumber a body fighting infection, making the balance of immune
system activity and physiological regulatory obligations quite unwieldy [75], [76]. In this way,
nutritional stores throughout host tissues can become instrumental pieces in a proverbial game
of chess, acting as scattered pawns to be won or lost by the parties involved [74], [77]–[79]. A
host’s innate and adaptive immunities work synergistically with nutritional immunity to mitigate
pathogen-sequestration of nutrients. An example of this synergism is the deactivation of
siderophores8 or inhibition of their production with the induction of hyperthermia [80]. Another is
the sequestration of trace ions by macrophages into digestive vacuoles, in effect, weaponizing a
contained but highly-oxidative, cytotoxic environment to kill endocytosed pathogens [81].
Nutritional immunity is an effective facet of organismal defenses; however, like many other
mechanisms of defense, pathogens have evolved ways to subvert it. Exemplary of this
phenomenon, Histoplasma capsulatum, a fungal pathogen of animals, requires endocytosis by
macrophages to effectively disseminate throughout and successfully colonize a host [82].
The mechanisms of nutritional immunity vary within and between species, and these
differences define the corresponding diversity of predispositions and susceptibilities of hosts to
various pathogens [70]. Nutritional immunity, like other organismal characteristics, demonstrates
plasticity between individuals, but also can be expected to reflect an organism’s respective
ecology [83]–[85]. Another field of study, nutritional ecology, addresses this concern, but has
seldom been employed to this end in host-pathogen interactions [71]. Reasons for this include,
but are not limited to, the difficulties in acquiring data allowing characterization of organismal
“cross-talk” at such a small scale, and these challenges are undoubtedly multiplied in the face of
host-parasite interactions. Fungi are particularly tightly-woven with regard to the relationships with
their hosts, and is a physical characteristic inherent to biotrophic and necrotrophic growth [86].
8 Siderophores are specialized proteins or molecular complexes produced by bacteria and fungi for the sequestration and transport of trace metal ions and macrominerals.

13
With such a small distance constituting the interstitial spaces between the host and parasite,
research examining the respective exchanges in the context of nutritional immunity and
ecophysiology require accurate, high-resolution methods of measurement and detection.
An ‘Omics’ Strategy for Subverting Scale and Complexity of Host-parasite
Interactions. Measuring the units of exchange within host-parasite systems has demonstrated a history of
challenges. As a result of their life history traits, many parasites have lost a number of genes
required for living independently from another organism, leading to physiological inflexibility and
their frequent description of being unculturable/uncultivable [34], [87], [88]. It is this obligate nature
of many parasites that has proved the primary governor of their difficult cultivation; however,
various ‘omics’ technologies have allowed for facilitated identification, isolation and study of these
finicky organisms. For example, Mycobacterium leprae, a causative pathogen of leprosy (also
called Hanson’s Disease) and obligate intracellular parasite, has only been identified through the
application of genomics techniques to tissue biopsies collected from deceased patients [89]. A
number of fields have been slowed as a result of possessing uncultivable microorganisms at their
centers, but the advent of ‘omics’ technologies has afforded opportunities for the capture of
biological “snapshots”, making these previously uncharacterizable forms of life “characterizable”
[90], [91]. With these technologies, scientists have been able to better understand the complex
symbioses facilitating coral fitness, and examine the extremophiles challenging the very definition
of what constitutes “life” [92]. They have even allowed us to expand the knowledge of our own
species, illuminating the microbial worlds on and within us that make us who we are [93].
Metabolomics9, compared to the technical development of other ‘omics’ fields, is still
somewhat in its infancy, but it is this method, in particular, that shows the most promise for
examining the molecular space definitive of host-parasite cross-talk. Endometabolomics, or
metabolomics techniques designed to observed intracellular molecules, has become a pivotal tool
in understanding the cellular biochemistry associated with cancers and their respective drug
treatments [94]. Exometabolomics, on the other hand, are methods which capture the biochemical
moment of the extracellular space—the metabolic “inputs” and “outputs” of a given organism [95].
9 Metabolomics ‒ “the large-scale study of small molecules, commonly known as metabolites, within cells, biofluids, tissues or organisms. […] metabolites and their concentrations, unlike other "omics" measures, directly reflect the underlying biochemical activity and state of cells/tissues. Thus, metabolomics best represents the molecular phenotype.” Excerpt source: The European Bioinformatics Institute (EMBL-EBI)

14
2.2.3 Understanding a Parasite and its Host-niche through its Ecophysiological
Requisites.
The complex interplay of many biotic and abiotic environmental stresses and their influence gives
cause for their combined examination across many fields of study. Physiological ecology (also
called ecophysiology, or comparative physiology/environmental physiology) favors a more
mechanical approach and is the study of how living things function and adapt to various stresses
within their environments [6]. This field of study integrates measurements of the biotic and abiotic
pressures experienced by an organism, in place of more traditional, isolated biotic observations.
The inclusion of these diverse perspectives allows for examination of, both, the organism and the
environmental contexts from which it precipitated. An ecophysiological lens seeks to examine the
simple, recurring patterns underlying biological and ecological complexity; as a result, it lends
itself to the study of microbial communities and host-parasite interactions. Such complex systems
call for the implementation of improved technologies and techniques to meet the challenges they
present, and an ecophysiological lens may very well enable their application [87], [90], [96]–[98].
In effort to better understand the ecophysiological requirements, as well as putative host-
niche, of a fastidious fungal parasite, an exometabolomics approach was utilized to capture the
metabolic inputs and outputs of a known rich media. This technique offers an ideal steppingstone
for this experimental system, generating a path to more ecologically-relevant in vitro and in vivo
research. Although the ultimate, idealized objective will not be met by this research, it is the goal
of this project to lay the foundation for future work, as well as corroborate and supplement
previous molecular research of this host-parasite system. This collection of effort is intended to
facilitate improved standard operating procedures, experimental design, and reproducibility,
locally, as well as for others exploring bidirectional interactions of highly-specialized parasites
within their respective ecological contexts.
The problem examined within this work is that of developing an understanding of the
complex interactions demonstrated by a eukaryotic, hemibiotrophic parasite and its host, as well
as the many obstacles imposed by the nature of the relationship. In response, a focal question is
presented: how can we capitalize upon the “cross-talk” between these organisms to better
understand this relationship? To answer this question, an in vitro exometabolomics approach was
used to examine the putative exchange between organisms (Figure 2.0b). This strategy was then
used to develop a more ecologically-relevant selective medium for continued propagation in lieu
of within-host resolution.

15
2.3 Materials and Methods.
2.3.1 Liquid Fermentation of Blastoconidia for Longitudinal and End-point
Assays.
Inoculation and Incubation – Longitudinal Exometabolomics Studies.
Field samples were collected and topically sanitized using a bath of 79% ethanol prior to
dissection. Fungal tissue was then excised and placed onto a plate of fresh PDA containing
penicillin-streptomycin (100 ppm) and kanamycin (50 ppm). After development, the plug of fungal
tissue was used to inoculate each Erlenmeyer flask of liquid media (Grace’s Insect Medium,
Sigma Aldrich), which was subsequently sampled (330 µL/day, per sampling event) and extracted
in technical triplicate each day (100 µL per extraction; sample margin of 30 µL), over the course
of 21 days post-inoculation (dpi), including 0 dpi. All cultures were cultivated under low-/no-light
conditions at room temperature (~23 °C) and aerated at 130 rpm (VWR Incubating Orbital
Shaker). See 2.3.2 for exometabolomics assay protocol.
Inoculation and Incubation – End-point Exometabolomics Studies.
All assays subsequent of the two longitudinal studies were carried-out at end-point and were
inoculated with fresh blastospore solution, instead of a fungal tissue plug. For each series, the
same amount of spore solution was used from the identical spore source. Additionally, all cultures
were incubated under identical conditions as before, but with a difference in cultivation flasks
(tissue culture flasks, instead of Erlenmeyer flasks). To explore the physiological importance of
select trace metals and macromineral ions in blastoconidial growth and development, several
metrics were acquired at the end of a cultivation period of 11 dpi (12 days, total, including day
zero, 0 dpi). Measurements were taken after completion of the media sampling, sample-prep and
extraction exacted for exometabolomic analysis (technical replicate = 3; biological replicate =1).
Additional metrics included the differential pH (∆pH) and secreted protein (Ps) of the supernatant
for each incubated solution. All separate experimental batches cultured for these end-point
assays included an inoculated control flask and a non-inoculated control with the exception of one
set (for details and specific experimental series excluding a non-inoculated control, see
supplemental table, B2.0). For the minimal medias, in particular, each individual formulation
required pairing with an additional control (a non-inoculated flask containing each characteristic
media) for the duration of the cultivation period, in addition to their respective inoculated flasks
(experimental units).

16
Trace metal ions supplemented into growth medias were iron (Fe2+), copper (Cu2+), zinc
(Zn2+), and manganese (Mn2+). Macromineral ions chosen for supplementation were calcium
(Ca2+), potassium (K+) and magnesium (Mg2+). These cultivation experiments featuring
supplementation were performed in parallel with each ion’s chelation. The concentration of each,
respective supplement was determined through an examination of available literature as it regards
general fungal nutritional requirements [99]. For cultivation studies using a chelating agent, either
EDTA (Ethylenediaminetetraacetic acid) or TPEN (N,N,N′,N′-tetrakis(2-pyridinylmethyl)-1,2-
ethanediamine) were administered (again, see supplemental table B2.0 for experimental design,
concentrations and pairings). Additional cultivation series used in the development of minimal
media formulas and examination of morphology included three adjusted starting pHs (4.2, 5.0 and
6.6 pH), and asparagine- and methionine-fortified versions of the traditional rich media
(separately, each original concentration in Grace’s Insect Medium was effectively doubled). This
same set (biological replicate, n = 1) also included three additional flasks, each laced with
dibutyryl-cAMP, a signaling molecule-mimic, at three concentrations (1.0 mM, 1.5 mM and 1.7
mM). Upon minimal media formulation, which used data from the first longitudinal study of O.
kimflemingae and subsequent end-point assays of the same species, the medias were similarly
inoculated with blastospore solution and assayed at end-point (exometabolomics, differential pH,
and secreted protein).
2.3.2 Exometabolomics – Longitudinal and End-point Assays.
Sample Dilution and Methanolic Extraction.
To optimize the analytical balance of accuracy with sensitivity in the use of LC-MS
exometabolomic techniques, it was necessary to determine the linear range of the substrata used
across the experiments. This was ensured by performing a preliminary LC-MS analysis of the
substrata formulation, both, undilute and at four distinct magnitudes of dilution; the resultant
dilutions for comparison were as follows: 1:1, 1:2, 1:4, 1:8, and 1:32. With use of these results, it
was determined that a 1:4 dilution of the sampled media for the intended extractions would be
necessary to optimize peak resolution and sensitivity, effectively minimizing effects of ion-
suppression or peak-loss due to ions falling below the level of detection (data not shown).
All LC-MS samples were prepared in technical triplicate using a methanolic extraction. A
330uL sample of growth media was harvested from the culture and centrifuged 30 seconds at
max speed to remove cell debris. For extraction, 100 µL of supernatant was administered into
three 1.5 mL centrifuge tubes, each containing 900 µL of ice-cold methanol (100%, HPLC-grade,
Thermo Fisher Scientific). All extracted samples were placed in a -80 °C freezer for storage until

17
day of batch-injection for LC-MS analysis. Sample prep on the day of injection required an
additional pelleting step, transfer of supernatant to new 1.5 mL centrifuge tubes, and then drying
under a stream of ultra-pure nitrogen gas. These were subsequently resuspended in 400 µL of
HPLC-grade water (Sigma Aldrich) also containing an internal standard (1 µM Chlorpropamide).
All steps on the day of were performed on ice and with ice-chilled reagents. These were then
vortexed (vigorously, 2x 5 seconds each) and centrifuged at max speed and 4 °C for 10 minutes,
after which supernatants were transferred to new 1.5 mL centrifuge tubes. These were
subsequently used to contribute to the pooled quality control sample or QC (~100 µL, mass
spectrometry vial), in addition to their own, respective mass spectrometry vials (100 µL per vial
for each sample). All samples were run in randomized order using an Orbitrap Exactive Plus
(Thermo Fisher Scientific). QC samples were injected to constitute 5% of the total injected per
batch. Data acquisition was exacted through the injection of 10 µL per sample using a previously-
established method [100], with slight modifications (0 min = 0%B: 5 min = 20%B: 7.5 min = 55%B:
15 min = 65%B: 17.5 min = 95%B: 21min = 0%B; mass filters - 0-5 min = 85-800 m/z, 5-6 min =
100-800 m/z, 6-9.5 min = 85-800 m/z, 9.5- 15.5 min = 110 - 1000m/z, and 15.5-22.5 min = 250-
1000 m/z).
Feature Detection, Metabolomic Analyses and Data Visualization.
Thermo .RAW files were converted to .mzXML format using ReAdW (software). Targeted
analyses were performed using an open-source software [101] and a knowns list provided by the
laboratory of Dr. Manuel Llinás at Penn State University. Peaks were picked manually based upon
observed mass (+/-10 ppm, expected [M-H]-), peak shape, distance from expected retention time
(+/- 1 minute) and signal over background. Peak areas were exported into Excel for subsequent
analysis. All data were background subtracted using each analyte’s averaged method blank
value. Peak’s falling below averaged blank value or below 0 were imputed with a value of 10000
or average method blank value. These data were RSD-filtered (relative standard deviation, <
25%), and then log2-transformed relative to the averaged control values. Transformed data were
then used to generate figures (i.e., heatmaps, metaprints, metatracks, select analyte line plots).
The media components unable to be measured as a result of the analytical method were limited
to choline chloride and glycine.
To more closely compare the gross differences between species, a self-organizing maps
visualization technique was employed to differentially examine the metabolic signatures of each
in a holistic manner. This method, called suprahexagonal mapping, utilizes an unsupervised
learning algorithm (self-organizing maps, or SOMs) to allow for dimensional reduction of complex
18
data. This results in the generation of a 2-dimensional hexagonally-shaped plane composed of
smaller hexagonal cells reflecting their assigned, hyper-dimensional nodes. These cells are
organized in an ordinal fashion and bin-contents are assigned according to their relatedness in
data behavior, resulting in a highly-polarized visualization with impressive inferential power. The
provided training data and node behaviors are also used to generate subgroups or families of
behavior within the larger hexagonal plane called metaclusters and metacluster bases. With the
overlay of a new dataset for comparison to the training data, the topology—or cell contents (i.e.,
target compounds) and hyper-dimensional organizational structure across the 2-dimensional
plane—remain the same (i.e., metacluster bases and contained cell numbers); however, how
those cells are filled with visualization is a direct product of the overlaid data set. For longitudinal
hexagonal mapping, only, sets analyzed contained all possible metabolites of the targeted list; if
any metabolites failed to be detected in a given data set, zeros were inserted by default for those
observations, while all those detected maintained their respective data (RSD-filtered, log2-
transformed relative to the control average). For end-point hexagonal mapping, only shared
metabolite data were mapped. All enrichment analyses was performed through the MSEA
(metabolite set enrichment analysis) feature of the MetaboAnalyst web portal [102].
2.3.3 Assay of Secreted Protein.
For quantification of secreted protein, a small amount of supernatant was collected (~1-2 mL)
from each respective sample and administered into 1.5 mL centrifuge tubes. Samples were then
centrifuged for 20 minutes at 12,000 xg. Subsequently, these were filtered through a 0.45 µm
syringe filter using a 3 mL syringe (new syringe and filter were used with each sample). All were
injected into new 1.5 mL centrifuge tubes prior to colorimetric protein assay. For quantification of
secreted protein post-sample prep, a Pierce BCA Protein Assay kit (Thermo Fisher Scientific) was
used, as well as the included recommended method for a 96-well plate. As a result of determined
fit to the standard curve, samples were diluted to 10% and 14.29% their original concentration.
96-well plates were then scanned using a Biotek Synergy H1 Microplate Reader (absorbance,
562 nm). As a result of the limited number of technical replicates per sample, both concentrations
(10% and 14.29%) were used in the generation of figures in addition to their respective average.
Technical variance was exhibited in form of the standard deviation per sample and were applied
to the graphical representations of the averaged data (+/- calculated standard deviation).
2.3.4 Measurement of Supernatant pH and Differential Calculation.
For all pH measurements collected for the end-point studies and growth medium preparation
protocols, a traditional industrial-grade pH meter was used (Mettler Toledo™ S220

19
SevenCompact™ pH/Ion Benchtop Meter). After being centrifuged in 50 mL conical tubes for 10
minutes (15317 xg; Beckman Coulter Benchtop Centrifuge) at approximate room temperature (24
°C), supernatants were separated from the pelleted wet biomass and reallocated to new conical
tubes (two separate tubes with each sample) for pH measurement (biological replicate, n = 1;
technical replicate, n = 1). All pH measures were taken immediately with the termination of each
culture series designated for end-point assays (11 dpi). Differential pH (∆pH) was calculated using
starting pH and ending pH of each minimal media and used to generate figures. These calculated
values were corrected through subtraction of batch starting pH. For all other end-point studies,
differential pH (∆pH) was calculated using the pH of a non-inoculated control that was incubated
in-parallel under identical experimental conditions.
2.3.5 Figure Generation and Statistics of Exometabolomic Data.
Generation of all heatmaps and hexagonal maps (metaprints and metatracks) required use of the
supraHex package in R [103]. All color schemes used were customized (excerpt: basic <-
paste(c("midnightblue","white","darkred"), collapse="-")). Heatmaps were
produced using Euclidean distance and Ward linkage methods in clustering. Hexagonal mapping
was performed using default arguments with the exception of graphical parameters. All
enrichment analyses were either performed manually using common databases
(KEGG/HMDB/PubChem/ChEBI/MetaCyc) or with the use of the MetaboAnalyst web portal [102].
2.4 Results.
2.4.1 Longitudinal Exometabolomics of O. kimflemingae, in vitro.
To examine the physiological demands of Ophiocordyceps kimflemingae in the context of its
substrata, an extracellular metabolomics approached was implemented. Targeted metabolomics
was used to identify the changes in media composition over time as a function of fungal growth
in liquid culture. Surprisingly, O. kimflemingae demonstrated very little nutritional reliance upon
growth medium constituents (Table 2.0), although this media has been indicated as one of the
most commonly used media for in vitro cultivation of this and other species of Hypocrealean fungi
[35], [36], [104]. Initial examinations indicated both a temporally-defined metabolic shift mid-
course (~day 13) and, for a subset of analytes, distinct fluctuations over time (Fig. 2.1). These
findings were provided in further detail below, beginning with the examination of the gross
observations across analytes over time, and, subsequently, a review of each macronutrient
category and major findings.
20
2.4.2 High Productivity with Very Little Input: Lag Phase and Underlying
Compositional Dynamics of Growth Substrata.
In examination of temporal media dynamics with growth, characteristics between and across days
were analyzed to better understand the importance and putative interplay of metabolites relative
to fungal physiology. The features of the media over the course of this study suggested that this
parasite is impressively improvisational, and this was emphasized largely by the selective nature
of its nutritive uptake (Figure 2.1). The large majority of the analytes detected through targeted
analyses were demonstrated to have increased over time, while only a minority of those were
observed to have decreased in any substantial manner. Additionally, this organism demonstrated
a blatant lag phase prior to any indications of media utilization. The stasis appeared to dominate
the timeline until, on 13 dpi, marked changes across metabolites appeared to occur, this also
coinciding with the first observation of turbidity, a common indication of growth for cultivation in
liquid media (unpublished observations). This apparent shift observed with 13 dpi was quantified
by the quadrupling of more than 28% of detected metabolites between 12 and 13 dpi. A much
higher level of metabolic activity was suggested from this time point onward by continued media
compositional changes, and by the final observation of the study, 25 of 64 metabolites were
indicated as experiencing increased relative abundance over time. Conversely, and in additional
support of the organism’s resourcefulness, a minority of eight metabolites were determined to be
decreasing over the course of the experiment. These were examined as putative metabolic
“inputs”, and their complements, those which increased in the media, were examined as putative
metabolic “outputs”. The remaining 31 analytes were left to a third and final category which was
ascribed little to no change in relative abundance over time. Across all groups, enrichment
analysis was dominated by protein biosynthesis, ammonia recycling, urea cycle, malate-aspartate
shuttle and alanine metabolism network-association (Holm adjusted p < 0.05; see Allman et al.,
Antimicrobial Agents and Chemotherapy 2016). With the understanding that this organism
exhibited aggressive proliferation under experimental conditions, these associations indicated by
enrichment analysis did not come as a surprise.
2.4.3 Temporally and Magnitudinally Distinguished Metabolites.
Before examining the exometabolomic data on the basis of macronutritional class, analytes were
briefly highlighted based on having exhibited distinctive behaviors over the course of the
experiment. The largest absolute fold-change (average log2 fold-change per diem) was

21
demonstrated by orotate10, a metabolite not attributable to the growth medium formulation. In
magnitude, orotate was immediately followed by thiamine, ribose-5-S-homocysteine, asparagine,
tetrahydrobiopterin and ribose, respectively, of which three of five were contributors to the original
formulation. When direction of change is considered (i.e., increase or decrease relative to control
abundance), orotate maintained top rank, having experienced the greatest fold-change increase
in relative abundance throughout the course of the observations. Those which followed orotate in
magnitude of increase were ribose-5-S-homocysteine, tetrahydrobiopterin and indole-3-
carboxylic acid, respectively. Compounds exhibiting the largest log2 fold-change decrease were
thiamine, asparagine and ribose. The majority of metabolites within the increasing and decreasing
parental clusters exercised their namesake trends beginning upon 13 dpi with the exception of D-
gluconate, nicotinate, xanthine and hydroxyphenylacetic acid, all of which exhibited a much more
gradual increase long-prior to this time point (Figure 2.1). Metabolites experiencing non-
asymptotic or non-sigmoidal distributions across the full chronology of the experiment were limited
to glutathione, 2-oxo-4-methylthiobutanoate, tetrahydrobiopterin, N-acetylglutamate, xanthine,
hexose-phosphate, IMP, hydroxyphenylacetic acid and pyroglutamic acid. Pyroglutamic acid, in
particular, presented a unique case, as it is the time-dependent result of glutamate/glutamine
within each sample, pyrolyzing gradually across all samples over the course of the experiment
[105]. First, despite the expectation that this analyte would be correlated with the detected
abundance of glutamate/glutamine, it was not. In fact, observations actually seemed to indicate a
depletion of pyroglutamic acid subsequent of 13 dpi, in direct opposition with the time-dependent
accumulation across controls. Additionally, with pyroglutamic acid’s precursor, glutamate, having
demonstrated subtle increase through time, and, because of this, much was left unaccounted for
with respect to the details of this metabolite.
2.4.4 Characterization of Substratum-utilization Phenotype by Macronutrient
Category.
To determine the substratum-utilization phenotype of this organism, the exometabolomic data
were examined with the original media formulation as a guide for determining changes from the
media baseline compositional features. This facilitated reference to analytes that were available
in the media for uptake, which then permitted for simple discernment of differentially-removed or
-added components (Figure 2.1; Table 2.0). An initial overview of these results was provided, and,
subsequently, was further reviewed in more detail for each respective macronutrient category.
10 Orotate is an organic acid commonly produced as a result of the pentose phosphate pathway from 5-Phosphoribosyl diphosphate; orotate then feeds into pyrimidine and purine metabolism.

22
According to the resulting data, O. kimflemingae demonstrated a high level of nutritional
selectivity. This was proffered by the fact that only 8 components out of 36 detectable formulation
analytes indicated noticeable decrease and were clustered as such (contents of decreased-
detection parental cluster). Metabolites within the media detected as being depleted or decreased
were observed to include two vitamins (thiamine and pyridoxine), three amino acids (asparagine,
cystine and methionine), two carbohydrates (sucrose and ribose) and one atypical amino acid
(pyroglutamic acid). Thiamine and asparagine were the most aggressively removed from the
media, exhibiting log2-fold change slopes of -13.69 and -5.96 between 11 and 13 dpi, respectively.
Conversely, the amino acid, methionine, and amino acid dimer, cystine, were of a somewhat more
gradual decrease and demonstrated a small time-delay compared to the initial depletion of
thiamine and asparagine. The removal of pyridoxine was less pronounced compared to thiamine,
while the depletion of detected carbon sources, sucrose and ribose, were understood to have
been swift, although differing in the time-point at which they surpassed below their respective
limits of detection.
While there were several blatant characteristics within the data, other, subtler, trends were
also observed. The only other amino acids demonstrating any level of depletion that were also
featured in the media formulation were alanine, isoleucine, leucine and phenylalanine. Alanine
and isoleucine only showing minor removal beginning with 14 dpi, whereas the latter two exhibited
low rates of removal on and after 19 dpi. Other amino acids, vitamins and carbon sources present
in the growth medium formulation were not determined to have been removed to any notable
degree. Interestingly, some of these were, instead, increased in detection co-temporally with the
aforementioned indications of media utilization. Some of those exhibiting this behavior showed a
unique pattern of decrease subsequent to this increase over time. The five amino acids that
exhibited this characteristic behavior were proline, valine, β-alanine, serine and threonine.
Carbon Sources and Contributors to Core Carbon Metabolism ‒ Sucrose and Ribose.
Carbohydrates were the largest contributors by mass to the formulation of Grace’s Insect Medium
(Table 2.0). There were three sugars featured in the medium formulation: two hexoses (i.e.,
glucose and fructose), and one disaccharide (i.e., sucrose, a nonreducing heteromeric dimer
composed of one glucose and one fructose molecule). Sucrose was, by far, in the greatest supply,
contributing more than half of total ingredient mass and approximately 92% of the mass of total
primary carbon sources. An additional sugar, a pentose (e.g., ribose) was also detected as being
present in the media, not by formulation, and was indicated as also having been removed over
the course of the study. Organic acids central to carbon metabolism were other relevant

23
components featured in the medium formulation; these included: fumarate, succinate, malate and
α-ketoglutarate (i.e., each of these four are known to directly contribute to the TCA cycle). Each,
carbon sources and other contributors to core carbon metabolism, were used below to
categorically examine carbon-acquisition as indicated by the longitudinal exometabolomic data of
O. kimflemingae.
The selective reliance upon starch-derived sugar monomers and their required,
corresponding exoenzymes have been well-documented as a fundamental basis of fungal
nutrition [106]. Previously, glucose has been observed as the preferred carbon source of a closely
related fungus within the same species complex, Ophiocordyceps unilateralis (BCC 1869), when
grown in liquid culture [35]. Initial review of the data suggested a very similar carbohydrate
preference, as sucrose, which contains glucose, was one of the few analytes determined as
having been removed from the media in any substantial manner. Upon further investigation,
however, results implied that the dimer, sucrose, was being broken down prior to differential
absorption of the hexose monomers. Interestingly, O. kimflemingae appeared to refrain from
removing simple hexoses, and, instead, seemed to slowly remove a related product, hexose-
phosphate. In addition to the increased-detection and subsequent persistence of simple hexoses
in the media, a preferential removal of the detected 5-carbon sugar was observed to have been
completely removed (Figure 2.2a). Further, with the depletion of sucrose from the media (4.91
log2-fold decrease), hexose was shown to increase substantially relative to control values with
and subsequently to 13 dpi (4.71 log2-fold increase). Simultaneously, ribose is shown to begin a
graded decrease, finally experiencing a sudden drop-off with 19 dpi (average -9.98 log2-fold); the
detected relative abundance of ribose dropped to 11.51 log2-fold. Hexose-phosphate, a
phosphorylated form of hexose, was determined to have increased sharply in the media with 14
dpi, peaking in the media on 16 dpi (9.82 log2-fold increase), before decreasing over the remaining
5 days (average slope -0.33 log2-fold difference per dpi relative to control).
As central contributors and intermediates of core carbon metabolism, organic acids were
also examined in greater detail, and, with this and the resultant metabolic footprint of this
organism, were determined as likely ambient indicators of metabolic activity as it involves shunts
to, from, and through various legs of the TCA cycle. As suggested per this warrant, several organic
acids proved insightful in examination of the putative metabolic form and function indicated by the
exometabolomic analysis of O. kimflemingae over the course of this study (Figure 2.2b). Fumarate
began a gradual increase on 13 dpi, eventually culminating to 0.79 log2-fold in abundance relative
to control values. Similarly, succinate, a downstream TCA intermediate which results from the

24
oxidation of fumarate, also demonstrated a gradual increase initiated with 13 dpi and ultimately
exhibited a relative-increased abundance of 0.64 log2-fold by 21 dpi. Interestingly, the hydrated
product of fumarate as mediated by fumarate hydratase (or fumarase), malate, did not differ
substantially from control levels at any point over the course of the experiment. On the other hand,
α-ketoglutarate — the organic acid that precedes succinyl-CoA and, therein, succinate, within the
TCA cycle — began demonstrating a sharp decrease in detected relative abundance upon 15 dpi
(-2.27-log2 fold from 14 dpi), reaching a trough on 19 dpi.
Nitrogen Sources ‒ Asparagine, Atypical and Sulfur-containing Amino Acids.
Across organisms, amino acids are highly valued for their nitrogen-containing moieties; however,
in the instance of fungi and other microbes, they can also serve as a crucial source of sulfur. As
per respective exometabolomic data, O. kimflemingae has been indicated as no exception to this
mode of acquisition. What’s more, this Hypocrealean species was indicated as removing an
atypical amino acid, pyroglutamic acid, from the media, which suggested the rather characteristic
ability to utilize this irregular nitrogen source, a seldom reported capacity that has been
documented in select species of fungi [107], [108]. These two exceptional qualities demonstrated
by O. kimflemingae’s metabolic footprint were examined in further detail, below, as they relate to
the corresponding organism’s physiology and nutritional requirements.
The metabolic footprint indicated that the select few putative nitrogen sources utilized by
O. kimflemingae also happen to involve the two, sole amino acids which can also serve as organic
sources of sulfur: methionine and cysteine. Two of the three most-swiftly depleted nitrogen
sources found in the original medium formulation, cystine11 and methionine, contain this trace
essential element, although in very different forms (Figure 2.2c). Methionine contains sulfur within
its S-methyl thioester side chain. Cystine, on the other hand, is constituted by two cysteine
molecules — cysteine being the only amino acid to contain a sulfhydryl moiety — that are joined
by a disulfide bridge. The separation of the two cysteines is reported to occur readily in the
presence of mild reducing agents; however, exoenzymes evolved for the specialized hydrolysis
of these linking moieties have also been documented in fungal species [109]. Here, cystine was
shown to decrease by 4.45 log2-fold following 13 dpi. Cysteine, in contrast, demonstrated a minor
decrease (1.38 log2-fold) between 12 dpi and 14 dpi, a trend that was markedly interrupted with
the subsequent time point, 15 dpi, where the analyte initiated a steep increase in relative
abundance of 1.83 log2-fold. This trend continued for only one additional time point, 16 dpi, the
11 Cystine is commonly used in artificial mediums and supplements as a stable source of the amino acid cysteine, of which it is the dimeric form.

25
value of which was thenceforth reiterated across the remaining observations generating a plateau
of approximately 1.49 log2-fold relative to control values. Methionine, in contrast to cysteine or its
dimerized form, exhibits a clean, gradual depletion beginning on 13 dpi and amounting to a final
decrease of 4.39 log2-fold from initial relative abundance. Asparagine is a proteinogenic amino
acid containing a carboxamide side chain and α-carboxylic acid moiety, characteristics conferring
much of its value as a pivotal and highly-flexible intermediate between many core metabolic
processes (Figure 2.2c). In this study, asparagine distinguished itself from all other amino acids
removed from the media, being depleted below accurate detection levels within only 48 hours.
More explicitly, asparagine was determined to decrease by 14 log2-fold relative to control levels
between 12 and 14 dpi.
The exometabolomic data of O. kimflemingae suggested an ability to remove an atypical
amino acid from the media, a capacity known to be a relatively uncommon or lesser-characterized
phenotype among eukaryotes. Pyroglutamic acid, although not a formal contributor to the growth
medium formulation, is a naturally occurring lactam-form of glutamate or glutamine, two amino
acids which do contribute to the medium’s known composition (Table 2.0; Figure 2.2c). Despite
the demonstrated time-dependent accumulation of this cyclized-form across control samples, the
relative abundance of pyroglutamic acid was sharply reversed beginning with 15 dpi (5.67 log2-
fold decrease from 14 dpi) for the inoculated samples, ultimately reaching a trough on 17 dpi of
5.44 log2-fold decrease. It is this demonstration of continuous accumulation in the absence of this
fungus which further implicated the posited faculty for utilization of the atypical amino acid.
Vitamins ‒ Thiamine and Pyridoxine.
As essential vitamins, thiamine and pyridoxine are required cofactors for many catabolic, anabolic
and anaplerotic reactions. Many of these include requirements in-conjunction with
decarboxylases, mediating the degradation of amino acids into catabolites that function as
precursors for purine and pyrimidine synthesis, as well as many secondary metabolites. In this
exometabolomic study, O. kimflemingae demonstrated selective auxoautotrophism12 and
auxoheterotrophism13 for various vitamins. Of those measured, thiamine and pyridoxine were
indicated as the only vitamins for which the fungus was auxoheterotrophic. This was suggested
by the fact that only these two vitamins were observed to decrease in relative abundance over
time within the metabolic footprint. The depletion of thiamine was the most severe, exhibiting a
12 Auxoautotrophic is used to describe an organism with the ability to produce its own supply of a select essential nutrient. 13 Auxoheterotrophic is used to describe an organism that is deficient in an essential nutrient, as it is unable to synthesize it itself.
26
13.69 log2-fold decrease within 24 hours (from 12 dpi to 13 dpi) (Figure 2.2e). Pyridoxine, on the
other hand, was removed in a less-abrupt fashion, demonstrating a steep decline subsequent of
13 dpi, of which, thenceforth, decreased in severity in-approach to 19 dpi (Figure 2.2f). The overall
decrease of pyridoxine from the initially detected abundance was approximately 5.38 log2-fold
relative to control values. Folate, another vitamin detected, appeared to exhibit behavior indicating
that it was relatively stable around the feature’s limit of detection, showing no substantial decrease
or increase relative to control values.
O. kimflemingae was shown to be auxoautotrophic for select, detectable vitamins
contained within the formulation (Table 2.0), and therefore was determined to not require their
provision via substrata. Indicated by a notable increase in detection during the observation period
relative to control values, these vitamins were limited to pantothenate (9.40 log2-fold) and
nicotinate (3.88 log2-fold change).14 Pantothenate began a noticeable increase with 13 dpi.
Nicotinate also showed relative-increased detection (Figure 2.2f). Initial accumulation of the
vitamin began with 13 dpi and culminated to a height of 3.88 log2-fold difference relative to control.
The observations indicating auxoautotrophically-derived pantothenate accumulation suggested
that the affiliated source for substratum-dependence lay upstream of the vitamin, biosynthetically.
To better understand the sources from which O. kimflemingae was potentially synthesizing this
vitamin, the known precursors of pantothenate, alanine and β-alanine, were visually juxtaposed
with their anabolic successor (Figure 2.2e). In this way, it was determined that the formulation
component most-likely being used for pantothenate biosynthesis by this fungus was alanine. This
was deduced from the additional auxoautotrophism demonstrated for β-alanine, which
corresponded with the depletion of alanine and the intermediate of the two, aspartate, from the
media.
2.4.5 Follow-up: Supplementation of Ionic Cofactors, Chelation and
Phenotype Rescue.
Many instrumental cofactors required by metabolic pathways are present in substrata as free
ions15, and can act by activating or catalyzing enzymatic reactions. Alternatively, they can work
in-concert with other cofactors16 to facilitate biochemical processes and are often vitamin-derived
14 Although included within the raw data, p-aminobenzoate and myo-inositol did not pass the RSD-filtering process. 15 Cofactors can be described as being either inorganic (e.g., metal ions; iron-sulfur clusters within cysteinyl residues) or organic (e.g., vitamins and derivatives; non-vitamin-derived metabolites; protein-derived; non-protein/off-target participants). 16 In this case, synonymous with “coenzymes”; coenzymes are frequently sub-classified as either cosubstrates or prosthetic groups, which are either transiently- or permanently bound to an enzymatic protein within a complex, respectively.

27
coenzymes or are synthesized at low concentrations from other essential nutrients (e.g., NAD or
tetrahydrobiopterin, respectively). Many layers constitute the pathways within organismal
metabolisms and cofactors function as the gatekeepers and regulators of these fundamental
processes. Incorporation of these trace nutrients is crucial for developing a complete “chemical
snapshot” of any organism’s physiology.
To determine this more complete “chemical snapshot”, these inorganic cofactors, such as
zinc and copper, were selectively supplemented through administration or removed through
chelation, and their metabolic signatures compared. Blastospores inoculated into rich media were
cultivated for a fixed period and assayed at end-point for generation of their respective metabolic
footprints (Figure 2.3a; Figure 2.3c; supplemental table B2.0)17,18. The footprints of these series
exhibited similarities within and between culture sets, all of which were performed in identical
experimental fashion. Suprahexagonal visualization allowed for emphasis of those which were
distinct within and across each set. The most visually distinguished of the signatures were those
resembling the non-inoculated samples within their respective series, a status which could,
generally, be considered the closest signature to one indicating “dead” or “no growth”, from an
exometabolic standpoint. At physiologically-relevant concentrations, zinc, calcium and copper
were indicated as being capable of reenabling growth in the presence of TPEN at equimolar
concentrations, whereas manganese, although successful in the instance of EDTA, was unable
to rescue blastoconidia proliferation. Conversely, zinc, which was successful in rescuing growth
in the presence of TPEN, failed to do so in the presence of EDTA; however, the capacity of zinc
to restore wild type growth in the latter case was not done so at a physiologically-relevant
concentration. Only copper proved to rescue in both cases (i.e., equimolar concentrations of
TPEN or EDTA). Potassium and magnesium failed to rescue under the regime of either chelator,
and, although iron also failed in the case of TPEN, it was not tested in the presence of EDTA.
While these studies only began to explore their necessity, it is clear that trace ions play a key role
in parasite physiology and will require more careful examination in the future to determine their
true importance.
17 For hexagonal map base-, hits-, distribution-, metacluster-, and index topologies, see supplemental figures B2.2a-e. 18 For heatmaps corresponding to the individual data sets per assay type (supplementation, chelation/titration, or rescues), in addition to each condition type’s differential pH and relative secreted protein, see supplemental figures B2.3(a-i).

28
2.4.6 Comparison of Two Hypocrealean Species Using Longitudinal
Exometabolomics.
Interspecific Comparisons with the Use of Self-Organizing Maps. To examine how this exometabolomic phenotype might differ between species, an additional
longitudinal study was performed for a second variety within the same species complex as O.
kimflemingae, Ophiocordyceps camponoti-floridani. These data over time and the respective
generated exometabolomic signatures were compared between this and the prior-studied species
(Figure 2.4; supplemental figures B2.5a-e; supplemental table B2.6). The resulting figures
provided readily-comparable graphics or so-called “metaprints”19 [110] representing the profiles
of each species under identical cultivation conditions for 21 dpi, of which can be examined as
paired sets of longitudinal metaprints or “metatracks” (Figure 2.6). Differences were superficially
discernable and exemplified by the large red core of features that resulted in the overlaying of
data for O. camponoti-floridani. It was also clear that the gross behavior of O. camponoti-floridani
was more diffuse or evenly-distributed across the hexagonal plane, which contrasted with the
stark polarization observed with O. kimflemingae (Figure 2.6). It was evident that the detected
metabolic activity of O. kimflemingae (or OKf in tables/figures) had been offset by a delay, or lag-
phase, of 12 dpi when compared to O. camponoti-floridani (or OCf). The mechanism mediating
this difference was not plainly apparent. For the proper comparison of macronutrient uptake and
putative secretomes, the study termination date and the point at which both organisms could be
considered metabolically mature, 21 dpi, was used as the time-point of reference (Figure 2.7a).
The metaprints of the two species were compared side-by-side to determine metabolites of
interest, and were topically compared by the macronutritional subgroups discussed prior. With
input of the training data (O. kimflemingae), the hexagonal plane was organized into four (4) major
metacluster base regions (supplemental figures B2.5a-e; supplemental table B2.6). To further
parse possible differences in phenotype and putative host-niche, exometabolomic data for each
species was examined on a single-metabolite level using cell-assignments as the primary guide
for discussion. Differences in analytes determined to be putatively secreted by each organism
were also examined in accordance to their relationships to the metabolic inputs indicated.
Carbon Sources and Contributors to Core Carbon Metabolism ‒ Sucrose and Ribose.
O. camponoti-floridani demonstrated wider coverage of carbon sources supplied by the medium
formulation, however, all the same, indicated no overlap of sugar preference with the other
19 Metaprinting is a useful tool for visualizing and comparing metabolomic data; the method utilizes an R package, supraHex, which employs self-organizing maps to create a 2-D representation of data features competitively-assimilated by their learned categories of behavior.

29
species. Contrasting with O. kimflemingae, which was not observed to utilize the detected simple
hexose sugars, the opposite was observed in O. camponoti-floridani. Ribose and hexose, each,
demonstrated relative-decreased detection in the media over time (Figure 2.7a). Interestingly,
sucrose, the putative sugar source for O. kimflemingae, the exometabolomic signature of O.
camponoti-floridani did not exhibit any hint of removal from the media. On the other hand, hexose-
phosphate was shown to increase (node 61, Figure 2.6), and in a manner very similar to that
observed in O. kimflemingae; of cautionary note, in case of the latter, it was observed to
subsequently decrease over the remaining days, differing plainly from the plateau demonstrated
by hexose-phosphate for O. camponoti-floridani.
Amino Acids.
Similarly to what was observed in the case of O. kimflemingae, select amino acids were prioritized
over others for removal from the growth media of O. camponoti-floridani. Preferences for
asparagine, methionine and cystine were, again, demonstrated (Figure 2.7b). The media of O.
camponoti-floridani was distinguished from that of O. kimflemingae by the depletion of a much
broader range of amino acids. This was in addition to a marked removal of the amino acid
monomer, cysteine, with that of its dimer, cystine, which, in stark contrast, saw a sudden increase
and plateau with no subsequent removal from the media of O. kimflemingae. Although slightly
more graded at first, O. camponoti-floridani exhibited an abrupt removal of asparagine (node 77,
Figure 2.6) compared to that observed with O. kimflemingae. Methionine (node 80, Figure 2.6)
demonstrated a very gradual, almost linear, removal in the case of O. camponoti-floridani, which
contrasted with its swift removal observed with O. kimflemingae. Cystine, an analyte co-localized
with methionine, shows similar behavior in that the feature exhibits substantial decrease for each
species, but the pair is differentiated from cystine’s monomer, cysteine (node 18, Figure 2.6),
which showed increase in the case of O. kimflemingae. Interesting, and further emphasized
through the paired hexagonal maps, O. camponoti-floridani demonstrates nearly identical
behavior for cystine and cysteine, appearing to remove the analytes completely from the media.
The removal of alanine, which was observed in O. kimflemingae, was a behavior swapped with
that of beta-alanine in the case of O. camponoti-floridani. Interestingly, pyroglutamic acid (node
51, Figure 2.6) was utilized at a much less-impressive rate in O. camponoti-floridani compared to
that which was observed in O. kimflemingae; in fact, its removal from the media for O. camponoti-
floridani was only detectable when the time-dependent accumulation of the amino acid was
accounted for, which was, again, facilitated by the hexagonally-mapped data. One of the benefits
of the using metaprints, the emergence of cryptic players, was made readily apparent with these

30
side-by-side comparisons. Specifically, it resulted in the emphasis of certain amino acid groups
over others, such as branch-chain (distributed; nodes 30, 73, and 33, Figure 2.6) and cyclic
(adjacent; nodes 71, 72 and 73, Figure 2.6) amino acids present in the media, as well as those
which are known to directly contribute to the TCA cycle (nodes 17, 55, 83, and 56, Figure 2.6). It
also highlighted catabolites and anabolites downstream of those components of the media
indicated as putative metabolic “inputs”. These downstream analytes, for example, included
aconitate and glutathione (node 90, Figure 2.6). Both species, despite their blatant distinction in
amino acid uptake, were indicated as putatively secreting catabolites of indoles, or, more-
specifically, tryptophan. These metabolic byproducts included indole-3-carboxylic acid (ICA) and
kynurenic acid (nodes 63 and 38, respectively).
Vitamins ‒ Thiamine and Pyridoxine.
As exhibited by O. kimflemingae, a pointed removal of select vitamins was a trait also
demonstrated by O. camponoti-floridani over time. Thiamine, in particular, was again removed in
a similarly aggressive manner to that of the first species (node 77, Figure 2.6). Pyridoxine, another
vitamin removed in the presence of O. kimflemingae, was also depleted over time. However, its
removal from the growth medium of O. camponoti-floridani was much more gradual and less
severe overall relative to control values (supplemental table, B2.6; supplemental figure, B2.4).
Nicotinate and pantothenate both demonstrated increase within the medias of the two species
(node 61, Figure 2.6), the two being differentiated only by the initial lag phase demonstrated in O.
kimflemingae.20
2.4.7 Ophiocordyceps kimflemingae – Extracellular Physical and Chemical
Perturbation with Objective of Minimal Media Development.
Many organisms readily colonize and exploit basal or rich medias, making their use in isolation
protocols difficult and often leading to the amplification of any competition-selected species
present within a given sample. To combat this problem, antibiotics are often used in this context,
which have demonstrated the capacity to alter and even inhibit normal growth of blastoconidia in
vitro (unpublished data). Conversely, minimal selective medias are commonly developed for
improving the experimental evaluation of organisms grown under lab conditions, detection of
auxotrophic mutants or similar microbial strain maintenance. These simpler medias may also be
supplemented with select ingredients for differential or selective cultivation of secondary
metabolites. The value of minimal medias in the cultivation and experimental testing of microbes
20 Biotin failed to pass RSD-filtering for O. camponoti-floridani, and was therefore held from being used in the comparative analysis.

31
is quite common-place and, for the length of microbiology’s history as a field, has been held as a
reliable material strategy in labs requiring microbes or microbial cultivation for research.
For example, the so-described “fastidious” fungal genus, Hirsutella, the former
anamorphic genus of Ophiocordycipitaceae, now phylogenetically-merged, has been thoroughly
studied in interest of overcoming the challenges that often deter the development of high-
throughput cultivation strategies in order to foster the fungi’s potential as a biocontrol agent in
agricultural systems [37], [111], [112]. Further, the use of such medias in the cultivation of more
fastidious organisms often can prove tedious and unreliable due to high rates of contamination
and inappropriate nutritional content, many of which have been shown to actually inhibit growth
(e.g., by acting as non-specific antagonists/agonists of membrane transporter proteins or as
growth-deterring transcription factors), cause cytotoxicity, or cell death [113]. The physiological
phases of a fungi’s life cycle are directly tied to the status and constitutional matrix of its substrata
for successful colonization, sustenance and subsequent dispersal of propagules. It is also this
media specificity that governs the diversity of microbial communities coexisting with fungi and the
characteristics of microbial succession which take place over time as the extracellular matrix
continues to degrade and change.
In follow-up to previous studies, analytes from prior exometabolomics analyses
(longitudinal exometabolomic study of O. kimflemingae) were chosen to be doubled in
concentration in substrata for examination of their nutritional importance and to, therein,
determine the limiting nutrient of the two: asparagine and methionine. Subsequently, select abiotic
factors were also tested to elucidate their possible influence upon fungal physiology and resulting
emergent substratum-utilization phenotype, the profiles of each generated through use of end-
point exometabolomic assays. These abiotic factors included three incremented concentrations
of a cyclic signaling molecule-mimic often used in the study of various eukaryotic organisms (i.e.,
1.0 mM, 1.5 mM and 1.7 mM dibutyryl-cAMP) and three distinct starting pHs (i.e., 4.2, 5.0 and 6.6
pH). Below, these adjustments to the growth medium and their respective impacts upon the
substratum-utilization phenotype of O. kimflemingae were described. Finally, to test the
cumulative knowledge regarding the baseline nutritional requirements of O. kimflemingae, a final
series of minimal medias were formulated, prepared, and examined for viability through a final set
of end-point assays and determination of metabolic footprints in vitro. These profiles were then
compared to that which was demonstrated by the same blastoconidia cultivated using the original,
rich medium formulation of Grace’s Insect Medium in-parallel under identical experimental
conditions.
32
Physical and Chemical Perturbation.
Examining Surpluses of Asparagine and Methionine.
To examine the viability of the nutritional requisites implicated by the exometabolomic longitudinal
data of O. kimflemingae, asparagine and methionine were selected for follow-up experimentation.
Because individual components necessary for the preparation and implementation of drop-out
medias were not readily available, a converse, fortification-defined approach was applied to
examine whether these nutrients could reflect their significance in promoting fungal growth
through a surplus of these select nutrients. To suit this objective, asparagine and methionine were
added in-excess to the standard rich media (Grace’s Insect Medium). Relative to the original
medium formulation, these amino acids were effectively doubled in concentration as a result of
fortification. This was performed separately in-culture for each nutrient and compared to that of a
parallel-cultivated inoculated control (a technical replicate for the media formulation was also
used). For this and two other distinct media supplementation trials, exometabolomic analyses
were performed after 11 dpi, as well as measures of differential pH and total secreted protein.
Morphology was also examined for qualitative comparisons of treatments.
For both species examined through time-series exometabolomics, methionine and
asparagine were demonstrated as being swiftly removed from the original media formulations
over time. End-point exometabolomic signatures for two selectively-fortified formulations were
visualized as peak area values that were log2-transformed relative to the inoculated control data
(Figure 2.8). Gross differences between the two conditions were reviewed by their hierarchical
clustering and, thenceforth, were utilized for group-wise enrichment analysis. MSEA of first of four
parental clusters, containing a total of 8 analytes, indicated association with aspartate
metabolism, β-alanine metabolism, glycerolipid metabolism and glycolysis (p-value = 8.02E-5, p-
value = 0.00462, p-value = 0.00462, and p-value = 0.012, respectively). The general behavior of
this cluster was that of relative-increase for asparagine-fortified condition, and relatively no
change in the case of the methionine-fortified condition. The second parental cluster contained a
total of 38 analytes, and MSEA of the cluster indicated association with protein biosynthesis,
ammonia recycling, the urea cycle and glycine/serine/threonine metabolism (p-value = 5.89E-9,
p-value = 0.0044, p-value = 0.00657, and p-value = 0.0171, respectively). Changes observed
across the analytes of this group were not of noticeable character. The third of four parental
clusters only contained 3 analytes, making enrichment analysis impractical. Those analytes
included 2-oxo-4-methylthiobutanoate, uridine, and methionine. Despite the few analytes
designated in this cluster, a trend was plainly apparent, exhibiting relative increase for the

33
methionine-fortified condition and little to no change for that of the asparagine-fortified condition.
The fourth parental cluster—which demonstrated relative decrease across analytes for the
asparagine-fortified condition, and relatively no change with some instances of relative-increase/-
decrease in the context of the methionine-fortified condition—contained 20 analytes and showed
enrichment for phenylalanine/tyrosine metabolism, protein biosynthesis, tyrosine metabolism and
catecholamine biosynthesis (p-value = 1.01E-4, p-value = 0.00682, p-value = 0.0457, p-value =
0.105, respectively).
Differential pH (∆pH) for both of these experimental conditions were determined to be
equivalent (a decrease of 0.02 from control value; supplemental figure, B2.7a), and roughly
unaltered relative to the control at end-point. The methionine-fortified condition exhibited a lower
combined mean secreted protein relative to the series’ respective control (-0.05 µg/mL; combined
mean being derived from the 10 and 14% sample concentrations), while the asparagine-fortified
condition, in contrast, demonstrated increased secreted protein relative to control value (+0.05
µg/mL; supplemental figure, B2.7b). In regard to brief morphological comparisons between all
extracellular perturbation conditions, the doubling of asparagine in the media produced the most
distinctive change compared to that of other regimes and control morphology (supplemental
figure, B2.8). The resultant phenotype of this condition, in particular, presented as exceptionally-
compact spherules occurring at much higher densities than those observed as a result of other
conditions. Nevertheless, additional research will be necessary to determine which of these two
nutrients are truly limiting.
Introduction of a Signaling Molecule ‒ Dibutyryl Cyclic-AMP.
Cyclic nucleotides and similar signaling molecules have long-been linked to fungal
morphogenesis, growth and development [114]–[117]. Fungal pathogenesis as it regards plant
and animal pathogens has also been associated with these small molecules, which have been
observed acting as key factors orchestrating both virulence and host-colonization [118], [119].
These modes of regulation for fungal pathogens appear to not be limited to those which infect
endothermic or vertebrate hosts; entomopathogenic fungi also have been documented as utilizing
similar molecules, like cyclic adenosine monophosphate (cAMP) or cyclic guanosine
monophosphate (cGMP), to regulate their physiology as they infiltrate, colonize and interact with
their hosts [120]–[122]. Dimorphism and the nature of dimorphic transitions in fungal pathogens
have been characterized for various species and have been observed to be mediated by cyclic
nucleotides via MAPK and cAMP-PKA signaling pathways [114], [123].
34
As with previous trials of extracellular perturbation, blastoconidia were cultivated in liquid
culture for 11 dpi prior to performance of end-point bioassays examining growth media
composition and biochemical alterations relative to controls (i.e., exometabolomic signature
generation, differential pH, and secreted protein). Prior to inoculation with blastoconidia, three
distinct concentrations of dibutyryl cyclic adenine monophosphate (dibutyryl-cAMP) were
administered to separate tissue culture flasks containing growth media. The experimental
concentrations were determined through reference of relevant literature21. These three
concentrations mimicked similar work in Mucor rouxii as it applies to the newly introduced analogs
described by Pereyra et al. (Microbiology, 2000). Specifically, the three concentrations employed,
here, were 1.0 mM, 1.5 mM and ~1.7 mM dibutyryl-cAMP.
Targeted exometabolomic analyses of the three aforementioned experimental culture
conditions and subsequent heatmap generation resulted in four primary clusters reflecting the
behavior of detected analytes upon data analysis and subsequent visualization (Figure 2.9).
MSEA of the most-vertical of the four parental clusters indicated analyte-collective associations
with aspartate and pyrimidine metabolism (p-value = 3.66E-4, and p-value = 0.00994,
respectively); metabolites within this cluster tended to exhibit increased detection, and, further,
demonstrated dose-dependence with the increasing concentration of supplemented signaling
molecule-mimic, dibutyryl-cAMP. MSEA of the second parental cluster indicated possible
associations with phenylalanine/tyrosine metabolism, glycerolipid metabolism and glycolysis. The
majority of analytes co-localized within this cluster exhibited relatively low to no change in
detection for the lowest-administered dibutyryl-cAMP concentration, while demonstrating
increased-detection relative to control values across the other two experimental conditions. In
consideration of the third parental cluster, MSEA indicated associations with protein biosynthesis,
the urea cycle, ammonia recycling, and glutamate metabolism. This parental cluster was the
largest of the four and displayed minimal change. Because the fourth parental cluster only
contained three analytes (i.e., uridine, D-gluconate, sucrose), MSEA was not performed.
However, patterns across the experimental conditions were still present, and this pattern could
be described as a “normal”-shaped distribution of relative detection across conditions, determined
by the increased detection of the central experimental condition (1.5 mM dibutyryl-cAMP) and
21 Pereyra, et al. examined the influence upon post-germination morphogenesis and cAMP-PKA signaling in Mucor rouxii using extracellular, synthetic induction with various cAMP-analog molecules (Microbiology 2000). N6-benzoyl-cAMP and N6-monobutyryl-cAMP were the primary analogs employed; dibutyryl-cAMP was purportedly used as a control, having been examined at varying concentrations in the same fungus and fungal life-state in a prior publication (Exp Myc 1992), alongside two common hydrolytic byproducts (i.e., O2’-mono-butyryl-cAMP and butyrate), all used at a single, fixed concentration.[257], [258]
35
adjacent, bilateral decreased detection for the other two conditions. The supernatant differential
pH, relative secreted protein, and microscopic imaging acquired for these samples also suggested
dose-dependent effects across all observation-types for this regime of extracellular perturbation
(supplemental figures, B2.7c, B2.7d, and B2.8).
Adjustments of Starting pH.
Environmental proton concentration (pH) is a fundamental abiotic factor that drives, is exploited
and subverted by organisms in their survival, adaptation, and acclimation, as well as their
maintenance of physiological homeostasis [124][125]. The requirement of proton gradients and
individual protons is universally conserved throughout all forms of life and for a large variety of
utilities. The proton’s instrumental roles throughout forms of life is conferred primarily by its
inherent simplicity, presence throughout both inorganic and organic chemical reactions, and its
versatility as a source for ionic potential, chemical and kinetic energy, in addition to its capacity
for mediation of cell-signaling [126], [127]. Chemical gradients, in particular, created by active
transport of protons across a cellular membrane are often regarded as the fundamental tenet of
homeostasis, and, thus, their maintenance frequently presents as the key feature distinguishing
living from dead organic material [128]. Some organisms, like fungi, demonstrate particularly-
blurred lines delineating their physiological homeostasis and strategies of resource acquisition,
which results in emergent, exquisitely-orchestrated relationships and inextricable linkage of these
two facets defining an organism’s life cycle. Specifically, fungi are dependent upon chemical
gradients for facilitated diffusion of nutrients, as well as the activities mediated by various,
specialized transporter proteins [106],[129]. As a result, fungi often demonstrate a sigmoidal
growth curve with a biomass accumulation rate exhibiting a binomial shape over time, given that
limiting nutrients are not unlimited [109]. This relationship in filamentous fungi even governs the
rate at which individual cells reach the “death phase” of growth — this fatal predisposition and
subsequent induction spreads radially from the mycelial center outward, the greatest incidence of
death phase induction being most-central and the least tailing the metabolically active edge of the
hyphal collective [106]. Moreover, an emergent character of this physiological fluidity of fungi with
their surroundings is that secreted products and chemical characteristics of substrata often also
mimic or reflect the trends and points of flection exhibited by these growth curves. Commonly
affected chemical traits of the substrata include pH, a decreased measure of which is often
associated with biomass accumulation and secondary metabolite production in fungi; this trend
applies, both, in the general sense, across fungi, and specifically, as this dynamic has also been
demonstrated by those within the species complex discussed in this work, O. unilateralis s.l. [130].

36
To examine the impact of starting pH upon media alteration in O. kimflemingae, end-point
exometabolomic assays were performed comparing the resulting profiles for three distinct starting
pH values (i.e., pH = 4.2, 5.0, and 6.6, +/- 0.02) to that of an inoculated control (average pH ~5.8
+/- 0.05). As before, a heatmap was generated for visualization of the exometabolomic data,
which allowed for clustering of analytes detected across experimental conditions prior to pathway
enrichment analysis of respective parental clusters and subsets (Figure 2.10). Again, similar to
the other experimental series within this subsection, analytes were grouped into four parental
clusters for trend and metabolite set enrichment analysis. These parental clusters can be
described by their general trends across analytes [peak areas log2-transformed relative to control
values] and in how they compare between experimental conditions. The first of four parental
clusters remained largely unchanged within the pH 4.2 and pH 5.0 experimental conditions, while
demonstrating universal increase across analytes of the third condition, pH 6.6. Additionally, this
parental cluster only contained three analytes (i.e., L−argininosuccinate,
S−adenosyl−L−homocysteine, and GMP), which rendered any attempt at MSEA impractical or
irresponsible. However, it should be noted that the relative-increased detection in pH 6.6
experimental condition of these three metabolites is indicated as nearing 6 log2 fold-change
increase relative to control values, which stands as a distinguishing trend compared to all other
shown analytes and experimental conditions.
The second of the four parental clusters demonstrated very little to no changes between
the three experimental conditions. This cluster contained a total of 37 distinct metabolites, and
MSEA of which indicated enrichment of pathways associated with protein biosynthesis and the
urea cycle (p-value = 6.48E-10, and p-value = 0.00996, respectively). The third of four parental
clusters exhibited analyte behavior demonstrated by pH 4.2 and pH 5.0 experimental conditions
that appeared largely similar in their overall-increased relative detection, while all analytes of the
pH 6.6 condition exhibited relative-decreased detection. MSEA of this parental cluster, which
contained 19 analytes, indicated associations with beta-alanine metabolism, pyrimidine
metabolism, and protein biosynthesis (p-value = 1.27E-4, p-value = 0.00745, and p-value =
0.00799, respectively). Experimental condition two (i.e., pH 5.0) was the only one to exhibit any
exceptions to the parental cluster’s largely positive trend. These two analytes demonstrating high-
contrast as a result of relative-decreased detection, aconitate and uracil, were noted, as they are
known to contribute to the citric acid cycle and pyrimidine metabolism, respectively.
The fourth of four parental clusters possessed analytes across all experimental conditions
exhibited a trend reflecting relative-decreased detection. This parental cluster contained 10
37
analytes, total, and MSEA of this cluster indicated associations primarily with
phenylalanine/tyrosine metabolism; however, connections to aspartate and glycerolipid
metabolism were also indicated. Analytes within this parental cluster showed a relative-decreased
detection across all experimental conditions and metabolites. The only experimental condition
exhibiting trend-exceptions was the second (i.e., pH 5.0), of which dihydroorotate was
demonstrated as having a relative-increased detection, a disruption to the overall negative trend
of the parental cluster. Differential pH and secreted protein were also measured at end-point for
this set of extracellular perturbations (supplemental figure, B2.7e; supplemental figure, B2.7f).
Differential pH and secreted protein demonstrated only minor changes, however, morphological
comparisons revealed a possible influence of starting pH upon this aspect of development
(supplemental figure, B2.8).
Minimal Media Development and Trial – Determining Nutritional Requisites for
Parasite Growth. Minimal medias are essential tools in the laboratory study of any microbial organism, most notably
to mitigate or potentially eliminate isolate contamination, a frequent issue experienced in the lab
(unpublished; respective facility-associated discussion and housekeeping notes)22. For this
reason, a major objective of this work—in addition to better understanding this EPF in the context
of its ecology and basic physiology—was the development of an improved, selective minimal
media. As a result of preceding analyses, auxotrophisms and prototrophisms were therein-
implicated, and, decidedly, were re-examined for their validity through the formulation of selective,
minimal medias.
To develop a minimal formula, data collected as a result of the preceding studies of O.
kimflemingae were used to determine essential nutrients that were selectively removed from the
respective assays’ rich medium (i.e., Grace’s Insect Medium). Results already evaluated in this
work highlighted a simple minority of analytes as having been removed from the medium. These
select few formed the baseline composition23, subsequently-discussed by way of macronutrient
category, and were limited to the following list of components at minimum: asparagine,
methionine, sucrose, and thiamine (Table 2.1). Other key components used in the baseline
formulation were inorganic ions, the concentrations and identities of which mirrored those featured
22 It is important to note that contamination of isolates has been demonstrated to be a problem primarily for the North American isolates, whereas those isolated from South America and/or Southeast Asia do not seem to exhibit this problematic predisposition. 23 “baseline composition” here and throughout refers to the common core of ingredients (with the exception of thiamine, which is doubled in the context of one of the formulations) used in the formulation of various minimal medias tested for viability.

38
in the original Grace’s Insect Medium formulation. Additionally, it should be noted that α-
ketoglutarate was also included in these formulations, despite suggestions of only minor
importance in its observed removal. Several organic acids were included within the rich media
formulation and α-ketoglutarate was known to be located upstream metabolically of these other
organic acids, and, as a result, was determined representative of this constituent category, thusly
validating its inclusion (Figure 2.2b). To examine the viability of the minimal formulations derived
from the results of the prior analyses, each was formalized, prepared and tested in parallel against
the original rich medium, Grace’s Insect Medium. The design of this experiment was identical to
those used to further examine the substrata dynamics and extracellular perturbation-responses
of O. kimflemingae through implementation of end-point bioassays following an incubation period
of 11 days post-inoculation (11 dpi). In addition to the exometabolomic analysis of resultant
samples, the pH and secreted protein of each supernatant were determined.
Visualization of the resulting targeted exometabolomic analyses demonstrated blatant
differential clustering of the formulations used, arranging the four minimal media formulations
amongst themselves, separate from that of the original rich media (Figure 2.11; Table 2.1).
Because each formulation was represented relative to its respective control, the data also
illustrate within-group changes which emphasize the differential traits between the experimental
formulations. Just as before, across all media formulations, a select few components were
indicated as being removed almost entirely from the media: asparagine, thiamine, and sucrose.
Methionine was also nearly depleted across all formulations with the exception of the original rich
media. These four analytes neatly composed the fourth parental cluster of four and MSEA of
which indicated associations with protein biosynthesis (p-value = 0.00294). The third parental
cluster contained a total of 12 analytes, and MSEA of this parental cluster indicated associations
with the citric acid cycle, biotin metabolism and intracellular signaling (i.e., histamine). The second
of four parental clusters, containing a total of 20 analytes, was indicated as being primarily
associated with protein biosynthesis, the urea cycle, arginine/proline metabolism,
phenylalanine/tyrosine metabolism, and ammonia recycling with MSEA (p-value = 4.1E-13, p-
value = 9.56E-4, p-value = 0.00268, p-value = 0.003, and p-value = 0.602, respectively). The first
and the largest of the four parental clusters contained a total of 31 analytes. MSEA of the entire
parental cluster indicated associations with nucleotide sugar metabolism and beta-alanine
metabolism (p-value = 0.00258, and p-value = 0.00801, respectively).
Overall, it was clear by this visualization of the data that indications symptomatic of DNA
replication and general growth are still present across all media formulations. Despite the baseline

39
composition of the minimal medias having included only five macronutrients, the production of
essential vitamins and amino acids did not appear at all inhibited. Further, although pyridoxine
was withheld from inclusion in the baseline composition for the minimal media formulations (i.e.,
those that did not include RPMI vitamin mix), the organism was clearly not deterred from
producing metabolites known to require pyridoxine for their production, either as an organic
cofactor or as a precursor. The exometabolomic signatures of the various minimal formulations
suggest that the few macronutrients included were those which were most influential in their
limitation of this parasite’s growth and development in vitro. Additionally, a macronutrient included
in the minimal medias that had been suspected of lower importance, α-ketoglutarate, was
confirmed as lacking necessity, as its detection across minimal medias was not indicated to have
changed relative to each formulation’s control values. In the case of the rich media, a small
collection of additional analytes was demonstrated to have relative-decreased detection, which
included alanine, pyroglutamic acid and isoleucine; because these were also produced in the
minimal medias which did not include these analytes by formulation, they or the presence of other
nutrients were suggested to be, either, putatively inhibitory of the pathways leading to their
production, or merely a result of ion suppression (analytical influence). Furthermore, this
suggested that their presence could have possibly stifled other routes of metabolism affiliated with
the roughly 22 primary and/or secondary metabolites exhibiting increased-detection in the minimal
medias but that were not detected in such fashions in the rich media.
The pH for each respective formulation was measured and adjusted to a pH of 5.78 +/-
0.02 prior to inoculation and start of incubation period. After the completion of the incubation
period, each supernatant was measured again for pH, as well as secreted protein (supplementary
figures, B2.7g and B2.7h). For this series, each differential pH was normalized by the differential
pH determined for the original rich media formulation (∆pHO). The minimal formulation which
exhibited the largest negative differential pH possessed a collective of inorganic ions incorporated
from a recipe originally intended for Isaria spp. Blastospore Production (IBP) with the exception
of cobalt, and is so-titled [32]. This recipe was unique amongst formulations and distinct from the
traditional salts featured in Grace’s Insect Medium in its replacement of MgCl2, KCl, NaHCO3 and
NaHPO4 with FeSO4, MnSO4 and ZnSO4 (Table 2.1). Following “Minimal + IBP salts”, which
demonstrated the largest magnitude decreased pH relative to control, the measures of “Minimal”,
“Minimal + RPMI + B1”, and, finally, “Minimal + RPMI”, ranked from greatest to least, respectively.
Contrastingly, the secreted protein did not mirror these changes, showing that “Minimal + RPMI”
demonstrated the least difference from the control. Protein secretion diminished from “Minimal”

40
to “Minimal + IBP salts”, and, finally, with “Minimal + RPMI + B1” exhibiting the least amount of
secreted protein relative to control.
2.5 Discussion.
In this study, a targeted exometabolomic strategy within a comprehensive ecophysiological
framework allowed for characterization of a complex fungal parasite using only its respective
growth media. These methods enabled the determination of key metabolites associated with
growth and underlying metabolic pathways of the parasite. Furthermore, they also facilitated
advanced comparisons of two, distinct species, highlighting core physiological differences
between them in the process.
As a result of this study, it was shown that O. kimflemingae and a closely-related species
of the same species complex, O. camponoti-floridani, possess different metabolic capacities,
particularly as it relates to carbon acquisition. Differential preferences for key carbon-sources
were largely implicated by the observable contrast in sugar-utilization and the characteristics of
the remainder carbohydrates. O. kimflemingae appeared able to hydrolyze the nonreducing
disaccharide, sucrose, that was present in the media, as well as absorb the phosphorylated form
of one of its resulting monomers (Figure 2.7). Exoenzymatic phosphorylases are common in fungi,
and, when acting upon sucrose, are known to result in D-fructose and α-1-D-glucose-phosphate
[131], [132]. Excreted invertases (or specific enzyme for hydrolysis of sucrose) have also been
observed in other, closely-related Hypocrealean fungi [133]. It is the continued activity involving
the phosphorylated hexose sugar in the presence of the plateaued-abundance of a simple hexose
that suggests differential treatment of the two monomers by O. kimflemingae. In light of previous
studies having shown the same preference in a related species, the phosphorylated monomer
used in this case was likely glucose-phosphate [134]. If this holds true, the remaining plateaued
hexose is likely fructose, left unutilized by O. kimflemingae. Further proffering this argument
against fructose as preferred carbon-source for this species, another simple sugar present,
ribose, was used instead, despite the former’s abundance; however, it should be noted that the
original source of ribose within the media is unclear. O. camponoti-floridani was suggested, either,
to lack this exoenzymatic sucrose phosphorylase (or invertase) or lack a specialized transporter
facilitating direct uptake, for the abundance of sucrose present within the media went undisturbed
across all observations (Figure 2.7). Similarly to what was observed in O. kimflemingae, the free
hexoses and ribose were used gradually over time, suggesting transporters compatible with these
simple sugars are expressed by O. camponoti-floridani. Interestingly, extracellular trehalose-6-
phosphate (T6P)—labeled as such in the provided figures, although it could be any nonreducing,
41
C-12, homodimeric, phosphorylated sugar—was observed to increase in the presence of O.
camponoti-floridani. Many organisms, including fungi, use trehalose to avoid freezing and
desiccation [135]. Trehalose has also been found in fungi under normal conditions and many fungi
commonly express T6P phosphorylase and T6P synthase; however, T6P has only been
demonstrated to accumulate intracellularly, not extracellularly, when the organism is undergoing
stress [136]. This has also been demonstrated to be a key facet of fungal gluconeogenic- and
glycolytic-regulation [137], [138]. Trehalose homeostasis has also been associated with virulence
and stress tolerance in, both, human and plant pathogens (e.g., Cryptococcus gattii and
Magnaporthe oryzae, respectively) [139], [140]. Because of this molecule’s intracellular functional
importance, the extracellular detection of this compound is most likely the result of cellular
leakage. If this is the case, its measurement within the media could function as a proximal metric
for stress and cellular antagonism in vitro. Alternatively, if it was intentionally secreted, the
compound could serve as a signaling molecule of sorts for, either, intercellular regulation of
colonial growth or for communication with host tissues. Other interesting sources of carbon
backbones within the media, namely, TCA cycle intermediates, were used distinctly between the
two species, with the exception of α-ketoglutarate. These interspecific distinctions in the use of
TCA cycle intermediates may implicate differences in canonical TCA metabolism, such as the
utilization of a glyoxylate shunt. To illuminate the full-extent of their biological functions and value,
further characterization should be considered for these select carbon skeletons.
O. camponoti-floridani appeared to produce a greater diversity of central carbon
intermediates and consumed a greater number of amino acids than that demonstrated by O.
kimflemingae, highlighting metabolic preferences between species. This preference is not
surprising considering and could even be the direct result of the low abundance of free-hexoses
available for uptake, assuming the species possesses a deficit of a proper sucrose phosphorylase
similar to what was purportedly exhibited by O. kimflemingae. Putatively-secreted analytes
demarcate precursing- and terminating-points of the shikimate pathway24, the glyoxylate cycle25
and those feeding into/out of gluconeogenesis (e.g., phosphoenolpyruvate), suggesting that O.
camponoti-floridani is likely distributing gluconeogenic products between multiple endpoints.
24 The shikimate pathway is used by many microorganisms to synthesize cyclic amino acids from phosphoenolpyruvate and/or other products of glucose oxidation. 25 The glyoxylate cycle is a pathway common to microorganisms and plants that functions as a shortcut or shunt within the TCA cycle, of which allows for the conservation and production of carbohydrates via omission of the traditional cycle’s lost CO2.

42
Despite these differences, it appears that both of these fungal species have the capability to use
a large array of carbon sources, although, one more-so than the other.
Amino acid metabolism was differential between the two species; however, overlap
existed for a select few, suggesting that these specific amino acids are essential for both O.
camponoti-floridani and O. kimflemingae. The similarities in asparagine utilization implicate a
preferential reliance upon versatile glucogenic amino acids, while methionine consumption
suggests a priority for dual-purpose resources, as this latter compound can act as an organic
source of both nitrogen and sulfur [113]. Interestingly, organic sulfur and nitrogen assimilation has
been associated with pathogenic life history traits in other fungal species [141]. Additionally, both
asparagine and methionine have been linked to stress tolerance in pathogenic microbes,
including fungi [142], [143]. Asparagine possesses the highest ratio of nitrogen to carbon of any
uncharged polar amino acid, a combination of traits which better enables facilitated and passive
diffusion of amino acids into the protoplasm and has also led to asparagine’s mention as a
“perfect” nitrogen source for certain fungal pathogens [144]. Further, asparagine is highly-
centralized in microbial metabolisms, and is the only identified auxoheterotrophic amino acid of
the human fungal pathogen, Paracoccioides spp. [145]. Asparagine is also known for its role in
cross-linkages of fungal glycans, microbial products well-known as crucial governors of microbe-
microbe and microbe-host associations [146]. Methionine, on the other hand, plays an active role
at the crossroads of several key metabolic pathways [147], and is a known transcriptional
regulator in fungi [148]. Methionine is the primary precursor of S-adenosylmethionine (SAM), a
molecule that functions as a major preceding compound for microbial secondary metabolites, and
acts as the dominant methyl-group donor for epigenetic modulation and post-translational
modifications [149]. In many fungal pathogens, methionine is crucial for mediating host-infiltration,
colonization and subversion of host immune responses [150]; it is also known to confer stress
tolerance and virulence by enabling the production of stress-ameliorating compounds (e.g.,
glycerol, glutathione), fungal virulence factors and secreted toxins, respectively [143], [151].
Together, auxotrophy for these two amino acids may suggest strict genetic regulation that may
also be enabling of metabolic remodeling, as well as the production of important proteins and
secondary metabolites associated with virulence and pathogenesis [152].
The distinctions between O. kimflemingae and O. camponoti-floridani regarding putatively-
secreted amino acid metabolites and secondary metabolites implicated differences in probable
host-niche, as well as respective ecologies and pathogenic traits. O. camponoti-floridani
exercised additional uptake of several other amino acids that spanned nearly all amino acid

43
categories. Although fungi are known to uptake both inorganic and organic sources of nitrogen, a
preference for organic nitrogen sources has been frequently associated with pathogenic fungal
species [153], [154]; further, increased access to organic nitrogen sources over inorganic ones
has been shown to increase rates of proliferation and biomass accumulation for those species
[155]. In addition to more robust indications of glycogen-catabolism than those observed in O.
kimflemingae—another physiological symptom documented to have importance in fungal
pathogenesis [153]—this expanded range of organic nitrogen sources could indicate a greater
predisposition for virulence O. camponoti-floridani compared to its relative tested in-parallel.
Similarly, the highly-selective nature of amino acid utilization observed in O. kimflemingae could
support the notion that it is more specially-adapted to its host species. If we hold true, both, the
ecological assumption that symbiotic relationships trend toward the mutualistic [156] and that the
virulence of O. camponoti-floridani is in fact comparably more impressive, then it can be
hypothesized that this subtropical species possibly adopted its host-niche much more recently in
evolutionary history than O. kimflemingae. In the case of the latter species, a regulatory bottleneck
is likely being conferred through the selective uptake of asparagine over that of other
metabolically-versatile amino acids, like aspartate, glutamate or glutamine—all for which O.
camponoti-floridani demonstrated auxotrophisms [157]—and, as a result, may make the
parasite’s metabolic activity and presence within its host more salient.
Certain vitamins (organic cofactors) were found to be important for the growth of both
species, O. kimflemingae and O. camponoti-floridani. Each was highly auxotrophic in regard to
thiamine (Figure 2.7c), a cofactor vital to central carbon metabolism and the prototrophism for
which is relatively common in bacteria and some fungi [158], although, auxotrophism for this
vitamin appears common across Ascomycetes [129]. Thiamine has been found to be essential
for virulence in fungal pathogens [159], [160], and has become a popular focus for development
of antifungals [161], [162]. Additionally, both species were shown to be prototrophic for nicotinate
and pantothenate (Figure 2.7c). Pantothenate can be synthesized de novo by Saccharomyces
cerevisiae from polyamine degradation-dependent β-alanine production [163], and is the pathway
of choice for fungal biosynthesis of CoA and acetyl-CoA, which are the primary metabolites used
in the production of non-ribosomal peptides and polyketides [164]. Interestingly, NADPH, a
bioactive product of nicotinate metabolism, is also required for the biosynthesis of these important
secondary metabolites. Secondary metabolites dependent upon these pathways include fatty
alkyl pantothenate analogues (pantothenamides), which are known for their ability to interfere with
fatty acid biosynthesis in bacteria, a mode of action known to confer antibiotic-like qualities [165].
The biosynthesis of pantothenate in both species appears at-odds with the differential

44
auxotrophisms exhibited for its potential precursors, alanine and β-alanine (Figure 2.7d). O.
camponoti-floridani is the only of the two which appears to be directly capitalizing upon the known
pathway of fungal β-alanine biosynthesis for the production of pantothenate. In contrast, the
exometabolomic behavior of O. kimflemingae suggests that it is, either using alanine to
biosynthesize aspartate, which is then being fed into the traditional route of pantothenate
biosynthesis, or alanine is not being used for this purpose and pantothenate’s precursor, β-
alanine, is being produced through polyamine degradation (i.e., spermine and then 3-
aminopropanal degradation). Alternatively, use of valine for the production of the pantothenate
precursor, pantoate, has also been confirmed as a contributor to this biosynthetic product in fungi
[166], [167]. Due to the importance of auxotrophisms in determining host-parasite relationships,
it would be immensely helpful if these pathways for both species were further-elucidated. Both
species seemed to be somewhat facultatively-auxotrophic for pyridoxine, although, differing in the
exact manner of which (Figure 2.7c). Methyltransferases (e.g., SAM) and aminotransferases—
which enable the interconversion of various amino acids and contributors to central carbon
metabolism, as well as the production of secondary metabolites—require pyridoxine as a cofactor
for normal enzymatic function [168]. O. kimflemingae was shown experimentally (i.e., testing of
the formulated minimal medias) to not necessarily require pyridoxine for normal blastoconidial
proliferation; however, this vitamin and its requisite should be further evaluated to realize its true
necessity in the case of O. camponoti-floridani.
As suggested by various contributions to Hypocrealean literature, several basic inorganic
ions are absolutely required for growth of varieties of Ophiocordyceps [35]; for O. kimflemingae,
this hypothesis was recapitulated in the results of the minimal media trials, in addition to several
experiments which simulated the removal/deficit of select inorganic ions and matched with
complementary rescue experiments (Figure 2.3a). Interestingly, macrominerals showed very little
sway in physiological impact in the incidences of both extracellular and cell-permeable chelators,
while trace metal ions (e.g., copper or zinc) were highlighted as inorganic ions of physiological
significance in other identical regimens. Results of the minimal media trials further corroborated
the importance of trace metal ions over that of macrominerals in liquid culture, as the formulation
titled “Grace’s Minimal Media with IBP Salts”—which contained a broader spectrum of trace metal
ions but lacked all vitamins with the exception of thiamine—demonstrated an exometabolomic
signature nearly identical to the minimal media (traditional inorganic ion
composition/concentrations and all of the vitamins included in the original rich media formulation).
A large number of the trials resulted in the apparent death or inhibited growth of the fungus,
suggesting inhibition or disruption of essential nutrient acquisition or underlying metabolic

45
pathways instrumental to survival. In response to this, an additional pair of figures was generated
to demonstrate the metabolic footprints that are implicated to represent “living/proliferating” and
“no growth” as they relate to these trials (Figure 2.11). Moreover, it is recommended that these
trends be further examined through similarly-assayed experiments specially designed to test the
impact of drop-out media variants, namely, those of the improved minimal media formulation
herein derived.

46
2.6 Featured Tables.
Table 2.0 Grace’s Insect Medium – Official Formulation.

47
Table 2.1 Minimal Media Formulations.

48
2.7 Featured Figures.
Figure 2.0a Photographic Diagram of the Life Cycle of O. unilateralis s.l.

49
Figure 2.0b Schematic of in vitro Growth Assays.
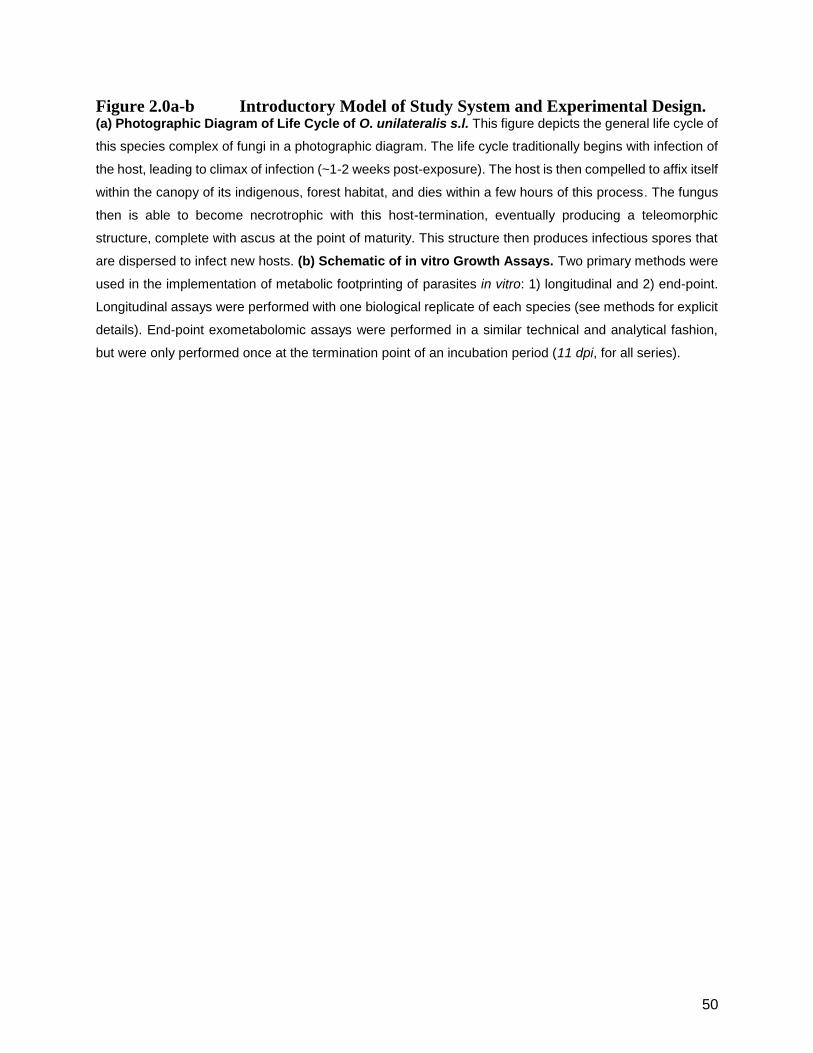
50
Figure 2.0a-b Introductory Model of Study System and Experimental Design. (a) Photographic Diagram of Life Cycle of O. unilateralis s.l. This figure depicts the general life cycle of
this species complex of fungi in a photographic diagram. The life cycle traditionally begins with infection of
the host, leading to climax of infection (~1-2 weeks post-exposure). The host is then compelled to affix itself
within the canopy of its indigenous, forest habitat, and dies within a few hours of this process. The fungus
then is able to become necrotrophic with this host-termination, eventually producing a teleomorphic
structure, complete with ascus at the point of maturity. This structure then produces infectious spores that
are dispersed to infect new hosts. (b) Schematic of in vitro Growth Assays. Two primary methods were
used in the implementation of metabolic footprinting of parasites in vitro: 1) longitudinal and 2) end-point.
Longitudinal assays were performed with one biological replicate of each species (see methods for explicit
details). End-point exometabolomic assays were performed in a similar technical and analytical fashion,
but were only performed once at the termination point of an incubation period (11 dpi, for all series).
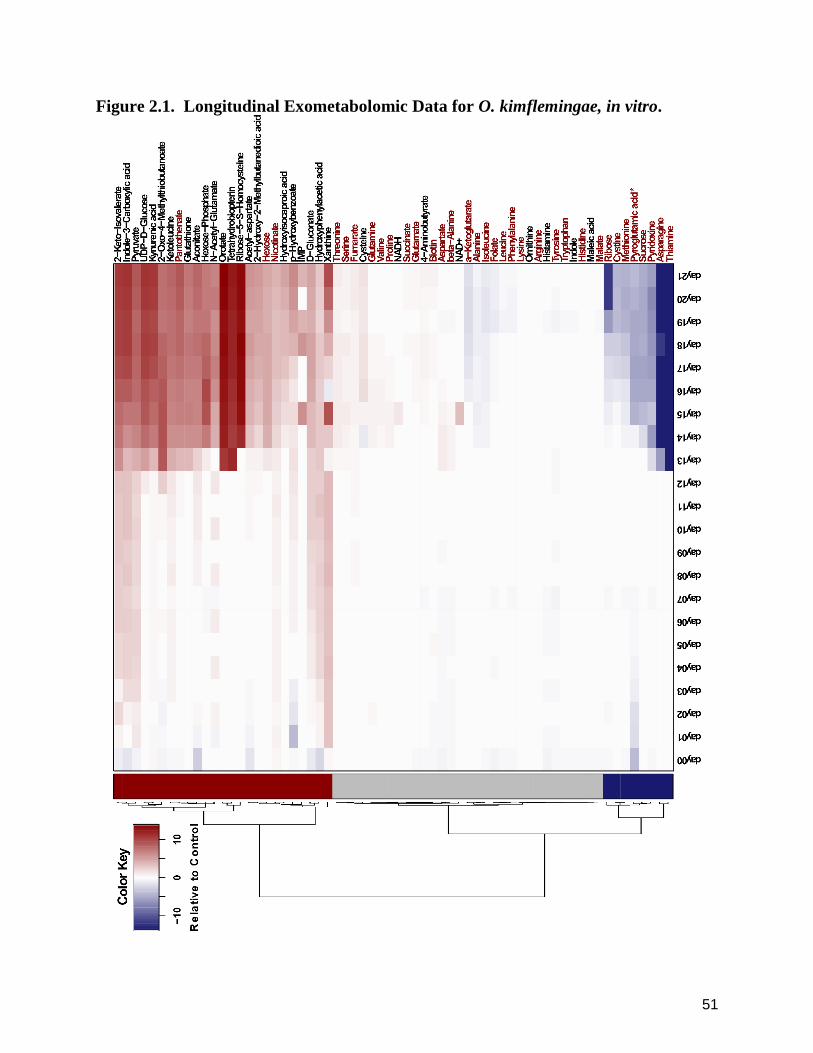
51
Figure 2.1. Longitudinal Exometabolomic Data for O. kimflemingae, in vitro.
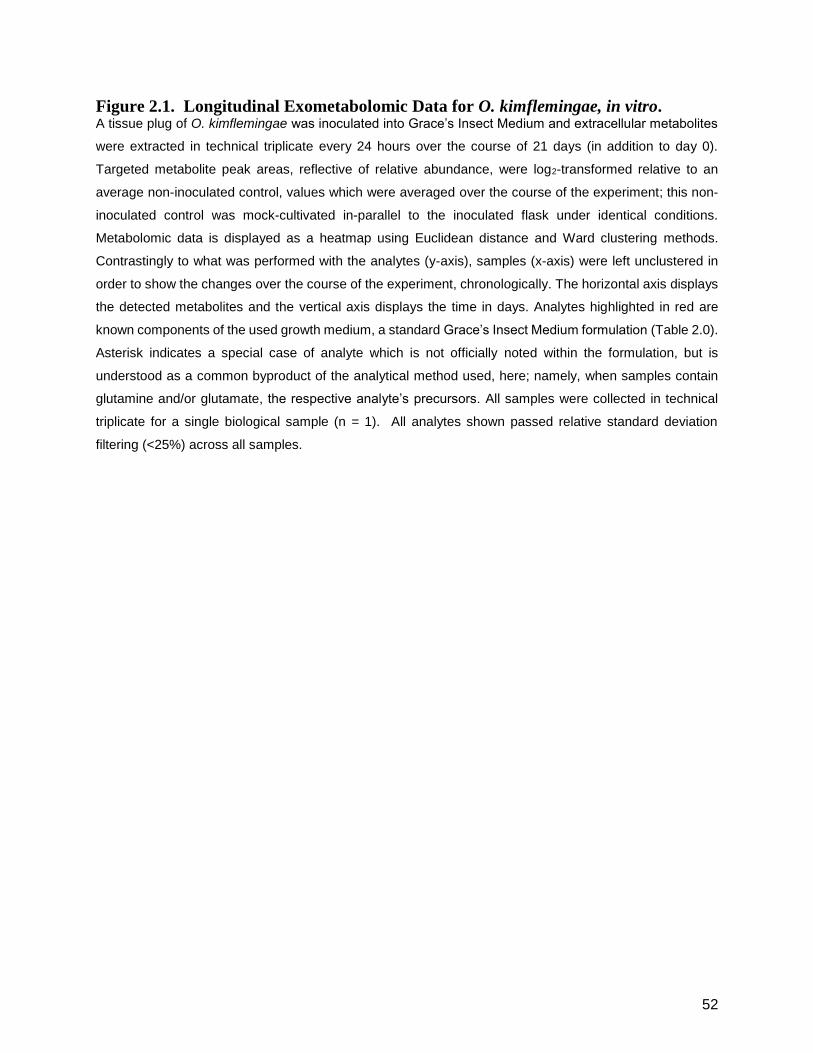
52
Figure 2.1. Longitudinal Exometabolomic Data for O. kimflemingae, in vitro. A tissue plug of O. kimflemingae was inoculated into Grace’s Insect Medium and extracellular metabolites
were extracted in technical triplicate every 24 hours over the course of 21 days (in addition to day 0).
Targeted metabolite peak areas, reflective of relative abundance, were log2-transformed relative to an
average non-inoculated control, values which were averaged over the course of the experiment; this non-
inoculated control was mock-cultivated in-parallel to the inoculated flask under identical conditions.
Metabolomic data is displayed as a heatmap using Euclidean distance and Ward clustering methods.
Contrastingly to what was performed with the analytes (y-axis), samples (x-axis) were left unclustered in
order to show the changes over the course of the experiment, chronologically. The horizontal axis displays
the detected metabolites and the vertical axis displays the time in days. Analytes highlighted in red are
known components of the used growth medium, a standard Grace’s Insect Medium formulation (Table 2.0).
Asterisk indicates a special case of analyte which is not officially noted within the formulation, but is
understood as a common byproduct of the analytical method used, here; namely, when samples contain
glutamine and/or glutamate, the respective analyte’s precursors. All samples were collected in technical
triplicate for a single biological sample (n = 1). All analytes shown passed relative standard deviation
filtering (<25%) across all samples.
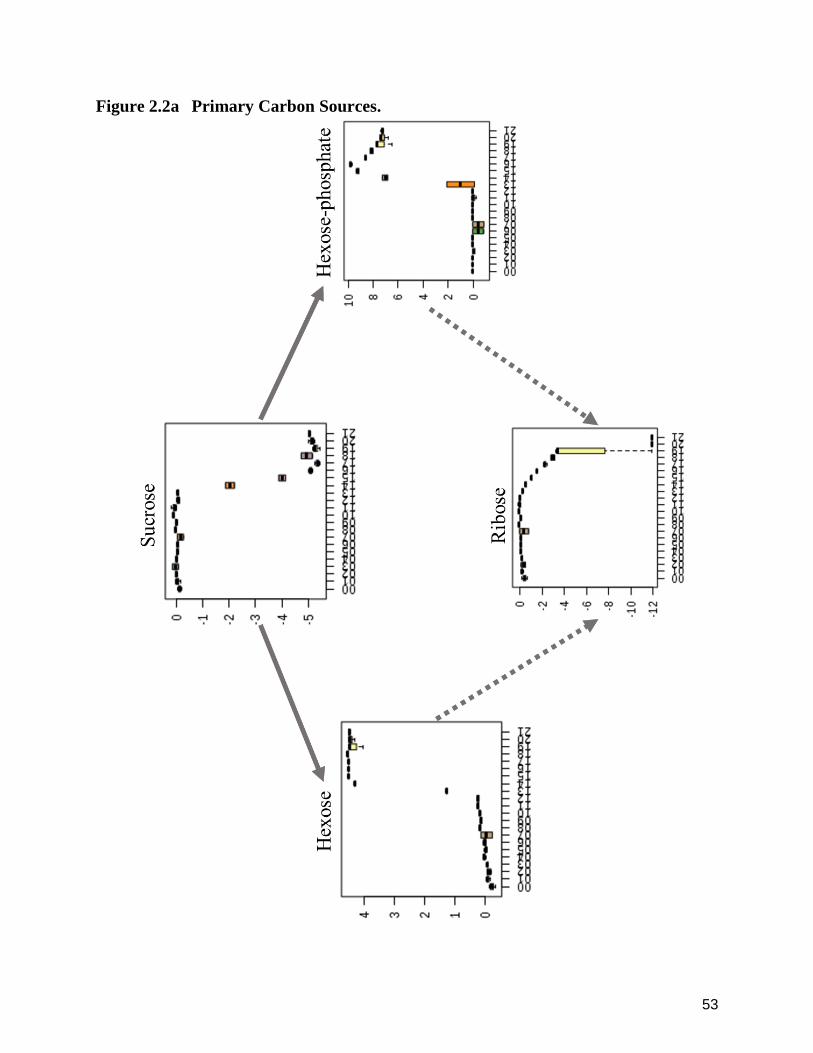
53
Figure 2.2a Primary Carbon Sources.
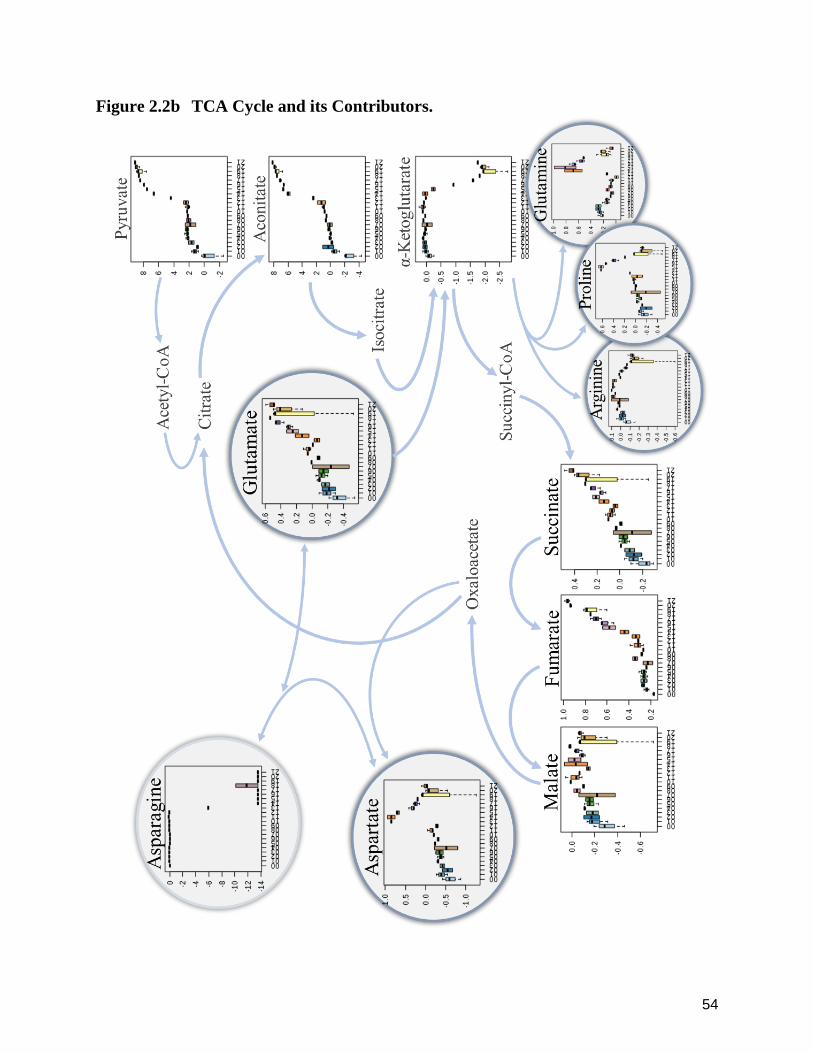
54
Figure 2.2b TCA Cycle and its Contributors.

55
Figure 2.2c Focal Amino Acids.

56
Figure 2.2d Urea Cycle and Pyrimidine Synthesis.

57
Figure 2.2e Vitamins – Pantothenate and Precursors.
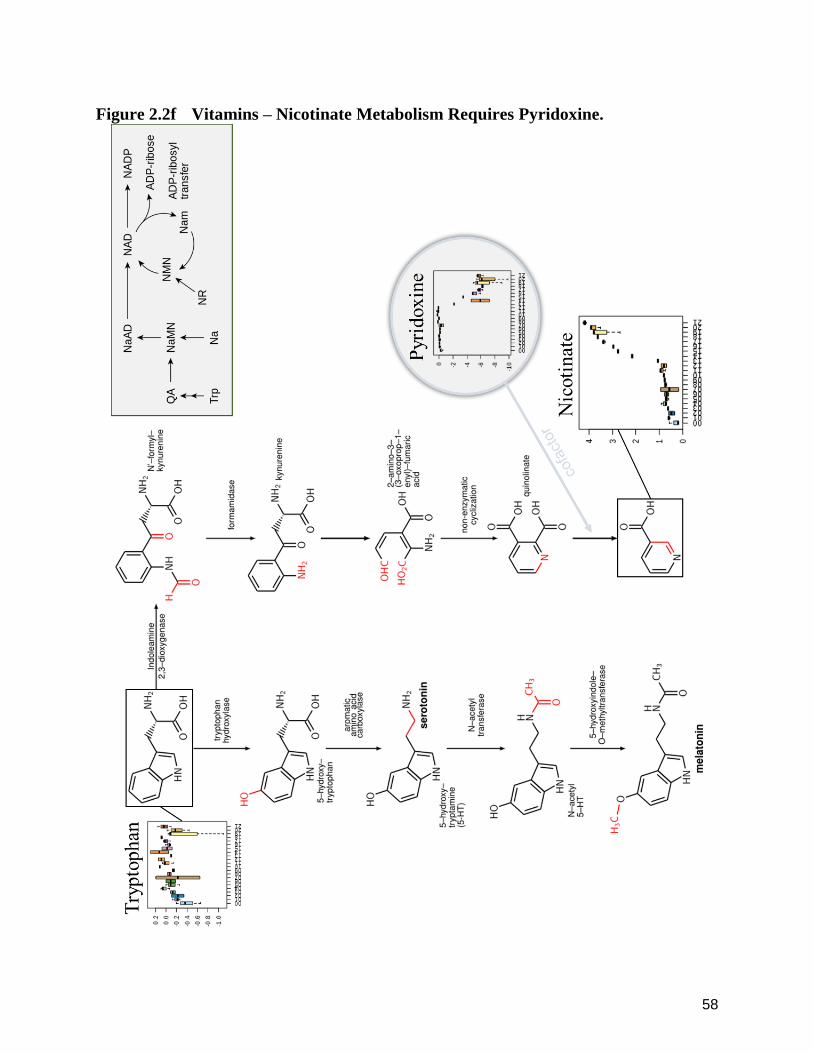
58
Figure 2.2f Vitamins – Nicotinate Metabolism Requires Pyridoxine.
59
Figure 2.2a-f Exometabolomic Data in Physiological Context. Metabolite data from the O. kimflemingae longitudinal study were re-visualized based on their respective
trends and potential biological interactions. Accordingly, boxplots for each of the analytes of interest were
placed into a schematic representation of their putative physiological contexts. For each envisaged boxplot,
the y-axis denotes log2-fold change relative to control values, while the x-axis indicates time in days post-
inoculation (dpi). (a) Depiction of primary carbon-sources and their select relevant catabolites. (b) Figure
illustrating the TCA cycle and facets of primary carbon metabolism. (c) Amino acid metabolism as it relates
to sulfur regulation. (d) Illustration of the urea cycle and precursors of pyrimidine biosynthesis. (e)
Pantothenate biosynthesis. (f) Precursing amino acid and cofactor required for nicotinate biosynthesis. All
boxplots were generated with the MetaboAnalyst.ca web portal (Statistical Analysis, core option) using the
data from Figure 2.1.

60
Figure 2.3a End-point Exometabolomic Metaprints for Supplementation and
Chelation of Trace Ions.

61
Figure 2.3b Heatmap of Metacluster Bases Underlying Suprahexagonal Metaprints.
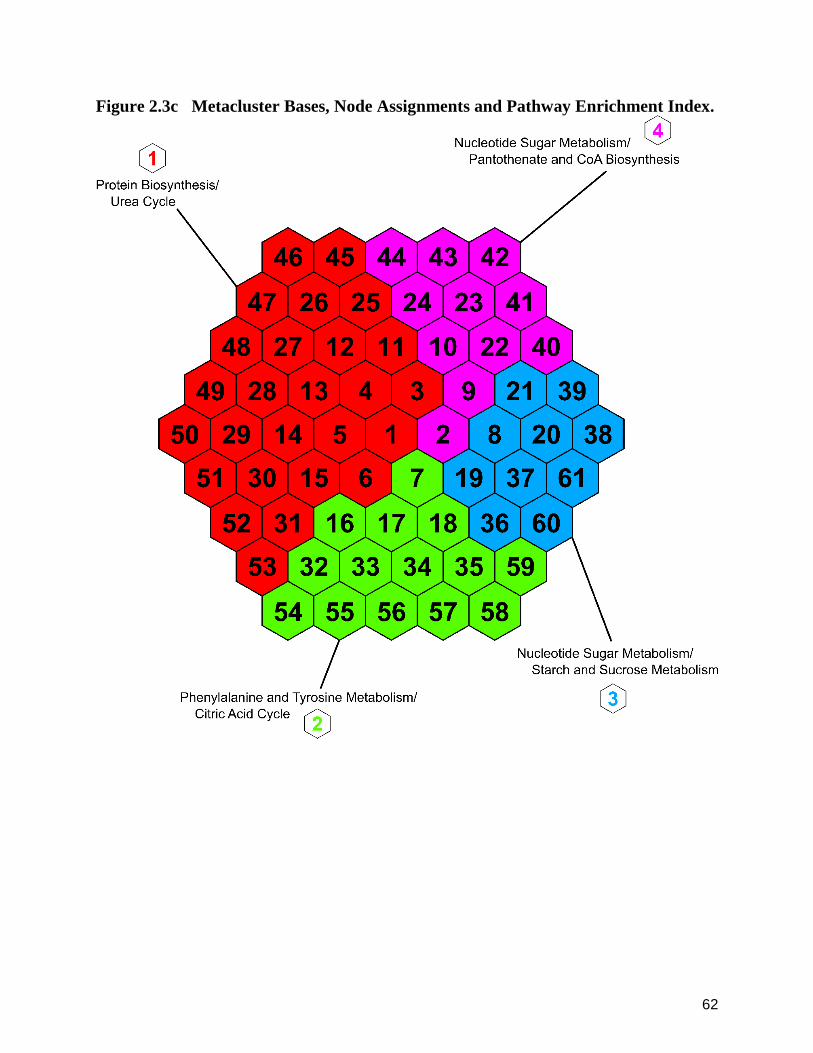
62
Figure 2.3c Metacluster Bases, Node Assignments and Pathway Enrichment Index.
63
Figure 2.3 Suprahexagonal Mapping of End-point Trace Ion Assays. (a) End-point Exometabolomic Metaprints for Supplementation and Chelation of Trace Ions. Series
of end-point exometabolomic studies were performed upon the substrata of O. kimflemingae.
Suprahexagonal mapping using an unsupervised learning algorithm (i.e., self-organizing maps) was used
to visualize the resultant exometabolomic data and compare metabolic footprints of the various
experimental conditions (supraHex, R-package; Bioconductor). Analytes to which this technique was
employed were filtered prior to mapping (relative standard deviation, < 25%). All data was log2-transformed
relative to an average [non-inoculated] control per series, respectively. Each experimental condition
possessed a biological replicate of one (n = 1) and all extractions at end-point (11 dpi) were performed in
technical triplicate. Three types of general conditions were tested: 1) trace ion supplementation; 2) trace
ion chelation using TPEN or EDTA; and 3) simultaneous rescue of growth phenotype through equimolar
administration of individual trace ions and a partner chelating agent. Supplementation conditions are listed
within the inlaid table (i.e., “Supplement Concentrations”), and denote series number within parentheses.
Series 5 chelator titrations are also listed in an inlaid table featuring the respective agents’ concentrations
(i.e., “Titrations”). All experimental conditions resulting in apparent “death” or lack of growth at end-point
are indicated by light gray labels. (b) Heatmap of Metacluster Bases Underlying Suprahexagonal
Metaprints. Using the same package and within the same workspace, the data was then used to generate
a heatmap based upon the corresponding analytes and their respective metaclusters across experimental
conditions. The x-axis shows the experimental conditions (series number in parentheses), and the y-axis
denotes detected analytes (right) and their respective metacluster base (left). The base colors are featured
in an additional key with their assigned base number. (c) Metacluster Bases, Metabolite Node
Assignment and Pathway Enrichment Index for Metaprints. This figure was generated as a numerical
metabolite-node index (note cell numbers). Each metacluster base is denoted by the colors of the index’s
suprahexagonal cells, each of which contains a set of analytes assigned per metabolite-node. The colors
of the bases and their respective designated number are conserved from the preceding figure. For each
metacluster base, all analytes contained across all base-respective cells were used to perform enrichment
analysis. The resulting pathway associations of these analyses are described within this index, adjacent to
each metacluster base. All enrichment was performed using the MSEA tool provided through the
MetaboAnalyst.ca web portal.

64
Figure 2.4 Comparative Metaprints for Two Hypocrealean Species.
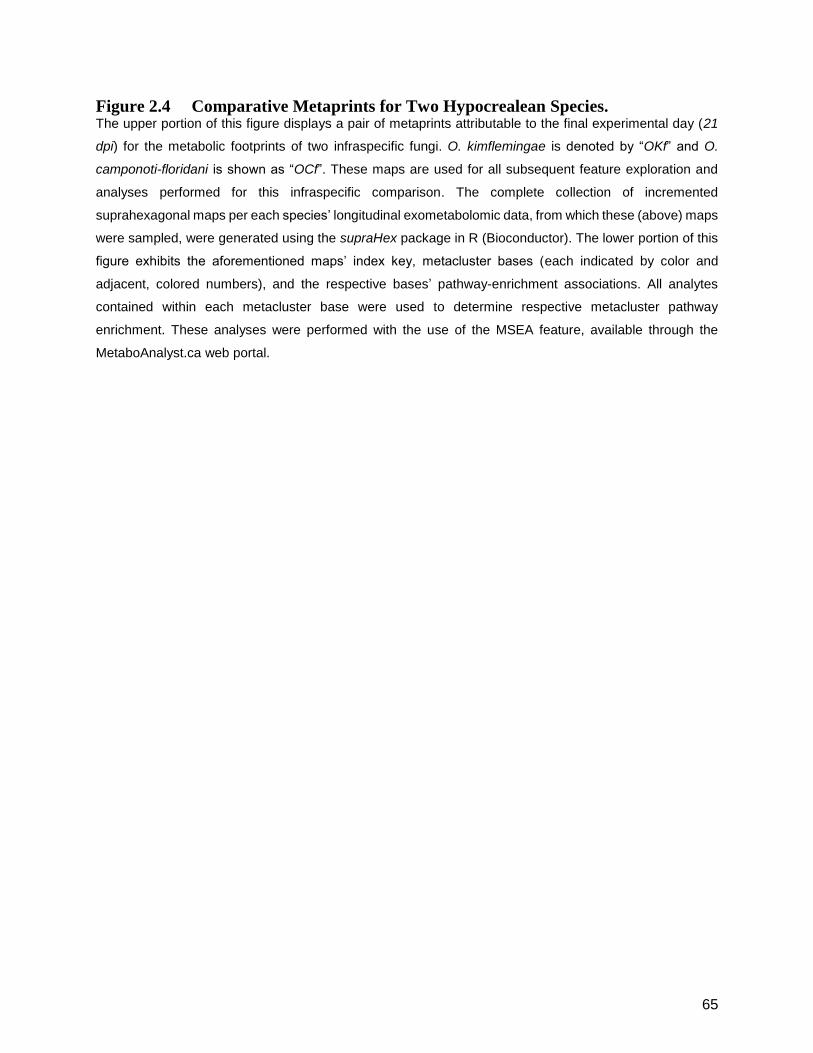
65
Figure 2.4 Comparative Metaprints for Two Hypocrealean Species. The upper portion of this figure displays a pair of metaprints attributable to the final experimental day (21
dpi) for the metabolic footprints of two infraspecific fungi. O. kimflemingae is denoted by “OKf” and O.
camponoti-floridani is shown as “OCf”. These maps are used for all subsequent feature exploration and
analyses performed for this infraspecific comparison. The complete collection of incremented
suprahexagonal maps per each species’ longitudinal exometabolomic data, from which these (above) maps
were sampled, were generated using the supraHex package in R (Bioconductor). The lower portion of this
figure exhibits the aforementioned maps’ index key, metacluster bases (each indicated by color and
adjacent, colored numbers), and the respective bases’ pathway-enrichment associations. All analytes
contained within each metacluster base were used to determine respective metacluster pathway
enrichment. These analyses were performed with the use of the MSEA feature, available through the
MetaboAnalyst.ca web portal.
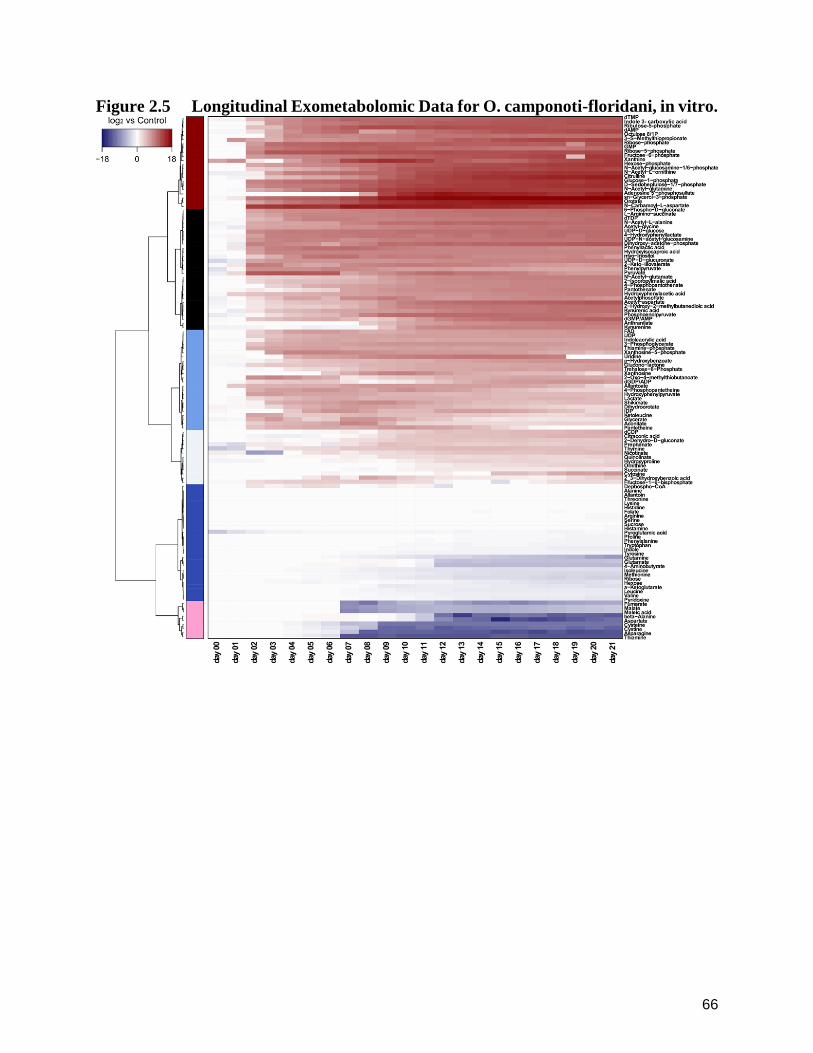
66
Figure 2.5 Longitudinal Exometabolomic Data for O. camponoti-floridani, in vitro.

67
Figure 2.5 Longitudinal Exometabolomic Data for O. camponoti-floridani, in vitro. This heatmap was generated using longitudinal exometabolomic data of O. camponoti-floridani. For 21
days post-inoculation (samples include day 0), media was sampled and methanol-extracted in triplicate for
LC-MS analysis (biological replicate, n=1). Metabolites are denoted along the y-axis (right, vertical), while
the experimental days of observation are represented along the x-axis (bottom, horizontal). Dendrogram
clustering was performed with the use of Euclidean distance and Ward linkage methods. All peak area data
were normalized using the average baseline value per analyte; subsequently, these data were filtered by
their respective relative standard deviation (RSD < 25%). Data shown are these values, log2-transformed
relative to the average control values. Heatmap was generated using the advanced heatmap function
provided by the supraHex package in R (Bioconductor).
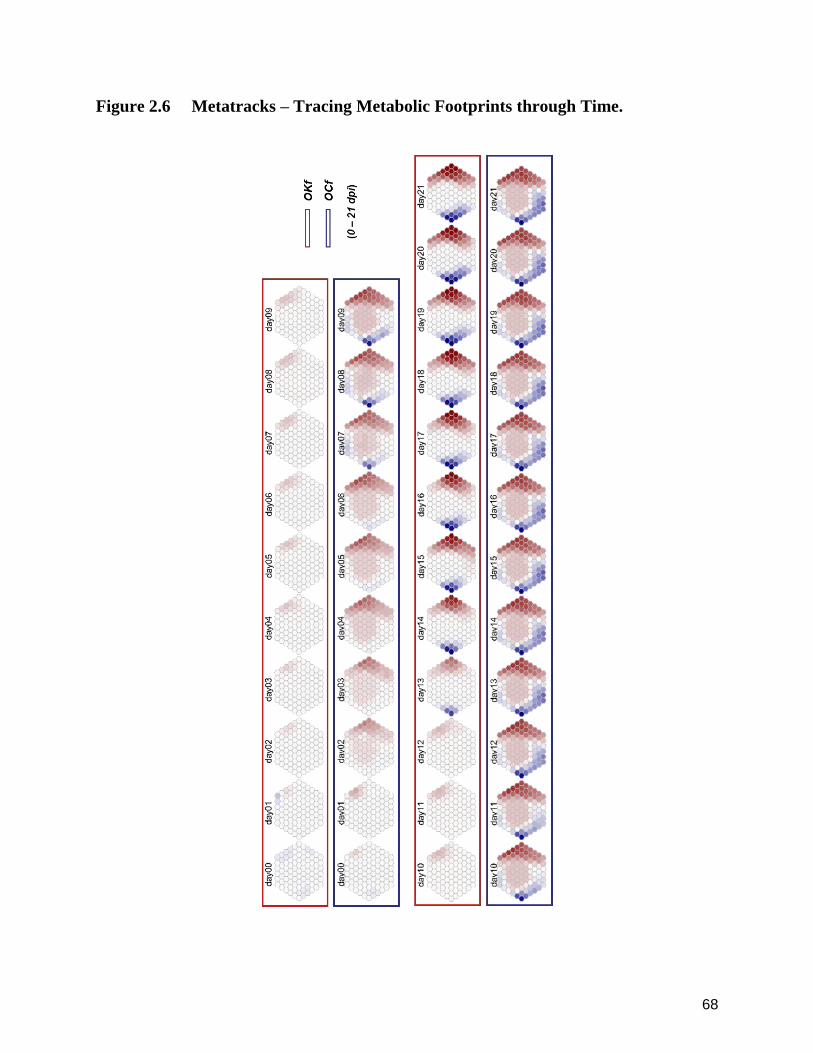
68
Figure 2.6 Metatracks ‒ Tracing Metabolic Footprints through Time.

69
Figure 2.6 Metatracks ‒ Tracing Metabolic Footprints through Time. O. kimflemingae (OKf) and O. camponoti-floridani (OCf) were sequentially mapped onto a suprahexagonal
plane for all increments of their respective experimental periods. Both sets contained 287 analytes
regardless of absence or presence. Further, both data sets were RSD-filtered and log2-transformed relative
to control values prior to incorporating the complete list of analytes into each and the subsequent zero-
imputation for any absences. The longitudinal exometabolomic data for OKf was utilized as the training
data for the employed algorithm (self-organizing maps, SOM). The longitudinal exometabolomic data for
the second species, OCf, was overlain onto the same, hyper-dimensional, topologically-fixed plane to
generate its respective metatracks. Suprahexagonal mapping was performed using the supraHex package
in R (Bioconductor).

70
Figure 2.7a Infraspecific Dual-plot – Comparative Carbon-source Utilization.

71
Figure 2.7b Infraspecific Dual-plot – Differential Nitrogen-source Utilization.
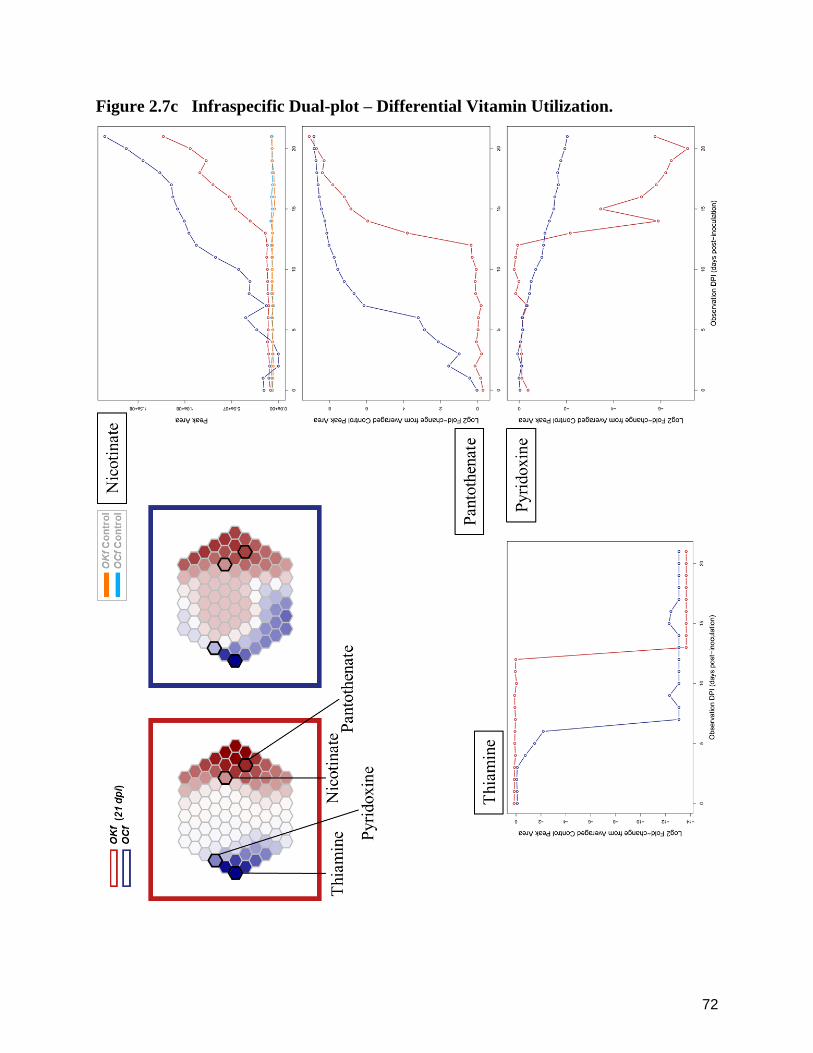
72
Figure 2.7c Infraspecific Dual-plot – Differential Vitamin Utilization.
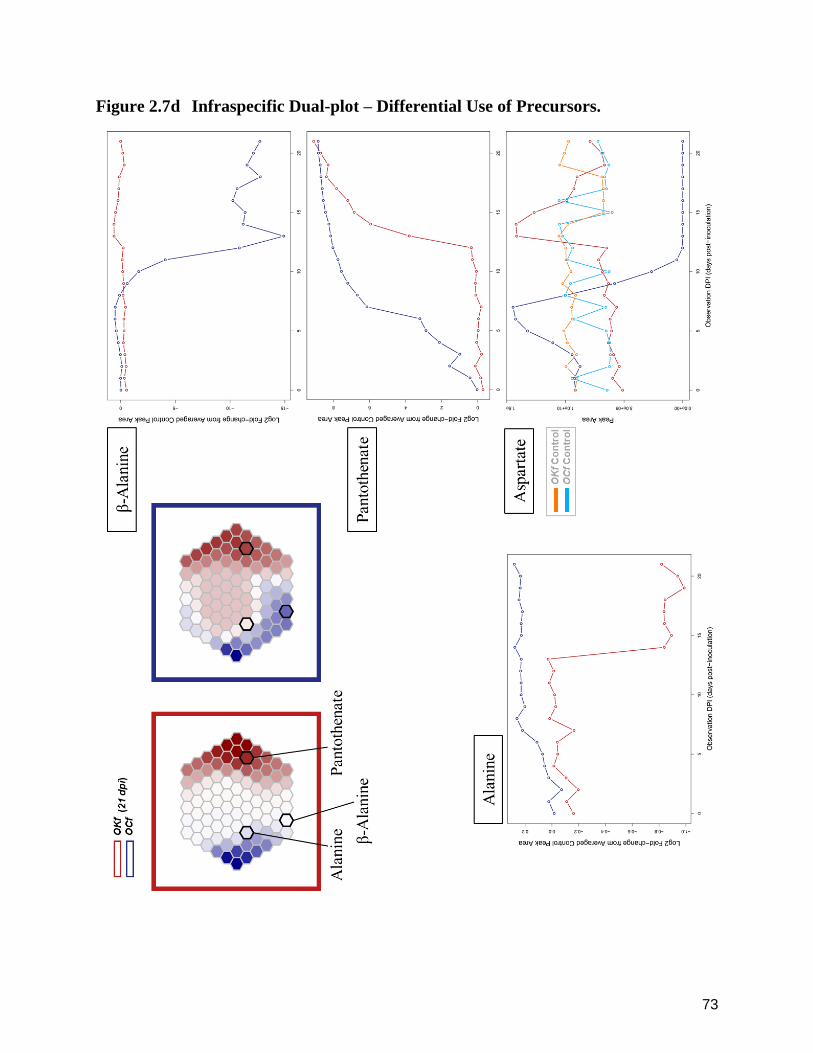
73
Figure 2.7d Infraspecific Dual-plot – Differential Use of Precursors.
74
Figure 2.7 Infraspecific Dual-plots ‒ Dissection of Infraspecific Metaprints. A single metaprint taken from the final experimental day (21 dpi) for each species, OKf (O. kimflemingae)
and OCf (O. camponoti-floridani), are exhibited and annotated, accordingly. With each of the subsequently
listed figures, a macronutritional category is highlighted and respective analytes reviewed, each shown in
more explicit detail in an accompanying plot immediately adjacent to the pair of metaprints. Metabolites
represented with each plot are indicated by their respective labels. OKf is indicated by a red box and data
plotted in red, while the second species, OCf, is denoted by a dark blue annotation box and identically-
colored plotted data. For plots, time in days post-inoculation (dpi) is featured upon the x-axis, and log2-
transformed [relative to controls] peak area is represented on the y-axis. In one instance, a plot features
non-transformed peak area for the y-axis; in this case, the control data is also plotted: OKf control data is
denoted by orange and OCf control data is shown in light blue. Metaprint cells containing these specific
analytes were demarcated by darkened edges (small, black hexagons) and respectively labeled according
to their relevant, contained metabolite(s). Contents of focus for this figure are labeled, accordingly, with
each emphasized cell. (a) Select analytes detected between species were compared as they relate to
carbon-source utilization (removal from the media) and central carbon metabolism. The metabolites
featured include sucrose, ribose, hexose and hexose-phosphate, the latter three constituting putative
products given hydrolytic processing of the former. (b) Focal nitrogen sources are highlighted and exhibited
individually in plots that feature the respective longitudinal exometabolomic data from each species. These
metabolites of focus include methionine, asparagine, cysteine and its dimeric form, cystine. (c) Vitamins of
interest are highlighted and examined in more detail in adjacent plots, each of which features the
longitudinal exometabolomic data for both regarded species. Metabolites featured in this figure include
thiamine, pyridoxine, pantothenate, and nicotinate. The last listed was a special case in regard to its
transformed data; therefore, for this single case, the data was shown in its non-transformed peak area state.
This prompted inclusion of the respective control data, which, as referenced before, are indicated
accordingly (see additional, inlaid key). (d) Pantothenate and its precursors for its biosynthesis, as indicated
in the literature as it applies to yeast and other microbes. Log2-transformed longitudinal data for these
analytes are displayed in adjacent plots, OKf being depicted in red and OCf being exhibited in blue.
Aspartate, featured in this figure, is shown in the form of peak areas for both species for parallel visualization
with each respective control dataset (similarly to what was done for exhibition of data for nicotinate).
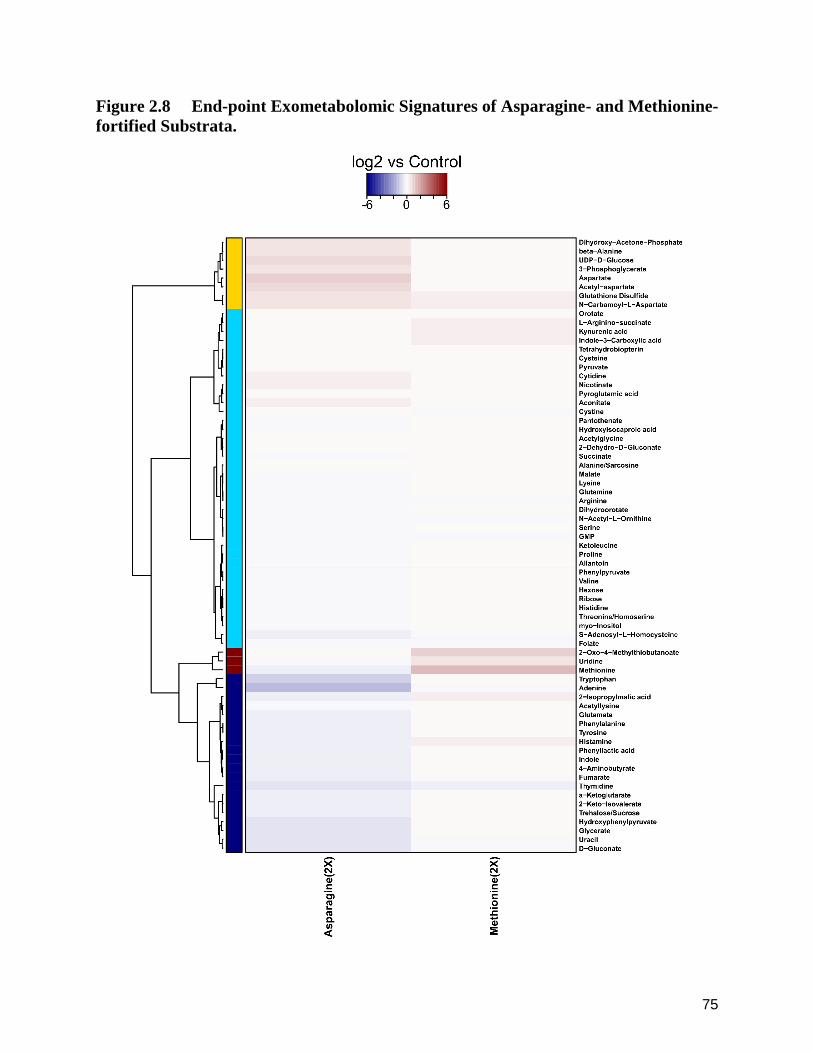
75
Figure 2.8 End-point Exometabolomic Signatures of Asparagine- and Methionine-
fortified Substrata.
76
Figure 2.8 End-point Exometabolomic Signatures of Asparagine- and Methionine-
fortified Substrata. After a period of cultivation (11 dpi), asparagine- and methionine-fortified medias were examined using
targeted end-point exometabolomic analysis to derive a substratum-utilization phenotype, or metabolic
footprint. Samples were extracted in technical triplicate (biological, n = 1). After blank-subtraction (average
blank values determine from all blank samples per metabolite), analytes were filtered based on their
calculated RSD values (relative standard deviation, < 25%). Peak areas were then log2-transformed relative
to values of a parallel-cultivated inoculated control; these data were used to generate the above heatmap.
The aforementioned inoculated control was simply a flask of standard-formulation Grace’s Insect Medium
that was inoculated in-parallel with the other experimental flasks containing formulation-variants
(asparagine- and methionine-fortified Grace’s Insect Medium; each fortifying nutrient’s concentration was
approximately double what it was in the medium’s original formula). Analytes are clustered by row across
experimental conditions by way of Euclidean-Ward distance and clustering methods. A total of four
dendrographic bases were permitted emphasis and respective color-assignment through the selective
enabling of cut-tree graphical features. Experimental conditions were left unclustered to aid in legibility of
the figure. Heatmap was generated using the advanced heatmap function included within the supraHex
package in R (Bioconductor).
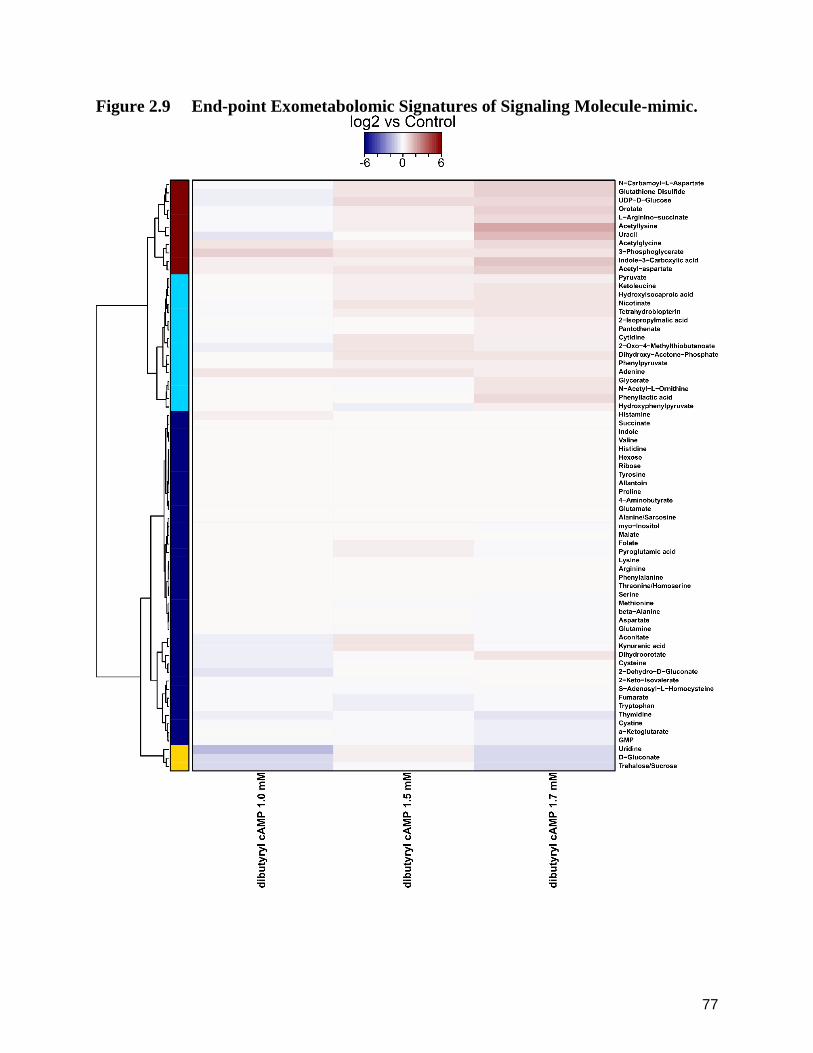
77
Figure 2.9 End-point Exometabolomic Signatures of Signaling Molecule-mimic.
78
Figure 2.9 End-point Exometabolomic Signatures of Signaling Molecule-mimic. Flasks containing standard Grace’s Insect Medium were doped with select administrations of a synthetic
cAMP-mimic, dibutyryl-cAMP (i.e., one flask each: 1.0 mM, 1.5 mM, and 1.7 mM). After 11 dpi, the
respective substrata were extracted in technical triplicate for targeted end-point exometabolomic analysis
(biological, n = 1). The peak areas were blank-subtracted (average blank values determined from all blank
samples per metabolite), and, subsequently, the analytes were filtered through use of calculated relative
standard deviation (RSD, < 25%). The resultant data were log2-transformed relative to inoculated control
values for visualization of the analytes in heatmap form (above). Metabolites are indicated by the y-axis,
while the experimental conditions are represented along the x-axis. Analyte dendrographic generation and
row-reordering were performed using Euclidean-Ward distance and clustering methods. Four
dendrographic features were selected for emphasis in the respective dendrogram. Samples (x-axis) were
left unclustered to aid in legibility and inference. This figure was generated with the use of the advanced
heatmap function available in the supraHex package in R (Bioconductor).

79
Figure 2.10 End-point Exometabolomic Signatures of Altered Substrata Starting
pH.

80
Figure 2.10 End-point Exometabolomic Signatures of Altered Substrata Starting
pH. Standard Grace’s Insect Medium was adjusted to three distinct starting pHs (i.e., 4.2, 5.0 and 6.6 pH).
These were then inoculated and co-cultivated with additional inoculated and non-inoculated controls (each
unadjusted, common-practice pH of ~5.8). All flasks were cultivated under identical conditions and, after 11
dpi, were extracted in technical triplicate for the performance of targeted end-point exometabolomic analysis
(biological, n = 1). Peak area data was blank-subtracted using the determined average noise levels across
samples (average values determined from all blank samples per metabolite). Analytes were then filtered
according to calculated RSD values (relative standard deviation, < 25%). Subsequently, data were log2-
transformed relative to the values of the inoculated control. These results were then used to generate the
above heatmap. The y-axis of this figure displays the detected metabolites (clustered), while the
experimental conditions are represented upon the x-axis. The dendrogram featured along the y-axis was
produced with the use of Euclidean-Ward distance and clustering methods, the structure of which is paired
with the derived base groups, decidedly demarcated as four parental clusters. Experimental conditions (x-
axis) were left unclustered to aid in legibility of the figure. This heatmap was generated through use of the
advanced heatmap function available in the supraHex package in R (Bioconductor).
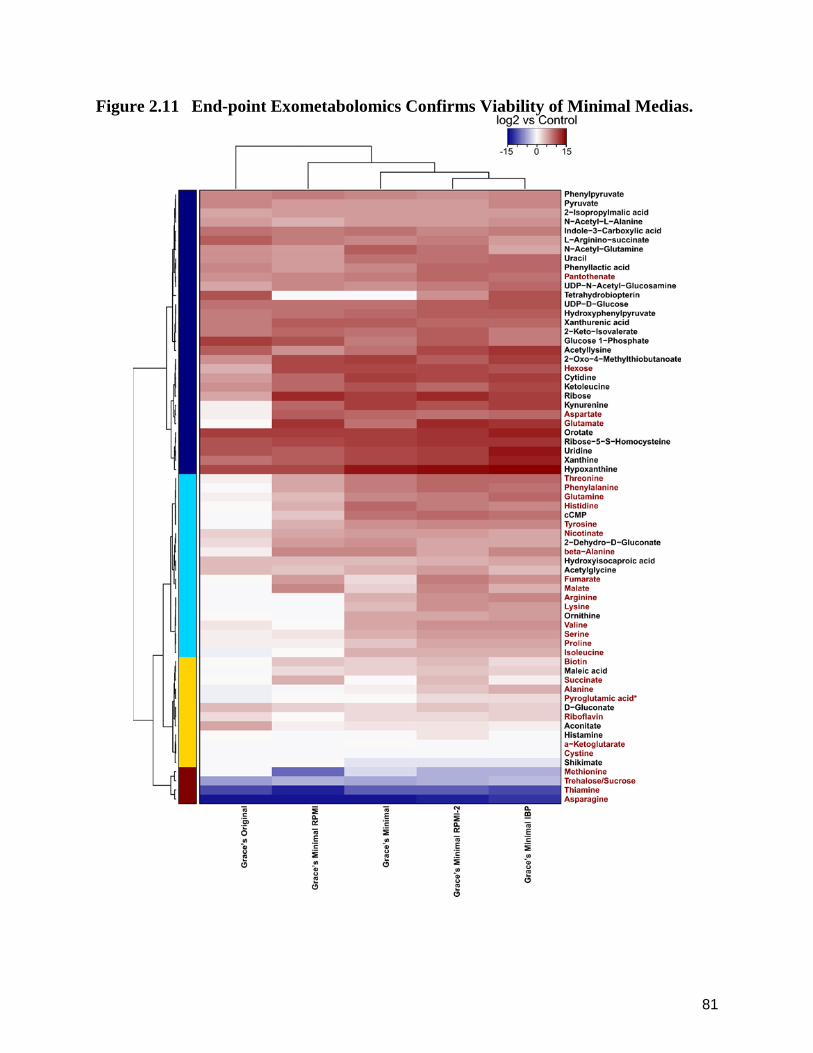
81
Figure 2.11 End-point Exometabolomics Confirms Viability of Minimal Medias.

82
Figure 2.11 End-point Exometabolomics Confirms Viability of Minimal Medias. Four distinct minimal medias were formulated based on the preliminary results returned from the
longitudinal exometabolomic study of O. kimflemingae (Table 2.1). These medias were inoculated and co-
cultivated with their respective non-inoculated controls. An additional pair was also cultivated in-parallel to
allow for comparison of the new formulations to that of the original rich medium (Grace’s Insect Medium);
again, one flask was inoculated and the other, its respective control, was non-inoculated. After 11 dpi of
continuous culture conditions, all medias were extracted in technical triplicate for the exaction of targeted
exometabolomic analysis (biological, n = 1). Peak area data was blank-subtracted (blank average values
determined from all blank samples per metabolite), and, then, relative standard deviations were calculated
to filter analytes by reproducibility (RSD, < 25%). The same processing steps were exacted in the case of
the data determined from the pair of parallel-cultivated standard Grace’s Insect Medium formulations (one
inoculated and one non-inoculated). The data for, each, the inoculated standard rich medium and all other
processed inoculated datasets were subsequently log2-transformed relative to their respective formulations’
non-inoculated control data. The above figure was generated with the resultant data using the advanced
heatmap function available within the supraHex package in R (Bioconductor). Analytes are depicted on the
y-axis, clustered (Euclidean-Ward) and accompanied by a dendrogram reflective of that clustering; while,
distinct media formulations (experimental conditions) are denoted along the x-axis. Metabolites in red are
thusly-shaded to indicate that they are known components of the standard Grace’s Insect Medium
formulation (an asterisk indicates that a metabolite is expected in the presence of glutamate/glutamine upon
LC-MS analysis as an artefact of the method; although, this analyte is shaded in red, this specific
component is at no point added to the medium during preparation or formal manufacture). Experimental
conditions (x-axis) for this figure were also clustered (Euclidean-Ward); however, no columnar tree bases
were assigned or otherwise designated to complement the generated dendrogram.

83
Figure 2.12 Perturbations Reveal Exometabolomic Signatures of Life and Death.

84
Figure 2.12 Perturbations Reveal Exometabolomic Signatures of Life and Death. With the analyses performed upon the data derived from the trace ion/macromineral supplementation,
chelation and phenotype rescue exometabolomic assays, hexagonal mapping revealed putative hexmap
signatures of life and death under the various circumstances. These two planes were generated using the
averaged data for cultures determined as being either “dead” or “alive” at the end-point of the respective
studies (11 dpi for all conditions tested). Using all metabolites in-common between all data sets, the data
were mapped accordingly, resulting in the two distinct data phenotypes shown here. All data were RSD-
filtered (< 25%) and were log2-transformed relative to the calculated means across all experimental
conditions per analyte (group mean-centered). Hexmaps were generated using the overlay feature within
the supraHex package in R (Bioconductor).

85
Chapter 3. Summary and Concluding Statements.
3.1 Summary of Findings and Implications for Pathogenic Fungi.
In this study, a targeted exometabolomics technique was applied in the interest of examining a
complex host-parasite system and allowed for successful fulfillment of my formal thesis statement
(ref. Chapter 1). Through this, I was able to highlight the nutritional requirements of this parasite
and compare these with a second, closely related species, which fostered further biological and
ecological inference. Subsequently, I used targeted exometabolomics in combination with other
methods of bioassay to probe tolerances of the parasite and examine its responses, revealing
novel physiological capacities and features, and, as a result, contributed a unique, in-depth
dataset to the current body of entomopathogenic fungal literature. This collected data has allowed
for the expansion of the initial, proposed ecological model (Figure 1.0), generating a more detailed
picture of these interactions as they were illuminated by these in vitro methods (Figure 3.0; Figure
3.1). With these concepts condensed, it is now possible to discuss work-done in the context of
biological and ecological implications, as well as future work to confirm, refute, or expand these
ideas and fundamental questions.
According to the differences in physiology, as well as implicated host-niche and virulence,
this ecological model is likely overly simplistic for the second species, O. camponoti-floridani. If a
traditional compartmental model is considered (supplemental figure B3.0) and adjusted,
accordingly, to emulate the variable states characteristic to this parasite’s characteristic life cycle,
we might more precisely examine just how these two species may differ between their respective
realized host- and environmental niches. First, it is necessary to examine select facets of their
ecologies in order to highlight differences in life history traits. In other Ophiocordycipitaceae, it
has been observed that overwintering of the infected hosts can become a regular facet of the
host-parasite relationship, depending upon the ecoregion to which the two organisms are
indigenous [169]. These fastidious species demonstrate life history traits reflective of both stress-
tolerant (S-selected) and ruderal (R-selected) survival strategy types, which are characterized by
the modulation of resource-competition through environmental stress and/or disturbance,
respectively26. Most fungi require continuous, high humidity and mild temperatures for vegetative
26 In-complement to the r/K selection theory developed by R.H. MacArthur and E.O. Wilson, C-S-R selection theory (developed by J.P. Grime, 1974, 1977) is an evolutionary theory describing the various adaptive strategies of plants. Grime expanded this theory in-address of vegetation life history strategies and succession; this included a reconciliation of r/K-selection theory with that of C-S-R selection theory, ultimately resulting in a triangle-shaped figure visualizing the combinations of survival strategies reflective of organismal investments resulting from the relative importance of competition, stress and/or disturbance. This heuristic represents functional equilibria split between three corners constituted by C-, S- and R-selected strategies [259], [260].
86
growth, a phase which poses great threat to recently-dispersed ascospores. The subterranean
overwintering of O. sinensis, for example, acts to enhance the relative fitness of its sexual spores
upon their dispersal in the early spring, the only time the fungus produces a fruiting body and
finally breaches the soil surface. The seasonality of this species’ teleomorph depends upon this
regular, high-stress disturbance for the mitigation of competition and enhancement of offspring
survival. It is the stress tolerance to conditions presented by the spring season in an alpine climate
that acts as competitive release for the offspring of this species. Contrastingly, the tropical species
of Ophiocordyceps do not exhibit such an extreme dependence upon the seasons, in some cases,
continuously infecting naïve hosts year-round; however, some species, such as O. camponoti-
rufipedis, have adopted distinct strategies that similarly enhance the survival of their offspring,
namely, via arboreal spore release and optimized host-exposure via targeted dispersal [170]
(Figure 2.0). Even though the forest floor of this tropical climate maintains stable high humidity,
the concentration of water vapor begins to drop exponentially and microclimate instability
becomes standard with exit of the boundary layer27 of the forest floor [171]. Normally, this would
pose a great threat to the survival of common fungi; however, species of Ophiocordyceps seem
to have adapted to these more challenging microclimates for the sake of transmission. Both O.
kimflemingae and O. camponoti-floridani exhibit this arboreal dispersal, but, their respective
ecologies differ in a number of ways. First, O. kimflemingae is indigenous to the temperate
rainforest ecoregions of the Southeastern United States, whereas O. camponoti-floridani, a more
recently discovered variety, is known only to the sub-tropical climate of Central and Southern
Florida. In a manner similar to the tropical species found in Northern Brazil, O. camponoti-floridani
appears to perpetuate its life cycle throughout most of the year (unpublished data). Contrastingly,
infections of O. kimflemingae appear to slow prior to and cease during the winter months. In line
with its purported continuous infectious cycles, the increased breadth of amino acids used by O.
camponoti-floridani suggested increased virulence [152], [172]. Virulence is inextricably tied to
transmission and transmissibility of a pathogen [173]–[175]. With consideration for the contrasting
geographies of O. camponoti-floridani (subtropical climate) with that of O. kimflemingae
(temperate rainforest ecoregion), paired with the implications of its broadened organic nitrogen
utilization, it was further substantiated that seasonality of infection cycles may play an important
role in determination of virulence for this species complex. Although continuous infection cycles
for O. camponoti-floridani have been proffered, thorough studies examining this phenomenon
have yet to be performed. The suggestion that increased virulence is more-positively correlated
27 A boundary layer is a layer of air adjacent to a surface characterized by low-turbulence and, therein, low convection; demonstrates minimal response (e.g., heat loss, etc.) as a result of forced convection/laminar flow.
87
with geographical location than it is with the history of host-association proved somewhat
unexpected, as it is understood that host-parasite relationships trend toward attenuation with
longer histories of association [176], [177]. Ultimately, these histories of association need more
thoroughly confirmed to refute these hypotheses. Alternatively, low relatedness of individual hosts
is commonly associated with higher virulence in the event of horizontal transmission [178], and
has been demonstrated in other eukaryotic pathogens that demonstrate multi-host life history
traits [179]. This trend has also been observed in fungal pathogens and has been further
implicated more recently by the positive correlation of codon optimization with increased host
range [180]. However, it is uncertain as to how this might occur in organisms which exhibit life
history dualities dependent upon host-context, like many species of Hypocrealean fungi, which
serve as mutualist endophytes of plants while also presenting as an entomopathogen with insect-
host introduction. Moreover, due to the taxonomic disparities between them, determining the true
evolutionary influence of intermediate hosts can be challenging and further complicates useful
examination of these interactions. Although, in provision of promise, it continues to be suggested
that plants may possess mutualistic relationships with endophytes in which these symbiotic fungi
actively infect herbivorous insects in its host’s defense [181]–[184]. Thence, in consideration of
the infection’s well-known characteristics, it is tempting to posit that O. unilateralis s.l. and similar
fungal species may actually be demonstrating an extended phenotype, not just of themselves,
but of a yet-discovered mutualistic symbiosis. Ultimately, these many considerations suggest that
further study of this species complex may provide previously untapped insight regarding the
evolution of virulence and virulence maintenance/attenuation via intermediaries in highly-
coevolved host-parasite interactions.
As a result of this study, in addition to the contributions of previously published research,
it is becoming clear that these two species demonstrate physiological signatures that complement
their respective ecologies and relationships with their hosts. In particular, these data were found
to recapitulate many traits of ants and certain ant species that corroborate their respective
candidate statuses for parasitism by this particular pathogen (O. unilateralis s.l.). A general
predisposition for infection by the entomopathogen is possibly conferred through the nutrient
density and high thiamine content found across many ant species [185]. This is likely further
supplemented by the relatively high moisture, energy and crude/available protein content
reportedly found in ants compared to other social insects [186]. In regard to the suggested
importance of trace nutrients, as opposed to macronutrients, ants are known to selectively
sequester trace metal ions in both their soft tissues and throughout portions of the cuticle; for
example, zinc can be found at higher levels within the cuticle of the mandibles, and is thought to

88
confer hardness for the mechanical utility of the tissue [187]. To address the possible influence
host life history traits may have on nutritive content, carpenter ants (tribe: camponotini), in
particular, exhibit trophic symbioses with aphids, trading protection from predators for the
honeydew the phloem-feeding insect excretes. Honeydew, as a result, is often a main constituent
of the carpenter ant diets; interestingly, honeydew has been noted for its high asparagine content,
as well as its high provisions of sucrose [188]. Ultimately, these host-niche features, confirmed
through published literature and the data presented here, represent possible targets for
subsequent research seeking to further-illuminate the details of this host-parasite relationship.
Although more work needs to be done, these assays and the lens through which they were applied
stand as a testament to the utility in capitalizing upon the ecophysiological principles governing
organismal survival. Until the year 1959, the publication year of Robert H. Whittaker’s On the
Broad Classification of Organisms, the classification of fungi as part of the Kingdom Plantae was,
as of yet, uncontested [189]. This is a simple example of the toll that using inappropriate tools can
have across many fields of study. The argument made in this work is that, in attempting to better
understand organisms, the best tools available are the principles defining the very forces from
which they result, or, as R. Buckminster Fuller more-eloquently advised, “don’t fight forces, use
them”.
3.2 Conservation of Biological Interfaces and Broader Impacts.
Biological interfaces can be observed across organisms and are reflected in the
architectures of their respective organ systems, tissues and cells [190]. These morphologies, the
most common metric used in delineating barriers of exchange, are selected for as a result of the
inherent physical properties and associated physiological utilities [191], [192]. These so-called
utilities are contingent upon the physical principles governing matter, and it is this mathematical
“inequality” that provides potential energy by way of dimensionality and, therein, the possibility of
chemical gradients [193]. As a result, the relationship between individuals and their environments,
as well as how they adapt to improve the efficiency of those relationships (i.e., exchange), is one
of the most highly conserved, copied and repeated strategies in nature [194]–[196]. This
improvement of organism-environment interaction can be observed in everything from plant root
systems and neurons to even that of fungal hyphae, the latter being the primary focus of this work
[197], [198]. Instances of organism-environment exchange optimization may serve a variety of
physiological functions, including nutrient acquisition and communication, although, homeostasis
is frequently the primary utility [199], [200]. However, some instances of organism-environment
interaction are not characterizable in such simplicity, and, often, this is due to the environment of

89
the organism being biotic instead of abiotic, creating a new paradigm of interaction, one involving
multiple organisms [201], [202]. Even when this is the case, however, interface morphology, and
even the mechanisms used in their formation, demonstrate equivalences and homologies with
more traditional organism-environment interactions [196], [200], [203]. Biological interfaces
formed by multiple-organismal contact, emersion, or infiltration are frequently characterized by
their gradients of exchange and the physiological side effects observed in the organisms involved;
for example, it is the observation of these dynamics which facilitates determination of
pathogenesis [204]–[207]. Interactions drawn from these interfaces can be either positive,
amplifying the proficiency of both organisms, or selectively positive-oppositional, amplifying one
organism’s physiology over the others involved in the interaction; however, higher degrees of
complexity may exist as a result of these interfaces.
The most well-known contexts of biological interfaces involving exchange between
multiple organisms can be described as either mutualistic or parasitic symbioses. Examples of
these interfaces range from arbuscular mycorrhizal fungi and plant pathogens to those of
entomopathogenic fungi, such as those discussed here. This work was aimed to highlight and
subvert the shared features characteristic of biological interfaces to examine a complex host and
parasite relationship. Other publications have put-forth this same advantage conferred by these
homologies, particularly when examining host-parasite interactions [208]. In these pursuits,
various ‘omics’ technologies have been utilized, alone and in-combination, to quantify and
characterize these interactions across a large variety of fields and systems. A notable field utilizing
this lens and relevant methods includes cancer research and studies examining pathogens that
generate attention through contribution to the global health burden [209], [210]. Examples of these
pathogens include Mycobacterium tuberculosis (dx: Tuberculosis) and Cryptosporidium parvum
(dx: Cryptosporidiosis) [211]–[214]. Exometabolomics, in particular, has been highlighted among
‘omics’ methods for its utility in understanding organismal “inputs” and “outputs” [215]–[220]. The
use of this method has been used to better understand how microbes change their environments,
and, further, how they might be characterized upon this same quality [12], [98], [221]. This
technique has proved particularly fertile ground for agricultural applications, ranging from
biocontrol and soil remediation to food product quality control and detection of microbial toxins as
contaminants [222]–[225]. It is through use of this technique that novel antibiotics have been
identified and targeted for pharmaceutical development [161]. Particularly relevant, host-parasite
interactions, specifically in case of the malaria-causative agent, Plasmodium falciparum, have
been defined using similar exometabolomic approaches [208], [226].

90
3.3 Future Work.
The desire to understand an organism within its natural context is a logical motive based upon
sound science targeting truth and relevance in any derived ontology; however, it is an ideal that
is, even today, largely unattained. Due to the inherent complexity of biological systems, entire
fields of study (e.g., systems biology, integrative physiology) have been birthed out of the attempts
to study and properly emulate them within a controlled, laboratory environment [96], [227]–[229].
Medical studies using animal models, in particular, have drawn a large amount of criticism
regarding their ontological translatability [227], [230], [231]. Greek and Menache (2013) stated
that, “predicting intra-complex system response is difficult and predicting inter-complex system
response is essentially impossible at higher levels of organization” [232]. Similar to the way in
which this publication challenged the problematic axioms underlying common practices, the
methods broadly applied to the study of specialized parasites within laboratory conditions so-too
demand disruption for the sake of advancement. The parasitic environment is not a simple one,
despite fundamental similarities to other biological systems, and should be treated as such for the
determination of biologically relevant characterizations in laboratory conditions.
Literature regarding the ecology and ecophysiology of fungi is in deficit as it concerns the
inclusion of host-niche and the ecological context of interacting hosts, especially for fungi
demonstrating life cycles requiring or facultatively incorporating multiple hosts. As a result, it is
understandable as to why research continues to bifurcate away from a more holistic
understanding of these systems, particularly when considering in vitro cultivation. It was only in
decades following the 1951 publication of Physiology of the Fungi by Lilly and Barnett [233]28, that
the value of fungal ecology, ecophysiology, and their synthesis began to gain traction in the
scientific community. To-date, and more-so in recent years, much emphasis has been placed on
the potential fungi have as tools of biological control and even the toxicological remediation of
landscapes [49], [234]–[236]. This has further-biased the literature away from ecophysiologically-
relevant contexts, and even recent attempts to re-center the focus of understanding, particularly
as it regards EPFs, were primarily motivated by the host-organisms and not the ecophysiological
context of the fungi involved [63]. Hence, it is becoming imperative that the experimental design,
and the tools developed and implemented, focus on preserving and/or emulating the original
contexts of the organisms that they are used to study.
28 This seminal work was the first of its kind, a comprehensive synthesis of literature assembled for the advancement of fungal physiology, and contributed many key observations for their general study, for example, “there is no universal set of conditions which leads to fructification in all fungi.”
91
Here, it was demonstrated that the use of targeted exometabolomics was immensely
effective in examining the ways in which a complex fungal parasite interacts with its substrata, of
which represented a simulation of the host environment; however, these assays were only
beginning to tap the potential of what this and similar techniques could deliver to the field of host-
parasite interactions. Even though the future of exometabolomics is promising, in regard to this
system in particular, much more work will be required to fully-realize the true nature of this host-
parasite relationship [237], [238]. This research may have illuminated a small portion of the
parasite-side of this relationship, but additional methods will be necessary to examine the ex- and
in vivo dynamics of the infection process, progression and climax, all while maintaining the
system’s biological and ecological context. In light of their combined use in pharmaceutical and
molecular biology labs for high throughput analytics of similarly complex dynamics and
interactions, metabolic fingerprinting, in addition to footprinting (of which was used here without
its complement technique), would benefit the study of this system immensely [239]. The biological
layers presented by the system also impose obstacles; these may be overcome with the
implementation of advanced fluxomics, which has already enabled metabolic phenotyping in,
both, whole multicellular organisms and diverse communities of heterotrophic microbes [240]. The
technologies and computational approaches surrounding this technique are continuously
improving, making such applications ever-increasingly within reach, user-friendly and
economically effective [241]. Use of these or similar methods would allow for simplified
phenotype-genotype link generation, whether it is used within and without the respective host
organism [242]. Being flexible enough for either in- or ex vivo use, it could provide a level of insight
paramount for the advancement of this and similar systems.
Because of the relatively small size of the host organism in this system, biopsies, vital
sampling/measurement and in vivo imaging range from difficult to impossible, making the study
of host-pathogen dynamics throughout pathogenesis challenging. Recent improvements of high-
resolution magnetic resonance (MRI) and mass spectral imaging (MSI) techniques may provide
answers the challenges of working with such difficult host specimens [243]. MALDI-ToF and ToF-
SIMS, although techniques requiring ex vivo sampling processes, are already being used for the
parsing of various, diffuse organismal relationships [244], [245]. In addition to its growing value
as a novel method of culture-independent fungal strain characterization, MSI techniques (i.e.,
MALDI and its variants) allow for high-resolution visualization of molecules across biological
samples [246], [247]. Inorganic ions, which are unobservable with the use of LC-MS, can be
visualized across tissues through utilization of XRF (x-ray fluorescence)[248]–[250]. The
colocalization of pathway components, such as the enzymes, substrates, products and cofactors,
92
may be achieved with the co-administration of these techniques to individual samples. With this
understanding and through a combination of these discussed techniques, pathways of potential
activation could be determined as a result of examining the presence-absence of trace ions
across tissue sections. This method in particular can even be integrated into various forms of
computed tomography (CT) [251]. Use of micro-/nanoCT imaging, alone or in combination with
radioisotopic labeling, would allow for in vivo imaging of the infection process from start to finish,
despite small size of the host. Additionally, certain labeling techniques may be used to target
specific tissues, even enabling for distinction of non-host tissues in-/ex vivo [252]. Due to the
length of incubation period in this system and the extent to which it resembles a closed system,
use of both MSI (i.e., MALDI-ToF, ToF-SIMS) and micro-/nanoCT imaging techniques could offer
the novel opportunity for model development, facilitating more representative teleological
architectures of pathogenesis and within-host dynamics. Lastly, elucidation of exact biochemical
characters delineating the host-parasite interface could easily be performed with the use of
traditional transgenic or CRISPR-enabled GFP-labeling techniques [253].
Ideally, these and other methods could be combined in a holistic fashion to improve the
ecological model detailed within this this work. Use of more advanced techniques designed for
high-throughput sampling and characterization will improve the outlook for this and similar
systems as it regards their examination and translatability. With the ongoing and forthcoming
global change, the future of human health is uncertain, particularly as it concerns our relationships
with microbes. It is experimental systems facilitating low-cost, high-throughput research of
complex pathogens that will better enable our scientific and public health professionals in the face
of a future defined by unpredictable obstacles that will challenge us across scales, cultures and
environments.

93
3.4 Featured Figures.
Figure 3.0 Model Amendment ‒ Proposed Host-niche and Host-parasite Exchange.

94
Figure 3.0 Model Amendment ‒ Proposed Host-niche and Host-parasite Exchange. The original ecological model discussed in Chapter 1 was revised, here, to illustrate how one might include
the revelations or novel hypotheses brought about from this work. This figure shows much of the tested
abiotic influences that represent putative facets of the host-niche, as it relates to the ecological model for
this parasitoid fungus. The broad implications of the results discussed in this work are placed between the
two spaces comprising the host landscape.
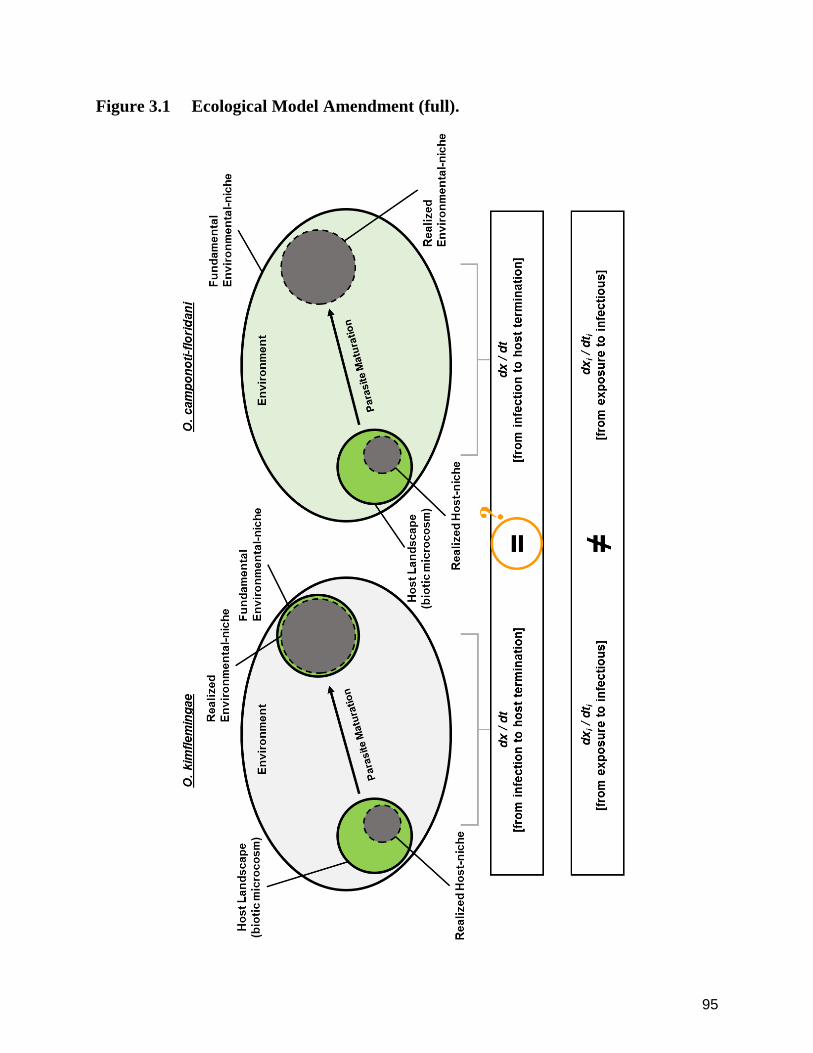
95
Figure 3.1 Ecological Model Amendment (full).

96
Figure 3.1 Ecological Model Amendment (full). Similarly to what was depicted in Chapter 1, an ecological model for each species examined in the featured
longitudinal study is represented with alterations (if applicable) to better reflect the hypothetical realized and
fundamental niches of each as supported by the data and respective inferences made in this work. One
posited difference emphasized, here, is the differing incidences of infection (as a result of seasonality) and
the projected effects that this may have had on their respective ecological roles. It should be noted that,
although it has not been confirmed, the incubation period of the two species is assumed differential as a
result of differing levels of virulence; however, it is unknown as to whether this may also have an impact
upon the distance from the host-colony traveled by the infected during the course of manipulation.

97
APPENDIX A: Supplemental Results.
A.1 Physiological Importance of Trace Metal and Macromineral Ions.
A.1.1 Supplementation of Trace Metal and Macrominerals Ions. The gross results of the trace metal and macromineral ion supplementation cultures, firstly, and
as anticipated, recapitulate the substantial impact that inoculation has upon the substrata’s
composition. Differential pH and secreted protein measures also demonstrated blatant distinction
between the various ion supplementations (supplemental figures, B2.3b and B2.3c).
Supplementation of physiologically-relevant concentrations of magnesium, manganese and
calcium ions exhibited highly-similar exometabolomic signatures and were clustered accordingly
within the columnar cut-groups. The supplementation of potassium (again, at a physiologically-
relevant concentration) produced an exometabolomic signature that is nearly indistinguishable
from the inoculated controls (supplemental figure, B2.3a). Iron was supplemented at two separate
concentrations which demarcate the lower and upper limits of the ion’s typical nutritional
requirement range for fungi (i.e., 1 µM and 3 µM). The low-end concentration of ferrous iron was
largely identical in its exometabolomic signature to that of the inoculated controls, possessing
very minor and disparately distributed differences. The high-end concentration of iron
supplementation exhibited an exometabolomic signature more-akin to those of the copper-
supplemented cultures, many features of which markedly contrast with that of the low-end
concentration iron supplementation (i.e., increased detection of acetyl-aspartate, N-acetyl-L-
alanine, 2-ketoisovalerate, L-arginosuccinate; decreased detection of various other metabolites)
and others which parallel with zinc-supplementation (i.e., relative-increased detection of uracil;
relative-decreased detection of D-sedoheptulose-1/7-phosphate and shikimate-3-phosphate).
Two distinct concentrations of copper, one based on general fungal nutritional
requirements and the other of a lesser physiological-relevance, demonstrate characteristic
exometabolomic signatures that cluster within those of the manganese, magnesium, calcium, re-
stabilized-cultivation zinc and simultaneously straddled the high-concentration iron
supplementation within the same subset of the columnar dendrogram (supplemental figure,
B2.3a). Despite their colocalization, these two cultures supplemented with distinct copper
concentrations exhibit blatant differences. The high-concentration copper-supplemented
exometabolomic signature is characterized primarily by the breadth of analytes shown to have
relative-decreased detection, several blocks of these analytes providing distinction from that of
the low-concentration copper-supplementation. Similarly to the copper supplementation cultures,
there are also two distinct experimental cultures supplemented with zinc that were utilized in these
98
experiments; contrastingly, in the case of these cultures, the concentrations were identical. The
two presented exometabolomic signatures possess highly differential characteristics, despite the
similarities of their respective treatments. One culture received blastoconidia which had been
incubated in unrefreshed media for a period of time prior to inoculation, which likely facilitated a
differential response to the supplementation. The late-cultivation zinc-supplemented
exometabolomic signature is the most distinct of any presented in supplemental figure B2.3a,
demonstrating the widest variety of differentially detected metabolites. Turning attention to the re-
stabilized zinc-supplemented culture (after more than 1 re-dilution of blastoconidia into fresh
media), distinction can immediately be curated when comparing to, both, the previously described
zinc-supplemented culture, and the exometabolomic signatures of the other cultures.
Supplementation of macromineral ions (i.e., potassium, magnesium and calcium), in addition to
manganese, failed to demonstrate substantially-distinct profiles relative to control data. No
cultures at end-point, across supplementation conditions, demonstrated any indication that trace
ions or macrominerals exercised a negative impact upon growth.
Differential pH and secreted protein were also determined for these culture
supplementation regimens (supplemental figures, B2.3b and B2.3c). Late-cultivation zinc-
supplemented conditions exhibited the greatest differential pH at end-point relative to controls of
all tested trace ions, concentrations and series (reflective of age as a result of dilutions of
blastoconidia into fresh rich media). Of all ions tested, quantitation of secreted protein relative to
that of control cultivations revealed a gross trend suggesting that supplementation of trace metal
ions (i.e., zinc, copper, iron) was associated with approximately “normal” amounts of secreted
protein, whereas supplementation of macrominerals (i.e., potassium, magnesium, calcium) was
associated with decreased secreted protein. Interestingly, exceptions to these trends were
primarily those of both concentrations of copper and the non-physiologically-relevant
concentration of calcium. The physiologically-relevant concentration of copper demonstrated
decreased secreted protein compared to other trace metal ions tested, the data of this regimen
demonstrating a much greater likeness to those described as “macrominerals”. Contrastingly, its
non-physiologically-relevant concentration (4 µM, copper) exhibited secreted protein
concentrations more akin to the ion’s compatriot “trace metals”. A similar swapping-of-trend was
demonstrated by secreted protein attributed to concentrations of calcium; however, this swap
differed in the fact that the expected trend (macrominerals demonstrating lower relative secreted
protein than those of the trace metal ions) was only disrupted by the non-physiologically-relevant
concentration, which possessed secreted protein concentrations more similarly to those
demonstrated by trace metal ions.

99
A.1.2 Ion Chelation and Titrations. The gross trends visualized in supplemental figure B2.3d illustrated that, in incidences of cell
death, the exometabolomic signatures conferred by each chelator are distinct. This behavior was
reflected in this visualization of the data, resulting in a bifurcated columnar clustering of these
“dead”/”no growth” experimental conditions, orientating bilaterally to the co-clustered and
“live”/”living”-indexed experimental conditions. Those observed as being proliferative or viable at
experimental completion were limited to the lowest titration concentration of TPEN (0.0625 µM)
and all of the titration concentrations employed in the examination of EDTA (200 µM; 20 µM; 2
µM; 0.2 µM). The higher concentrations used for EDTA (2 mM), however, all failed to demonstrate
any viability. The exometabolomic signatures of the EDTA titration samples plainly exhibit a dose-
dependent effect of the chelator upon substrata dynamics. Trends observed within the dead
culture samples were much more polarized and exhibited a more limited scope of differences.
Just as before, pH and secreted protein were determined and compared between
treatment groups relative to an inoculated control (supplemental figures, B2.3e and B2.3f). Across
EDTA supplementation regimens, ∆pH appeared somewhat dose-dependent, the pH changing in
the negative direction with increased concentration of the chelating agent; however, the only
exception to this trend, 200 µM, demonstrated an increased ∆pH relative to control when the trend
would suggest otherwise. A similar but opposite trend in ∆pH observed across titrated
administrations of TPEN (increasing ∆pH with increasing concentrations of the chelator) was also
very similarly disrupted by the second-to-largest concentration of the chelating agent (1 µM),
which exhibited a decreased ∆pH instead of an intermediate magnitude of relative increase. With
the exception of one case (TPEN, 0.0625 µM), all regimens featuring the sole-supplementation
of one of two ion-chelating agents demonstrated decreased secreted protein relative to controls.
Titration of EDTA exhibited a slight dose-dependent effect, secreted protein decreasing even
further with the highest of four tested concentrations. However, this dose dependence is not held
for the late-cultivation culture regimen, which was a much higher amount of the same chelator.
This likely was reflective of the amount of growth, and, therein, protein excretion, capable of being
sustained prior to apoptosis, as all blastoconidia participant in the EDTA titration survived;
however, further examination of cellular impacts of the chelator should be further examined.
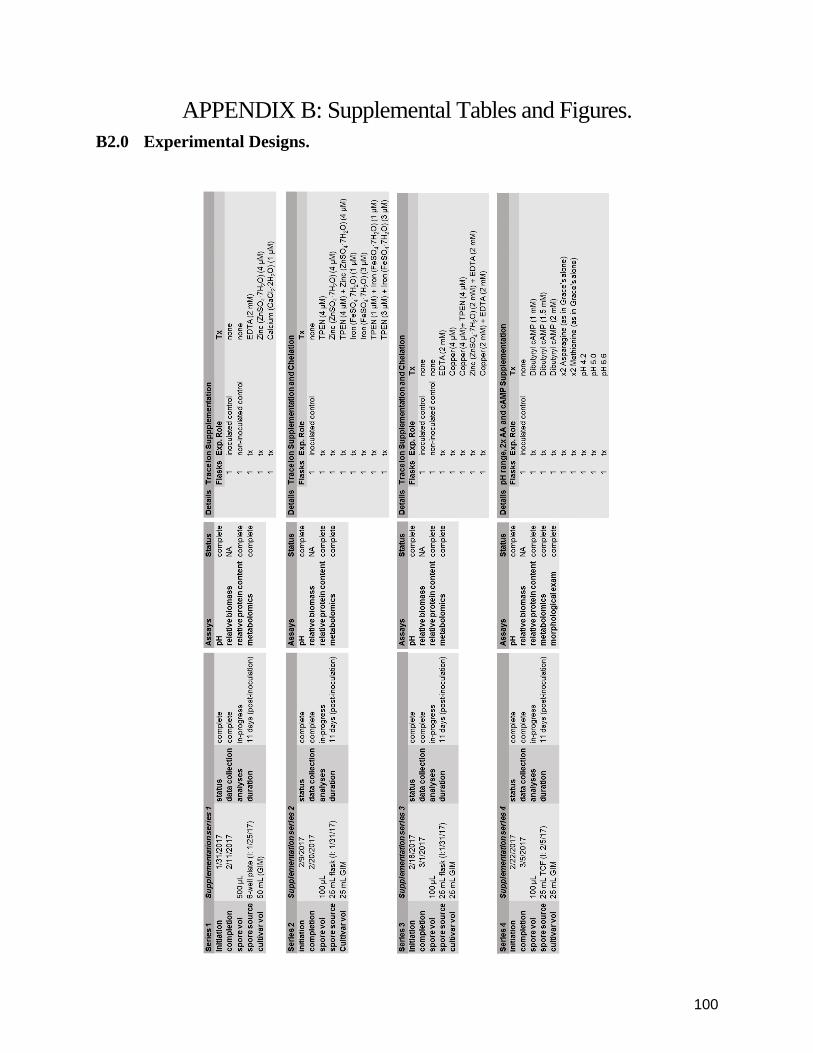
100
APPENDIX B: Supplemental Tables and Figures.
B2.0 Experimental Designs.

101

102
B2.1 End-point Trace Ion and Macromineral Studies ‒ Hexmap Index Key.

103
B2.2a-e End-point Exometabolomic Trace Ion/Macromineral Hexmap
Topologies.
a b
c d
e
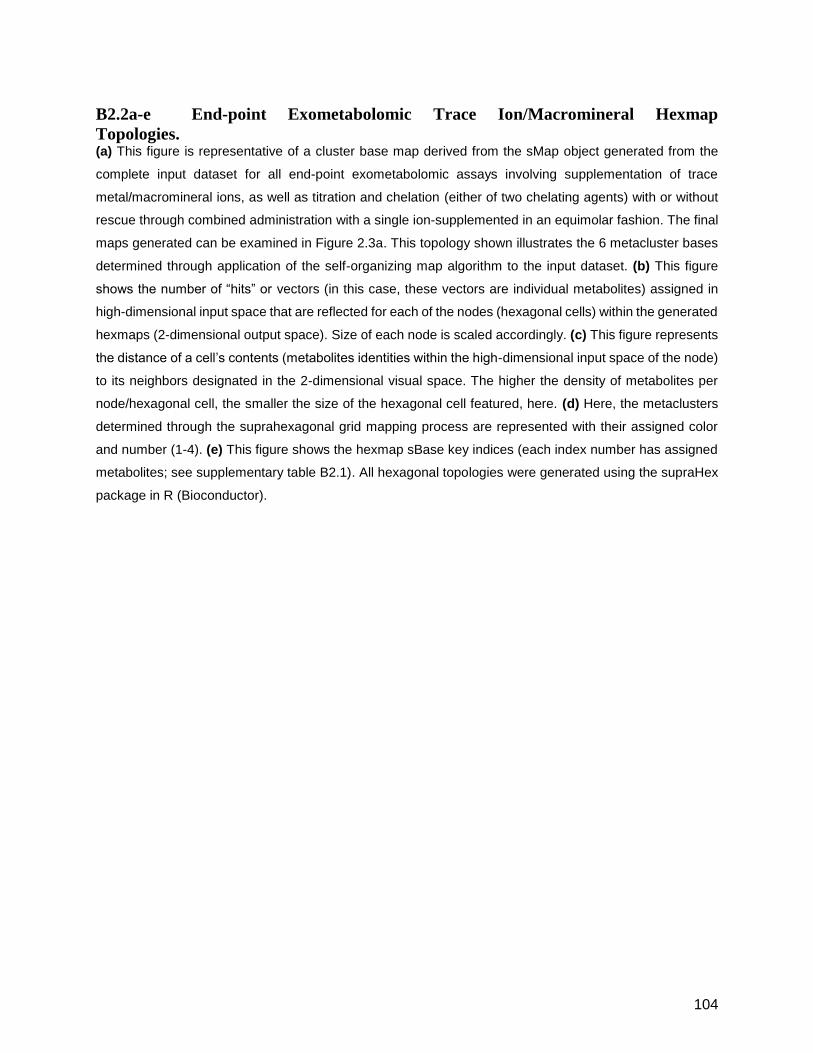
104
B2.2a-e End-point Exometabolomic Trace Ion/Macromineral Hexmap
Topologies. (a) This figure is representative of a cluster base map derived from the sMap object generated from the
complete input dataset for all end-point exometabolomic assays involving supplementation of trace
metal/macromineral ions, as well as titration and chelation (either of two chelating agents) with or without
rescue through combined administration with a single ion-supplemented in an equimolar fashion. The final
maps generated can be examined in Figure 2.3a. This topology shown illustrates the 6 metacluster bases
determined through application of the self-organizing map algorithm to the input dataset. (b) This figure
shows the number of “hits” or vectors (in this case, these vectors are individual metabolites) assigned in
high-dimensional input space that are reflected for each of the nodes (hexagonal cells) within the generated
hexmaps (2-dimensional output space). Size of each node is scaled accordingly. (c) This figure represents
the distance of a cell’s contents (metabolites identities within the high-dimensional input space of the node)
to its neighbors designated in the 2-dimensional visual space. The higher the density of metabolites per
node/hexagonal cell, the smaller the size of the hexagonal cell featured, here. (d) Here, the metaclusters
determined through the suprahexagonal grid mapping process are represented with their assigned color
and number (1-4). (e) This figure shows the hexmap sBase key indices (each index number has assigned
metabolites; see supplementary table B2.1). All hexagonal topologies were generated using the supraHex
package in R (Bioconductor).

105
B2.3a End-point Exometabolomic Signatures – Trace Ion/Macromineral
Supplementation.

106
B2.3b-c End-point Trace Ion Supplementation – Differential pH and Secreted
Protein.
b
c
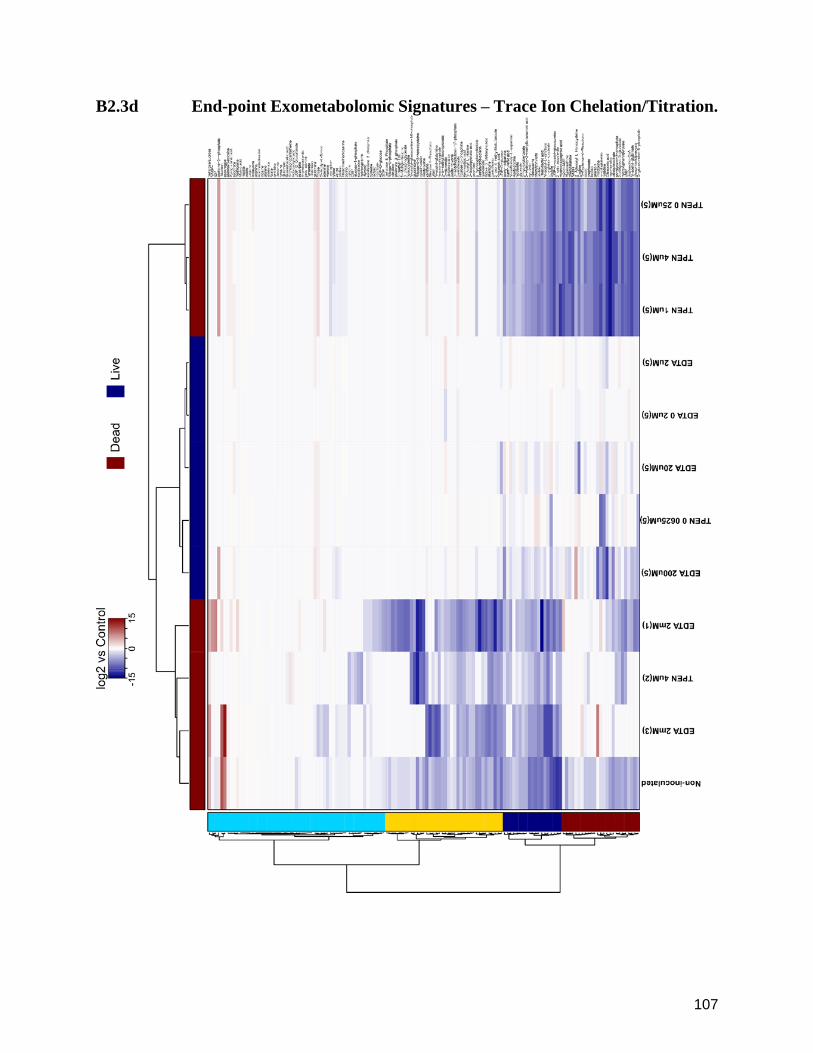
107
B2.3d End-point Exometabolomic Signatures – Trace Ion Chelation/Titration.
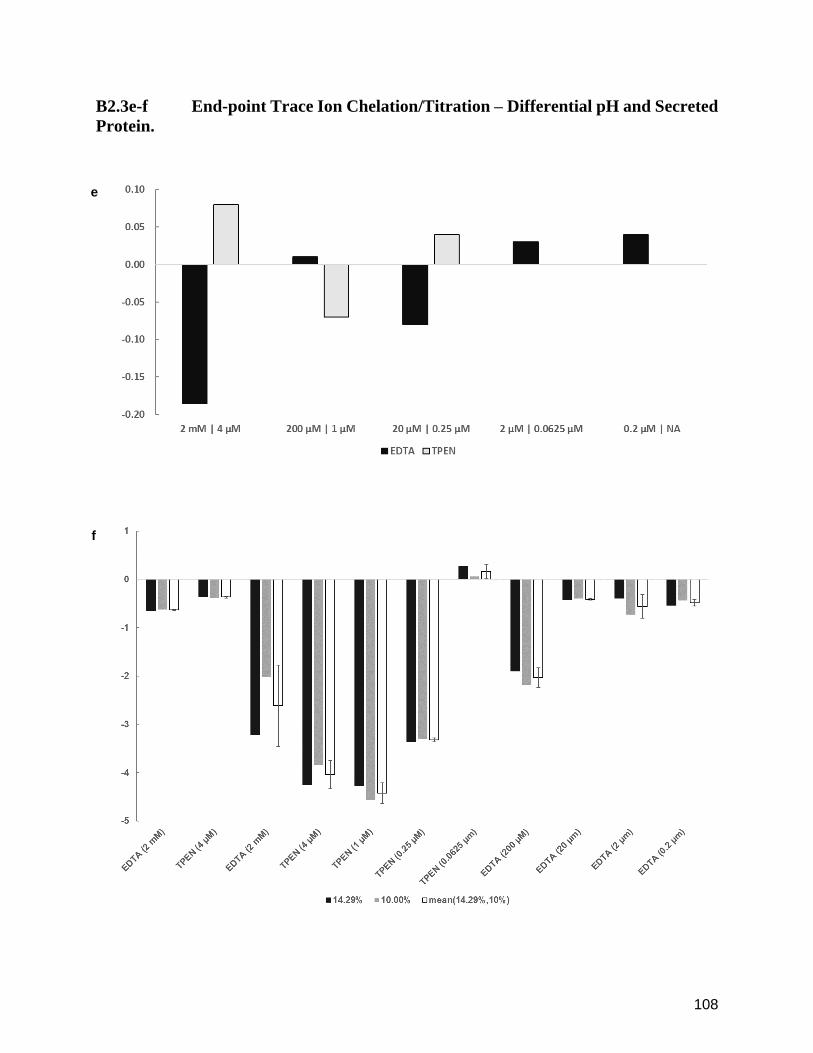
108
B2.3e-f End-point Trace Ion Chelation/Titration – Differential pH and Secreted
Protein.
e
f

109
B2.3g End-point Exometabolomic Signatures – Trace Ion Rescues.

110
B2.3h-i End-point Trace Ion Rescues – Differential pH and Secreted Protein.
h
i
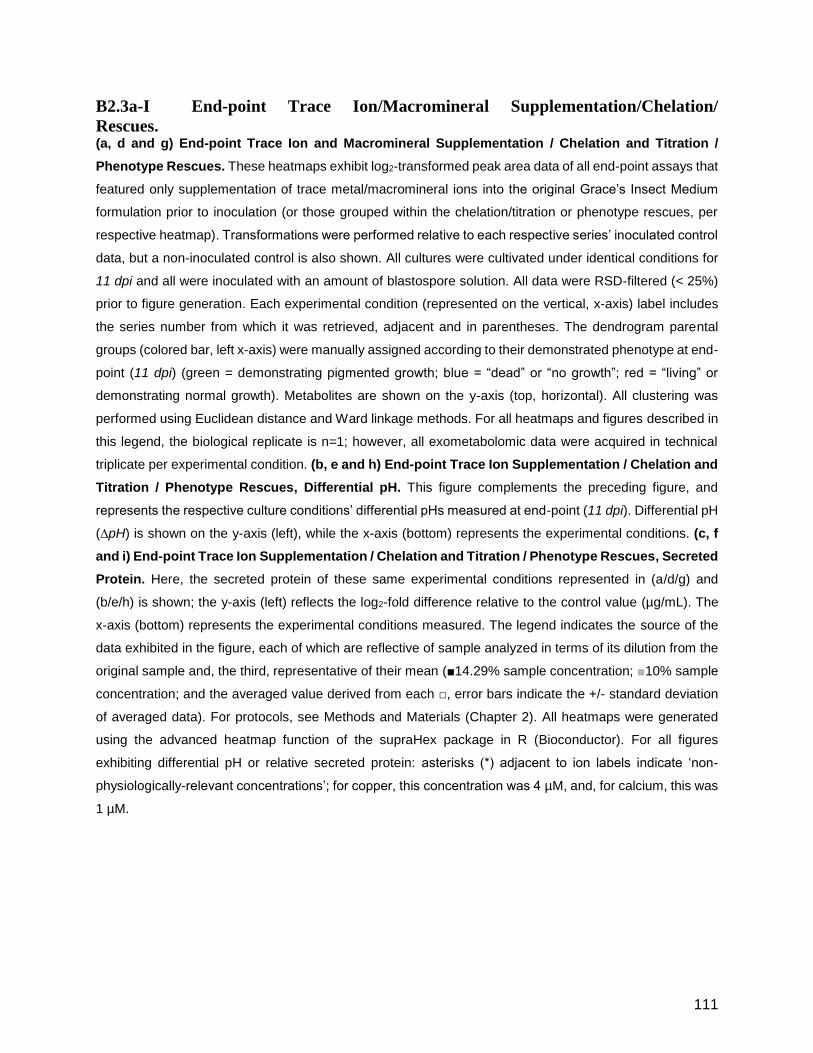
111
B2.3a-I End-point Trace Ion/Macromineral Supplementation/Chelation/
Rescues. (a, d and g) End-point Trace Ion and Macromineral Supplementation / Chelation and Titration /
Phenotype Rescues. These heatmaps exhibit log2-transformed peak area data of all end-point assays that
featured only supplementation of trace metal/macromineral ions into the original Grace’s Insect Medium
formulation prior to inoculation (or those grouped within the chelation/titration or phenotype rescues, per
respective heatmap). Transformations were performed relative to each respective series’ inoculated control
data, but a non-inoculated control is also shown. All cultures were cultivated under identical conditions for
11 dpi and all were inoculated with an amount of blastospore solution. All data were RSD-filtered (< 25%)
prior to figure generation. Each experimental condition (represented on the vertical, x-axis) label includes
the series number from which it was retrieved, adjacent and in parentheses. The dendrogram parental
groups (colored bar, left x-axis) were manually assigned according to their demonstrated phenotype at end-
point (11 dpi) (green = demonstrating pigmented growth; blue = “dead” or “no growth”; red = “living” or
demonstrating normal growth). Metabolites are shown on the y-axis (top, horizontal). All clustering was
performed using Euclidean distance and Ward linkage methods. For all heatmaps and figures described in
this legend, the biological replicate is n=1; however, all exometabolomic data were acquired in technical
triplicate per experimental condition. (b, e and h) End-point Trace Ion Supplementation / Chelation and
Titration / Phenotype Rescues, Differential pH. This figure complements the preceding figure, and
represents the respective culture conditions’ differential pHs measured at end-point (11 dpi). Differential pH
(∆pH) is shown on the y-axis (left), while the x-axis (bottom) represents the experimental conditions. (c, f
and i) End-point Trace Ion Supplementation / Chelation and Titration / Phenotype Rescues, Secreted
Protein. Here, the secreted protein of these same experimental conditions represented in (a/d/g) and
(b/e/h) is shown; the y-axis (left) reflects the log2-fold difference relative to the control value (µg/mL). The
x-axis (bottom) represents the experimental conditions measured. The legend indicates the source of the
data exhibited in the figure, each of which are reflective of sample analyzed in terms of its dilution from the
original sample and, the third, representative of their mean (■14.29% sample concentration; ■10% sample
concentration; and the averaged value derived from each □, error bars indicate the +/- standard deviation
of averaged data). For protocols, see Methods and Materials (Chapter 2). All heatmaps were generated
using the advanced heatmap function of the supraHex package in R (Bioconductor). For all figures
exhibiting differential pH or relative secreted protein: asterisks (*) adjacent to ion labels indicate ‘non-
physiologically-relevant concentrations’; for copper, this concentration was 4 µM, and, for calcium, this was
1 µM.

112
B2.4 Hexagonal Map with Select Labels – Infraspecific Comparisons.

113
B2.4 Hexagonal Map with Select Labels ‒ Infraspecific Comparisons. This figure provides a simplified graphical representation of the node assignments applicable to the
infraspecific comparison data and hexagonal maps (metaprints and metatracks). This topology illustrates
select analytes that are frequently visited in exposition of the results related to the compared metaprints
and was generated to facilitate reference of cell contents, although the full map index is also provided in
table form (supplemental table B2.6). Hexmap was generated using the supraHex package in R
(Bioconductor); all labels were added manually.

114
B2.5a-e Longitudinal Exometabolomic Hexmap Topologies.
a b
c
e
d

115
B2.5a-e Hexagonally Mapped Exometabolomic Data. All of the featured figures discussed here are reflective of the training dataset (longitudinal exometabolomics
data for O. kimflemingae) and the codebooks applicable to the infraspecific comparison results discussed
in Chapter 2. Figures (a-c) and (e) are informative regarding the input data, while (d) represents the
generated suprahexagonal data. (a) Base Topology. This figure illustrates the bases delineated by the
sMap object of the input training data. Four distinct cluster bases were produced (1-4). (b) Hits Topology.
This figure shows the “hits” per node or number of assigned contents (metabolite vectors) per hexagonal
cell. (c) Distribution Topology. This figure reflects between-neighbor distance in suprahexagonal space
in terms of relative cell-size. (d) Metacluster Topology. This fourth map illustrates the suprahexagonal
metacluster bases generated through the training process and reflects groups based off of their respective
behaviors/traits. (e) Index Topology. This figure represents a map key of node indices to accompany the
visualizations for cell content reference (see supplemental table B2.6). All hexagonal topologies were
generated using the supraHex package in R.

116
B2.6 Hexagonally Mapped Exometabolomic Data ‒ Hexmap Index Key.

117

118
B2.7a-b Asparagine and Methionine ‒ Differential pH and Secreted Protein.
a
b

119
B2.7c-d Dibutyryl-cAMP ‒ Differential pH and Secreted Protein.
c
d

120
B2.7e-f Adjusted Starting pH ‒ Differential pH and Secreted Protein.
e
f
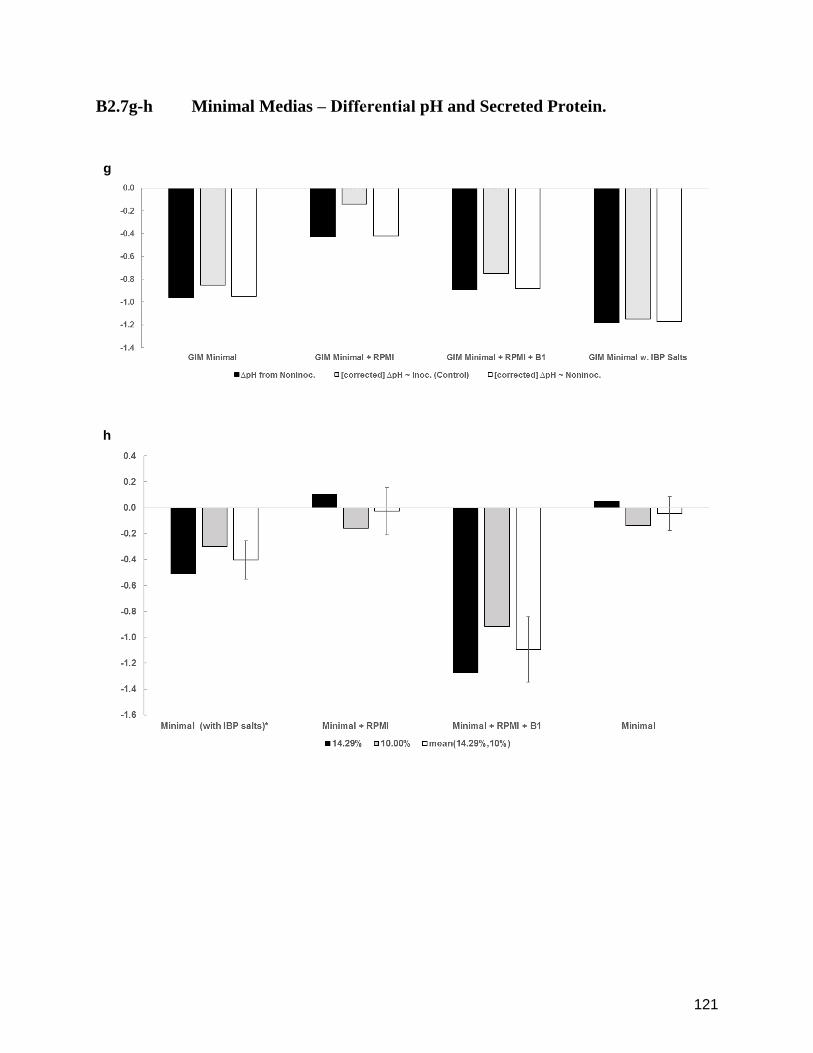
121
B2.7g-h Minimal Medias ‒ Differential pH and Secreted Protein.
g
h
122
B2.7a-h Differential pH and Relative Secreted Protein. For figures (a, c, e, and g), the y-axis (left) denotes the differential pH (∆pH) relative to non-inoculated
control pH, while the x-axis (bottom) denotes the experimental condition measured at end-point (11 dpi);
however, for figure (h), these values are relative to each formulation’s respective non-inoculated control
pH. Additionally, each measurement for this figure (h) were normalized by their respective starting pH
measures. Figure (e), which represents the culture conditions intended to examine the effects of different
starting media pHs, also possesses a second y-axis (right; pH scale) to also show the starting and ending
pH measurements for each respective ∆pH per experimental condition (x-axis). The starting pH values are
shown by the dark gray line (marks = dark gray outline, open circle), while the end-point pH values are
represented by the black line (marks = black outline, open circle). For the final series examining the minimal
media formulations (g-h), three bars are featured: one (■) representative of the differential pH (∆pH) from
each formulation’s respective non-inoculated control, the second (■) representative of the ∆pH resulting
from subtraction of the corrected original media formulation differential pH from the end-point measures of
each experimental condition, and a third (□) representing the ∆pH derived by the subtraction of the non-
inoculated end-point measures corrected by ∆pHO (correction differential; ∆pH of Grace’s Insect Medium
original formulation) from the end-point experimental measures. For figures (b, d, f, and h) depicting the
secreted protein, the y-axis (left) indicates the log2-fold change in value relative to that of the inoculated
control (µg/mL), while the x-axis (bottom) represents the experimental condition that was measured. The
three distinct bars (one black, one gray, and one white with black outline) represent the two concentrations
of the original sample analyzed, and their respective, calculated mean (■14.29% original sample
concentration; ■10% original sample concentration; and their combined mean □, error bars of which
indicate the +/- standard deviation of the averaged data).

123
B2.8 Morphological Changes Between Various Perturbations.

124
B2.8 Morphological Changes Between Various Perturbations. All images were taken using a specialized microscope-adapted digital camera (adapter magnification, 0.5x).
Scale bar was thickened and set in front of a black background for emphasis from original images; scale
bar length still identical to that which is shown in the bottom right-hand corner of each photo. All images
taken were done so under 20x magnification. Image was minimally-edited using Microsoft Office
PowerPoint (-50% Contrast; +20% Brightness; 0% Saturation; +25% Sharpness). Each image is one from
a collection taken for each experimental condition and were chosen on the basis of morphology for
facilitating comparisons. Experimental conditions featured are as follows: (a) 2x Asparagine; (b) 2x
Methionine; (c) Control; (d) Dibutyryl-cAMP 1.0 mM; (e) Dibutyryl-cAMP 1.5 mM; (f) Dibutyryl-cAMP 1.7
mM; (g) starting pH of 4.2; (h) starting pH of 5.0; (i) starting pH of 6.6.
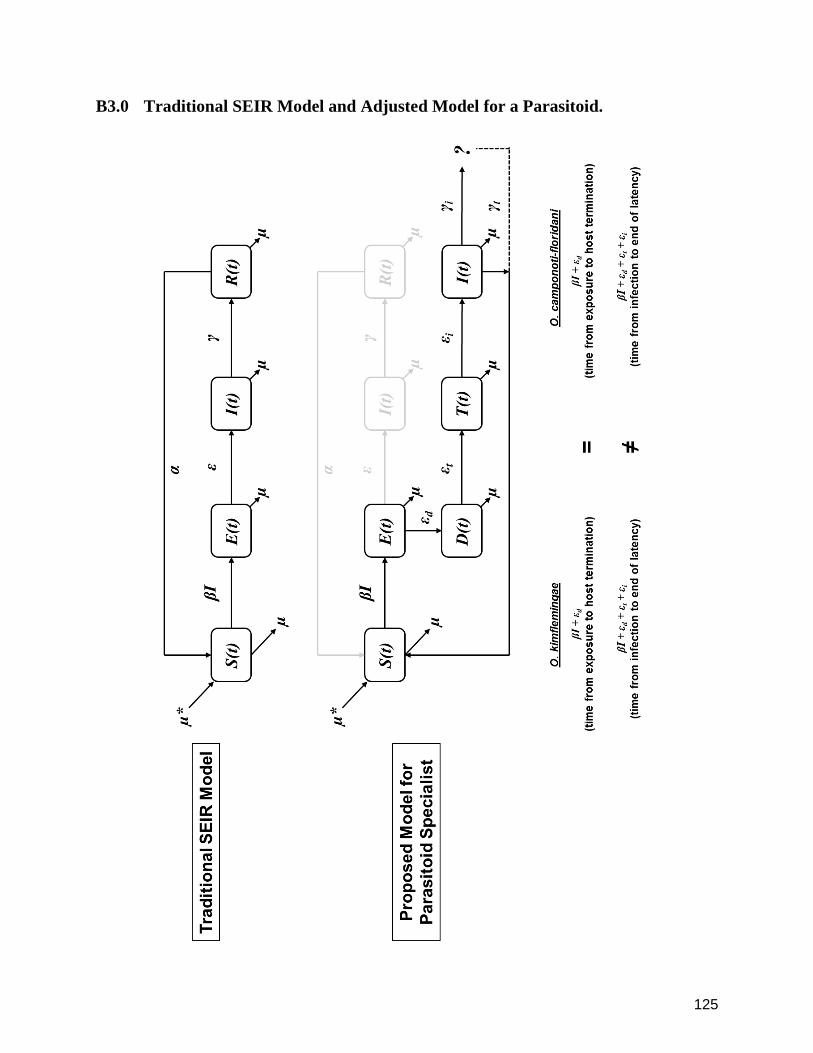
125
B3.0 Traditional SEIR Model and Adjusted Model for a Parasitoid.

126
B3.0 Traditional SEIR Model and Adjusted Model for a Parasitoid. This figure was included as both a visual aid and a proposed model for facilitating future study. It was
intended to complement the ecological models also featured within this work. Here, a traditional SEIR
(susceptible-exposed-infectious-recovered) compartmental model, used for modeling population dynamics
observed with applicable infectious diseases, is juxtapositioned with an additional, hypothetical model that
was drafted in attempt to clarify the unique dynamics presented by a parasitoid, much like the organisms
examined in this work.

127
BIBLIOGRAPHY
[1] G. E. Hutchinson, “Homage to Santa Rosalia or Why are there so many kinds of animals?,” Am. Nat., vol. 93, no. 870, pp. 145–159, 1959.
[2] S. C. Stearns, “The evolution of life history traits: a critique of the theory and a review of the data,” Annu. Rev. Ecol. Syst., vol. 8, pp. 145–171, 1977.
[3] H. T. Hammel, “Infrared emissivities of some arctic fauna,” J. Mammal., vol. 37, no. 3, pp. 375–378, 1956.
[4] A. l Norris and T. H. Kunz, “Effects of Solar Radiation on Animal Thermoregulation,” in Solar Radiation, E. B. Babatunde, Ed. InTech, 2012, pp. 197–202.
[5] N. N. Shi, C.-C. Tsai, F. Camino, G. D. Bernard, N. Yu, and R. Wehner, “Keeping cool: Enhanced optical reflection and radiative heat dissipation in Saharan silver ants,” Science (80-. )., vol. 349, no. 6245, pp. 298–301, 2015.
[6] G. E. Hutchinson, “The multivariate niche,” Cold Spring Harb. Symp. Quant. Biol., vol. 22, pp. 415–421, 1957.
[7] W. W. Murdoch, C. J. Briggs, and R. M. Nisbet, Consumer–Resource Dynamics. Princeton, NJ: Princeton University Press, 2003.
[8] S. B. Andersen, S. Gerritsma, K. M. Yusah, D. Mayntz, N. L. Hywel-Jones, J. Billen, J. J. Boomsma, and D. P. Hughes, “The life of a dead ant: the expression of an adaptive extended phenotype,” Am. Nat., vol. 174, no. 3, pp. 424–433, 2009.
[9] C. de Bekker, R. A. Ohm, R. G. Loreto, A. Sebastian, I. Albert, M. Merrow, A. Brachmann, and D. P. Hughes, “Gene expression during zombie ant biting behavior reflects the complexity underlying fungal parasitic behavioral manipulation,” BMC Genomics, vol. 16, p. 620, 2015.
[10] M. A. Fredericksen, “Fungal parasites that manipulate ant behavior: toward a mechanistic understanding of an extended phenotype,” The Pennsylvania State University, 2016.
[11] S. B. Weinstein and A. M. Kuris, “Independent origins of parasitism in Animalia,” Biol. Lett., vol. 12, 2016.
[12] O. Erbilgin, B. P. Bowen, S. M. Kosina, S. Jenkins, R. K. Lau, and T. R. Northen, “Dynamic substrate preferences and predicted metabolic properties of a simple microbial consortium,” BMC Bioinformatics, vol. 18, 2017.
[13] D. Krug and R. Müller, “Secondary metabolomics: the impact of mass spectrometry-based approaches on the discovery and characterization of microbial natural products,” Nat. Prod. Rep., vol. 31, pp. 768–83, 2014.
[14] T. Sue, V. Obolonkin, H. Griffiths, and S. G. Villas-Bôas, “An exometabolomics approach to monitoring microbial contamination in microalgal fermentation processes by using metabolic footprint analysis,” Appl. Environ. Microbiol., vol. 77, no. 21, pp. 7605–7610, 2011.
[15] J. A. Dunne, K. D. Lafferty, A. P. Dobson, R. F. Hechinger, A. M. Kuris, N. D. Martinez, J. P. McLaughlin, K. N. Mouritsen, R. Poulin, K. Reise, D. B. Stouffer, D. W. Thieltges, R. J. Williams, and C. D. Zander, “Parasites affect food web structure primarily through increased diversity and complexity,” PLoS Biol., vol. 11, no. 6, 2013.
[16] T. G. Jephcott, T. Sime-Ngando, F. H. Gleason, and D. J. Macarthur, “Host-parasite interactions in food webs: Diversity, stability, and coevolution,” Food Webs, vol. 6, 2016.
[17] R. Poulin, Evolutionary Ecology of Parasites, 2nd. Princeton University Press, 2011.
[18] C. Chetouhi, J. Panek, L. Bonhomme, H. ElAlaoui, C. Texier, T. Langin, C. de Bekker, S. Urbach, E. Demettre, D. Missé, P. Holzmuller, D. P. Hughes, A. Zanzoni, C. Brun, and D. G. Biron, “Cross-talk in host-parasite associations: What do past and recent proteomics approaches tell us?,” Infect. Genet. Evol., vol. 33, pp. 84–94, Jul. 2015.
[19] S. A. Adamo, “Parasites: evolution’s neurobiologists,” J. Exp. Biol., vol. 216, pp. 3–10, 2013.
[20] a W. Gemmill, M. E. Viney, and a F. Read, “The evolutionary ecology of host-specificity: experimental studies

128
with Strongyloides ratti,” Parasitology, vol. 120, pp. 429–437, 2000.
[21] B. C. Sheldon and S. Verhulst, “Ecological immunology: Costly parasite defenses and trade-offs in evolutionary ecology,” Trends Ecol. Evol., vol. 11, no. 8, pp. 317–321, 1996.
[22] T. Dandekar and W. Eisenreich, Eds., “Host-adapted metabolism and its regulation in bacterial pathogens,” in Frontiers in Cellular and Infection Microbiology, vol. 5, Lausanne: Frontiers Media, 2015.
[23] E. Alix, S. Mukherjee, and C. R. Roy, “Subversion of membrane transport pathways by vacuolar pathogens,” J. Cell Biol., vol. 195, no. 6, pp. 943–952, 2011.
[24] M. Brock, “Fungal metabolism in host niches.”
[25] T. C. Wen, G. R. Li, J. C. Kang, C. Kang, and K. D. Hyde, “Optimization of solid-state fermentation for fruiting body growth and cordycepin production by Cordyceps militaris,” Chiang Mai J. Sci., vol. 41, no. 4, pp. 858–872, 2014.
[26] P. H. Leung, Q. X. Zhang, and J. Y. Wu, “Mycelium cultivation, chemical composition and antitumour activity of a Tolypocladium sp. fungus isolated from wild Cordyceps sinensis,” J. Appl. Microbiol., vol. 101, pp. 275–283, 2006.
[27] S. Ali, Z. Huang, and S. X. Ren, “Production and extraction of extracellular lipase from the entomopathogenic fungus Isaria fumosoroseus (Cordycipitaceae; Hypocreales),” Biocontrol Sci. Technol., vol. 19, no. 1, pp. 81–89, 2009.
[28] Y. Y. Zhang, Y. Liu, W. M. Cheng, S. H. Nam, and C. R. Li, “Nutritional composition and bioactive constituents of artificial culture of Ophiocordyceps longissima (Ascomycetes),” Int. J. Med. Mushrooms, vol. 17, no. 1, pp. 33–41, 2015.
[29] K. Yue, M. Ye, X. Lin, and Z. Zhou, “The artificial cultivation of medicinal caterpillar fungus, Ophiocordyceps sinensis (Ascomycetes): a review,” Int. J. Med. Mushrooms, vol. 15, no. 5, pp. 425–34, 2013.
[30] V. K. Varshney, A. Pandey, A. Kumar, D. Rathod, and P. Kannojia, “Chemical screening and identification of high cordycepin containing cultured isolate(s) of medicinal chinese caterpillar mushroom, Ophiocordyceps sinensis (Berk.) G.H. Sung et al.,” Int. J. Med. Mushrooms, vol. 13, no. 4, pp. 327–333, 2011.
[31] I. Molnár, D. M. Gibson, and S. B. Krasnoff, “Secondary metabolites from entomopathogenic Hypocrealean fungi,” Nat. Prod. Rep., vol. 27, pp. 1241–1275, 2010.
[32] L. A. Lacey and H. K. Kaya, Eds., Field Manual of Techniques in Invertebrate Pathology. Springer US, 2007.
[33] Y.-W. Tang and C. W. Stratton, Eds., Advanced Techniques in Diagnostic Microbiology, 2nd ed. Springer Science & Business Media, 2012.
[34] S. S. Epstein, Volume 10 of Microbiology Monographs: Uncultivated Microorganisms. Springer Science & Business Media, 2009.
[35] K. Kocharin and P. Wongsa, “Semi-defined medium for in vitro cultivation of the fastidious insect pathogenic fungus Cordyceps unilateralis,” Mycopathologia, vol. 161, pp. 255–260, 2006.
[36] P. Wongsa, K. Tasanatai, P. Watts, and N. Hywel-Jones, “Isolation and in vitro cultivation of the insect pathogenic fungus Cordyceps unilateralis,” Mycol. Res., vol. 109, no. 8, pp. 936–940, 2005.
[37] D. G. Boucias, J. M. Meyer, S. Popoonsak, and S. E. Breaux, “The genus Hirsutella: A polyphyletic group of fungal pathogens infecting mites and insects,” Use of Entomopathogenic Fungi in Biological Pest Management. 2007.
[38] T. M. Butt, C. J. Coates, I. M. Dubovskiy, and N. A. Ratcliffe, “Entomopathogenic fungi: New insights into host-pathogen interactions,” Adv. Genet., vol. 94, 2016.
[39] J. J. Boomsma, A. B. Jensen, N. V Meyling, and J. Eilenberg, “Evolutionary interaction networks of insect pathogenic fungi,” Annu. Rev. Entomol., vol. 59, pp. 467–85, 2014.
[40] S. V Nyholm and J. Graf, “Knowing your friends: Invertebrate innate immunity fosters beneficial bacterial

129
symbioses,” Nat. Rev. Microbiol., vol. 10, pp. 815–827, 2012.
[41] K. Clay and C. L. Schardl, “Evolutionary origins and ecological consequences of endophyte symbiosis with grasses,” Am. Nat., vol. 160, pp. S99–S127, 2002.
[42] S. Parsa, V. Ortiz, and F. E. Vega, “Establishing fungal entomopathogens as endophytes: Towards endophytic biological control,” J. Vis. Exp., no. 74, 2013.
[43] J. W. Spatafora, G. H. Sung, J. M. Sung, N. L. Hywel-Jones, and J. F. White, “Phylogenetic evidence for an animal pathogen origin of ergot and the grass endophytes,” Mol. Ecol., vol. 16, pp. 1701–1711, 2007.
[44] L. Delaye, G. García-Guzmán, and M. Heil, “Endophytes versus biotrophic and necrotrophic pathogens—are fungal lifestyles evolutionarily stable traits?,” Fungal Divers., vol. 60, pp. 125–135, 2013.
[45] S. Moonjely, L. Barelli, and M. J. Bidochka, “Insect Pathogenic Fungi as Endophytes,” in Advances in Genetics, vol. 94, Elsevier Inc., 2016, pp. 107–135.
[46] A. Grundschober, F. M. Freimoser, U. Tuor, and M. Aebi, “In vitro spore formation and completion of the asexual life cycle of Neozygites parvispora, an obligate biotrophic pathogen of thrips,” Microbiol. Res., vol. 156, pp. 247–257, 2001.
[47] W. C. Nettles, “In vitro rearing of parasitoids: Role of host factors in nutrition,” Arch. Insect Biochem. Physiol., vol. 13, pp. 167–175, 1990.
[48] W. C. Nettles, “Asparagine: A host chemical essential for the growth and development of Eucelatoria bryani, a tachinid parasitoid of Heliothis spp.,” Comp. Biochem. Physiol., vol. 85A, no. 4, pp. 697–701, 1986.
[49] R. M. Kepler, J. E. Maul, and S. A. Rehner, “Managing the plant microbiome for biocontrol fungi: examples from Hypocreales,” Curr. Opin. Microbiol., vol. 37, pp. 48–53, 2017.
[50] S. O. Suh, H. Noda, and M. Blackwell, “Insect symbiosis: Derivation of yeast-like endosymbionts within an entomopathogenic filamentous lineage,” Mol. Biol. Evol., vol. 18, no. 6, pp. 995–1000, 2001.
[51] N. Kobmoo, S. Mongkolsamrit, K. Tasanathai, D. Thanakitpipattana, and J. J. Luangsa-Ard, “Molecular phylogenies reveal host-specific divergence of Ophiocordyceps unilateralis sensu lato following its host ants,” Mol. Ecol., vol. 21, pp. 3022–3031, 2012.
[52] K. G. Peay, “The mutualistic niche: Mycorrhizal symbiosis and community dynamics,” Annu. Rev. Ecol. Evol. Syst., vol. 47, pp. 143–164, 2016.
[53] J. Dighton, Fungi in Ecosystem Processes, 2nd ed. CRC Press, 2016.
[54] X. Bao and M. J. Roossinck, “Multiplexed Interactions: Viruses of Endophytic Fungi,” in Advances in Virus Research: Mycoviruses, S. Ghabrial, Ed. Academic Press, 2013, pp. 37–58.
[55] K. A. Pirozynski and D. L. Hawksworth, Coevolution of Fungi with Plants and Animals. Academic Press, 1988.
[56] J. B. Wang, R. J. St. Leger, and C. Wang, Advances in Genomics of Entomopathogenic Fungi, vol. 94. Elsevier Ltd, 2016.
[57] F. E. Vega and P. F. Dowd, “The Role of Yeasts as Insect Symbionts,” in Insect-Fungal Associations: Ecology and Evolution, F. E. Vega and M. Blackwell, Eds. Oxford University Press, 2005.
[58] A. A. Raman, W. Wheatley, A. Popay, A. A. Raman, and W. Wheatley, “Endophytic Fungus-Vascular Plant-Insect Interactions,” Environ. Entomol., vol. 41, no. 3, pp. 433–447, 2012.
[59] J. S. Cory and J. D. Ericsson, “Fungal entomopathogens in a tritrophic context,” BioControl, vol. 55, no. 1, pp. 75–88, 2010.
[60] J. J. Boomsma, A. B. Jensen, N. V. Meyling, and J. Eilenberg, “Evolutionary interaction networks of insect pathogenic fungi,” Annu. Rev. Entomol., vol. 59, pp. 467–485, 2014.
[61] N. Nikoh and T. Fukatsu, “Interkingdom host jumping underground: Phylogenetic analysis of entomoparasitic fungi of the genus cordyceps,” Mol. Biol. Evol., vol. 17, no. 4, pp. 629–638, 2000.

130
[62] M. L. Berbee, “The phylogeny of plant and animal pathogens in the Ascomycota,” Physiol. Mol. Plant Pathol., vol. 59, pp. 165–187, 2001.
[63] D. P. Hughes, J. Araújo, R. Loreto, L. Quevillon, C. de Bekker, and H. C. Evans, “From So Simple a Beginning: The Evolution of Behavioral Manipulation by Fungi,” in Advances in Genetics, vol. 94, B. Lovett and R. J. St. Leger, Eds. Elsevier Inc, 2016, pp. 437–469.
[64] D. Wichadakul, N. Kobmoo, S. Ingsriswang, S. Tangphatsornruang, D. Chantasingh, J. J. Luangsa-Ard, and L. Eurwilaichitr, “Insights from the genome of Ophiocordyceps polyrhachis-furcata to pathogenicity and host specificity in insect fungi,” BMC Genomics, vol. 16, 2015.
[65] N. Kobmoo, S. Mongkolsamrit, T. Wutikhun, K. Tasanathai, A. Khonsanit, D. Thanakitpipattana, and J. J. Luangsa-Ard, “New species of Ophiocordyceps unilateralis, an ubiquitous pathogen of ants from Thailand,” Fungal Biol., vol. 119, pp. 44–52, 2015.
[66] F. Sasaki, T. Miyamoto, A. Yamamoto, Y. Tamai, and T. Yajima, “Relationship between intraspecific variations and host insects of Ophiocordyceps nutans collected in Japan,” Mycoscience, vol. 53, pp. 85–91, 2012.
[67] S. B. Andersen, M. Ferrari, H. C. Evans, S. L. Elliot, J. J. Boomsma, and D. P. Hughes, “Disease dynamics in a specialized parasite of ant societies,” PLoS One, vol. 7, no. 5, 2012.
[68] G. H. Sung, G. O. Poinar, and J. W. Spatafora, “The oldest fossil evidence of animal parasitism by fungi supports a Cretaceous diversification of fungal-arthropod symbioses,” Mol. Phylogenet. Evol., vol. 49, pp. 495–502, 2008.
[69] E. M. Swanson, A. Espeset, I. Mikati, I. Bolduc, R. Kulhanek, W. A. White, S. Kenzie, and E. C. Snell-Rood, “Nutrition shapes life-history evolution across species,” Proc. R. Soc. B Biol. Sci., vol. 283, no. 1834, p. 20152764, 2016.
[70] J. P. Cronin, M. E. Welsh, M. G. Dekkers, S. T. Abercrombie, and C. E. Mitchell, “Host physiological phenotype explains pathogen reservoir potential,” Ecol. Lett., vol. 13, no. 10, pp. 1221–1232, 2010.
[71] D. Raubenheimer, S. J. Simpson, and D. Mayntz, “Nutrition, ecology and nutritional ecology: Toward an intergrated framework,” Funct. Ecol., vol. 23, pp. 4–16, 2009.
[72] F. Ponton, K. Wilson, S. C. Cotter, D. Raubenheimer, and S. J. Simpson, “Nutritional immunology: A multi-dimensional approach,” PLoS Pathog., vol. 7, no. 12, pp. 1–4, 2011.
[73] E. P. Skaar and M. Raffatellu, “Metals in infectious diseases and nutritional immunity,” Metallomics, vol. 7, no. 6, pp. 926–928, 2015.
[74] J. Potrykus, E. R. Ballou, D. S. Childers, and A. J. P. Brown, “Conflicting interests in the pathogen-host tug of war: Fungal micronutrient scavenging versus mammalian nutritional immunity,” PLoS Pathog., vol. 10, no. 3, 2014.
[75] V. De Rosa, M. Galgani, M. Santopaolo, A. Colamatteo, R. Laccetti, and G. Matarese, “Nutritional control of immunity: Balancing the metabolic requirements with an appropriate immune function,” Semin. Immunol., vol. 27, no. 5, pp. 300–309, 2015.
[76] S. C. Cotter, S. J. Simpson, D. Raubenheimer, and K. Wilson, “Macronutrient balance mediates trade-offs between immune function and life history traits,” Funct. Ecol., vol. 25, no. 1, pp. 186–198, 2011.
[77] A. Crawford and D. Wilson, “Essential metals at the host-pathogen interface: nutritional immunity and micronutrient assimilation by human fungal pathogens.,” FEMS Yeast Res., vol. 15, no. 7, p. fov071, 2015.
[78] J. Fernandez, M. Marroquin-Guzman, and R. A. Wilson, “Mechanisms of nutrient acquisition and utilization during fungal infections of leaves,” Annu. Rev. Phytopathol., vol. 52, pp. 155–174, 2014.
[79] D. Wilson, F. Citiulo, and B. Hube, “Zinc Exploitation by Pathogenic Fungi,” PLoS Pathog., vol. 8, no. 12, pp. 12–15, 2012.
[80] P. a Mackowiak, “Direct effects of hyperthermia on pathogenic microorganisms: Teleologic implications with regard to fever,” Rev. Infect. Dis., vol. 3, no. 3, pp. 508–520, 1981.

131
[81] N. Scrimshaw and J. Sangiovanni, “Synergism of nutrition, infection, and immunity: an overview,” Am. J. Clin. Nutr., vol. 66, p. 464S–77S, 1997.
[82] A. L. Garfoot and C. A. Rappleye, “Histoplasma capsulatum surmounts obstacles to intracellular pathogenesis,” FEBS J., vol. 283, no. 4, pp. 619–633, 2016.
[83] D. M. Hawley and S. M. Altizer, “Disease ecology meets ecological immunology: Understanding the links between organismal immunity and infection dynamics in natural populations,” Funct. Ecol., vol. 25, pp. 48–60, 2011.
[84] M. Wrzosek, M. Ruszkiewicz-Michalska, K. Sikora, M. Damszel, and Z. Sierota, “The plasticity of fungal interactions,” Mycol. Prog., vol. 16, no. 2, pp. 101–108, 2017.
[85] P. S. Solomon, K. C. Tan, and R. P. Oliver, “The nutrient supply of pathogenic fungi: a fertile field for study,” Mol. Plant Pathol., vol. 4, no. 3, pp. 203–210, 2003.
[86] S. E. Smith and F. A. Smith, “Structure and function of the interfaces in biotrophic symbioses as they relate to nutrient transport,” New Phytol., vol. 114, pp. 1–38, 1990.
[87] Y. Hongoh, “Toward the functional analysis of uncultivable, symbiotic microorganisms in the termite gut,” Cell. Mol. Life Sci., vol. 68, no. 8, pp. 1311–1325, 2011.
[88] T. Narihiro and Y. Kamagata, “Cultivating yet-to-be cultivated microbes: The challenge continues,” Microbes Environ., vol. 28, no. 2, pp. 163–165, 2013.
[89] X. Y. Han, Y. H. Seo, K. C. Sizer, T. Schoberle, G. S. May, J. S. Spencer, W. Li, and R. G. Nair, “A new Mycobacterium species causing diffuse lepromatous leprosy,” Am. J. Clin. Pathol., vol. 130, pp. 856–864, 2008.
[90] C. Bock, M. Farlik, and N. C. Sheffield, “Multi-omics of single cells: strategies and applications,” Trends Biotechnol., vol. 34, no. 8, pp. 605–608, 2016.
[91] C. J. Martyniuk and D. B. Simmons, “Spotlight on environmental omics and toxicology: a long way in a short time,” Comp. Biochem. Physiol., vol. 19, pp. 97–101, 2016.
[92] H. Wong, A. Ahmed-Cox, and B. Burns, “Molecular ecology of hypersaline microbial mats: Current insights and new directions,” Microorganisms, vol. 4, no. 6, 2016.
[93] S. R. Bordenstein and K. R. Theis, “Host biology in light of the microbiome: Ten principles of holobionts and hologenomes,” PLoS Biol., vol. 13, no. 8, pp. 1–23, 2015.
[94] C. H. Johnson, J. Ivanisevic, and G. Siuzdak, “Metabolomics: beyond biomarkers and towards mechanisms,” Nat. Rev. Mol. Cell Biol., vol. 17, no. 7, pp. 451–459, 2016.
[95] L. P. Silva and T. R. Northen, “Exometabolomics and MSI: Deconstructing how cells interact to transform their small molecule environment,” Curr. Opin. Biotechnol., vol. 34, pp. 209–216, 2015.
[96] O. Prakash, Y. Shouche, K. Jangid, and J. E. Kostka, “Microbial cultivation and the role of microbial resource centers in the omics era,” Appl. Microbiol. Biotechnol., vol. 97, pp. 51–62, 2013.
[97] R. Kodzius and T. Gojobori, “Single-cell technologies in environmental omics,” Gene, vol. 576, no. 2, pp. 701–707, 2016.
[98] D. Singh, S. Y. Son, and C. H. Lee, “Perplexing metabolomes in fungal-insect trophic interactions: a terra incognita of mycobiocontrol mechanisms,” Front. Microbiol., vol. 7, no. 1678, 2016.
[99] G. M. Walker and N. A. White, Introduction to Fungal Physiology, no. June. 2005.
[100] W. Lu, M. F. Clasquin, E. Melamud, D. Amador-Noguez, A. A. Caudy, and J. D. Rabinowitz, “Metabolomic analysis via reversed-phase ion-pairing liquid chromatography coupled to a stand alone orbitrap mass spectrometer,” Anal. Chem., vol. 82, no. 8, pp. 3212–3221, 2011.
[101] M. F. Clasquin, E. Melamud, and J. D. Rabinowitz, “LC-MS data processing with MAVEN: a metabolomic analysis and visualization engine,” Curr. Protoc. Bioinforma., 2012.

132
[102] J. Xia, I. V. Sinelnikov, B. Han, and D. S. Wishart, “MetaboAnalyst 3.0-making metabolomics more meaningful,” Nucleic Acids Res., vol. 43, pp. W251–W257, 2015.
[103] H. Fang and J. Gough, “SupraHex: an R/Bioconductor package for tabular omics data analysis using a supra-hexagonal map,” Biochem. Biophys. Res. Commun., vol. 443, pp. 285–289, 2014.
[104] F. M. Freimoser, A. B. Jensen, U. Tuor, M. Aebi, and J. Eilenberg, “Isolation and in vitro cultivation of the aphid pathogenic fungus Entomophthora planchoniana,” Can. J. Microbiol., vol. 47, pp. 1082–1087, 2001.
[105] P. Purwaha, L. P. Silva, D. H. Hawke, J. N. Weinstein, and P. L. Lorenzi, “An artifact in LC-MS/MS measurement of glutamine and glutamic acid: In-source cyclization to pyroglutamic acid,” Anal. Chem., vol. 86, no. 12, pp. 5633–5637, 2014.
[106] M. O. Garraway and R. C. Evans, Fungal Nutrition and Physiology. New York, New York: John Wiley & Sons, 1984.
[107] A. Kumar and A. K. Bachhawat, “OXP1/YKL215c encodes an ATP-dependent 5-oxoprolinase in Saccharomyces cerevisiae: Functional characterization, domain structure and identification of actin-like ATP-binding motifs in eukaryotic 5-oxoprolinases,” FEMS Yeast Res., vol. 10, no. 4, pp. 394–401, 2010.
[108] A. Kumar and A. K. Bachhawat, “Pyroglutamic acid: Throwing light on a lightly studied metabolite,” Curr. Sci., vol. 102, no. 2, pp. 288–297, 2012.
[109] D. H. Griffin, Fungal Physiology. John Wiley & Sons, 1996.
[110] E. L. Allman, H. J. Painter, J. Samra, M. Carrasquilla, and M. Llin??s, “Metabolomic profiling of the Malaria Box reveals antimalarial target pathways,” Antimicrob. Agents Chemother., vol. 60, no. 11, pp. 6635–6643, 2016.
[111] A. V Toledo, M. E. Simurro, and P. A. Balatti, “Morphological and molecular characterization of a fungus, Hirsutella sp., isolated from planthoppers and psocids in Argentina,” J. Insect Sci., vol. 13, no. 18, 2013.
[112] D. R. Simmons, R. M. Kepler, S. A. Rehner, and E. Groden, “Phylogeny of Hirsutella species (Ophiocordycipitaceae) from the USA: Remedying the paucity of Hirsutella sequence data,” IMA Fungus, vol. 6, no. 2, pp. 345–356, 2015.
[113] J.-M. Beckerich, S. Landaud, D. Onésime, and A. Hébert, “Sulfur Metabolism in Hemiascomycetes Yeast,” in Proceedings of the International Plant Sulfur Workshop: Molecular Physiology and Ecophysiology of Sulfur, L. J. De Kok, M. J. Hawkesford, H. Rennenberg, K. Saito, and E. Schnug, Eds. Springer International Publishing Switzerland, 2015.
[114] X. Pan and J. Heitman, “Cyclic AMP-dependent protein kinase regulates pseudohyphal differentiation in Saccharomyces cerevisiae,” Mol. Cell. Biol., vol. 19, no. 7, pp. 4874–87, 1999.
[115] K. B. Lengeler, R. C. Davidson, C. D’souza, T. Harashima, W. C. Shen, P. Wang, X. Pan, M. Waugh, and J. Heitman, “Signal transduction cascades regulating fungal development and virulence,” Microbiol. Mol. Biol. Rev., vol. 64, no. 4, pp. 746–85, 2000.
[116] J. Kronstad, A. De Maria, D. Funnell, R. D. Laidlaw, N. Lee, and M. Ramesh, “Signaling via cAMP in fungi: Interconnections with mitogen-activated protein kinase pathways,” Arch. Microbiol., vol. 170, pp. 395–404, 1998.
[117] S. Gold, G. Duncan, K. Barrett, and J. Kronstad, “cAMP regulates morphogenesis in the fungal pathogen Ustilago maydis,” Genes Dev., vol. 8, no. 23, pp. 2805–2816, 1994.
[118] M. Sacco, B. Maresca, B. V. Kumar, G. S. Kobayashi, and G. Medoff, “Temperature- and cyclic nucleotide-induced phase transitions of Histoplasma capsulatum,” J. Bacteriol., vol. 146, no. 1, pp. 117–120, 1981.
[119] J. W. Kronstad, “Virulence and cAMP in smuts, blasts and blights,” Trends Plant Sci., vol. 2, no. 5, pp. 193–199, 1997.
[120] K. J. Verstrepen and F. M. Klis, “Flocculation, adhesion and biofilm formation in yeasts,” Mol. Microbiol., vol. 60, no. 1, pp. 5–15, 2006.
133
[121] T. Klengel, W. J. Liang, J. Chaloupka, C. Ruoff, K. Schröppel, J. R. Naglik, S. E. Eckert, E. G. Mogensen, K. Haynes, M. F. Tuite, L. R. Levin, J. Buck, and F. A. Mühlschlegel, “Fungal adenylyl cyclase integrates CO2 sensing with cAMP signaling and virulence,” Curr. Biol., vol. 15, no. 22, pp. 2021–2026, 2005.
[122] G. T. Cole and H. C. Hoch, Eds., The Fungal Spore and Disease Initiation in Plants and Animals. Springer Science & Business Media, 1991.
[123] M. I. Borges-Walmsley and A. R. Walmsley, “cAMP signalling in pathogenic fungi: Control of dimorphic switching and pathogenicity,” Trends Microbiol., vol. 8, no. 3, pp. 133–141, 2000.
[124] W. Boron, “Regulation of intracellular pH,” Adv. Physiol. Educ., vol. 28, pp. 160–179, 2004.
[125] D. L. Nelson, A. L. Lehninger, and M. M. Cox, Eds., Lehninger Principles of Biochemistry. Macmillan, 2008.
[126] W. Z. Zeng and T. Le Xu, “Proton production, regulation and pathophysiological roles in the mammalian brain,” Neurosci. Bull., vol. 28, no. 1, pp. 1–13, 2012.
[127] N. Demaurex, “pH Homeostasis of cellular organelles.,” News Physiol. Sci., vol. 17, no. February, pp. 1–5, 2002.
[128] G. P. Gladyshev, “On thermodynamics, entropy and evolution of biological systems: What is life from a physical chemist’s viewpoint,” Entropy, vol. 1, pp. 9–20, 1999.
[129] D. H. Jennings, The Physiology of Fungal Nutrition. Cambridge, Great Britain: Cambridge University Press, 1995.
[130] P. Unagul, P. Wongsa, P. Kittakoop, S. Intamas, P. Srikitikulchai, and M. Tanticharoen, “Production of red pigments by the insect pathogenic fungus Cordyceps unilateralis BCC 1869,” J. Ind. Microbiol. Biotechnol., vol. 32, no. 4, pp. 135–140, 2005.
[131] K. A. Borkovich and D. J. Ebbole, Cellular and Molecular Biology of Filamentous Fungi. ASM Press, 2010.
[132] R. C. Cooke and J. M. Whipps, Eds., Ecophysiology of Fungi. Blackwell Scientific Publications, 1993.
[133] X. Liao, W. Fang, L. Lin, H. L. Lu, and R. J. S. Leger, “Metarhizium robertsii produces an extracellular invertase (MrINV) that plays a pivotal role in rhizospheric interactions and root colonization,” PLoS One, vol. 8, no. 10, 2013.
[134] W. Prathumpai, K. Kocharin, K. Phimmakong, and P. Wongsa, “Effects of different carbon and nitrogen sources on naphthoquinone production of Cordyceps unilateralis BCC 1869,” Appl. Biochem. Biotechnol., vol. 136, pp. 223–232, 2007.
[135] A. Van Laere, “Trehalose, reserve and/or stress metabolite?,” FEMS Microbiol. Lett., vol. 63, no. 3, pp. 201–209, 1989.
[136] N. Al-Bader, G. Vanier, H. Liu, F. N. Gravelat, M. Urb, C. M. Q. Hoareau, P. Campoli, J. Chabot, S. G. Filler, and D. C. Sheppard, “Role of trehalose biosynthesis in Aspergillus fumigatus development, stress response, and virulence,” Infect. Immun., vol. 78, no. 7, pp. 3007–3018, 2010.
[137] S. Deroover, R. Ghillebert, T. Broeckx, J. Winderickx, and F. Rolland, “Trehalose-6-phosphate synthesis controls yeast gluconeogenesis downstream and independent of SNF1,” FEMS Yeast Res., vol. 16, no. 4, pp. 1–15, 2016.
[138] M. A. Blázquez, R. Lagunas, C. Gancedo, and J. M. Gancedo, “Trehalose-6-phosphate, a new regulator of yeast glycolysis that inhibits hexokinases,” FEBS Lett., vol. 329, pp. 51–54, 1993.
[139] A. Thammahong, S. Puttikamonkul, J. R. Perfect, R. G. Brennan, and R. A. Cramer, “Central role of the trehalose biosynthesis pathway in the pathogenesis of human fungal infections: Opportunities and challenges for therapeutic development,” Microbiol. Mol. Biol. Rev., vol. 81, no. 2, pp. e00053-16, 2017.
[140] T. Fujikawa, A. Sakaguchi, Y. Nishizawa, Y. Kouzai, E. Minami, S. Yano, H. Koga, T. Meshi, and M. Nishimura, “Surface a-1,3-glucan facilitates fungal stealth infection by interfering with innate immunity in plants,” PLoS Pathog., vol. 8, no. 8, 2012.

134
[141] J. M. McDowell, “Genomes of obligate plant pathogens reveal adaptations for obligate parasitism,” Proc. Natl. Acad. Sci., vol. 108, no. 22, pp. 8921–8922, 2011.
[142] A. Gouzy, G. Larrouy-Maumus, D. Bottai, F. Levillain, A. Dumas, J. B. Wallach, I. Caire-Brandli, C. de Chastellier, T. Di Wu, R. Poincloux, R. Brosch, J. L. Guerquin-Kern, D. Schnappinger, L. P. Sório de Carvalho, Y. Poquet, and O. Neyrolles, “Mycobacterium tuberculosis exploits asparagine to assimilate nitrogen and resist acid stress during infection,” PLoS Pathog., vol. 10, no. 2, 2014.
[143] W. Shao, Y. Yang, Y. Zhang, C. Lv, W. Ren, and C. Chen, “Involvement of BcStr2 in methionine biosynthesis, vegetative differentiation, multiple stress tolerance and virulence in Botrytis cinerea,” Mol. Plant Pathol., vol. 17, no. 3, pp. 438–447, 2016.
[144] H. Seifi, D. De Vleesschauwer, A. Aziz, and M. Höfte, “Modulating plant primary amino acid metabolism as a necrotrophic virulence strategy: The immune-regulatory role of asparagine synthetase in Botrytis cinerea-tomato interaction,” Plant Signal. Behav., vol. 9, no. 2, 2014.
[145] A. Gonzalez and O. Hernandez, “New insights into a complex fungal pathogen: the case of Paracoccidioides spp.,” Yeast, vol. 33, pp. 113–128, 2016.
[146] H. Rovenich, A. Zuccaro, and B. P. H. J. Thomma, “Convergent evolution of filamentous microbes towards evasion of glycan-triggered immunity,” New Phytol., vol. 212, no. 4, pp. 896–901, 2016.
[147] M. E. Saint-Macary, C. Barbisan, M. J. Gagey, O. Frelin, R. Beffa, M. H. Lebrun, and M. Droux, “Methionine biosynthesis is essential for infection in the rice blast fungus Magnaporthe oryzae,” PLoS One, vol. 10, no. 4, pp. 1–22, 2015.
[148] R. H. Bischof, J. Horejs, B. Metz, C. Gamauf, C. P. Kubicek, and B. Seiboth, “L-Methionine repressible promoters for tuneable gene expression in Trichoderma reesei,” Microb. Cell Fact., vol. 14, p. 120, 2015.
[149] O. D. K. Maddocks, C. F. Labuschagne, P. D. Adams, and K. H. Vousden, “Serine metabolism supports the methionine cycle and DNA/RNA methylation through de novo ATP synthesis in cancer cells,” Mol. Cell, vol. 61, pp. 210–221, 2016.
[150] R. C. Pascon, “Cryptococcus neoformans methionine synthase: expression analysis and requirement for virulence,” Microbiology, vol. 150, no. 9, pp. 3013–3023, 2004.
[151] L. Manzanares-Miralles, Ö. Sarikaya-Bayram, E. B. Smith, S. K. Dolan, Ö. Bayram, G. W. Jones, and S. Doyle, “Quantitative proteomics reveals the mechanism and consequence of gliotoxin-mediated dysregulation of the methionine cycle in Aspergillus niger,” J. Proteomics, vol. 131, pp. 149–162, 2016.
[152] I. V. Ene, S. Brunke, A. J. P. Brown, and B. Hube, “Metabolism in fungal pathogenesis,” Cold Spring Harb. Perspect. Med., vol. 4, no. 12, pp. 1–22, 2014.
[153] Y. Deng, F. Yang, and N. I. Naqvi, “The Role of Nutrients in Fungal Development and Pathogenesis,” in Fungal Bio-Molecules: Sources, Applications and Recent Developments, V. K. Gupta, S. Sreenivasaprasad, and R. L. Mach, Eds. John Wiley & Sons, 2015.
[154] P. Weimann and B. Tudzynski, “The Nitrogen Regulation Network and its Impact on Secondary Metabolism and Pathogenicity,” in Fusarium: Genomics, Molecular and Cellular Biology, D. W. Brown and R. H. Proctor, Eds. Horizon Scientific Press, 2013.
[155] M. Golebiowski, A. Ostachowska, M. Paszkiewicz, M. I. Bogus, E. Wloka, M. Ligeza-Zuber, and P. Stepnowski, “Fatty acids and amino acids of entomopathogenic fungus Conidiobolus coronatus grown on minimal and rich media,” Chem. Pap., vol. 70, no. 10, pp. 1360–1369, 2016.
[156] G. Jansen, L. L. Crummenerl, F. Gilbert, T. Mohr, R. Pfefferkorn, R. Thänert, P. Rosenstiel, and H. Schulenburg, “Evolutionary transition from pathogenicity to commensalism: Global regulator mutations mediate fitness gains through virulence attenuation,” Mol. Biol. Evol., vol. 32, no. 11, pp. 2883–2896, 2015.
[157] M. Mulleder, E. Calvani, M. T. Alam, R. K. Wang, F. Eckerstorfer, A. Zelezniak, and M. Ralser, “Functional metabolomics describes the yeast biosynthetic regulome,” Cell, vol. 167, pp. 553–565, 2016.
[158] S. Manzetti, J. Zhang, and D. Van Der Spoel, “Thiamin function, metabolism, uptake, and transport,”
135
Biochemistry, vol. 53, pp. 821–835, 2014.
[159] X. Qi, X. Su, H. Guo, J. Qi, and H. Cheng, “VdThit, a thiamine transport protein, is required for pathogenicity of the vascular pathogen Verticillium dahliae,” Mol. Plant-Microbe Interact., vol. 29, no. 7, pp. 545–559, 2016.
[160] S. Brunke, S. Mogavero, L. Kasper, and B. Hube, “Virulence factors in fungal pathogens of man,” Curr. Opin. Microbiol., vol. 32, pp. 89–95, 2016.
[161] M. Kaltdorf, M. Srivastava, S. K. Gupta, C. Liang, J. Binder, A.-M. Dietl, Z. Meir, H. Haas, N. Osherov, S. Krappmann, and T. Dandekar, “Systematic identification of anti-fungal drug targets by a metabolic network approach,” Front. Mol. Biosci., vol. 3, no. 22, 2016.
[162] M. Siemieniuk, U. Czyzewska, S. Strumilo, and A. Tylicki, “Thiamine antivitamins – an opportunity of therapy of fungal infections caused by Malassezia pachydermatis and Candida albicans,” Mycoses, vol. 59, pp. 108–116, 2016.
[163] W. H. White, P. L. Gunyuzlu, and J. H. Toyn, “Saccharomyces cerevisiae is capable of de novo pantothenic acid biosynthesis involving a novel pathway of beta-Alanine production from spermine,” J. Biol. Chem., vol. 276, no. 14, pp. 10794–10800, 2001.
[164] K. J. Sheridan, S. K. Dolan, and S. Doyle, “Endogenous cross-talk of fungal metabolites,” Front. Microbiol., vol. 5, no. 732, 2015.
[165] J. L. Meier and M. D. Burkart, “The chemical biology of modular biosynthetic enzymes,” Chem. Soc. Rev., vol. 38, pp. 2012–2045, 2009.
[166] C. Spry, K. Kirk, and K. J. Saliba, “Coenzyme A biosynthesis: an antimicrobial drug target,” FEMS Microbiol. Rev., vol. 32, no. 2008, pp. 56–106, 2007.
[167] H. Chen, X. He, H. Geng, and H. Liu, “Physiological characterization of ATP-citrate lyase in Aspergillus niger,” J. Ind. Microbiol. Biotechnol., vol. 41, no. 4, pp. 721–731, 2014.
[168] J. M. Berg, J. L. Tymoczko, and L. Stryer, Eds., “The First Step in Amino Acid Degradation Is the Removal of Nitrogen,” in Biochemistry, 5th ed., New York: W. H. Freeman and Company, 2002.
[169] B. Baral and J. Maharjan, “In vitro culture of Ophiocordyceps sinensis (Yarsagumba) and their associated endophytic fungi of Nepal Himalaya,” Sci. World, vol. 10, no. 10, pp. 38–42, 2012.
[170] R. G. Loreto, S. L. Elliot, M. L. R. Freitas, T. M. Pereira, and D. P. Hughes, “Long-term disease dynamics for a specialized parasite of ant societies: a field study,” PLoS One, vol. 9, no. 8, p. e103516, 2014.
[171] G. C. Ainsworth, The Fungi: An Advanced Treatise. New York, New York: Academic Press, 1968.
[172] I. R. Lee, C. A. Morrow, and J. A. Fraser, “Nitrogen regulation of virulence in clinically prevalent fungal pathogens,” FEMS Microbiol. Lett., vol. 345, pp. 77–84, 2013.
[173] M. Lipsitch and E. R. Moxon, “Virulence and transmissibility of pathogens: What is the relationship?,” Trends Microbiol., vol. 5, no. 1, pp. 31–37, 1997.
[174] T. Day, “Parasite transmission modes and the evolution of virulence,” Evolution (N. Y)., vol. 55, no. 12, pp. 2389–2400, 2001.
[175] M. E. Wickham, N. F. Brown, E. C. Boyle, B. K. Coombes, and B. B. Finlay, “Virulence is positively selected by transmission success between mammalian hosts,” Curr. Biol., vol. 17, pp. 783–788, 2007.
[176] A. F. Read, “The evolution of virulence,” Trends Microbiol., vol. 2, no. 3, pp. 73–76, 1994.
[177] P. J. Kerr, E. Ghedin, J. V. DePasse, A. Fitch, I. M. Cattadori, P. J. Hudson, D. C. Tscharke, A. F. Read, and E. C. Holmes, “Evolutionary history and attenuation of myxoma virus on two continents,” PLoS Pathog., vol. 8, no. 10, p. e1002950, 2012.
[178] L. Chao, K. A. Hanley, C. L. Burch, C. Dahlberg, E. Paul, L. I. N. Chao, K. A. Hanley, C. L. Burch, and P. E. Turner, “Kin selection and parasite evolution: Higher and lower virulence with hard and soft selection source,” Q. Rev. Biol., vol. 75, no. 3, pp. 261–275, 2000.
136
[179] A. M. Dunn and J. E. Smith, “Microsporidian life cycles and diversity: the relationship between virulence and transmission,” Microbes Infect., vol. 3, pp. 381–388, 2001.
[180] T. Badet, R. Peyraud, M. Mbengue, O. Navaud, M. Derbyshire, R. P. Oliver, A. Barbacci, and S. Raffaele, “Codon optimization underpins generalist parasitism in fungi,” Elife, vol. 6, p. e22472, 2017.
[181] S. L. Elliot, M. W. Sabelis, A. Janssen, L. P. S. Van der Geest, E. A. M. Beerling, and J. Fransen, “Can plants use entomopathogens as bodyguards?,” Ecol. Lett., vol. 3, pp. 228–235, 2000.
[182] P. P. Wäli, P. R. Wäli, K. Saikkonen, and J. Tuomi, “Is the pathogenic ergot fungus a conditional defensive mutualist for its host grass?,” PLoS One, vol. 8, no. 7, p. e69249, 2013.
[183] K. Saikkonen, S. Saari, and M. Helander, “Defensive mutualism between plants and endophytic fungi?,” Fungal Divers., vol. 41, pp. 101–113, 2010.
[184] J. S. Cory and K. Hoover, “Plant-mediated effects in insect-pathogen interactions,” Trends Ecol. Evol., vol. 21, no. 5, pp. 278–286, 2006.
[185] P. J. Anankware, K. O. Fening, E. Osekre, and D. Obeng-Ofori, “Insects as food and feed: A review,” Int. J. Agric. Res. Rev., vol. 3, no. 1, pp. 143–151, 2015.
[186] D. Raubenheimer and J. M. Rothman, “Nutritional ecology of entomophagy in humans and other primates,” Annu. Rev. Entomol., vol. 58, pp. 141–160, 2013.
[187] W. B. Rabitsch, “Tissue-specific accumulation patterns of Pb, Cd, Cu, Zn, Fe, and Mn in workers of three ant species (Formicidae, hymenoptera) from a metal-polluted site,” Arch. Environ. Contam. Toxicol., vol. 32, pp. 172–177, 1997.
[188] A. E. Douglas, “Phloem-sap feeding by animals: Problems and solutions,” J. Exp. Bot., vol. 57, no. 4, pp. 747–754, 2006.
[189] J. M. Scamardella, “Not plants or animals: A brief history of the origin of kingdoms protozoa, protista and protoctista,” Int. Microbiol., vol. 2, pp. 207–216, 1999.
[190] K. Schmidt‐Nielsen, “Scaling in biology: the consequences of size,” J. Exp. Zool., vol. 194, pp. 287–307, 1975.
[191] P. S. Dodds, “Optimal form of branching supply and collection networks,” Phys. Rev. Lett., vol. 104, no. 4, 2010.
[192] G. B. West and J. H. Brown, “The origin of allometric scaling laws in biology from genomes to ecosystems: Towards a quantitative unifying theory of biological structure and organization,” J. Exp. Biol., vol. 208, pp. 1575–1592, 2005.
[193] G. B. West, J. H. Brown, and B. J. Enquist, “The fourth dimension of life: Fractal geometry and allometric scaling of organisms,” Science (80-. )., vol. 284, pp. 1677–1679, 1999.
[194] D. C. Schneider, “The rise of the concept of scale in ecology,” Bioscience, vol. 51, no. 7, pp. 545–553, 2001.
[195] M. E. F. Apol, R. S. Etienne, and H. Olff, “Revisiting the evolutionary origin of allometric metabolic sca ling in biology,” Funct. Ecol., vol. 22, pp. 1070–1080, 2008.
[196] A. Goriely, “Basic Aspects of Growth,” in Interdisciplinary Applied Mathematics, Vol. 45: The Mathematics and Mechanics of Biological Growth, S. S. Antman, L. Greengard, and P. J. Holmes, Eds. New York: Springer Science & Business Media, 2017.
[197] P. B. Reich, M. G. Tjoelker, J.-L. Machado, and J. Oleksyn, “Universal scaling of respiratory metabolism, size and nitrogen in plants,” Nature, vol. 439, pp. 457–461, 2006.
[198] K. J. Locey and J. T. Lennon, “Scaling laws predict global microbial diversity,” Proc. Natl. Acad. Sci., vol. 113, no. 21, pp. 5970–5975, 2016.
[199] M. Raimo and E. Lotti, “Rebuilding growth mechanisms through visual observations,” ChemTexts, vol. 2, no. 11, 2016.
137
[200] N. Meyer-Vernet and J.-P. Rospars, “Maximum relative speeds of living organisms: Why do bacteria perform as fast as ostriches?,” Phys. Biol., vol. 13, 2016.
[201] J. G. Okie, V. H. Smith, and M. Martin-Cereceda, “Major evolutionary transitions of life, metabolic scaling and the number and size of mitochondria and chloroplasts,” Proc. R. Soc. B, vol. 283, 2016.
[202] D. A. Dawson, Introductory Lectures on Stochastic Population Systems, Technical. Laboratory for Research in Statistics and Probability - Carleton University, 2010.
[203] P. Willmore, G. Stone, and I. Johnston, Eds., Environmental Physiology of Animals, 2nd ed. Wiley-Blackwell, 2004.
[204] C. Knecht, C. Fretter, P. Rosenstiel, M. Krawczak, and M.-T. Hütt, “Distinct metabolic network states manifest in the gene expression profiles of pediatric inflammatory bowel disease patients and controls,” Sci. Rep., vol. 6, no. 32584, 2016.
[205] M. S. Rossi, A. A. Boada-Sucre, M. T. Simoes, Y. Boher, P. Rodriguez, M. Moreno, M. Ledezma de Ruiz, M. L. Marquez, H. J. Finol, C. Sanoja, and G. Payares, “Adhesion of Trypanosoma evansi to red blood cells (RBCs): Implications in the pathogenesis of anaemia and evasion of immune system,” Diagnostic Pathol. Open, vol. 2, no. 1, 2017.
[206] S. Weis, A. R. Carlos, M. R. Moita, S. Singh, B. Blankenhaus, S. Cardoso, R. Larsen, S. Rebelo, S. Sch?uble, L. Del Barrio, G. Mithieux, F. Rajas, S. Lindig, M. Bauer, and M. P. Soares, “Metabolic adaptation establishes disease tolerance to sepsis,” Cell, vol. 169, pp. 1263–1275–e7, 2017.
[207] U. Schmitz and O. Wolkenhauer, Eds., Methods in Molecular Biology, Vol. 1386: Systems Medicine. New York: Springer Science & Business Media, 2016.
[208] B. F. C. Kafsack and M. Llinás, “Eating at the table of another: Metabolomics of host-parasite interactions,” Cell Host Microbe, vol. 7, pp. 90–99, 2010.
[209] M. Jain, R. Nilsson, S. Sharma, N. Madhusudhan, T. Kitami, A. L. Souza, R. Kafri, M. W. Kirschner, C. B. Clish, and and V. K. Mootha, “Metabolite profiling identifies a key role for glycine in rapid cancer cell proliferation,” Science (80-. )., vol. 336, no. 6084, pp. 1040–1044, 2012.
[210] L. Willmann, T. Erbes, S. Halbach, T. Brummer, M. Jäger, M. Hirschfeld, T. Fehm, H. Neubauer, E. Stickeler, and B. Kammerer, “Exometabolom analysis of breast cancer cell lines: Metabolic signature,” Sci. Rep., vol. 5, p. 13374, 2015.
[211] C. T. Haas, J. K. Roe, G. Pollara, M. Mehta, and M. Noursadeghi, “Diagnostic ‘omics’ for active tuberculosis,” BMC Med., vol. 14, no. 37, 2016.
[212] S. Holtfreter, J. Kolata, S. Stentzel, S. Bauerfeind, F. Schmidt, N. Sundaramoorthy, and B. Bröker, “Omics approaches for the study of adaptive immunity to Staphylococcus aureus and the selection of vaccine candidates,” Proteomes, vol. 4, no. 11, 2016.
[213] D. J. Beale, A. V. Karpe, W. Ahmed, S. Cook, P. D. Morrison, C. Staley, M. J. Sadowsky, and E. A. Palombo, “A community multi-omics approach towards the assessment of surface water quality in an urban river system,” Int. J. Environ. Res. Public Health, vol. 14, no. 3, 2017.
[214] C. Sánchez-Ovejero, F. Benito-Lopez, P. Díez, A. Casulli, M. Siles-Lucas, M. Fuentes, and R. Manzano-Román, “Sensing parasites: Proteomic and advanced bio-detection alternatives,” J. Proteomics, 2016.
[215] M. K. Aurich, G. Paglia, O. Rolfsson, S. Hrafnsdottir, M. Magnusdottir, M. M. Stefaniak, B. Palsson, R. M. T. Fleming, and I. Thiele, “Prediction of intracellular metabolic states from extracellular metabolomic data,” Metabolomics, vol. 11, pp. 603–619, 2015.
[216] D. Beale, K. Kouremenos, and E. Palombo, Eds., Microbial Metabolomics: Applications in Clinical, Environmental, and Industrial Microbiology. Switzerland: Springer International Publishing, 2016.
[217] G. B. Tristão, L. P. Assunção, L. P. A. dos Santos, C. L. Borges, M. G. Silva-Bailão, C. M. de Almeida Soares, G. Cavallaro, and A. M. Bailão, “Predicting copper-, iron-, and zinc-binding proteins in pathogenic species of the Paracoccidioides genus,” Front. Microbiol., vol. 5, no. 761, 2015.
138
[218] N. M. Stasulli and E. A. Shank, “Profiling the metabolic signals involved in chemical communication between microbes using imaging mass spectrometry,” FEMS Microbiol. Rev., vol. 40, pp. 807–813, 2016.
[219] M. Zampieri, K. Sekar, N. Zamboni, and U. Sauer, “Frontiers of high-throughput metabolomics,” Curr. Opin. Chem. Biol., vol. 36, pp. 15–23, 2017.
[220] S. D. Sherrod and J. A. McLean, “Systems-wide high-dimensional data acquisition and informatics using structural mass spectrometry strategies,” Clin. Chem., vol. 62, no. 1, pp. 77–83, 2016.
[221] YANG Yun-Feng, “Omics for environmental microbiology,” Unpubl. Work. Microbiol. CAS, vol. 40, no. 41171201, pp. 18–33, 2013.
[222] J. Allen, H. M. Davey, D. Broadhurst, J. J. Rowland, S. G. Oliver, and D. B. Kell, “Discrimination of modes of action of antifungal substances by use of metabolic footprinting,” Appl. Environ. Microbiol., vol. 70, no. 10, pp. 6157–6165, 2004.
[223] A. Barrick, A. Châtel, M. Bruneau, and C. Mouneyrac, “The role of high-throughput screening in ecotoxicology and engineered nanomaterials,” Environ. Toxicol. Chem., vol. 9999, no. 9999, pp. 1–11, 2017.
[224] T. L. Swenson, U. Karaoz, J. M. Swenson, B. P. Bowen, and T. Northen, “Linking soil biology and chemistry using bacterial isolate exometabolite profiles,” bioRxiv, 2017.
[225] H. A. Filyk and L. C. Osborne, “The multibiome: the intestinal ecosystem’s influence on immune homeostasis, health, and disease,” EBioMedicine, vol. 13, pp. 46–54, 2016.
[226] K. L. Olszewski, J. M. Morrisey, D. Wilinski, J. M. Burns, A. B. Vaidya, J. D. Rabinowitz, and M. Llinás, “Host-parasite interactions revealed by Plasmodium falciparum metabolomics,” Cell Host Microbe, vol. 5, pp. 191–199, 2009.
[227] I. W. Mak, N. Evaniew, and M. Ghert, “Lost in translation: animal models and clinical trials in cancer treatment,” Am. J. Transl. Res., vol. 6, no. 2, pp. 114–118, 2014.
[228] P. Kennedy and J. Stajich, “Twenty-first century mycology: a diverse, collaborative, and highly relevant science,” New Phytol., vol. 205, pp. 23–26, 2015.
[229] F. Gross and M. MacLeod, “Prospects and problems for standardizing model validation in systems biology,” Prog. Biophys. Mol. Biol., 2017.
[230] A. E. Teschendorff, P. Sollich, and R. Kuehn, “Signalling entropy: a novel network-theoretical framework for systems analysis and interpretation of functional omic data,” Methods, vol. 67, no. 3, pp. 282–293, 2014.
[231] C. Gustafsson and J. Vallverdú, “The best model of a cat is several cats,” Trends Biotechnol., vol. 34, no. 3, pp. 207–213, 2016.
[232] R. Greek and A. Menache, “Systematic reviews of animal models: Methodology versus epistemology,” Int. J. Med. Sci., vol. 10, pp. 206–221, 2013.
[233] V. G. Lilly, The Physiology of the Fungi. New York: McGraw-Hill, 1951.
[234] B. H. Ownley, K. D. Gwinn, and F. E. Vega, “Endophytic fungal entomopathogens with activity against plant pathogens: Ecology and evolution,” BioControl, vol. 55, no. 1, pp. 113–128, 2010.
[235] L. R. Jaber and B. H. Ownley, “Can we use entomopathogenic fungi as endophytes for dual biological control of insect pests and plant pathogens?,” Biol. Control, vol. 107, pp. 50–59, 2017.
[236] M. C. González-Chávez, R. Carrillo-González, S. F. Wright, and K. A. Nichols, “The role of glomalin, a protein produced by arbuscular mycorrhizal fungi, in sequestering potentially toxic elements,” Environ. Pollut., vol. 130, no. 3, pp. 317–323, 2004.
[237] C. Talavera-López, B. Andersson, A. Reid, A. Bancroft, S. Nichol, and A. Tracey, “Parasite genomics—Time to think bigger,” PLoS Negl. Trop. Dis., vol. 11, no. 4, p. e0005463, 2017.
[238] A. Krabberød, M. Bjorbækmo, K. Shalchian-Tabrizi, and R. Logares, “Exploring the oceanic microeukaryotic interactome with metaomics approaches,” Aquat. Microb. Ecol., vol. 79, pp. 1–12, 2017.

139
[239] N. A. Abreu and M. E. Taga, “Decoding molecular interactions in microbial communities,” FEMS Microbiol. Rev., vol. 40, pp. 648–663, 2016.
[240] G. Winter and J. O. Krömer, “Fluxomics – connecting ’omics analysis and phenotypes,” Environ. Microbiol., vol. 15, no. 7, pp. 1901–1916, 2013.
[241] S. G. Wu, Y. Wang, W. Jiang, T. Oyetunde, R. Yao, X. Zhang, K. Shimizu, Y. J. Tang, and F. S. Bao, “Rapid prediction of bacterial heterotrophic fluxomics using machine learning and constraint programming,” PLoS Comput. Biol., vol. 12, no. 4, p. e1004838, 2016.
[242] C. Salon, J.-C. Avice, S. Colombié, M. Dieuaide-Noubhani, K. Gallardo, C. Jeudy, A. Ourry, M. Prudent, A.-S. Voisin, and D. Rolin, “Fluxomics links cellular functional analyses to whole-plant phenotyping,” J. Exp. Bot., vol. 68, no. 9, pp. 2083–2098, 2017.
[243] P. Zanzonico, “Noninvasive Imaging for Supporting Basic Research,” in Small Animal Imaging, Basics and Practical Guide, F. Kiessling, B. J. Pichler, and P. Hau, Eds. Springer International Publishing, 2017, pp. 3–32.
[244] P. Le Pogam, B. Legouin, A. Geairon, H. Rogniaux, F. Lohézic-Le Dévéhat, W. Obermayer, J. Boustie, and A.-C. Le Lamer, “Spatial mapping of lichen specialized metabolites using LDI-MSI: Chemical ecology issues for Ophioparma ventosa,” Sci. Rep., vol. 6, no. 37807, 2016.
[245] H. E. Hulme, L. M. Meikle, H. Wessel, N. Strittmatter, J. Swales, C. Thomson, A. Nilsson, R. J. B. Nibbs, S. Milling, P. E. Andren, C. L. Mackay, A. Dexter, J. Bunch, R. J. A. Goodwin, R. Burchmore, and D. M. Wall, “Mass spectrometry imaging identifies palmitoylcarnitine as an immunological mediator during Salmonella Typhimurium infection,” Sci. Rep., vol. 7, no. 2786, 2017.
[246] Y.-N. Ho, L.-J. Shu, and Y.-L. Yang, “Imaging mass spectrometry for metabolites: Technical progress, multimodal imaging, and biological interactions,” Wiley Interdiscip. Rev. Syst. Biol. Med., no. e1387, 2017.
[247] A. Matusch, L. S. Fenn, C. Depboylu, M. Klietz, S. Strohmer, J. A. McLean, and J. S. Becker, “Combined elemental and biomolecular mass spectrometry imaging for probing the inventory of tissue at a micrometer scale,” Anal. Chem., vol. 84, no. 7, pp. 3170–3178, 2012.
[248] M. J. Pushie, I. J. Pickering, M. Korbas, M. J. Hackett, and G. N. George, “Elemental and chemically specific x‐ray fluorescence imaging of biological systems,” Chem. Rev., vol. 114, p. 8499−8541, 2014.
[249] N. De Brier, S. V. Gomand, E. Donner, D. Paterson, E. Smolders, J. A. Delcour, and E. Lombi, “Element distribution and iron speciation in mature wheat grains (Triticum aestivum L.) using synchrotron x-ray fluorescence microscopy mapping and x-ray absorption near-edge structure (XANES) imaging,” Plant. Cell Environ., vol. 39, pp. 1835–1847, 2016.
[250] J. B. Glass, S. Chen, K. S. Dawson, D. R. Horton, S. Vogt, E. D. Ingall, B. S. Twining, and V. J. Orphan, “Trace metal imaging of sulfate-reducing bacteria and methanogenic archaea at single-cell resolution by synchrotron x-ray fluorescence imaging,” Geomicrobiol. J., 2017.
[251] T. Sasaya, N. Sunaguchi, T.- Thet-Lwin, K. Hyodo, T. Zeniya, T. Takeda, and T. Yuasa, “Dual-energy fluorescent x-ray computed tomography system with a pinhole design: Use of K-edge discontinuity for scatter correction,” Sci. Rep., vol. 7, no. 44143, 2017.
[252] H. Haas, M. Eisendle, and B. G. Turgeon, “Siderophores in fungal physiology and virulence,” Annu. Rev. Phytopathol., vol. 46, pp. 149–187, 2008.
[253] A. S. A. El-Sayed, S. E. Abdel-Ghany, and G. S. Ali, “Genome editing approaches: manipulating of lovastatin and taxol synthesis of filamentous fungi by CRISPR/Cas9 system,” Appl. Microbiol. Biotechnol., vol. 101, no. 10, pp. 3953–3976, 2017.
[254] R. W. Sterner and J. J. Elser, Eds., Ecological Stoichiometry. Princeton University Press, 2002.
[255] J. Elser, “Biological stoichiometry: a chemical bridge between ecosystem ecology and evolutionary biology,” Am. Nat., vol. 168, pp. S25–S35, 2006.
[256] H. C. Evans, “Coevolution of Entomogenous Fungi and Their Insect Hosts,” in Coevolution of Fungi with Plants and Animals, K. A. Pirozynski and D. L. Hawksworth, Eds. Academic Press, 1988, pp. 149–171.

140
[257] E. Pereyra, M. Ingerfeld, N. Anderson, S. L. Jackson, and S. Moreno, “Mucor rouxii ultrastructure: Cyclic AMP and actin cytoskeleton,” Protoplasma, vol. 228, no. 4, pp. 189–199, 2006.
[258] E. Pereyra, V. Zaremberg, and S. Moreno, “Effect of dibutyryl-cAMP on growth and morphology of germinating Mucor rouxii sporangiospores,” Exp. Mycol., vol. 16, pp. 93–101, 1992.
[259] J. P. Grime, “Evidence for the existence of three primary strategies in plants and its relevance to ecological and evolutionary theory,” Am. Nat., vol. 111, no. 982, pp. 1169–1194, 1977.
[260] J. P. Grime, “Vegetation classification by reference to strategies,” Nature, vol. 250, no. 5461, pp. 26–31, 1974.


![Colbie Caillat - Realize[1]](https://static.fdocuments.us/doc/165x107/563db99a550346aa9a9ee39a/colbie-caillat-realize1.jpg)