Agricultural and Biological Engineering SWFREC, UF/IFAS Immokalee.

The Pennsylvania State University
The Graduate School
Agricultural & Biological Engineering Program
MONENSIN DEGRADATION IN STOCKPILED DAIRY MANURE
A Thesis in
Agricultural & Biological Engineering
by
Maurice T. Washington
© 2012 Maurice T. Washington
Submitted in Partial Fulfillment
of the Requirements
for the Degree of
Master of Science
August 2012
The thesis of Maurice T. Washington was reviewed and approved* by the following:
Herschel Elliott
Professor of Agricultural & Biological Engineering
Thesis Advisor
Robert Graves
Professor of Agricultural & Biological Engineering
Jud Heinrichs
Professor of Dairy and Animal Science
Paul Heinemann
Professor & Department Head
Head of the Agricultural & Biological Engineering of Department
*Signatures are on file in the Graduate School

iii
ABSTRACT
Antibiotics are commonly used in livestock production for growth promotion and parasite
control. A significant fraction of the administered antibiotics is excreted in manure rather than being
metabolized by the animal. Commonly, livestock manures are stored in lagoons or stockpiled prior to
disposal by land application. In recent years, the prevalence of veterinary antibiotics and their fate in
the environment has become a topic of concern. The environmental impacts of manure-borne
antibiotics have not been fully elucidated. The major concerns are the development of antibiotic
resistance and direct toxic effects on organisms in the terrestrial and aquatic environments. The
occurrence and fate of monensin in the environment related to dairy manure management has not been
fully studied.
Monensin is an ionophore antibiotic used widely in dairy production. Monensin’s
classification as a growth amplifier allows it to be considered a marker for agricultural pollution when
found in the environment. Therefore, the focus of this research was to quantify the degradation of
monensin in stored dairy manure using composting and stockpiling. First, stockpiles were left
undisturbed (SP treatments). The second treatment involved turning the piles at day-6 to simulate
composting management (CP treatments). Additional turning of piles was initially planned, however,
was not done because of pile size and the risk of losing additional pile heat prematurely.
The dairy manure was initially blended with oat straw and wood chips to achieve moisture
content and carbon-to-nitrogen ratio of approximately 60% and 28, respectively. These conditions are
considered ideal for microbial activity and, in turn, degradation of compounds like monensin.
Amended manure was segregated into piles roughly 2.3 m3 (3 yd
3) each and the monensin
concentration was monitored over a 50-day period. Total monensin (water extractable plus methanol
extractable) analysis was conducted using enzyme-linked immunosorbent assay (ELISA) analysis.
Pile temperature and organic matter content were also recorded periodically over the experimental
period.
A reduction in monensin concentration was observed with time for both treatments.
Assuming first-order monensin degradation, the calculated average half-lives were 57.8 d (compost)
and 13.6 d (static). Monensin seemed to dissipate by day 10 in the methanol extractable fraction but

iv
the water extractable concentration persisted to day 16. There were only three piles (CP2, CP4, and
SP1) that had measurable concentrations of water extractable monensin on the last day of sampling
(day 50). Overall, the water extractable form made up 77.9% (compost) and 83.8% (static) of total
monensin.
The original intent of this study was not to quantify runoff. But due to heavy rainfall and
elevated MC, runoff was observed from both treatments. Monensin was detected in runoff from both
treatments. Runoff from the compost treatments averaged 4.04 ng mL-1
, while static treatments
averaged 3.98 ng mL-1
. These values were in the lower range of concentrations reported in literature
for runoff containing monensin. Approximately 142 mm of rainfall occurred between sampling days
16 – 50. The runoff volume from the compost was 1,852 L and 1,701 L from the static treatments. A
mass balance estimate revealed that runoff losses accounted for < 2 % of monensin remaining at day
16 in both the compost and static treatments. Therefore, even though runoff did occur, the majority of
the monensin lost from the piles between days 16 and 50 can be attributed to degradation.
Previous studies have used spiked manure samples which resulted in higher and more easily
measured monensin levels. In contrast, this study used manure with monensin at levels actually
excreted from dairy cattle. The finding of a longer half-life for the compost treatment was unexpected.
It is likely a reflection of the difficulties experienced in measuring monensin at extremely low, but
environmentally relevant, levels. These results suggest monensin may be an environmental concern in
the aqueous phase. Monensin levels can be degraded using manure management before land
application, but piles should be covered to prevent runoff generation. Understanding the degradation
behavior of monensin in dairy manure will contribute to our understanding of its fate in environmental
systems and could provide insights into practical manure management methods that can be used in
dairy production.

v
TABLE OF CONTENTS
List of Figures .......................................................................................................................... vii
List of Tables ........................................................................................................................... viii
Acknowledgements .................................................................................................................. ix
Chapter 1 Background and Justification ................................................................................ 1
Chapter 2 Literature Review .................................................................................................. 4
2.1 Background ............................................................................................................... 4
2.1.1 Use of Antibiotics in Dairy Production .............................................................. 4 2.1.2 Sources of Dairy Production Antibiotics and Their Exposure Routes ............... 7
2.1.3 Regulation of Antibiotics in Livestock Production ............................................ 9
2.2 Scope of Ionophore Antibiotic Problem .................................................................. 9
2.3 Occurrence, Transport, and Fate of Monensin in the Environment ......................... 10
2.3.1 Monensin ............................................................................................................ 10
2.3.2 Properties of Monensin ...................................................................................... 12
2.3.3 Human Health Concerns of Monensin ............................................................... 13
2.3.4 Occurrence, Transport, and Fate of Monensin and its Impact on the Envr ........ 13
2.3.5 Monensin Degradation Chemistry………………………………………….…..19
2.4 Remediation of Antibiotics through Composting .................................................... 21
2.5 Gaps in Knowledge .................................................................................................. 24
Chapter 3 Goals, Objectives, Hypothesis ................................................................................. 25
3.1 Research Goals ......................................................................................................... 25
3.2 Objectives ................................................................................................................ 26
3.3 Hypothesis ................................................................................................................ 26
Chapter 4 Methodology ........................................................................................................... 27
4.1 Site Description ....................................................................................................... 27
4.2 Summary of Dairy Operations ................................................................................ 28
4.3 Construction of Compost and Static Piles ............................................................... 29

vi
4.3.1 Raw Materials .................................................................................................... 29
4.3.2 Treatments .......................................................................................................... 31
4.4 Installation of Temperature Probes ......................................................................... 32
4.5 Sample Technique and Storage ............................................................................... 33
4.5.1Sample Preparation from Field ........................................................................... 34
4.6 Sample Ananlysis .................................................................................................... 34
4.6.1 Monensin Ananlysis ........................................................................................... 34
4.6.2 Sample Preparation for Monensin Analysis ....................................................... 36
4.7 Data Compilation and Analysis .............................................................................. 36
4.7.1 Data Recording and Processing ......................................................................... 36
4.7.2 Statistical Analysis ............................................................................................. 37
Chapter 5 Results and Discussion ............................................................................................ 38
5.1 Monensin in Dairy Manure ..................................................................................... 38
5.2 Temperature ............................................................................................................ 38
5.3 Moisture Content, Rainfall, and Organic Matter .................................................... 42
5.4 Monensin Degradation ............................................................................................ 45
Chapter 6 Conclusions ............................................................................................................. 50
6.1 Implications of this study ........................................................................................ 50
Appendix A:Temperature Profiles of Treatment Piles ............................................................. 53
Appendix B: Organic Matter Profiles ...................................................................................... 57
Appendix C: Monensin Concentration by extraction Technique ............................................. 59
Appendix D: Mass Balance Calulations .................................................................................. 61
References ................................................................................................................................ 67
vii
LIST OF FIGURES
Figure 2-1: Potential exposure pathways for antibiotics used in dairy farming. ..................... 8
Figure 2-2: Anticipated exposure routes of monensin. ........................................................... 14
Figure 2-3: Chemical struture of monensin, factors, and metabolites...................................... 20
Figure 4-1: Schematic of compost site for composting and stockpiling of dairy manure. . 27
Figure 4-2: Schematic of freestall Holstein heifer barn . 28
Figure 4-3: First pass of the vertical mixer . 31
Figure 4-4: Mixing of second batch 31
Figure 4-5: Third pass of the vertical mixer . 31
Figure 4-6: Mixing of the third batch . 31
Figure 4-7: Turning of compost pile . 32
Figure 4-8: Schematic of iButton placement in each pile . 33
Figure 5-1: Temperature profiles of compost and static treatments . 41
Figure 5-2: Average total-ext monensin concentration of compost piles versus time. 46
Figure 5-3: Average total-ext monensin concentration of static piles versus time 47
viii
LIST OF TABLES
Table 2-1: Common bacterial targets of antibiotics. ................................................................ 7
Table 2-2: Reported monensin concentrations from various studies 17
Table 4-1: Batch mixing recipes 30
Table 4-2: Summary of linear equations for ELISA kits 35
Table 5-1: Compost pile temperature variations 40
Table 5-2: Static pile temperature variations 40
Table 5-3: Compost treatment moisture content and cumulative rainfall totals 42
Table 5-4: Static treatment moisture content and cumulative rainfall totals 43
Table 5-5: Organic matter content of compost treatments 44
Table 5-6: Organic matter content of static treatments 45
Table 5-7: First-order average rate constant and half-life of total-ext monensin 45
Table 5-8: Monensin concentration totals by extraction method 48

ix
ACKNOWLEDGEMENTS
First and foremost, I would like to thank God, for giving me the opportunity to work towards my
degree aspirations. I’m thankful for all of the adversity and challenges that I have faced throughout this
process. I would like to thank my advisor, Dr. Herschel Elliott. I appreciate the time you have invested
in me. I believe your guidance has made me not only a stronger researcher but more importantly, a
stronger person. Thanks to my other committee members: Dr. Graves and Dr. Heinrichs. I appreciate the
help you have given me along the way.
A special thanks goes out to Maria Long, Nadine Davitt. Maria, thank you for tutelage and
instruction, you were my savior in the lab. Nadine, you went above and beyond with the logistics of this
project. Without you, there would be no project. To my friends and colleagues, especially: Dan
Hofstetter, Mile Hile, Senorpe Asem-Hiablie, and Jyotsna Pandy. Thank you all for being a sounding
board for ideas and just being supportive of me. Many thanks go to the Agricultural and Biological
Engineering department for your continued support and giving me the opportunity to pursue my graduate
degree.
Finally, I would like to thank my family, who has always been supportive of my dreams and
academic goals. This M.S. degree is dedicated to my grandmother for all she has sacrificed and continues
to do for me. I hope I have made them all proud.

Chapter 1
Background and Justification
Agriculture plays a large contributing role in non-point pollution of both the terrestrial and
aquatic environments and this is no different in Pennsylvania. Dairy production is the number one
agricultural industry in Pennsylvania and the state ranks fifth nationally in total milk production. As with
other livestock types, manure handling, storage and application can be troublesome in production
operations. Thus, proper manure management is one of the major issues currently facing the dairy
industry.
The use of pharmaceuticals, specifically antibiotics in veterinary and human medicine, and their
sub- sequent effects on the environment are now emerging issues. Antibiotics are poorly absorbed in the
body of dairy animals resulting in the majority (40% – 90%) of the administered compound being
excreted in urine or feces, which end up in manure (Kumar et al., 2005). Antibiotic concentrations found
in the manure range from trace levels to > 200 mg kg-1
, with typical concentrations ranging anywhere
from 1 mg kg -1
– 10 mg kg -1
(Kumar et al., 2005). As in many countries, manure in the U.S. is often
land applied as a source of nutrients for crops and as a means of disposal.
Manure is rich in nitrogen (N), phosphorus (P), potassium (K) and micronutrients, making it a
valuable resource for crop production. However, manure that is improperly managed poses a burden to
the farming operation and can be problematic to aquatic environments. In the U.S., land application of
manure is the most widespread method of disposal with storage in lagoons or pits being other viable
options. It is estimated that in dairy production, more than 90% of manure is stockpiled as a temporary
management technique (Meyer, 1997). According to the 2007 Agricultural Census, there were over 22
million acres of farmland treated by manure, a slight decrease from the 2002 Agricultural Census (USDA-
NASS, 2007). The occurrence of soil, sediment, or crop contamination and pollution of surface and
groundwater are possible with land application as a disposal method. For example, cases exist in which
manure contaminated with antibiotics from Concentrated Animal Farming Operations (CAFOs) have
reached both surface and groundwaters (CDC, 1998). In 2002, a reconnaissance study conducted on
rivers across the United States found that approximately 80% of streams contained antibiotics and

2
hormones (Koplin et al., 2002). With such a large area of agricultural land used for manure application,
the risk of antibiotics or other pharmaceuticals entering the environment is large.
The exposure routes of these pharmaceuticals vary depending on their source. Pharmaceuticals
that are present in agricultural areas typically arise from two sources: veterinary pharmaceuticals
administered to livestock and pharmaceuticals introduced to lands via application of biosolids from
wastewater treatment plants (WWTP). Several of the larger municipalities such as Chicago, Houston,
Washington D.C., and Milwaukee have biosolids land application programs.
The antibiotics used in animal production are excreted in manure. By definition, manure is fresh
feces and urine (ASAE Standards 2005). The manure is then directly applied to agricultural fields or held
in a storage tank until application. Once applied the antibiotics in the manure will either degrade or
persist in the soil, run off in surface water, leach into groundwater, or be taken up by crops. Once applied
to the soil, most antibiotics become unstable, but this depends on the antibiotic itself as well how long it
takes for the antibiotic to degrade and binding capabilities of the antibiotic and the soil. According to
Venglovsky et al., (2009), “Antibiotics that bind strongly to soil and have shorter half-lives can be
completely degraded within the soil and are not usually detected in ground water, surface water, or plants.
For those antibiotics that bind strongly to soil yet have long half-lives, there is also a concern that these
drugs could be taken up by plants.”
The foremost issue regarding the use of antibiotics in animal production is the development of
resistant bacterial strains, which represents a health risk to both humans and animals. According to the
Center for Disease Control (CDC), bacteria become resistant to antibiotics through several mechanisms:
sharing of genetic information, ability to neutralize an antibiotic, and ability to change the antibiotic
attack site by mutation (CRS, 2010).
The antibiotic of concern in this study is monensin (C36H62O11). Monensin is a sub-therapeutic
antibiotic used predominately in dairy production. Studies have shown monensin’s potential toxicity to
several species of livestock. Though monensin is used strictly in agriculture, the occurrence of bacterial
resistance is still a concern in the veterinary field. Monensin presents no health risk as far as bacterial
resistance to humans, however monensin is very toxic to humans if ingested (ELANCO Animal Health,
2010).

3
There exist several routes by which humans can possibly be exposed to antibiotic residues. The
first route involves the consumption of crops that have accumulated antibiotic residues from soil amended
with contaminated manure. The next route occurs through the consumption of livestock that have
accumulated antibiotic residues through the food chain. Last, but not least, the consumption of
contaminated surface or groundwater by humans is another concern. Even though strenuous monitoring
of food from treated livestock is required, the health impacts of the aforementioned exposure routes have
not been quantified. If these foods are ingested, there could possibly be some allergic or toxic reactions to
a particular antibiotic. This especially may be the case when a person is using one antibiotic
therapeutically and ingest another antibiotic through residues within food and water.
This project is primarily concerned with the fate of sub-therapeutic pharmaceuticals. Since land
application is used as a disposal method for manure, one means of reducing the environmental impact of
manure-borne antibiotics is to treat the manure prior to land application. One practical treatment solution
is composting. This proposed research will focus on the degradation of monensin through composting
compared to stockpiling as the conventional manure management option. Currently only a few studies
(Cessna et al., 2011; Ramaswamy et al., 2010; Dolliver et al. 2008a, 2008b; Storteboom et al. 2007) have
investigated antibiotic degradation of livestock manures during composting. This research will focus on
the degradation of monensin in dairy manure.

Chapter 2
Literature Review
The occurrence and fate of sub-therapeutic antibiotics in the environment and their potential
environmental risk has become a topic of concern in recent years. Antibiotics are used predominately as
growth promoters in livestock production. Most of the antibiotics are administered to healthy livestock.
These antibiotics are not fully absorbed by livestock and are excreted into manure. Animal manure
application to agricultural lands is a common manure management practice. The concern lies with the
introduction of antibiotics into the environment by different pathways could have adverse effects on the
terrestrial and aquatic environments. The occurrence, transport and fate of several of these antibiotics
have been documented, but further research is required. According to Kumar et al. (2005), Barsaraba et
al. (1999) stated: “ionophore antibiotics such as monensin, that are specifically used in agriculture have
been documented as causing adverse reactions when used in conjunction with other antibiotics.” Finding
monensin in the environment can be directly linked as an indicator of agricultural pollution. A study to
evaluate the performance of composting versus stockpiling of dairy manure to determine conditions
necessary for monensin degradation could provide insights into composting as a practical method for
mitigating the adverse effects of monensin in the environment.
2.1 Background
2.1.1 Use of Antibiotics in Dairy Production
With the increasing world population, diminishing agricultural lands, and the escalating demand
for food, livestock production has become more intensive. This intensive production has led to the
increased use of antibiotics as a common practice with livestock production. In the United States, 12.6
thousand metric tons of antibiotics were sold for animal use in 2007 (Watanabe et al., 2010). Antibiotics
are drugs that are used to block, inhibit the growth of, or kill bacteria. Antibiotics are a category of
antimicrobials and are derived from naturally occurring microorganisms. These microorganisms have the
ability to produce natural compounds, which interfere with or kill competing microbes. Most antibiotics

5
mimic these actions by different pathways. The cause for concern with antibiotic use in livestock
production is the potential for antibiotic resistance. This resistance could occur through resistant bacteria
being transferred through the environment or by ingestion of livestock. The use of these antibiotics and
their effect on the environment has become an emerging issue that still requires much research.
According to McAllister et al. (2001), Foley et al. (1946) stated: “antibiotics have been used in
livestock production for over 50 years” and reported 1946 as the first recorded use of antibiotics in dairy
cattle for treatment of mastitis. Antibiotic use is classified under three treatment categories in dairy
production; therapeutic, sub-therapeutic and prophylactic. Therapeutic treatment addresses an existing
condition, sub-therapeutic is used to amplify production, and prophylactic treatment is used during times
of high disease risk. Most antibiotics in dairy production are administered therapeutically but the focus of
this paper will be on ionophores, which are administered as sub-therapeutic treatments. The most
accepted theory on antibiotic resistance is that sub-therapeutic (long-term, low dose) use of antibiotics
will more likely stimulate antibiotic resistance (McAllister et al., 2001). Since low doses are used, this
allows more bacteria to withstand the initial antibiotic application. This greatly increases the chances of
continued bacterial growth due to the low antibiotic concentrations. Also, the effectiveness of an
antibiotic is reliant on the physiological characteristics of the target bacteria. For example, using an
antibiotic on a bacterial infection for which it is not intended may induce antibiotic resistance by that
target bacteria.
In dairy production, several common families of antibiotics are prevalent. These families include
ionophores (monensin, lasalocid, salinomycin), macrolides (erythromycin and tylosin) tetracyclines and
the more commonly known penicillins (penicillin G, ampicillin and cloaxcillin). Ionophores, macrolides
and tetracyclines all derive from the coagulase-negative staphylococci family of pathogens, which are
associated with mastitis. The penicillins derive from the Penicillium spp. As mentioned, mastitis was the
first disease treated by antibiotics in dairy production. Mastitis is still a common disease today in most
dairies. This further supports that no antibiotic is completely effective in killing bacteria because of the
complexity of the bacterial communities in agricultural settings. Antibiotics can only mediate most
diseases and the survival of most bacteria in the environment will continue.

6
The United States Department of Agriculture, National Animal Health Monitoring System
(NAHMS) report on Antibiotic Use on U.S. Dairy Operations, 2002 and 2007 (USDA-NAHMS, 2008)
stated that:
“Mastitis was the most common disease in cows for which antibiotics were used.
Cows with mastitis were treated with antibiotics by about 85 percent of
operations.”
“About 60 percent of operations used antibiotics to treat pre weaned heifers for
disease, primarily respiratory disorders and diarrhea or other digestive
problems.”
The use of ionophores by U.S. dairy operations remained the same from 2002 to
2007 at 45 percent.
The NAHMS report consisted of data from 17 of the nation’s major dairy production states
including Pennsylvania. These 17 states represent 79.5% of all U.S. dairy operations and 82.5% of all
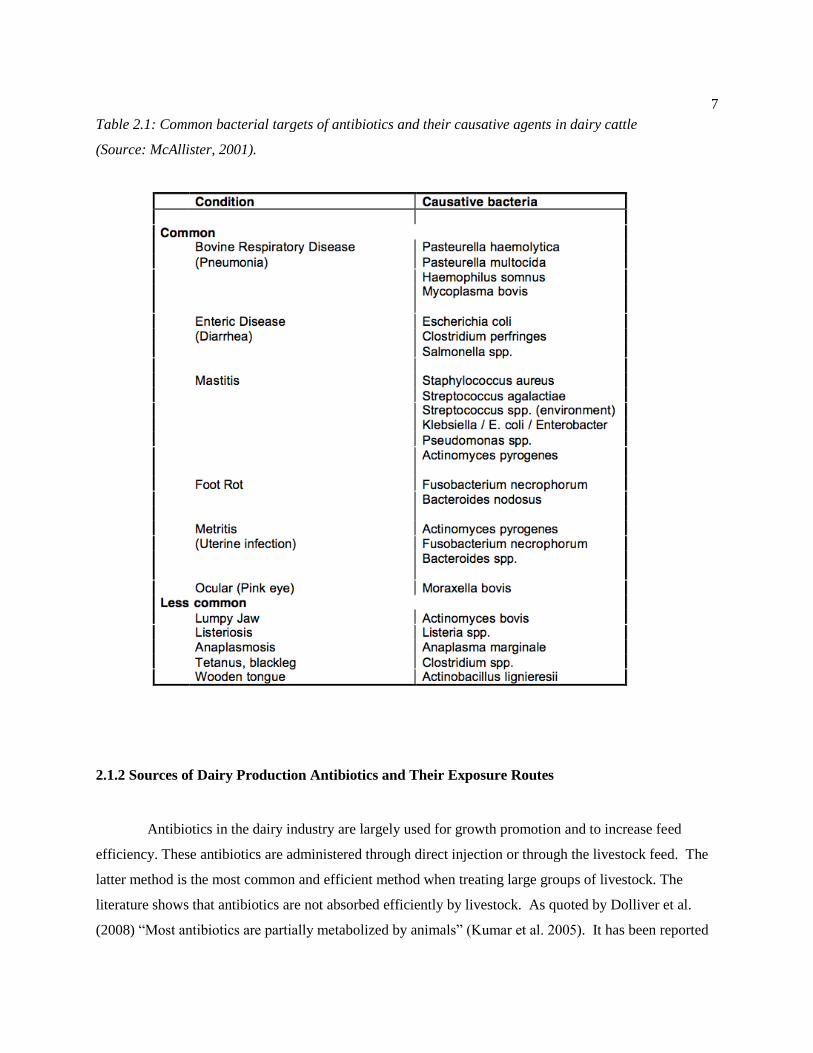
dairy cows in the U.S. Table 2.1 lists some of the other diseases common in dairy production and the
causative bacteria.
7
Antibiotics in the dairy industry are largely used for growth promotion and to increase feed
efficiency. These antibiotics are administered through direct injection or through the livestock feed. The
latter method is the most common and efficient method when treating large groups of livestock. The
literature shows that antibiotics are not absorbed efficiently by livestock. As quoted by Dolliver et al.
(2008) “Most antibiotics are partially metabolized by animals” (Kumar et al. 2005). It has been reported
Table 2.1: Common bacterial targets of antibiotics and their causative agents in dairy cattle
(Source: McAllister, 2001).
2.1.2 Sources of Dairy Production Antibiotics and Their Exposure Routes

8
that roughly 75% of antibiotics administered to livestock are not absorbed and are excreted in urine and
feces (Chee-Sanford et al., 2009).
Manure consist of urine, feces, bedding, spilled feed, water and sometimes soil. Metabolites or
antibiotic residues reach terrestrial and aquatic environments by direct or indirect means. These residues
are directly applied on the land by excretion onto pastures by livestock and are directly applied with
manure application onto agricultural lands. According to the pharmacokinetics and pharmacodynamic
parameters of the livestock and the characteristics of the antibiotics or metabolites, the excretion and
spread in the environment occurs through different exposure pathways (Kemper, 2008). The antibiotics
or metabolites in the manure will either degrade in the soil, remain in the soil profile, run off with surface
water, leach into groundwater, or be taken up by crops. Figure 2.1 shows a typical exposure pathway
flow chart for antibiotics used in livestock production.
Figure 2.1: Potential exposure pathways for antibiotics used in animal production
(Source: Kemper, 2007).
9
2.1.3 Regulation of Antibiotics in Livestock Production
There are limited U.S. regulations on antibiotic use in livestock production compared to other
countries. The Center for Veterinary Medicine (CVM), a center under the Food and Drug Administration
(FDA) umbrella is in charge of regulating the manufacturing and distribution of drugs for all animals,
including livestock. The CVM has authority to approve new animal treatments based on a similar criteria
used in the approval process for human medicines. In 1996 the Centers for Disease Control (CDC) began
a collaborative effort with the FDA and the U.S. Department of Agriculture (USDA) to collect
antimicrobial resistance data. This collaborative effort was named the National Antimicrobial Resistance
Monitoring System (NARMS) and is aimed at monitoring resistance among food borne bacteria isolated
from the human population. The most recent NARMS report released in 2006 and shows an increase in
resistance for several bacteria. Even though this collaborative effort exists, currently there are no
regulations pertaining to the presence of antibiotics or similar compounds such as hormones in manure
(Kumar et al., 2005). The FDA currently approves antimicrobials for disease prevention, disease
treatment, disease control, and for growth promotion/feed efficiency. In the U.S. antibiotic use in humans
takes precedence over livestock use, human health is the number one priority. The antibiotics that cause
resistance to the ones that are used as a “last resort” option in human medicine are starting to come under
the greatest scrutiny (McAllister et al., 2001).
In the European Union (EU), some countries like Sweden have banned the use of all sub-
therapeutic antibiotics in livestock production. The EU has established several antibiotic resistance
monitoring programs as well. In 2006 the EU instituted an outright ban on antibiotics used in livestock as
growth promoters. Currently there is an ongoing battle in the U.S. between those who support and those
who want to ban antibiotic use in livestock production.
2.2 Scope of Ionophore Antibiotic Problem
Ionophores are classified as carboxylic polyether antibiotics. Ionophores are a part of a subgroup
of anticoccodials that are exclusively used for livestock production (i.e. cattle, swine, poultry and small
ruminants). In 2009 the Food and Drug Administration’s (FDA) Center for veterinary medicine (CVM)
released a report on Antimicrobials sold or distributed for use in food producing animals. In 2009,
approximately 3,740,627 kg (8,246,671 lbs) of Ionophores were sold and distributed in the U.S. (FDA-
CVM, 2010). The 2009 annual totals represent all approved uses of all dosage forms (injectable, oral,
medicated feed, etc) of ionophores actively marketed for food producing species. Ionophores in this
10
study include (Laidlomycin, Lasalocid, Monensin, Narasin, Salinomycin, and Semduramicin. The
FDA has approved 23 different anticoccodial compounds, which are used as prophylactics for preventing
outbreaks of coccidiosis (Hansen et al., 2009). Ionophores are used worldwide as feed additives for
growth promotion and improved feed efficiency. The most common ionophores used in livestock
production are monensin (Rumenson ®), lasalocid (Bovatec ®), laidlomycin (Cattlyst ®) and
salinomycin (Sacox ®). Ionophores allow sodium and potassium to pass through cell membranes in
exchange for protons, resulting in the disruption of the ion gradient, which causes cell death.
Ionophores have not been thoroughly studied and their widespread use warrants an in- depth
investigation to determine their occurrence and fate in the environment. Berton et al. (1982) stated, “The
practice of feeding livestock ionophores takes on a particular significance in that it ultimately introduces
powerful pharmacological agents into man’s food supply.” From a few studies, ionophores are shown to
be emerging contaminants that prevail in soil, surface water, ground water, manure, and sediments.
Ionophores have the tendency to exhibit higher toxicities than those of other antibiotics. The LD50 in
adult rats for lasalocid and monensin are 100 and 35 mg kg -1
, respectively. These values approach that of
the well-known poison potassium cyanide, which has a LD50 of 10 mg kg-1
(Sassman and Lee, 2007). As
documented by Sassman and Lee (2007), a number of other antibiotics, such as erythromycin and
sulfametazine, when interacting with ionophores, enhance ionophore toxicity.
2.3 Occurrence, Transport, and Fate of Monensin in the Environment
2.3.1 Monensin
Monensin is a polyether ionophore used strictly in animal production. Monensin use accounts for
roughly 13% of the sub-therapeutic livestock pharmaceutical usage in the U.S. (Dolliver et al., 2007).
According to Purevjav, 2011; monensin is the most widely used inonophore with sales over $ 100
million. The use of ionophores such as monensin has been estimated to have a positive cost-to-benefit
ratio, saving the cattle industry approximately $ 1 billion per year (Callaway et al., 2003).
The Streptomyces cinnamonensis microorganism produces monensin. The fermentation of
Streptomyces cinnamonensis generates antibiotic factors, i.e.(homologues). Factors have the same

11
functional group but differ in composition. Monensin generates four factors: A, B, C, and D.
Monensin A is the major antibiotic factor of monensin, occurring >90 percent of the time.
Monensin has a unique structural makeup, which includes; a free carboxlic acid group, cyclic ethers, and
several oxygen containing functions. Its’ unique structural characteristics enable monensin to form cyclic
compounds with cations and allows for free movement across biological membranes. It is that free
movement which allows monensin to inactivate gram-positive microorganisms by interfering with the ion
transport mechanism of microorganisms in the gastrointestinal tract thereby leading to cell death. The
free movement across the biological membranes are facilitated by monensin attaching to the bacteria and
protozoa (McGuffey et al. 2001). As a result, monensin provides a more hospitable environment for
certain microorganims against bacteria and protozoa. The metabolism of those microorganisms then
benefits the cattle, resulting in increased performance in production efficiency.
Utilized mainly as a growth promoter, monensin is also used for the treatment and prevention of
coccidiosis. Coccidiosis is a disease caused by parasites in the intestinal tract of livestock with diarrhea
being the main symptom. In some cases coccidiosis can be asymptomatic, and in the worst-case scenario
can cause death in young livestock. Research has shown that the biological actions of monensin in cattle
cause increased efficiency of energy metabolism, increased milk production, reduction of digestive
disorders, changes in gas production, and improved protein metabolism. Monensin increases energy
metabolism efficiency by diverting hydrogen to other end products. These end products are then able to
attract more digestible energy away from fermented organic matter (OM) in the gastrointestinal tract and
results in efficient use of feed energy (McGuffey et al., 2001). Monensin has also been proven to increase
milk production and decrease milk fat (Odongo et al. 2007, Tedeschi et al. 2003, Phipps et al. 2000).
Monensin has the ability to diminish the effects of digestive disorders (bloat, ketosis, etc) in cattle
because they are able to effect the end products of fermentation, bacteria, and eating behavior (McGuffey
et al., 2001).
Methane is an unavoidable byproduct of OM fermentation in the rumen and ruminants. Research
studies indicate monensin has the ability to reduce methane (CH4) in dairy cattle (Odongo et al., 2007;
Muller et al., 2006; Tedeschi et al., 2003; and Schelling, 1984). This is accomplished by adjusting the
acetate:propionate ratio towards propionate, which decreases methane production (Odongo et al., 2007;
Muller et al., 2006; Tedeschi et al., 2003). Protein metabolism is very important in dairy cattle.
Monensin allows for decreased protein metabolism, which results in the increased ability for nitrogen (N)

12
retention in the rumen (Tedeschi et al., 2003; McGuffey et al., 2001; and Schelling, 1984). As a result,
there are less N emissions and N found in fecal matter.
Monensin is used in poultry, beef, dairy and small ruminant production. Monensin has been used
commercially throughout the world for over 30 years. Monensin was first approved for use on broilers in
the U.S. in 1971. Then in 1975, monensin gained approval by the FDA for use in beef cattle production.
The FDA recently (2004) approved monensin for use in U.S. dairy production as a feed additive.
According to Dolliver et al (2008a), “monensin is administered generally in a dry feed additive mixture at
dosages ranging from 5 to 400 grams per ton of feed” (Miller Publishing Company, 2006). Since
monensin is orally fed, it is excreted at very high percentage of intake.
2.3.2 Properties of Monensin
Monensin tends to be hydrophobic in nature, which increases its ability to form lipophilic
complexes with alkali metals in the soil. Despite this hydrophobic property, monensin has been found in
ground water, surface water and river sediments. Carlson and Marbury (2006) concluded that monensin
was immobile, since it was not detected below 25 cm in the soil profile after manure application with a 1
mg kg -1
concentration of monensin along with 78 mm of precipitation. But, according to an
environmental assessment of Rumensin® (Elanco Products Company, 1989), when monensin is
introduced into the environment it has the ability to persist and reach aquifers, due to the slow kinetics of
degradation processes like hydrolysis and photolysis.
The sorption coefficient (Kd) for monensin varies, but all values in the literature (Sassman and
Lee, 2007) fall in the range of 0.915 L kg -1
to 78.6 L kg -1
. That study was done for various soils at an
aqueous phase concentration of 0.05 µmol L -1
. The Kd value reported by Elanco was 9.3 L kg -1
for
sandy loam soils. The reported values of the octanol water-partitioning coefficient (log Kow) of monensin
ranges from about 2.8 to 4.2, reflecting its hydrophobic behavior. The water solubility of monensin
ranges between 0.85 mg L-1
and 63 mg L -1
at pH between 9 and 7, respectively (Elanco Products
Company, 1989).
Several studies have reported on the half-life of monensin in the environment. The half-life of
monensin ranges from 2 to 13.5 d in the soil and in fresh manure (Elanco Products Company, 1989;
Sassman and Lee, 2007; and Carlson and Marbury, 2006). Dolliver et al. (2008a) concluded that the half-
life of monensin in controlled and composted manure treatments ranged from 11 to 23 d, respectively at

13
an initial concentration of 53 g of monensin in 12 m3 of turkey manure. From the literature, there is no
consensus regarding the physiochemical behavior of monensin in the environment, but the half-life
studies seem very consistent. Further research is therefore warranted to document the half-life of
monensin in composted samples.
2.3.3 Human Health Concerns of Monensin
The potential danger of antibiotics to human and animal health has come to the forefront and cannot
be ignored. Due to monensin’s different mode of action in livestock compared to humans, it has never
been used as an antibiotic in human healthcare, but accidental ingestion has been reported. According to
Sekar and Wu (2006), “monensin residues in foodstuffs and environments may have adverse health
effects on human beings because ionophores can exhibit acute pharmacological effects on the
cardiovascular systems.” Monensin can be deadly to humans, a boy died of renal failure and
myoglobinuria from accidental ingesting monensin (Sekar and Wu, 2006). Confirmed reports indicate
that the toxicity of monensin to workers who manufacture, handle, or are regularly exposed to monensin
on a continual basis. Current literature on monenisn use in humans is sparse. The aforementioned cases
are the only documented ones thus far.
2.3.4 Occurrence, Transport, and Fate of Monensin and its Impact on the Environment
Few research studies have evaluated the occurrence, transport, and fate of monensin in
agricultural environments. As quoted by Watanabe et al. (2008) “monensin is a high priority for detailed
risk assessment based on high usage and high toxicity and with an unassessed potential to reach the
environment” (Capelton et al., 2008). From the studies that have been conducted, monensin has been
discovered in ground water, surface water and sediments (Section 2.2.2).
The prevalence of monensin in surface water is due to runoff and leaching through the soil profile
(Figure 2.3). When the soil infiltration rate is exceeded by rainfall then overland flow impacts the way
water-soluble chemicals migrate.

14
Figure 2.2: Anticipated exposure routes of monensin (ionophore antibiotic)
(Source: Hansen et al., 2009).
Watanabe et al., (2008) provided some key findings concerning monensin and ground water that
can be further investigated. This research study was conducted at two dairies located in the Central Valley
of California. The two dairies averaged about 1400 lactating cows, 1300 heifers and 360 dry cows. All
of the water used from the dairies was collected into lagoons and later recycled and used to flush
freestalls. The hydrology of this area allowed for surface irrigation for agricultural purposes. The ground
water levels in this area were very shallow, only 2 m to 5 m in depth at the study site. They indicated
that:
Monensin persisted in high concentrations in the manure transport and manure storage
systems. Monensin concentrations in the lagoon water ranged from 3.91 g L-1
to 16.24
µg L -1
and between 1.89 g L-1
to 3.91µg L -1
in the flush lanes of the dairies.
Monensin was detected in the ground water beneath the dairy production areas of the
farm. The monensin was detected in one shallow monitoring well at Dairy 1 and in three
shallows wells at Dairy 2. The concentration of monensin ranged from 0.04 g L-1
to
0.39 µg L -1
. This demonstrates that monensin has the ability to reach shallow alluvial
ground water.

15
Monensin was not detected in all ground water; the fields in which lagoon manure
water was applied had no detection of monensin in the ground water. This result could
be due to any number of factors such as aerobic surface conditions or the complexity of
the soil biota.
Monensin is hydrophobic in nature, but there has been research conducted showing that
monensin is present in runoff from the soil surface. A study was conducted by Davis et al. (2006)
evaluating the potential for agricultural runoff to the aquatic environment, specifically surface waters. A
solution containing seven antibiotics including monensin, was applied to the study plot 1 h before a
rainfall simulation (60 mm h-1
). The runoff samples were collected on a continuous basis, and the results
showed monensin was the greatest concentration of the seven antibiotics in runoff (1.20 µg L -1
) and the
second highest concentration in sediment (10.5 µg kg -1
). This resulted in monensin having the highest
absolute loss of all the antibiotics tested (Davis et al., 2006). Even though monensin concentrations were
high in sediment, its relative loss due to sediment transport was <10 % (Davis et al., 2006). This study
showed the potential of monensin to persist in the aqueous environment in small volumes but in high
concentrations.
A study conducted by Kim and Carlson (2006) investigated the occurrence of three antibiotics
(monensin, salinomycin and narasin) in a mixed-landscape watershed containing pristine urban and
agricultural lands in Northern Colorado. Five sampling sites were selected, two of which were directly in
the agricultural area. The agricultural area was downstream of the pristine and urban land areas.
Monensin was mainly found at two sample sites in the area of the watershed influenced by agriculture.
Concentrations of monensin were the highest out of all the other antibiotics for in both water and
sediment and were located at sample site five. Monensin concentrations in water were 0.036 µg L -1
and
31.5 µg kg -1
in sediment. Kim and Carlson (2006) state, “a significant difference of measured
concentration among different sampling events indicates that flow conditions and seasonal variability may
effect the concentration of the three ionophore antibiotics.”
Kim and Carlson (2006) used the concept of a pseudo-partitioning coefficient to describe the
relationship between the sediment matrix and the ionophore antibiotic. The sediment concentrations
along with the overlying water concentrations were used to calculate the average pseudo-partitioning
coefficients. At the higher flow conditions, the monensin concentration in the sediment was calculated to
be three orders of magnitude greater than in the river (Kim and Carlson, 2006). Low stream flow

16
exhibited higher sediment partitioning, possibly due to the ionophore antibiotics sorbing to both
sediment and suspended solids as they settle during low flow. For monensin, the pseudo-partitioning
coefficient ranged from 680 L kg-1
to 10,248 L kg -1
. Antibiotics have the ability to accumulate in
sediment, which could have adverse impact on the aquatic biota of water bodies. When assessing
antibiotics, sediment needs to be included. Monensin concentrations from previous studies are reported in
Table 2.2.

17
Table 2.2: Reported monensin concentrations from various studies.
Publication Analyte Water Soil or Manure
Kim & Carlson (2006) Monensin 0.036 g/L # 31.5 g/kg ¶
Davis et al. (2006) Monensin 1.20 μg/L + 10.5 μg/kg ¶
Lissemore et al. (2006) Monensin 6.2 - 1172 ng/L # -----
Watanabe et al (2008) Monensin 0.04 – 0.39 g/L ¥ -----
Dolliver & Gupta (2008a) Monensin 18 – 25 mg/kg * 62 – 120 mg/kg *
Song et al. (2010) Monensin
1 – 189 ng/L ◊
2 – 75 ng/L ∆ 0.004 – 0.50 g/kg †
Forrest et al. (2011) Monensin 2- 843 ng/L ----
Surface Water
Runoff
¥ Ground water
¶Sediment
†Surface Soil (top 10 cm)
*Water Extractable sample *Spiked* (expressed on dry weight basis)
◊Stagnant water (ditches)
∆Drainage water (drainage tile channels)

Results of Forrest et al. (2011) continue to provide evidence of the occurrence of monensin in the
terrestrial environment. This particular study investigated the occurrence and concentrations of
antibiotics commonly used in the livestock industry of Alberta, Canada. Twenty-three watersheds were
studied over a one-year period, with a total of 247 water samples taken. From these samples,
approximately 51% of them were positive for antibiotics. Monensin was detected 34% of the time, more
than any other antibiotic. Concentrations of monensin ranged from 2 ng L-1
to 843 ng L-1
. This study
concluded that manure production and regional cattle densities were correlated to the frequency of
monensin detection, while monensin concentrations were correlated to a number of water quality
parameters.
There are a few studies that have reported the effect of monensin on plant growth. Hillis et al.
(2007) stated that algae and aquatic plants are sensitive to monensin and that monensin has a detrimental
effect to zooplankton at a concentration of 500 µg L -1
. Mollenhauer et al. (1986) evaluated the effects of
monensin on plant growth using rye grass seedlings. The experiment analyzed rye grass seed germination
in seed pouches, soil, and ultrastructure analysis in petri dishes. Rye grass seeds were exposed to an
aqueous solution of monensin at concentrations of 10-5
and 10-4
M in all three germination methods. The
analysis of the seed pouches determined germination was slightly affected by the 10-5
M monensin.
Monensin at 10-4
M significantly affected germination yielding 8%. The root and shoot growth rates were
similarly affected by the monensin concentrations of 10-4
, resulting in no root growth and reduced shoot
growth. Similar results of reduction in grow rates of the roots and shoots in seedlings planted in soil were
observed. The ultrastructure analysis revealed monensin changes the cell structure of rye grass seedlings
at a concentration of 10-5
M and cell death occurs at 10-4
M in the root tip and increases with time until 24
h, when approximately 20% of the cell population is affected. Mollenhauer et al. (1986) concluded
germination and root growth of rye grass seedlings is visibly affected by a minimum concentration of 10-5
M monensin.
A study conducted by Hoagland (1996) further investigated the effects monensin has on plant
growth. This study examined the effects monensin has in various concentrations on the growth of several
species of plants (major agricultural crops and weeds). The plants used in the study include: cotton, okra,
hemp sesbania, sicklepod, jimsonweed, johnsongrass, velvetleaf, spurred anoda, and prickly sida. The
plants ranged in age from 10 to 14 d and were treated with monensin by foliar and root zone application.
The foliar treatments used monensin concentrations of 10-4
to 10-5
M, while the root zone treatments were
conducted using 10-4
to 10-6
M concentration. Growth effects and herbicidal injury were observed over a

19
3 d period. For foliar application, 10-5
M monensin did not cause substantial damage to the plants.
Monensin at the concentration of 10-4
M caused visible severe discoloration to all of the plants except
cotton and okra. Plant growth was also affected at a 10-5
M concentration with cotton being the least
affected of all the plants. At this concentration, the fresh weight accumulation showed cotton was not
affected but the weight reduction of the other plants ranged from 18% (okra) to 75% (hemp sesbania).
Root application of monensin caused discoloration of the plants at a 10-5
M concentration, with
cotton and okra displaying minimum visual injury. When monensin was applied at the 10-4
M
concentration, plant death occurred amongst all plant species between 24 to 65 h. Hoagland (1996)
concluded cotton and okra are monensin tolerant crops and leguminous weeds (sicklepod and hemp
sesbania) are very sensitive to foliar and root application of monensin. The phytoxicity of monensin
generally occurs due to root adsorption rather than foliar adsorption which is limited. As a result the
assumption can be made that monensin could have an effect on legumes, but this would have to be further
investigated. To clarify the biological and environmental effects of monensin and other ionophores on
humans, livestock and the biota in terrestrial and aquatic environments, long-term studies are needed.
2.3.5 Monensin Degradation Chemistry
In 1984 Donoho conducted the most extensive study on monensin metabolism, using radiolabed
monensin in food producing species to determine metabolism mechanisms. Donoho’s work, is heavily
cited and serves as the basis for monensin metabolism research. Building on Donoho’s 1984 work, the
most recent metabolism research has looked at toxic interactions between monensin and other antibiotics
(Roder, 2011 and Szucs et al. 2003.) Donoho (1984) observed that up to 90% of administered monensin
is excreted in manure. Of that 90%, less than 10% was excreted as the parent compound and the rest was
made up of monensin metabolites. Monensin is rapidly absorbed and extensively metabolized by the liver
(Donoho, 1984). These metabolites in the excrement are due to animal metabolism. According to
Donoho, (1984), data has suggested there are more than 50 metabolites in the feces of monensin-dosed
animals. There are several analytical methods that have been used to identify monensin metabolites,
including: high-performance liquid chromatography (HPLC), liquid chromatography-mass spectrometry
(LC/MS) and other forms of MS. Figure 2.3 illustrates the chemical structure of monensin, factors, and
selected metabolites. “Due to the large number and low concentrations of monensin metabolites produced
by animals, a great amount of effort is needed to catalog and characterize them (Donoho, 1984).”
Metabolite M-1 of monensin has been evaluated in several biological studies and was shown to be 20
times less active than monensin. “As a result, the first step in monensin metabolism seems to eliminate

20
the biological activity in the M-1 metabolite (Donoho, 1984). To date, no other studies have apparently
been conducted specifically investigating the excretion rate of monensin with manure.
Figure 2.3: Chemical structure of monensin, factors and metabolites (Source: Dolliver et al. 2008b).
Studies have shown the fundamental metabolic pathways of monensin are o-demethylation and
oxidation, i.e. hydroxylation (Gupta, 2011, Sassman and Lee, 2007, and Donoho, 1984). Within the last
15 years, it has been discovered that monensin is interfered with by cytochrome P450. Specifically,
cytochrome P450 3A plays an important role with the oxidative metabolism of monensin (Nebbia et al.
1999). These findings were reached while conducting experiments on rats, further research is being

21
conducted to determine if P450 3A plays the same role in food producing species such as cattle.
Nebbia et al. (2001) conducted a study investigating the oxidative metabolism of monensin and P450 3A
function in the liver of animals. It was concluded that monensin’s metabolism in the liver is species
dependent. Total monensin metabolism was highest in cattle, followed by rats, chicks, pigs, and horses.
It was discovered that the o-demethylation of monensin is highly restricted in vitro by chemicals
competing and binding with P450 isoenzymes that are essential in its oxidative biotransformation. It was
also predicted that a similar mechanism is likely to occur in a living organism when target organism are
exposed to ionophores and other drugs (Nebbia et al. 2001). These interactions are responsible for
inhibiting P450 and enhancing ionophore concentrations and thereby promoting ionophore toxicity.
2.4 Remediation of Antibiotics through Composting
Due to the amount of sub-therapeutic antibiotics used in livestock production and their potential
adverse effects on humans and the environment, means of reducing their impact are needed. A practical
solution is to eliminate them from the manure before they are applied to agricultural lands. A manure
management approach that could be used is composting. Composting is a controlled aerobic process that
biologically decomposes organic matter into a stable product called compost. As an on-farm manure
management practice, the widespread use of composting makes it practical as well as economical.
Composting has been recognized as a viable means of degrading antibiotic-containing manure.
Findings from Watanabe et al., (2008) showed that monensin attenuation is greater under aerobic
conditions than anoxic conditions, i.e. composting vs. stockpiling. Studies have been conducted by
Cessna et al. (2011); Ramaswamy et al. (2010), Dolliver et al., (2008a, 2008b), Dolliver and Gupta
(2008a, 2008b), and Storteboom et al. (2007) in which composting or some type of manure management
practice was used to reduce or eliminate antibiotics from manure. Four of these studies specifically
examined the use of composting to reduce or eliminate ionophore antibiotics with three focusing on
monensin. A study by Cessna et al. (2011) investigated the effects on the composting process by
veterinary antimicrobials (antibiotics). This study took place over a 2 yr period. The study assessed the
use of open air windrow composting on beef manure contaminated with chlortetracycline, sulfamethazine,
and tylosin. The objectives of this study included monitoring the dissipation of the antimicrobials and
assessing the effect of those antimicrobials on the composting process. Before the construction of the
windrows the chlortetracycline had changed its form to iso-chlortetracycline and can exist as enol/keto-

22
chlortetracycline in solution. The dissipation of iso-chlortetracycline, sulfamethazine, and tylosin were
modeled using first-order kinetics, while enol/keto-chlortetracycline was modeled using exponential
equations.
The data revealed no significant difference in the initial concentration of antimicrobials in 2005
compared to 2006, though the duration of antimicrobial administration differed, 204 d (2005) compared to
13 d (2006). It was determined that the dissipation rates were affected by the year. In 2006, iso-
chlortetracycline and tylosin dissipated at a faster rate compared to that of 2005 due to warmer and drier
conditions of the windrows. In 2005, sulfamethazine dissipated the fastest, but no significant data exist to
correlate this to the cooler and wet conditions of the windrow in 2005. The time for 50% dissipation
(DT50) varied for each of the antimicrobials. The DT50 (2005) for chlortetracycline ranged from 9.8 to
26.5 d compared to 5.5 to 16.1 d in (2006). The DT50 of sulfamethazine jumped from 26.8 d (2005) to
237 d in (2006). For tylosin, the DT50 decreased from 43.5 d (2005) to 20.3 d (2006). This study found
evidence, which supports antimicrobials having an effect on the compost process based upon temperature
and nutrient properties. Further research is needed to verify these effects in a more controlled setting with
the use of controlled composting and stockpiling as management options.
Ramaswamy et al. (2010) conducted a study explored the use of composting poultry manure
contaminated with salinomycin before land application. Salinomycin is an ionophore antibiotic similar to
monensin and is also used as a feed additive. Similar to monensin, salinomycin is hydrophobic in nature
and is more likely to persist in sediment. In a previous study it was reported that salinomycin was found
at concentrations in sediment 500 times higher than concentrations in water (Kim and Carlson, 2006).
This study assessed open heap conditions (control) for comparison. The experiment was conducted in
open laboratory conditions where temperature, moisture content, pH and other variables were measured.
The concentration of salinomycin in the compost decreased from 22 mg kg-1
to 2 x 10⁻⁵
g kg-1
during the
38 d compost. The control yielded a decrease of 27.5 mg kg-1
to 0.024 mg kg-1
. The rapid degradation of
salinomycin in compost exhibited a half-life of 1.3 d and a removal rate of 0.5358 d-1
. The half-life of the
control was 4 d with a removal rate of 0.1731 d-1
. From this study, Ramaswamy et al. concluded that
composting significantly reduced the concentration of salinomycin, which would result in safer manure
for land application.
One study examined the ineffectiveness of stockpiling as a manure management practice. The
study conducted by Dolliver et al. (2008a) used three different manure management treatments (control

23
treatment, managed composting and vessel composting) to compost turkey manure. The C:N ratio of
the turkey manure was 13:3 (including bedding). The bedding used was a combination of sunflower hulls
and aspen shavings at a 50:50 blend ratio. Sampling for the controlled and managed compost piles were
taken on the same day intervals whereas the vessel composting used another schedule. Composite
sampling was used for each of the three manure treatments. Each composite sample consisted of 3
subsamples.
Antibiotic analysis was performed using enzyme-linked immunosorbent assay (ELISA) method.
In this study the concentration of antibiotics recovered from the manure was not quantified and was
assumed to remain constant overtime (Dolliver et al. 2008a). Dolliver and colleagues measured the
degradation of antibiotics by the decrease of total extractable antibiotic concentration overtime. The
study found that thermophilic temperatures (>40ºC) were achieved within four days in all of the
treatments. The total extractable concentration of monensin increased after the start of the study but
gradually declined over time with reductions ranging from 54% to 76% with an average half-life of 17 d.
According to Dolliver et al. (2008a), the water extractable antibiotic concentrations may represent the
most available type of degradation for microorganisms. The water extractable concentration of monensin
was lower on the final day of the study compared to the initial start of the study. As quoted by Dolliver et
al. (2008a), “The reduction in the proportion of antibiotics that were water extractable during storage and
composting may be due to changes in manure physical/chemical characteristics, adsorption processes, or
a reduction in bioavailability.”
Dolliver and Gupta (2008a) also investigated antibiotic losses from unprotected manure
stockpiles and concluded that unprotected manure piles can contribute to antibiotic contamination of
aquatic environments. Due to a lack of information existing on antibiotic losses from onsite manure
management practices, Dolliver and Gupta (2008a) decided to investigate this and were able to quantify
antibiotic losses in beef manure. Composting and manure storage techniques often occur outside which
can lead to the runoff and leaching of pollutants (Dolliver and Gupta, 2008a). Antibiotic analysis was
conducted using the (ELISA) method as in Dolliver and Guptas’ previous study. The antibiotic
concentrations in the manure pile runoff increased with the increasing amount of antibiotic in the manure.
Monensin had the highest concentration in runoff (2,715 µg L -1
) of any of the antibiotics. Dolliver and
Gupta concluded that manure storage in protected facilities (covered) could possibly reduce or eliminate
contaminants from manure in aquatic environments.
24
The study conducted by Storteboom et al. (2007) confirmed the general finding of the other
three studies; namely, some form of manure management is effective in degrading concentrations of
antibiotics in livestock manure. Two studies were conducted during this experiment, the study of interest
was the pilot study. The pilot study investigated the response of antibiotics and antibiotic resistant genes
(ARG) to high intensity management (HIM) compared to low intensity management (LIM). “It was
hypothesized that HIM of animal manures may stimulate the degradation of antibiotics and minimize the
spread of ARG into the environment” (Storteboom et al., 2007). HIM was defined as amending, watering
and turning of the windrow and LIM was defined as no amending, watering or turning of the window
pile. Horse manure was used for this study and was subjected to high and low intensity managements in
three replicate piles. The HIM manure was amended with leaves and alfalfa. One control pile was
created for each manure management. Monensin was applied to the manure piles in the form of solid
pulverized feed by sprinkling, watering and mixing into the piles. Monensin was found to have a half-life
of 14.7 d in the HIM manure compared to 30.1 d in the LIM manure, but the final concentrations of
monensin were not statistically different between the two management options.
2.5 Gaps in Knowledge
Forrest et al. (2011), conclude that, “despite the limited knowledge of the effects of
pharmaceutical residues in the environment, agricultural producers can use proactive practices to reduce
their presence and potential impacts.” As a result, providing a viable means for remediating monensin
and other forms of antibiotic pharmaceuticals from dairy manure is a very important aspect that warrants
further research. Currently, researchers have documented composting as being a proactive practice than
can remediate antibiotic residues. To date, there have been no studies on monensin degradation during
composting of dairy manure. This proposed research would assess the potential of composting as a
biological treatment option for dairy producers, for treatment of manure containing antibiotic residues i.e.
monensin. Investigating the usefulness of composting compared to stockpiling manure could have
positive environmental and management benefits for the dairy producer.

Chapter 3
Goals, Objectives, Hypothesis
3.1 Research Goals
As an ionophore antibiotic, monensin is primarily used to amplify production. In dairy
production, monensin is the most widely administered antibiotic. In the United States, monensin
is the only antibiotic permitted as a feed additive for lactating cows (Watanabe et al, .2008). The
occurrence and fate of monensin in the environment through dairy manure management has not
been fully studied, even though monensin is predominately used in U.S. dairy production.
Studies (Dolliver et al., (2008a) and Dolliver and Gupta, (2008a)) using turkey and beef manure
as a media to introduce antibiotics onto land have concluded monensin is prevalent in both
terrestrial and aquatic environments. Monensin’s classification as a sub-therapeutic antibiotic
allows it to be considered a marker for agricultural pollution when found in the environment
(Forrest et al. 2011). The application of dairy manure to agricultural lands is a common
management practice. However, the monensin introduced to the terrestrial environment could
persist and have adverse effects over time. Methods to degrade monensin prior to land
application are needed.
The goal of this investigation is to compare monensin degradation for composting versus
stockpiling of dairy manure. Determination of the degradation behavior of monensin in dairy
manure will contribute to our understanding of its fate in environmental systems and potential
remediation strategies.

26
3.2 Objectives
The specific objectives of this research are to:
Determine C:N ratio and moisture content (MC) of dairy manure and develop a
procedure for adjusting both to optimize composting conditions.
Determine the monensin concentration in dairy manure as provided by a dairy producer.
Quantify the rate of monensin degradation in stockpiled dairy manure.
Evaluate the effect of composting on the degradation rate of monensin in dairy manure.
3.3 Hypothesis
Composting of dairy manure will accelerate the degradation of monensin relative to stockpiling
of dairy manure.
Supporting Argument:
Monensin breaks down in aerobic environments more quickly than anoxic environments
(Watanbe et al., 2008). Since composting is a controlled aerobic process, the composting will
accelerate the degradation rate of monensin. Aerobic conditions and a balanced C: N ratio from
amendments (sawdust, straw, etc) should accelerate degradation of monensin relative to
stockpiling. If so, composting could be used as a dairy manure management technique.

Chapter 4
Methodology
4.1 Site Description
The research was conducted at Penn State’s Organic Materials Processing and Education
Center (OMPEC) from June 2011 through September 2011. The OMPEC is a 5.26 ha site located
at University Park created to compost cafeteria waste, landscaping debris, and livestock manure.
The compost site for this research was a 93 m2 asphalt surface containing a compost structure
4.2 m (wide) x 14.6 m (length) x 1.22 m (height). The compost structure was made of 32 (0.61 x
0.61 x 1.83 m) concrete blocks. Figure 4.2 shows the layout and placement of treatments at the
site. The locations of the treatments within the 8 bays were randomized.
Fig 4.1: Schematic of compost site for composting and stockpiling of dairy manure.

4.2 Summary of Dairy Operation
The manure used in this study was acquired from a local dairy producer near Pine Grove Mills,
PA. This dairy facility, consist of several hundred head of cattle and approximately 182 ha of agricultural
land. Approximately 146 ha are used for manure application, which accounts for 80% of the total land
use. The manure was taken from a freestall barn containing 30 continuously confined Holstein heifers
about 6 months of age and ranging in weight from 272 kg to 295 kg (600 to 650 lbs). The freestall barn
(Fig. 4.2) consist a typical bedded pack located in 6 bays, free stalls and a free stall alley. The bedded
pack consisted of manure and a mixture of corn stalk bedding used. The bedded pack is cleaned out
every three months and the freestall alleys are cleaned out every 5 d.
Typically application of solid manure occurs in March and September. In the summer, solid
manure is taken to the edge of a field and left in a static pile until land application in the fall. In the
summer (June to August), liquid manure from the heifer barn is applied to roughly 10.1 ha of permanent
hay pasture.
Fig 4.2: Schematic of freestall Holstein heifer barn.
29
4.3 Construction of Compost & Static Piles
The site for the compost bays was thoroughly washed down and cleared of any existing debris on
the pavement. The concrete blocks were then set in place using the 3-4-5 triangle method. The back wall
of the bays were put in place first, then the lateral walls were placed. The bays were then labeled to
distinguish between compost and static piles. The placement and order of the bays were randomized.
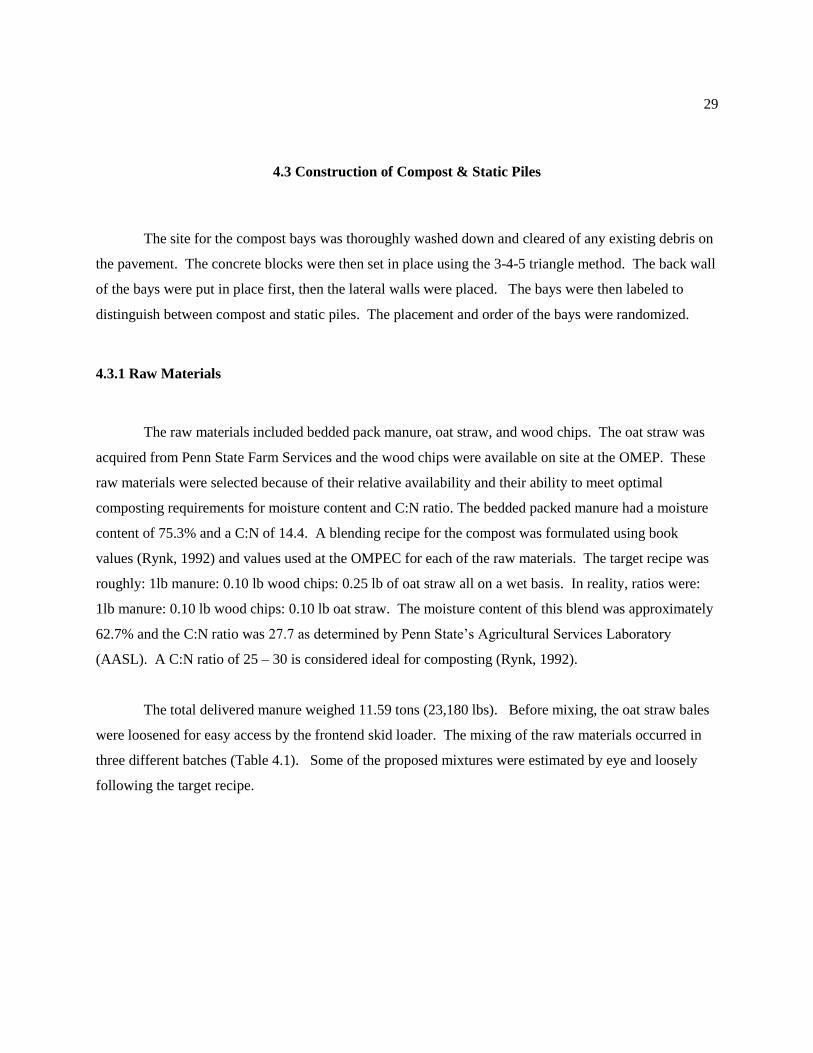
4.3.1 Raw Materials
The raw materials included bedded pack manure, oat straw, and wood chips. The oat straw was
acquired from Penn State Farm Services and the wood chips were available on site at the OMEP. These
raw materials were selected because of their relative availability and their ability to meet optimal
composting requirements for moisture content and C:N ratio. The bedded packed manure had a moisture
content of 75.3% and a C:N of 14.4. A blending recipe for the compost was formulated using book
values (Rynk, 1992) and values used at the OMPEC for each of the raw materials. The target recipe was
roughly: 1lb manure: 0.10 lb wood chips: 0.25 lb of oat straw all on a wet basis. In reality, ratios were:
1lb manure: 0.10 lb wood chips: 0.10 lb oat straw. The moisture content of this blend was approximately
62.7% and the C:N ratio was 27.7 as determined by Penn State’s Agricultural Services Laboratory
(AASL). A C:N ratio of 25 – 30 is considered ideal for composting (Rynk, 1992).
The total delivered manure weighed 11.59 tons (23,180 lbs). Before mixing, the oat straw bales
were loosened for easy access by the frontend skid loader. The mixing of the raw materials occurred in
three different batches (Table 4.1). Some of the proposed mixtures were estimated by eye and loosely
following the target recipe.
30
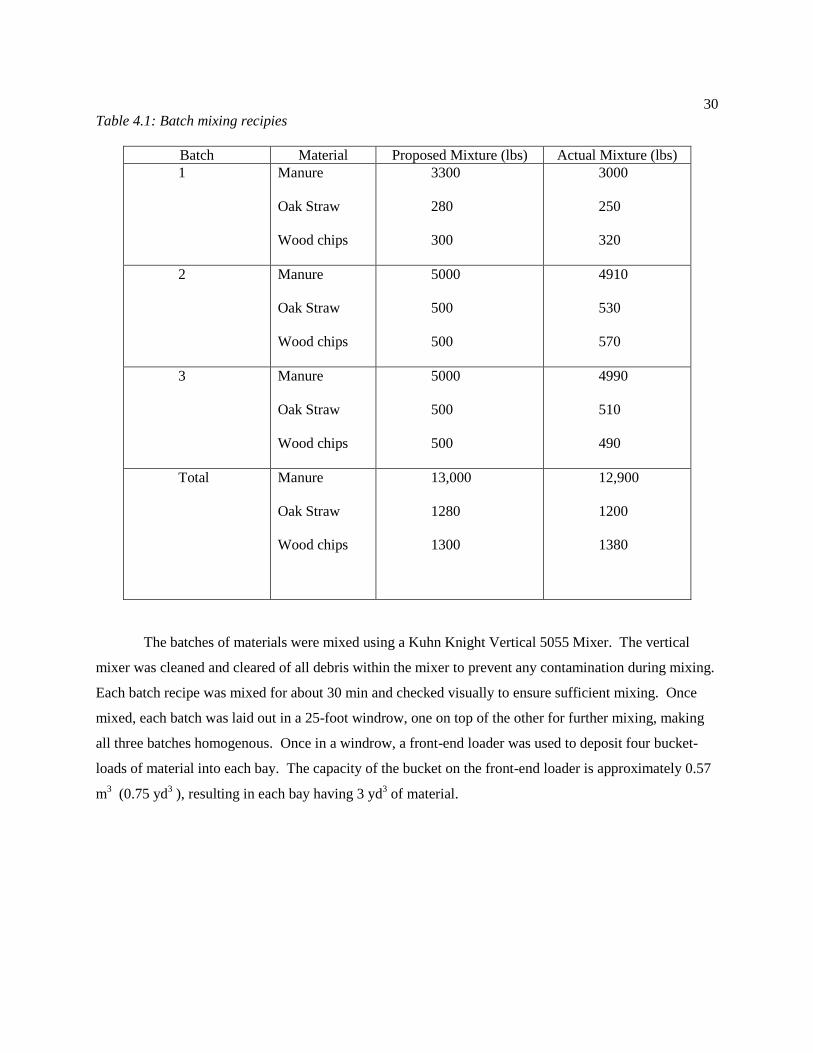
Table 4.1: Batch mixing recipies
Batch Material Proposed Mixture (lbs) Actual Mixture (lbs)
1 Manure
Oak Straw
Wood chips
3300
280
300
3000
250
320
2 Manure
Oak Straw
Wood chips
5000
500
500
4910
530
570
3 Manure
Oak Straw
Wood chips
5000
500
500
4990
510
490
Total Manure
Oak Straw
Wood chips
13,000
1280
1300
12,900
1200
1380
The batches of materials were mixed using a Kuhn Knight Vertical 5055 Mixer. The vertical
mixer was cleaned and cleared of all debris within the mixer to prevent any contamination during mixing.
Each batch recipe was mixed for about 30 min and checked visually to ensure sufficient mixing. Once
mixed, each batch was laid out in a 25-foot windrow, one on top of the other for further mixing, making
all three batches homogenous. Once in a windrow, a front-end loader was used to deposit four bucket-
loads of material into each bay. The capacity of the bucket on the front-end loader is approximately 0.57
m3 (0.75 yd
3 ), resulting in each bay having 3 yd
3 of material.

31
Fig 4.3: First pass of the vertical mixer Fig. 4.4: Mixing of the second batch
Fig. 4.5: Third pass of the vertical mixer Fig. 4.6: Mixing of the third batch
4.3.2 Treatments
Once in place, each manure pile measured approximately 2.1 m (width) x 1.5 m (length) x 0.91 m
(height). The static piles (control) remained undisturbed during the 50-day study period, except for the
minor disturbance associated with sampling. In the beginning, this study set out to evaluate composting.
The compost piles were to be turned based on temperature (< 40 C), in actuality the compost piles were
only turned once, on day 6 during the 50-day study. The piles were turned only once, because of the
concern they would not reheat properly due to the small size of the piles. Also, the use of manual
thermometers to roughly gauge pile temperature were inaccurate. After examining the temperature
profiles of the compost piles, some piles would have only required one to three additional turns to fully
stimulate composting. As a result, due to the experimental design, the experiment actually investigated
static pile treatment (no disturbance vs. limited disturbance) and its effect on monensin degradation. The

32
compost piles were turned with the use of a front-end loader Fig. 4.7. Sampling and retrieval of
temperature contributed to additional pile disturbance. This experiment was conducted in an outside
environment, resulting in the same climatic conditions for both treatments.
Fig. 4.7: Turning of compost pile
4.4. Installation of Temperature Probes
Thermochron temperature logger iButtons (model DS1921G) were used to monitor temperature
for this experiment. These iButtons are highly resistant to environmental hazards and are a self-sufficient
system. The DS1921G operating range is -40˚C to +85˚C and has an accuracy of + 1˚C.
Each iButton was cataloged and labeled. Once cataloged, the iButtons were programmed using
the One Wire Viewer software. Using the software interface, temperature scale (°C), frequency of
measurement (30 min), and synchronization of time for each iButton were set. Before installation in the
piles, the iButtons were encased in waterproof capsules for protection from the elements, and tagged with
polypropylene twine to allow for easy retrieval of the sensors. The iButton sensors were removed for
compost turning based on temperature and when the experiment was concluded. An auger was used to
penetrate each pile for proper placement of the iButton sensors. The iButton sensors were placed at a
depth of 12 – 18 inches at the bottom, left, right, back and the core of each pile, as shown in Fig. 4.8.
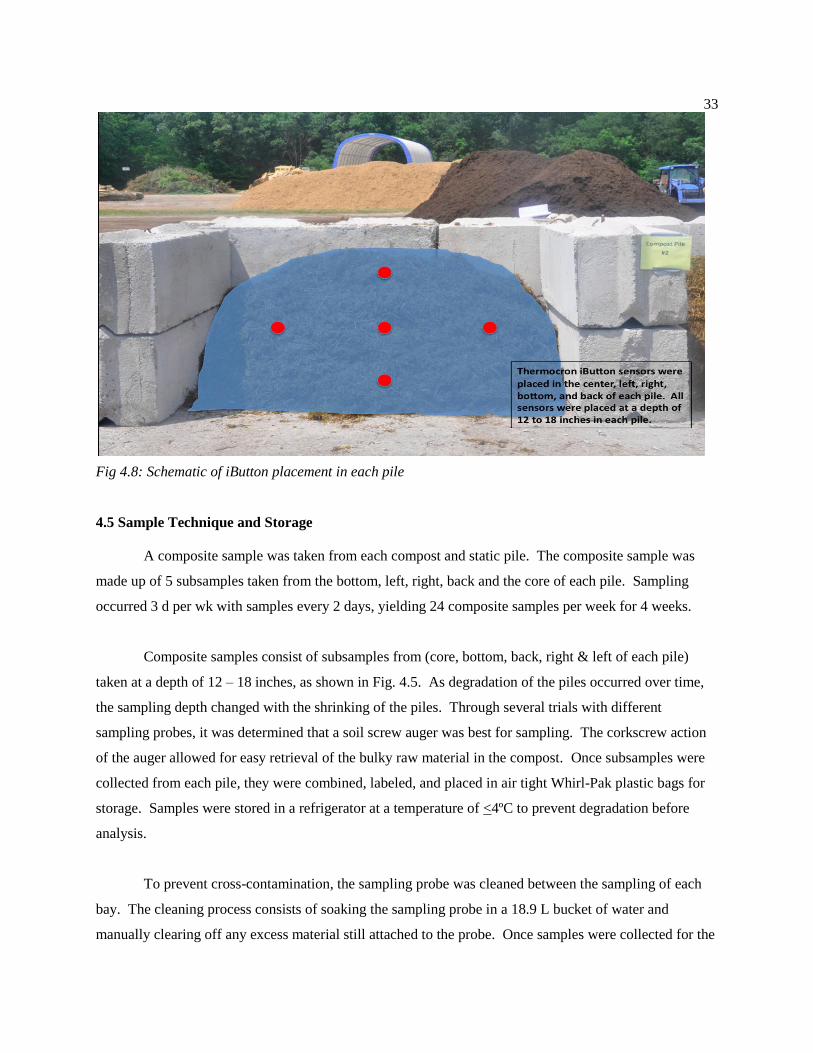
33
Fig 4.8: Schematic of iButton placement in each pile
4.5 Sample Technique and Storage
A composite sample was taken from each compost and static pile. The composite sample was
made up of 5 subsamples taken from the bottom, left, right, back and the core of each pile. Sampling
occurred 3 d per wk with samples every 2 days, yielding 24 composite samples per week for 4 weeks.
Composite samples consist of subsamples from (core, bottom, back, right & left of each pile)
taken at a depth of 12 – 18 inches, as shown in Fig. 4.5. As degradation of the piles occurred over time,
the sampling depth changed with the shrinking of the piles. Through several trials with different
sampling probes, it was determined that a soil screw auger was best for sampling. The corkscrew action
of the auger allowed for easy retrieval of the bulky raw material in the compost. Once subsamples were
collected from each pile, they were combined, labeled, and placed in air tight Whirl-Pak plastic bags for
storage. Samples were stored in a refrigerator at a temperature of <4ºC to prevent degradation before
analysis.
To prevent cross-contamination, the sampling probe was cleaned between the sampling of each
bay. The cleaning process consists of soaking the sampling probe in a 18.9 L bucket of water and
manually clearing off any excess material still attached to the probe. Once samples were collected for the
34
first four bays, the 18.9 L bucket was then emptied and cleaned out. The 18.9 L bucket was then refilled
for the sampling of the last four bays. When sampling was completed, the probe was cleaned and stored
until the next sampling day.
4.5.1 Sample Preparation from Field
Before monensin, moisture, and organic matter analysis of the samples, the subsamples from each
pile were combined into one composite sample. That composite sample was considered representative of
the entire pile.
A Hobart Buffalo chopper was used to break down each subsample. The samples were then
homogenized for 15 min using the Buffalo chopper food processor to a more manageable composite
sample. Any clumps of compost or any fibrous materials were chopped into smaller pieces.
To prevent cross-contamination of samples, the blades and the bowl of the food processor were
disassembled and cleaned between the processing of each pile sample. When homogeneity was reached,
each composite sample is separated into a smaller sample, representative of each pile. The samples were
stored in refrigeration until all analyses could occur.
4.6 Sample Analysis
The moisture content was determined by weighing before and after oven drying at 105 C for 24
hr. The organic matter (OM) analysis was provided by AASL. The %OM is defined as OM lost on
ignition.
4.6.l Monensin Analysis
The enzyme-linked immunosorbent assay (ELISA) is a test used in immunology and other
scientific fields to detect antibodies and antigens. The ELISA uses enzymes that react with antibodies to
form colored products. The development of color in an ELISA test indicates a positive result. The most
commonly used ELISA method is called the indirect ELISA; an antibody test used to determine whether a
certain type of antibody is present in a sample, and at what concentration. ELISA has been used
previously to quantify monensin in manure (Dolliver and Gupta, 2008a; and Dolliver et al., 2008a,
2008b).

35
A commercially available kit from Immuno-Diagnostic Reagents (Vista, CA) was used to
perform the monensin analysis. This kit consisted of a 96-well plate coated with monensin antibodies.
The marketed use of the kit is intended for residue analysis in foods, but Dolliver et al. (2008a,b) adapted
the kit for use on complex samples. Dolliver et al. (2008b) evaluated the application of this commercially
available ELISA kit on environmental samples and concluded that it was highly sensitive, yielding a 1.5
µg L-1
detection limit and a 3.0 µg L-1
quantification limit. ELISA analysis was performed in accordance
with manufacturer recommendations. Quantification was performed using a microplate reader at a
wavelength of 405 nm. All samples were run in triplicate. Table. 4.2 displays the linear equations
determined for each ELISA kit based upon average absorbance. The average absorbance values were
determined by the standards (0, 1, 5, and 25 ng mL-1
) provided in each kit. From the average absorbance,
a range was determined for each kit which was used to quantify monensin in the samples. The R2 value
describes how closely the linear equations model the relationship between the absorbance and standards
of the ELISA kit.
Table 4.2: Summary of linear equations for ELISA kits
Plate Identification R2 Linear Equation
Kit 1 0.95147 y = -6.229x + 13.13
Kit 2 0.91587 y = -4.7737x + 9.8408
Kit 3 0.92397 y = -5.8111x + 9.0905
Kit 4 0.91174 y = 4.1892x + 7.5479
Kit 5 0.90219 y = -4.619x + 7.8446
Kit 6 1 y = -126.85x + 58.066
Kit 7 0.95455 y = -4.869x + 8.3446

36
4.6.2 Sample Preparation for Monensin Analysis
The compost and static pile samples were prepared for analysis using an extraction technique of
Dolliver et al. (2008a), who determined both water and methanol extractable antibiotic concentrations.
The complexity of samples, such as compost or manure, create a greater chance of inaccuracy during
analysis. This extraction process allowed for a cleaner sample to be analyzed due to the sensitivity of the
ELISA. The extraction technique used by Dolliver et al. (2008a) is described below. Antibiotic
degradation was interpreted as a decrease of total-extractable (water and methanol-extractable) antibiotic
over time. The water extractable analysis represented the monensin that was more soluble. The methanol
extractable analysis represented the monensin that was tightly sorbed to the compost.
Water Extractable Antibiotics
Five grams of manure was mixed with 10mL of Nanopure® water and vortexed for one min.
The sample was then shaken end over end for 15 min at 4˚ C and centrifuged at 2000g for 20 min.
The supernatant was then collected. An additional 10 mL of Nanopure® water was added, supernatants
were combined and then centrifuged at 2000 g for 20 min. The supernatant was then filtered through a
non-sorptive 0.45µm filter.
Total Extractable Antibiotics
The remaining solids were mixed with 10 mL of an 80:20 (v/v) methanol:water solution. The sample was
vortexed, shaken and centrifuged (2000g for 20 min) with the supernatants collected. This step was
repeated with an additional 5 ml of the methanol:water solution.
4.7 Data Compilation & Analysis
4.7.1 Data Recording & Processing
At the end of the experiment, the iButtons were collected and bagged for each pile. Each
waterproof capsule was cleaned of excess material before the iButton is processed. Once cleaned, each
iButton was crossed referenced with the iButton list. The data from each iButton was uploaded with the
One Wire Viewer software. The software interface stops the recording of new data and provides a

37
temperature/time plot and a histogram. The data was saved and then imported into Microsoft Excel. The
mean average temperature was calculated for each day, for every pile, producing a representative
temperature profile. All degradation, moisture content, organic matter, precipitation, and temperature
data was collected and recorded in Microsoft Excel.
4.7.2 Statistical Analysis
The temperature profiles for each treatment were averaged to produce mean temperatures for
each treatment. The mean temperatures of both treatments were analyzed to assess trends related to
ambient temperature and other variables. The data was then evaluated using a general regression and
correlation model procedure using Minitab version 16. The significance level used for statistical analysis
was = 0.05. The difference in the mean temperatures of the treatments was evaluated using a two
sample t - test. The differences discussed in the text were significant at α = 0.05.
38
Chapter 5
Results and Discussion
5.1 Monensin in Dairy Manure
Samples were taken on April 27th and June 7
th 2011 to quantify the presence of monensin in the
manure provided by the local dairy producer. The two samples had total monensin concentrations of 0.83
and 1.06 mg kg-1
. On average, the water extractable monensin made up, 52.4% of the total monensin
concentration with the remaining 47.6% being in the methanol extractable form. These concentrations of
monensin are representative of what was observed during the actual experiment. These amounts are
similar to the reported typical concentrations of antibiotics (1 mg kg -1
– 10 mg kg -1
) in livestock manures
(Kumar et al., 2005).
5.2 Temperature
Temperature is a critical factor affecting microbial degradation of organic contaminants and the
composting process. The average temperature profiles of the compost piles (CPs) and static piles (SPs)
indicate thermophilic conditions (>40 C) were reached on day 0 for compost and the following day for
static piles. Thermophilic conditions were not sustained during the duration of the experiment, compost
and static piles averaged 25 d and 11 d, respectively. Compost piles averaged 40.2 C on day 0 and
increased to 49.4 C on day 1. In comparison, the temperature of the static piles averaged 37.5 C and
46.3 C for d 0 and d 1, respectively. The peak maximum temperature of the CPs shown in Table 5.3
occurred with a three-day period: (2 – 4 d; July 21 – 23) where the average ambient temperature was the
highest during the entire study. These temperatures were 29.4 C, 32.3 C, and 28.8 C, respectively. The
SPs showed a similar pattern lasting four days, with the period starting a day earlier on (d 1; July 20th) at a
temperature of 26.6 C.
39
CP 3 reached a maximum peak temperature of 55.6 C on day 2 and was the highest of all
treatments. A temperature of 51.4 C from SP 4 was the highest maximum peak temperature for any SPs.
Temperature variation patterns showed the average minimum temperature increase occurred on day 4 in 7
out of 8 piles. The average maximum temperature increase occurred on day 0 in 6 out of 8 piles, shown
in Table 5.1 and 5.2. Change in temperature is defined as
. The minimum temperature
increase, showed a steep decline of temperature before day 10 of composting bottoming out at 36.6 C.
The compost piles then showed a gradual incline peaking a second time at 50.3 C on day 15 and declined
gradually to an average temperature of 32.1 C at the conclusion of the experiment. The static piles reflect
the same pattern as the compost piles with the same steep decline of temperature before the day 10. The
temperature gradually declined in the SPs during the rest of the experiment ranging from 28.2 C to
44.1 C.
TTn Tn1

Table 5.1: Compost Pile Temperature Variations
Temperature
Variation
CP 1 CP 2 CP 3 CP 4 CP Average
Minimum Maximum Minimum Maximum Minimum Maximum Minimum Maximum Minimum Maximum
Temperature
Increase ( C) -8.6 6.2 -10.5 7.4 -11.3 11.8 -10.5 12.3 -10.2 9.2
Day of Rate
Temp Increase 4 6 4 6 4 0 4 0 4 0
Peak
Temperature
( C) 30.7 47.7 31.3 49.7 33.3 55.6 30.5 54.7 32.1 51.5
Table 5.2: Static Pile Temperature Variations
Temperature
Variation
SP 1 SP 2 SP 3 SP 4 SP Average
Minimum Maximum Minimum Maximum Minimum Maximum Minimum Maximum Minimum Maximum
Temperature
Increase ( C) -7.1 9.1 -5.9 8.7 -7 6.1 -6.3 11.3 -6.5 8.8
Day of Rate
Temp Increase 4 0 19 0 4 0 4 0 4 0
Peak
Temperature
( C) 29.2 45.7 29.2 46.8 28.2 43.6 31.7 51.4 29.8 46.3

The peaks and valleys from both treatment profiles roughly follow that of the ambient
temperature, which indicates a potential relationship between ambient and pile temperature, shown in Fig.
5.1. Temperature profiles of individual piles are given in appendix A. The mean compost temperatures
were positively correlated to ambient temperatures (P = 0.000). A similar positive correlation was shown
in the static temperatures (P = 0.000). As ambient temperature climbed, the mean temperatures of the
treatments climbed and vice versa. The mean temperatures of the compost piles were higher during the
duration of the study, averaging 3 C hotter than the static piles, illustrated in Fig. 5.1. The mean
temperature of the compost treatment was significantly greater than the mean temperature of the static
treatment (P = 0.001). But, that statistical significance seems to be heavily influenced by the first 25 days
of temperature measurements. The last 25 days of the study indicate no statistical difference between
treatment temperatures (P = 0.853).
Figure 5.1: Temperature profiles of compost and static treatments
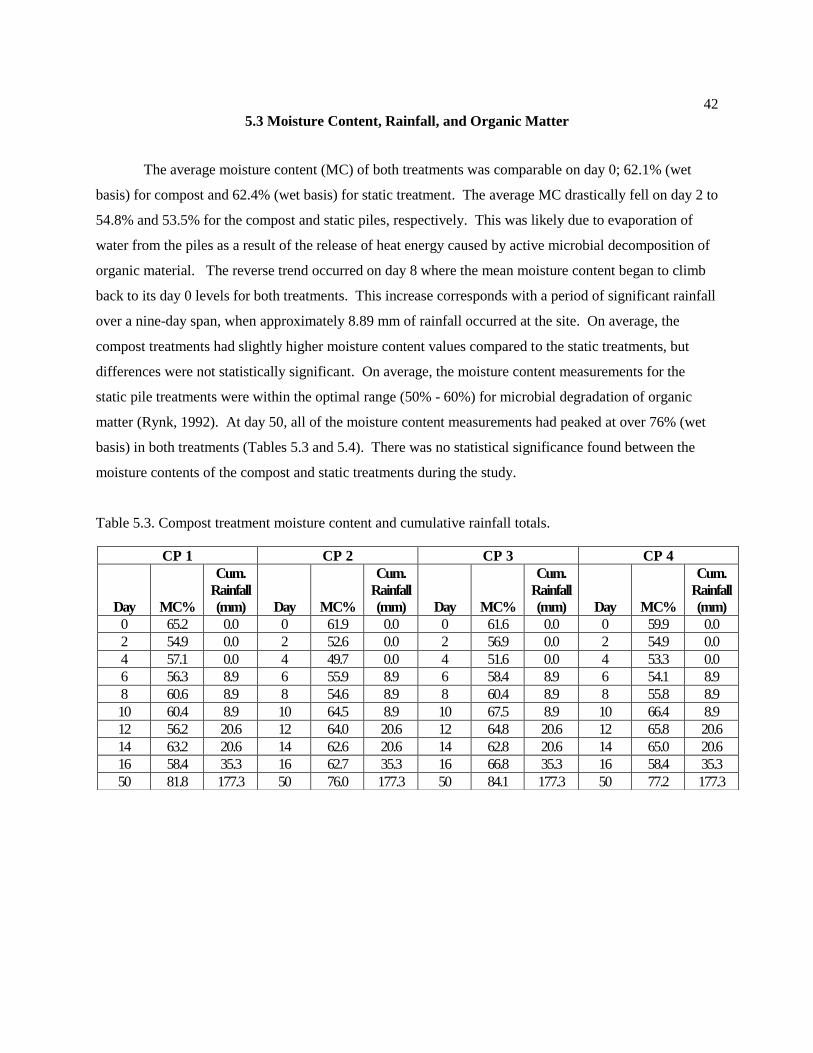
42
5.3 Moisture Content, Rainfall, and Organic Matter
The average moisture content (MC) of both treatments was comparable on day 0; 62.1% (wet
basis) for compost and 62.4% (wet basis) for static treatment. The average MC drastically fell on day 2 to
54.8% and 53.5% for the compost and static piles, respectively. This was likely due to evaporation of
water from the piles as a result of the release of heat energy caused by active microbial decomposition of
organic material. The reverse trend occurred on day 8 where the mean moisture content began to climb
back to its day 0 levels for both treatments. This increase corresponds with a period of significant rainfall
over a nine-day span, when approximately 8.89 mm of rainfall occurred at the site. On average, the
compost treatments had slightly higher moisture content values compared to the static treatments, but
differences were not statistically significant. On average, the moisture content measurements for the
static pile treatments were within the optimal range (50% - 60%) for microbial degradation of organic
matter (Rynk, 1992). At day 50, all of the moisture content measurements had peaked at over 76% (wet
basis) in both treatments (Tables 5.3 and 5.4). There was no statistical significance found between the
moisture contents of the compost and static treatments during the study.
Table 5.3. Compost treatment moisture content and cumulative rainfall totals.
CP 1 CP 2 CP 3 CP 4
Day MC%
Cum.
Rainfall
(mm) Day MC%
Cum.
Rainfall
(mm) Day MC%
Cum.
Rainfall
(mm) Day MC%
Cum.
Rainfall
(mm)
0 65.2 0.0 0 61.9 0.0 0 61.6 0.0 0 59.9 0.0
2 54.9 0.0 2 52.6 0.0 2 56.9 0.0 2 54.9 0.0
4 57.1 0.0 4 49.7 0.0 4 51.6 0.0 4 53.3 0.0
6 56.3 8.9 6 55.9 8.9 6 58.4 8.9 6 54.1 8.9
8 60.6 8.9 8 54.6 8.9 8 60.4 8.9 8 55.8 8.9
10 60.4 8.9 10 64.5 8.9 10 67.5 8.9 10 66.4 8.9
12 56.2 20.6 12 64.0 20.6 12 64.8 20.6 12 65.8 20.6
14 63.2 20.6 14 62.6 20.6 14 62.8 20.6 14 65.0 20.6
16 58.4 35.3 16 62.7 35.3 16 66.8 35.3 16 58.4 35.3
50 81.8 177.3 50 76.0 177.3 50 84.1 177.3 50 77.2 177.3

43
Table. 5.4 Static treatment moisture content and cumulative rainfall totals.
A study by Yoshida et al., (2010) concluded that higher soil moisture content (80 – 100% field
capacity) translated to a higher rate of monensin degradation. High moisture content was observed in
both treatments during the study, but the difference was the use of soil in Yoshida et al. study. Higher
soil MC resulted in degradation on monensin in their study, but high MC values (> 65%) generally
suggest that compost treatments are anaerobic in nature. The On Farm Composting Handbook suggests
the commonly accepted range for aerobic composting was 40% – 65% (Rynk, 1992). (EPA, 1995),
determined 50% - 60% as the optimum range. Anaerobic conditions may have occurred in both
treatments toward the end of the study, based on rigid interpretation of the accepted reported ranges for
aerobic MC (40% - 65%), but this was not verified using other methods. Additionally, the experimental
set up did not allow for the verification of Yoshida et al., 2010 findings of high %MC and its effect on
monensin degradation.
The compost treatments in this experiment became waterlogged during each of the first three
cumulative rainfall events. During the experiment, significant runoff was observed from each compost
treatment during the heavy rainfall events. Due to the amount of rainfall and the high moisture content,
eventually both treatments became waterlogged and runoff occurred. Since the intent of this experiment
was not to quantify runoff from the treatments, the actual runoff volume for each treatment at that time
was unknown. But towards the end of the experiment some runoff samples were collected to get a sense
of the monensin concentration that may have still existed. The analysis showed that concentrations were
within the range observed during the experiment. The average runoff (n=3) from the compost treatments
was approximately 4.04 ng mL-1
, while the static treatments averaged 3.98 ng mL-1
. From the small
SP 1 SP 2 SP 3 SP 4
Day MC%
Cum.
Rainfall
(mm) Day MC%
Cum.
Rainfall
(mm) Day MC%
Cum.
Rainfall
(mm) Day MC %
Cum.
Rainfall
(mm)
0 61.9 0.0 0 59.8 0.0 0 66.1 0.0 0 61.7 0.0
2 49.2 0.0 2 54.1 0.0 2 52.5 0.0 2 58.4 0.0
4 52.5 0.0 4 56.6 0.0 4 52.1 0.0 4 44.5 0.0
6 47.8 8.9 6 52.6 8.9 6 60.4 8.9 6 48.5 8.9
8 50.4 8.9 8 47.8 8.9 8 52.2 8.9 8 45.3 8.9
10 62.5 8.9 10 60.1 8.9 10 62.4 8.9 10 60.4 8.9
12 69.7 20.6 12 52.6 20.6 12 63.2 20.6 12 55.5 20.6
14 61.5 20.6 14 58.6 20.6 14 54.5 20.6 14 60.7 20.6
16 57.3 35.3 16 49.4 35.3 16 63.1 35.3 16 43.3 35.3
50 79.4 177.3 50 78.1 177.3 50 77.0 177.3 50 83.7 177.3
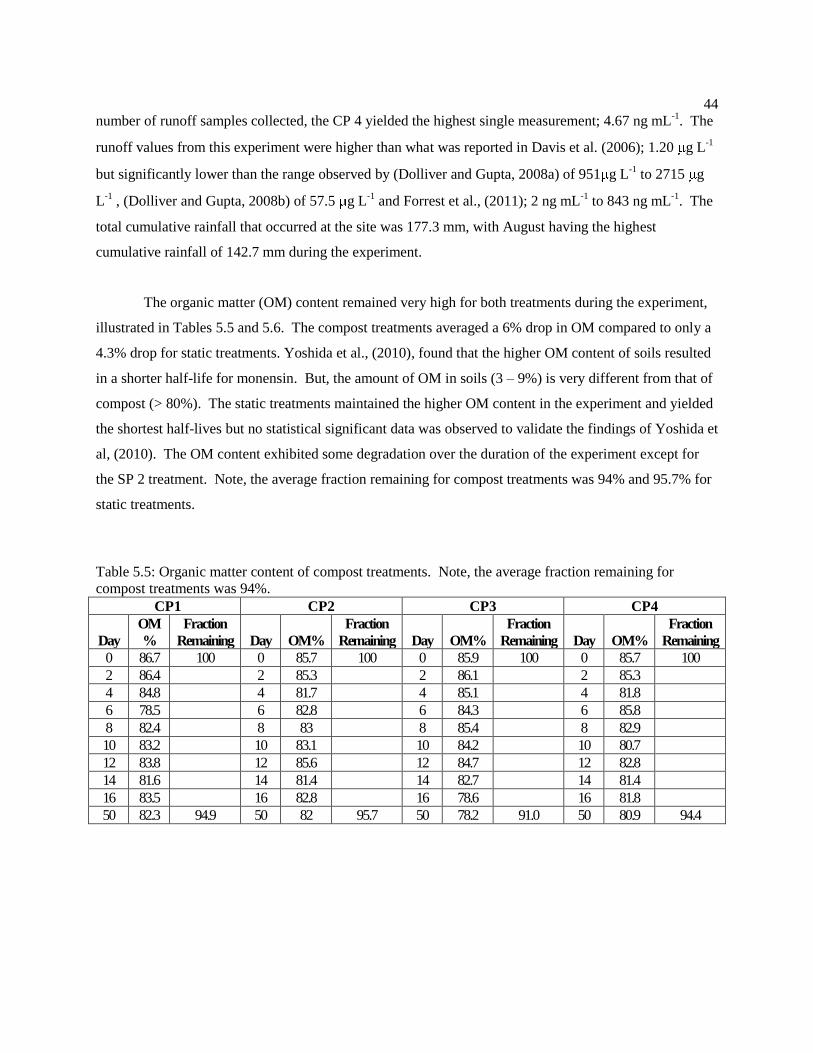
44
number of runoff samples collected, the CP 4 yielded the highest single measurement; 4.67 ng mL-1
. The
runoff values from this experiment were higher than what was reported in Davis et al. (2006); 1.20 g L-1
but significantly lower than the range observed by (Dolliver and Gupta, 2008a) of 951 g L-1
to 2715 g
L-1
, (Dolliver and Gupta, 2008b) of 57.5 g L-1
and Forrest et al., (2011); 2 ng mL-1
to 843 ng mL-1
. The
total cumulative rainfall that occurred at the site was 177.3 mm, with August having the highest
cumulative rainfall of 142.7 mm during the experiment.
The organic matter (OM) content remained very high for both treatments during the experiment,
illustrated in Tables 5.5 and 5.6. The compost treatments averaged a 6% drop in OM compared to only a
4.3% drop for static treatments. Yoshida et al., (2010), found that the higher OM content of soils resulted
in a shorter half-life for monensin. But, the amount of OM in soils (3 – 9%) is very different from that of
compost (> 80%). The static treatments maintained the higher OM content in the experiment and yielded
the shortest half-lives but no statistical significant data was observed to validate the findings of Yoshida et
al, (2010). The OM content exhibited some degradation over the duration of the experiment except for
the SP 2 treatment. Note, the average fraction remaining for compost treatments was 94% and 95.7% for
static treatments.
Table 5.5: Organic matter content of compost treatments. Note, the average fraction remaining for
compost treatments was 94%.
CP1 CP2 CP3 CP4
Day
OM
%
Fraction
Remaining Day OM%
Fraction
Remaining Day OM%
Fraction
Remaining Day OM%
Fraction
Remaining
0 86.7 100 0 85.7 100 0 85.9 100 0 85.7 100
2 86.4 2 85.3 2 86.1 2 85.3
4 84.8 4 81.7 4 85.1 4 81.8
6 78.5 6 82.8 6 84.3 6 85.8
8 82.4 8 83 8 85.4 8 82.9
10 83.2 10 83.1 10 84.2 10 80.7
12 83.8 12 85.6 12 84.7 12 82.8
14 81.6 14 81.4 14 82.7 14 81.4
16 83.5 16 82.8 16 78.6 16 81.8
50 82.3 94.9 50 82 95.7 50 78.2 91.0 50 80.9 94.4

45
Table 5.6: Organic matter content of static treatments. Note, the average fraction remaining for static
treatments was 95.7%.
SP1 SP2 SP3 SP4
Day OM%
Fraction
Remaining Day OM%
Fraction
Remaining Day OM%
Fraction
Remaining Day OM%
Fraction
Remaining
0 83.7 100 0 84.1 100 0 85.8 100 0 87.2 100
2 85.6 2 84.7 2 84.8 2 83.2
4 86.4 4 85.2 4 85.2 4 85.9
6 85.5 6 85.4 6 82.5 6 84.9
8 83.6 8 84.7 8 83.6 8 83.1
10 81.5 10 83.1 10 82.6 10 81.7
12 82.1 12 84.7 12 84.9 12 81.3
14 83.1 14 84 14 83.2 14 82
16 78.7 16 85.1 16 80.8 16 85.6
50 77.3 92.4 50 85.3 101.4 50 79.2 92.3 50 84.4 96.8
5.4 Monensin Degradation
Studies by Yoshida et al., (2010), Dolliver et al., (2008a), Watanabe et al., (2008), Sassman and
Lee (2007), and Carlson and Marbury, (2006) have shown that monensin degradation exhibits first-order
kinetics. As a result, the data in this experiment was analyzed using a first-order decay process: C = C0e-kt
where C is the monensin concentration at time (t), C0 is the initial monensin concentration, and k is the
monensin degradation rate constant. With the use of this model, the half-life was calculated as:
. The average rate constants and half-lives from both treatments are shown in Tables. 5.7.
The decay rate of was higher and half-life four times shorter for the static treatment in comparison to the
compost treatment. The R2 values for model fit of both treatments and the exponential degradation are
illustrated in Fig. 5.2 and 5.3.
Table. 5.7: First order average rate constant and half-life of total extractable monensin
Average Total Extractable
Treatment CP SP
(-k) (d-1
) 0.012 0.051
t1/2 (d) 57.8 13.6
t1 2
ln( 2)
k
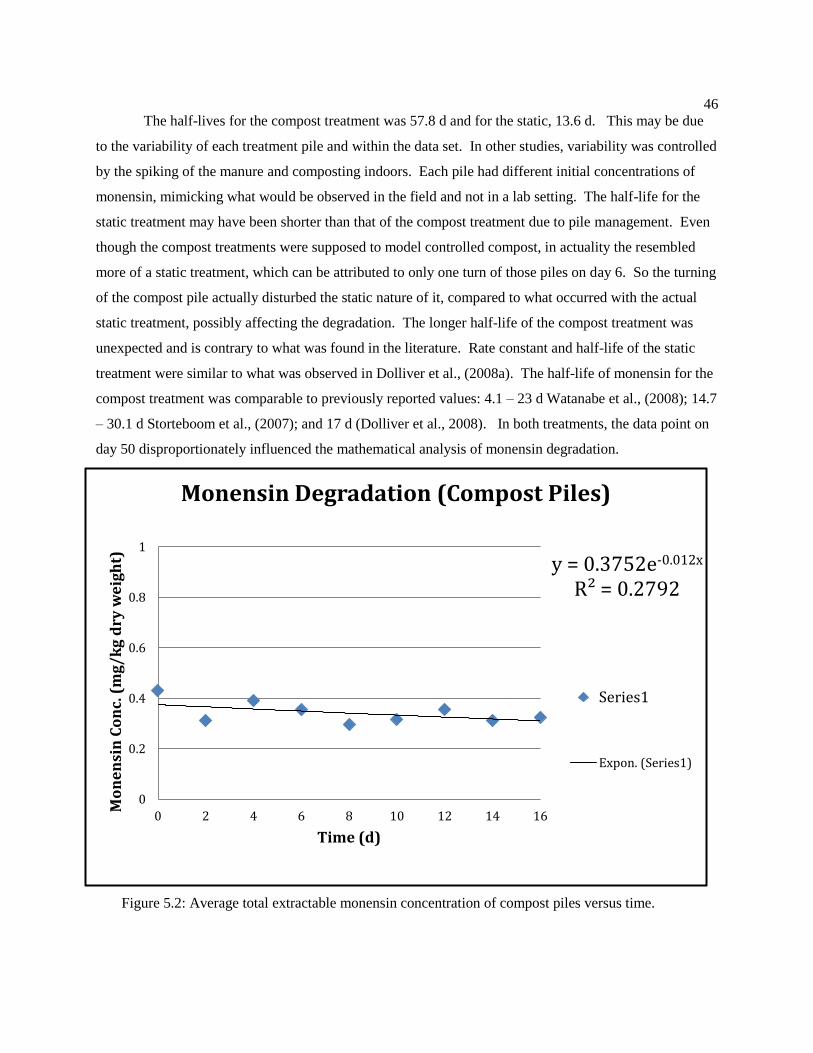
46
The half-lives for the compost treatment was 57.8 d and for the static, 13.6 d. This may be due
to the variability of each treatment pile and within the data set. In other studies, variability was controlled
by the spiking of the manure and composting indoors. Each pile had different initial concentrations of
monensin, mimicking what would be observed in the field and not in a lab setting. The half-life for the
static treatment may have been shorter than that of the compost treatment due to pile management. Even
though the compost treatments were supposed to model controlled compost, in actuality the resembled
more of a static treatment, which can be attributed to only one turn of those piles on day 6. So the turning
of the compost pile actually disturbed the static nature of it, compared to what occurred with the actual
static treatment, possibly affecting the degradation. The longer half-life of the compost treatment was
unexpected and is contrary to what was found in the literature. Rate constant and half-life of the static
treatment were similar to what was observed in Dolliver et al., (2008a). The half-life of monensin for the
compost treatment was comparable to previously reported values: 4.1 – 23 d Watanabe et al., (2008); 14.7
– 30.1 d Storteboom et al., (2007); and 17 d (Dolliver et al., 2008). In both treatments, the data point on
day 50 disproportionately influenced the mathematical analysis of monensin degradation.
Figure 5.2: Average total extractable monensin concentration of compost piles versus time.
y = 0.3752e-0.012x R² = 0.2792
0
0.2
0.4
0.6
0.8
1
0 2 4 6 8 10 12 14 16
Mo
ne
nsi
n C
on
c. (
mg
/k
g d
ry w
eig
ht)
Time (d)
Monensin Degradation (Compost Piles)
Series1
Expon. (Series1)

47
Figure 5.3: Average total extractable monensin concentration of static piles versus time.
Examining the four replications for each treatment (Appendix C) a clear pattern is evident where
the methanol extraction monensin concentrations declines rapidly and were no longer detected past the
10th d of sampling. In comparison, water extractable monensin concentrations were detected to the 50
th d
of the study. This may be due to the reported sorption coefficient (Kd) of 9.3 L kg-1
(Elanco Products
Company, 1989), which is in the range also reported by (Sassman and Lee, 2007, Davis et al., 2006, and
Kumar et al., 2005). Song et al., (2010) reported monensin Kd values ranging from 1.4 L kg-1
– 8.3 L kg-1
.
This low Kd value indicates that monensin is not tightly adsorbed thus promoting mobility. In
comparison, other antibiotics such as chlortetracycline, with high Kd values (1280 – 2386 L kg-1
), are less
mobile. In this case, the mobility occurred in the aqueous phase, indicating monensin’s propensity to
reach the aqueous environment. This was further validated by Song et al., (2010) who concluded,
“monensin sorbed by soils is predictably released into the surface water during rainfall events.”
y = 0.5895e-0.051x R² = 0.6389
0
0.2
0.4
0.6
0.8
1
0 2 4 6 8 10 12 14 16
Mo
ne
nsi
n C
on
c. (
mg
/k
g d
ry w
eig
ht)
Time (d)
Monensin Degradation (Static Piles)
Series1
Expon. (Series1)

48
Another thought is that the microbes are attracted to the water interface of the compost where the
monensin is adsorbed. This allows the microbes to readily degrade the monensin that is not strongly
adsorbed to the surface of the compost. This degradation would also model an interfacial kinetic
expression and follow a similar logarithmic trend (Dunn, 1968). As a result the monensin that is not
degraded may be found in the aqueous phase due to its low Kd value. The water extractable monensin
concentrations encompassed approximately 77.9% (compost treatments) and 83.8% (static treatments) of
the total monensin concentrations for the entire study, this is summarized in Table 5.8. From analysis of
both treatments, it was concluded that the water extractable monensin concentrations were most
significant and warrant further study.
Table 5.8: Monensin concentration unit totals by extraction method. Note, water-extractable monensin
concentrations make up 77.9% (compost) and 83.8% (static) of total-extractable monensin.
Pile CP1 CP2 CP3 CP4
Ext-Type
Water-
Ext
Meth-
Ext
Total-
Ext
Water-
Ext
Meth-
Ext
Total-
Ext
Water-
Ext
Meth-
Ext
Total-
Ext
Water-
Ext
Meth-
Ext
Total-
Ext
Total 2.41 0.71 3.12 2.42 0.43 2.85 2.30 0.58 2.88 2.48 1.08 3.56
Percentage 77.2 22.8 100.0 84.9 15.1 100.0 79.8 20.2 100.0 69.6 30.4 100.0
Pile SP1 SP2 SP3 SP4
Ext-Type
Water-
Ext
Meth-
Ext
Total-
Ext
Water-
Ext
Meth-
Ext
Total-
Ext
Water-
Ext
Meth-
Ext
Total-
Ext
Water-
Ext
Meth-
Ext
Total-
Ext
Total 3.69 0.45 4.14 2.48 0.81 3.29 3.76 0.69 4.45 2.63 0.42 3.05
Percentage 89.2 10.8 100.0 75.3 24.7 100.0 84.5 15.5 100.0 86.3 13.7 100.0
Between sampling day 16 – 50, there were 142 mm of rainfall. Due to that significant amount of
rainfall it is possible that monensin could have been removed via runoff instead of through degradation.
Mass balance calculations, shown in Appendix D, were completed to quantify the loss of monensin via
runoff. Monensin removal was modeled as follows: Removal = degradation + runoff losses (no
volatilization). To start, the total monensin lost between day 16 – 50 was calculated, which provided a
benchmark for the mass of monensin that was present. A water balance was calculated to determine the
impact of precipitation on the piles, where: Precipitation = MC + Runoff losses + Evaporation. In this
water balance, evaporation was neglected due to the high MC of the piles and the heavy rainfall over the
34 day period. The volume of runoff was calculated based on MC and precipitation, which was defined
as: Runoff losses = Precipitation - ∆MC. From the runoff volume calculation, the mass of monensin lost
in the runoff was then calculated assuming 4.04 ng mL -1
(compost) and 3.98 ng mL -1
(static) for
monensin concentrations collected from runoff samples.
49
The total mass of monensin lost from day 16 – 50 only accounted for 21% (compost) and 22%
(static) of the total mass of monensin from day 0. According to the mass balance, approximately 1,852 L
of runoff volume came from the compost treatments and 1,701 L from the static treatments. Those values
are conservative (on the high side) due to evaporation being neglected in the water balance equation. The
total mass of monensin measured from the runoff, between day 16 – 50 accounted for 7.48 mg from the
compost and 6.6 mg from the static treatments respectively. The total monensin lost due to runoff
accounted for < 2% of the total monensin available from day 16 – 50. So it can be concluded that little of
the monensin during that 34-day period was attributable to removal via runoff. Thus it was concluded
that moennsin removal from the piles was predominantly due to degradation. Volatilization was
eliminated as a loss mechanism because of monensins’ non-volatile nature.

50
Chapter 6
Conclusions
6.1 Implications of this study
This study mimicked physiological processes in which metabolites are secreted in manure by
dairy cattle, unlike previous studies were manures were spiked. The results of this study showed that
compost and static treatments have the ability to degrade monensin in dairy manure before land
application and can be used as manure management options by dairy producers. When composting in an
outdoor setting, piles should be covered to prevent runoff. The average half-lives of the treatments were
57.8 d (compost) and 13.6 d (static) respectively. Half-lives reported in the literature range from 4.1 to
30.1 days (Watanabe et al. 2008 and Storteboom et al. 2007). Specifically, static treatments required less
maintenance time, and would allow dairy producers to be more flexible with time often committed to
manure management. Neither treatment completely degraded monensin over the 50 d period but
concentrations were greatly reduced.
Methanol-extractable monensin, that adsorbed to the organic material dissipated after d 10 of
sampling. This may indicate that bound monensin is degraded quickly or is rapidly transformed to a
water soluble form. Water-extractable monensin was more prevalent than methanol-extractable
monensin. This study has shown that, even though monensin was degraded to lower concentrations it can
still persist in the aqueous phase. Water-extractable monensin was detected up to d 16. Water-extractable
monensin was also detected in three out of eight piles on the last day of sampling (d 50). This may be
evidence proving monensin poses an environmental concern in aquatic environments. This concern was
further substantiated by the detection of monensin in runoff from both treatments, although this study was
not designed to evaluate runoff. Monensin concentrations in runoff averaged 4.04 ng mL -1
(compost
n=3) and 3.98 ng mL -1
(static n=3).
Due to the excessive precipitation (142 mm) towards the end of the study, a mass balance was
used to determine if degradation or dissipation due to washout of the monensin was occurring. Monensin
removal was considered to be losses due to degradation and runoff losses with (no volatilization). A
water balance was also used to determine the impact of precipitation on the piles where: Precipitation =
∆MC + runoff losses + evaporation. This gave a conservative estimate of precipitation because

51
evaporation was neglected. Approximately 83.7% of the precipitation that fell on the compost treatment
resulted in runoff and 76.8% for the static treatment. The total mass of monensin lost due to runoff
accounted for <2% of the total mass of monensin from day 16 – 50. This showed that degradation was
the driving mechanism that had the most influence on the fate of monensin in this study. Dissipation into
runoff of monensin had little to no impact of the fate of monensin in this study.
The Kd of monensin is a likely indicator of its potential to exist in the aqueous phase and should
be further investigated in compost. The concentrations of monensin observed in this study were below
the reported levels that have toxic effects on humans and aquatic life. To date, there have been no studies
to investigate the effects of low concentrations of antibiotics including monensin, in the environment over
a long period of time.
The effects of these low concentrations are unknown and warrant investigation. Over the 50 d
duration of this study, the temperature (pile and ambient), moisture content, organic matter, and rainfall
were all monitored and no correlation was found in respect to monensin degradation. A more
comprehensive study should be conducted to investigate the influence of those variables on monensin
degradation. With the large use of monensin in the dairy industry and its frequent detection in aqueous
environments, it is imperative that more monitoring studies are started to gain a stronger understanding of
this issue.

52
Appendices

53
Appendix A
Figure A-1: Compost pile #1 temperature profile
Figure A-2: Compost pile # 2 temperature profile
0
10
20
30
40
50
60
0 10 20 30 40 50
Te
mp
era
ture
(C
)
Days
CP 1 Temperature Profile
CP1
Ambient
0
10
20
30
40
50
60
0 10 20 30 40 50
Te
mp
era
ture
(C
)
Days
CP 2 Temperature Profile
CP2
Ambient
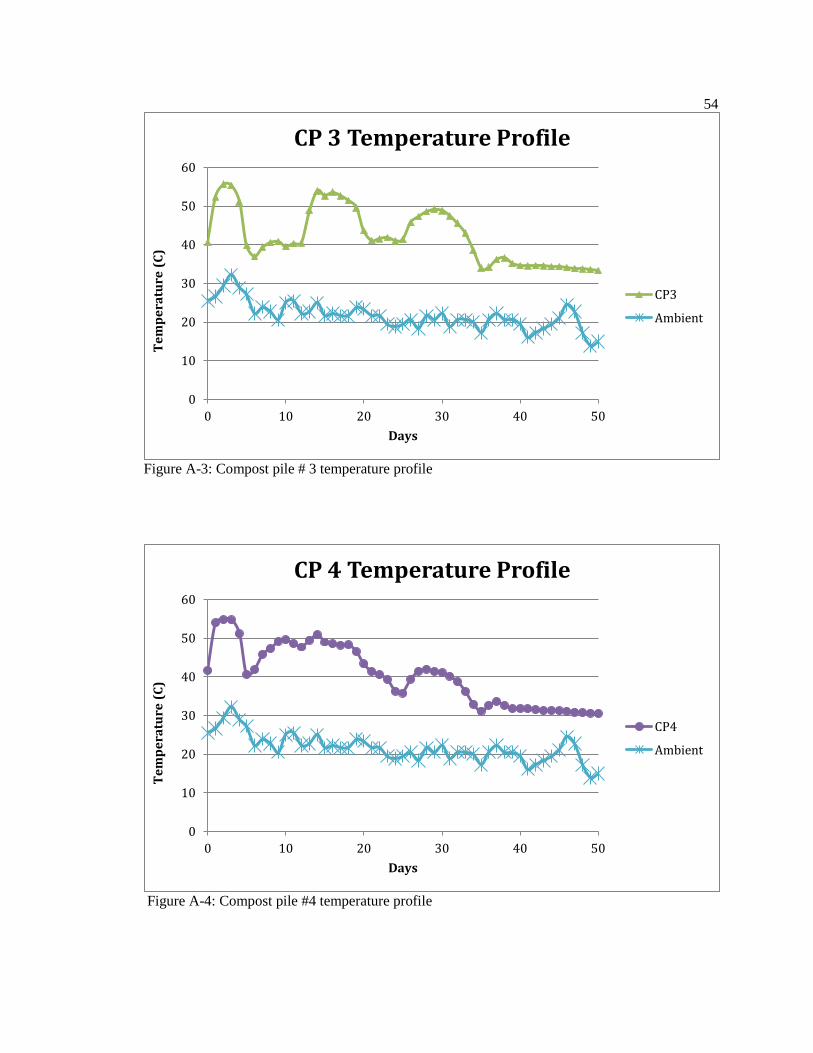
54
Figure A-3: Compost pile # 3 temperature profile
Figure A-4: Compost pile #4 temperature profile
0
10
20
30
40
50
60
0 10 20 30 40 50
Te
mp
era
ture
(C
)
Days
CP 3 Temperature Profile
CP3
Ambient
0
10
20
30
40
50
60
0 10 20 30 40 50
Te
mp
era
ture
(C
)
Days
CP 4 Temperature Profile
CP4
Ambient

55
Figure A-5: Static pile #1 temperature profile
Figure A-6: Static pile #2 temperature profile
0
5
10
15
20
25
30
35
40
45
50
0 10 20 30 40 50
Te
mp
era
ture
(C
)
Days
SP 1 Temperature Profile
SP1
Ambient
0
5
10
15
20
25
30
35
40
45
50
0 10 20 30 40 50
Te
mp
era
ture
(C
)
Days
SP 2 Temperature Profile
SP2
Ambient

56
Figure A-7: Static pile #3 temperature profile
Figure A-8: Static pile #4 temperature profile
0
5
10
15
20
25
30
35
40
45
50
0 10 20 30 40 50
Te
mp
era
ture
(C
)
Days
SP 3 Temperature Profile
SP3
Ambient
0
10
20
30
40
50
60
0 10 20 30 40 50
Te
mp
era
ture
(C
)
Days
SP 4 Temperature Profile
SP4
Ambient

57
Appendix B
Figure B-1: Compost treatment organic matter content profile. Note: 100% refers to the initial
(day 0) O.M. content.

58
Figure B-2: Static treatment organic matter content profile. Note: 100% refers to the initial
(day 0) O.M. content.
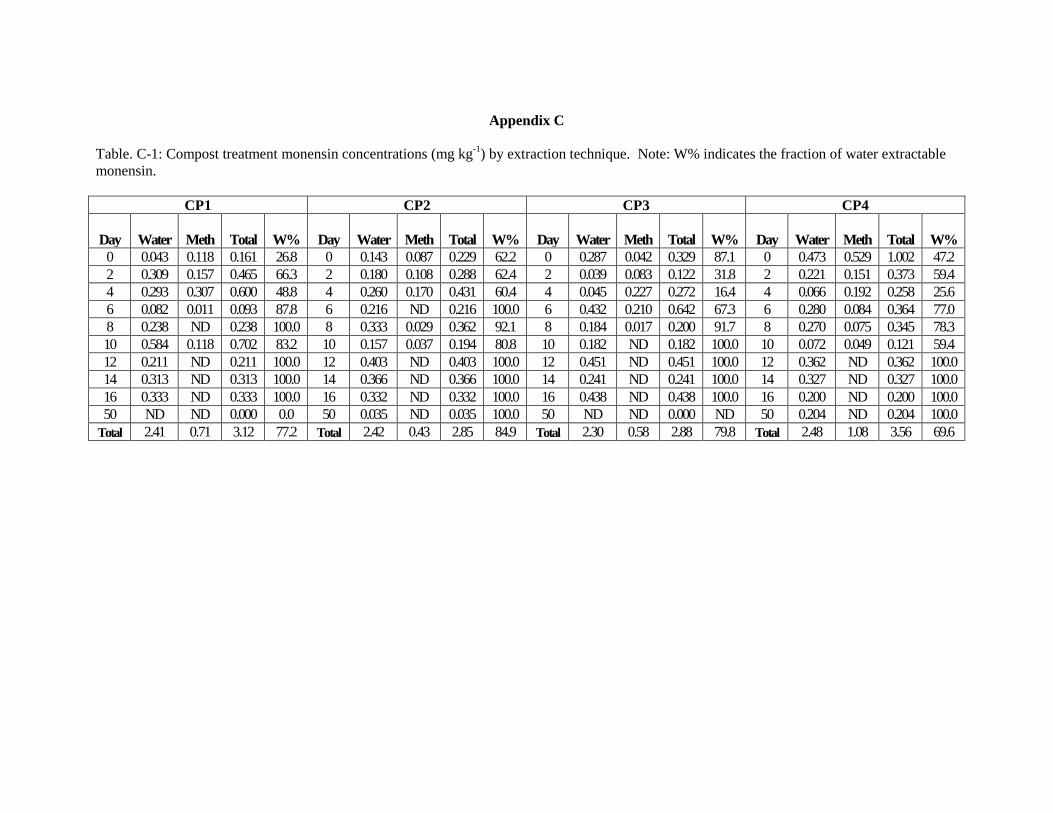
Appendix C
Table. C-1: Compost treatment monensin concentrations (mg kg-1
) by extraction technique. Note: W% indicates the fraction of water extractable
monensin.
CP1 CP2 CP3 CP4
Day Water Meth Total W% Day Water Meth Total W% Day Water Meth Total
W% Day Water Meth Total W%
0 0.043 0.118 0.161 26.8 0 0.143 0.087 0.229 62.2 0 0.287 0.042 0.329 87.1 0 0.473 0.529 1.002 47.2
2 0.309 0.157 0.465 66.3 2 0.180 0.108 0.288 62.4 2 0.039 0.083 0.122 31.8 2 0.221 0.151 0.373 59.4
4 0.293 0.307 0.600 48.8 4 0.260 0.170 0.431 60.4 4 0.045 0.227 0.272 16.4 4 0.066 0.192 0.258 25.6
6 0.082 0.011 0.093 87.8 6 0.216 ND 0.216 100.0 6 0.432 0.210 0.642 67.3 6 0.280 0.084 0.364 77.0
8 0.238 ND 0.238 100.0 8 0.333 0.029 0.362 92.1 8 0.184 0.017 0.200 91.7 8 0.270 0.075 0.345 78.3
10 0.584 0.118 0.702 83.2 10 0.157 0.037 0.194 80.8 10 0.182 ND 0.182 100.0 10 0.072 0.049 0.121 59.4
12 0.211 ND 0.211 100.0 12 0.403 ND 0.403 100.0 12 0.451 ND 0.451 100.0 12 0.362 ND 0.362 100.0
14 0.313 ND 0.313 100.0 14 0.366 ND 0.366 100.0 14 0.241 ND 0.241 100.0 14 0.327 ND 0.327 100.0
16 0.333 ND 0.333 100.0 16 0.332 ND 0.332 100.0 16 0.438 ND 0.438 100.0 16 0.200 ND 0.200 100.0
50 ND ND 0.000 0.0 50 0.035 ND 0.035 100.0 50 ND ND 0.000 ND 50 0.204 ND 0.204 100.0
Total 2.41 0.71 3.12 77.2 Total 2.42 0.43 2.85 84.9 Total 2.30 0.58 2.88 79.8 Total 2.48 1.08 3.56 69.6

60
Table. C-2: Static treatment monensin concentrations (mg kg-1
) by extraction technique. Note: W% indicates the fraction of water extractable
monensin.
SP1 SP2 SP3 SP4 Day Water Meth Total W% Day Water Meth Total W% Day Water Meth Total W% Day Water Meth Total W%
0 1.771 0.059 1.829 96.8 0 0.456 0.182 0.637 71.5 0 0.422 0.214 0.636 66.3 0 0.141 0.163 0.304 46.4
2 0.249 0.191 0.441 56.6 2 0.337 0.055 0.392 86.0 2 0.392 0.062 0.454 86.4 2 0.480 0.033 0.513 93.6
4 0.082 0.104 0.187 44.1 4 0.083 0.009 0.092 90.1 4 0.731 0.111 0.843 86.8 4 0.261 0.049 0.310 84.2
6 0.098 ND 0.098 100 6 0.333 0.306 0.638 52.1 6 0.407 0.119 0.526 77.4 6 0.335 0.038 0.372 89.9
8 0.321 0.074 0.395 81.2 8 0.240 0.119 0.359 66.9 8 0.261 0.116 0.376 69.2 8 0.379 0.053 0.432 87.7
10 0.078 0.020 0.098 79.4 10 0.187 0.134 0.320 58.3 10 0.485 0.066 0.552 88.0 10 0.271 0.080 0.351 77.2
12 0.501 ND 0.501 100 12 0.369 ND 0.369 100 12 0.388 ND 0.388 100 12 0.252 ND 0.252 100
14 0.309 ND 0.309 100 14 0.163 ND 0.163 100 14 0.211 ND 0.211 100 14 0.288 ND 0.288 100
16 0.249 ND 0.249 100 16 0.310 ND 0.310 100 16 0.466 ND 0.466 100 16 0.222 ND 0.222 100
50 0.034 ND 0.034 100 50 ND ND 0.000 0.0 50 ND ND 0.000 0.0 50 ND ND 0 0.0
Total 3.69 0.45 4.14 89.2 Total 2.48 0.80 3.28 75.5 Total 3.76 0.69 4.45 84.5 Total 2.63 0.42 3.05 86.3

Appendix D
Mass Balance of Total Monensin Lost
Day 16 – Day 50
Introduction:
Due to the excessive rainfall during the period of the experiment, runoff losses occurred from the piles of
both treatments. To determine the extent to which loss of monensin in runoff contributed to its removal
from the piles, the following analysis was conducted. Since a goal of the research was to evaluate the
degradation of monensin under compost and static conditions, it was important to verify if runoff losses
were significant enough to result in substantial overestimation of removal due to microbial degradation.
Total amount of compost:
Givens:
CP SP
Day 0: 2,925.7 kg Mass of material Day 0: 2,925.7 kg Mass of material
Monensin Conc. Totals Monensin Conc. Totals
Pile Height: *Assumption: The width and the length of the piles stayed the same, and only the height changed. The
fractional reduction in pile height is assumed to be equivalent to the fractional loss of compost mass.
CP SP
58% loss in height 33% loss in height
Estimate of mass of material from Day16 – 50
CP
SP
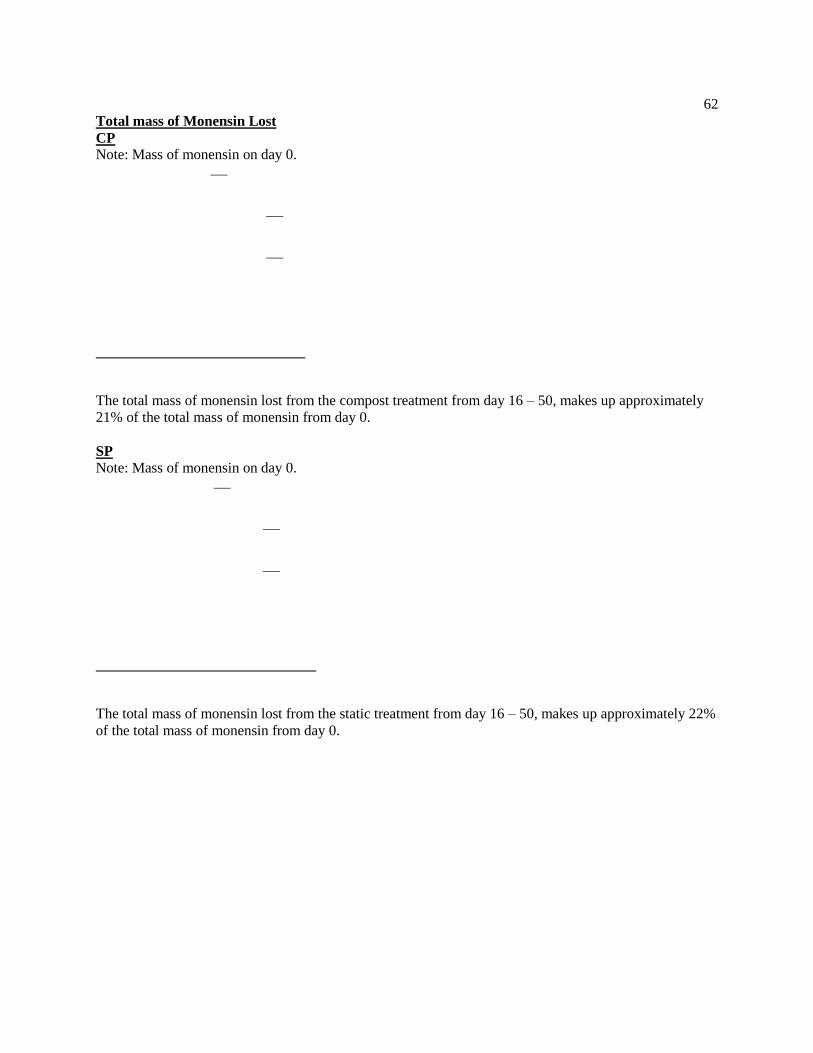
62
Total mass of Monensin Lost
CP
Note: Mass of monensin on day 0.
The total mass of monensin lost from the compost treatment from day 16 – 50, makes up approximately
21% of the total mass of monensin from day 0.
SP
Note: Mass of monensin on day 0.
The total mass of monensin lost from the static treatment from day 16 – 50, makes up approximately 22%
of the total mass of monensin from day 0.
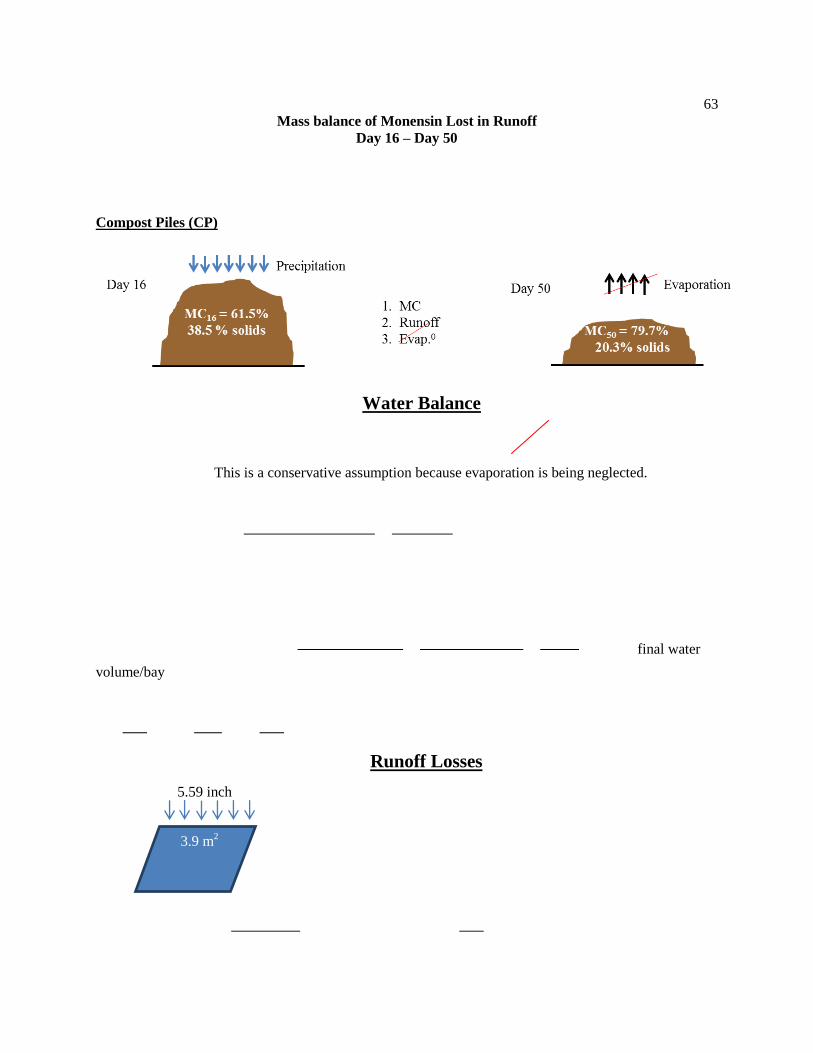
63
Mass balance of Monensin Lost in Runoff
Day 16 – Day 50
Compost Piles (CP)
Water Balance
This is a conservative assumption because evaporation is being neglected.
final water
volume/bay
Runoff Losses
3.9 m2
5.59 inch
inch

64
Mass of Monensin from Runoff Losses
from
compost.

65
Static Piles (SP)
Water Balance
This is a conservative assumption because evaporation is being neglected.
Runoff Losses
3.9 m2
5.59 inch
66
Mass of Monensin from Runoff Losses
from static.
Concluding Remarks:
For both CP and SP treatments, the calculated amounts of monensin lost in runoff were only 1 – 2% of
the total monensin present at day 16. Several assumptions have been made in this analysis. The
assumption of no evaporation from the piles is clearly an unrealistic assumption. However, this
assumption resulted in a greater calculated runoff volume than actually occurred. If evaporation was
accounted for, the percentage losses of monensin would be lower than calculated. This reasoning lends
credibility to the conclusion that monensin disappearance from the piles between days 16 and 50 was
predominately due to degradation.
67
References
Aga, D., R. Goldfish, and P. Kulshrestha. 2003. Application of ELISA in determining the fate
of tetracyclines in land-applied livestock wastes. The Analyst, Royal Society of
Chemistry. 123: 658 – 662.
Aga, D., S. O’Connor, S. Ensley, J. Payero, D. Snow, and D. Tarkalson. 2005. Determination of
persistence of tetracycline antibiotics and their degradates in manure-amended soil
using enzyme-linked immunosorbent assay and liquid chromatograpy-mass
spectrometry. J. Agricultural and Food Chemistry. 53: 7165 – 7171.
ASAE Standards. 2005. D384.2. Manure production and characteristics. St. Joseph, Mich.: ASAE
Basaraba, R., F. Oehme, M. Vorhies, and G. Stokka. 1999. Toxicosis in cattle from concurrent
Feeding of monensin and dried distiller’s grains contaminated with macrolide antibiotics.
J. Vet Diagn Invest. 11: 79 – 86.
Boxall, A., P. Johnson, E. Smith, C. Sinclair, E. Stutt, and L. Levy. 2006. Uptake of veterinary
medicines from soils into plants. J. Agricultural and Food Chemistry. 54: 2288 – 2297.
Callaway, T., T. Edrington, J. Rychlik, K. Genovese, T. Poole, Y. Jung, K. Bischoff, R.
Anderson, and D. Nisbet. 2003. Ionophores: their use as runinant growth promotants
and impact on food safety. Curr. Iss. Intest. Microbiol. 4: 43 – 51.
Carlson, J., and S. Mabury. 2006. Dissipation kinetics and mobility of chlortetracycline,
tylosin and monensin in an agricultural soil in Northumberland County, Ontario, Canada.
Environ. Toxicology and Chemistry. 25: 1 – 10.
CRS. 2010. Antibiotic Use in Agriculture: Background and Legislation. Washington, D.C.:
Congressional Research Service.
Davis, J.G., C.C. Truman, S.C. Kim, J.C. Ascough II, and K. Carlson. 2006. Antibiotic
transport via runoff and soil loss. J. Environ. Qual. 35: 2250 – 2260.

68
Dolliver, H., and S. Gupta. 2008a. Antibiotic losses from unprotected manure stockpiles.
J. Environ. Qual. 37: 1238 – 1244.
Dolliver, H., and S. Gupta. 2008b. Antibiotic losses in leaching and surface runoff from
manure-amended agricultural land. J. Environ. Qual. 37: 1227 – 1237.
Dolliver, H., S. Gupta, and S. Noll. 2008a. Antibiotic degradation during manure composting.
J. Environ. Qual. 37: 1245 – 1253.
Dolliver, H., K. Kumar, S. Gupta, and A. Singh. 2008b. Application of enzyme- linked
immunosorbent assay analysis for determination of monensin in environmental
samples. J. Environ. Qual. 37: 1220 – 1226.
Donoho, A. 1984. Biochemical studies on the fate of monensin in animals and in the
environment. J. Anim. Sci. 58: 1528 – 1539.
Dougherty, M. 1998. Composting for municipalities: planning and design considerations.
NRAES. Natural, Resources, Agricultural, Engineering Service, Ithaca, New York.
Dunn, J.I. 1968. An interfacial kinetics model for hydrocarbon oxidation. Biotechnology and
Bioengineering. 10 (6): 891 - 894
Elanco Animal Health. 2010. Rumensin 90 Premix, material safety data sheet. Greenfield, IN.:
Elanco Animal Health.
Elanco Products Company. 1989. Environmental assessment for the use of rumensin premixes
in the feed of beef cattle for the prevention and control of coccidiosis. NADA 095-735.
Technical Report. Indianapolis, IN.
EPA. 1995. Composting: decision maker’s guide to solid waste management. Volume II (EPA
530-R-95-023), USA.
69
FDA-CVM. 2010. 2009 Summary report: antimicrobials sold or distributed for use in food-
producing animals. Washington, D.C.: Food and Drug Administration-Centers for
Veterinary Medicine.
Foley, E., S. Lee, N. Hartley. 1946. The effect of penicillin on staphylococci and streptococci
commonly associated with bovine mastitis. J. Food. Technol. 8: 129 – 133.
Forrest, F., K. Lorenz, T. Thompson, J. Keensliside, J. Kendall, and J. Charest. 2011. A scoping
study of livestock antimicrobials in agricultural streams of Alberta. Canadian Water
Resources Journal 36: 1-16.
Gupta, R.C. 2011. Ionophores. Reproductive and developmental toxicology, 373 – 384.
London, UK.: Elsevier Inc.
Kemper, N., H. Färber, D. Skutlarek, and J. Krieter. 2008. Analysis of antibiotic residues in
liquid manure and leachate of dairy farms in Northern Germany. Agricultural Water
Management. 95: 1288 – 1292.
Kemper, N. 2007. Veterinary antibiotics in the aquatic and terrestrial environment.
Ecological indicators 8: 1 – 13.
Kim, S., and K. Carlson. 2006. Occurrence of ionophore antibiotics in water and sediments
of a mixed-landscaped watershed. Water Research 40: 2549 – 2560.
Koplin, D.W., E. Furlong, M. Meyer, E. Thurman, S. Zaugg, L. Barber, and H. Buxton. 2002.
Pharmaceuticals, hormones, and the other organic waster water contaminants in U.S.
Streams, 1999 – 2000: a national reconnaissance. Environ. Sci. Technol. 36: 1202 –
1211.
Kumar, K., S. Gupta, S. Baidoo, Y. Chander, and C. Rosen. 2005. Antibiotic uptake by plants
from soil fertilized with animal manure. J. Environ. Qual. 34: 2082 – 2085.

70
Hansen, M., K. A. Krogh, E. Bjorklund, A. Brandt, and B. Halling-Sorensen. 2009a.
Analytical strategies for assessing ionophores in the environment. Trends in Analytical
Chemistry 28(5): 521 – 533.
Hansen, M., K. A. Krogh, E. Bjorklund, A. Brandt, and B. Halling-Sorensen. 2009b.
Environmental risk assessment of ionophores. Trends in Analytical Chemistry
28(5): 534 – 542.
Hillis, D., L. Lissemore, P. Sibley, and K. Soloman. 2007. Effects of monensin on zooplankton
communities in aquatic microcosoms. Envr. Sci. Technol 41: 6620 – 6626.
Hoagland, R.E. 1996. Herbicidal properties of the antibiotic monensin. J. Sci Food Agric. 70:
373 – 379.
Lissemore, L., C. Hao, P. Yang, P. Sibley, S. Mabury, and K. Solomon. 2006. An exposure
Assessment for selected pharmaceuticals within a watershed in Southern Ontario.
Chemosphere. 64: 717 – 729.
McAllister, T., L. Yanke, G. Inglis, and M. Olson. 2001. Is antibiotic use in dairy cattle
causing antibiotic resistance? Advances in Diary Technology. 13: 229 – 247.
McGuffey, R.K., L.F. Richardson, and J.I.D. Wilkinson. 2001. Ionophore for dairy cattle:
Current status and future outlook. J. Dairy Sci. 84 (E. Suppl.): E194 – E203.
Meyer, D., I. Garnett, and J. Gutherie. 1997. A survey of dairy manure management practices in
California. J. Dairy Sci. 80: 1841 – 1845.
Mollenhauer, H. H., D. J. Morre´, and R. E. Proleskey. 1986. Monensin inhibition of growth of
ryegrass seedlings. Bot. Gaz. 147:432–436.
Muller, L., F. Bargo, and I. Ipharraguerre. 2006. Review: monensin for grazing dairy cows.
Prof. Anim. Sc. 22: 115 – 119.
71
Nebbia C., L. Ceppa, M. Dacasto, M. Carletti, and C. Nachtmann. 1999. Oxidative metabolism
of monensin in rat liver microsomes and interactions with tiamulin and other
chemotherapeutic agents: evidence for the involvement of cyctochrome P-450 3A
subfamily. Drug Metabolism and Disposition. (27) 9: 1039 – 1044.
Nebbia C., L. Ceppa, M. Dacasto, and M. Carletti. 2001. Oxidative monensin metabolism and
cytochrome P450 3A content and functions in liver microsomes from horses, pigs, broiler
chicks, cattle, and rats. J Vet Pharmacol Ther 24:399–403.
Odongo, N., R. Bagg, G. Vessle, P. Dick, M. Or-Rashid, S. Hook, J. Gray, E. Kebreab, J. France,
B. McBride. 2007. Long-term effects of feeding monensin on methane production in
lactating dairy cows. J. Dairy Sci. 90: 1781 – 1788.
Patil, G.P. 2002. Composite sampling. Encyclopedia of environmetrics, 387 – 391. A.H. El-
Saarawi and W.W. Piegorsch, ed. Chichester. : John Wiley and Sons, Ltd.
Phipps, R., J. Wilkinson, L. Jonker, M. Tarrant, A. Jones, and A. Hodge. J. Dairy Sci. 83: 2789 –
2794.
Pressman, B., and M. Fahim. 1982. Pharmacology and toxicology of the monovalent
carboxylic ionophores. Ann. Rev. Pharmacol. Toxicol. 22: 465 – 490.
Purevjav, T. 2011. Effects of functional oils and monensin on cattle finishing programs.
PhD diss. Ames, Iowa.: Iowa State University, Department of Animal Science.
Ramaswamy, J., S.O. Prasher, R. M. Patel, S.A. Hussain, and S.F. Barrington. 2010. The effect
of composting on the degradation of a veterinary pharmaceutical. Bioresource
Technology 101(7): 2294 – 2299.
Roder, J.D. 2011. Ionophore toxicity and tolerance. Vet. Clin. Food. Anim. 27: 305 – 314.
Russell, J.B., and A.J. Houlihan. 2003. Ionophore resistance of ruminal bacteria and its
potential impact on human health. FEMS Microbiology Reviews 27: 65 – 74.

72
Rynk, R. 1992. On – farm composting handbook. NRAES-54. Natural Resource, Agriculture,
and Engineering Service, Ithaca, New York.
Sassman, S., and L. S. Lee. 2007. Sorption and degradation in soils of veterinary ionophore
antibiotics: Monensin and lasalocid. Environmental Toxicology and Chemistry 26 (8):
1614 – 1621.
Scott, J.C. 1952. Health and agriculture in China. Faber and Faber. London
Sekar, R., and H. Wu. 2006. Quantitative method for analysis of monensin in soil, water,
and urine by direct combination of single-drop microextraction with atmosphereic
pressure matrix-assisted laser desorption/ionization mass spectrometry. Anal.
Chem. 78: 6306 – 6313.
Schelling, G. 1984. Monensin mode of action in the rumen. J. Anim. Sci. 58: 1518 – 1527.
Song, Wenlu., Y. Ding, C. Chiou, and H. Li. 2010. Selected veterinary pharmaceuticals in
agricultural Water and soil from land application of animal manure. J. Environ. Qual. 39:
1211 – 1217.
Storteboom, H., S. Kim, K. Doesken, K. Carlson, J. Davis, and A. Pruden. 2007. Response
of antibiotics and resistance genes to high – intensity and low – intensity manure
management. J. Environ. Qual. 36: 1695 – 1703.
Szucs, G., V. Tanasi, P. Laczay, and K. Monostory. 2004. Biochemical background of toxic
interactions between tiamulin and monensin. Chemico-Biological Interactions.
147: 151 – 161.
Tedeschi, L., D. Fox, and T. Tylutki. 2003. Potential environmental benefits of ionophores in
ruminant diets. J. Environ. Qual. 32: 1591 – 1602.

73
USDA-NAHMS. 2008. Antibiotic use on U.S. dairy operations, 2002 and 2007. Fort Collins, CO: USDA
National Animal Health Monitoring System.
US Environmental Protection Agency. 2009. Occurrence of Contaminants of Emerging
Concern in Wastewater From Nine Publicly Owned Treatment Works. Report
EPA-821- R-09-009, Washington, DC.
Venglovsky, J., N. Sasakova, and I. Placha. 2009. Pathogens and antibiotic residues in
animal manures and hygienic and ecological risks to subsequent land application.
Bioresources Technology. 100: 5386 – 5391.
Watanbe, N., T. Harter, and B. Bergamaschi. 2008. Environmental occurrence and shallow
ground water detection of the antibiotic monensin from dairy farms. J. Environ. Qual. 37:
S-78 – 85.
Watanbe, N., B. Bergamaschi, K. Loftin, M. Meyer, and T. Harter. 2010. Use and
environmental occurrence of antibiotics in freestall dairy farms with manured forage
fields. Environ. Sci. Technol. 44 (17): 6591 – 6600.
Yoshida, N., M. Castro, C. Mortier, and A. Cirelli. 2007. Environmental behavior of antibiotic
monensin: preliminary studies in Argentina. Environ. Chem Lett. 5 (3): 157 – 160.
Yoshida, N., M. Castro, C. Mortier, and A. Cirelli. 2010. Degradation of monensin on soils:
influence of organic matter and water content. Chemistry and Ecology. 26 (1): 27 – 33.