A Theory of Urban Park Geography - Landscape Values
19
Journal of Leisure Research Copyright 2008 2008, Vol. 40, No.4, pp. 589–607 National Recreation and Park Association 1 Address correspondence to: Professor Gregory Brown, Department of Geography, Central Washington University, Ellensburg, WA 98926. e-mail: [email protected]. 589 A Theory of Urban Park Geography Gregory Brown 1 Central Washington University Abstract A theory of urban park values is presented using the theory of island biogeography as an analogue. The theory predicts that two factorsóthe size of park and distance from concentrated human habitationóinfluence the diversity of park values. The theory posits the diversity of human values for parks will increase with park size while the diversity of park values will decrease further from concentrated areas of human habi- tation. Spatial data from a study of Anchorage, Alaska, residents indicate a relatively strong relationship between park size and the diversity of park values and a weak, inverse relationship between distance from domicile and diversity of park values. The implications of the theory for urban area park planning are discussed. KEYWORDS: Park values, diversity, theory, island biogeography Introduction One of the more influential theories in contemporary ecology is the theory of island biogeography (MacArthur and Wilson, 1967). The theory posits that two fac- torsósize of island and distance from mainlandócombine to regulate the balance be- tween species immigration and extinction rates in island populations. The theory is backed by limited empirical data showing that smaller islands tend to have fewer spe- cies while islands closer to a mainland have higher numbers of species. The theory is compelling, in part, because it contains the essential ingredients of a good theoryóthe identification of variables (size, distance, and species diversity), a presumed relation- ship between the variables (species diversity increases with island size and decreases with distance from ìmainlandî), an explicit causal mechanism (equilibrium theory of immigration and extinction), and the empirical possibility for refutation or refinement (whether the theory fits observed phenomena). While the original conception of the theory applied to ìoceanicî islands, the theo- ry has been applied in a variety of terrestrial settings where islands are created through physical isolation (e.g., as in the case of mountain tops or ìsky islandsî) or fragmented natural landscapes (e.g., through urbanization, agriculture, or forestry practices). To the extent that islands and mainlands can be meaningfully ascribed to a set of physical
Transcript of A Theory of Urban Park Geography - Landscape Values
Journal of Leisure Research Copyright 20082008, Vol. 40, No.4, pp. 589–607 National Recreation and Park Association
1 Address correspondence to: Professor Gregory Brown, Department of Geography, Central Washington University, Ellensburg, WA 98926. e-mail: [email protected].
589
A Theory of Urban Park Geography
Gregory Brown1
Central Washington University
Abstract
A theory of urban park values is presented using the theory of island biogeography as an analogue. The theory predicts that two factorsóthe size of park and distance from concentrated human habitationóinfluence the diversity of park values. The theory posits the diversity of human values for parks will increase with park size while the diversity of park values will decrease further from concentrated areas of human habi-tation. Spatial data from a study of Anchorage, Alaska, residents indicate a relatively strong relationship between park size and the diversity of park values and a weak, inverse relationship between distance from domicile and diversity of park values. The implications of the theory for urban area park planning are discussed.
Keywords: Park values, diversity, theory, island biogeography
Introduction
One of the more influential theories in contemporary ecology is the theory of island biogeography (MacArthur and Wilson, 1967). The theory posits that two fac-torsósize of island and distance from mainlandócombine to regulate the balance be-tween species immigration and extinction rates in island populations. The theory is backed by limited empirical data showing that smaller islands tend to have fewer spe-cies while islands closer to a mainland have higher numbers of species. The theory is compelling, in part, because it contains the essential ingredients of a good theoryóthe identification of variables (size, distance, and species diversity), a presumed relation-ship between the variables (species diversity increases with island size and decreases with distance from ìmainlandî), an explicit causal mechanism (equilibrium theory of immigration and extinction), and the empirical possibility for refutation or refinement (whether the theory fits observed phenomena).
While the original conception of the theory applied to ìoceanicî islands, the theo-ry has been applied in a variety of terrestrial settings where islands are created through physical isolation (e.g., as in the case of mountain tops or ìsky islandsî) or fragmented natural landscapes (e.g., through urbanization, agriculture, or forestry practices). To the extent that islands and mainlands can be meaningfully ascribed to a set of physical

BROWN590
settings, the spatial variables of island size and distance from mainland can be plot-ted against the observed distribution of a measurable variable of interest such as the number of species present.
In the theory of island biogeography, size and distance appear to influence the observed distribution of plant and animal speciesóin particular, the diversity of species. Using the theory of island biogeography as an analogue, the structure of this theory is extended to the realm of human geography and the virtual islands of parks that exist within most urban areas. Using data from a study of urban parks in Anchorage, Alaska, the key spatial variables of park size and distance from concentrated human habitation are posited to influence the distribution of human values that are associated with urban parks. The theory is stated as follows: all else being equal, the diversity of human values for urban parks will increase with urban park size while the diversity of human park values will decrease the further one moves from concentrated areas of human habitation.
Park Values
Park values, as defined and used in this theory, refer to values that humans associ-ate with the geographic areas that comprise the parks. While Rokeach (1973) distin-guished between held values and assigned values, these value types are interrelated in that assigned values usually reflect a personís held values (Brown, 1984). As operation-alized in this study, it is not possible to parse whether a park value is held or assigned or both, nor is it essential to the theory. The measurement of landscape values in general, from which park values are derived, are based on a transactional concept of human-landscape relationships (Zube, 1987) wherein humans are active participants in the landscapeóthinking, feeling, and actingóleading to the attribution and valuing of specific places (Brown, 2005). The park values may be instrumental in that the parks are viewed as a means to achieve desired human outcomes, e.g., recreation. The park values may also be functional values in that they may contribute to another value with-out the intervention of human consciousness, e.g., providing wildlife habitat. Func-tional values exist regardless of humansí awareness of them (Lockwood, 1999). The eight park values referenced in this studyóscenic, recreation, natural, development/economic, social/cultural, wildlife, environmental quality, and futureóare respondent park values that consist of both instrumental and functional park values.
The distinction between use and non-use values is important to a theory of urban park values. Some park values result from direct human use or interaction with the park while other values may be held from a distance. For example, recreation value is clearly a use-related value while environmental quality value (providing clean air and water) is primarily a non-use value. The distribution of use and non-use park values is not assumed to be homogenous and is examined as a function of park size and loca-tion in urban areas.
Urban Parks as Islands
Whereas land and waterscapes with distinct physical boundaries provide the basis for discriminating between islands and mainlands, park areas with their contrast-ing, surrounding urban development may be viewed as islands and mainlands. In this theory, urban parks are viewed as islands of relatively distinctive land use and value
A THEORY OF URBAN PARK GEOGRAPHY 591
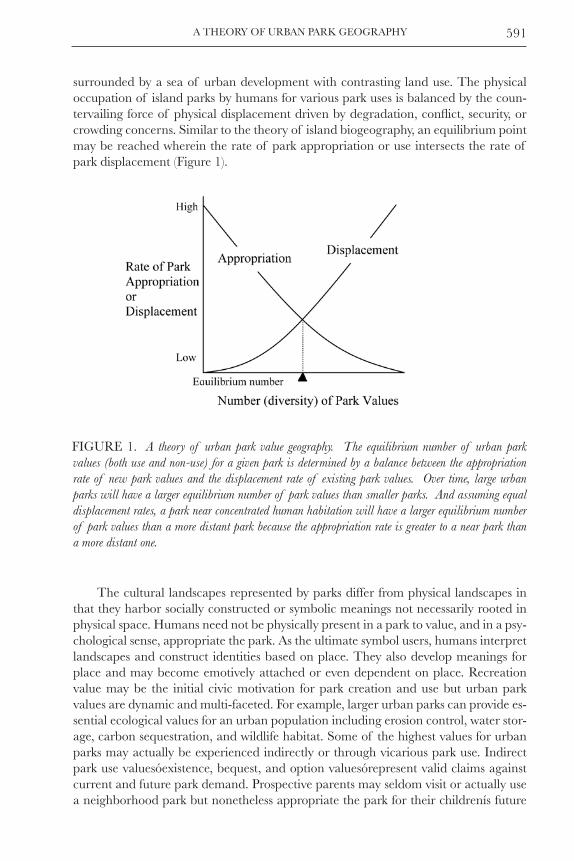
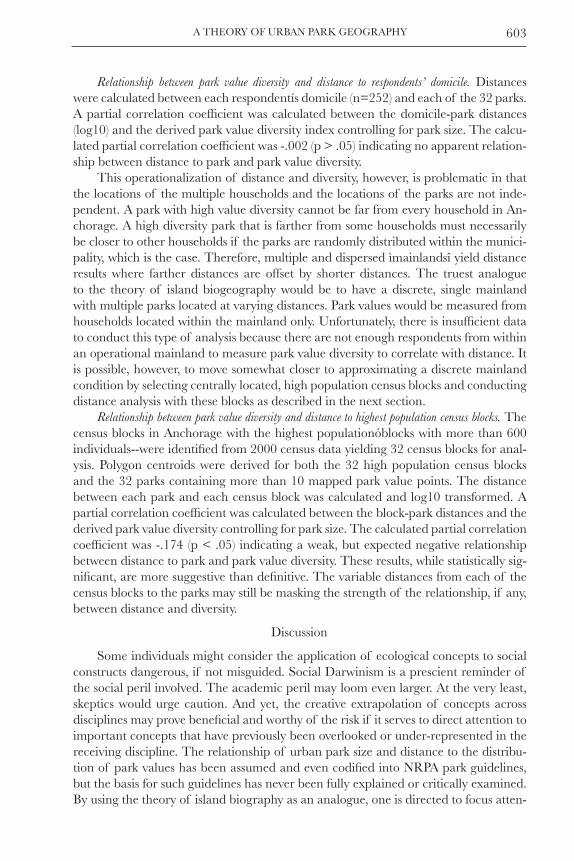
surrounded by a sea of urban development with contrasting land use. The physical occupation of island parks by humans for various park uses is balanced by the coun-tervailing force of physical displacement driven by degradation, conflict, security, or crowding concerns. Similar to the theory of island biogeography, an equilibrium point may be reached wherein the rate of park appropriation or use intersects the rate of park displacement (Figure 1).
The cultural landscapes represented by parks differ from physical landscapes in that they harbor socially constructed or symbolic meanings not necessarily rooted in physical space. Humans need not be physically present in a park to value, and in a psy-chological sense, appropriate the park. As the ultimate symbol users, humans interpret landscapes and construct identities based on place. They also develop meanings for place and may become emotively attached or even dependent on place. Recreation value may be the initial civic motivation for park creation and use but urban park values are dynamic and multi-faceted. For example, larger urban parks can provide es-sential ecological values for an urban population including erosion control, water stor-age, carbon sequestration, and wildlife habitat. Some of the highest values for urban parks may actually be experienced indirectly or through vicarious park use. Indirect park use valuesóexistence, bequest, and option valuesórepresent valid claims against current and future park demand. Prospective parents may seldom visit or actually use a neighborhood park but nonetheless appropriate the park for their childrenís future
FIGURE 1. A theory of urban park value geography. The equilibrium number of urban park values (both use and non-use) for a given park is determined by a balance between the appropriation rate of new park values and the displacement rate of existing park values. Over time, large urban parks will have a larger equilibrium number of park values than smaller parks. And assuming equal displacement rates, a park near concentrated human habitation will have a larger equilibrium number of park values than a more distant park because the appropriation rate is greater to a near park than a more distant one.
BROWN592
use. Parks also provide natural open space and environmental values that can increase in importance with changing urban conditions such as higher housing density.
Park Appropriation
For urban landscapes that include island parks, the concept of ìimmigrationî in biogeography is expanded to include not only physical movement into a park, but psy-chological or symbolic appropriation. For the biogeographer, immigration is the physical movement of species or genetic material across boundaries. For the human geogra-pher, the appropriation of parklands includes both human physical movement into park boundaries as well as the cognitive or affective assignment of values to parklands. Park appropriation then is a function of both direct use and non-use values.
park appropriation = f(direct use values, nonuse values)
The rate of appropriation for a small park situated in a dense urban area could be very high even with little actual direct park use because appropriation includes both use and non-use values. For some urban parks, non-use values will likely exceed use values. Recent studies indicate that for some larger natural areas on public lands, the non-use values exceed use values including recreation (Cordell et al., 2003; Brown and Alessa, 2005). Thus, direct use of parklands is only a partial, and even misleading, indicator of actual park value.
Park Displacement
For the biogeographer, extinction occurs when species are unable to sustain a minimum viable population due to any number of factors associated with limited hab-itat. For the human geographer, the concept of displacement is the extinction analogue. Humans may terminate use of a park area for a variety of reasons including degrada-tion of the physical environment, conflict over use, security issues, crowding, or shifting values, either held values or values assigned to the parklands.
Park displacement = f(degradation, conflict, security, crowding, shifting values)
Size and Distance as Variables influencing Appropriation and Displacement
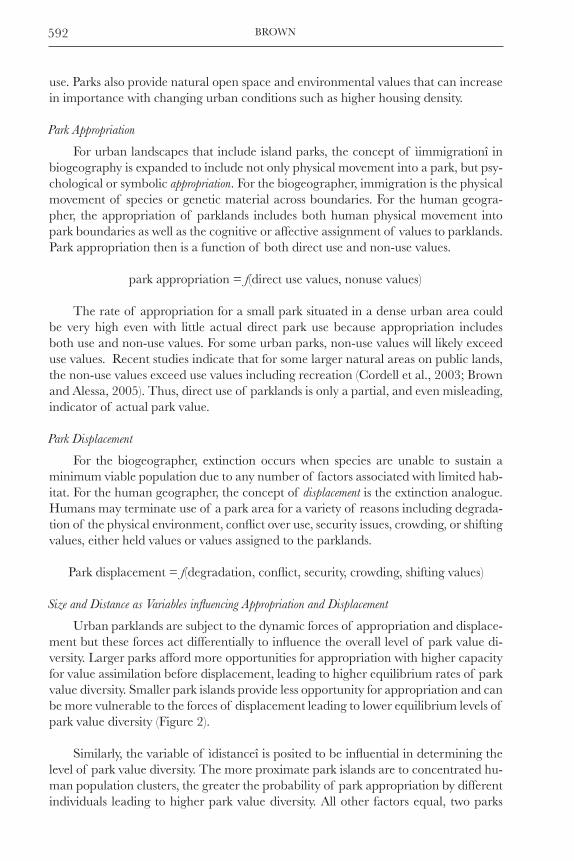
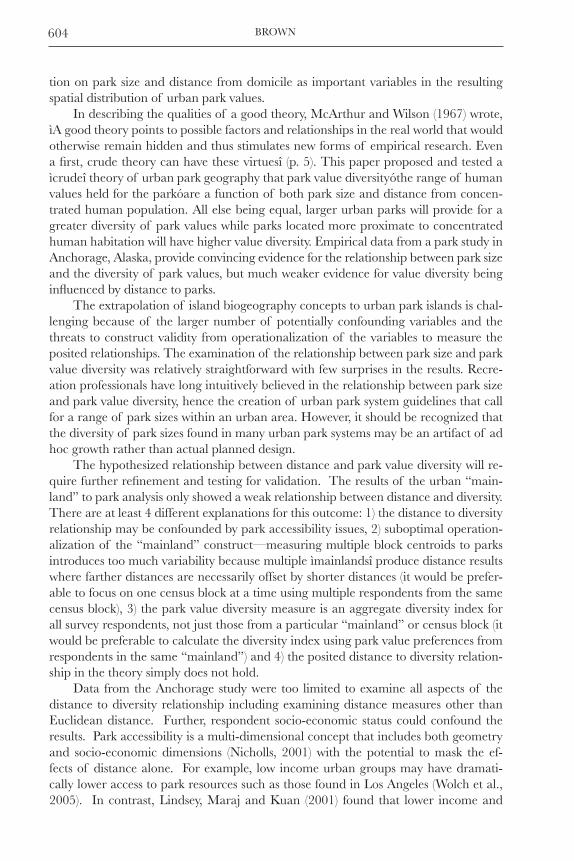
Urban parklands are subject to the dynamic forces of appropriation and displace-ment but these forces act differentially to influence the overall level of park value di-versity. Larger parks afford more opportunities for appropriation with higher capacity for value assimilation before displacement, leading to higher equilibrium rates of park value diversity. Smaller park islands provide less opportunity for appropriation and can be more vulnerable to the forces of displacement leading to lower equilibrium levels of park value diversity (Figure 2).
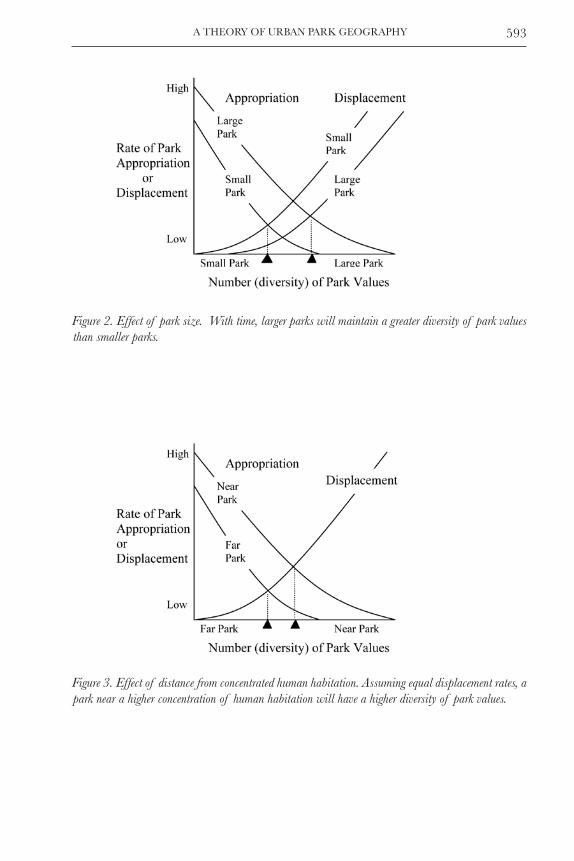
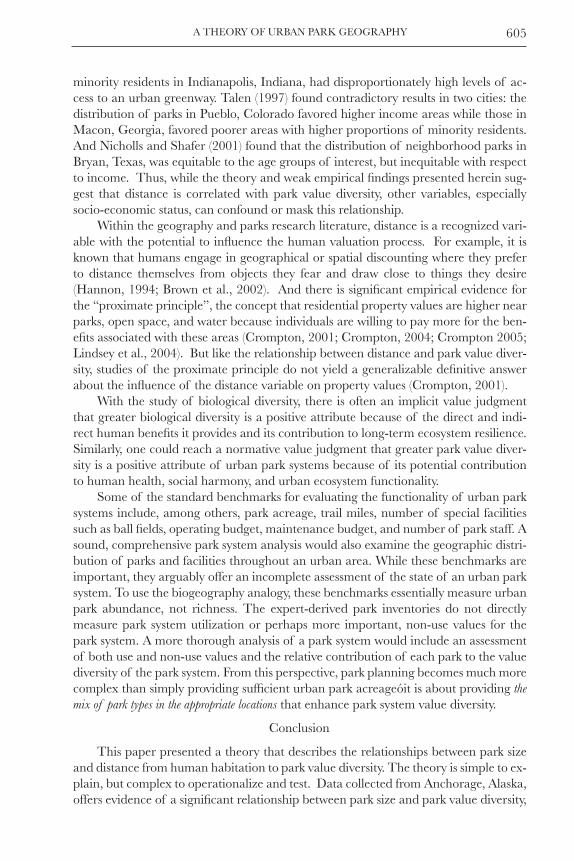
Similarly, the variable of ìdistanceî is posited to be influential in determining the
level of park value diversity. The more proximate park islands are to concentrated hu-man population clusters, the greater the probability of park appropriation by different individuals leading to higher park value diversity. All other factors equal, two parks
A THEORY OF URBAN PARK GEOGRAPHY 593
Figure 2. Effect of park size. With time, larger parks will maintain a greater diversity of park values than smaller parks.
Figure 3. Effect of distance from concentrated human habitation. Assuming equal displacement rates, a park near a higher concentration of human habitation will have a higher diversity of park values.
BROWN594
of equal size would have different park value diversity levels based on distance from concentrated human population clusters (Figure 3). The working assumption in this paper is that urban parks and open spaces represent objects of desire that influence the distance/diversity relationship but there may be instances where urban parks harbor undesirable community features (e.g., areas of drug trade, graffiti, litter) that can influ-ence the park value distance/diversity relationship in unpredictable ways.
The crux of extrapolating biogeography theory to a theory of urban park values is measurement of the dependent variable, the diversity of park values. Whereas the number of species for biogeography, can in theory, be enumerated, social and cultural landscapes, being perceptual by definition, consist of socially constructed features de-rived from both use and non-use values of parks. Non-use values for parks, in particu-lar, are challenging to measure because they are not directly observable like recreation value. A method is required that can successfully measure perceptions of park value across a representative sample of an urban population to examine potential spatial relations. One method for measuring urban park values, based on survey research, is described in the next section.
Methods
Data Collection Methods
To develop and test the theory, data were used from a general public survey of An-chorage, Alaska, residents conducted in 2003. Anchorage is a city with approximately 274,000 residents (Alaska Dept. of Labor and Workforce Development, 2003) with a relative abundance of parks, open spaces, and recreation opportunities for city residents. There are approximately 10,000 acres of parkland, 400 kilometers of trails and 25 pri-vate and public indoor recreation facilities in the Anchorage Bowl, a geographic area of the city bounded by the Chugach mountains and Cook Inlet. Adjacent to Anchorage is Chugach State Park, a state park with nearly 500,000 acres of natural open space and several urban access points. In addition, the Anchorage Coastal Wildlife Refuge abuts Anchorage along the coast and encompasses over 50 square miles of coastline.
The general public survey of Anchorage residents was completed as part of a public involvement process for the Anchorage Parks and Recreation Open Space and Plan revision process. The resident survey was designed to achieve multiple re-search objectives, with the relevant objective for this study to measure the importance and spatial location of parks and open space values and special places in Anchorage through survey respondent mapping.
Residents were asked to place mnemonically coded sticker dots associated with landscape values on an Anchorage map provided with the survey. Residents could place up to three coded dots provided for each of the eight landscape values. Upon return of the survey and map, the spatial locations of the values were digitized using ArcGIS® software.
The mapping of landscape values and special places in survey research has been used in a variety of land use planning applications (Brown, 2005) including forest and protected areas planning and management (Reed and Brown, 2003), highway plan-ning (Brown, 2003), identifying wilderness values (Brown and Alessa, 2005), conserva-tion planning for marine and coastal areas (Brown et al., 2004), tourism and residential
A THEORY OF URBAN PARK GEOGRAPHY 595
development planning (Brown, 2006), and assessing protected area allocations (Ray-mond and Brown, 2006). When used to solicit information from the public as part of a land use planning process, the survey method may be viewed as a form of public participation GIS or PPGIS (Abbot et al., 1998; Talen, 2000; Sieber, 2006).
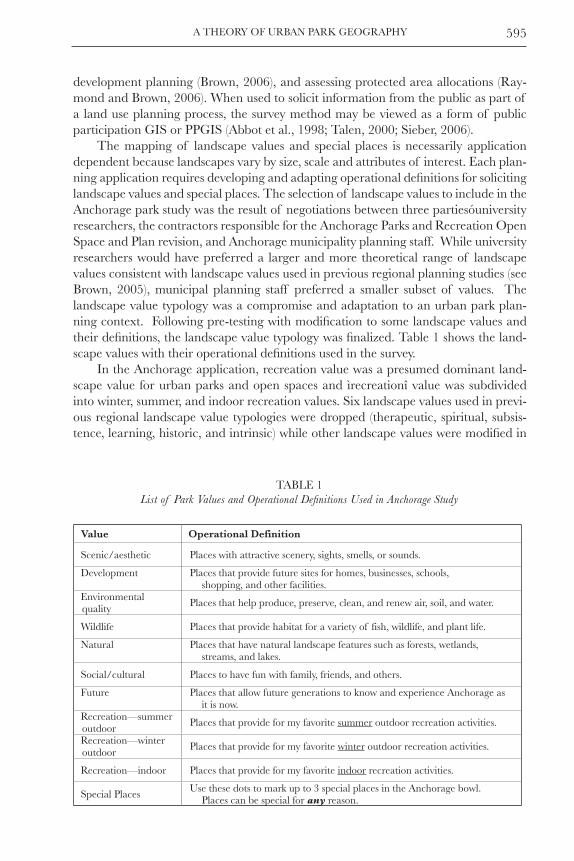
The mapping of landscape values and special places is necessarily application dependent because landscapes vary by size, scale and attributes of interest. Each plan-ning application requires developing and adapting operational definitions for soliciting landscape values and special places. The selection of landscape values to include in the Anchorage park study was the result of negotiations between three partiesóuniversity researchers, the contractors responsible for the Anchorage Parks and Recreation Open Space and Plan revision, and Anchorage municipality planning staff. While university researchers would have preferred a larger and more theoretical range of landscape values consistent with landscape values used in previous regional planning studies (see Brown, 2005), municipal planning staff preferred a smaller subset of values. The landscape value typology was a compromise and adaptation to an urban park plan-ning context. Following pre-testing with modification to some landscape values and their definitions, the landscape value typology was finalized. Table 1 shows the land-scape values with their operational definitions used in the survey.
In the Anchorage application, recreation value was a presumed dominant land-scape value for urban parks and open spaces and ìrecreationî value was subdivided into winter, summer, and indoor recreation values. Six landscape values used in previ-ous regional landscape value typologies were dropped (therapeutic, spiritual, subsis-tence, learning, historic, and intrinsic) while other landscape values were modified in
TABLE 1List of Park Values and Operational Definitions Used in Anchorage Study
Value Operational Definition
Scenic/aesthetic Places with attractive scenery, sights, smells, or sounds.
Development Places that provide future sites for homes, businesses, schools, shopping, and other facilities.
Environmental quality Places that help produce, preserve, clean, and renew air, soil, and water.
Wildlife Places that provide habitat for a variety of fish, wildlife, and plant life.
Natural Places that have natural landscape features such as forests, wetlands, streams, and lakes.
Social/cultural Places to have fun with family, friends, and others.
Future Places that allow future generations to know and experience Anchorage as it is now.
Recreation—summer outdoor Places that provide for my favorite summer outdoor recreation activities.
Recreation—winter outdoor Places that provide for my favorite winter outdoor recreation activities.
Recreation—indoor Places that provide for my favorite indoor recreation activities.
Special Places Use these dots to mark up to 3 special places in the Anchorage bowl. Places can be special for any reason.
BROWN596
name and operational definitionó economic value became development value, biologi-cal diversity value became wildlife value, wilderness value became natural value, life sustaining value became environmental quality value, and cultural value became social and cultural value. In total, eight separate landscape values were included in the value typology along with special places.
The survey instrument was designed, developed, and administered using a modi-fied Total Design Method (Dillman, 1978) and consisted of three mailing waves (sur-vey, postcard reminder, second survey mailing) to 1650 randomly selected Anchorage households selected from a 2002 statewide database containing over 90% of Alaska residents. A total of 259 survey responses were received from 1477 valid addresses (18% response rate) after three mailings representing 6114 point locations that were digitized and used in the spatial analysis.
Data Analysis
Relationship between park size and abundance and diversity of values. The distribution of mapped landscape values (points) were intersected with an Anchorage parks polygon coverage to derive park value frequency distributions for each park. A buffer of 200 feet was extended around each park boundary to include points that were likely in-tended for inclusion within the park. Anchorage parks containing less than 10 mapped points were excluded from further analysis resulting in 32 parks retained for analysis.
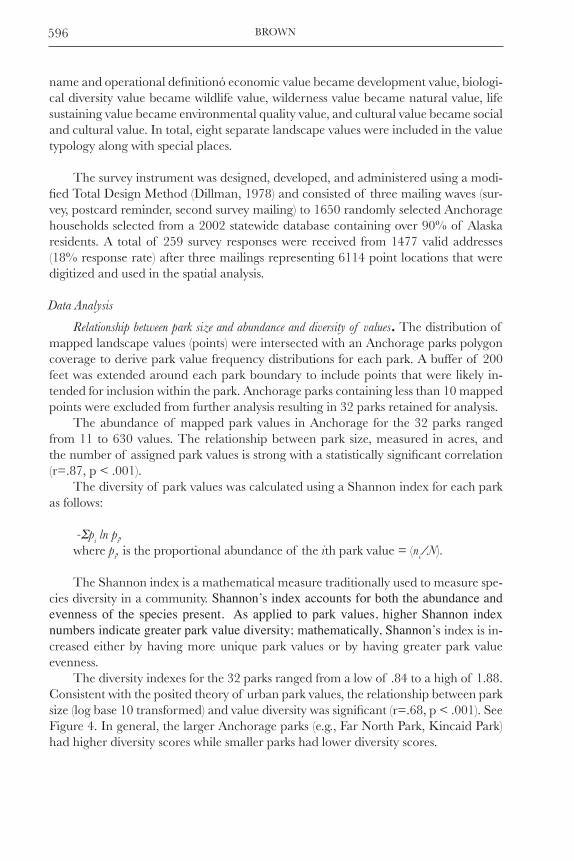
The abundance of mapped park values in Anchorage for the 32 parks ranged from 11 to 630 values. The relationship between park size, measured in acres, and the number of assigned park values is strong with a statistically significant correlation (r=.87, p < .001).
The diversity of park values was calculated using a Shannon index for each park as follows:
-Σpi ln pi, where pi, is the proportional abundance of the ith park value = (ni/N).
The Shannon index is a mathematical measure traditionally used to measure spe-cies diversity in a community. Shannon’s index accounts for both the abundance and evenness of the species present. As applied to park values, higher Shannon index numbers indicate greater park value diversity; mathematically, Shannon’s index is in-creased either by having more unique park values or by having greater park value evenness.
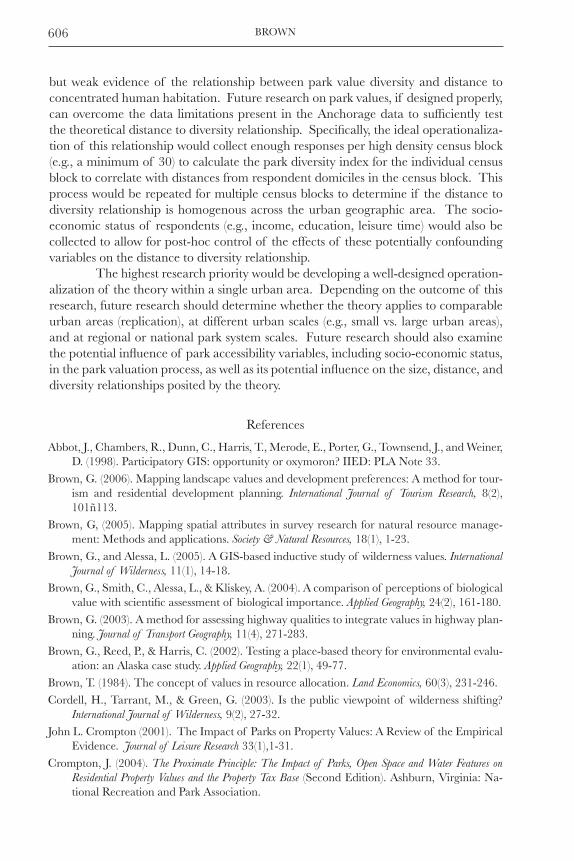
The diversity indexes for the 32 parks ranged from a low of .84 to a high of 1.88. Consistent with the posited theory of urban park values, the relationship between park size (log base 10 transformed) and value diversity was significant (r=.68, p < .001). See Figure 4. In general, the larger Anchorage parks (e.g., Far North Park, Kincaid Park) had higher diversity scores while smaller parks had lower diversity scores.
A THEORY OF URBAN PARK GEOGRAPHY 597
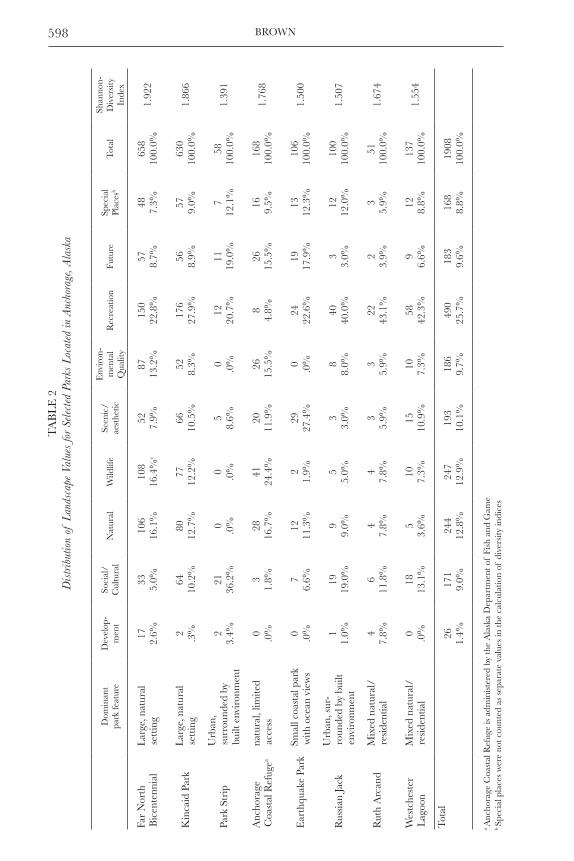
Influence of park setting and features on park values. While park size appears related to the diversity of park values, each park has its own unique character and setting, what might be termed intrinsic park qualities. This is illustrated in Table 2 that shows the distribution of park values for a subset of eight parks in Anchorage. Recreation value, as expected, tends to dominate most parks (see especially, Ruth Arcand, Russian Jack, and Westchester Lagoon parks) but there is considerable variation in the distribution of other park values. The more ìurbanî the park setting where the surrounding land-scape is dominated by a built environment and concentrated human occupation (e.g., Park Strip, Russian Jack), the greater the social/cultural values assigned to the park. In contrast, the larger, more natural parks in Anchorage were assigned park values that reflect natural, wildlife, and environmental quality values. For example, the ìAnchor-age Coastal Refugeî is a state wildlife reserve located within the Anchorage municipal boundary and contains the highest percentage of wildlife values. Earthquake Park is recognized for its outstanding coastal views and thus has a relatively high percentage of assigned scenic values. Thus, while park size is related to the diversity of park val-ues, each park retains a somewhat unique identity based on the mix and dominance of selected park values.
NRPA park classification and park value diversity. The National Parks and Recreation Association (NRPA) is a professional organization of park management professionals, academics, and municipal organizations that promote and advocate standards and guidelines for educating professionals and providing quality recreational opportuni-ties in a variety of settings. The NRPA has developed a park classification system and set of guidelines to promote adequate levels of recreation opportunities within urban
Figure 4. Relationship between park value diversity and park area in Anchorage.
BROWN598
TA
BL
E 2
Dis
tribu
tion
of L
ands
cape
Val
ues
for
Sele
cted
Par
ks L
ocat
ed in
Anc
hora
ge, A
lask
a
Dom
inan
t pa
rk fe
atur
eD
evel
op-
men
tSo
cial
/ C
ultu
ral
Nat
ural
Wild
life
Scen
ic/
aest
hetic
Env
iron
-m
enta
l Q
ualit
yR
ecre
atio
nFu
ture
Spec
ial
Plac
esb
Tot
alSh
anno
n-
Div
ersi
ty
Inde
x
Far
Nor
th
Bic
ente
nnia
lL
arge
, nat
ural
se
ttin
g17 2.6%
33 5.0%
106
16.1
%10
816
.4%
c52 7.9%
8713
.2%
150
22.8
%57 8.7%
48 7.3%
658
100.
0%1.
922
Kin
caid
Par
kL
arge
, nat
ural
se
ttin
g2 .3%
6410
.2%
8012
.7%
7712
.2%
6610
.5%
52 8.3%
176
27.9
%56 8.9%
57 9.0%
630
100.
0%1.
866
Park
Str
ipU
rban
, su
rrou
nded
by
built
env
iron
men
t
23.
4%21
36.2
%0 .0%
0 .0%
58.
6%0 .0%
1220
.7%
1119
.0%
712
.1%
5810
0.0%
1.39
1
Anc
hora
ge
Coa
stal
Ref
ugea
natu
ral,
limite
d ac
cess
0 .0%
31.
8%28
16.7
%41
24.4
%20
11.9
%26
15.5
%8
4.8%
2615
.5%
16 9.5%
168
100.
0%1.
768
Ear
thqu
ake
Park
Smal
l coa
stal
par
k w
ith o
cean
vie
ws
0 .0%
76.
6%12
11.3
%2
1.9%
2927
.4%
0 .0%
2422
.6%
1917
.9%
1312
.3%
106
100.
0%1.
500
Rus
sian
Jack
U
rban
, sur
-ro
unde
d by
bui
lt en
viro
nmen
t
11.
0%19
19.0
%9
9.0%
55.
0%3
3.0%
88.
0%40
40.0
%3
3.0%
1212
.0%
100
100.
0%1.
507
Rut
h A
rcan
dM
ixed
nat
ural
/re
side
ntia
l4
7.8%
611
.8%
47.
8%4
7.8%
35.
9%3
5.9%
2243
.1%
23.
9%3
5.9%
5110
0.0%
1.67
4
Wes
tche
ster
L
agoo
nM
ixed
nat
ural
/re
side
ntia
l0 .0%
1813
.1%
53.
6%10 7.3%
1510
.9%
10 7.3%
5842
.3%
96.
6%12 8.8%
137
100.
0%1.
554
Tot
al
26 1.4%
171
9.0%
244
12.8
%24
712
.9%
193
10.1
%18
69.
7%49
025
.7%
183
9.6%
168
8.8%
1908
100.
0%
a A
ncho
rage
Coa
stal
Ref
uge
is a
dmin
iste
red
by th
e A
lask
a D
epar
tmen
t of
Fish
and
Gam
eb Sp
ecia
l pla
ces
wer
e no
t cou
nted
as
sepa
rate
val
ues
in th
e ca
lcul
atio
n of
div
ersi
ty in
dice
s
A THEORY OF URBAN PARK GEOGRAPHY 599
TA
BL
E 3
Map
ping
of
NR
PA C
lass
ifica
tion
Into
Anc
hora
ge P
arks
Cla
ssifi
catio
ns
NR
PA C
lass
ifica
tions
(M
erte
s an
d H
all 1
996;
p.
94-
95)
NR
PA S
ize
and
Loc
atio
n G
uide
lines
(M
erte
s an
d H
all 1
996;
p. 9
4-95
)A
ncho
rage
Par
ks
Cla
ssifi
catio
n Sy
stem
Anc
hora
ge P
ark
Cla
ssifi
catio
nD
omin
ant
Val
ues
Shan
non
Div
ersi
ty
Inde
x
Min
i-Par
kN
eigh
borh
ood
Park
Scho
ol-P
ark
• M
ini-p
ark—
betw
een
2500
sq.
ft. a
nd o
ne
acr
es, l
ess
than
¼ m
ile in
res
iden
tial s
ettin
g•
Nei
ghbo
rhoo
d—5
to 1
0 ac
res
optim
al, ¼
to
½ m
ile d
ista
nce
• Sc
hool
-par
k—va
riab
le s
ize,
loca
tion
d
eter
min
ed b
y sc
hool
Nei
ghbo
rhoo
d U
se A
rea
• M
ini-P
ark
• N
eigh
borh
ood
Park
• E
lem
enta
ry S
choo
l Site
s•
Dev
elop
ed tr
ail a
cces
s co
rrid
or
Up
to 2
0 ac
res
Rec
reat
ion
Soci
alSc
enic
1.15
Com
mun
ity P
ark
Lar
ge U
rban
Par
k
• C
omm
unity
—us
ually
bet
wee
n 30
and
50
acre
s, ½
to 3
mile
dis
tanc
e•
Lar
ge U
rban
Par
k—us
ually
a m
inim
um o
f
50
acre
s w
ith 7
5 or
mor
e ac
res
optim
al, u
sual
ly
ser
ves
entir
e co
mm
unity
Com
mun
ity U
se A
rea
• C
omm
unity
Par
k•
Lar
ge U
rban
Par
k•
Tow
n C
ente
r Pa
rk•
Mid
dle
Scho
ol S
ite•
Dev
elop
ed tr
ail a
cces
s co
rrid
or
20 to
100
acr
es
Rec
reat
ion
Wild
life
Env
iron
-m
enta
l
1.43
Spec
ial U
seSp
orts
Com
plex
• Sp
ecia
l use
—si
ze v
aria
ble,
loca
tion
vari
able
• Sp
orts
com
plex
—us
ually
a m
inim
um o
f 25
a
cres
with
40-
80 a
cres
opt
imal
, str
ateg
ical
ly
loc
ated
Spec
ial U
se A
reas
• R
egio
nal F
acili
ties
• Sp
orts
Com
plex
• Sk
i Are
a•
Gol
f C
ours
e•
Spec
ial E
vent
Ven
ue•
Hig
h Sc
hool
Site
vari
able
N/A
N/A
Nat
ural
Res
ourc
e A
reas
• N
atur
al r
esou
rce
area
s—si
ze v
aria
ble,
loca
tion
dep
ends
on
avai
labi
lity
and
oppo
rtun
ity
Nat
ural
Res
ourc
e U
se A
rea
• Pr
eser
vatio
n•
Con
serv
atio
n•
Res
erve
> 1
00 a
cres
Rec
reat
ion
Nat
ural
Wild
life
1.74
Park
Tra
ilsC
onne
ctor
Tra
ils•
Tra
ils--
.5 m
iles
per
1000
(198
3 N
RPA
s
tand
ard)
, loc
atio
n va
riab
leT
rails
and
Con
nect
ors
• Pa
ved
mul
ti-us
e•
Nat
ural
sur
face
vari
able
N/A
N/A
BROWN600
areas. Early NRPA efforts to identify, establish, and promote objective standards of recreation service have been superseded by a classification system providing size and location guidelines rather than quantitative service standards.
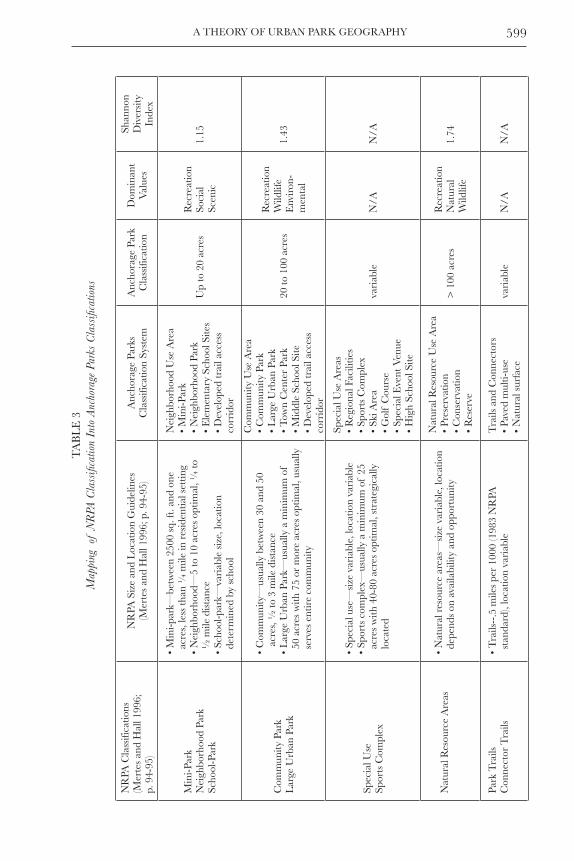
The latest NRPA guidelines (Mertes and Hall, 1996) recognize a variety of park types and recreation opportunities. See Table 3 for a description of NRPA park clas-sifications and size/location guidelines. Because the NRPA park guidelines address the same two variablesópark size and location (distance)óas does the proposed theory of urban park geography, the validity of the NRPA guidelines and the theory of park geography appear intertwined. In the NRPA guidelines, there is a presumption that park size and distance serve to differentiate park opportunities to accommodate dif-ferent human values but there is little empirical evidence to support the presumed differences. The theory of urban park geography predicts there should be differences in park value diversity based on park size differences associated with the NRPA park classifications.
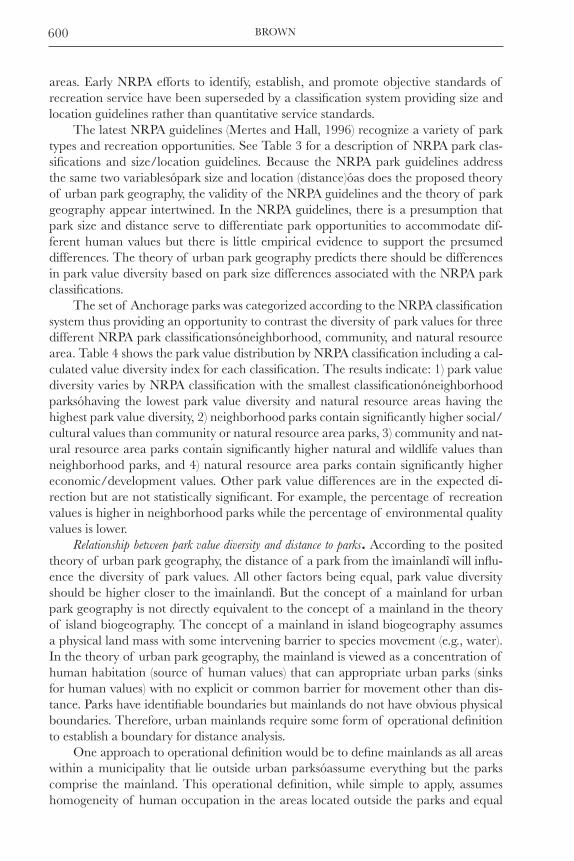
The set of Anchorage parks was categorized according to the NRPA classification system thus providing an opportunity to contrast the diversity of park values for three different NRPA park classificationsóneighborhood, community, and natural resource area. Table 4 shows the park value distribution by NRPA classification including a cal-culated value diversity index for each classification. The results indicate: 1) park value diversity varies by NRPA classification with the smallest classificationóneighborhood parksóhaving the lowest park value diversity and natural resource areas having the highest park value diversity, 2) neighborhood parks contain significantly higher social/cultural values than community or natural resource area parks, 3) community and nat-ural resource area parks contain significantly higher natural and wildlife values than neighborhood parks, and 4) natural resource area parks contain significantly higher economic/development values. Other park value differences are in the expected di-rection but are not statistically significant. For example, the percentage of recreation values is higher in neighborhood parks while the percentage of environmental quality values is lower.
Relationship between park value diversity and distance to parks. According to the posited theory of urban park geography, the distance of a park from the ìmainlandî will influ-ence the diversity of park values. All other factors being equal, park value diversity should be higher closer to the ìmainlandî. But the concept of a mainland for urban park geography is not directly equivalent to the concept of a mainland in the theory of island biogeography. The concept of a mainland in island biogeography assumes a physical land mass with some intervening barrier to species movement (e.g., water). In the theory of urban park geography, the mainland is viewed as a concentration of human habitation (source of human values) that can appropriate urban parks (sinks for human values) with no explicit or common barrier for movement other than dis-tance. Parks have identifiable boundaries but mainlands do not have obvious physical boundaries. Therefore, urban mainlands require some form of operational definition to establish a boundary for distance analysis.
One approach to operational definition would be to define mainlands as all areas within a municipality that lie outside urban parksóassume everything but the parks comprise the mainland. This operational definition, while simple to apply, assumes homogeneity of human occupation in the areas located outside the parks and equal
A THEORY OF URBAN PARK GEOGRAPHY 601
TA
BL
E 4
Gro
up M
eans
(% o
f Pa
rk V
alue
s In
Eac
h Pa
rk C
lass
ifica
tion)
and
Hom
ogen
ous
Subs
ets
with
Sta
tistic
ally
Sig
nific
ant D
iffer
ence
s
NR
PA
Par
k C
lass
ifica
tion
Dev
elop
men
taSo
cial
aN
atur
ala
Wild
lifea
Scen
icE
nvir
on-
men
tal
Futu
reR
ecre
-at
ion
Park
Val
ue D
iver
sity
In
dexb
Nei
ghbo
rhoo
d (n
=6)
(0-2
0 ac
res)
.007
.280
.008
.013
.120
.039
.097
.436
1.15
Com
mun
ity/u
rban
(n=
17)
(20-
100
acre
s).0
11.1
16.1
16.1
27.1
38.1
24.1
36.0
76.2
711.
43
Nat
ural
Res
ourc
e A
rea
(n=
9)(>
100
acr
es)
.047
.088
.151
.124
.103
.105
.092
.290
1.74
a S
tatis
tical
ly si
gnifi
cant
diff
eren
ces b
etw
een
park
cla
ssifi
catio
n su
bset
s (Tu
key
HSD
, p <
.05)
b Va
lue
dive
rsity
inde
x ca
lcul
ated
usi
ng S
hann
on d
iver
sity
inde
x =
-Σpi
ln p
i, w
here
pi,
the
prop
ortio
nal a
bund
ance
of
the
ith v
alue
= (n
i/N
).
BROWN602
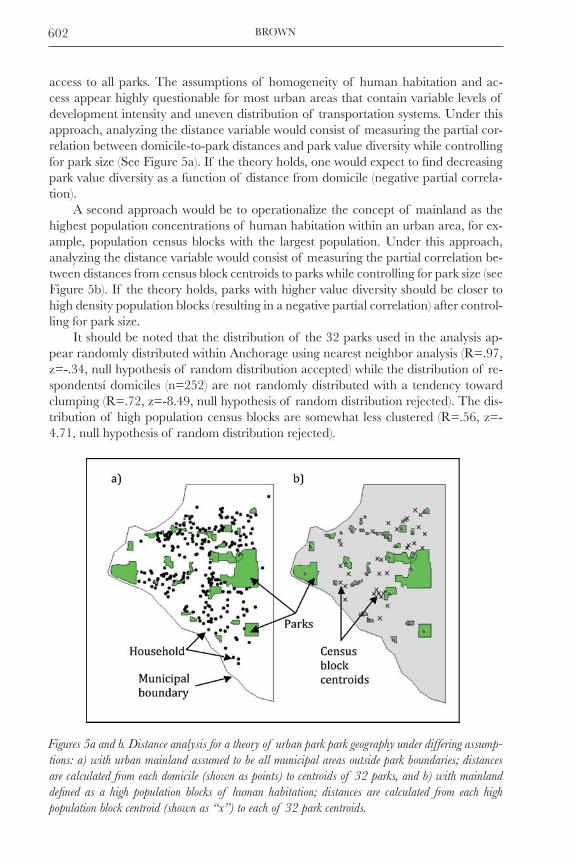
access to all parks. The assumptions of homogeneity of human habitation and ac-cess appear highly questionable for most urban areas that contain variable levels of development intensity and uneven distribution of transportation systems. Under this approach, analyzing the distance variable would consist of measuring the partial cor-relation between domicile-to-park distances and park value diversity while controlling for park size (See Figure 5a). If the theory holds, one would expect to find decreasing park value diversity as a function of distance from domicile (negative partial correla-tion).
A second approach would be to operationalize the concept of mainland as the highest population concentrations of human habitation within an urban area, for ex-ample, population census blocks with the largest population. Under this approach, analyzing the distance variable would consist of measuring the partial correlation be-tween distances from census block centroids to parks while controlling for park size (see Figure 5b). If the theory holds, parks with higher value diversity should be closer to high density population blocks (resulting in a negative partial correlation) after control-ling for park size.
It should be noted that the distribution of the 32 parks used in the analysis ap-pear randomly distributed within Anchorage using nearest neighbor analysis (R=.97, z=-.34, null hypothesis of random distribution accepted) while the distribution of re-spondentsí domiciles (n=252) are not randomly distributed with a tendency toward clumping (R=.72, z=-8.49, null hypothesis of random distribution rejected). The dis-tribution of high population census blocks are somewhat less clustered (R=.56, z=-4.71, null hypothesis of random distribution rejected).
Figures 5a and b. Distance analysis for a theory of urban park park geography under differing assump-tions: a) with urban mainland assumed to be all municipal areas outside park boundaries; distances are calculated from each domicile (shown as points) to centroids of 32 parks, and b) with mainland defined as a high population blocks of human habitation; distances are calculated from each high population block centroid (shown as “x”) to each of 32 park centroids.
A THEORY OF URBAN PARK GEOGRAPHY 603
Relationship between park value diversity and distance to respondents’ domicile. Distances were calculated between each respondentís domicile (n=252) and each of the 32 parks. A partial correlation coefficient was calculated between the domicile-park distances (log10) and the derived park value diversity index controlling for park size. The calcu-lated partial correlation coefficient was -.002 (p > .05) indicating no apparent relation-ship between distance to park and park value diversity.
This operationalization of distance and diversity, however, is problematic in that the locations of the multiple households and the locations of the parks are not inde-pendent. A park with high value diversity cannot be far from every household in An-chorage. A high diversity park that is farther from some households must necessarily be closer to other households if the parks are randomly distributed within the munici-pality, which is the case. Therefore, multiple and dispersed ìmainlandsî yield distance results where farther distances are offset by shorter distances. The truest analogue to the theory of island biogeography would be to have a discrete, single mainland with multiple parks located at varying distances. Park values would be measured from households located within the mainland only. Unfortunately, there is insufficient data to conduct this type of analysis because there are not enough respondents from within an operational mainland to measure park value diversity to correlate with distance. It is possible, however, to move somewhat closer to approximating a discrete mainland condition by selecting centrally located, high population census blocks and conducting distance analysis with these blocks as described in the next section.
Relationship between park value diversity and distance to highest population census blocks. The census blocks in Anchorage with the highest populationóblocks with more than 600 individuals--were identified from 2000 census data yielding 32 census blocks for anal-ysis. Polygon centroids were derived for both the 32 high population census blocks and the 32 parks containing more than 10 mapped park value points. The distance between each park and each census block was calculated and log10 transformed. A partial correlation coefficient was calculated between the block-park distances and the derived park value diversity controlling for park size. The calculated partial correlation coefficient was -.174 (p < .05) indicating a weak, but expected negative relationship between distance to park and park value diversity. These results, while statistically sig-nificant, are more suggestive than definitive. The variable distances from each of the census blocks to the parks may still be masking the strength of the relationship, if any, between distance and diversity.
Discussion
Some individuals might consider the application of ecological concepts to social constructs dangerous, if not misguided. Social Darwinism is a prescient reminder of the social peril involved. The academic peril may loom even larger. At the very least, skeptics would urge caution. And yet, the creative extrapolation of concepts across disciplines may prove beneficial and worthy of the risk if it serves to direct attention to important concepts that have previously been overlooked or under-represented in the receiving discipline. The relationship of urban park size and distance to the distribu-tion of park values has been assumed and even codified into NRPA park guidelines, but the basis for such guidelines has never been fully explained or critically examined. By using the theory of island biography as an analogue, one is directed to focus atten-
BROWN604
tion on park size and distance from domicile as important variables in the resulting spatial distribution of urban park values.
In describing the qualities of a good theory, McArthur and Wilson (1967) wrote, ìA good theory points to possible factors and relationships in the real world that would otherwise remain hidden and thus stimulates new forms of empirical research. Even a first, crude theory can have these virtuesî (p. 5). This paper proposed and tested a ìcrudeî theory of urban park geography that park value diversityóthe range of human values held for the parkóare a function of both park size and distance from concen-trated human population. All else being equal, larger urban parks will provide for a greater diversity of park values while parks located more proximate to concentrated human habitation will have higher value diversity. Empirical data from a park study in Anchorage, Alaska, provide convincing evidence for the relationship between park size and the diversity of park values, but much weaker evidence for value diversity being influenced by distance to parks.
The extrapolation of island biogeography concepts to urban park islands is chal-lenging because of the larger number of potentially confounding variables and the threats to construct validity from operationalization of the variables to measure the posited relationships. The examination of the relationship between park size and park value diversity was relatively straightforward with few surprises in the results. Recre-ation professionals have long intuitively believed in the relationship between park size and park value diversity, hence the creation of urban park system guidelines that call for a range of park sizes within an urban area. However, it should be recognized that the diversity of park sizes found in many urban park systems may be an artifact of ad hoc growth rather than actual planned design.
The hypothesized relationship between distance and park value diversity will re-quire further refinement and testing for validation. The results of the urban “main-land” to park analysis only showed a weak relationship between distance and diversity. There are at least 4 different explanations for this outcome: 1) the distance to diversity relationship may be confounded by park accessibility issues, 2) suboptimal operation-alization of the “mainland” construct—measuring multiple block centroids to parks introduces too much variability because multiple ìmainlandsî produce distance results where farther distances are necessarily offset by shorter distances (it would be prefer-able to focus on one census block at a time using multiple respondents from the same census block), 3) the park value diversity measure is an aggregate diversity index for all survey respondents, not just those from a particular “mainland” or census block (it would be preferable to calculate the diversity index using park value preferences from respondents in the same “mainland”) and 4) the posited distance to diversity relation-ship in the theory simply does not hold.
Data from the Anchorage study were too limited to examine all aspects of the distance to diversity relationship including examining distance measures other than Euclidean distance. Further, respondent socio-economic status could confound the results. Park accessibility is a multi-dimensional concept that includes both geometry and socio-economic dimensions (Nicholls, 2001) with the potential to mask the ef-fects of distance alone. For example, low income urban groups may have dramati-cally lower access to park resources such as those found in Los Angeles (Wolch et al., 2005). In contrast, Lindsey, Maraj and Kuan (2001) found that lower income and
A THEORY OF URBAN PARK GEOGRAPHY 605
minority residents in Indianapolis, Indiana, had disproportionately high levels of ac-cess to an urban greenway. Talen (1997) found contradictory results in two cities: the distribution of parks in Pueblo, Colorado favored higher income areas while those in Macon, Georgia, favored poorer areas with higher proportions of minority residents. And Nicholls and Shafer (2001) found that the distribution of neighborhood parks in Bryan, Texas, was equitable to the age groups of interest, but inequitable with respect to income. Thus, while the theory and weak empirical findings presented herein sug-gest that distance is correlated with park value diversity, other variables, especially socio-economic status, can confound or mask this relationship.
Within the geography and parks research literature, distance is a recognized vari-able with the potential to influence the human valuation process. For example, it is known that humans engage in geographical or spatial discounting where they prefer to distance themselves from objects they fear and draw close to things they desire (Hannon, 1994; Brown et al., 2002). And there is significant empirical evidence for the “proximate principle”, the concept that residential property values are higher near parks, open space, and water because individuals are willing to pay more for the ben-efits associated with these areas (Crompton, 2001; Crompton, 2004; Crompton 2005; Lindsey et al., 2004). But like the relationship between distance and park value diver-sity, studies of the proximate principle do not yield a generalizable definitive answer about the influence of the distance variable on property values (Crompton, 2001).
With the study of biological diversity, there is often an implicit value judgment that greater biological diversity is a positive attribute because of the direct and indi-rect human benefits it provides and its contribution to long-term ecosystem resilience. Similarly, one could reach a normative value judgment that greater park value diver-sity is a positive attribute of urban park systems because of its potential contribution to human health, social harmony, and urban ecosystem functionality.
Some of the standard benchmarks for evaluating the functionality of urban park systems include, among others, park acreage, trail miles, number of special facilities such as ball fields, operating budget, maintenance budget, and number of park staff. A sound, comprehensive park system analysis would also examine the geographic distri-bution of parks and facilities throughout an urban area. While these benchmarks are important, they arguably offer an incomplete assessment of the state of an urban park system. To use the biogeography analogy, these benchmarks essentially measure urban park abundance, not richness. The expert-derived park inventories do not directly measure park system utilization or perhaps more important, non-use values for the park system. A more thorough analysis of a park system would include an assessment of both use and non-use values and the relative contribution of each park to the value diversity of the park system. From this perspective, park planning becomes much more complex than simply providing sufficient urban park acreageóit is about providing the mix of park types in the appropriate locations that enhance park system value diversity.
Conclusion
This paper presented a theory that describes the relationships between park size and distance from human habitation to park value diversity. The theory is simple to ex-plain, but complex to operationalize and test. Data collected from Anchorage, Alaska, offers evidence of a significant relationship between park size and park value diversity,
BROWN606
but weak evidence of the relationship between park value diversity and distance to concentrated human habitation. Future research on park values, if designed properly, can overcome the data limitations present in the Anchorage data to sufficiently test the theoretical distance to diversity relationship. Specifically, the ideal operationaliza-tion of this relationship would collect enough responses per high density census block (e.g., a minimum of 30) to calculate the park diversity index for the individual census block to correlate with distances from respondent domiciles in the census block. This process would be repeated for multiple census blocks to determine if the distance to diversity relationship is homogenous across the urban geographic area. The socio-economic status of respondents (e.g., income, education, leisure time) would also be collected to allow for post-hoc control of the effects of these potentially confounding variables on the distance to diversity relationship.
The highest research priority would be developing a well-designed operation-alization of the theory within a single urban area. Depending on the outcome of this research, future research should determine whether the theory applies to comparable urban areas (replication), at different urban scales (e.g., small vs. large urban areas), and at regional or national park system scales. Future research should also examine the potential influence of park accessibility variables, including socio-economic status, in the park valuation process, as well as its potential influence on the size, distance, and diversity relationships posited by the theory.
References
Abbot, J., Chambers, R., Dunn, C., Harris, T., Merode, E., Porter, G., Townsend, J., and Weiner, D. (1998). Participatory GIS: opportunity or oxymoron? IIED: PLA Note 33.
Brown, G. (2006). Mapping landscape values and development preferences: A method for tour-ism and residential development planning. International Journal of Tourism Research, 8(2), 101ñ113.
Brown, G, (2005). Mapping spatial attributes in survey research for natural resource manage-ment: Methods and applications. Society & Natural Resources, 18(1), 1-23.
Brown, G., and Alessa, L. (2005). A GIS-based inductive study of wilderness values. International Journal of Wilderness, 11(1), 14-18.
Brown, G., Smith, C., Alessa, L., & Kliskey, A. (2004). A comparison of perceptions of biological value with scientific assessment of biological importance. Applied Geography, 24(2), 161-180.
Brown, G. (2003). A method for assessing highway qualities to integrate values in highway plan-ning. Journal of Transport Geography, 11(4), 271-283.
Brown, G., Reed, P., & Harris, C. (2002). Testing a place-based theory for environmental evalu-ation: an Alaska case study. Applied Geography, 22(1), 49-77.
Brown, T. (1984). The concept of values in resource allocation. Land Economics, 60(3), 231-246.Cordell, H., Tarrant, M., & Green, G. (2003). Is the public viewpoint of wilderness shifting?
International Journal of Wilderness, 9(2), 27-32.John L. Crompton (2001). The Impact of Parks on Property Values: A Review of the Empirical
Evidence. Journal of Leisure Research 33(1),1-31.Crompton, J. (2004). The Proximate Principle: The Impact of Parks, Open Space and Water Features on
Residential Property Values and the Property Tax Base (Second Edition). Ashburn, Virginia: Na-tional Recreation and Park Association.
A THEORY OF URBAN PARK GEOGRAPHY 607
Crompton J. (2005). The Impact of Parks on Property Values: Empirical Evidence from the Past Two Decades in the United States. Leisure Management 10, 203-218.
Hannon, B. (1994). Sense of place: geographic discounting by people, animals, and plants. Eco-logical Economics, 10(2), 157-174.
Lindsey, G., Maraj, M. and Kuan, S. (2001). Access, equity, and urban greenways: An explor-atory investigation. The Professional Geographer, 53(3), 332-346.
Lindsey, G., Man, J., Peyton, S. and Dickson, K. (2004). Property Values, Recreation Values, and Urban Greenways. Journal of Parks and Recreation Administration, 22(3), 69-90.
Lockwood, M. (1999). Humans valuing nature: Synthesizing insights from philosophy, psychol-ogy and economics. Environmental Values, 8(3), 381-401.
MacArthur, R., and Wilson, E. (1967). The theory of island biogeography. Princeton, NJ: University Press. Reprinted in 2001.
Mertes, J., and Hall, J. (1996). Parks, Recreation, Open Space and Greenway Guidelines. Ashburn, VA: National Recreation and Park Association.
Nicholls, S. (2001) Measuring the accessibility and equity of public parks: a case study using GIS. Managing Leisure, 6(4), 201–219.
Nicholls, S. and Shafer, C. (2001). Measuring Accessibility and Equity in a Local Park System: The Utility of Geospatial Technologies to Park and Recreation Professionals, Journal of Park and Recreation Administration, 19(4), 102-124.
Raymond, C., and Brown, G. (2006). A method for assessing protected area allocations using a typology of landscape values. Journal of Environmental Planning and Management, 49(6), 797-812.
Reed, P., and Brown, G. (2003). Values suitability analysis: A methodology for identifying and integrating public perceptions of forest ecosystem values in national forest planning. Journal of Environmental Planning and Management, 46(5), 643-658.
Sieber, R. (2006). Public Participation Geographic Information Systems: A Literature Review and Framework. Annals of the Association of American Geographers, 96(3), 491–507.
Rokeach, M. (1973). The nature of human values. New York, NY: Free Press.Talen, E. (1997). The social equity of urban service distribution: An exploration of park access
in Pueblo, Colorado, and Macon, Georgia. Urban Geography, 18(6), 521–41.Talen, E. (2000). Emily Talen. Bottom-Up GIS: A New Tool for Individual and Group Expres-
sion in Participatory Planning. Journal of the American Planning Association, 66(3), 279-294.Wolch, J., Wilson, J., and Fehrenbach, J. (2005). Parks and park funding in Los Angeles: An
equity-mapping analysis. Urban Geography, 26(1), 4ñ35.Zube, E. (1987). Perceived land use patterns and landscape values. Landscape Ecology, 1(1)
37ñ45.