A Theory of Elastic Presentation Space - University of...
72
CPSC 583 Fall 2010 biovis Sheelagh Carpendale
Transcript of A Theory of Elastic Presentation Space - University of...

CPSC 583Fall 2010
biovis
Sheelagh Carpendale
BioVis• Data generation
– Used to be expensive and time consuming– Now recent innovations make it cost effective and
rapid• Bottle neck of discovery now in the analysis
process• Leads to pull for visualization
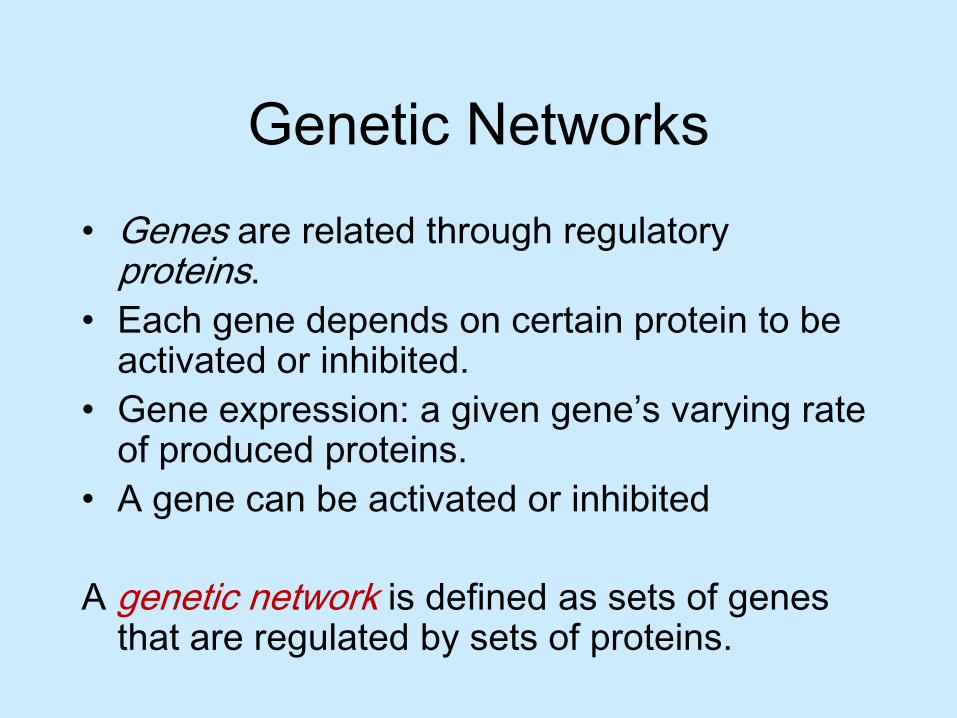
Genetic Networks• Genes are related through regulatory
proteins.• Each gene depends on certain protein to be
activated or inhibited.• Gene expression: a given gene’s varying rate
of produced proteins.• A gene can be activated or inhibited
A genetic network is defined as sets of genes that are regulated by sets of proteins.

GeneVis: goals
• To simulate and visualize a genetic network
• based on actual biological data.• Support interaction with and
modification of the simulated genetic network

Participatory Design
• in participation with Dr. M. Surrette, Department of Microbiology and Infectious Diseases at UofC– Participatory design– Iterative process– Flagella System (E. coli)
C.A.H. Baker, S. Carpendale, P. Pruiskiewicz and M. Surette. Simulation and visualization of genetic networks. Journal of Information Visualization, Special Issue on Coordinated Multiple Views, 2(4):201-207. Palgrave-Macmillan, 2003.

Sample Input Data
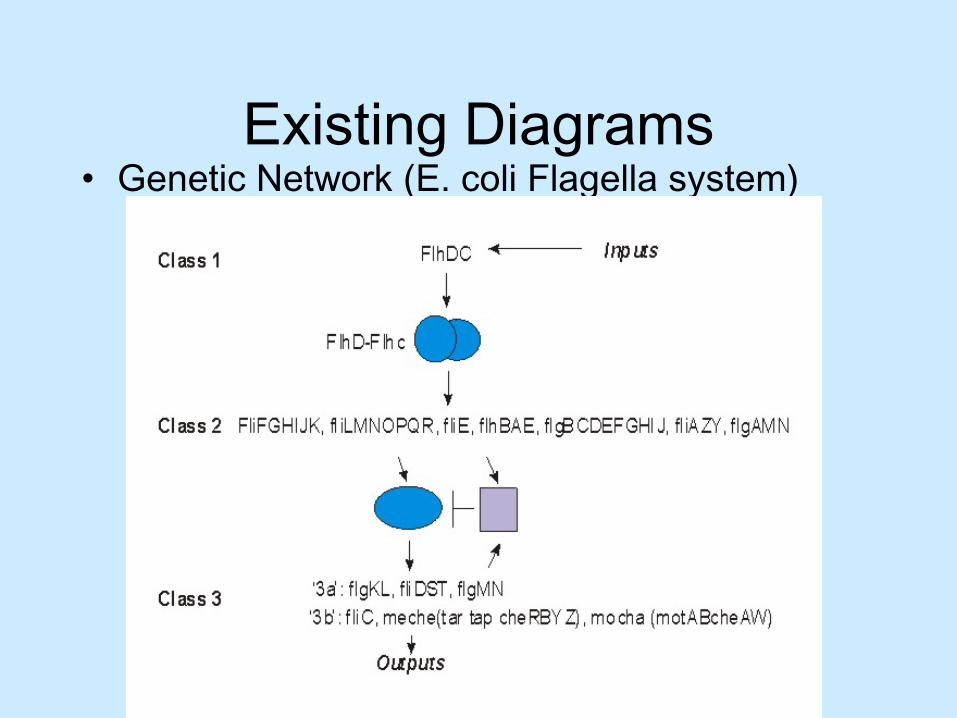
Existing Diagrams• Genetic Network (E. coli Flagella system)

GeneVis: Simulation Model
• Genetic network functioning is based on probabilistic interactions.
• Five random factors:1) Protein direction of movement2) Protein distance of travel3) Protein decay rate4) Protein binding5) Reversible binding

Genetic Networks• Genes make proteins.• A gene’s production of a protein is inhibited or
activated by proteins produced by other genes.• These dependencies form genetic networks.

Gene expression

GeneVis• Visual Representations:
Genes
Proteins
Gene expression

GeneVis• Grid-based simulation• Intersection testing by grid position
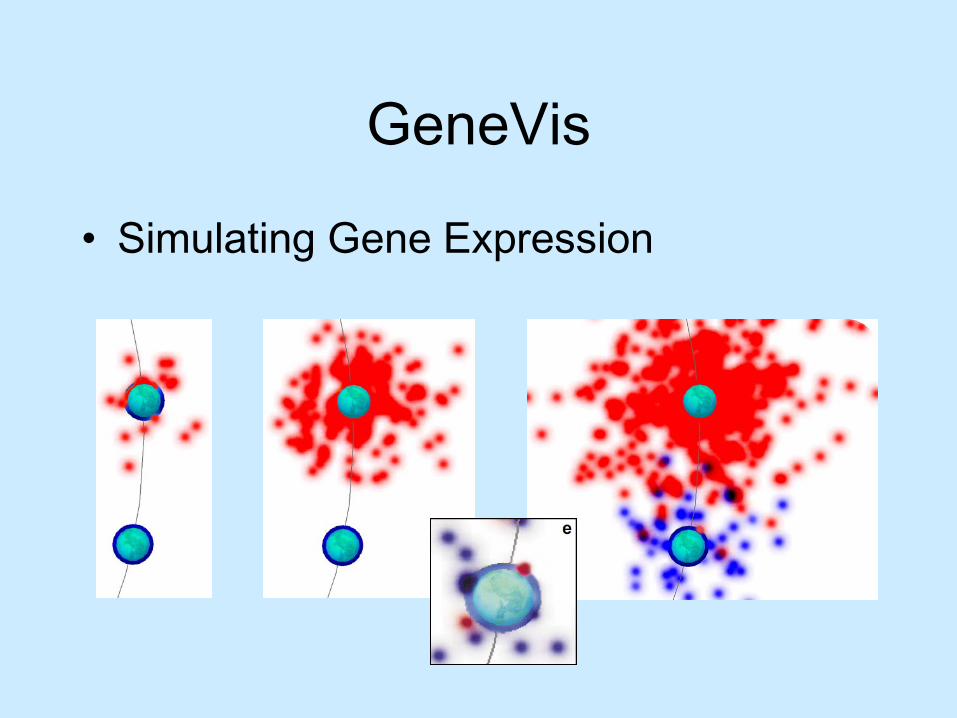
GeneVis
• Simulating Gene Expression

GeneVis
Proteins
Gene
Expression History
Chromosome

Visualization
• Manipulating Gene Properties– Uses:
• Mutation to genes in real-time during the simulation.
• Editing gene properties prior to simulation.
– This is the primary tool for adjusting the simulation
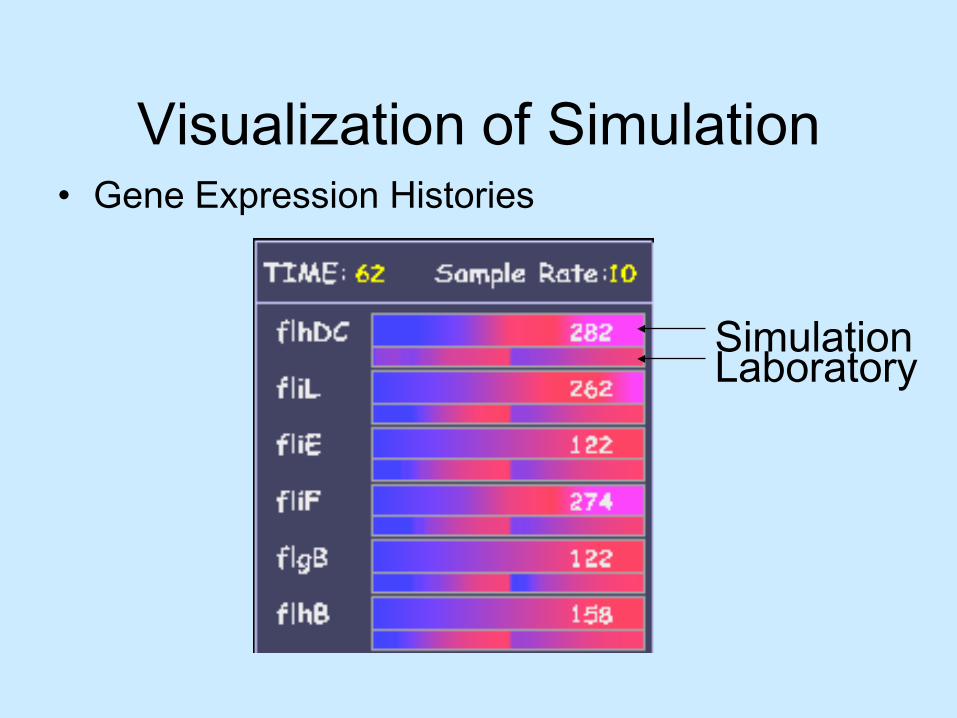
Visualization of Simulation• Gene Expression Histories
SimulationLaboratory

Visualization of Simulation
Protein Interaction View Protein Concentration View

Genevis: visualizing genetic regulation
with
CJ Baker
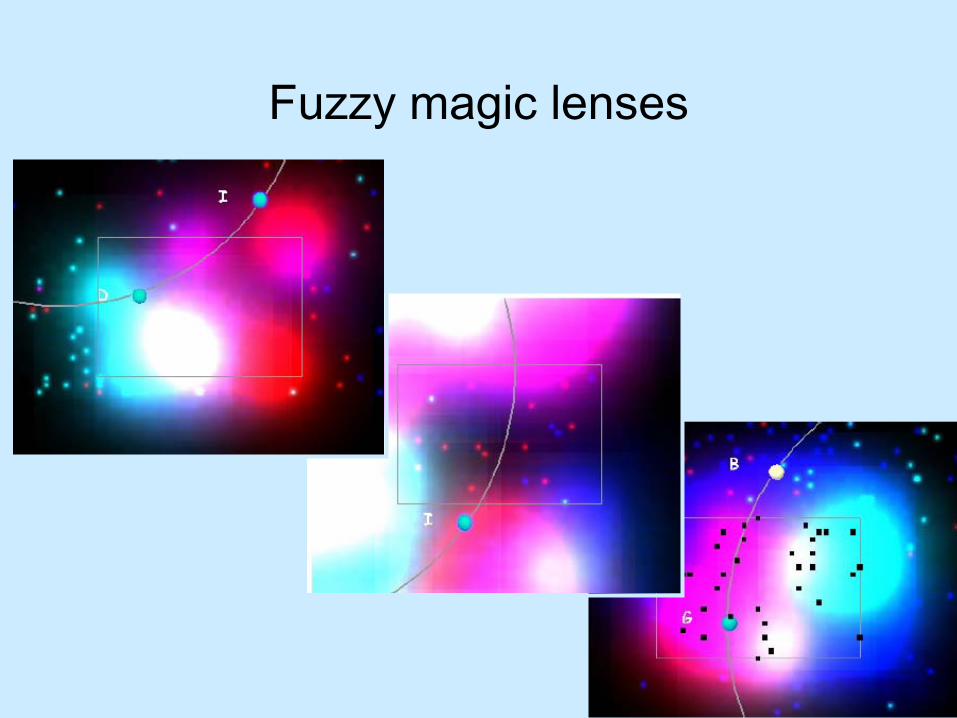
Fuzzy magic lenses

More about genetic data
Gemone – genetic material of a cell– Thought of as cellular instruction set
• Consists of 1 or more chromosomes– Contain DNA and/or RNA
• Built of nucleotides A, C, G, and T• This sequence has directionality

Aligning Humans & Mammals• Sequences of human DNA aligned with about a dozen other
mammals, created as an illustration for Seed Magazine. The data is from the Mammalian Genome Project at the Broad Institute. This is real alignment data, based on a more "functional" tool that browses this data. The first image is the final image, and the second image is an alternate.
• In each block, the white row is human DNA, additional rows are ordered roughly in their "evolutionary distance" from humans. First row after human is chimp, then rhesus macaque (rhesus monkey), elephant, dog, armadillo, cavia (basically a guinea pig), cow, and so on, down to monodelphis (opossum). Letters are colored when they differ from human, with Ts and As in red, Cs and Gs in blue.


Nature HapMap project• When comparing the genetic code (the 3 billion A, C, G, and T
letters) of two people, changes can be seen every one to three thousand letters. The changes are often inherited in groups, taking on a kind of "block" structure. Each difference is one of two letters (represented by the deeper and paler red colors).
• Ben Fry’s cover of the HapMap issue of the journal Nature. • Depicts the CFTR region of the human genome• This image represents blocks in the genetic profile of three
different populations (data HapMap Project (hapmap.org)). • top row shows a group of Yorubans from Africa, • middle row a groups with Western European Ancestry• bottom a set of Japanese and Han Chinese individuals. • Higher genetic diversity -> less "block" structures • Lower genetic diversity means more blocks. • Height proportional to number of people in group with changes


http://benfry.com/isometricblocks/

Genome valence
• Ben Fry: 2002 Whitney Biennial
• a primary use of the data for biologists is to search for a sequence of letters and see if it's found in the genome of another organism.
• If the sequence is found, it is then possible, based on what's known about the sequence as it's found in the other organism, to guess the function of that sequence of letters.

Genome Valence • visual representation of the algorithm (called BLAST)
commonly used for genome searches. • genome of an organism is made up of thousands of
genes (34,000 for the human, 20,000 for the mouse, and 14,000 for the fruitfly). A gene is made up of a sequence of As, Cs, Gs, Ts that averages 1000 to 2000 letters apiece.
• BLAST breaks sequences of letters into 9 letter parts. • Every unique nine letter set is represented as a point• points are arranged from the center, with the most
common sets on the outside, the less common towards the middle.


http://benfry.com/genomevalence/
Gremlin
Gremlin: An Interactive Visualization Model for Analyzing Genomic Rearrangements
Trevor M. O’Brien, Anna M. Ritz, Benjamin J. Raphael, & David H. Laidlaw
IEEE TRANSACTIONS ON VISUALIZATION AND COMPUTER GRAPHICS, VOL. 16, NO. 6, NOVEMBER/DECEMBER 2010

Gremlin
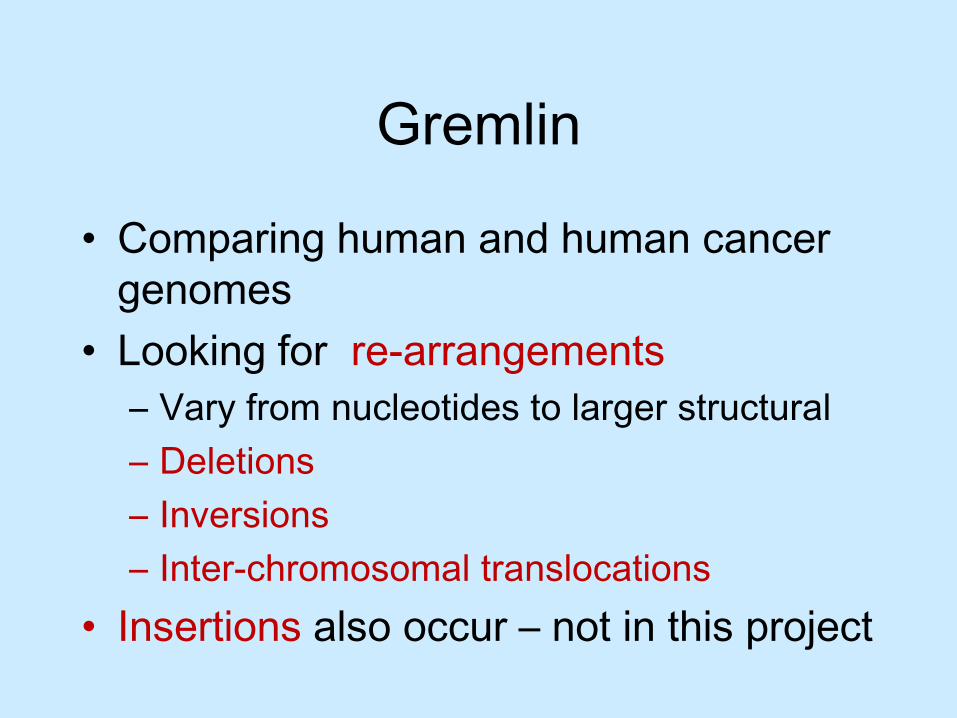
• Comparing human and human cancer genomes
• Looking for re-arrangements– Vary from nucleotides to larger structural – Deletions– Inversions– Inter-chromosomal translocations
• Insertions also occur – not in this project

Gremlin
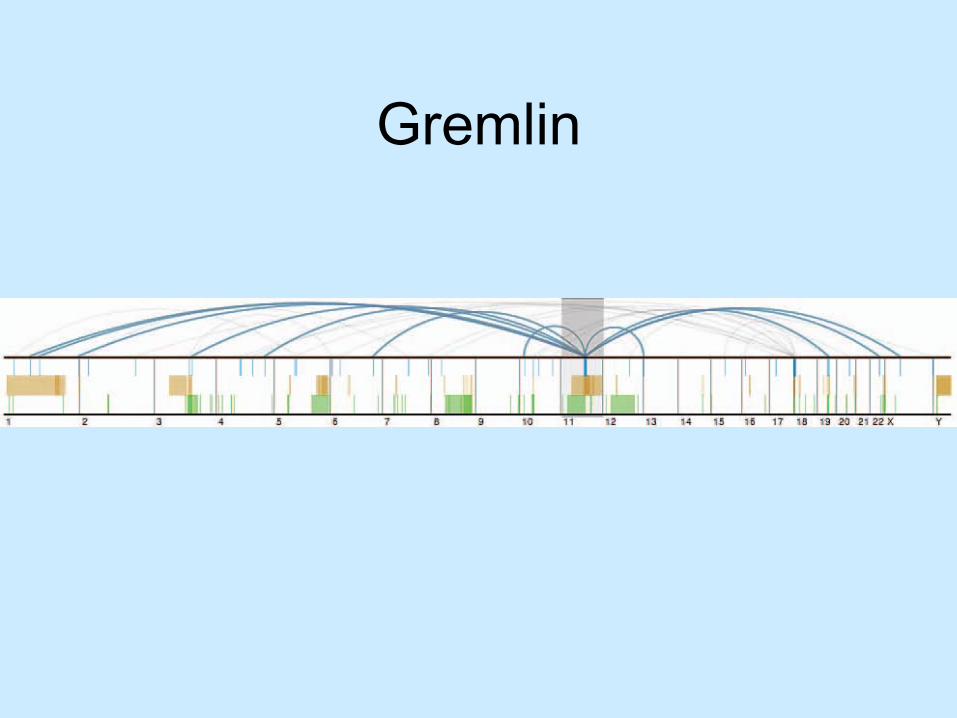
• Human genome – 3 million nucleotide base pairs
• Many to one mapping (screen space)• Model – 1D horizontal, linear,
conventional ordering
Gremlin
• Comparing human and human cancer genomes
• Looking for re-arrangements– Vary from nucleotides to larger structural – Deletions– Inversions– Inter-chromosomal translocations
• Insertions also occur – not in this project

Gremlin

Gremlin
Gremlin
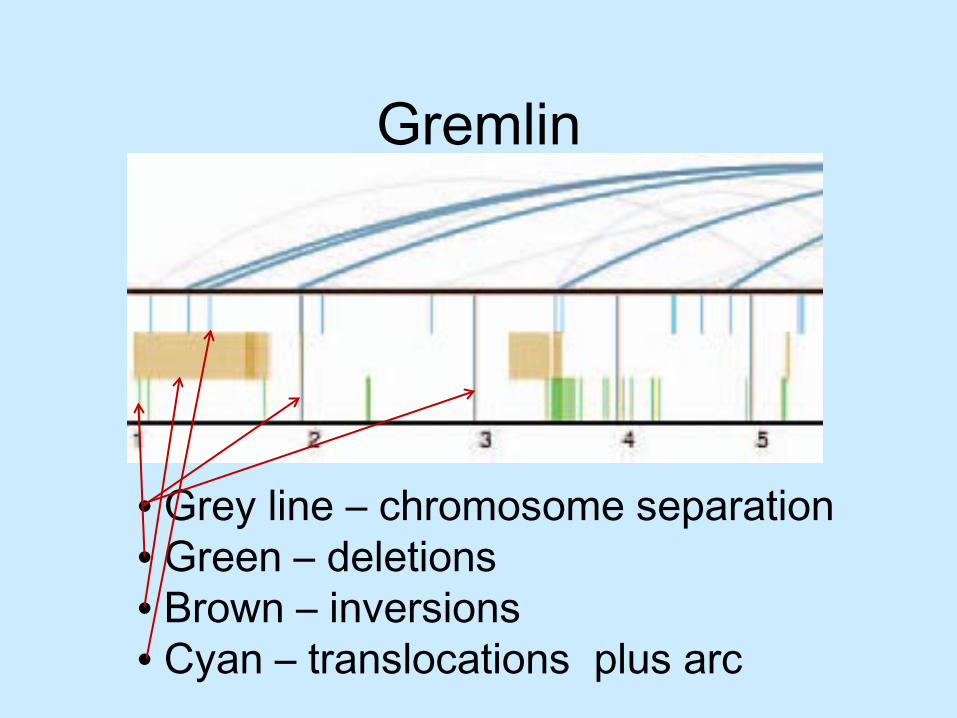
• Grey line – chromosome separation• Green – deletions• Brown – inversions• Cyan – translocations plus arc
Gremlin

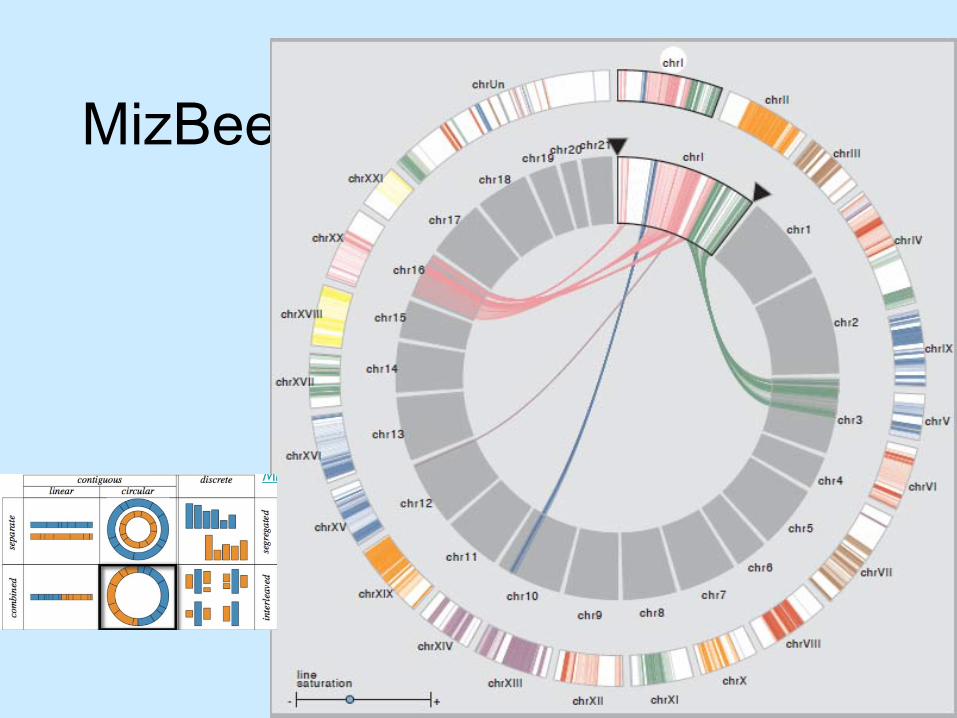
MizBee
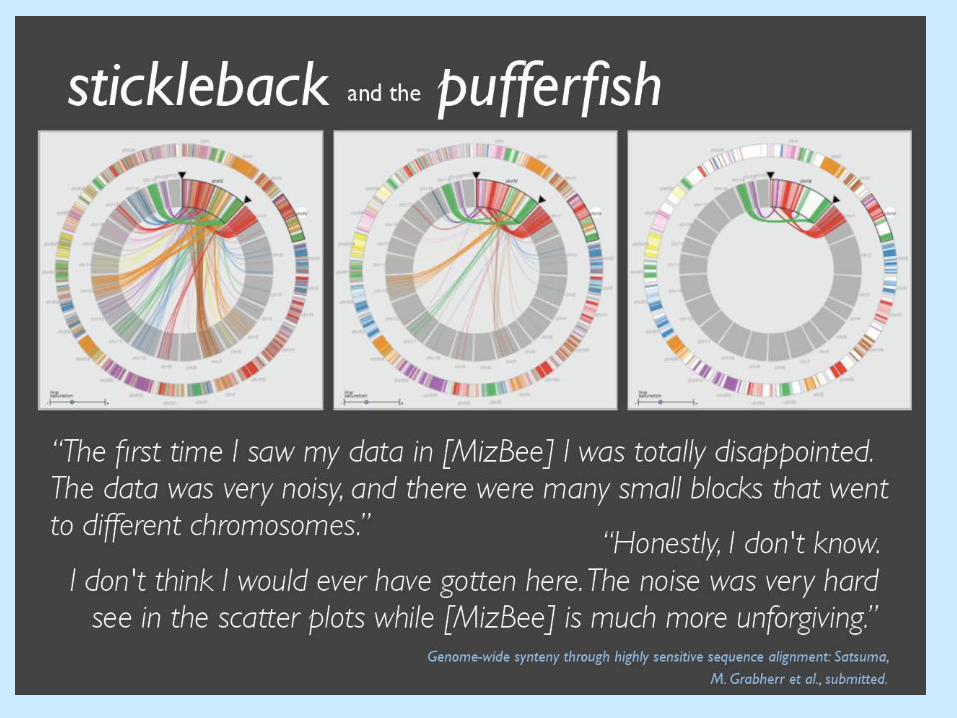
• Comparing genomes – two species (fish)
• Questions – evolutionary positioning– genomic function
• Evidence – Shared ancestry– Shared function

MizBee
• Relatedness in tree of life• Discovery of new genes in species
genome• Identification of sequences and
mechanisms responsible for gene expression regulation

MizBee
• Relationship of convservation between features
• Features – Genes, transposons, introns, exons
• Similarities – how well features map• Synteny – ‘in ribbon – same chromosome,
contiguous -> abstraction ‘blocks’

MizBee
• Conservation relationships in blocks • Proximity• Location• Size• Orientation• Similarity

MizBee

MizBee
Design taxonomy– Represent chromosomes as segments– Encode conservation– Layout variations
src
dst

Design Taxonomy

Taxonomy: contiguous, linear, separate
• most similar match for features• Low saturation encodes low similarity
scores
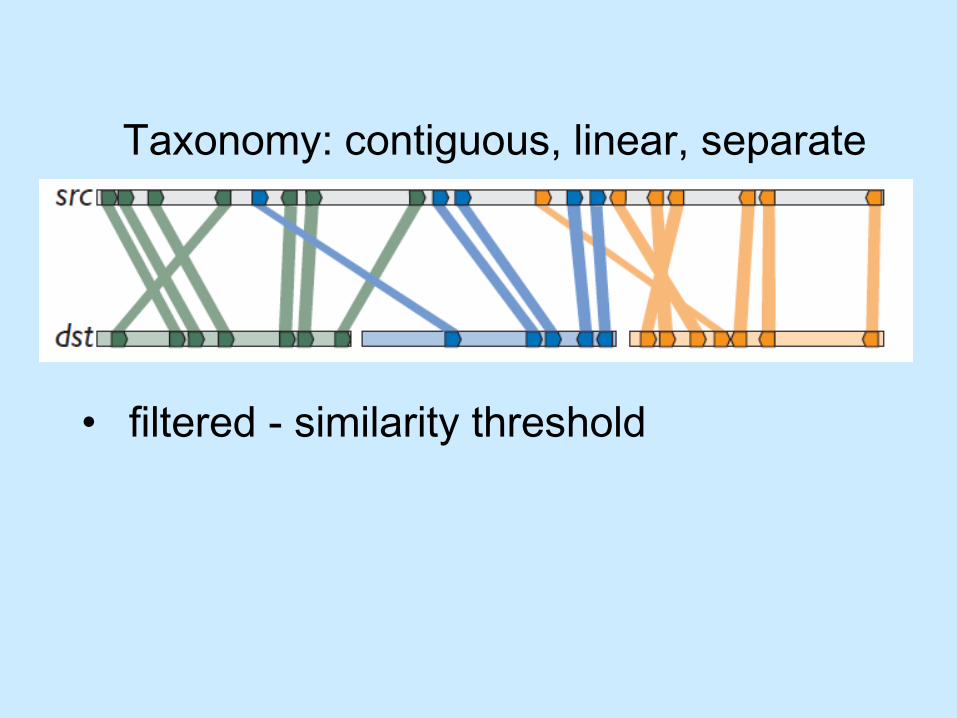
• filtered - similarity threshold
Taxonomy: contiguous, linear, separate

• Combining feature into blocks• Circles show counter examples – need
to be close on src, close on dst, matched orientation
Taxonomy: contiguous, linear, separate
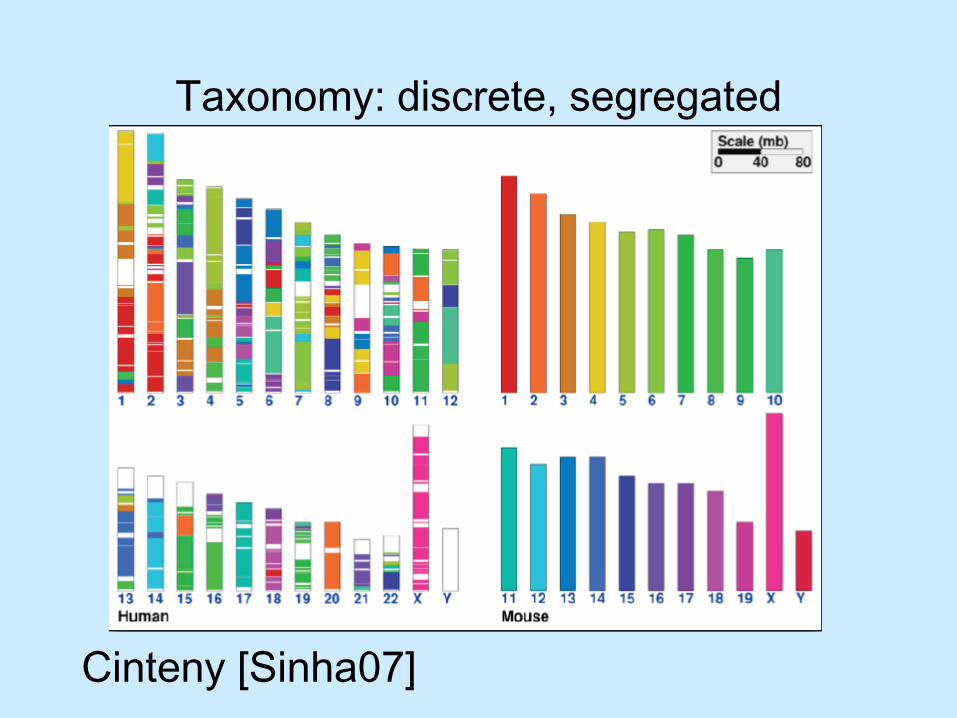
Cinteny [Sinha07]
Taxonomy: discrete, segregated
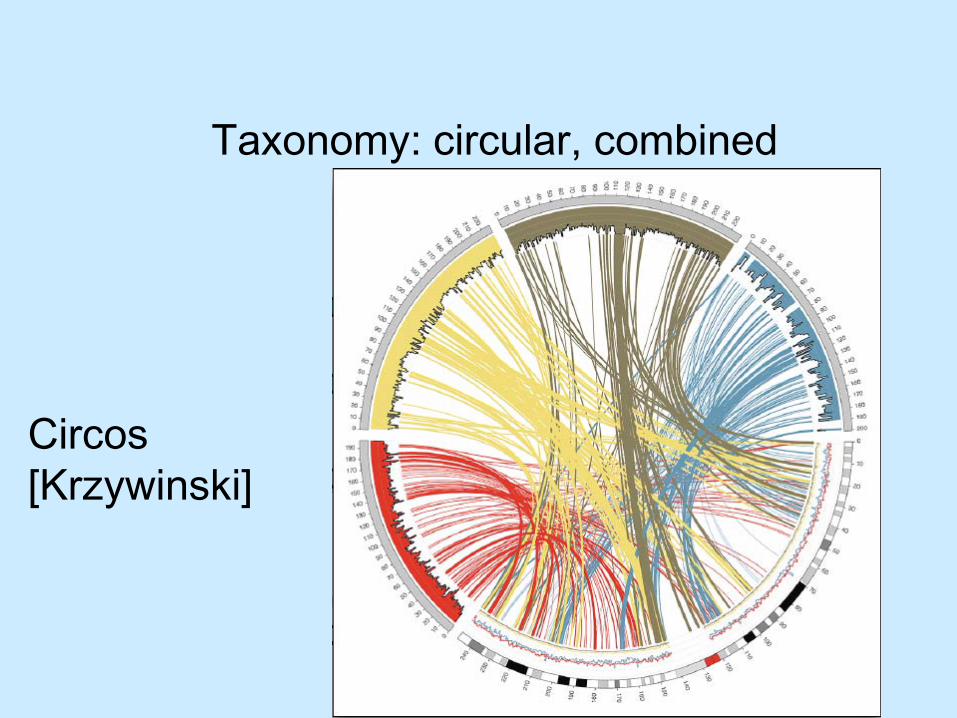
Taxonomy: circular, combined
Circos[Krzywinski]

Taxonomy: circular, combined
Appolo[Lewis02]
MizBee

MizBee

MizBee

MizBee


ABySS
ABySS-Explorer: Visualizing Genome Sequence Assemblies
Cydney B. Nielsen, Shaun D. Jackman, Inanc¸ Birol, and Steven J.M. Jones
IEEE TRANSACTIONS ON VISUALIZATION AND COMPUTER GRAPHICS, VOL. 15, NO. 6, NOVEMBER/DECEMBER 2009

ABySS
ABySS-Explorer employs a novel graph representation enabling biologists to examine the global structure of a genome sequence assembly

ABySSExample of a path ambiguity
in an genome assembly resulting from a repetitive A-rich sequence shown as DNA sequences (a) and as an arrow diagram (b).
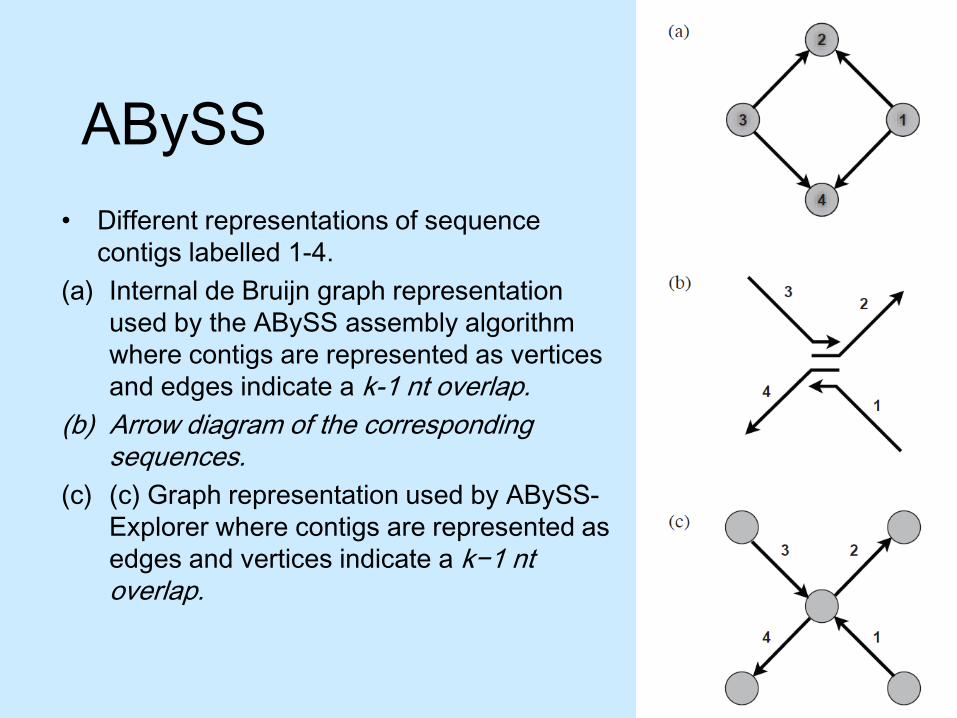
ABySS• Different representations of sequence
contigs labelled 1-4. (a) Internal de Bruijn graph representation
used by the ABySS assembly algorithm where contigs are represented as vertices and edges indicate a k-1 nt overlap.
(b) Arrow diagram of the corresponding sequences.
(c) (c) Graph representation used by ABySS-Explorer where contigs are represented as edges and vertices indicate a k−1 ntoverlap.

ABySSExample of vertex polarity using an overlap size of 6 nt. Bothgraph and sequence representations are shown.
When a contig edge isreverse-complemented, its orientation, labelled strand, and vertex poleconnections are inverted.

ABySSContigs of different sizes appear as distinct shapes.
In this graph,
one oscillation corresponds to 100 nt such that smaller contigs appear as waves (e.g. contig “36+” = 3,000 nt)
larger contigs become solidshapes (e.g. contig “28+” = 11,700 nt).
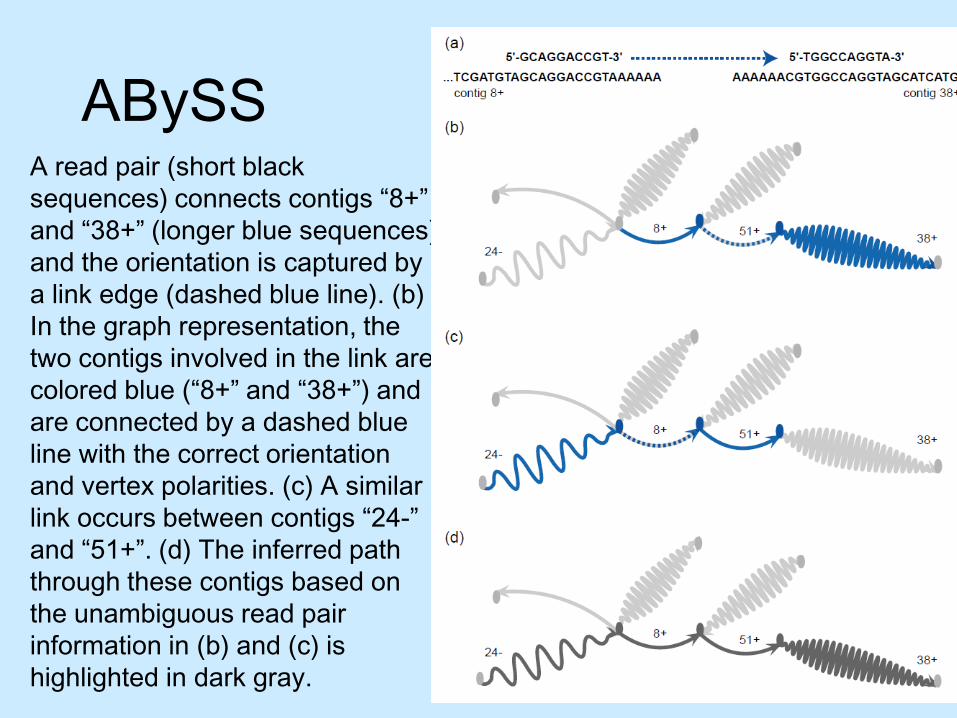
ABySSA read pair (short black sequences) connects contigs “8+”and “38+” (longer blue sequences) and the orientation is captured by a link edge (dashed blue line). (b) In the graph representation, the two contigs involved in the link are colored blue (“8+” and “38+”) and are connected by a dashed blue line with the correct orientation and vertex polarities. (c) A similar link occurs between contigs “24-” and “51+”. (d) The inferred path through these contigs based on the unambiguous read pair information in (b) and (c) is highlighted in dark gray.

ABySSABySS-Explorer view of over 200,000 nt of human genome sequence.

ABySS
Detail of an assembled contig cycle.

ABySSDetail of an ambiguous path (a) resolved by paired read information (b).

ABySS(a) color scheme annotates roughly 1,000,000 nt of the referencehuman genome. (b) Same annotations as in (a) indicate a global inversion event in the corresponding region of a lymphoma genome.

ABySS(c) ABySS-Explorer view of roughly 200,000 nt assembled from the human lymphoma genome region depicted in (b).

ABySSDetail of the inversion breakpoint in a human lymphoma genome.