
A Testing Methodology for Performance-Based Specification
43
Heriot-Watt University Research Gateway A Testing Methodology for Performance-Based Specification Citation for published version: McCarter, WJ, Suryanto, B, Taha, HM, Nanukuttan, S & Basheer, PAM 2017, 'A Testing Methodology for Performance-Based Specification', Journal of Structural Integrity and Maintenance, vol. 2, no. 2, pp. 78-88. https://doi.org/10.1080/24705314.2017.1318040 Digital Object Identifier (DOI): 10.1080/24705314.2017.1318040 Link: Link to publication record in Heriot-Watt Research Portal Document Version: Peer reviewed version Published In: Journal of Structural Integrity and Maintenance Publisher Rights Statement: This is an Accepted Manuscript of an article published by Taylor & Francis in Journal of Structural Integrity and Maintenance on 24/05/2017, available online: http://www.tandfonline.com/10.1080/24705314.2017.1318040 General rights Copyright for the publications made accessible via Heriot-Watt Research Portal is retained by the author(s) and / or other copyright owners and it is a condition of accessing these publications that users recognise and abide by the legal requirements associated with these rights. Take down policy Heriot-Watt University has made every reasonable effort to ensure that the content in Heriot-Watt Research Portal complies with UK legislation. If you believe that the public display of this file breaches copyright please contact [email protected] providing details, and we will remove access to the work immediately and investigate your claim. Download date: 08. Oct. 2021
Transcript of A Testing Methodology for Performance-Based Specification

Heriot-Watt University Research Gateway
A Testing Methodology for Performance-Based Specification
Citation for published version:McCarter, WJ, Suryanto, B, Taha, HM, Nanukuttan, S & Basheer, PAM 2017, 'A Testing Methodology forPerformance-Based Specification', Journal of Structural Integrity and Maintenance, vol. 2, no. 2, pp. 78-88.https://doi.org/10.1080/24705314.2017.1318040
Digital Object Identifier (DOI):10.1080/24705314.2017.1318040
Link:Link to publication record in Heriot-Watt Research Portal
Document Version:Peer reviewed version
Published In:Journal of Structural Integrity and Maintenance
Publisher Rights Statement:This is an Accepted Manuscript of an article published by Taylor & Francis in Journal of Structural Integrity andMaintenance on 24/05/2017, available online: http://www.tandfonline.com/10.1080/24705314.2017.1318040
General rightsCopyright for the publications made accessible via Heriot-Watt Research Portal is retained by the author(s) and /or other copyright owners and it is a condition of accessing these publications that users recognise and abide bythe legal requirements associated with these rights.
Take down policyHeriot-Watt University has made every reasonable effort to ensure that the content in Heriot-Watt ResearchPortal complies with UK legislation. If you believe that the public display of this file breaches copyright pleasecontact [email protected] providing details, and we will remove access to the work immediately andinvestigate your claim.
Download date: 08. Oct. 2021

A Testing Methodology for Performance-Based Specification
W. J. McCarter 1 *
B. Suryanto 1
H. M. Taha 1
S. Nanukuttan 2
P. A. M. Basheer 3
1 Heriot Watt University,
School of Energy, Geoscience, Infrastructure and Society,
Edinburgh, EH14 4AS,
U.K.
2 Queen's University,
School of Planning, Architecture and Civil Engineering,
Belfast, BT7 1NN,
U.K.
3 University of Leeds,
School of Civil Engineering,
Leeds LS2 9JT, UK
* Corresponding Author: E-mail: [email protected]
Phone: +44-131-451-3318
Fax: +44-131-451-4617

A Testing Methodology for Performance-Based Specification
Satisfactory guidelines for ensuring adequate reinforced concrete durability can
only be developed by monitoring concrete performance under a range of field
exposure conditions over an extended period of time. Only then can there be a
move from prescriptive durability specifications (minimum grade, maximum
water-binder ratio, and minimum cement content) to performance-based
methods. The situation is also made more complex by the range of cements now
available - BS EN 197 defines a total of 27 products in the family of common
cements. Implementation of both design for durability and performance-based
standards and specifications are limited by the lack of rapid, simple, science-
based test methods for characterizing the transport properties and deterioration
resistance of concrete. This paper presents an overview of performance-based
specification and developments in the application of electrical property
measurements as a candidate testing methodology in evaluating the relative
performance of concrete mixes. The technique lends itself to in-situ monitoring
thereby allowing measurements to be obtained on the as-placed concrete.
Keywords: concrete, durability, performance, resistivity, formation factor,
testing
Introduction
A state of the nation report (New Civil Engineer, 2000) graded the quality of the UK's
infrastructure from B (fair) to D (poor) with an overall grading of C (average). A similar
situation exists in the US, where the ASCE Report on America's Infrastructure (ASCE, 1998)
estimated a five-year total investment need of US$1.3 trillion just to reinstate roads, bridges
and other infrastructure systems to good serviceable life; in 2005, this investment need had
risen to US$1.6 trillion. Further to this, the average state of America's infrastructure was
given a Grade D (Poor); as a specific example, in excess of 40% of 500,000 highway bridges
are rated as structurally deficient or functionally obsolete and some US$100 billion is the

estimated requirement to eliminate the current backlog of bridge deficiencies and maintain
repair levels (Swamy, 2008).
Considering reinforced concrete structures, the initiation and propagation stages of
deterioration result from a complex interaction of physical, chemical and electrochemical
phenomena. The rate at which a particular structure deteriorates depends on many factors and
evaluating the performance of reinforced concrete requires numerous data inputs, in
particular, the response of the concrete to the changing micro-environment in the vicinity of a
specific structural element or part of a structure. As it is the concrete cover-zone which
protects the steel reinforcement - and therefore provides the first line of defence against the
environment - it is understandable that considerable attention is directed towards assessing
the performance of this zone (Long, Henderson and Montgomery, 2001; Basheer and Nolan,
2001; Basheer and Barbhuiya, 2010). The protective properties of the cover-zone are a major
factor with regard to the in-service performance of the structure, likely deterioration rates for
a particular exposure condition and compliance with specified design life. It is permeation
processes such as diffusivity and sorptivity which are important and there clearly exists a
need to study and determine quantitatively those near-surface characteristics of concrete
which promote the ingress of gases or liquids containing dissolved contaminants.
Regarding concrete durability, European Standard BS EN206 (BSI, 2013a) deals with
durability on the basis of a prescriptive, deem-to-satisfy approach by specifying minimum
grade, minimum binder content and maximum water-binder ratio for a series of well-defined
environmental classes. Interestingly, section 5.3.3 of this code allows for performance-related
methods and defines concrete on the basis of an equivalent durability procedure (EDP);
further detail on the EDP is presented in PD CEN/TR 16563 (BSI, 2013b). However, in order
to fully implement a performance-based strategy requires,

(1) long-term experience of local materials and practices and on a detailed knowledge
of the local environment;
(2) test methods based on approved and proven tests that are representative of actual
conditions and have approved performance criteria; and,
(3) analytical models that have been calibrated against test-data representative of
actual conditions in practice.
Performance Testing
Although attempts have been made to introduce performance-based specifications, the lack of
reliable, consistent and standardised test procedures for evaluating concrete performance has
hindered its widespread implementation. Furthermore, there is also an intense need to
evaluate the concrete as early as possible; the sooner information is obtained about the early-
age properties of any given batch of concrete, the sooner adjustments can be made to the
materials, proportions or processes for subsequent concrete placement, and the sooner
remedial measures can be initiated on the concrete already installed or construction practices
altered (e.g. extended curing). Early-age testing is useful in this regard as the consequences of
unsatisfactory concrete discovered at a later stage becomes expensive. The term identity
testing is used in BS 8500-1 (BSI, 2016) to describe testing to validate the identity of the mix.
Identity testing attempts to verify some key characteristic of the concrete that relates to the
desired performance and could take the form of a slump, flow, density, strength, water-
content or some non-destructive or in-place method.
According to BS EN1990 (BSI, 2005), a reinforced concrete structure is designed in
such a way that 'deterioration over its design working life does not impair the performance of
the structure below that intended, having due regard to its environment and the anticipated
level of maintenance'. It is evident that consideration of a maintenance strategy forms an

integral part of the structural design process. Implicit within this process is a consideration of
adequate monitoring procedures, together with an appropriate level of inspection for the
particular structure. As noted above, cover-zone transport mechanisms, their variation
through the cover-zone, cyclic wetting/drying characteristics and temporal changes in
properties all influence reinforced concrete performance and durability. In-situ monitoring of
cover-zone concrete – in both the spatial and temporal domains - could thus assist in making
realistic predictions as to the in-service performance of the structure; likely deterioration rates
for a particular exposure condition, compliance with the specified design life and as an early
warning indicator of incipient problems. Fig. 1 (adapted from Tutti, 1982) highlights the
usefulness of in-situ monitoring of concrete performance during the life of the structure
which can be divided into three stages: an initial stage which represents the concrete response
to the external environment, a second stage which represents the initiation of the deterioration
process (corrosion in this instance) and a third stage where propagation of deterioration
occurs.
The specification of the service-life/performance/durability of reinforced concrete by
means a single parameter is the holy grail of the engineer and hence a subject of intense
research interest (see, for example, Neithalath, Persun, and Manchiryal, 2010; Muigai, Moyo
and Alexander, 2012; Spragg et al, 2013; Andrade, d'Andrea and Rebolledo, 2014; Nganga,
Alexander and Beushausen, 2015; Merioua, Bezzar and Ghomari, 2015). The challenges
posed by a performance-based testing and specification approach to improve service life of
concrete structures have been acknowledged (Beushausen and Fernandez-Luco, 2015). It is
set against this background that the work presented examines the use of the intrinsic electrical
properties of cementitious materials (resistivity in the current work) as a potential candidate
testing methodology in assessing concrete performance. Moreover, as the electrical resistivity

of the concrete surrounding the rebar controls the magnitude of the corrosion current, it
makes this parameter an important factor in the overall corrosion dynamics.
The work detailed specifically highlights the development of a testing methodology
for in-situ monitoring of the as-placed concrete, which can be undertaken from initial
gauging, through setting and throughout the long-term hardening process. In addition, the
combination of concrete resistivity measurements and the calculated pore-fluid resistivity
could be used to rank the durability performance of concrete mixes.
Electrical Property Measurements
From an electrical point of view, concrete can be regarded as a composite comprising non-
conductive aggregate particles embedded in an ionically conducting cementitious matrix,
with conduction occurring primarily through the continuous water-filled, pore-network. As a
consequence, the electrical properties of concrete are directly related to setting and hardening
processes, so its measurement could be of practical significance in assessing the durability of
concrete. In addition, as the hydration process will alter the pore system (e.g. pore tortuosity,
pore connectivity) beyond the standard curing period, this will result in time-variant
microstructural - hence electrical property - changes.
The electrical resistivity of a material is a fundamental electrical property and is equal
to the resistance, in ohms, between opposite faces of a unit cube of that material. Hence, if R
is the bulk resistance of a prismatic sample of concrete placed between two electrodes of area
A (cm2), separated by a distance L (cm), then its bulk resistivity, , is given by,
L
RA Ohm-cm (cm) (1)
Conventional treatment of resistivity data - saturated rocks in this instance - has been
to utilise the formation factor F (Archie, 1942; Atkins and Smith, 1961) which is defined as

the ratio of bulk resistivity, , of the saturated rock to the resistivity of the saturating liquid,
p. The formation factor is then related to the rock porosity, , through the relationship,
m
p
aF
(2)
where the exponent m is the cementation exponent, and is related to the tortuosity and
connectivity of the pore network within the rock and a is a correction factor which is valid
over a particular range of porosities,. A wide range of values have been reported for m and
a for different rock and sediment formations, with a, typically, in the range 0.4–2.5 and m =
1.22.5 (Worthington, 1993; Khalil and Santos, 2009). Values of m and a are characteristic
for a given porous rock formation and are determined empirically.
Provided that the solid phase can be regarded as an insulator in comparison to that of
the interstitial aqueous phase, diffusion and resistivity of a saturated porous system are
connected through the relationship (Atkinson and Nickerson, 1984; Scherer, Valenza and
Simmons, 2007),
F
1p
oD
D
(3)
where D is the diffusion coefficient of an ion in the porous material, Do the free solution
diffusion coefficient of the ion.
The work detailed above indicates that the electrical resistivity of concrete provides an
indirect measure of the capillary pore network (continuity, tortuosity) which is a key property
of concrete to resist the permeation of a fluid. In order to fully exploit electrical property
measurements in assessing the relative performance of different concrete mixes, however, the
resistivity of the pore-fluid, p, needs to be estimated. This is particularly relevant when
supplementary cementitious materials (SCM) are used as these materials alter the

concentrations of Na+, K+ and OH- within the interstitial aqueous phase in comparison to a
plain Portland cement concrete (Shi, Stegeman and Caldwell, 1998). In order to evaluate the
resistivity of the pore-fluid, pore expression techniques can be used to squeeze the pore-fluid
out of the hardened cement paste; however, this is impractical for a variety of reasons, not
least because it complicates the testing procedure. The pore-fluid resistivity could be
estimated from the ionic concentrations predicted from the chemical composition of the
binder. For example, the model of Taylor (Taylor, 1987) predicts the concentration of various
ionic species in the pore solution based on the cement composition and degree of hydration.
From the estimated concentrations of the ions, it is then possible to evaluate the resistivity of
the pore-fluid. In this work, the model developed by Snyder, Feng, Keen, and Mason (2003)
and Bentz (2007) is used to estimate the resistivity of the pore fluid.
Experimental
In order to investigate to applicability of electrical measurements to monitor the short- and
long- term performance of concrete, developments were made on two fronts (a) electrical
measurements on concretes taken during the initial 24-hours after casting, and (b) electrical
measurements taken during long-term hardening and cyclic ponding up to 350 days
hydration. Different electrode configurations were used for each regime and described below.
In the current work, testing was carried out in a temperature controlled laboratory
(22C±1C, 55%±5%RH).
Materials

The concrete mixes used within the experimental programme are presented in Table 1 with a
crushed granite aggregate used throughout together with a mid-range water
reducer/plasticiser (SikaPlast 15RM). Table 1 also presents the 28-day and 56-day concrete
compressive strengths, denoted f28 and f56, respectively, which were determined on 100mm
cubes cast at the same time as the slabs detailed below (6 per mix). The oxide analysis of the
cementitious materials is presented in Table 2.
The range of mixes, in terms of binder-content, binder composition and water-binder ratio,
would satisfy minimum requirements specified in BS 8500-1 (BSI, 2016) for environmental
exposure classes XC (corrosion induced by carbonation), XS (corrosion induced by chlorides
from sea-water) and XD (corrosion induced by chlorides other than sea-water e.g. deicing
salt) for an intended working life of 100 years, with 50mm cover-to-steel.
Testing over Initial 24-hours
Concrete samples were compacted into plastic (non-conductive) cuboidal moulds of internal
dimensions 150mm×150mm×150mm. A pair of stainless-steel electrodes, 2.4mm diameter,
were embedded into each concrete sample (three samples per mix) with a center-to-center
spacing of 75mm and embedded to a depth of 75mm. The electrodes were held securely in
position using a PVC former placed across the top of the cube mould. Embedding the
electrodes in this fashion ensured intimate contact with the sample and reduced any
interference with the natural distribution of aggregate. A thermistor was also embedded
centrally within each cube to allow internal temperature measurements. The top surface of the
cell was covered to prevent evaporation; the electrodes were connected to an LCR meter with
electrical resistance measurements taken on a 4 minute cycle throughout the initial 24-hours

after gauging. In order to avoid problems with electrode-polarization, the frequency of the
applied field was 100kHz.
Testing during Long-Term Hardening
Samples (3 per mix) for this stage of the experimental programme were cast as
250×250×150mm (thick) slabs in steel formwork with the 250×250mm face cast against the
formwork used as the working face. To facilitate ponding, an integral 20mm dyke was cast
around the working face. On demoulding at approximately 24-hours, each specimen was
wrapped in damp hessian and placed in a heavy-duty polythene bag which was then sealed.
The specimens were then left in a laboratory for a period of 27-days. At this time, the four
vertical faces and the as-cast face of the specimens were painted with two coats of an epoxy-
based sealant and left in a laboratory environment. After approximately 7-days, all samples
were ponded with water for a period of 24-hours. This ensured the surface region of all
specimens was in a similar saturated state. Samples were then allowed to dry for a further 7-
days before being subjected to a cyclic ponding regime viz. 1-day wetting followed by 6-days
drying.
In this part of the study, electrical measurements were obtained utilizing a multi-
electrode array (McCarter, Chrisp and Starrs, 2011) which was embedded within the sample
at the time of casting. This arrangement allowed monitoring of the spatial distribution of both
electrical resistance and temperature. In summary, the array comprised six electrode-pairs
and four thermistors mounted on a PVC former, with the former being secured onto two,
15mm diameter steel bars; the cover-to-steel was 50mm. Each electrode comprised a 1.6mm
diameter stainless steel rod, sleeved with insulation to expose a 10mm tip; the centre-to-
centre spacing between the electrodes was 10mm. With this arrangement, the electrode-pairs
were positioned at 10, 20, 30, 40, 50 and 75mm from the concrete surface (see Fig. 2(a)). The

electrode array was positioned at the plan centre of each slab with wiring from the embedded
array ducted out of the slab and terminated with a multipole D-connector. On demoulding at
24-hours, electrical resistance and thermistor (temperature) measurements on the array were
then taken on a 12-hour cycle using a multiplexing system (see Fig. 2(b)) with testing
extending up to 350 days.
Calibration of Electrode Arrangements
The resistivity of the concrete was evaluated by multiplying the resistance measured across
the electrodes by a calibration factor, denoted k , as shown in equation (4) below. As the
electrical field between the electrodes is non-uniform, the geometrical factor A/L in equation
(1) is not readily calculable and was obtained by calibrating the electrode arrangement in
liquids of know resistivity. This was undertaken for the electrode arrangement used in both
the cubes (24-hour hydration study) and slabs (long-term hardening study). The measured
resistance, R (ohms), across the electrodes was then converted to resistivity, (in cm),
through the relationship,
kR cm (4)
The calibration factor, k was obtained as 5.77cm for the cube specimens and for each
electrode-pair on the array k was 2.41cm.
Results and Discussion
Due to the considerable amount of data collected, only a selection of results are presented for
illustrative purposes and, for reasons of clarity, only selected measurement points are
highlighted on the figures (although graphs presented were drawn through all measurement
points).

Response during initial 24-hours
Fig. 3(a) presents the resistivity, , during the initial 24-hours for the PC concrete mixes in
Table 1; also shown in this Figure is the -time response for the w/b = 0.35 concrete mix
without the addition of plasticiser. The curves can be divided into two distinct regions: an
initial region of decreasing resistivity followed by a region of increasing resistivity over the
remainder of the 24-hour test period. However, it is evident that the time over which these
regions occur, the absolute values of resistivity within each region and the rate of change of
resistivity within each region depends on the w/b ratio and addition of plasticiser.
During mixing, dissolution of ions from the cement grain surfaces takes place, with
the different mineralogical phases and calcium sulphate contributing to the pore-solution
chemistry. The interstitial aqueous phase contains, primarily, Na+, K+, Ca2+, SO42- and OH-
which increases with time and, as conduction will be primarily electrolytic in nature, will
result a decrease in resistivity. The period of decreasing resistivity extends over 0-1.5 hours
for the concrete (w/b = 0.35) without plasticiser, whereas for the same concrete with
plasticiser this period has increased to 0-2.5 hours indicating a slower dissolution process,
which is a similar time-scale for the higher w/b ratio concrete (0.65); however, the w/b= 0.65
concrete achieves a lower resistivity simply as a result of the higher volumetric water content
of this mix. A period of increasing resistivity follows which is taken to imply an increase in
rigidity of the concrete. As the cement paste hydrates, its porosity decreases with the pore
network becoming more tortuous, constricted and disconnected as a crystalline network is
formed. As conduction is electrolytic via the continuous capillary pores, this will result in an
increase in resistivity of the concrete. Regarding the PC concrete (w/b = 0.35), it is also
evident that the resistivity of the concrete without plasticiser increases at a faster rate than the
concrete with plasticiser highlighting that the plasticiser is having a retarding effect on the

hydration process. The retarding effect results in resistivity values that are similar to the w/b
= 0.65 PC concrete over the initial 15 hours
The influence of the SCM's on early hydration can be seen in Figs. 3(b) and (c). As
with the PC concretes, the resistivity decreases due to increasing ionic concentration within
the water phase although the absolute values of resistivity are higher due to the reduced PC
content of these mixes(hence lower ionic concentrations) and inert nature of the SCM during
the early stages of hydration which is acting as a filler material. During the period after the
resistivity minimum, the resistivity increases albeit at a slower rate than the PC concrete; as
before, the retarding effect of the plasticiser results in the resistivity vs time response being
similar for both w/b ratios.
Response during period 24-hours – 350 days
Preliminaries
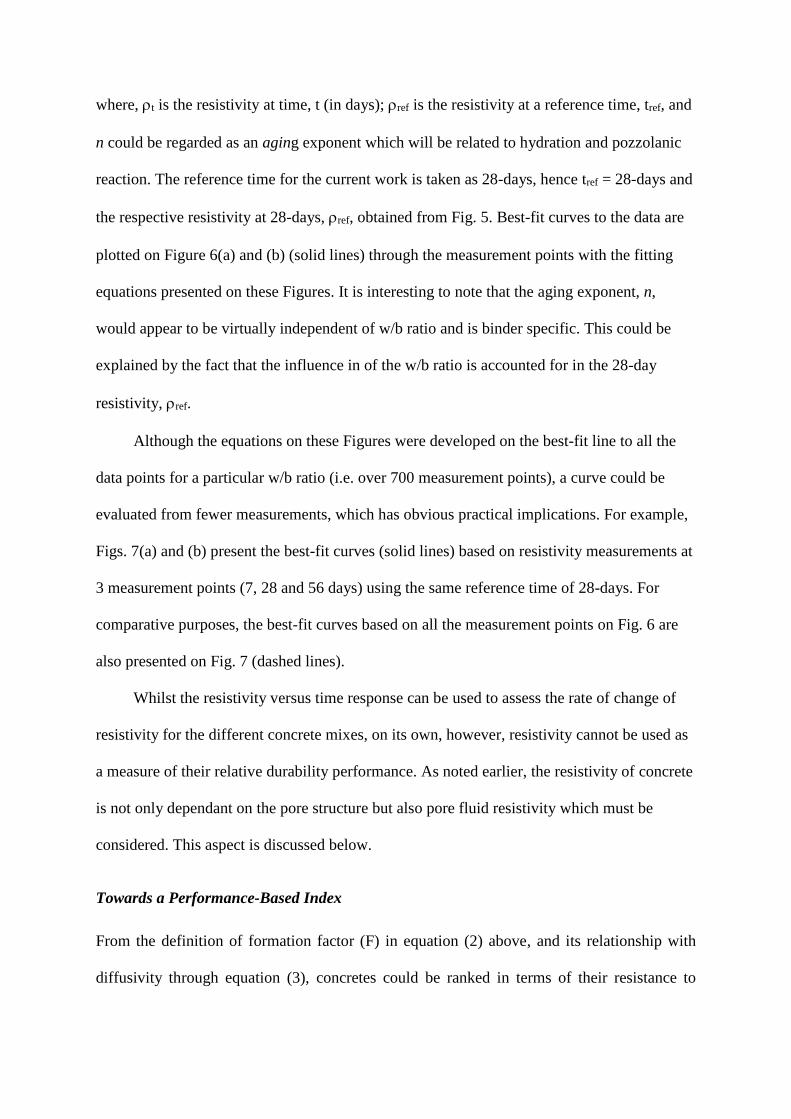
Fig. 4 presents the resistivity, , for the electrodes positioned at 10, 20, 30 and 75mm from
the surface for the PC concrete mix (w/b=0.65) with data presented between 100 and 200
days after casting. Note that for reasons of clarity, only every 5th measurement point is
highlighted. The influence of the cyclic wetting/drying regime on the concrete resistivity is
clearly evident for the electrode-pairs positioned 10mm and 20mm from the surface, with
periods of wetting resulting in a decrease in resistivity and drying accompanied by an
increase in resistivity. The electrode-pair positioned at 75mm, however, displays a continual
increase and is not influenced by wetting/drying at the concrete surface. Similar responses
were obtained for the other concrete mixes and it is for this reason that only measurements
from the electrode-pair positioned at 75mm from the exposed surface, and still within the
near-surface region, are presented and discussed below. The electrical measurements

obtained at 75mm will thus reflect cement hydration, pozzolanic reaction and microstructural
development.
Resistivity/Time response
Fig. 5(a) presents the resistivity for concrete mixes with w/b=0.35 over the initial 4-weeks
after demoulding i.e. during the curing period. The resistivity of all mixes display a continual
increase although the influence of the SCM's on resistivity is also evident. For periods <3
days, the PC concrete displays a higher resistivity than the FA/35 and GGBS/65 mixes and
reflects the initial slower reaction of these systems. However, for periods >3-days, the
resistivity of the GGBS/65 concrete achieves higher values than the PC concrete whereas for
the FA/35 concrete, this effect does not occur until approximately 15 days. Similar trends are
observed in Fig. 5(b) for concrete mixes with w/b=0.65 although the resistivity of the FA/35
mix only achieves higher values than the PC mix at periods in excess of 28-days. It is also
apparent that there is an inverse relationship between w/b ratio and resistivity.
Figs. 6(a) and (b) display the resistivity at 75mm from the surface from 7-days up to
approximately 350 days for 0.35 and 0.65 w/b ratios (Note: again, for clarity, only every 20th
measurement point is highlighted on these curves). The influence of SCM's on the resistivity
is now clearly evident from these Figures; at the end of the test period, the resistivity of the
FA/35 and GGBS/65 mixes are almost an order of magnitude higher than the PC mix, at both
w/b ratios. The increase in resistivity for both the GGBS and FA concretes reflects the on-
going reactivity of the SCM's and pore structure refinement during the post-curing period.
The temporal increase in resistivity for the concretes presented in Fig. 6 can be
represented by the equation of the form,
n
reft
treft
(5)
where, t is the resistivity at time, t (in days); ref is the resistivity at a reference time, tref, and
n could be regarded as an aging exponent which will be related to hydration and pozzolanic
reaction. The reference time for the current work is taken as 28-days, hence tref = 28-days and
the respective resistivity at 28-days, ref, obtained from Fig. 5. Best-fit curves to the data are
plotted on Figure 6(a) and (b) (solid lines) through the measurement points with the fitting
equations presented on these Figures. It is interesting to note that the aging exponent, n,
would appear to be virtually independent of w/b ratio and is binder specific. This could be
explained by the fact that the influence in of the w/b ratio is accounted for in the 28-day
resistivity, ref.
Although the equations on these Figures were developed on the best-fit line to all the
data points for a particular w/b ratio (i.e. over 700 measurement points), a curve could be
evaluated from fewer measurements, which has obvious practical implications. For example,
Figs. 7(a) and (b) present the best-fit curves (solid lines) based on resistivity measurements at
3 measurement points (7, 28 and 56 days) using the same reference time of 28-days. For
comparative purposes, the best-fit curves based on all the measurement points on Fig. 6 are
also presented on Fig. 7 (dashed lines).
Whilst the resistivity versus time response can be used to assess the rate of change of
resistivity for the different concrete mixes, on its own, however, resistivity cannot be used as
a measure of their relative durability performance. As noted earlier, the resistivity of concrete
is not only dependant on the pore structure but also pore fluid resistivity which must be
considered. This aspect is discussed below.
Towards a Performance-Based Index
From the definition of formation factor (F) in equation (2) above, and its relationship with
diffusivity through equation (3), concretes could be ranked in terms of their resistance to

ionic penetration using the parameter, F. However, the formation factor requires a knowledge
of the pore-water resistivity. A straightforward procedure for estimating pore-water resistivity
from the concentrations of Na+, K+ and OH- ions in the pore-water has been developed
(Snyder, Feng, Keen and Mason, 2003; Bentz, 2007). In their work, for a particular degree of
hydration, the concentrations of Na+ and K+ are computed from the binder composition
(Table 2) and it was assumed that 75% of the Na2O and K2O will be released into the pore-
water. The concentration of OH- is then deduced from the electro-neutrality condition. Using
the equivalent conductivity of each ion, these data are then used to compute the pore solution
electrical resistivity, p, which is presented in Fig. 8.
Table 3 presents the computed F values for each concrete mix in Table 1 at both 28-
days (F28) and 56-days (F56); in calculating p, an average degree of hydration of 80% has
been assumed throughout for each binder type (although it is evident from Fig. 8 that
hydration does not have a significant influence on pore fluid resistivity over the range 50%-
95% hydration). With reference to Table 3, decreasing the w/b ratio from 0.65 to 0.35 results
in a fivefold (approximately) increase in F for each mix. Moreover, the beneficial effect of
the FA and GGBS is clearly evident, particularly at longer time-scales. Although these
materials may not necessarily create concretes of lower porosity than their PC counterparts, it
is of a more disconnected and tortuous in nature (Li and Roy, 1986; Lu, Landis and Keane,
2006). It is interesting to note that whilst the GGBS/65 concrete displays the highest
resistivity, when the resistivity of the pore-water is considered, it is out-ranked by the FA/35
concrete in the longer-term.
When equation (3) above, is combined with equation (5), the instantaneous diffusion
coefficient at time, t, Di(t), of a particular ionic species (e.g. Cl-) could be approximated as,
𝐷𝑖(𝑡) = 𝐷𝑜𝜌𝑝
𝜌𝑟𝑒𝑓(
𝑡
𝑡𝑟𝑒𝑓)
−𝑛
(6)

Consider the FA concrete with w/b=0.35. If, over the test period, an average degree of
hydration of 80% is assumed then, from Fig. 8, the resistivity of the pore-water, p, is
evaluated as 8.31 ohm-cm; taking the self-diffusion of the chloride ion (Cl-) in pure water,
Do, as 1.84×10⁻⁹ m2/s (Li and Gregory, 1974; Shackleford and Daniel, 1991), then, from Fig.
5(a) and equation (6) above, the time-dependant, instantaneous diffusion coefficient, Di(t),
could be approximated by the relationship,
𝐷𝑖(𝑡) = 1.63 × 10⁻¹² (𝑡
28)
−1.06
𝑚2/𝑠 (7)
It must be stressed that Di(t) represents the diffusion coefficient at time, t, and not the
effective (or apparent) diffusion coefficient, Deff, normally referred to in the literature. Deff is
generally obtained from the error function solution to the chloride profile obtained from dust
drillings taken through the cover-zone and thus represents the integrated, or time-averaged,
diffusion coefficient. Hence, if Deff values are used to make predictions as to future chloride
ingress they will tend to underestimate the time to activation of corrosion.
It is accepted that the evaluation of the resistivity of the pore-water is, at best,
approximate, however, considering the extremely wide variation in published values for
diffusion coefficients for concretes with and without SCM's (Bamforth, Price and Emerson,
1997), this methodology could be developed a means for estimating the diffusion coefficient
and ranking the performance of different concretes.
Conclusions and Concluding Comments
The work detailed has presented developments in the application of the electrical properties
of concrete as a candidate testing methodology in assessing both the early hydration
characteristics (<24-hours) and the long-term performance of concrete. This was achieved by

using electrical resistivity measurements in combination with the pore-fluid resistivity
evaluated from the oxide composition of the cementitious materials.
The following conclusions can be drawn:
1. Resistivity measurements taken during the early hydration period (24-hours) indicated
that the response comprised two distinct regions – a initial region (up to 3.0 hours)
of decreasing resistivity resulting from dissolution processes and increasing ionic
concentration within the interstitial aqueous phase followed by a region of increasing
resistivity resulting from setting and the increase in rigidity of the concrete.
2. Further to conclusion 1 above, the addition of SCM's result in higher resistivity values
during the initial region and is attributed to the reduced ionic concentrations within
the aqueous phase and filler effect of the SCM. Furthermore, resistivity measurements
clearly show that the addition of plasticiser has a mild retarding effect on the early
hydration processes and, as such, the testing methodology could be used to study the
influence of chemical admixtures on setting and hardening.
3. Further to conclusion 1 above, during the period of increasing resistivity, the
resistivity of the PC concrete increases at a faster rate than those concretes containing
SCMs and reflects the slower reaction during the initial stages of hydration.
4. Over the period 1day up to 350 days, the resistivity of concrete increases with time
due to the ongoing hydration and pozzolanic processes. In the short-term the
resistivity of concretes containing SCM's is lower than the respective PC mix due to a
slower reaction; however, in the longer term, the resistivity of the FA and GGBS
concretes displays a more marked increase that that of the PC concretes and attributed
to a more disconnected and tortuous capillary pore network.

5. Through the use of an ageing factor, a relationship was established to model the
development of resistivity with time. The ageing exponent was found to be binder
specific and virtually independent of w/b ratio.
6. The term Formation Factor (F) was introduced and used to assess the relative
performance of the concrete mixes. In general terms, the higher the F value for the
concrete, the better its performance rating; however, work is still required to obtain
values, or range of values, for F for concrete classification purposes
The resistivity of concrete is a relatively easy parameter to evaluate and the work detailed
above has shown that it can be monitored from initial placing of the concrete, through setting
and long-term hardening. In a broader sense, the measurement technology lends itself in-situ
monitoring and remote interrogation (McCarter and Vennesland, 2004). The installation of a
network of sensors, embedded at critical locations within a concrete structure, could provide
continuous, real-time data on the response of the micro-environment within the cover-zone to
changing ambient environmental conditions.
Acknowledgements
The work presented formed part of the concrete durability programme into monitoring and
improving the performance of structural concrete in bridges and in the development of
performance-based testing procedures undertaken for Transport Scotland and the Engineering
and Physical Sciences Research Council, UK (Research Grants EP/G025096, EP/G02152X
and EP/I005846). Funding from both organisations is gratefully acknowledged. The views
expressed in this paper are those of the Authors and not necessarily those of Transport
Scotland.
The Authors also wish to acknowledge the support of Hanson Cement (UK) for supplies of
materials and the technical support of AmphoraNDT (www.amphorandt.com).


References
American Society of Civil Engineers (ASCE) (1998). Report Card for America's
Infrastructure. Retrieved from: http://ascelibrary.org/doi/pdf/10.1061/9780784478899
(accessed 12/01/2017)
Andrade, K., d'Andrea, R. and Rebolledo, N. (2014, March). Chloride ion penetration in
concrete: The reaction factor in the electrical resistivity model. Cement and Concrete
Composites. 47, 41-46. doi:10.1016/j.cemconcomp.2013.09.022
Archie, G.E. (1942). The electrical resistivity log as an aid in determining some reservoir
characteristics, Transactions of the American Institute of Mining and Metallurgical
Engineers, 146(1), 54-62. doi.org/10.2118/942054-G
Atkins, E.R. and Smith, G.H. (1961, March 1). The significance of particle shape in
formation resistivity factor - porosity relationships, Society of Petroleum Engineers. 13, 285-
291. doi:10.2118/1560-G-PA
Atkinson, A. and Nickerson, A. K. (1984). The diffusion of ions through water-saturated
cement. Journal of Materials Science. 19(9), 3068-3078. doi:10.1007/BF01026986
Bamforth, P. B., Price W. F. and Emerson, M. (1997). An international review of chloride
ingress into structural concrete. Transport Research Laboratory, Contractor Report 359,
162pp. ISBN 0-7277-2928-4
Basheer, P. A. M. and Barbhuiya, S. (2010). Pore structure and transport processes. Chapter 2
in Concrete durability: A practical guide to the design of durable concrete structures (M
Soutsos, Editor) Thomas Telford Ltd., London. (ISBN 978-0-7277-3517-1)
Basheer, P.A.M. and Nolan E. (2001). Near-surface moisture gradients and in situ permeation
tests, Construction and Building Materials. 15(2/3), 105-114. doi:10.1016/S0950-
0618(00)00059-3
Bentz, D. (2007). A virtual rapid chloride permeability test, Cement and Concrete
Composites. 29(10), 723-731. doi:10.1016/j.cemconcomp.2007.06.006

Beushausen, H. and Fernandez-Luco L. (Eds). (2015) Performance-based specifications and
control of concrete durability, State-of-the-Art Report RILEM TC 230-PSC. (ISBN 978-94-
017-7309-6).
British Standards Institution (BSI) (2005). BS EN1990:2002+A1:2005 Eurocode – Basis of
structural design, British Standards Institution, London.
British Standards Institution (BSI) (2013a). BS EN206:2013 Concrete - Specification,
performance, production and conformity, British Standards Institution, London.
British Standards Institution (BSI) (2013b). PD CEN/TR 16563:2013 Principles of the
equivalent durability procedure. British Standards Institution, London. ISBN 978-0-580-
81434-1.
British Standards Institution (BSI) (2016). BS EN8500-1:2015+A1:2016 Concrete -
Complementary British Standard to BS EN 206 Part 1: Method of specifying and guidance
for the specifier, British Standards Institution, London.
Khalil, M.A. and Santos, F.A.M. (2009). Influence of degree of saturation in the electric
resistivity hydraulic conductivity relationship. Surveys in Geophysics. 30, 601-615, 2009.
doi:10.1007/s10712-009-9072-4
Li S. and Roy D. M. (1986) Investigation of relations between porosity, pore structure, and
C1− diffusion of fly ash and blended cement pastes. Cement and Concrete Research. 16(5),
749-759. doi:10.1016/0008-8846(86)90049-9
Li, Y-H. and Gregory, S. (1974). Diffusion of ions in sea-water and in deep-sea sediments,
Geochimica et Cosmochimica Acta, 38, 703-714. doi:10.1016/0016-7037(74)90145-8
Long, A.E., Henderson G.D. and Montgomery F.R. (2001). Why assess the properties of
near-surface concrete. Construction and Building Materials. 15(2/3), 65-79.
doi:10.1016/S0950-0618(00)00056-8
Lu, S., Landis, E. N. and Keane, D. T. (2006). X-ray microtomographic studies of pore
structure and permeability in Portland cement concrete. Materials and Structures. 39(6), 611-
620. doi:10.1617/s11527-006-9099-7

McCarter, W. J. and Vennesland, Ø. (2004). Sensor systems for use in reinforced concrete
structures. Construction and Building Materials, 18(6), 351–358.
doi:10.1016/j.conbuildmat.2004.03.008
McCarter, W.J., Chrisp, T.M. and Starrs, G., A sensor apparatus and method for embedding
in construction material, Patent No. GB2487691 and WO/2011048378, 2011.
https://patentscope.wipo.int/search/en/detail.jsf?docId=WO2011048378&recNum=1&maxRe
c=&office=&prevFilter=&sortOption=&queryString=&tab=PCT+Biblio
Merioua, A., Bezzar, A. and Ghomari, F. (2015). Non-destructive Electrical Methods for
Measuring the Physical Characteristics of Porous Materials. Journal of Nondestructive
Evaluation, 34(2), Article 13 (12pp). doi:10.1007/s10921-015-0287-7
Muigai, R. , Moyo, P. and Alexander, M. (2012). Durability design of reinforced concrete
structures: a comparison of the use of durability indexes in the deemed-to-satisfy approach
and the full-probabilistic approach. Materials and Structures. 45(8), 1233-1244.
doi:10.1617/s11527-012-9829-y
Neithalath, N., Persun, J. and Manchiryal, R.K. (2010). Electrical conductivity based
microstructure and strength prediction of plain and modified concretes. International Journal
of Advances in Engineering Sciences and Applied Mathematics. 2(3), 83–94. doi:
10.1007/s12572-011-0023-1
New Civil Engineer. (2000, May 25). The state of the nation. New Civil Engineer. 15-17.
Nganga, G., Alexander, M. and Beushausen, H. (2015) Practical implementation of the
durability index performance-based design approach. Construction and Building Materials,
45, 251-261. doi:10.1016/j.conbuildmat.2013.03.069
Scherer, G.W., Valenza J.J. and Simmons G. (2007). New methods to measure liquid
permeability in porous materials, Cement and Concrete Research. 37(3), 386-397.
doi:10.1016/j.cemconres.2006.09.020
Shackleford, C. D. and Daniel, D. E. (1991). Diffusion in Saturated Soil. I: Background.
Journal of Geotechnical Engineering. 117(3), 467-484. doi:10.1061/(ASCE)0733-
9410(1991)117:3(467)

Shi, C., Stegemann, J. A. and Caldwell, R. J. (1998). Effect of Supplementary Cementing
Materials on the Specific Conductivity of Pore Solution and its Implications on the Rapid
Chloride Permeability Test (AASHTO T277 and ASTM C1202) Results. ACI Materials
Journal. 95(4), 389-394
Snyder, K.A., Feng, X., Keen, B.D. and Mason, T.O. (2003). Estimating the electrical
conductivity of cement paste pore solutions from OH-, K+ and Na+ concentrations. Cement
and Concrete Research. 33(6), 793-798. doi:10.1016/S0008-8846(02)01068-2
Spragg, R., Bu, Y., Snyder, K., Bentz, D. and Weiss, J. (2013). Electrical Testing of Cement-
Based Materials: Role of Testing Techniques, Sample Conditioning, and Accelerated Curing.
Publication FHWA/IN/JTRP-2013/28. Joint Transportation Research Program, Indiana
Department of Transportation and Purdue University, West Lafayette, Indiana.
doi:10.5703/1288284315230
Swamy, R.N. (2008, April). Holistic Design: Key to Sustainability in Concrete Construction.
JSCE Concrete Committee. Newsletter No. 13. Retrieved from:
http://www.jsce.or.jp/committee/concrete/e/newsletter/newsletter13/newsletter13.asp
Taylor, H.F.W. (1987). A method for predicting alkali ion concentrations in cement pore
solutions, Advances in Cement Research. 1(1), 5-16. doi:10.1680/adcr.1987.1.1.5
Tutti, K. (1982). Corrosion of Steel in Concrete, Report Fo 4.82, Swedish Cement and
Concrete Association, Stockholm, pp469. Retrieved from:
http://portal.research.lu.se/portal/files/4709458/3173290.pdf#page=34&zoom=auto,-120,519
(accessed 12/01/2017)
Worthington, P.F. (1993). The uses and abuses of the Archie equations, 1: the formation
factor porosity relationship. Journal of Applied Geophysics. 30(3), 215-228.
doi:10.1016/0926-9851(93)90028-W

Captions for Figures
Fig. 1 Components of service life.
Fig. 2 (a) Electrode array embedded within slab samples for long-term testing, and (b)
experimental set-up for long-term testing.
Fig. 3 Resistivity during initial 24-hours for (a) PC concretes, (b) GGBS/65 concretes,
and (c) FA/35 concretes.
Fig. 4 Variation in resistivity for electrode-pairs at 10, 20, 30 and 75mm from the
concrete surface undergoing cyclic wetting (PC concrete, w/b=0.65).
Fig. 5 Increase in resistivity during initial 28-days after casting for concretes (a)
w/b=0.35 and (b) w/b=0.65.
Fig. 6 Increase in resistivity over the period 7-350 days after casting for concretes (a)
w/b = 0.35 and (b) w/b = 0.65. Curve fits in the form of equation (5) are also
presented.
Fig. 7 Curve-fits (solid lines) to concrete resistivity measurements based on 3 (three)
measurement points – 7, 28 and 56 days for (a) w/b = 0.35 and (b) w/b = 0.65.
Curve fits based on all measurements points indicted with dashed lines.
Fig. 8 Pore-fluid resistivity, p, for all cementitious binders evaluated using the work of
Snyder, Feng, Keen and Mason (2003) and Bentz (2007).

Table 1 Summary of concrete mixes (pl =plasticiser, w/b = water-binder ratio, FA = fly ash, GGBS = ground granulated blast-furnace slag).
Figure in brackets is standard deviation for compressive strength results.
Mix
w/b
CEM I
kg/m3
GGBS
kg/m3
FA
kg/m3
20mm
kg/m3
10mm
kg/m3
Fine
(<4mm)
kg/m3
pl
l/m3
f28
MPa
f180
MPa
PC
0.35 378 - - 787 393 787 5.15 79 (0.95) 88 (1.44)
0.65 263 - - 790 395 790 - 39 (0.87) 46 (2.52)
GGBS/65
0.35 132 244 - 782 391 782 5.12 65 (2.26) 76 (0.58)
0.65 92 170 - 786 393 786 - 31 (0.79) 40 (2.31)
FA/35
0.35 242 - 130 773 386 773 5.06 65 (0.38) 81 (1.15)
0.65 169 - 91 780 390 780 - 24 (0.35) 38 (0.95)

27
Table 2 Oxide analysis of cementitious materials used in experimental programme.
% by weight PC FA GGBS
SiO2 20.68 51.0 34.33
Al2O3 4.83 27.4 12.60
Fe2O3 3.17 4.6 0.60
CaO 63.95 3.4 41.64
MgO 2.53 1.4 8.31
TiO2 + 1.6 +
P2O5 + 0.3 +
SO3 2.80 0.7 +
K2O 0.54 1.0 0.47
Na2O 0.08 0.2 0.25
+ not determined

28
Table 3 Formation factors (F) for the concrete mixes in Table 1 at 28-days (F28) and
56-days (F56). Note: the figure in brackets is the standard deviation for the value
presented.
Mix w/b p*
(cm)
28
(×104 cm)
(×104 cm)
F28 F56
PC
0.35 10.7 0.725 (0.032) 0.865
(0.037) 677 (30) 808 (34)
0.65 23.6 0.368 (0.030) 0.445
(0.034) 156 (12) 188 (14)
GGBS/65
0.35 27.8 3.23 (0.210) 4.46 (0.275) 1162 (75) 1604
(100)
0.65 57.6 1.69 (0.110) 2.32 (0.153) 293 (19) 403 (27)
FA/35 0.35 8.31 0.952 (0.045) 2.01 (0.093) 1146 (54)
2419
(112)
0.65 18.1 0.394 (0.031) 0.842
(0.066) 218 (17) 465 (37)
* calculated value

29
Figure 1
Deg
ree
of
Det
erio
rati
on
Initial period:
Changes in concrete
due to
environmental
action
Propagation period:
Condition reached which
defines the serviceability
limit state
End of Service Life
Initiation of
deterioration
Monitor and Test

30
Figure 2(a)

31
Figure 2(b)
Resistance measurement
and multiplexing units

32
Figure 3(a)
0.1
0.2
0.5
1
0.050 5 10 15 20 25
w/b = 0.35 (without plasticiser)w/b = 0.35 (with plasticiser)w/b = 0.65
(a) PC
Time (hrs)
( 1
04 o
hm
-cm
)

33
Figure 3(b)
0.05
0.10
0.15
0.20
0 5 10 15 20 25
w/b = 0.35.w/b = 0.65
(b) GGBS/65
Time (hrs)
( 1
04 o
hm
-cm
)

34
Figure 3(c)
0.05
0.10
0.15
0.20
0 5 10 15 20 25
w/b = 0.35w/b = 0.65
(c) FA/35
Time (hrs)
( 1
04 o
hm
-cm
)
35
Figure 4
0.5
1.0
1.5
2.0
100 120 140 160 180 200
10mm20mm30mm75mm
Time, t (days)
(1
04
oh
m-c
m)

36
Figure 5(a)
0.1
0.2
0.5
1
2
5
0 10 20 30
PCGGBS/65FA/35
(a) w/b = 0.35
Time (Days)
( 1
04 o
hm
-cm
)

37
Figure 5(b)
0.1
0.2
0.5
1
2
5
0 10 20 30
PCGGBS/65FA/35
(b) w/b = 0.65
Time (Days)
( 1
04 o
hm
-cm
)

38
Figure 6(a)
0.5
1
2
5
10
20
0.30 50 100 150 200 250 300 350
PCGGBS/65FA/35
(a) w/b = 0.35
= 3.259104(t/28)
0.431
= 0.970104(t/28)
1.06
= 0.745104(t/28)
0.254
Time, t (Days)
( 1
04
ohm
-cm
)

39
Figure 6(a)
0.1
1
10
0 50 100 150 200 250 300 350
PCGGBS/65FA/35
(b) w/b = 0.65
= 1.74104(t/28)
0.431
= 0.403104(t/28)
1.03
= 0.376104(t/28)
0.251
Time, t (Days)
( 1
04
oh
m-c
m)

40
Figure 7(a)
0.5
1
2
5
10
20
0 50 100 150 200 250 300 350
PCGGBS/65FA/35
(a) w/b = 0.35
= 0.970104(t/28)
1.04
= 3.259104(t/28)
0.489
= 0.745104(t/28)
0.250
Time, t (Days)
( 1
04
oh
m-c
m)

41
Figure 7(b)
0.1
1
10
0 50 100 150 200 250 300 350
PCGGBS/65FA/35
= 1.74104(t/28)
0.56
= 0.403104(t/28)
1.07
= 0.376104(t/28)
0.21
(b) w/b = 0.65
Time, t (Days)
( 1
04
oh
n-c
m)

42
Figure 8
0
20
40
60
80
40 50 60 70 80 90 100
PC: w/b = 0.35PC: w/b = 0.65GGBS/65: w/b = 0.35GGBS/65: w/b = 0.65FA/35: w/b = 0.35FA/35: w/b = 0.65
Degree of Hydration (%)
p
(oh
mcm
)


![Adaptive Testing Methodology [ ATM ]](https://static.fdocuments.us/doc/165x107/587199d61a28ab044e8b5743/adaptive-testing-methodology-atm-.jpg)
