A Test Rig for the Condition-Based Maintenance Application ... · PDF fileA Test Rig for the...
11
Challenge F: Even more trains even more on time A Test Rig for the Condition-Based Maintenance Application on the Traction Chain of Very High Speed Trains P. Pennacchi 1 , S. Bruni 1 , S. Chatterton 1 , P. Borghesani 1 , R. Ricci 1 , D. Marinis 2 , A. Didonato 2 , F. Unger-Weber 3 1 Politecnico di Milano – Dept. Mechanical Engineering, Via La Masa 1, I-20156 Milano, Italy 2 Bombardier Transportation Italy S.p.a., Via Tecnomasio 2, I-17047 Vado Ligure (SV), Italy 3 Bombardiert Transportation GmbH, Am Rathenaupark 1, D-16761 Hennigsdorf, Germany Abstract The preventive maintenance of traction equipment for Very High Speed Trains (VHST) nowadays is becoming very expensive owing to the high complexity and quality of these components that require high reliability. An efficient maintenance approach like the Condition-Based Maintenance (CBM) should be implemented to reduce the costs. For this purpose, an experimental full-scale test rig for the CBM of VHST traction equipment has been designed to investigate in detail failures in the main mechanical components of system, i.e. motor, bearings and gearbox. The paper describes the main characteristics of this unique test rig, able to reproduce accurately the train operating conditions, including the relative movements of the motor, the gearbox and the wheel axle. Gearbox, bearing seats and motor are equipped by accelerometers, thermocouples, torque meter and other sensors in different positions. The testing results give important information about the most suitable sensor position and type to be installed for each component and show the effectiveness of the techniques used for the signal analysis in order to identify faults of the gearbox and motor bearings. Introduction Very high speed trains (VHST) require powerful, small and light traction components. These have to operate reliably on various conditions and tracks (including cross-border operation), making the maintenance strategy crucial. Nowadays the most commonly adopted approach is the time-based (or mileage) preventive maintenance (also called planned maintenance), which sets a periodic interval to perform maintenance operations regardless of the health status of the physical components. However, the high reliability required and the complex structure specific of rolling stock equipment make the cost of preventive maintenance higher than necessary, because components are maintained although they might not need maintenance. Therefore, more efficient maintenance approaches, such as condition-based maintenance (CBM), should be implemented. CBM is a maintenance program that recommends maintenance actions based on the assessment of the status of the components, performed analyzing signals coming from installed sensors. CBM attempts to avoid unnecessary maintenance tasks by taking actions only when there is evidence of abnormal behaviors of a physical asset, in this specific context of the traction equipment, i.e. the electrical motor, the gearbox and the bearings. In particular, condition-based maintenance (CBM) promises following benefits among others: on average, longer maintenance intervals, adapted to running conditions; reduction of failures, which leads to train blocking the track or to time delays; prediction of the remaining component life-time; optimisation of maintenance operations and increase of availability. In order to investigate the feasibility of a CBM approach on a VHST, actual traction components (traction motor fed by motor converter and traction gearbox), taken from a Bombardier high speed train application, have been tested on a special test rig, built up with unique characteristics aimed to reproduce actual train operating conditions. Documentation in literature can be found regarding statistical failure characteristics of wheel axle bearings, see for instance [1], whilst the results of CBM techniques for wheel axle bearings of heavy haul freight rail, obtained using a test rig, are reported in [2]. Other test rigs for general applications were proposed to study bearing wear, among those recently by [3,4], or to develop CBM techniques on intentionally damaged bearings [5,6], but there are not specific documentation related to train traction components. Similarly, the problem of detecting damage and wear of gearing has been analyzed by several authors and many different CBM techniques have been proposed. Also some test rigs are described,
Transcript of A Test Rig for the Condition-Based Maintenance Application ... · PDF fileA Test Rig for the...

Challenge F: Even more trains even more on time
A Test Rig for the Condition-Based Maintenance Application on the Traction Chain of Very High Speed Trains
P. Pennacchi1, S. Bruni1, S. Chatterton1, P. Borghesani1, R. Ricci1,
D. Marinis2, A. Didonato2, F. Unger-Weber3
1Politecnico di Milano – Dept. Mechanical Engineering, Via La Masa 1, I-20156 Milano, Italy 2Bombardier Transportation Italy S.p.a., Via Tecnomasio 2, I-17047 Vado Ligure (SV), Italy 3Bombardiert Transportation GmbH, Am Rathenaupark 1, D-16761 Hennigsdorf, Germany
Abstract
The preventive maintenance of traction equipment for Very High Speed Trains (VHST) nowadays is becoming very expensive owing to the high complexity and quality of these components that require high reliability. An efficient maintenance approach like the Condition-Based Maintenance (CBM) should be implemented to reduce the costs. For this purpose, an experimental full-scale test rig for the CBM of VHST traction equipment has been designed to investigate in detail failures in the main mechanical components of system, i.e. motor, bearings and gearbox. The paper describes the main characteristics of this unique test rig, able to reproduce accurately the train operating conditions, including the relative movements of the motor, the gearbox and the wheel axle. Gearbox, bearing seats and motor are equipped by accelerometers, thermocouples, torque meter and other sensors in different positions. The testing results give important information about the most suitable sensor position and type to be installed for each component and show the effectiveness of the techniques used for the signal analysis in order to identify faults of the gearbox and motor bearings.
Introduction
Very high speed trains (VHST) require powerful, small and light traction components. These have to operate reliably on various conditions and tracks (including cross-border operation), making the maintenance strategy crucial. Nowadays the most commonly adopted approach is the time-based (or mileage) preventive maintenance (also called planned maintenance), which sets a periodic interval to perform maintenance operations regardless of the health status of the physical components. However, the high reliability required and the complex structure specific of rolling stock equipment make the cost of preventive maintenance higher than necessary, because components are maintained although they might not need maintenance. Therefore, more efficient maintenance approaches, such as condition-based maintenance (CBM), should be implemented. CBM is a maintenance program that recommends maintenance actions based on the assessment of the status of the components, performed analyzing signals coming from installed sensors. CBM attempts to avoid unnecessary maintenance tasks by taking actions only when there is evidence of abnormal behaviors of a physical asset, in this specific context of the traction equipment, i.e. the electrical motor, the gearbox and the bearings. In particular, condition-based maintenance (CBM) promises following benefits among others:
on average, longer maintenance intervals, adapted to running conditions; reduction of failures, which leads to train blocking the track or to time delays; prediction of the remaining component life-time; optimisation of maintenance operations and increase of availability.
In order to investigate the feasibility of a CBM approach on a VHST, actual traction components (traction motor fed by motor converter and traction gearbox), taken from a Bombardier high speed train application, have been tested on a special test rig, built up with unique characteristics aimed to reproduce actual train operating conditions. Documentation in literature can be found regarding statistical failure characteristics of wheel axle bearings, see for instance [1], whilst the results of CBM techniques for wheel axle bearings of heavy haul freight rail, obtained using a test rig, are reported in [2]. Other test rigs for general applications were proposed to study bearing wear, among those recently by [3,4], or to develop CBM techniques on intentionally damaged bearings [5,6], but there are not specific documentation related to train traction components. Similarly, the problem of detecting damage and wear of gearing has been analyzed by several authors and many different CBM techniques have been proposed. Also some test rigs are described,
Challenge F: Even more trains even more on time
equipped with both spur and helical gears, see for instance respectively [7,8], but they are generally characterized by low or medium power [9], without complex converters, being these test rigs installed in laboratories. Moreover, the test rigs generally used are focused on developing CBM techniques related to bearings or to gearings separately, with the exception of that presented in [10] which employs in any case very low power, or they use a single type of bearing, in order to easy distinguish the typical failure signature. Environmental noise is normally limited and generally testing conditions are not as severe as the operating ones. On the contrary, the test rig, designed to develop specific CBM techniques for VHST, is aimed to reproduce accurately the environment and to consider the complete system instead of each single component (i.e. motor, inverter, gearbox, different kinds of bearings, etc.), reproducing also the actual relative movements of the motor, the gearbox and the wheel axle, caused by the wheel-track interaction, by employing specific moving platforms to which the components are connected. This is a unique characteristic of this test rig together with the actual and high-power motors employed.
Traction system under test
The traction system installed on the test rig has been taken from the “REGINA” high speed train, manufactured by Bombardier, able to reach a maximum speed of 250 km/h. It is composed of an electric motor, see Fig. 1, fastened, in real application, to the bogie by means of three elastic bushings, and of a gearbox, connected on the real train to the bogie by a reaction rod and to the wheel axle. The traction motor is a converter driven 4-poles asynchronous 265 kW motor, whose rotor is mounted on two different bearings: a single row, deep groove ball bearing (BM2 type in Fig. 1) and a cylindrical roller bearing on the Driven End (DE) side (BM1 in Fig. 1).
Fig. 1: Traction equipment arrangement and bearing position and type. The gearbox follows the typical layout with a single reduction gear unit, with helical gearing. The helical pinion (input shaft) of the gearbox is connected to the electrical motor by a toothed coupling. On the gearbox there are two tapered rolling bearings for the output shaft (BG3 in Fig. 1), that can be mounted directly on the wheel-set or on a hollow shaft fitted on the wheel-set, two cylindrical roller bearings (BG2 in Fig. 1), and one split inner ball (four-point) bearing for the input shaft (BG1 in Fig. 1) that supports the axial thrust of the input shaft. The lubricant of the gearbox bearings is oil, whereas is grease for the motor bearings. Bearing positions and types have been coded as showed in Table 1.
Shaft Bearing position along shaft
Position Code
Rolling Element
Bearing Type Code
Motor shaft Motor front (gearbox side) MP1 Cylindrical BM1 Motor shaft Motor back MP2 Ball BM2 Gearbox fast shaft Shaft end NDE side GP1 Ball BG1 Gearbox fast shaft NDE side GP2 Cylindrical BG2 Gearbox fast shaft DE side GP3 Cylindrical BG2 Gearbox wheel shaft NDE side GP4 Tapered BG3 Gearbox wheel shaft DE side GP5 Tapered BG3
Table 1: Bearing types and positions.
GearBox Coupling Motor (z) x
y
Challenge F: Even more trains even more on time
Test rig description
In order to simulate the train load, the traction equipment under test was installed in a test rig coupled with an electro-dynamic brake system. The test rig is powered by a static group converter that supplies the equipments with a DC bus bar at 1500 Vdc with the max power of 300 kW. The electrical scheme is shown in Fig. 2.
Fig. 2: Test rig electrical scheme.
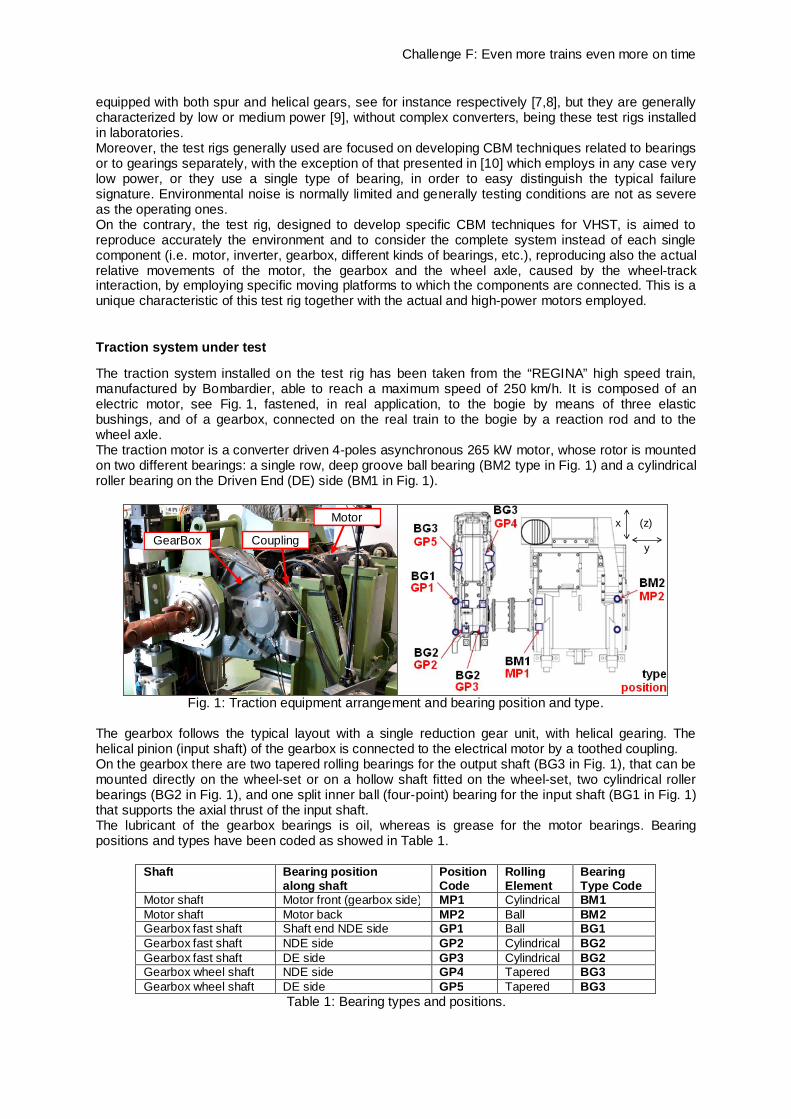
The traction motor under test is controlled by its own traction converter connected to the DC bar by means of a precharge circuit. The brake motor (double-star asynchronous type) is controlled using a converter of the E464 locomotive. Both converters are powered in parallel by the DC bus and each one is also connected to overvoltage resistors by means of a dedicated bar system. The two converters are controlled so that during normal operation one absorbs electrical energy and transforms it into mechanical energy to the axle, while the other recovers mechanical energy delivering it to the bus as electrical energy. The energy absorbed by the power supply unit is used to make up for the mechanical and electric losses. Since the power supply system is not capable of recovering energy, a possible surplus of power not absorbed by one of the two converters is dissipated by the resistors. The mechanical parts of the test rig are installed on a dedicated basement.
Fig. 3: Test rig layout and control devices.
9
7
1
5
3
2
4
Challenge F: Even more trains even more on time
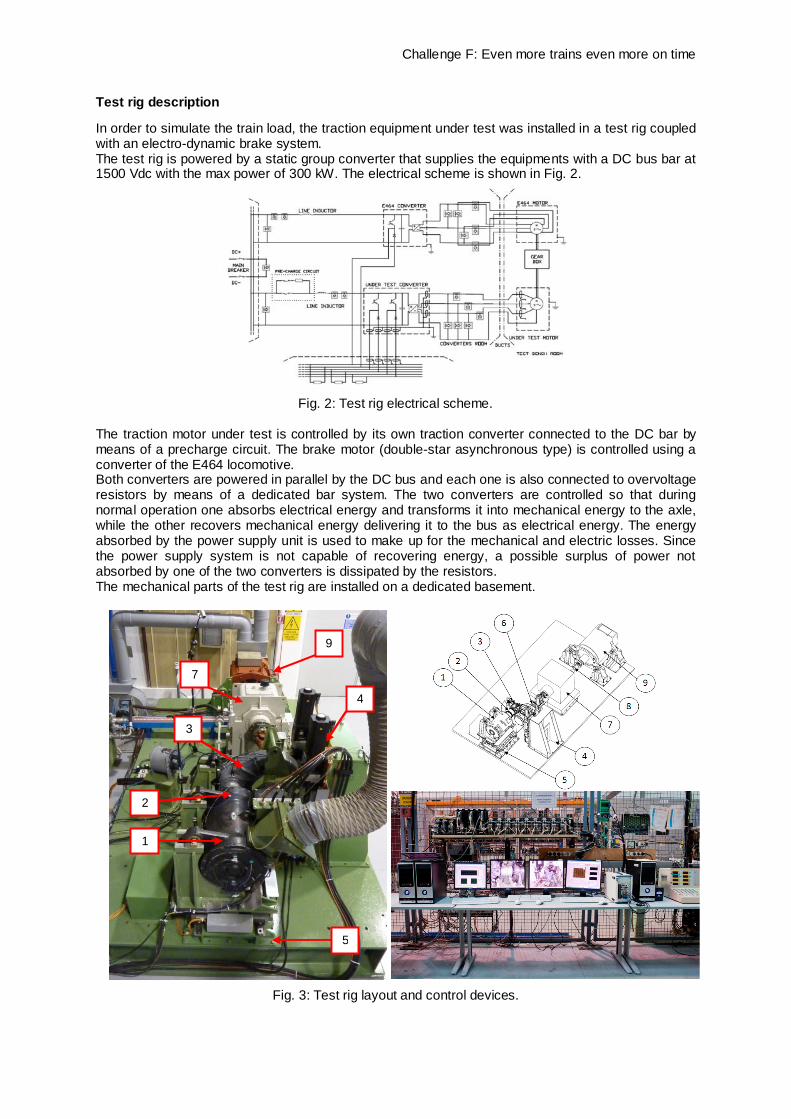
As shown in Fig. 3, the gearbox (pos.3) and the traction motor under test (pos. 1) with the toothed coupling (pos. 2) were mounted on two moving platforms. These platforms simulate the relative movement between the motor suspended on the bogie primary damper and the gearbox joined with the wheel axle. The vertical moving platform (pos. 4) supports the axle of the traction gearbox, by means of two bearings, and shakes it vertically replicating both the movement between the motor and gearbox and the vibrations generated by the tracks. Another moving platform (pos. 5) moves the traction motor in the two directions of the horizontal plane, replicating only the movement between the motor and gearbox. The gearbox axle is connected by means of a cardan shaft to an industrial parallel shaft gearbox (pos 7), that is connected by means of a second cardan shaft to the brake motor (pos. 9). A torque meter is placed between the flanges connecting the first cardan shaft and the industrial gearbox, in order to measure the actual output torque of the traction equipment under test. The industrial gear box is installed in order to adapt the torque-speed curve of the brake motor to the one of the traction motor, as shown in Fig. 4.
Fig. 4: Torque-speed curves of traction and braking subsystems.
A portable axial fan is mounted on the base to reproduce the air flow that hits the gearbox when the train is running. In addition, it cools the bearings and allows stationary operation longer than in real application. Two axial fans are connected to the motor under test and to the brake motor by means of rigid and flexible tubes.
Track influence – moving platforms
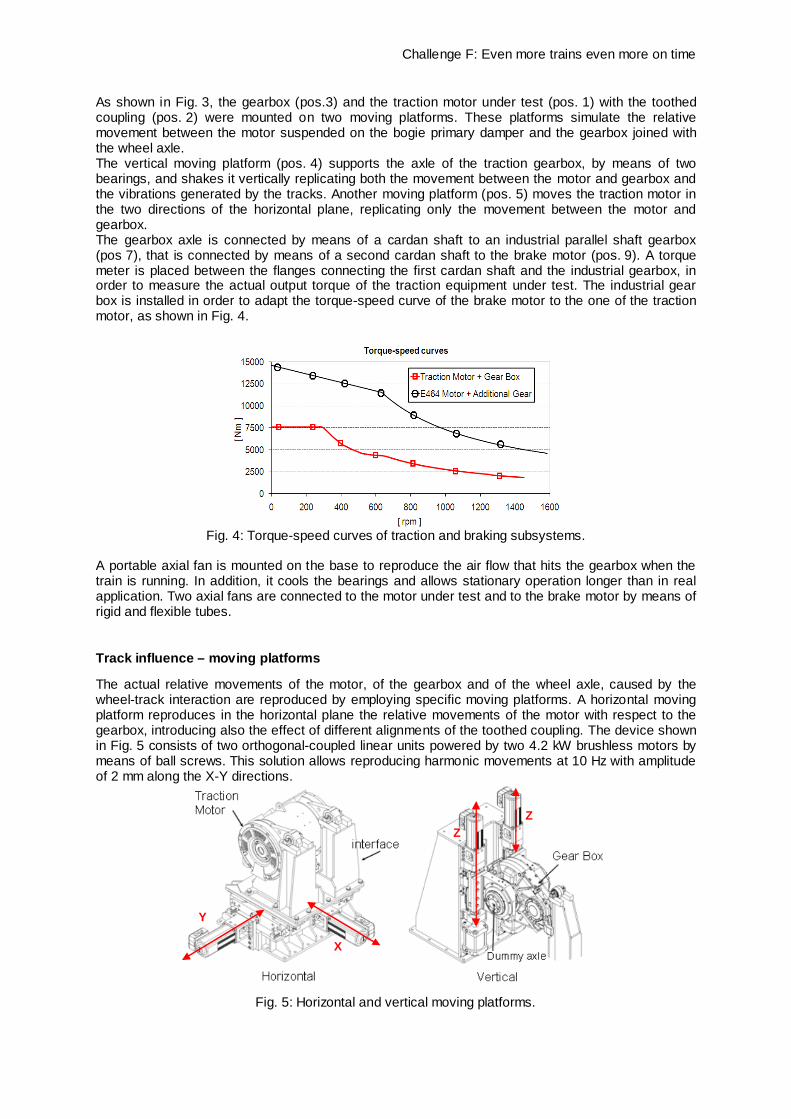
The actual relative movements of the motor, of the gearbox and of the wheel axle, caused by the wheel-track interaction are reproduced by employing specific moving platforms. A horizontal moving platform reproduces in the horizontal plane the relative movements of the motor with respect to the gearbox, introducing also the effect of different alignments of the toothed coupling. The device shown in Fig. 5 consists of two orthogonal-coupled linear units powered by two 4.2 kW brushless motors by means of ball screws. This solution allows reproducing harmonic movements at 10 Hz with amplitude of 2 mm along the X-Y directions.
Fig. 5: Horizontal and vertical moving platforms.
X
Y
Z Z
Challenge F: Even more trains even more on time
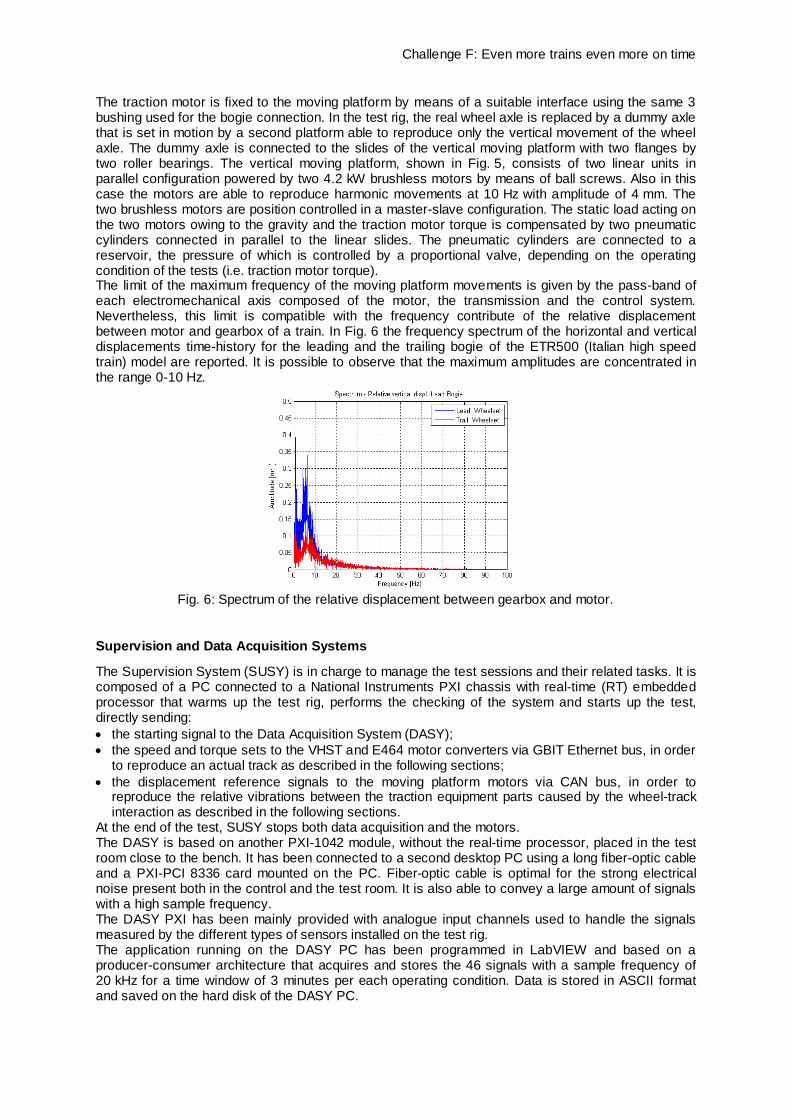
The traction motor is fixed to the moving platform by means of a suitable interface using the same 3 bushing used for the bogie connection. In the test rig, the real wheel axle is replaced by a dummy axle that is set in motion by a second platform able to reproduce only the vertical movement of the wheel axle. The dummy axle is connected to the slides of the vertical moving platform with two flanges by two roller bearings. The vertical moving platform, shown in Fig. 5, consists of two linear units in parallel configuration powered by two 4.2 kW brushless motors by means of ball screws. Also in this case the motors are able to reproduce harmonic movements at 10 Hz with amplitude of 4 mm. The two brushless motors are position controlled in a master-slave configuration. The static load acting on the two motors owing to the gravity and the traction motor torque is compensated by two pneumatic cylinders connected in parallel to the linear slides. The pneumatic cylinders are connected to a reservoir, the pressure of which is controlled by a proportional valve, depending on the operating condition of the tests (i.e. traction motor torque). The limit of the maximum frequency of the moving platform movements is given by the pass-band of each electromechanical axis composed of the motor, the transmission and the control system. Nevertheless, this limit is compatible with the frequency contribute of the relative displacement between motor and gearbox of a train. In Fig. 6 the frequency spectrum of the horizontal and vertical displacements time-history for the leading and the trailing bogie of the ETR500 (Italian high speed train) model are reported. It is possible to observe that the maximum amplitudes are concentrated in the range 0-10 Hz.
Fig. 6: Spectrum of the relative displacement between gearbox and motor.
Supervision and Data Acquisition Systems
The Supervision System (SUSY) is in charge to manage the test sessions and their related tasks. It is composed of a PC connected to a National Instruments PXI chassis with real-time (RT) embedded processor that warms up the test rig, performs the checking of the system and starts up the test, directly sending: the starting signal to the Data Acquisition System (DASY); the speed and torque sets to the VHST and E464 motor converters via GBIT Ethernet bus, in order
to reproduce an actual track as described in the following sections; the displacement reference signals to the moving platform motors via CAN bus, in order to
reproduce the relative vibrations between the traction equipment parts caused by the wheel-track interaction as described in the following sections.
At the end of the test, SUSY stops both data acquisition and the motors. The DASY is based on another PXI-1042 module, without the real-time processor, placed in the test room close to the bench. It has been connected to a second desktop PC using a long fiber-optic cable and a PXI-PCI 8336 card mounted on the PC. Fiber-optic cable is optimal for the strong electrical noise present both in the control and the test room. It is also able to convey a large amount of signals with a high sample frequency. The DASY PXI has been mainly provided with analogue input channels used to handle the signals measured by the different types of sensors installed on the test rig. The application running on the DASY PC has been programmed in LabVIEW and based on a producer-consumer architecture that acquires and stores the 46 signals with a sample frequency of 20 kHz for a time window of 3 minutes per each operating condition. Data is stored in ASCII format and saved on the hard disk of the DASY PC.
Challenge F: Even more trains even more on time
Sensor installation
The measurement set-up on the gearbox includes, with reference directions in Fig. 1: 4 dual accelerometers, measuring accelerations along X axis and temperature at each shaft end; 3 triaxial accelerometers, 2 placed in the proximity of the fast shaft end and one on the wheel shaft; 7 single-axis accelerometers: 4 measuring vertical accelerations at each shaft end, 3 measuring
accelerations along Y axis on the thrust bearing of the fast shaft and on both sides of the wheel shaft.
The placement of single axis accelerometers and dual sensors has been studied to provide one temperature and two orthogonal acceleration measurements for each bearing. The choices for the measurement setup of the motor are the following: 5 single axis accelerometers measuring X and Y acceleration on the flanges of both the bearings
an Y acceleration only on the ball bearing; 4 miniaturized single-axis accelerometers, placed in proximity of the bearings, in the inner part of
the flange; 1 triaxial accelerometer, placed on top of the motor case; 2 thermistors, one per each bearing. A separated tachometer has been mounted on the test rig, close to the torque-meter. This sensor gives one impulse per revolution of the wheel shaft. Finally two microphones and two temperature-humidity sensors have been placed close to the traction system.
Damaged bearings
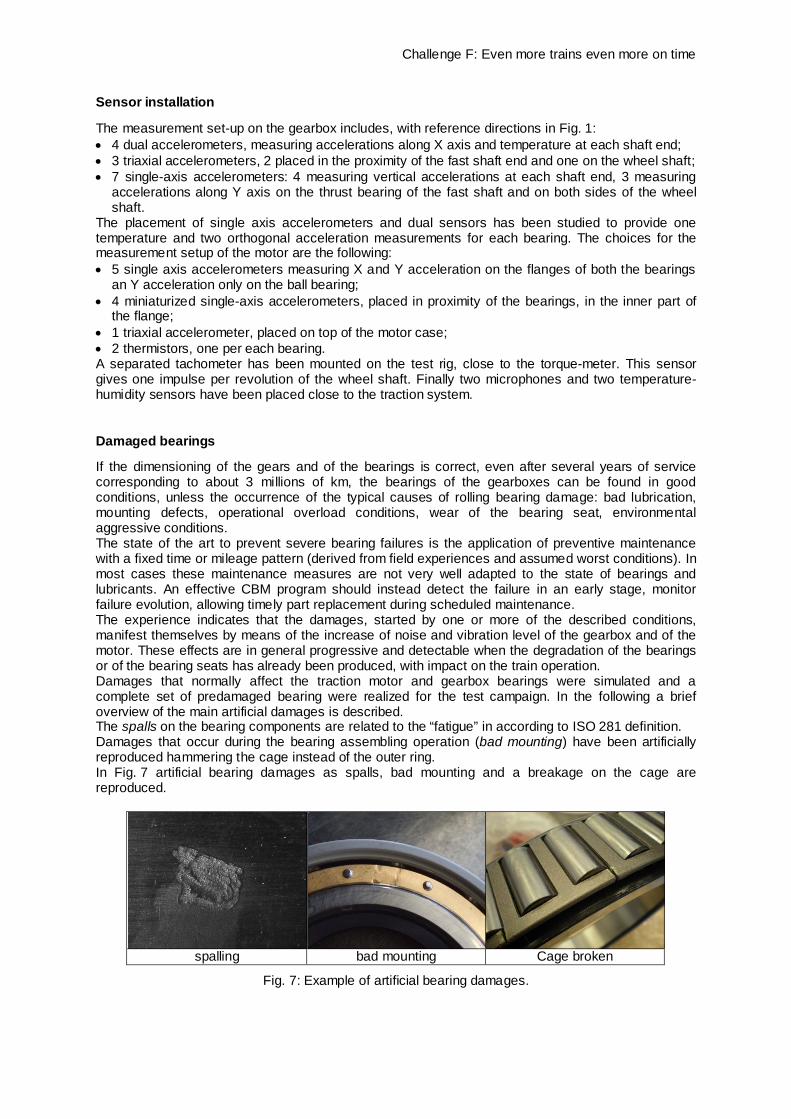
If the dimensioning of the gears and of the bearings is correct, even after several years of service corresponding to about 3 millions of km, the bearings of the gearboxes can be found in good conditions, unless the occurrence of the typical causes of rolling bearing damage: bad lubrication, mounting defects, operational overload conditions, wear of the bearing seat, environmental aggressive conditions. The state of the art to prevent severe bearing failures is the application of preventive maintenance with a fixed time or mileage pattern (derived from field experiences and assumed worst conditions). In most cases these maintenance measures are not very well adapted to the state of bearings and lubricants. An effective CBM program should instead detect the failure in an early stage, monitor failure evolution, allowing timely part replacement during scheduled maintenance. The experience indicates that the damages, started by one or more of the described conditions, manifest themselves by means of the increase of noise and vibration level of the gearbox and of the motor. These effects are in general progressive and detectable when the degradation of the bearings or of the bearing seats has already been produced, with impact on the train operation. Damages that normally affect the traction motor and gearbox bearings were simulated and a complete set of predamaged bearing were realized for the test campaign. In the following a brief overview of the main artificial damages is described. The spalls on the bearing components are related to the “fatigue” in according to ISO 281 definition. Damages that occur during the bearing assembling operation (bad mounting) have been artificially reproduced hammering the cage instead of the outer ring. In Fig. 7 artificial bearing damages as spalls, bad mounting and a breakage on the cage are reproduced.
spalling bad mounting Cage broken
Fig. 7: Example of artificial bearing damages.
Challenge F: Even more trains even more on time
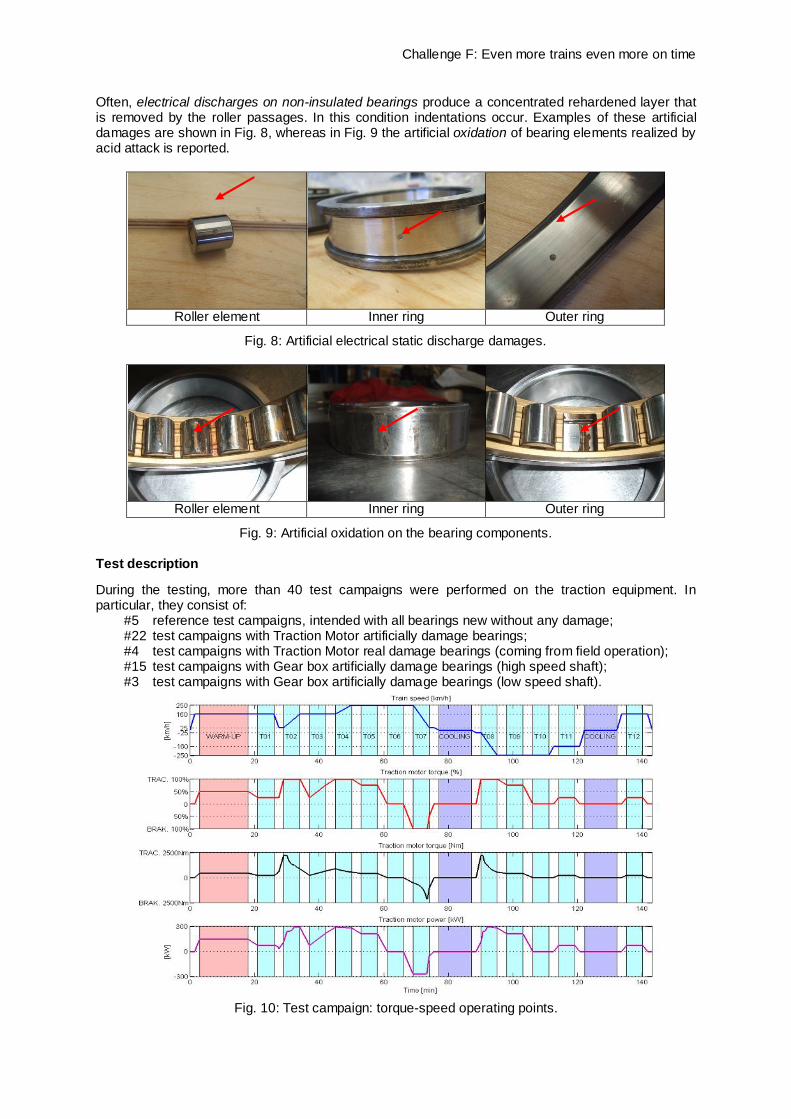
Often, electrical discharges on non-insulated bearings produce a concentrated rehardened layer that is removed by the roller passages. In this condition indentations occur. Examples of these artificial damages are shown in Fig. 8, whereas in Fig. 9 the artificial oxidation of bearing elements realized by acid attack is reported.
Roller element Inner ring Outer ring
Fig. 8: Artificial electrical static discharge damages.
Roller element Inner ring Outer ring
Fig. 9: Artificial oxidation on the bearing components.
Test description
During the testing, more than 40 test campaigns were performed on the traction equipment. In particular, they consist of:
#5 reference test campaigns, intended with all bearings new without any damage; #22 test campaigns with Traction Motor artificially damage bearings; #4 test campaigns with Traction Motor real damage bearings (coming from field operation); #15 test campaigns with Gear box artificially damage bearings (high speed shaft); #3 test campaigns with Gear box artificially damage bearings (low speed shaft).
Fig. 10: Test campaign: torque-speed operating points.

Challenge F: Even more trains even more on time
The same test campaign of an overall duration of 140 minutes has been performed for each damaged bearing mounted on the test rig. The schedule of a campaign consists of a warm-up of 15 minutes (at 160 km/h with 50% of motor torque), followed by a series of 12 tests at different operating points as shown in Fig. 10. Between test 7 and 8 and between test 11 and 12, when the rotation direction is inverted, 2 cooling pauses of 10 minutes have been inserted. The different operating points have been chosen to provide examples of different conditions the train undergoes during normal operation (i.e. acceleration, braking, and cruise). The vibration profiles executed by the platforms depend on the train speed the test rig is simulating.
Analysis techniques
In order to analyze all the information coming from the acquisitions, a widespread variety of techniques could be used, starting from the simpler ones (statistical parameters, Fourier analysis, averaging, etc.), commonly used in not so critical environments and requiring constant speed operation, up to more sophisticated ones (cyclostationarity, EMD-HHT, Spectral Kurtosis, etc.). Some of them are also suitable to be used in speed transient conditions. Among these various analysis techniques proposed in literature, after a benchmark executed on the first campaigns, it has been pointed out how the most suitable ones for this particular application are Envelope Analysis and Spectral Kurtosis, whose theoretical approach is presented in [15] and [16], respectively. Both the techniques result in a spectrum-like indicator with, on the horizontal axis a range of frequencies, and on the vertical axis a technique-specific amplitude. A damage, localized on a specific bearing component (i.e., inner ring, roller) is evidenced by the appearance of peaks in the spectrum-like indicator at frequencies close to the nominal defect frequencies of the bearing. For each bearing is possible, knowing its geometrical dimensions to calculate the characteristic frequencies given a specific shaft rotating speeds and then check for correspondences in the indicator. Table 2 specifies the characteristic defect frequencies of the different bearings for the 4 locations of damage, namely Inner and Outer Ring, Rollers and Cage, calculated for a train speed of 160 km/h.
Frequencies in Hertz for a Train
Speed of 160 km/h
Fundamental Train Frequency
Cage/Roller
Ball Spin Frequency Cage/Roller
Ball Pass Frequency Outer
Outer Ring
Ball Pass Frequency Inner
Inner Ring BM1 (Ball) 22.4 169.52 380.87 517.71 BM2 (Cylindr.) 21.91 150.08 241.02 340.41 BG1 (Ball) 21.93 150.63 350.82 494.9 BG2 (Cylindr.) 22.6 178.53 406.77 544.66 BG3 (Tapered) 7.63 120.09 297.43 333.13
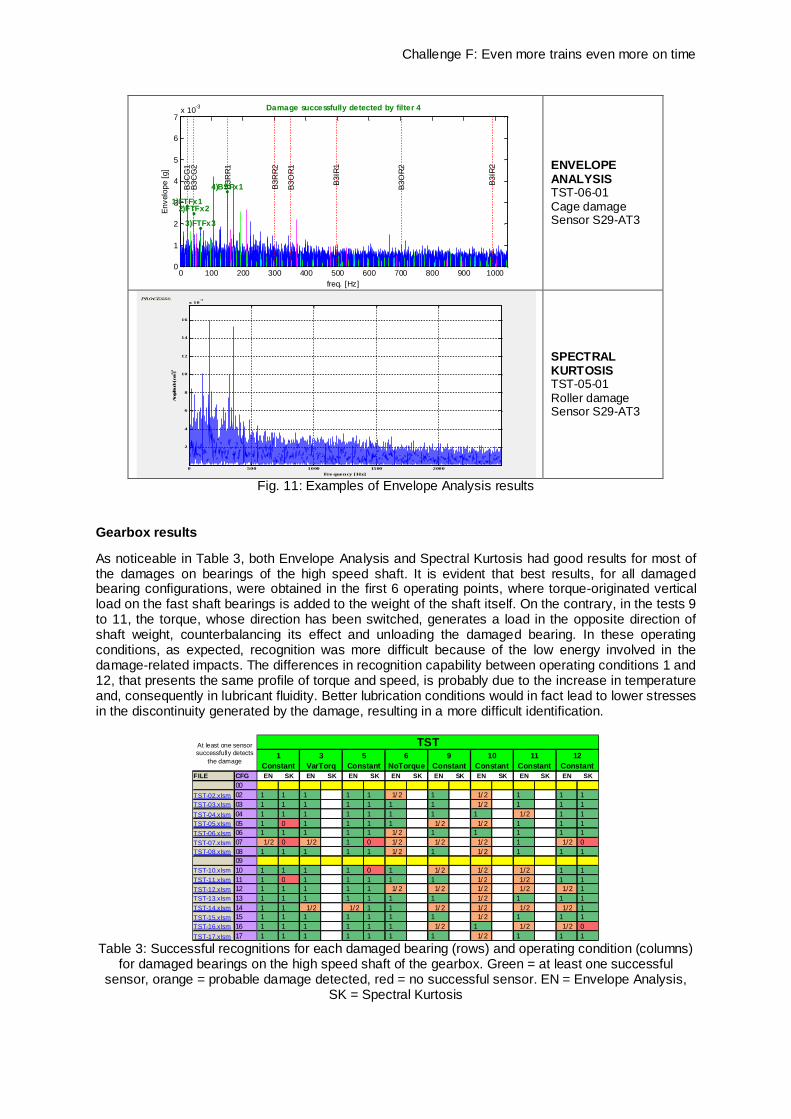
Table 2: Defect frequencies of the different bearings at a train speed of 160 km/h. A typical spectrum of two types of damages is presented in Fig. 11, with results for Envelope Analysis and results of Spectral Kurtosis, taken as examples, from test campaigns with damaged BG1 (ball bearing on gearbox).
Challenge F: Even more trains even more on time
0 100 200 300 400 500 600 700 800 900 10000
1
2
3
4
5
6
7x 10⁻³
freq. [Hz]
Enve
lope
[g]
Damage successfully detected by filter 4
B3IR
1
B3IR
2
B3O
R1
B3O
R2
B3C
G1
B3
CG
2
B3R
R1
B3R
R2
1)FTFx12)FTFx2
3)FTFx3
4)BSFx1
ENVELOPE ANALYSIS TST-06-01 Cage damage Sensor S29-AT3
0 500 1000 1500 2000
2
4
6
8
10
12
14
16
x 10-3
Fre quency [Hz]
Am
plitu
de [m
/s2 ]2
SPECTRAL KURTOSIS TST-05-01 Roller damage Sensor S29-AT3
Fig. 11: Examples of Envelope Analysis results
Gearbox results
As noticeable in Table 3, both Envelope Analysis and Spectral Kurtosis had good results for most of the damages on bearings of the high speed shaft. It is evident that best results, for all damaged bearing configurations, were obtained in the first 6 operating points, where torque-originated vertical load on the fast shaft bearings is added to the weight of the shaft itself. On the contrary, in the tests 9 to 11, the torque, whose direction has been switched, generates a load in the opposite direction of shaft weight, counterbalancing its effect and unloading the damaged bearing. In these operating conditions, as expected, recognition was more difficult because of the low energy involved in the damage-related impacts. The differences in recognition capability between operating conditions 1 and 12, that presents the same profile of torque and speed, is probably due to the increase in temperature and, consequently in lubricant fluidity. Better lubrication conditions would in fact lead to lower stresses in the discontinuity generated by the damage, resulting in a more difficult identification.
FILE CFG EN SK EN SK EN SK EN SK EN SK EN SK EN SK EN SK00
TST-02.xlsm 02 1 1 1 1 1 1/2 1 1/2 1 1 1TST-03.xlsm 03 1 1 1 1 1 1 1 1/2 1 1 1TST-04.xlsm 04 1 1 1 1 1 1 1 1 1/2 1 1TST-05.xlsm 05 1 0 1 1 1 1 1/2 1/2 1 1 1TST-06.xlsm 06 1 1 1 1 1 1/2 1 1 1 1 1TST-07.xlsm 07 1/2 0 1/2 1 0 1/2 1/2 1/2 1 1/2 0TST-08.xlsm 08 1 1 1 1 1 1/2 1 1/2 1 1 1
09TST-10.xlsm 10 1 1 1 1 0 1 1/2 1/2 1/2 1 1TST-11.xlsm 11 1 0 1 1 1 1 1 1/2 1/2 1 1TST-12.xlsm 12 1 1 1 1 1 1/2 1/2 1/2 1/2 1/2 1TST-13.xlsm 13 1 1 1 1 1 1 1 1/2 1 1 1TST-14.xlsm 14 1 1 1/2 1/2 1 1 1/2 1/2 1/2 1/2 1TST-15.xlsm 15 1 1 1 1 1 1 1 1/2 1 1 1TST-16.xlsm 16 1 1 1 1 1 1 1/2 1 1/2 1/2 0TST-17.xlsm 17 1 1 1 1 1 1 1 1/2 1 1 1
9Constant
10Constant
11Constant
12Constant
At least one sensor successfully detects
the damage
TST1
Constant3
VarTorq5
Constant6
NoTorque
Table 3: Successful recognitions for each damaged bearing (rows) and operating condition (columns)
for damaged bearings on the high speed shaft of the gearbox. Green = at least one successful sensor, orange = probable damage detected, red = no successful sensor. EN = Envelope Analysis,
SK = Spectral Kurtosis
Challenge F: Even more trains even more on time
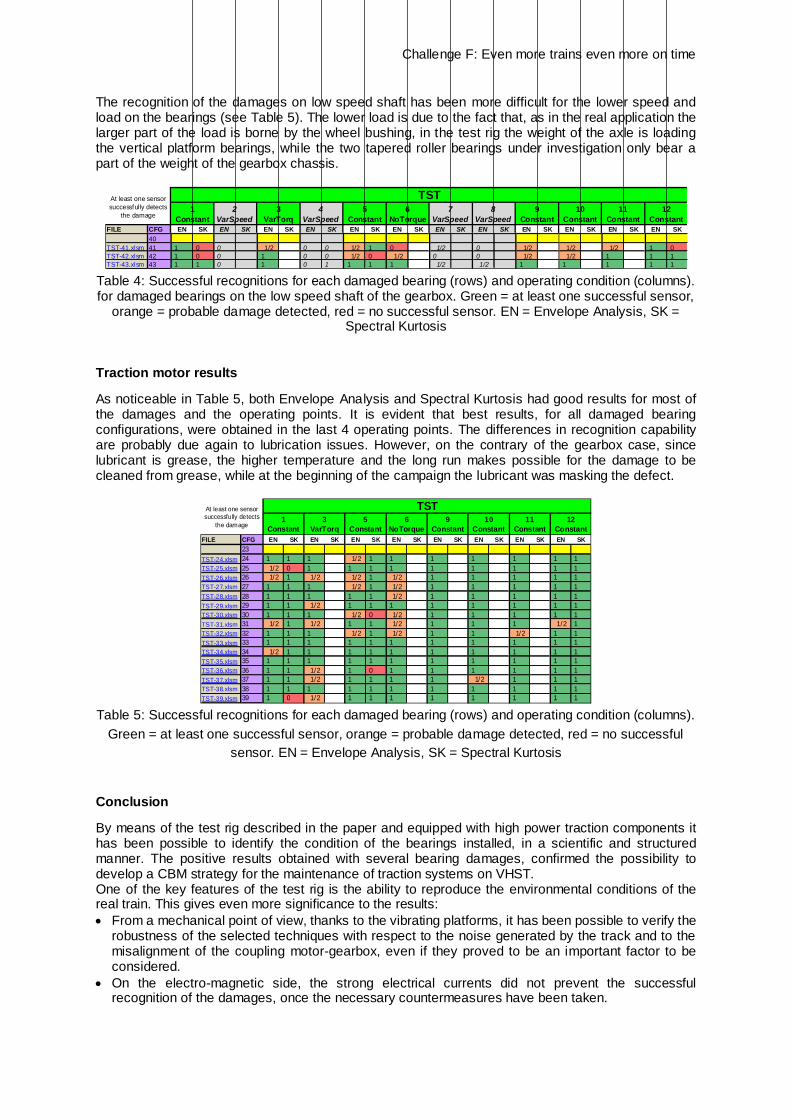
The recognition of the damages on low speed shaft has been more difficult for the lower speed and load on the bearings (see Table 5). The lower load is due to the fact that, as in the real application the larger part of the load is borne by the wheel bushing, in the test rig the weight of the axle is loading the vertical platform bearings, while the two tapered roller bearings under investigation only bear a part of the weight of the gearbox chassis.
FILE CFG EN SK EN SK EN SK EN SK EN SK EN SK EN SK EN SK EN SK EN SK EN SK EN SK
9Constant
10Constant
11Constant
12Constant
At least one sensor successfully detects
the damage5
Constant6
NoTorque7
VarSpeed8
VarSpeed1
Constant2
VarSpeed3
VarTorq4
VarSpeed
TST
TST-39.xlsm 39 1 0 1/2 0 1 1 0 0 1 1 1 140
TST-41.xlsm 41 1 0 0 1/2 0 0 1/2 1 0 1/2 0 1/2 1/2 1/2 1 0TST-42.xlsm 42 1 0 0 1 0 0 1/2 0 1/2 0 0 1/2 1/2 1 1 1TST-43.xlsm 43 1 1 0 1 0 1 1 1 1 1/2 1/2 1 1 1 1 1
Table 4: Successful recognitions for each damaged bearing (rows) and operating condition (columns). for damaged bearings on the low speed shaft of the gearbox. Green = at least one successful sensor,
orange = probable damage detected, red = no successful sensor. EN = Envelope Analysis, SK = Spectral Kurtosis
Traction motor results
As noticeable in Table 5, both Envelope Analysis and Spectral Kurtosis had good results for most of the damages and the operating points. It is evident that best results, for all damaged bearing configurations, were obtained in the last 4 operating points. The differences in recognition capability are probably due again to lubrication issues. However, on the contrary of the gearbox case, since lubricant is grease, the higher temperature and the long run makes possible for the damage to be cleaned from grease, while at the beginning of the campaign the lubricant was masking the defect.
FILE CFG EN SK EN SK EN SK EN SK EN SK EN SK EN SK EN SK23
TST-24.xlsm 24 1 1 1 1/2 1 1 1 1 1 1 1TST-25.xlsm 25 1/2 0 1 1 1 1 1 1 1 1 1TST-26.xlsm 26 1/2 1 1/2 1/2 1 1/2 1 1 1 1 1TST-27.xlsm 27 1 1 1 1/2 1 1/2 1 1 1 1 1TST-28.xlsm 28 1 1 1 1 1 1/2 1 1 1 1 1TST-29.xlsm 29 1 1 1/2 1 1 1 1 1 1 1 1TST-30.xlsm 30 1 1 1 1/2 0 1/2 1 1 1 1 1TST-31.xlsm 31 1/2 1 1/2 1 1 1/2 1 1 1 1/2 1TST-32.xlsm 32 1 1 1 1/2 1 1/2 1 1 1/2 1 1TST-33.xlsm 33 1 1 1 1 1 1 1 1 1 1 1TST-34.xlsm 34 1/2 1 1 1 1 1 1 1 1 1 1TST-35.xlsm 35 1 1 1 1 1 1 1 1 1 1 1TST-36.xlsm 36 1 1 1/2 1 0 1 1 1 1 1 1TST-37.xlsm 37 1 1 1/2 1 1 1 1 1/2 1 1 1TST-38.xlsm 38 1 1 1 1 1 1 1 1 1 1 1TST-39.xlsm 39 1 0 1/2 1 1 1 1 1 1 1 1
9Constant
10Constant
11Constant
12Constant
At least one sensor successfully detects
the damage
TST1
Constant3
VarTorq5
Constant6
NoTorque
Table 5: Successful recognitions for each damaged bearing (rows) and operating condition (columns).
Green = at least one successful sensor, orange = probable damage detected, red = no successful sensor. EN = Envelope Analysis, SK = Spectral Kurtosis
Conclusion
By means of the test rig described in the paper and equipped with high power traction components it has been possible to identify the condition of the bearings installed, in a scientific and structured manner. The positive results obtained with several bearing damages, confirmed the possibility to develop a CBM strategy for the maintenance of traction systems on VHST. One of the key features of the test rig is the ability to reproduce the environmental conditions of the real train. This gives even more significance to the results: From a mechanical point of view, thanks to the vibrating platforms, it has been possible to verify the
robustness of the selected techniques with respect to the noise generated by the track and to the misalignment of the coupling motor-gearbox, even if they proved to be an important factor to be considered.
On the electro-magnetic side, the strong electrical currents did not prevent the successful recognition of the damages, once the necessary countermeasures have been taken.

Challenge F: Even more trains even more on time
Moreover, the correct recognition of unknown damages on real field bearings, worn during on train operation and mounted on the test rig before being disassembled and inspected, confirmed the potential of such approach.
The research activity provided several insights on the features that a CBM algorithm should have for this specific application. Envelope Analysis, implemented on two different hardware and software systems, and Spectral Kurtosis have been chosen as the most effective and robust techniques, both at constant speed and in slow transients, such as the ones characterizing rail application.
References
[1] Ferreira, J.L.A., Balthazar, J.C. and Araujo, A.P.N., An investigation of rail bearing reliability under real conditions of use, Engineering Failure Analysis, Vol. 10, No. 6 (2003), pp. 745-758.
[2] Randall, R.B., Antoni, J. and Chobsaard, S., The relationship between spectral correlation and envelope analysis in the diagnostics of bearing faults and other cyclostationary machine signals, Mechanical Systems and Signal Processing, Vol. 15, No. 5 (2001), pp. 945-962.
[3] Harvey, T.J., Wood, R.J.K. and Powrie, H.E.G., Electrostatic wear monitoring of rolling element bearings, Wear, Vol. 263, No. 7-12 (2007), pp. 1492-1501.
[4] Manoj, V., Manohar Shenoy, K. and Gopinath, K., Developmental studies on rolling contact fatigue test rig, Wear, Vol. 264, No. 7-8 (2008), pp. 708-718.
[5] Choy, F.K., Zhou, J., Braun, M.J. and Wang, L., Vibration monitoring and damage quantification of faulty ball bearings, Journal of Tribology, Vol. 127, No. 4 (2005), pp. 776-783.
[6] Hao, R. and Chu F., Morphological undecimated wavelet decomposition for fault diagnostics of rolling element bearings, Journal of Sound and Vibration, Vol. 320, No. 4-5 (2009), pp. 1164-1177
[7] Wang, W.Q., Ismail, F. and Golnaraghi, M.F., Assessment of gear damage monitoring techniques using vibration measurements, Mechanical Systems and Signal Processing, Vol. 15, No. 5 (2001), pp. 905-922.
[8] Oztürk, H., Sabuncu, M. and Yesilyurt, I., Early detection of pitting damage in gears using mean frequency of scalogram, Journal of Vibration and Control, Vol. 14, No. 4 (2008), pp. 469-484.
[9] Wang, W., Early detection of gear tooth cracking using the resonance demodulation technique, Mechanical Systems and Signal Processing, Vol. 15, No. 5 (2001), pp. 887-903.
[10] Sawalhi, N. and Randall, R.B., Simulating gear and bearing interactions in the presence of faults: Part I. The combined gear bearing dynamic model and the simulation of localised bearing faults, Mechanical Systems and Signal Processing, Vol. 22, No. 8 (2008), pp. 1924-1951.
[11] P. Pennacchi, S. Bruni, S. Chatterton, R. Ricci, P. Borghesani, F. Gherardi, D. Marinis, A. Didonato, F. Unger-Weber, Diagnostics of Roller Bearings for the Traction System of Very High-Speed Trains, Proceedings of 2th Workshop Tribologia e Industria, 18-19 maggio 2010, Bari, Italy, pp. 1-12.
[12] P. Pennacchi, S. Bruni, S. Chatterton, R. Ricci, P. Borghesani, F. Gherardi, D. Marinis, A. Didonato, F. Unger-Weber, Design of A Test rig for Traction Equipment of Very High Speed Trains, Proceedings of the 8th IFToMM International Conference on Rotordynamics September 12-15, 2010, KIST, Seoul, Korea.
[13] P. Firpo. Solutions for CBM application on Electrical Railway Propulsion Systems, International Conference on Electrical Systems for Aircraft, Railway and Ship Propulsion, October 19-21, 2010, Bologna, Italy.
[14] M. Elia, V. Soprano, G. Diana, New Condition-Based Monitoring Techniques for High Speed Railway Vehicle, 7th World Congress on High Speed Rail, 7-9 December 2010, Beijing, China.
[15] Hochmann, D. and Bechhoefer, E., Envelope Bearing Analysis: Theory and Practice, Aerospace Conference IEEE, 2005, pp 3658-3660
[16] Antoni, J., The spectral kurtosis of nonstationary signals: formalisation, some properties, and application, 12th European Signal Processing Conference, 2004.