A Practical Guide to Evaluating Teacher Effectiveness - ERIC - U.S

A Template for Evaluating Early College High Schools and Demonstrating Their Value to the Community
Point of Proof
Joseph A. Rochford, Ph.D. Stark Education Partnership, Inc.
October 2011

Point of Proof – 2
Funding for the Development of this document has been provided by the Martha Holden Jennings Foundation
© 2011
The Stark Education Partnership, Inc.400 Market Avenue North, Suite BCanton, Ohio 44702
(330) 452-0829www.edpartner.org

Point of Proof – 3
Early College High Schools are unique, almost counter intuitive, creations. By design, they are to enable low income, minority, and even low performing students to earn a high school diploma and up to two years of college or an Associate Degree simultaneously.
In order for this to happen youth, often as young as 14 or 15 years of age, must begin to tackle and succeed at demanding college coursework.
How well they do this can be measured and counted. We have been able to do this in K-12 and higher education in numerous ways for years using performance or management based information systems. One such example is the Performance Based Student Management System developed by Sysinterface for the Dayton Early College Academy (DECA).1
This report maintains that there are much broader issues centered on how well we evaluate ECHSs that may be critical to the future sustainability of such schools. Evaluation must become more than mere numbers; it must become a point of proof. Such proof will increasingly become necessary given the real and perceived expense of ECHSs in a climate where education budgets become constrained.
Do we have such proof today?
On a global scale, ECHS evaluation has taken place in two specific contexts, neither one of which may be immediately useful in local situations. The first context is the evaluation of the overall initiative for the Bill and Melinda Gates Foundation by the American Institutes for Research (AIR) and SRI International. This series of six reports2 contains a wealth of knowledge on
the implementation and growth of the initiative but no data that can be attributed to individual schools or communities.
The second context is the emergence of quasi-experimental studies that seek to establish the impact of ECHS. AIR is in the process of conducting an impact study on high school graduation and college enrollment3 and early results from ECHSs in North Carolina have been incorporated into a report4 by the SERVECenter. Results, while encouraging, are limited to that state and to academic achievements by students on conventional high school coursework.
The absence of compelling and locally adaptable proof poses problems. As a 2010 report by the Early College High Schools Funding Project noted:
Ohio’s nine Early College High Schools are supported through a broad spectrum of locally developed funding models reliant on a mix of state aid, private support, district tuition via per pupil funding, and higher education funding.5
1 See: Sysinterface Performance Based Student Management System at: http://sysinterface.us/SysInterface_QADEV/CaseStudy.aspx?ID=iN5b9W7gZrs=
2 See: AIR/SRI Evaluations of the Early College High School Initiative, available at: http://www.earlycolleges.org/publications.html#evaluations
3 See: Evaluation of the Early College High School Initiative: Impact Study Overview (2011) at: http://www.earlycolleges.org/publications.html#evaluations
4 (n.d.) A Better 9th Grade: Early Results from an Experimental Study of the Early College High School Model. Greensboro: SERVE Center.
5 Early College High Schools Funding Project Description and Status Report, January 27, 2010.
Introduction: Why a Template?
Point of Proof – 4
In Ohio, start up funds from the Bill and Melinda Gates Foundation have now been expended. State budgetary funding for ECHSs was discontinued under the Strickland administration (FY 09). While some funding continues under the state’s Race to the Top application, this will expire at the conclusion of the grant period. The mix has changed.
Baring future state aid, districts will increasingly need to find ways to achieve sustainable funding for ECHSs. That will likely come about through changes in school structure, policy, negotiations with higher education partners, and community support.
This is, “why a template”. Unlike the AIR and SRI International evaluations, this document is not concerned with project implementation. Ohio’s original ECHSs have matured and though implementation issues undoubtedly still arise, the real “gold-standard” now is student success and, in
a broader sense, the impact the school is having in the community.
Also, the template is not about data gathering, though it will be featured. A fully functional Student Information System (SIS)6 as envisioned by the founders of the early college movement, some will argue, will do this. Rather, the template ultimately is about analysis. In some ways this document and template parallels the concepts furthered by the Strategic Data Project at Harvard that recognizes, “…school districts today are gathering more information about students, teachers and schools than ever before...but how often is that data accessed and analyzed in order to support breakthrough decisions? How often does data inform fundamental policy shifts, strategic management decisions or curriculum changes? Unfortunately, not often enough.”7
6 See: Early College High School Initiative Student Information System at: https://echs-sis.org/PublicPages/Home.aspx
7 See: Center for Education Policy Research at Harvard University, Strategic Data Project at: http://www.gse.harvard.edu/~pfpie/index.php/sdp/strategic-data-project-the-vision

Point of Proof – 5
With start-up funding from the Bill and Melinda Gates Foundation and support from the Ohio Department of Education and the Ohio Board of Regents, the KnowledgeWorks Foundation launched an initiative in 2003 that eventually resulted in the creation of nine early college high schools. These are:
• Akron Early College High School • Canton Early College High School • Columbus Africentric Early College• Dayton Early College Academy• Design Lab Early College High School • Lorain County Early College High School • Metro Early College High School (Columbus)• Toledo Early College High School• Youngstown Early College
Ohio’s Early College High Schools
During the 2012-13 academic year, six additional early college high schools will be created using funds from Ohio’s successful Race to the Top grant proposal. These will be in: Crooksville Exempted, Fairport Harbor, Hicksville Exempted, Licking Heights Local, Maysville Exempted Village, and Reynoldsburg City Schools.
While this report and template is targeted for the original nine ECHSs that are located in Ohio’s “Big Eight” urban districts, it is hoped that it may also eventually be useful for the next generation as well.
Point of Proof – 6
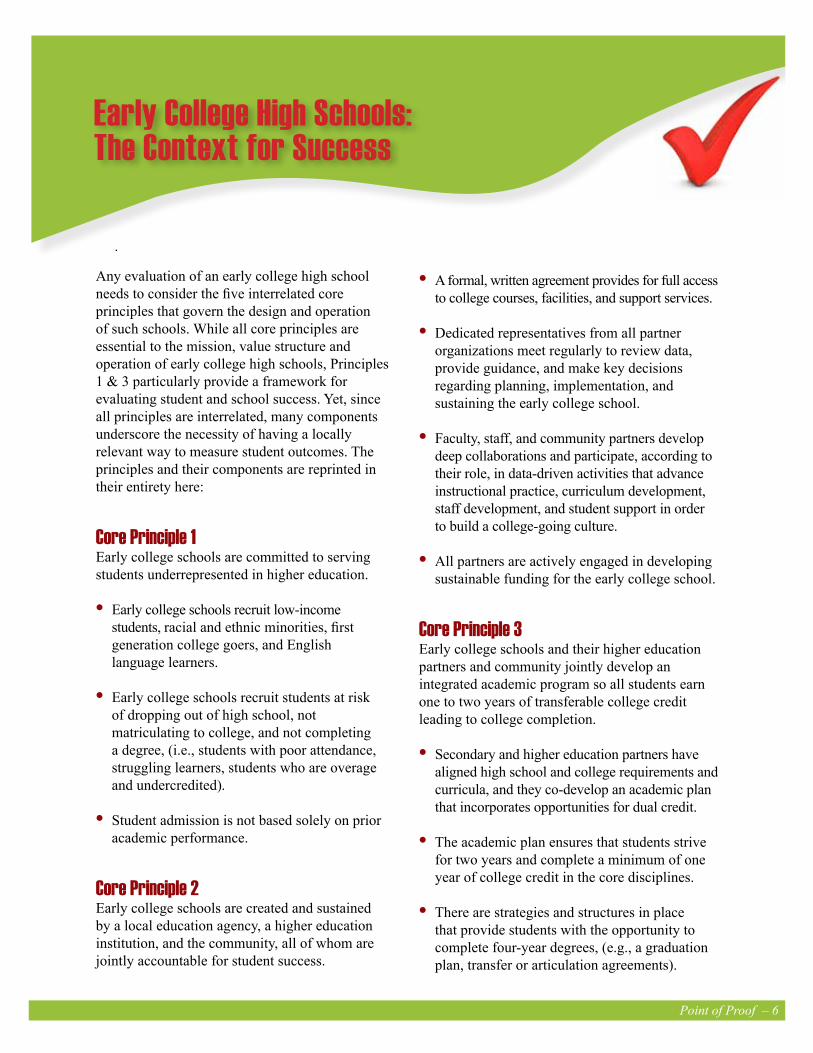
Early College High Schools: The Context for Success
Any evaluation of an early college high school needs to consider the five interrelated core principles that govern the design and operation of such schools. While all core principles are essential to the mission, value structure and operation of early college high schools, Principles 1 & 3 particularly provide a framework for evaluating student and school success. Yet, since all principles are interrelated, many components underscore the necessity of having a locally relevant way to measure student outcomes. The principles and their components are reprinted in their entirety here:
Core Principle 1 Early college schools are committed to serving students underrepresented in higher education.
• Early college schools recruit low-income students, racial and ethnic minorities, first generation college goers, and English language learners.
• Early college schools recruit students at risk of dropping out of high school, not matriculating to college, and not completing a degree, (i.e., students with poor attendance, struggling learners, students who are overage and undercredited).
• Student admission is not based solely on prior academic performance.
Core Principle 2Early college schools are created and sustained by a local education agency, a higher education institution, and the community, all of whom are jointly accountable for student success.
• A formal, written agreement provides for full access to college courses, facilities, and support services.
• Dedicated representatives from all partner organizations meet regularly to review data, provide guidance, and make key decisions regarding planning, implementation, and sustaining the early college school.
• Faculty, staff, and community partners develop deep collaborations and participate, according to their role, in data-driven activities that advance instructional practice, curriculum development, staff development, and student support in order to build a college-going culture.
• All partners are actively engaged in developing sustainable funding for the early college school.
Core Principle 3Early college schools and their higher education partners and community jointly develop an integrated academic program so all students earn one to two years of transferable college credit leading to college completion. • Secondary and higher education partners have
aligned high school and college requirements and curricula, and they co-develop an academic plan that incorporates opportunities for dual credit.
• The academic plan ensures that students strive for two years and complete a minimum of one year of college credit in the core disciplines.
• There are strategies and structures in place that provide students with the opportunity to complete four-year degrees, (e.g., a graduation plan, transfer or articulation agreements).

Point of Proof – 7
Core Principle 4Early college schools engage all students in a comprehensive support system that develops academic and social skills as well as the behaviors and conditions necessary for college completion. • Early college schools develop and implement
a proactive support plan that includes multiple academic and social supports to ensure students’ progression through college, articulates how and where services are delivered, and clearly describes the roles and responsibilities of staff and partners in their implementation.
• Early college schools address barriers to students’ learning and academic achievement inside and outside of school.
Core Principle 5Early college schools and their higher education and community partners work with intermediaries to create conditions and advocate for supportive policies that advance the early college movement.
• Early college schools collect and share data with initiative partners to help demonstrate effectiveness at the local, state, and national levels.
• Early college schools work with their intermediaries to develop communications plans that further the objectives of the movement.
• Early college schools and their intermediaries work collectively to influence state and national policy, including legislation, regulations, and the allocation of funds.
• Early colleges, with their partners, are involved in preparing teachers and leaders to effectively meet the unique mission of the early college movement.8
8 Early College High School Initiative (2008). Core Principles. Available at: http://www.earlycolleges.org/publications.html#coredocumentsfromtheearlycollegehighschoolinitiative

Point of Proof – 8
Measurement Comparison Additional Information and Analysis
8th Grade GPACompared to district averages
An Excel spreadsheet is one of the easiest ways to establish a profile for each student with the ability to sort results.
EXPLORE TestCompared to district; national averages
Both composite and sub-test scores
COMPASS TestCan be compared to partner college averages
If required by IHE partner, this test can also be used to establish a performance baseline for students. Re-tests can be used to measure progress over time.
8th Grade Ohio Achievement Assessments (OAA)
Compared to district averages; state averages
Reading, math and science
8th grade attendanceCompared to district averages; state averages
Attendance is highly correlated with academic performance.
Demographics – sex, SES, race, disability
Compared to district averages
Also, key Identifiers necessary for later disaggregation of results
Language Native language
Date of birth
First generation college-going
First in family to go to college
Measurement Scale One: Who Attends Early College High School?
Gathering the DataDemographic and OAA data parallels information collected by the Education Management Information System (EMIS). EXPLORE and COMPASS Test scores are not in EMIS and need to be collected from ACT reports and partner colleges (if COMPASS is not administered at high school). First generation college-going status will need to be established with each student.
ImportanceThis information will allow ECHSs to establish an entry level profile for students that will enable the disaggregation of later results according to specific demographic or prior academic achievement variables.

Point of Proof – 9
Analysis and UseClass profiles will also enable ECHSs to verify who they are serving and whether or not they are meeting the standard of serving underrepresented students. Comparison to district demographic and student performance data will enable ECHSs to determine if classes are representative or not representative of the general district population.
This can help offset any criticism that ECHSs are accepting only the best students.
Is it possible to identify incoming students who may be particularly at risk of succeeding in the ECHS environment through profiles alone? One part of that profile can be the EXPLORE Test.
Student Outcomes by EXPLORE Composite Score9
EXPLOREComposite
ScoreNumber
PersistedCECHS
AssociateDegree
Returned toRegular
High School
Entered District
AlternativeProgram
LeftDistrict
10-13 16 3 1 5 4 4
14-1510 22 18 9 2 2
16-17 25 21 11 3 1
18-19 12 6 5 3 2 1
20-21 7 5 2 2
22 3 3 2
N/A 4 4 1
Total 89 60 31 15 6 8
The real example above compares EXPLORE Composite Scores to specific outcomes in ECHS. Interestingly, the highest degree of persistence and success was among those students who scored
9 Data sources for following charts in this report, unless noted otherwise, are from Canton City Schools student records.
10 The national norm group for the EXPLORE Composite Score is 14.9.
1.0-2.0 points above the national norm. Success was less pronounced for higher scores. Those who scored below the national norm clearly encountered problems.

Point of Proof – 10
Measurement Scale Two: How are They Progressing?
Measurement Comparison Additional Information and Analysis
Standardized Test Scores
Compared to district averages, disaggregated on demographics if possible; group comparisons within ECHS
How are the ECHS students performing on the basis of standardized test scores such as the OGT, SAT, ACT compared to others in the district. Are achievement gaps disappearing in ECHS?
College Hours Earned For monitoring and reporting
College GPACompared to Conventional Students
How do ECHS student college GPAs compare to mainstream students, overall, by specific course?
Graduation Rates, All Students
Compared to district and state graduation rates, by sub-groups
On-Time Graduation, Some College
For students both persisting and not persisting in ECHS
On-Time Graduation with Two Years of College or Associate Degree
State and national averages where available. Internally, by sub-group
Students Not Persisting in ECHS – Profile
Are there differences between these students and those persisting on the basis of profile information?
Students leave ECHS for a variety of reasons. However, these students should be tracked
Students Not Persisting in ECHS – Graduation Rates
Compared to district and state graduation rates
Students Not Persisting in ECHS/Leaving District
Did these students also graduate on time. How many college hours accumulated
Student and family mobility is a reality in many districts

Point of Proof – 11
Gathering the DataStudents who have left the district can be tracked through the Statewide Student Identifier if still in Ohio. Other data can be tracked through district systems or EMIS data. College hours earned can be verified by the higher education (IHE) partner.
ImportanceWhether or not students graduate on time with up to two years of college or an Associate Degree determines the ultimate success of ECHSs, particularly if this holds constant for race, gender, SES and prior performance. All ECHSs track this data to some degree because it is essential to establish program success.
ECHSs have three categories of students. There are those who fully meet the standard. There are also those students who graduate, or not, on time but persist in ECHS and may have accumulated considerable college credit.
Additionally, not every student persists in ECHS.
While some have returned to their home high schools and others have left the school district, many may have accumulated college hours while in the ECHS setting. The literature and evaluations of ECHSs to date has been focused on outcomes for students who persist and successfully complete the program. The difficulty is that estimates place the transfer rate out of ECHSs at 25%.11
It would be a mistake to presume that the early college experience has not benefitted these students, particularly since the literature (Adelman, 200612; Swanson, 200813; and Karp 200714) strongly supports the notion that the accumulation of college credit while in high school results in increased access, persistence and success.
Analysis and UseThe chart below looks at outcomes for both students who persisted in, and students who left, ECHS over a two year period. Of those students who returned to regular high school, most had earned college credit. The on-time graduation rate for all students was 91% for year one and 96% for year two, far above the urban district average. Since this ECHS knew from student profiles that this student body for both years was representative of the district, the graduation rate becomes even more compelling.
11 AIR and SRI International (2009). Fifth Annual Early College High School Initiative Evaluation Synthesis Report Six Years and Counting: The ECHSI Matures. Washington and Arlington: Authors, p.48.
12 Adelman, C (2006). The Toolbox Revisited: Paths to Degree Completion From High School Through College Washington, D.C.: U.S. Department of Education.
13 Swanson, J. (2008). An analysis of the impact of high school dual enrollment course participation on post-secondary academic success, persistence and degree completion. Executive Summary. Paper presented at the meeting of the National Association for Gifted Children, Tampa, FL and the National Alliance of Concurrent Enrollment Partnerships, Kansas City, Mo..
14 Karp, Melinda Mechur; Calcagno, Juan Carlos; Hughes, Katherine L.; Wook Jeong, Dong; Bailey, Thomas R. (2007).The Postsecondary Achievement of Participants in Dual Enrollment: An Analysis of Student Outcomes in Two States; Community College Research Center, Teachers College, Columbia University. http://ccrc.tc.columbia.edu/Publication.asp?UID=547

Point of Proof – 12
Outcomes for All Enrolling Freshmen – Comparison of Class of 2009, Class of 2010
2009 2010
Student StatusNumber of Students
% of Students
Number of Students
% of Students
Graduated CECHS w/ Associate Degree 32 32% 31 35%
Graduated CECHS w/ College Credit 28 28% 29 33%
Graduated District High School15 w/College Credit 21 21% 19 21%
Graduated High School w/o College Credit 2 2% 1 1%
Did not Graduate on Time 6 6% 2 2%
Dropped Out 2 2% 0 0%
Left District 8 8% 816 9%
Students Remaining in District (All four years) 83 84% 79 89%
On-Time HS Graduation Rate (All Students Remaining in District)
91% 96%
If there are two hard and fast rules in data analysis, they are “disaggregate” and “compare.” For ECHSs these rules are essential to producing evidence. The chart below looks at on-time high school graduation and who earned an Associate Degree by race. Added to the chart is a comparison to the state high school graduation rate, also by race and exhibiting Ohio’s persistent Black-White achievement gap.
Both African Americans and Whites are outperforming state averages when it comes to graduation, but there is more. While students in both groups are enjoying a level of success in earning Associate Degrees, the achievement gap has flipped.
Because it is disaggregated and compared to some other standard, the data gains in power. The example below looks at outcomes by race.
15 This category also includes CHOICES alternative high school and Canton Digital Academy.
16 Five of these students are known to have graduated high school. Seven of these students had earned college credit.
ECHS Class of 2010 Graduation Outcomes by Race
NumberAA
DegreeAA %
On-Time HS Grad
ECHS Grad %
State HS Grad Rate %
African American 23 15 65% 23 100% 61.3%
White 33 15 45% 33 100% 88.6%

Point of Proof – 13
Comparison also creates a context for understanding the importance of the data. For ECHSs, their partners and communities, local context is the most critical. While a piece of data, like a graduation rate, may be impressive in itself, it also becomes important if decision makers have a broader understanding of what it means.
One way to establish such context is to look at individual sub-group outcomes in relation to the community. A report17 on Canton’s Early College High School did this by using the U.S. Census American Community Survey (ACS) data for the City of Canton.18
The most successful sub-group among CECHS students in 2010 is the impoverished African
American female. More students graduated in this category in 2010 than in 2009.
This is a significant result, given the demographics of poverty in the city of Canton, where females, over the age of 25, are the most impoverished group, according the U.S. Census. While females themselves account for 60% of the city’s poverty, African American females alone account for over 40%.
The greatest concentration of poverty is among the young (age 18-34) and those with only a high school diploma or less. While the Census estimates that 6,903 Canton females (4,301 African American) are below poverty, only 50 females with a Bachelor’s Degree or higher are in poverty.
17 Rochford, J. (2010). Ongoing Proof. Canton, Ohio: The Stark Education Partnership.
18 For ACS data see: http://www.census.gov/acs/www/

Point of Proof – 14
Measurement Scale Three: Outcomes Beyond Early College High School
It should be noted here that these outcomes can be tracked both for students who persisted a full four
years in ECHS and those who returned at some point to their home high schools.
Measurement Comparison Information and Analysis
High School Graduation ECHS non-graduates completing in the summer
Completion of Associate Degree
For those partnered with two year institutions, completion rate for students graduating with some college, no degree from ECHS
Entry into four year degree programs
District, state and national averages
Disaggregated, race, gender, SES
Persistence in four year degree programs
District, state and national persistence averages
Disaggregated, race, gender, SES
Completion of four year degree
Six year national averageTo what extent has time to a four year degree been compressed? Disaggregated?
Gathering the DataBeyond district level data on high school graduation, there is the question of tracking students into four year institutions. A new study by AIR that started in 2010 has the primary goal of establishing experimental and control groups to look at student outcomes beyond ECHS.19 The study will use a sample from about 25 ECHSs. Once again while this may provide supporting evidence, it is not local evidence.
The recommendation here is that each ECHS or their districts subscribe to the National Student Clearinghouse Student Tracker System.20 Though Ohio is targeting an integrated P-16 data system, Student Tracker has the capacity now to track college outcomes through completion for individual students at 95% of all higher education institutions across the nation.
ImportanceMost would argue that the ultimate goal for ECHSs is to enable students to go on and complete a Bachelor’s Degree, even if already having an Associate Degree. College success surveys by school districts of their former graduates, however, have always been problematic as reliance has been on mailed questionnaires. Student Tracker circumvents the difficulty of low return rates that often accompany this method.
19 AIR (n.d.). Evaluation of the Early College High School Initiative: Impact Study Overview. Washington, D.C.: Author.
20 See: National Student Clearinghouse Measure the Success of your High School Graduates at: http://www.studentclearinghouse.org/highschools/default.htm

Point of Proof – 15
Use and AnalysisWhile Student Tracker offers a comprehensive report that enables the tracking of outcomes for individual students, a new “second generation” system21 will enable schools to upload additional data fields for those students similar to the entry-level ECHS profiles recommended in this document. Hitherto, results needed to be compared back to district files for disaggregation.
If the ECHS is in a district that subscribes to Student Tracker for all high schools, comparisons can be made on college going and success rates for ECHS students as compared to the general student population.
Below is a sample chart from Student Tracker showing the impact of ECHS graduates who have already earned an Associate Degree on the college completion rate of their home high school in 2009.
Class of 2009 Postsecondary Enrollment and Progress
21 See National Student Clearinghouse. Student Tracker 2011 at: http://research.studentclearinghouse.org/studenttracker.21

Point of Proof – 16
Early College High Schools can be thought of as discrete, stand-alone schools that produce positive results for a distinct student body, or they can be thought of as something more. Vargas and Miller (2011) from Jobs for the Future22 have noted the impact of the ECHS movement in creating early college districts such as the Pharr-San Juan-Alamo Independent School District in Texas, or in forming a statewide secondary education strategy as has happened in North Carolina.
Yet, the impact of an ECHS can be far more immediate. Beyond benefitting individual students, the early college can impact home high schools, districts, partner colleges, neighborhoods and communities. The ECHS can fundamentally begin to alter adult thinking and change public policy and decision-making on college access. The nature and scope of this impact can vary by virtue of school type, where the ECHS is located and the nature of the partnership establishing the school. Consider the following example from Canton’s ECHS which is a district-based school:
For Start State College of Technology, one of the fastest growing mid-size two year institutions in the nation, early college high school was a risk. Many honestly questioned whether students could master the material. Additionally, why should the college undertake such a risky experiment when it was already on a “growth curve”? The risk was also there for the Canton City Schools, and particularly the Canton Professional Educators Association. Only through an innovative deployment of dual credit coursework, the same course for high school and college credit, augmented by outstanding instructional support, could the school’s goal of both a high school diploma and associate degree be met.
Evolving a Theory of Change for ECHSs
Both began to think differently. In Canton’s early college high school, a unique team teaching arrangement was formed between high school teachers and college professors. It had the collaborative result of rapidly bringing kids up to the level they needed to succeed in college coursework, but that was only the first step. After the first class in the summer of 2005 had a 95% success rate in passing their first six hours of college coursework, adults became believers.
Prior to early college high school, the community saw dual credit as a course taught on a college campus by a college professor for only a few “high performing” students. After early college high school, the community began to ask, “Why can’t we do this for other students?”
A cadre of high school teachers, meeting the qualifications to become college adjuncts, was formed. These teachers taught dual credit courses for non-early college high school students. Such teachers were best positioned to provide additional support to help students master the material. Students remained in their high schools as exemplars. The year early college high school was being planned in Canton, only 29 students participated in dual credit through PSEO. This past year, 156 students were taking dual credit courses at their high schools in addition to 287 students at early college high school. At the Timken Campus, where Canton’s early college high school is based, only 19 students had gone to college in 2004.
22 Vargas, J. & Miller M. (2011). Early College Designs An increasingly popular college-readiness strategy for school districts to reach more traditionally underserved students. The School Administrator June 2011 Number 6, Vol. 68.

Point of Proof – 17
Each ECHS then can be thought of as an intervention that has fostered change on several fronts (domains) and each early college would
benefit by evolving its own theory of change to ask a very fundamental question, “How would things be different if we did not exist?”
Additionally, why is it even important to ask that question if an ECHS already has great data? The reason is that data alone is only just outcome
monitoring, it does nothing to tell us about the effectiveness of the program and why the program is important.23
23 Several of the concepts on Impact Evaluation that follow are based on a 2009 presentation by Howard White, entitled What is impact evaluation, when and how should we use it, and how to go about it? Available on the website of the International Initiative for Impact Evaluation at: http://www.3ieimpact.org/general_resources.html
IndIvIdual OutcOmes
• High school graduation• 2 years college or
Associate Degree• Matriculation to 4
year institution• Time to degree
compressed• Bachelor’s Degree
Peer/FamIly OutcOmes
• Greater desire to go to college
schOOl OutcOmes
• High ratings• Higher individual
student test scores• Increased rigor in high
school curriculum• Parent/family
involvement
ImmedIate dOmaIns OF ImPact
dIstrIct OutcOmes
• Higher high school test scores• Higher graduation rates• Increased college-going rate• Faculty collaboration with higher education
secOndary dOmaIns OF ImPact
cOllege OutcOmes
• Increased enrollment (minority, low SES)• Faculty collaboration with K-12
cOmmunIty OutcOmes
• Increased adult desire to go to college• Rising education attainment• ECHS serves to prompt other
college access programs
Early College High Schools: Domains of Impact

Point of Proof – 18
Impact Evaluation: How Early College High Schools Can Demonstrate Their Value to a Community
Impact Evaluation is a way of assessing program effectiveness and importance by answering the question, “How would things be different if we did not exist?” Widely used by the World Bank24 and others, Impact Evaluation uses a counterfactual. In other words, it is concerned not only with what happened but with a comparison between what actually happened and what would have happened if the policy or program had not been in place.
While the counterfactual can no longer be observed (the program is in place and it has caused change) it can be estimated. Most often, this is done with a comparison or a comparison group and Impact Evaluation can become very sophisticated utilizing both experimental and quasi-experimental designs. Such an analysis is expensive and time-consuming. Schools and districts generally have neither the money nor personnel to conduct such studies. Further, we are dealing with relatively small numbers on a local basis. For all these reasons, such evaluations are seldom done on a local, or single school, basis. Yet, the Operations Evaluation Department of the World Bank notes that there are several methods or models of Impact Evaluation. One seems suited for the purposes of ECHSs given these realities.
Rapid assessment or review, conducted ex post. This method can encompass a range of approaches to endeavor to assess impact, such as participatory methods, interviews, focus groups,
case studies, an analysis of beneficiaries affected by the project, and available secondary data…25
For a single ECHS this assessment of material will be community based with the objective of gathering additional locally-relevant compelling evidence of effectiveness and importance. While it needs to be rigorous, it does not have to be overly complicated or complex. Local Impact Evaluations should follow White’s (2009) dictum to “be issues-driven not methods driven.”
After determining what issues are of paramount importance locally, ECHSs can create a chart similar to the following as a guide to help organize an impact evaluation. The “old reality” column is the counterfactual, i.e. how things have looked (or would look) without an ECHS. The “theory” column is from the ECHSs theory of change, or how and why existing conditions will be impacted or changed by the ECHS itself.
The third column “new reality” registers how things are now. Importance focuses on the impact we believe that the ECHS has created. The chart itself is only an example and each unique ECHS will find it advantageous to create its own. Note that as the chart progresses, items move from the individual to the community domain. Documenting the new reality and attaching importance will become more challenging as this progression occurs.
24 See: What is Impact Evaluation at the World Bank site: http://www.worldbank.org/ieg/ie/
25 See: OED and Impact Evaluation- A Discussion Note at: http://www.worldbank.org/ieg/docs/world_bank_oed_impact_evaluations.pdf

Point of Proof – 19
Old Reality Theory New Reality Importance
Low performing urban students are at risk of not graduating
The supportive environment of an ECHS will increase graduation rates for low performing students
Ninety-six percent of all low performing students graduate on time
Offsets high risk factor
Low performing students do not succeed at college coursework
Given adequate support in an ECHS environment low performing students will succeed at college coursework
Over half of all low performing students are graduating ECHS with 30 or more hours of college credit
These students now have a “head start” on a degree with increase chance of completing college
Low SES and minority students enroll in four year institutions at lower rates than higher SES whites
ECHS will remove gaps between sub-groups
Low SES and minority students enrolling at same rates
National data underscores sizable gaps between these populations
High schools do little to influence adult attitudes towards gaining more education
The success of students at ECHS motivates family members, peers and other adults to pursue more education
Family and community members inspired by ECHS student success are enrolling in college
The ECHS is emerging as a community success model
High schools do not directly increase college attainment in a community
Successful ECHS graduates directly increase a community’s college attainment level
ECHS graduates add directly to the “some college or associate degree” attainment levels
This begins to produce economic benefit for the community
The old reality can be charted from pre-existing data, literature and assumptions. While hard data can be used to outline some of the new reality, the use of secondary data will be necessary in many cases.
Secondary data can be both quantitative and qualitative. The quantitative data is not collected by the ECHS in this case but is comprised of
data collected by others that can be adopted and used. One example is the U.S. Census Bureau’s American Community Survey (ACS) data on education attainment (see last category in chart above). In this case, the data is calculated for the geographic area served by a school district and can be used to chart the “some college, no degree” category for 18 to 24 year olds. ACS data is released on a yearly basis.

Point of Proof – 20
S1501: Educational AttainmentData Set: 2009 American Community Survey 1-Year EstimatesSurvey: American Community SurveyGeographic Area: Canton City School District, Ohio
Subject TotalMargin of Error (+/-)
MaleMargin of Error (+/-)
FemaleMargin of Error (+/-)
Population 18 to 24 years 7,751 1,503 3,547 957 4,204 1,090
Less than high school graduate
26.8% 9.8 36.3% 17.8 18.9% 12.4
High school graduate (includes equivalency)
38.7% 12.2 38.8% 15.6 38.6% 17.7
Some college or Associate's degree
32.4% 14.4 25.0% 14.3 38.7% 22.7
Bachelor's degree or higher 2.1% 2.1 0.0% 4.5 3.9% 4.0
Carnevale, Rose and Cheah (2011) offer another piece of secondary data that can be merged with the chart above showing that “some college, no degree” holders earn over a quarter of a million more, Associate Degree over $400,000 more and those with Bachelor’s Degrees earning nearly a million more during their lifetimes than high school graduates.26
Interviews with ECHS students, families and community members can be added to a qualitative set that strengthens the case for impact on adults in the community. Not all data will be conclusive at first. As time goes on and additional evidence is gathered, the case for the value of the ECHS to individuals and the community can become more compelling.
26 Carnevale, A., Rose, S. and Cheah, B. (2011). The College Payoff: Education, Occupations, Lifetime Earnings. Washington, D.C.: Georgetown University Center on Education and the Workforce.

Point of Proof – 21

© 2011 Stark Education Partnership, Inc.