A Tale of Two Recoveries
18
A Tale of Two Recoveries A Special Report by An Assessment of New York City’s Residential Real Estate Market One Year Aſter Superstorm Sandy
Transcript of A Tale of Two Recoveries
A Tale of Two Recoveries
A Special Report by
An Assessment of New York City’s Residential Real Estate Market
One Year After Superstorm Sandy
2 S T R E E T E A S Y
Key Findings
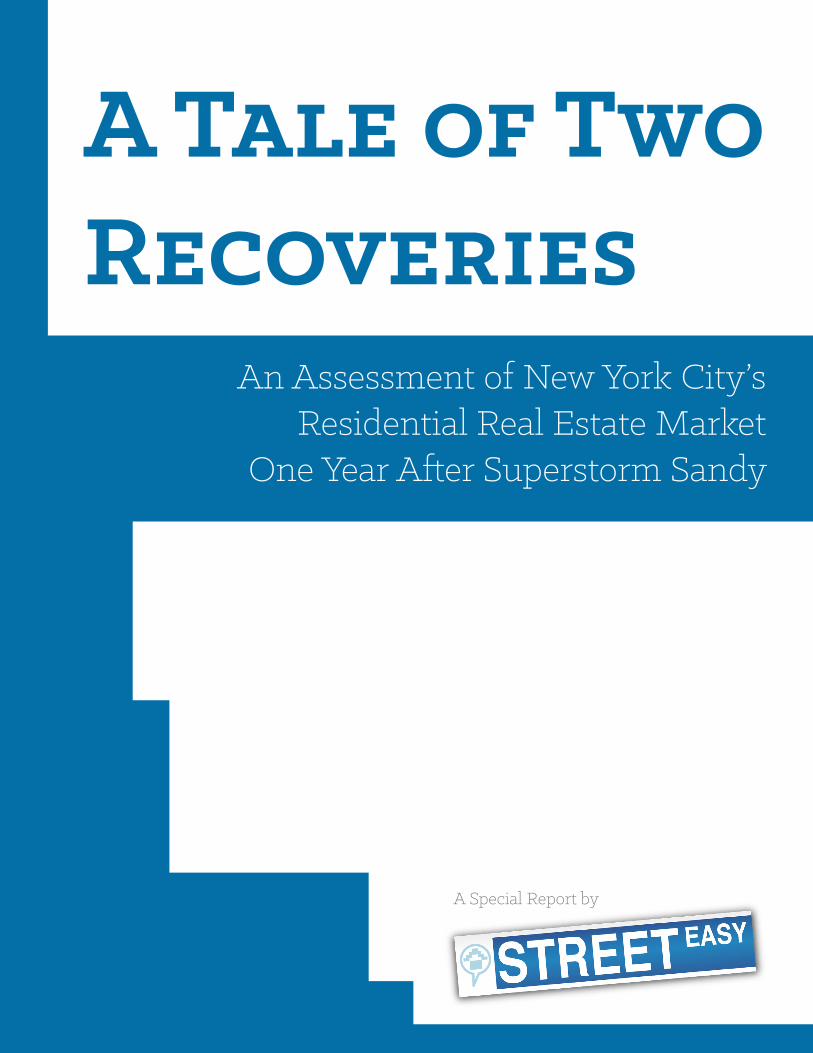
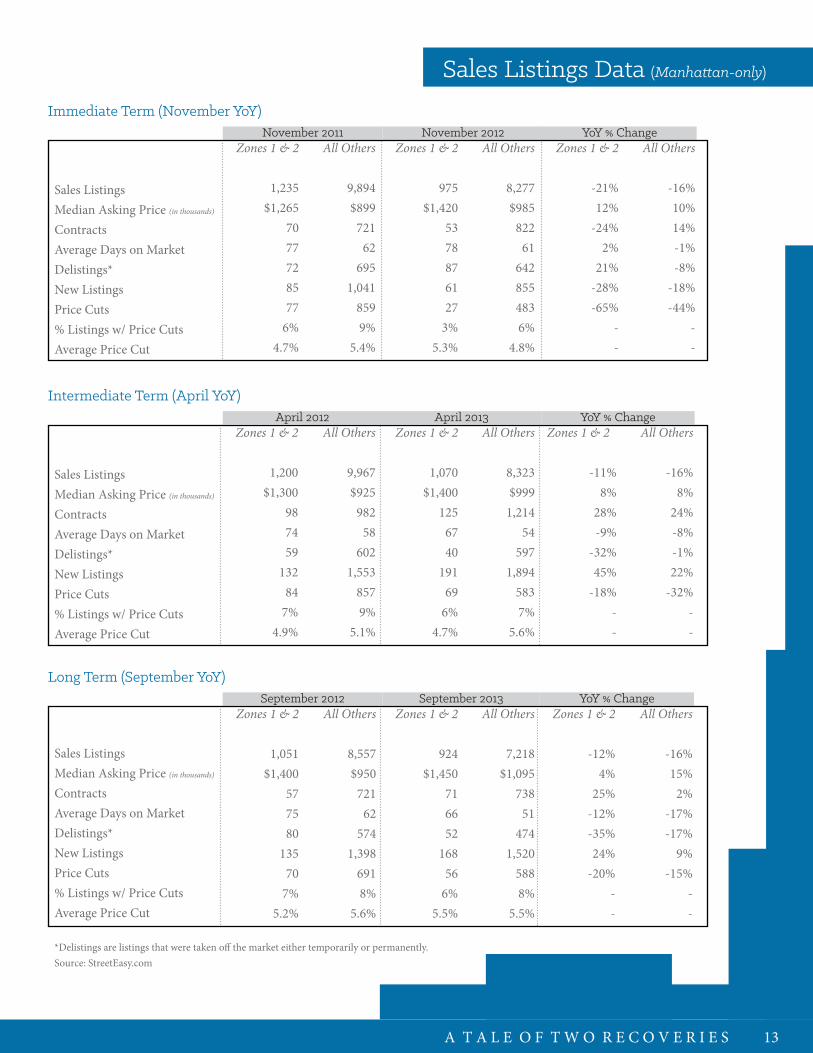
Contract volume in coastal Manhattan rebounded quickly after Sandy.There was a significant decline in contract volume in Zones 1 and 2 in Manhattan one month after Sandy (-24% year over year) but rebounded by April 2013 (+28% year over year).
Inventory in coastal Manhattan experienced a short-term negative shock immediately after Sandy.While inventory remains far more constricted in all of Manhattan than one year ago, Zones 1 and 2 experienced a significant decline in sales listings one month after Sandy (-21% year over year). By April 2013 - six months after the storm - listings were down 11% year over year.
“Delistings” in coastal Manhattan spiked in the storm’s immediate aftermath and declined quickly.After a spike in the number of delisted units in Zones 1 and 2 in Manhattan in the month after Sandy (+21% year over year), they declined significantly by April 2013 (-32% year over year) and continued to decline.
Real estate prices in coastal Manhattan were resilient to the impacts of Sandy.Prices in Zones 1 and 2 in Manhattan were stable in the immediate aftermath of Sandy: price cuts declined by 65% and median asking price increased by 12% year over year.

About StreetEasy
StreetEasy.com is a comprehensive real estate information website, providing consumers detailed sales and rental information and the tools to manage that information to make educated decisions. The site has become the reference site for consumers, real estate professionals, and the media and has been widely credited with bringing transparency to the New York City real estate market. StreetEasy is owned and operated by Zillow, Inc.
This report was authored by Sofia Song, Alan Lightfeldt, Sam Lin, and Mariela Quintana.
A T A L E O F T W O R E C O V E R I E S 3
The negative impacts were particularly acute in the coastal neighbor-hoods in the outer boroughs.
Unlike in Manhattan, closings volume and prices in Zones 1 and 2 in the Bronx, Brooklyn, Queens, and Staten Island declined immediately after Sandy. These zones have consistently underperformed in closings volume compared to all other zones. Over the long term, there has been a weak recovery in closings activity in the outer boroughs (with the notable exception of Queens - which in Septem-ber 2013 experienced a 38% increase year over year).
Manhattan rents levels have remained stable.Median asking rent in Zones 1 and 2 in Manhattan have remained relatively stable throughout the year and comparable to all other zones in the borough.
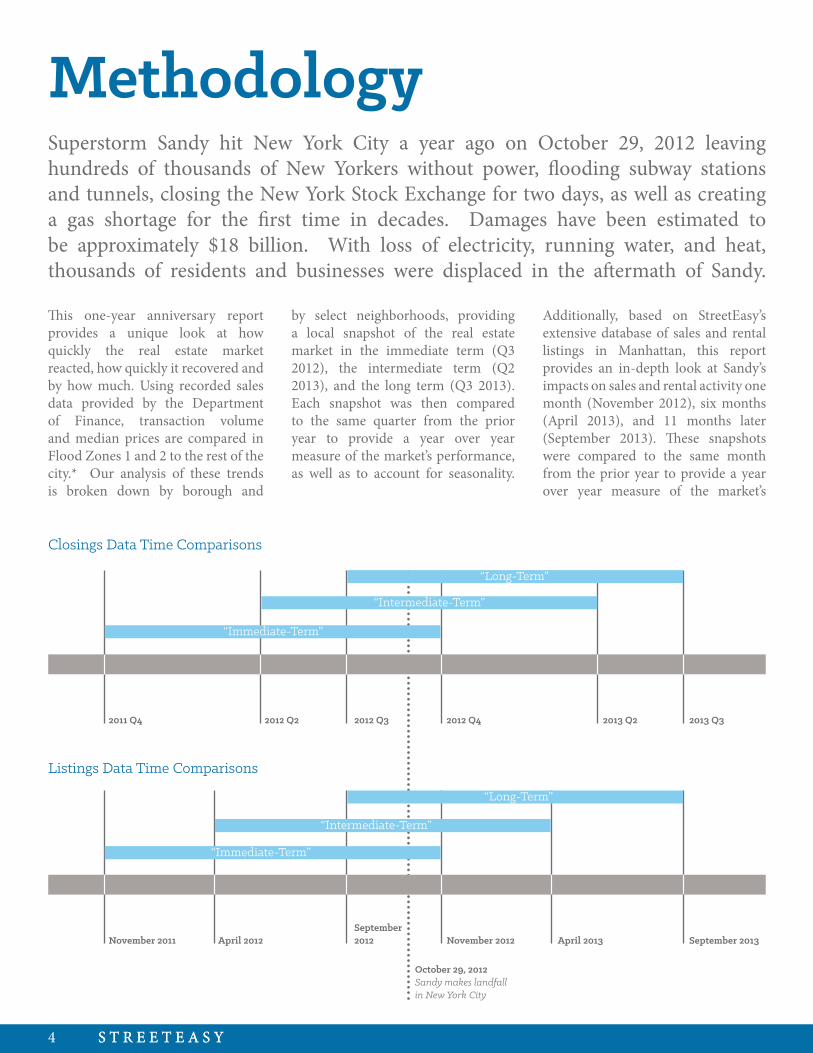
October 29, 2012Sandy makes landfall in New York City
November 2012 April 2013 September 2013November 2011 April 2012September 2012
“Immediate-Term”
“Intermediate-Term”
“Long-Term”
2012 Q4 2013 Q2 2013 Q32011 Q4 2012 Q2 2012 Q3
“Immediate-Term”
“Intermediate-Term”
“Long-Term”
4 S T R E E T E A S YS T R E E T E A S Y
Closings Data Time Comparisons
Listings Data Time Comparisons
This one-year anniversary report provides a unique look at how quickly the real estate market reacted, how quickly it recovered and by how much. Using recorded sales data provided by the Department of Finance, transaction volume and median prices are compared in Flood Zones 1 and 2 to the rest of the city.* Our analysis of these trends is broken down by borough and
by select neighborhoods, providing a local snapshot of the real estate market in the immediate term (Q3 2012), the intermediate term (Q2 2013), and the long term (Q3 2013). Each snapshot was then compared to the same quarter from the prior year to provide a year over year measure of the market’s performance, as well as to account for seasonality.
Superstorm Sandy hit New York City a year ago on October 29, 2012 leaving hundreds of thousands of New Yorkers without power, flooding subway stations and tunnels, closing the New York Stock Exchange for two days, as well as creating a gas shortage for the first time in decades. Damages have been estimated to be approximately $18 billion. With loss of electricity, running water, and heat, thousands of residents and businesses were displaced in the aftermath of Sandy.
Additionally, based on StreetEasy’s extensive database of sales and rental listings in Manhattan, this report provides an in-depth look at Sandy’s impacts on sales and rental activity one month (November 2012), six months (April 2013), and 11 months later (September 2013). These snapshots were compared to the same month from the prior year to provide a year over year measure of the market’s
Methodology

1
2
3
4
5
6Source: NYC Office of Emergency Management
NYC Flood Zones
A T A L E O F T W O R E C O V E R I E S 5
This study compares the market performance in Zones 1 and 2 with all other Zones (3-6).Residential units located within Zones 1 and 2 are among the most vulnerable to flood and damage in the event of a hurricane or superstorm, such as Hurricane Sandy.
Group 1:Zones 1 and 2
Group 2: All Others
performance and also to account for seasonality. These data findings are then put into the context of brokers and residents who were affected by Sandy and shared their first-hand experiences with us. The comments we received provide an anecdotal and personal account of the storm’s impact on New York City’s real estate market.
*There are six flood evacuation zones designated by the City of New York, which are separate from flood insurance risk zones designated by the Federal Emergency Management Agency (FEMA). For more information on the flood zones, visit the New York City Office of Emergency Management at http://www.nyc.gov/html/oem/html/hazards/storms_evaczones.shtml

6 S T R E E T E A S Y
Based on recorded sales data from the New York City Department of Finance, what is most evident
is that demand for properties in Zones 1 and 2 in Manhattan has remained inelastic. The transaction volume for Manhattan properties in Zones 1 and 2 increased at a considerably faster rate than properties in other zones. Immediately following Sandy, there was a 64% increase in the number of closings compared to the prior year, while other zones in Manhattan experienced a 41% increase. In the intermediate and long terms, closings for Zone 1 and 2 properties increased by more than twice as much as properties in other zones. Median closing price in Zones 1 and 2 jumped 23% by the intermediate term driven by the intense spring selling season.
Closings trends are drastically different in the Bronx, Brooklyn, Queens and Staten Island. In all of the outer boroughs, transaction volume in Zones 1 and 2 declined in the immediate term compared to the prior year. Brooklyn and Queens were the hardest hit with declines of 22% and 30%, respectively. In stark contrast, transaction volume and median closing prices were increasing in all other zones. While Brooklyn and Staten Island median
rest of the borough had a 4% increase.
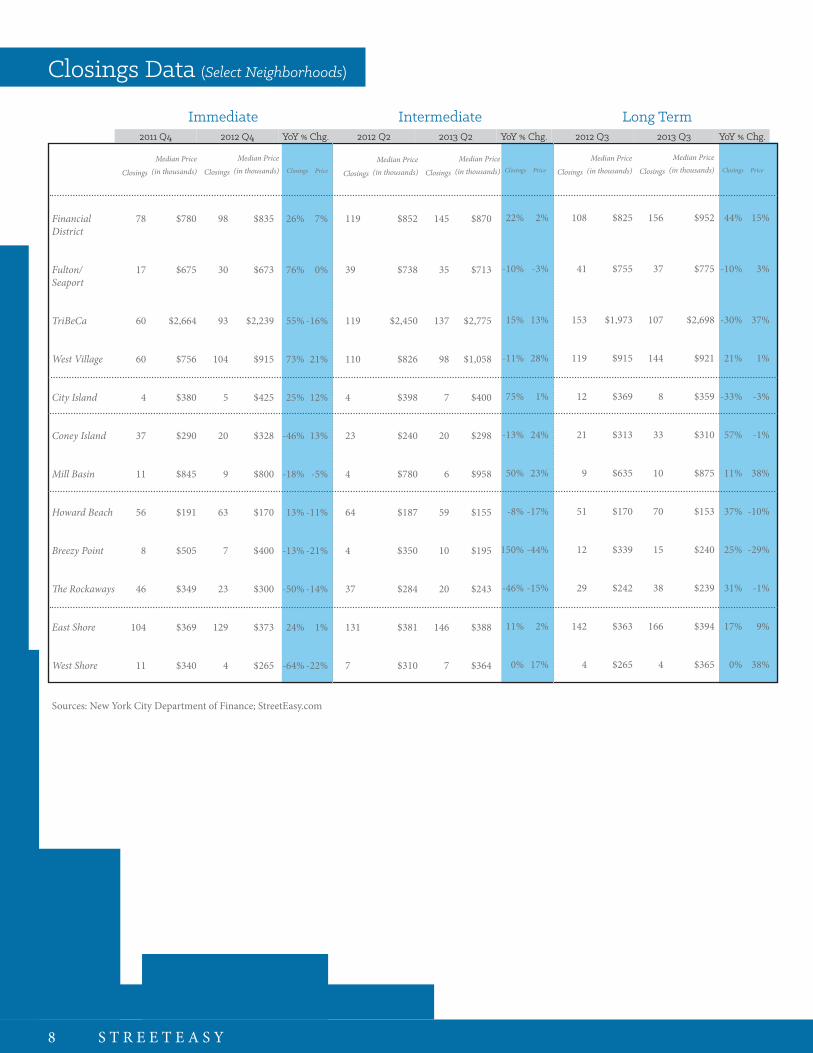
Neighborhoods such as Breezy Point and The Rockaways were some of the hardest hit in the city. Immediately following Sandy, closing volumes dropped 13% and 50%, respectively, compared to the prior year. A year later in the third quarter of 2013, closing volumes recovered with Breezy Point experiencing a 25% increase in closings from the year before, and The Rockaways had an increase of 31% in the same period.
Median closing prices, on the other hand, were much slower to recover in these two neighborhoods. In Breezy Point, prices declined by 21% immediately after Sandy. In the intermediate term, prices declined further by 44% compared to the prior year. By the close of Q3 2013, median closing price was still down 29% compared to a year ago. Median closing price in The Rockaways did not decline as dramatically. Median closing price declined by 14% in the immediate term and by 15% in the intermediate term. By the close of Q3 2013, median closing price had almost recovered, showing a 1% decrease from the prior year.
closing prices remained stable during this time, they declined by 3% in Queens and by 13% in the Bronx.
Since Sandy, transaction volume in the outer boroughs in Zones 1 and 2 had a much slower recovery. In the intermediate term, transaction volume in Brooklyn and Queens declined by 27% and 23% from the prior year. In other zones, Brooklyn experienced an 8% increase in transactions, while Queens experienced a 13% increase. Median prices in Zones 1 and 2 remained stable for Brooklyn but increased 33% and 24% in the Bronx and Queens. Median closing price in Staten Island’s Zones 1 and 2 declined by 43%.
In the long term, by Q3 2013, Brooklyn’s Zones 1 and 2 transaction volume declined by 4% and median price declined by 8%, compared to the previous year. In Queens, Zones 1 and 2 closings increased by 38% but median closing price declined by 3%. In the other zones, however, the median closing price in Queens increased 4% and transaction volume increased by 30%. Staten Island’s Zone 1 and 2 median closing price in the third quarter of 2013 declined by 24% since the prior year while the
Closings Trends64% immediate boost in sales volume in
Zones 1 and 2 in Manhattan (Q4 YoY)
immediate decline in sales volume in Queens’ Zones 1 & 2 (Q4 YoY)30%
41% immediate boost in sales volume in all other zones in Manhattan (Q4 YoY).
$976,000median closing price in Zones 1 and 2 in Manhattan in Q3 2013, a 5% decline since Sandy.
$267,000median closing price in Zones 1 and 2 in Staten Island in Q3 2013, a 24% decline since Sandy.

ClosingsMedian Closing Price
ClosingsMedian Closing Price
ClosingsMedian Closing Price
ClosingsMedian Closing Price
ClosingsMedian Closing Price
Zones 1 & 2
215$969
289$425
144$410
14$345
57$310
All Others
2,465$725
1,363$399
2,063$278
367$238
351$350
Zones 1 & 2
353$900
226$434
101$399
13$300
47$310
All Others
3,482$810
1,439$466
2,340$308
444$250
531$353
Zones 1 & 2
64%-7%
-22%2%
-30%-3%
-7%-13%
-18%0%
All Others
41%12%
6%17%
13%11%
21%5%
51%1%
Manhattan
Brooklyn
Queens
Bronx
Staten Island
Q4 2011 Q4 2012 YoY % Change
ClosingsMedian Closing Price
ClosingsMedian Closing Price
ClosingsMedian Closing Price
ClosingsMedian Closing Price
ClosingsMedian Closing Price
Zones 1 & 2
318$920
325$450
141$422
12$315
55$350
All Others
3,368$820
1,677$480
2,205$295
370$195
536$345
Zones 1 & 2
424$1,130
236$456
109$563
12$391
57$200
All Others
3,889$800
1,807$455
2,488$300
398$220
634$360
Zones 1 & 2
33%23%
-27%1%
-23%33%
0%24%
4%-43%
All Others
15%-2%
8%-5%
13%2%
8%13%
18%4%
Manhattan
Brooklyn
Queens
Bronx
Staten Island
Q2 2012 Q2 2013 YoY % Change
ClosingsMedian Closing Price
ClosingsMedian Closing Price
ClosingsMedian Closing Price
ClosingsMedian Closing Price
ClosingsMedian Closing Price
Zones 1 & 2
305$1,030
271$445
107$423
18$249
67$350
All Others
3,575$800
1,698$495
2,232$305
437$255
560$350
Zones 1 & 2
387$976
261$410
148$410
17$351
66$267
All Others
4,016$830
1,863$505
2,912$319
416$228
639$365
Zones 1 & 2
27%-5%
-4%-8%
38%-3%
-6%41%
-1%-24%
All Others
12%4%
10%2%
30%4%
-5%-11%
14%4%
Manhattan
Brooklyn
Queens
Bronx
Staten Island
Q3 2012 Q3 2013 YoY % Change
(in thousands)
(in thousands)
(in thousands)
(in thousands)
(in thousands)
(in thousands)
(in thousands)
(in thousands)
(in thousands)
(in thousands)
(in thousands)
(in thousands)
(in thousands)
(in thousands)
(in thousands)
Closings Data (City-wide)
A T A L E O F T W O R E C O V E R I E S 7
Immediate Term (Q4 YoY)
Intermediate Term (Q2 YoY)
Long Term (Q3 YoY)
Sources: New York City Department of Finance; StreetEasy.com
Financial District
Fulton/Seaport
TriBeCa
West Village
City Island
Coney Island
Mill Basin
Howard Beach
Breezy Point
The Rockaways
East Shore
West Shore
78
17
60
60
4
37
11
56
8
46
104
11
$780
$675
$2,664
$756
$380
$290
$845
$191
$505
$349
$369
$340
26%
76%
55%
73%
25%
-46%
-18%
13%
-13%
-50%
24%
-64%
7%
0%
-16%
21%
12%
13%
-5%
-11%
-21%
-14%
1%
-22%
98
30
93
104
5
20
9
63
7
23
129
4
$835
$673
$2,239
$915
$425
$328
$800
$170
$400
$300
$373
$265
119
39
119
110
4
23
4
64
4
37
131
7
$852
$738
$2,450
$826
$398
$240
$780
$187
$350
$284
$381
$310
22%
-10%
15%
-11%
75%
-13%
50%
-8%
150%
-46%
11%
0%
2%
-3%
13%
28%
1%
24%
23%
-17%
-44%
-15%
2%
17%
145
35
137
98
7
20
6
59
10
20
146
7
$870
$713
$2,775
$1,058
$400
$298
$958
$155
$195
$243
$388
$364
108
41
153
119
12
21
9
51
12
29
142
4
$825
$755
$1,973
$915
$369
$313
$635
$170
$339
$242
$363
$265
44%
-10%
-30%
21%
-33%
57%
11%
37%
25%
31%
17%
0%
15%
3%
37%
1%
-3%
-1%
38%
-10%
-29%
-1%
9%
38%
156
37
107
144
8
33
10
70
15
38
166
4
$952
$775
$2,698
$921
$359
$310
$875
$153
$240
$239
$394
$365
2011 Q4 2012 Q4 2012 Q2 2013 Q2 2012 Q3 2013 Q3YoY % Chg. YoY % Chg. YoY % Chg.
Median Price (in thousands) ClosingsClosings
Median Price (in thousands)Closings
Median Price (in thousands)Closings
Median Price (in thousands)Closings
Median Price (in thousands)Closings
Median Price (in thousands)ClosingsPriceClosings Price Closings Price
Immediate Intermediate Long Term
Closings Data (Select Neighborhoods)
8 S T R E E T E A S Y
Sources: New York City Department of Finance; StreetEasy.com

Breezy Point, QueensNumber of Closings: -13%Median Price: -21%
The Rockaways, QueensNumber of Closings: -50%Median Price: -14%West Shore, Staten Island
Number of Closings: -64%Median Price: -22%
Mill Basin, BrooklynNumber of Closings: -18%Median Price: -5%
Financial Dist., ManhattanNumber of Closings: 26%Median Price: 7%
Fulton/Seaport., ManhattanNumber of Closings: 76%Median Price: 0%
Coney Island, BrooklynNumber of Closings: -46%Median Price: 13%
A T A L E O F T W O R E C O V E R I E S 9
Neighborhood Statistics
The speed by which the coastal Manhattan real estate market recovered after Sandy is echoed by the personal experiences of residents and brokers in the area. In addition to StreetEasy.com data, the storm’s impact on the outer boroughs is equally, if not more, reflected in the first hand comments and experiences of local residents.
“Some closings froze the month after. I sent out for contracts in the middle of the storm’s aftermath, all in FiDi, and one pulled,” says Ariel Cohen, a broker with Douglas Elliman. According to Cohen, the client cited the storm as the reason for backing out. “But November was followed by a
that sold immediately after.”
In October of 2012 Roy Kim, Senior Vice President of Design at Extell Development and a long-time downtown resident, had just purchased a three-bedroom unit at 20 Pine Street. When the storm hit, Kim and his partner were still living in their rental apartment at 90 West Street, which due to flooding in the lobby and basement, made the building unoccupiable for the month following the storm.
Despite the damage the storm caused to the area, Kim does not have concern for the real estate value of the area. “At first I was worried about the value,
period of insane activity,” Cohen adds.
Ryan Serhant of NestSeekers reiterates Cohen’s assessment of the strength of the market, commenting that in his own experience, “The last ten months have been insane, we’ve been selling at record prices.” Serhant highlights a recent sale at 200 Chambers. “Sandy completely flooded the building’s lobby, but this summer we sold a unit there for a record price.” The three-bedroom apartment sold for over $4 million this August. Even in the immediate aftermath, Serhant found his transaction volume relatively unaffected, “We had several listings on the market downtown
Comparing the ImmediateImpacts of SandyThe immediate impacts of Sandy varied widely based on geography. While communities in Brooklyn, Queens, and Staten Island experienced significant declines in closing activity and sale price, some areas of Manhattan went relatively unscathed. This map compares the year over year change in closings and price between Q3 2011 and Q3 2012, just one month after Sandy hit.

10 S T R E E T E A S Y
but the estimated value of my unit has already gone up,” says Kim regarding the estimated value of his property at 20 Pine. His assessment aligns with the findings by StreetEasy.com that median closing price for the Financial District has increased by 15% in September 2013 year over year. In Kim’s opinion, “It’s a matter of supply and demand. For this area, there’s not a lot of supply and 20 Pine offers great value compared to elsewhere in the city.” Kim is highly optimistic for the area, citing the completion of the
World Trade Center as dynamic force in the neighborhood. “There’ll be more amenities, more retail, more residential units. The value is just going up and the area is going to become more livable.”
It is not just New Yorkers looking to relocate to a revitalized and more residential downtown neighborhood that is driving the appeal of and volume of closings in the Financial District, Seaport and other Zones 1 and 2 neighborhoods. According to Evan Shaffer, a broker with Douglas Elliman, “The initial hesitancy surrounding closings that Sandy caused has been offset by international buyers who are bringing their money in from abroad and are doing cash deals. Unlike most buyers, cash buyers do not have to meet mortgage
According to Boyle, the impact of these new premiums could have a domino effect not just on The Rockaways but on many waterfront communities in Zones 1 and 2 in Brooklyn and Queens. “Garrison Beach, Howard Beach, Sheepshead Bay, Canarsie, Coney Island, Red Hook,” Boyle counts off. “It’s a real cloud for all these places.”
Boyle attributes the declines in closing activity in The Rockaways in large part to the costs of flood insurance. “It’s creating a real hesitancy
for potential buyers,” he says.
Although flood insurance, as Boyle comments, “is hanging over the market” in The Rockaways, the decline in closing activity in the immediate aftermath also was a logistic issue brought on by the destruction the storm caused. “I had six houses on the market prior to Sandy and all but one was demolished,” says Robin Shapiro, of Robin Shapiro Realty, a brokerage that specializes in property in Rockaway Park, Belle Harbor and Neponsit.
In Shapiro’s case, closings stalled because the inventory quite literally was destroyed.
“In the immediate aftermath, the area was so up in the air and depressed. I
bank standards for insurance which may have facilitated the ease and speed of their closings after the storm.”
The impact of flood insurance premiums, however, is far different in the outer borough Zone 1 communities, like The Rockaways, Breezy Point, Howard Beach and Coney Island, which are not known for engaging the interest of international buyers as heavily as Manhattan Zones 1 and 2 waterfront areas. In these outer borough communities, “the flood
insurance premiums in the pipeline will have a big impact on the health and development of the area,” says Kevin Boyle, Managing Editor at The Rockaway Wave, referring to the new flood insurance premiums that were passed by federal legislation in July 2013.
In 2012, there were about 35,000 properties in Zones 1 that would be affected by these premiums, but now with the expanded flood zone maps, there are 68,000 all of which will be subject to the premiums. “Even if you can afford those premiums, there’s a good chance your neighbor can’t. And what happens then?,” asks Boyle. “He forecloses? That’s going to affect the value of your property and the whole neighborhood.”
People downtown are aware of the dangers of living on the water and have come to terms with that. In The Rockaways and along the shore, it will be a different story. Those areas were hit really
hard and may suffer in terms of real estate value, but Manhattan is doing incredibly well.
Roy Kim, SVP of Design at Extell and Financial District resident
“ “

A T A L E O F T W O R E C O V E R I E S 11
Closings Volume
Closings volume in Manhattan’s Zones 1 & 2 was largely unaffected by Sandy. These graphs show the changes in closings volume over time in each borough, indexed to 2011 Q4 levels with a value of 100. Immediately after Sandy (2012 Q4), closings volume in coastal zones declined in every borough - but the recovery was far more rapid and dramatic in Manhattan.
thought there would be no business. But in January after the damage was assessed and people were able to decide if they wanted to sell or stay and repair, the market took off again and sales activity resumed.” StreetEasy.com data corroborates Shapiro’s findings. By September of 2013, closing volume is up 31% from the prior year.
Shapiro describes the profile of sellers as “older people who were always thinking of moving and downsizing and who now can’t deal with the repairs. They’re selling their places ‘as-is.’ Because the properties are damaged, they’re being sold at discounted prices and in cash. You can’t get a loan on a house with no utilities.”
Because of the discounted prices, younger residents are selling their
he remains optimistic about the future of real estate in The Rockaways. Although it is a small sampling, StreetEasy.com data confirms his optimism for the real estate market. By September of 2013, closing volume is up again and median asking price is just 1% below levels of the prior year. “If I was a real estate developer, I would be looking here. The new boardwalk is going to bring a lot of commercial and residential activity to the area.” He says, referring to the reconstruction of the boardwalk which is to scheduled to begin before the end of the year and estimated to cost $200 million, “If the boardwalk does half of what the High Line did for Chelsea, I would say the prospects are promising.”
starter homes and now buying larger homes that are now within their budgets. “The prices prior to the storm do not hold now. They are definitely down at least 10% but there is a lot of volume,” comments Shapiro. Her assessments are on par with the data from StreetEasy.com, which records an immediate and intermediate term decline in median asking price in The Rockaways of 14% and 15%, respectively.
“It would be horrible if the prices were declining and there was no interest, but people are definitely interested.”
“There’s an artist and surfer community bringing new energy and appeal to the area.” says Boyle. Despite his concerns about the area and the imminent flood insurance premiums,
ManhattanBrooklynQueensThe BronxStaten Island
Zones 1 & 2
All Other Zones
Sandyoccurs
Sandyoccurs

12 S T R E E T E A S Y
Manhattan Sales Listings
Sales listings data by StreetEasy is based exclusively on Manhattan where data is the
most comprehensive and accurate. Indicators such as inventory, price cuts, number of new listings entering the market, number of delisted listings, and contract activity provide a timely and multi-dimensional view of how the market reacted to and recovered from Sandy. As mentioned previously, analysis of sales listings is broken into three time periods: immediate term (November 2012), the intermediate term (April 2013), and 11 months later (September 2013) and compares these snapshots to the same prior year period.
Immediately following Sandy, there was a 21% decline in inventory in Zones 1 and 2. Contract activity declined by 24% in these flood zones, while contract activity increased 14% in the rest of Manhattan. The number of delisted listings increased by 21% in Flood Zones 1 and 2 but decreased by 8% in the rest of the city. While inventory has been decreasing throughout Manhattan for the last two years, the number of new listings entering the market in November 2012 declined by 28% in Zones 1 and 2, in stark contrast to an 18% decrease in the rest of Manhattan.
according to Chou who had clients hoping to capitalize on a weakened sales market. “Potential buyers came downtown looking for deals, thinking that there would be sellers looking to unload their properties and that Sandy was a once in a lifetime event.” Despite potential buyers’ interest and appetite, “We saw a decline in contract activity in the immediate term because sellers saw potential growth in their property value. They weren’t going to sell at any price they were offered so they held onto their properties and waited it out.”
Cohen echoes Chou’s assessment, adding “Buyers tried to use the storm as leverage and negotiate lower prices, but it didn’t really work.” Although there was a temporary decline in contract volume in Manhattan immediately after Sandy, Cohen cites the increasing strength of the market in the months prior to the storm as driving its fast rebound “The market was really taking off when the storm hit and ultimately the storm didn’t stand in the way of the downtown market. In the long term, there was no way that Sandy dictated the real estate market down here.”
Consistent with the defining real estate trends of the year, there has been far less inventory in Zones 1 and 2 since
By April 2013, six months after the storm, the real estate market appears to have completely rebounded in Manhattan. Zones 1 and 2 were outpacing the rest of the borough in terms of contract activity. There were 28% more contracts in Zones 1 and 2 in April 2013 compared to the prior year, while the rest of the borough had a 24% increase in contract activity. Properties in Zones 1 and 2 were spending 9% fewer days on the market compared to the year before.
By September 2013, median asking price in Zones 1 and 2 rose to $1.45 million, a 4% increase from last year. The median asking price for the rest of Manhattan was $1.095 million, which is a 15% increase from last year but still 32% cheaper than Zones 1 and 2. Contract activity in Zones 1 and 2 increased by 25% compared to a year ago, while the rest of the borough had just a 2% increase in contract activity. Since properties were getting snatched up, there were 35% fewer delisted listings and 20% fewer price cuts in Zones 1 and 2.
Even in the immediate aftermath of the storm, interest in the downtown market continued to be strong
24% immediate decline in contract volume in Zones 1 and 2 (November YoY)
long-term increase in contract activity in Zones 1 and 2 (September YoY)25%
21% immediate decline in inventory in Zones 1 and 2 (November YoY)
$1.45 millionmedian asking price in Zones 1 and 2 in Manhattan in September 2013, a 4% increase YoY
$1.10 millionmedian asking price in all other zones in Manhattan in September 2013, 15% increase YoY
long-term decline in number of delist-ings in Zones 1 and 2 (September YoY)35%
Sales Listings Data (Manhattan-only)
November 2011 November 2012 YoY % Change
April 2012 April 2013 YoY % ChangeAll Others
9,967$925
98258
6021,553
8579%
5.1%
All Others
8,323$999
1,21454
5971,894
5837%
5.6%
All Others
-16%8%
24%-8%-1%22%
-32%--
Sales ListingsMedian Asking Price (in thousands)
ContractsAverage Days on MarketDelistings*New ListingsPrice Cuts% Listings w/ Price CutsAverage Price Cut
September 2012 September 2013 YoY % ChangeAll Others
8,557$950
72162
5741,398
6918%
5.6%
All Others
7,218$1,095
73851
4741,520
5888%
5.5%
All Others
-16%15%
2%-17%-17%
9%-15%
--
Sales ListingsMedian Asking Price (in thousands)
ContractsAverage Days on MarketDelistings*New ListingsPrice Cuts% Listings w/ Price CutsAverage Price Cut
All Others
9,894$899
72162
6951,041
8599%
5.4%
All Others
8,277$985
82261
6428554836%
4.8%
All Others
-16%10%14%-1%-8%
-18%-44%
--
Sales ListingsMedian Asking Price (in thousands)
ContractsAverage Days on MarketDelistings*New ListingsPrice Cuts% Listings w/ Price CutsAverage Price Cut
Zones 1 & 2
1,235$1,265
7077728577
6%4.7%
Zones 1 & 2
975$1,420
5378876127
3%5.3%
Zones 1 & 2
-21%12%
-24%2%
21%-28%-65%
--
Zones 1 & 2
1,051$1,400
577580
13570
7%5.2%
Zones 1 & 2
924$1,450
716652
16856
6%5.5%
Zones 1 & 2
-12%4%
25%-12%-35%24%
-20%--
Zones 1 & 2
-11%8%
28%-9%
-32%45%
-18%--
Zones 1 & 2
1,070$1,400
1256740
19169
6%4.7%
Zones 1 & 2
1,200$1,300
987459
13284
7%4.9%
Immediate Term (November YoY)
Intermediate Term (April YoY)
Long Term (September YoY)
*Delistings are listings that were taken off the market either temporarily or permanently.
A T A L E O F T W O R E C O V E R I E S 13
Source: StreetEasy.com

Immediate Term (November YoY)
Intermediate Term (April YoY)
Long Term(September YoY)
Inventory of homes for sale in coastal Manhattan sharply decreased immediately after Sandy.
While inventory across Manhattan has been on the decline, the number of sales listings in Zones 1 and 2 dropped by 21% in the month after Sandy.
-21% -11% -12%
Manhattan Sales Inventory
The lack of inventory in the immediate aftermath, however, as noted above was not accompanied by a lack of interest in the downtown market. Serhant found buyers aggressive to purchase. “People were desperate for a place to live and would pay any price for what they could get.”
Sandy. That said, there was a significant decline in Zones 1 and 2 immediately after Sandy. Cohen explains this shortage as an isolated trend primarily impacting Zone 1. “Some sellers were scared in the immediate aftermath and were slow to put their properties on the market. This was definitely more true downtown than it was in the rest of the city.”
On top of the initial hesitancy wrought by the storm, Richard Rothbloom, an agent with Brown Harris Stevens, attributes the shortage in inventory to the seasonal slump in the market. “The slump after Sandy coincided with the season. People just don’t put their places on the market in the winter downtown. It’s windy and bitter cold down here in the winter,” Rothbloom describes. “Places don’t sell as well under those conditions. Come spring, it gets better and that’s when we saw people starting to list again.”
We were all expecting the worst: that the uptown market would surge and that the downtown market would suffer. But in the long run, we saw the opposite. The waterviews downtown are a premium people are willing to pay, hurricane or not.
Ryan Serhant, broker at NestSeekers
“
“
14 S T R E E T E A S Y
Manhattan Rental Listings
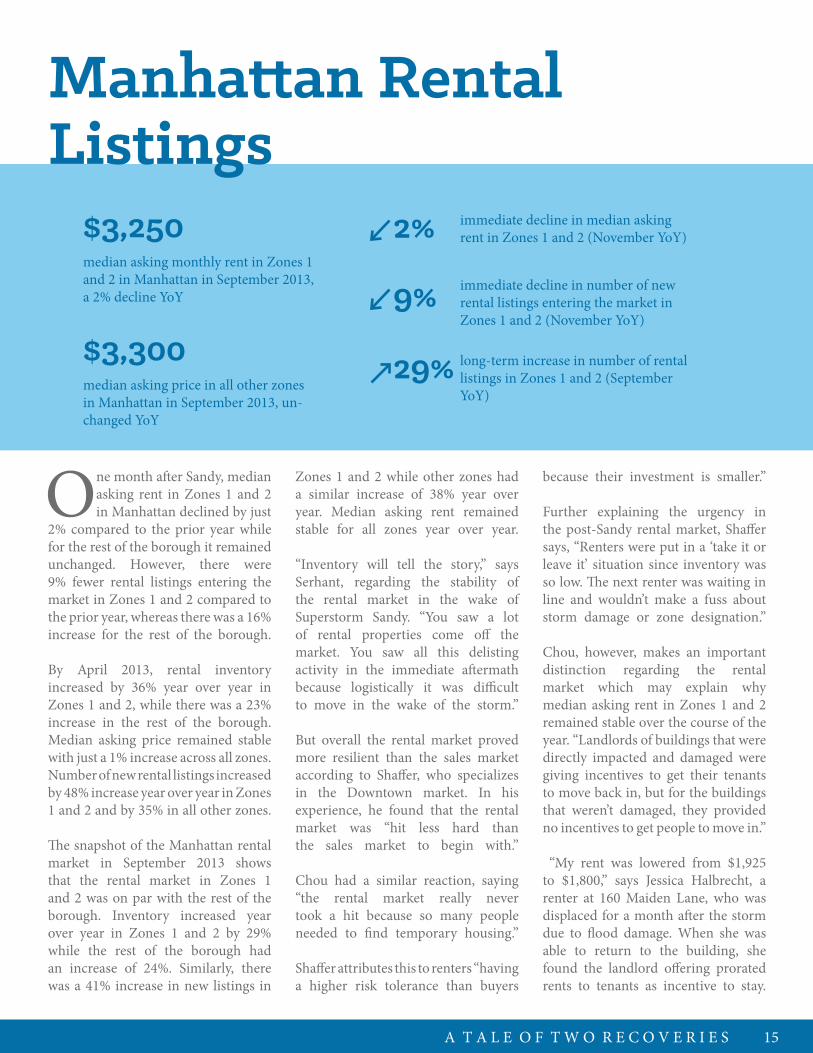
One month after Sandy, median asking rent in Zones 1 and 2 in Manhattan declined by just
2% compared to the prior year while for the rest of the borough it remained unchanged. However, there were 9% fewer rental listings entering the market in Zones 1 and 2 compared to the prior year, whereas there was a 16% increase for the rest of the borough.
By April 2013, rental inventory increased by 36% year over year in Zones 1 and 2, while there was a 23% increase in the rest of the borough. Median asking price remained stable with just a 1% increase across all zones. Number of new rental listings increased by 48% increase year over year in Zones 1 and 2 and by 35% in all other zones.
The snapshot of the Manhattan rental market in September 2013 shows that the rental market in Zones 1 and 2 was on par with the rest of the borough. Inventory increased year over year in Zones 1 and 2 by 29% while the rest of the borough had an increase of 24%. Similarly, there was a 41% increase in new listings in
because their investment is smaller.”
Further explaining the urgency in the post-Sandy rental market, Shaffer says, “Renters were put in a ‘take it or leave it’ situation since inventory was so low. The next renter was waiting in line and wouldn’t make a fuss about storm damage or zone designation.”
Chou, however, makes an important distinction regarding the rental market which may explain why median asking rent in Zones 1 and 2 remained stable over the course of the year. “Landlords of buildings that were directly impacted and damaged were giving incentives to get their tenants to move back in, but for the buildings that weren’t damaged, they provided no incentives to get people to move in.”
“My rent was lowered from $1,925 to $1,800,” says Jessica Halbrecht, a renter at 160 Maiden Lane, who was displaced for a month after the storm due to flood damage. When she was able to return to the building, she found the landlord offering prorated rents to tenants as incentive to stay.
Zones 1 and 2 while other zones had a similar increase of 38% year over year. Median asking rent remained stable for all zones year over year.
“Inventory will tell the story,” says Serhant, regarding the stability of the rental market in the wake of Superstorm Sandy. “You saw a lot of rental properties come off the market. You saw all this delisting activity in the immediate aftermath because logistically it was difficult to move in the wake of the storm.”
But overall the rental market proved more resilient than the sales market according to Shaffer, who specializes in the Downtown market. In his experience, he found that the rental market was “hit less hard than the sales market to begin with.”
Chou had a similar reaction, saying “the rental market really never took a hit because so many people needed to find temporary housing.”
Shaffer attributes this to renters “having a higher risk tolerance than buyers
A T A L E O F T W O R E C O V E R I E S 15
2% immediate decline in median asking rent in Zones 1 and 2 (November YoY)
long-term increase in number of rental listings in Zones 1 and 2 (September YoY)
29%
9% immediate decline in number of new rental listings entering the market in Zones 1 and 2 (November YoY)
$3,250median asking monthly rent in Zones 1 and 2 in Manhattan in September 2013, a 2% decline YoY
$3,300median asking price in all other zones in Manhattan in September 2013, un-changed YoY

S T R E E T E A S Y16
Rental Listings Data (Manhattan-only)
Source: StreetEasy.com
November 2011 November 2012 YoY % ChangeAll Others
9,486$3,250
3,576
All Others
11,299$3,250
4,158
Rental ListingsMedian Asking RentNew Listings
Zones 1 & 2
1,373$3,298
494
Zones 1 & 2
1,522$3,248
449
Zones 1 & 2
11%-2%-9%
Immediate Term (November YoY)
All Others
19%0%
16%
April 2012 April 2013 YoY % ChangeAll Others
11,836$3,150$4,503
All Others
14,056$3,195
6,097
Rental ListingsMedian Asking RentNew Listings
Zones 1 & 2
1,513$3,174
523
Zones 1 & 2
2,058$3,200
776
Zones 1 & 2
36%1%
48%
Intermediate Term (April YoY)
All Others
23%1%
35%
September 2012 September 2013 YoY % ChangeAll Others
11,667$3,295
4,330
All Others
14,420$3,300
5,966
Rental ListingsMedian Asking RentNew Listings
Zones 1 & 2
1,570$3,300
584
Zones 1 & 2
2,024$3,250
821
Zones 1 & 2
29%-2%41%
Intermediate Term (September YoY)
All Others
24%0%
38%
A T A L E O F T W O R E C O V E R I E S 17
These offers lasted for as long as the building was not fully operational.
But according to Shaffer, renters looking to move into the area or sign new leases “saw no huge advantage in the immediate aftermath of the storm and didn’t have any new leverage in terms of negotiation and availability.” Serhant echoes Shaffer’s observation, saying that “a lot of people were coming downtown and attempting to haggle for lower rents in the immediate aftermath, citing the storm and the zone and the damage, and landlords didn’t want to deal with that.”
In Shaffer’s opinion, “it was the landlords, if anyone, who had the upper hand because people were scrambling to find housing in the wake of the storm.”
But in the intermediate term, some tenants found they had both the incentive and interest in staying. Halbrecht considered moving when her lease was up last spring, based on the fact that a storm like Sandy could happen again, but was too crunched for time. “When I re-signed the lease in the spring I was able to negotiate keeping the lowered rental price,” Halbrecht says regarding the
rent cut her landlord offered when she returned to 190 Maiden Lane.
Betty Huang, a resident of 22 River Terrace in Battery Park City, weathered the storm with her husband, but cited other reasons for staying in the area. Although she is considering moving soon, she and her family plan to stay nearby. The amenities mix, park space and access to water makes Battery Park City a unique enclave in the city. On top of that, the prices at Battery City Park are affordable in large part due to the land lease arrangement. With both of her children currently enrolled at PS 89 in Tribeca, Huang maintains that the storm is not a reason to uproot from the area. For Huang, school zone designation is more important than flood zone designation.
“If you lived downtown, you were going to look for a rental to stay downtown,” confirms Serhant. For the long term and future of Manhattan’s Zones 1 and 2, he is confident, “no storm is going to convince a long term downtown resident to move to the Upper West Side.”
Renters were put in a take it or leave it situation since we
inventory was so low. The next renter was waiting in line and
wouldn’t make a fuss about storm damage or zone designation.
Evan Shaffer, broker at Douglas Elliman broker
“
“