A Tale of Two Crises: The Betas of EU...
9
A Tale of Two Crises: The Betas of EU Networks Copyright © 2013 The Brattle Group, Inc. The views expressed in this paper are strictly those of the authors and do not necessarily state or reflect the views of The Brattle Group, Inc. or its clients. August 2013 By Dan Harris and Francesco Lo Passo Introduction European capital markets have experienced two major upheavals in the past five years. The financial crisis came first in 2009, resulting in depressed economies worldwide. This was followed by a European sovereign debt crisis, which has manifested itself to various degrees. Both crises have affected the cost of capital for European energy network companies, although in very different ways. Since tariffs depend on the estimated cost of capital, the way in which regulators account for these recent crises will be critical during upcoming regulatory price controls. In this discussion paper, we assess the implications of recent market turbulence on the cost of capital for European network firms, and, in particular, their betas, which measure the relationship between the market index and a firm’s share price. Summary Almost all European Union (EU) energy networks have a revenue guarantee — a shortfall in forecast revenues in one year can be made up the following year. Hence, the large decrease in gas and power demand experienced in 2009 had relatively little effect on the share price of network firms. As the stock indices plunged, the share prices of the European networks held up well. This ‘disconnect’ resulted in a sharp decrease in betas for EU network firms. The effect of the Eurozone sovereign debt crisis has been quite different, however. Even with a revenue guarantee, investors in EU networks are exposed to the risk of default by a Eurozone member, with its associated risk of Eurozone exit. As a result, between 2010 and 2013 networks in countries badly affected by the Eurozone crisis have seen their betas increase sharply. These events have several implications for how EU regulators estimate betas in the context of revenues controls. When setting tariffs, regulators are making a forecast of the network’s future beta. The financial crisis has passed into history — a similar crisis is unlikely to occur again in the next regulatory period, and so regulators should avoid using data from the 2008- 2009 period to estimate the future beta. However for several countries the Eurozone crisis has not passed — sovereign spreads remain volatile. This means that for countries that are still affected by the sovereign debt crisis, regulators should only use data from the last two to three years when estimating beta. Using data that includes the 2008-2009 period will likely under estimate beta for networks in countries such as Italy, Spain and Portugal that continue to be affected by the sovereign debt crisis. This would lead to an underestimate of the true cost of capital, and result in tariffs that are too low to support investment. Regulators in countries that are not heavily exposed to the Eurozone crisis should be careful about using data from networks in countries that have more exposure. Using such data could overestimate beta for networks in countries with less exposure to the Eurozone crisis. DISCUSSION PAPER Contents Introduction Section 1 The Cost of Capital and Beta..2 Section 2 The Financial Crises.............2 Section 3 The Eurozone Crisis - A New Risk.............................. 4 Lessons Learnt The Brattle Group provides consulting and expert testi- mony in economics, finance and regulation to corporations, law firms and governments around the world. We have offices in London, Madrid and Rome. We also have offices in Cambridge, MA; New York, NY; San Francisco, CA; and Washington, DC. For more information, please visit www.brattle.com.
Transcript of A Tale of Two Crises: The Betas of EU...

A Tale of Two Crises: The Betas of EU Networks
Copyright © 2013 The Brattle Group, Inc.
The views expressed in this paper are strictly those of the authors and do not necessarily state or reflect the views of The Brattle Group, Inc. or its clients.
August 2013
By Dan Harris and Francesco Lo Passo
IntroductionEuropean capital markets have experienced two major upheavals in the past five years. The financial crisis came first in 2009, resulting in depressed economies worldwide. This was followed by a European sovereign debt crisis, which has manifested itself to various degrees. Both crises have affected the cost of capital for European energy network companies, although in very different ways.
Since tariffs depend on the estimated cost of capital, the way in which regulators account for these recent crises will be critical during upcoming regulatory price controls. In this discussion paper, we assess the implications of recent market turbulence on the cost of capital for European network firms, and, in particular, their betas, which measure the relationship between the market index and a firm’s share price.
SummaryAlmost all European Union (EU) energy networks have a revenue guarantee — a shortfall in forecast revenues in one year can be made up the following year. Hence, the large decrease in gas and power demand experienced in 2009 had relatively little effect on the share price of network firms. As the stock indices plunged, the share prices of the European networks held up well. This ‘disconnect’ resulted in a sharp decrease in betas for EU network firms.
The effect of the Eurozone sovereign debt crisis has been quite different, however. Even with a revenue guarantee, investors in EU networks are exposed to the risk of default by a Eurozone member, with its associated risk of Eurozone exit. As a result, between 2010 and 2013 networks in countries badly affected by the Eurozone crisis have seen their betas increase sharply.
These events have several implications for how EU regulators estimate betas in the context of revenues controls. When setting tariffs, regulators are making a forecast of the network’s future beta. The financial crisis has passed into history — a similar crisis is unlikely to occur again in the next regulatory period, and so regulators should avoid using data from the 2008-2009 period to estimate the future beta.
However for several countries the Eurozone crisis has not passed — sovereign spreads remain volatile. This means that for countries that are still affected by the sovereign debt crisis, regulators should only use data from the last two to three years when estimating beta. Using data that includes the 2008-2009 period will likely under estimate beta for networks in countries such as Italy, Spain and Portugal that continue to be affected by the sovereign debt crisis. This would lead to an underestimate of the true cost of capital, and result in tariffs that are too low to support investment.
Regulators in countries that are not heavily exposed to the Eurozone crisis should be careful about using data from networks in countries that have more exposure. Using such data could overestimate beta for networks in countries with less exposure to the Eurozone crisis.
DISCUSSION PAPER
Contents
Introduction
Section 1The Cost of Capital and Beta..2
Section 2The Financial Crises.............2
Section 3The Eurozone Crisis - A New Risk..............................4
Lessons Learnt
The Brattle Group provides consulting and expert testi-mony in economics, finance and regulation to corporations, law firms and governments around the world.
We have offices in London, Madrid and Rome. We also have offices in Cambridge, MA; New York, NY; San Francisco, CA; and Washington, DC. For more information, please visit www.brattle.com.
Page 2
DISCUSSION PAPER A Tale of Two Crises: The Betas of EU Networks
August 2013
Section 1 THE COST OF CAPITAL AND BETA
In the context of revenue controls, most regulators in Europe estimate the cost of equity using the Capital Asset Pricing Model (CAPM), summarised below. One of the key inputs in the CAPM is a firm’s ‘beta.’ Beta reflects the systematic risk of the firm that shareholders cannot diversify by holding stocks in many different projects of the same sort. A beta of 1.0 means that on average the firm’s share price moves in line with the ‘market’; the latter is usually measured by a stock index such as the S&P 500 or the FTSE All World index. A beta of less than 1.0 means that when the market declines the firm’s share price will fall by less than the market index. Accordingly, a lower beta indicates less risk, and hence investors demand a lower return on equity.
CAPM=rf + βequity x (Erm - rf )
Where rf is the risk-free rate, βequity is the systematic risk of the company and Erm is the total return of the market. The term (Erm - rf ) is known as the market risk premium (MRP).
A firm’s beta is usually estimated by comparing movements in the firm’s stock price against movements in the market index. When regulators need to estimate the cost of equity for a network that is not listed (and has no public share price), they often use a sample of listed networks that are comparable to the unlisted network.
Section 2 THE FINANCIAL CRISIS
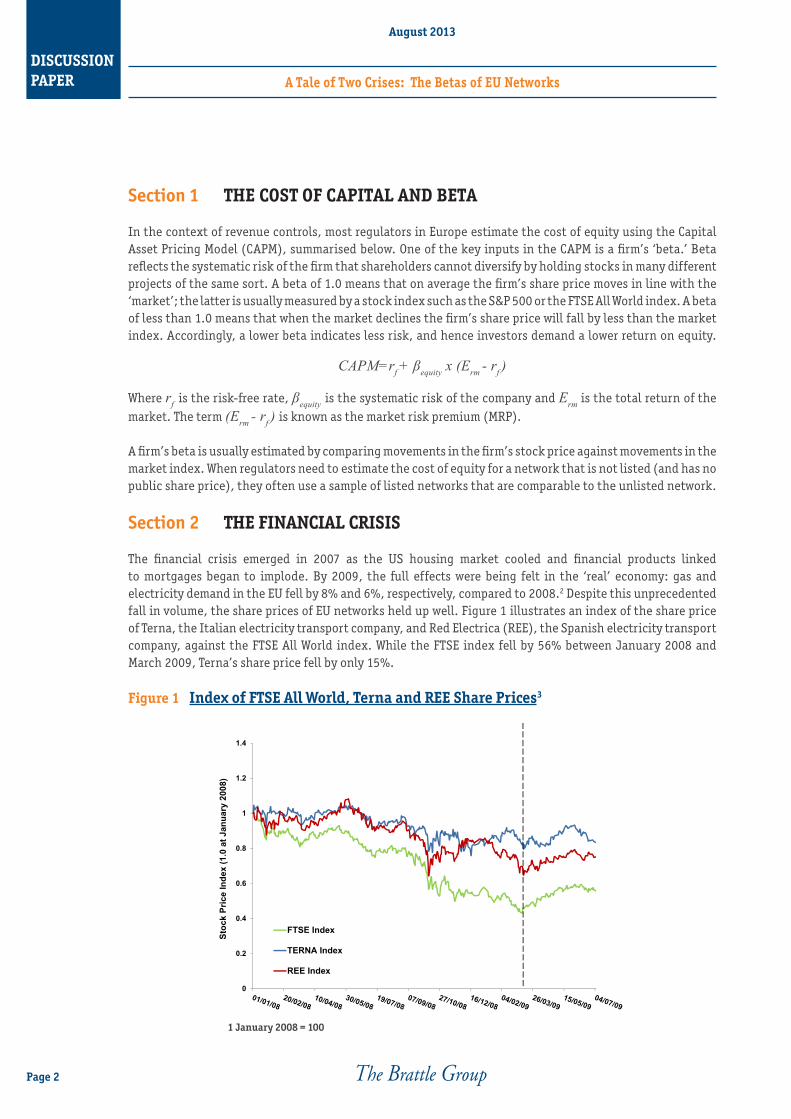
The financial crisis emerged in 2007 as the US housing market cooled and financial products linked to mortgages began to implode. By 2009, the full effects were being felt in the ‘real’ economy: gas and electricity demand in the EU fell by 8% and 6%, respectively, compared to 2008.2 Despite this unprecedented fall in volume, the share prices of EU networks held up well. Figure 1 illustrates an index of the share price of Terna, the Italian electricity transport company, and Red Electrica (REE), the Spanish electricity transport company, against the FTSE All World index. While the FTSE index fell by 56% between January 2008 and March 2009, Terna’s share price fell by only 15%.
Figure 1 Index of FTSE All World, Terna and REE Share Prices3
0
0.2
0.4
0.6
0.8
1
1.2
1.4
Stoc
k Pr
ice
Inde
x (1
.0 a
t Jan
uary
200
8)
FTSE Index
TERNA Index
REE Index
1 January 2008 = 100

DISCUSSION PAPER A Tale of Two Crises: The Betas of EU Networks
August 2013
Page 3
Part of the reason for the modest reaction of the EU network’s share prices to the financial crisis is that the networks have a revenue guarantee. Reduced volumes of gas and electricity lowered network revenues in 2009, but regulators would have allowed them to increase their tariffs to make up for the short fall, either in the next year or in the next regulatory period. Similarly, costs associated with increased rates of customer default could also be covered by future tariff increases.4 Investors realised that these revenue guarantees meant that the EU networks had relatively little exposure to the financial crisis, and so share prices held up well. Since the share prices of the EU networks fell by less than the market index, their betas decreased.
Figure 2 illustrates the rolling two-year daily equity beta for Terna, Enagas and REE from 1 January 2008 to 31 June 2009 — the peak of the financial crisis. Terna’s beta generally declines throughout this period. The betas of REE and Enagas jump as their shares fall with the market as it crashes on news of Lehman Brothers’ collapse. But after this initial shock, investors seem to realise that the networks have less exposure to the financial crisis than other businesses, and their betas fall below pre-crisis levels.
Figure 2 Rolling Two-Year Equity Beta5
The effect on Terna is confirmed by analyst reports issued during the financial crisis:
“A recent AEEG resolution on the mitigation of the volume effects on Terna’s revenues has further improved the defensiveness and visibility of the company’s earnings profile. The new mechanism will offset any impact on the grid’s fee revenues until 2011 for changes in transmission volumes exceeding by 0.5% the assumptions set up by the regulator for the yearly tariff. This is valuable support from the regulator, given the widespread concerns on the weakness of the economic cycle over the next few years”6
“Terna remains one of the most defensive names in the sector, in our view, given its mostly regulated cash flow. The company enjoys moderate growth supported by a stable regulatory framework ...”7
“Terna’s revenues/earnings profile is highly visible and safe. Prospects for Italian tariffs have been further improved thanks to recent resolutions granting a mitigation of the volume effect and the remuneration of work in work in progress.”8
0
0.1
0.2
0.3
0.4
0.5
0.6
0.7
0.8
0.9 REE
ENAGAS
TERNA
DISCUSSION PAPER A Tale of Two Crises: The Betas of EU Networks
August 2013
Page 4
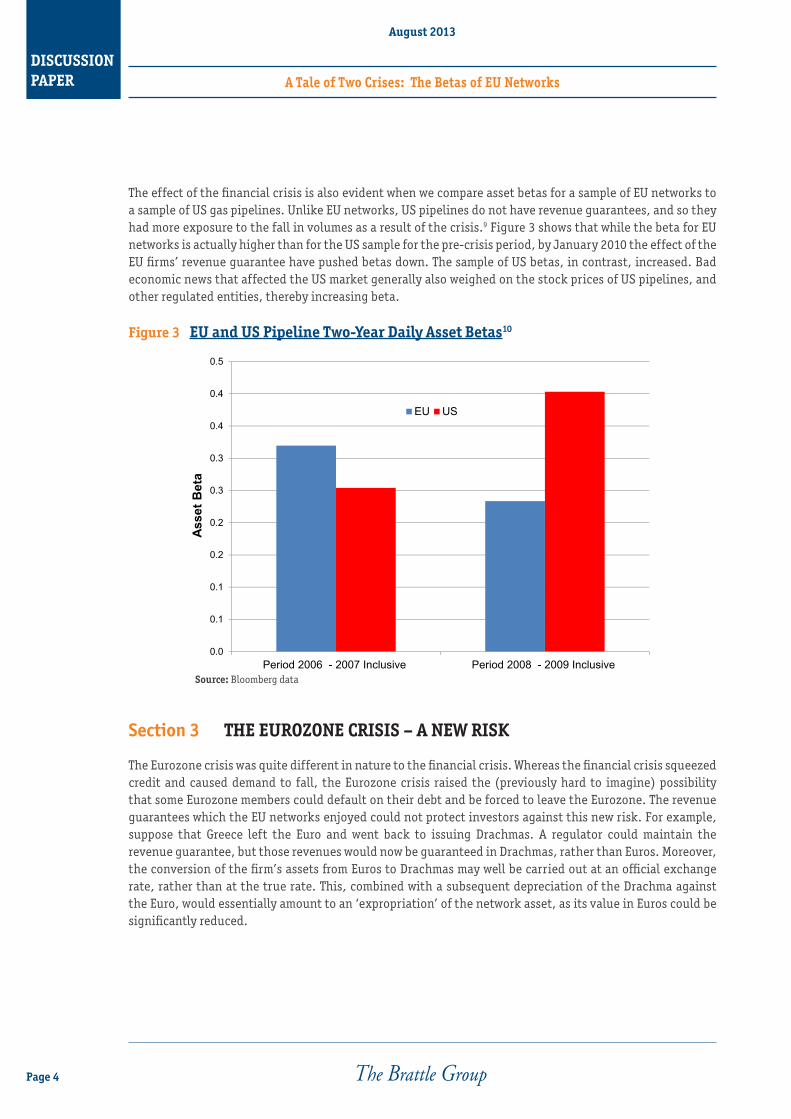
The effect of the financial crisis is also evident when we compare asset betas for a sample of EU networks to a sample of US gas pipelines. Unlike EU networks, US pipelines do not have revenue guarantees, and so they had more exposure to the fall in volumes as a result of the crisis.9 Figure 3 shows that while the beta for EU networks is actually higher than for the US sample for the pre-crisis period, by January 2010 the effect of the EU firms’ revenue guarantee have pushed betas down. The sample of US betas, in contrast, increased. Bad economic news that affected the US market generally also weighed on the stock prices of US pipelines, and other regulated entities, thereby increasing beta.
Figure 3 EU and US Pipeline Two-Year Daily Asset Betas10
Section 3 THE EUROZONE CRISIS – A NEW RISK
The Eurozone crisis was quite different in nature to the financial crisis. Whereas the financial crisis squeezed credit and caused demand to fall, the Eurozone crisis raised the (previously hard to imagine) possibility that some Eurozone members could default on their debt and be forced to leave the Eurozone. The revenue guarantees which the EU networks enjoyed could not protect investors against this new risk. For example, suppose that Greece left the Euro and went back to issuing Drachmas. A regulator could maintain the revenue guarantee, but those revenues would now be guaranteed in Drachmas, rather than Euros. Moreover, the conversion of the firm’s assets from Euros to Drachmas may well be carried out at an official exchange rate, rather than at the true rate. This, combined with a subsequent depreciation of the Drachma against the Euro, would essentially amount to an ‘expropriation’ of the network asset, as its value in Euros could be significantly reduced.
0.0
0.1
0.1
0.2
0.2
0.3
0.3
0.4
0.4
0.5
Period 2006 - 2007 Inclusive Period 2008 - 2009 Inclusive
Asse
t Bet
a
EU US
Source: Bloomberg data

DISCUSSION PAPER A Tale of Two Crises: The Betas of EU Networks
August 2013
Page 5
This is confirmed by analyst reports issued on REE and Enagas during the sovereign bond crisis in Spain:
“Looking at the price performance of Enagas and Red Electrica in 2010, the shares reached a year high in early April (unlike all other Spanish utilities, which peaked in January), before the sell-off of Spanish equities linked to sovereign bond crisis, which led to a selloff of Enagas and Red Electrica. This suggests that the market was, at least initially, more worried about the macro outlook and its implications for Enagas and Red Electrica, rather than about specific regulatory developments.”11
The exposure of the EU networks to the Eurozone crisis was soon reflected in the betas. Figure 4 shows the two-year rolling beta for Terna, against the ‘spread’ on Italian government debt, which we use to measure the extent and timing of the Eurozone crisis. The Italian spread had already increased as the crisis unfolded in Greece, but the sharp upward increase in May 2010 marked the point at which the Eurozone crisis began to ‘contaminate’ Italy. Six months later, as the Italian spread jumped above 5%, Terna’s two-year equity beta started to increase dramatically. Terna’s investors started to give greater weight to the risk of an Italian default and a possible return to the Lira, and Terna’s beta increased during the following months. This meant that bad news regarding Italy’s sovereign debt obligations not only affected the market index, but also has a large effect on Terna’s share price.
Figure 4 Terna Rolling Two-Year Equity Beta vs. Spread of Italian 10-Year Bonds Over 10-Year German Bonds12
Figure 5 illustrates that the betas of networks in other countries that were similarly exposed to the Eurozone crisis — for example Spain — showed a similar trend of an increasing beta as the Eurozone crisis unfolded. Equally, networks that have little exposure to the Eurozone crisis showed a stable, or even decreasing, beta. For example, the beta of the Great Britain (GB) network, National Grid, showed a sharp decrease in its beta at the same time as Spanish and Italian firms demonstrate an increase. The likely reason is that while the Eurozone crisis depressed the market index, GB is not in the Eurozone and so there is no risk that National Grid’s investors can suddenly find that they are holding an asset priced in Drachmas or Lira. Moreover, National Grid derives around 56% of its revenues from the US, which provides further insulation from the Eurozone crisis.13
0.00%
1.00%
2.00%
3.00%
4.00%
5.00%
6.00%
0.00
0.10
0.20
0.30
0.40
0.50
0.60
0.70
10-y
ear b
onds
spr
ead
(Ital
y vs
.Ger
man
y)
Rol
ling
Bet
as
TERNA Spread

DISCUSSION PAPER A Tale of Two Crises: The Betas of EU Networks
August 2013
Page 6
Figure 5 Rolling Two-Year Equity Betas of Terna, Enagas, REE and National Grid14
Lessons Learnt
Theoretically, betas measure only systematic risk or non-diversifiable risk; however, the figures and logic above highlight that the measured betas of gas and electricity networks reflect exposure to many factors, including regulatory risk, revenue and volume risks, and risk of ‘expropriation’ via devaluation. As we illustrate schematically in Figure 6, each risk will have its own correlation with the market, and the beta reflects investors’ views on the probability weighted average of all these risks. As circumstances change, some risks assume a much greater significance than in the past, and hence play much a more decisive role in determining beta. Accordingly, the firm’s beta changes over time as different risks come to dominate.
Figure 6 Impact of Different Risks on the Estimated Beta
0
0.1
0.2
0.3
0.4
0.5
0.6
0.7
0.8
0.9
REE
ENAGAS
TERNA
NG
Surprise drop in GDP Increase in sovereign debtspread
Price
Time
Network share price
Market index
Price
Time
Network share price
Market index
LOW HIGH
Share pricemovement
News
Effecton Beta

DISCUSSION PAPER A Tale of Two Crises: The Betas of EU Networks
August 2013
Page 7
As regulators come to estimate the cost of capital for networks, what are the implications from the events of the last few years? First, we should remember that the regulator is making a forecast of the network’s cost of capital, including the beta. Betas have usually been estimated using historical data on the assumption that the past is the best guide to the future, but with the turbulent past we have experienced recently, we must be careful in applying this assumption.
In particular, it seems unlikely that there will be another financial crisis in the next four to five years — the length of a typical regulator period. Hence, regulators should avoid using data from this period when estimating a forward looking beta, or at least should give the data a much lower weighting, proportionate to the chance of another financial crisis in the next regulatory period.
In contrast, for several countries the sovereign debt crisis is not yet resolved. Italy’s spread in June 2013 was at 2.74%, 1.01 percentage points above the average spread of 1.73% for the period 2005 to 2007, inclusive. Similarly, Spain’s spread remains above pre-crisis levels. For networks in these countries, the experience of the last two to three years will likely provide a reasonable estimate of the future beta, as the share prices of networks remain sensitive to news regarding the ability of the economy to sustain sovereign debt.
Finally, regulators should be wary about using the betas of networks in countries that had different Eurozone crisis exposure than their own country. Logically, such risk can best be measured by comparing the spreads over German bonds for the two countries over a period similar to the regulatory period. It could give misleading results to use the benchmark of a network in a country with a 3% spread for a network in a country with a spread of only 0.5%. Such comparisons are likely to over or underestimate the true beta of the network.
Endnotes1 The events we discuss have also affected the Market Risk Premium; however, we leave the discussion of this effect for another day.2 BP, p.l.c., BP Statistical Review of World Energy 2013, pages 23 and 40. 3 Analysis on Bloomberg data.4 Clearly, networks cannot raise prices without limit, since this would lead to further reductions in energy demand and customer defaults; however,
for many customers the demand for network services is relatively insensitive to prices, and so networks can usually count on recovering revenue shortfalls by increasing prices.
5 Analysis on Bloomberg data. 6 Kepler Capital Markets, Borsa Italiana, 22 January 2009.7 Merril Lynch report, Borsa Italiana, 1 April 2009.8 Kepler Capital Markets, Borsa Italiana, 1 April 2009.9 We note that US pipelines are not generally helpless in the face of falling volumes. While US firms do not have revenue guarantees, they can bring
a ‘rate case’ and apply to increase their tariffs if volumes fall unexpectedly, up to a point. Moreover, in the US, for some pipelines the reduction in gas volumes transported resulting from the financial crisis would have been partly or fully offset by the effect of falling gas prices and increased gas transport in some areas as a result of new shale gas production.
10 EU firms in the sample are REN, Elia, National Grid, Terna, SRG, Enagas and REE. US firms are TC Pipelines, Boardwalk Pipeline Partners and Spectra Energy Partners. Equity betas are sourced from Bloomberg, and re-levered as asset betas using debt and equity data supplied by Bloomberg. Note that in this example we use the Bloomberg betas as a consistent basis for comparing the US and EU. We do not endorse the absolute beta values Bloomberg produces. Absolute betas will depend on the sample of firms, the time horizon, choice of index, and statistical corrections and adjustments made.
11 Goldman Sachs,“Regulatory review: Spanish regulatory risk overdone; Italian risks overlooked,” Borsa Italiana, 14 September 2010. 12 Analysis on Bloomberg data.13 National Grid’s Annual Report 2012. 14 Analysis on Bloomberg data.15 “Long-term interest rates,” European Central Bank National Statistics.

DISCUSSION PAPER A Tale of Two Crises: The Betas of EU Networks
August 2013
Page 8
About the Authors
Mr Harris is an expert in the economics of gas and electricity markets around the world. He has been involved in client engagements across the full spectrum of the industry and his clients include energy regulators, competition authorities, gas and electricity network companies, gas buyers and sellers and electricity generators. He has contributed key analyses to some of the largest proposed energy mergers of recent times, assisted in estimating damages for several international arbitrations and advised on cost of capital issues in regulatory proceedings.
Mr Harris received his M.Sc. in Economics from the London School of Economics.
Dan HarrisPrincipal
Phone: +39.06.48.888.146Email: [email protected]
Francesco Lo PassoPrincipal
Phone: +39.06.48.888.10Email: [email protected]
Dr Lo Passo specializes in the application of regulatory economic principles to energy, transportation, telecommunications and other businesses in Italy and throughout the world. Formerly a Member of the Council of Experts for the Italian Treasury and a Senior Advisor on energy to the Italian Ministry of Foreign Affairs, he has broad experience in global privatization processes. He has had worked on behalf of leading companies, investment banks, infrastructure funds and institutional bodies in major European countries, Turkey, South Africa and India. Dr Lo Passo received his Ph.D. and M.A. in Economics from the University of Chicago and his J.D. from the Università di Torino, Italy.

Cambridge New York San Francisco Washington London Madrid Rome
www.brattle.com
ECONOMIC AND FINANCIAL EXPERTS