A Tale of Disproportionate Burden: The special -
28
BRIDGEPORT, HARTFORD, NEW HAVEN, & WATERBURY A TALE OF DISPROPORTIONATE BURDEN: The special needs of Connecticut’s poorer cities October 2010 CCM CANDIDATE BULLETIN
Transcript of A Tale of Disproportionate Burden: The special -
BRIDGEPORT, HARTFORD, NEW HAVEN, &WATERBURY
A TALE OF DISPROPORTIONATE BURDEN: The specialneeds of Connecticut’spoorer cities
October 2010
CCM CANDIDATE BULLETIN

A Tale of Disproportionate Burden:The special needs of Connecticut’s poorer cities
Bridgeport, Hartford, New Haven, & Waterbury
October 2010
©October 2010 Connecticut Conference of Municipalities
900 Chapel Street, 9th Floor, New Haven, Connecticut 06510-2807
Phone: (203) 498-3000 • Fax: (203) 562-6314
E-mail: [email protected] • Web site: www.ccm-ct.org
© 2010 Connecticut Conference of Municipalities
All Rights Reserved. This publication or any part thereof may not be reproduced, transmitted, or stored in any type of retrieval system
by any means, electronic or mechanical, without prior written consent of the Connecticut Conference of Municipalities (CCM).
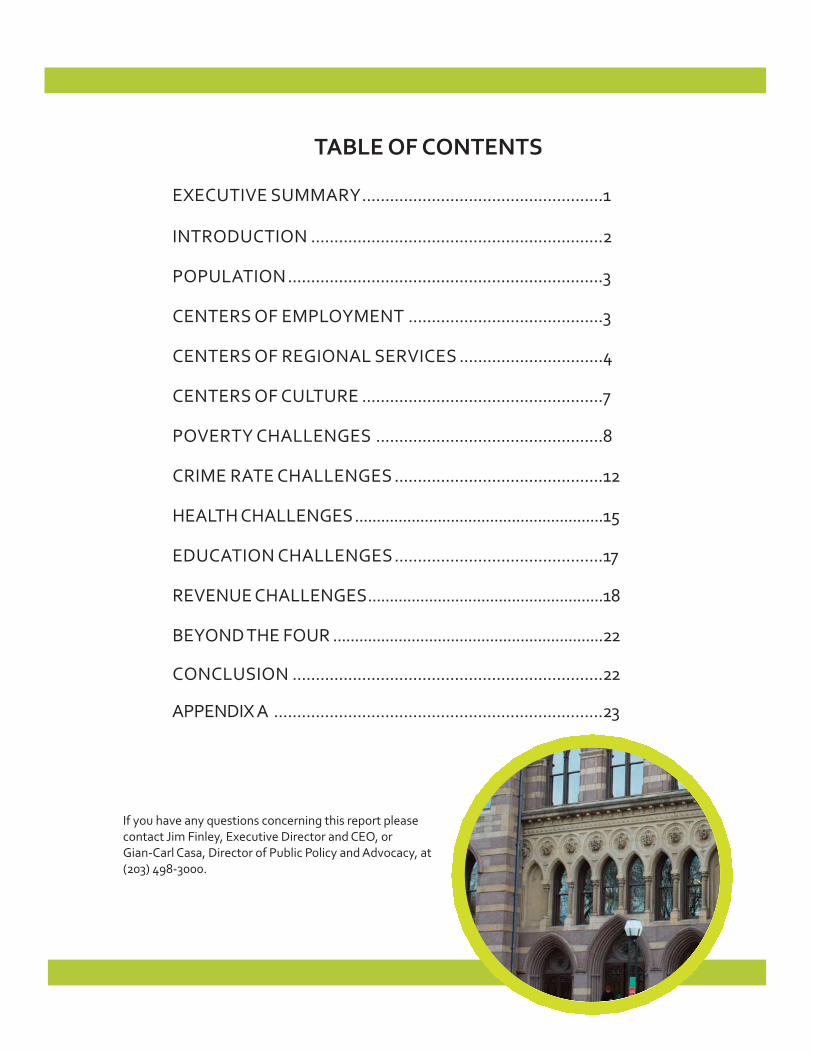
TABLE OF CONTENTS
EXECUTIVE SUMMARY....................................................1
INTRODUCTION ...............................................................2
POPULATION....................................................................3
CENTERS OF EMPLOYMENT ..........................................3
CENTERS OF REGIONAL SERVICES ...............................4
CENTERS OF CULTURE ....................................................7
POVERTY CHALLENGES .................................................8
CRIME RATE CHALLENGES .............................................12
HEALTH CHALLENGES.........................................................15
EDUCATION CHALLENGES.............................................17
REVENUE CHALLENGES......................................................18
BEYOND THE FOUR ..............................................................22
CONCLUSION ...................................................................22
APPENDIX A .......................................................................23
If you have any questions concerning this report pleasecontact Jim Finley, Executive Director and CEO, or GianCarl Casa, Director of Public Policy and Advocacy, at(203) 4983000.

Connecticut’s large cities are regional hubs for jobs, healthcare and culture. They are also among the poorest in thenation. They face enormous challenges in social services, education, public safety, and revenues:
• The poverty rates in Bridgeport, Hartford, New Haven, and Waterbury are at least twice as high as the rate for the state as a whole.
• They have more than half of Connecticut’s homeless.
• These cities experience much higher unemployment rates (Hartford - 16.9%, Waterbury - 14.5%, Bridgeport - 14.0%, New Haven - 13.4%) than the state average (9.3%).
• While 30.3 percent of Connecticut’s K-12 students are eligible for free/reduced-price meals, over 90 percent are eligible in both Bridgeport and Hartford. In New Haven, 73.4 percent of students are eligible, and in Waterbury, 74.7 percent are eligible.
• In Connecticut, 5.2 percent of students learn English as a second language. Those numbers are significantly higher in the state’s poorer cities: 14.4 percent in Hartford; 13.4 percent in Bridgeport; 12.6 percent in New Haven; and 11.4 percent in Waterbury.
• The crime rate for the state as a whole is 2,981 per 100,000 residents. That figure is 10,114 in Hartford, 7,964 in New Haven, 6,379 in Waterbury, and 5,435 in Bridgeport.
• These four cities have higher equalized mill rates than the state average (Connecticut mill rate - 14.13, Hartford - 39.42, New Haven - 29.18, Waterbury - 24.35, and Bridgeport - 18.78).
These cities are also the hubs of major population areas. They provide everything from employment to health care toarts and culture.
• Bridgeport, Hartford, New Haven, and Waterbury contain 14 percent of the state’s population.
• Almost 100,000 people commute into these cities for employment.
• Bridgeport and Hartford account for over 40 percent of their respective county’s hospital beds. New Haven and Waterbury together account for 86 percent of the hospital beds in New Haven County.
• These cities provide 12 percent of all retail food and, beverage sales tax revenues ($30.5 million).
The health of our central cities, their surrounding suburbs, and the state are linked. Despite tough fiscal times, stategovernment has a moral and economic imperative to provide increased assistance to Bridgeport, Hartford, New Haven,and Waterbury. Strong cities will yield statewide benefits for years to come. As go these cities, so goes Connecticut.
1 CCM PUBLIC POLICY REPORT • A TALE OF DISPROPORTIONATE BURDEN: BRIDGEPORT, HARTFORD, NEW HAVEN, & WATERBURY
EXECUTIVESUMMARY
A TALE OF DISPROPORTIONATE BURDEN: BRIDGEPORT, HARTFORD, NEW HAVEN, & WATERBURY • CCM PUBLIC POLICY REPORT 2
INTRODUCTION
Bridgeport, Hartford, New Haven, and Waterbury are four of Connecticut’s largest cities. These cities are regional hubs for jobs,health care, and culture. In the state with the nation’s highest per capita income, they are also among the poorest cities in theUnited States. These four communities bear a disproportionate burden when it comes to paying for and providing services toConnecticut’s neediest residents. This report provides statistics that demonstrate this burden.
It’s clear that if these cities fail, the suburbs around them will also founder. People won’t move their families or businesses toregions without a cultural and work base, and these bases can’t be spread out among 15-20 towns. Only a strong central city canprovide these anchors. If the central city isn’t viable, the only alternative for economic growth will be areas that haven’t yet beendeveloped, devouring Connecticut’s green space and agricultural communities.
All of Connecticut has a stake in the vitality of Bridgeport, Hartford, New Haven, and Waterbury.
POPULATIONFourteen percent (491,882 residents) of Connecticut’s population resides within these four communities. These citieshave very high population densities (Bridgeport: 8,525.3 per square mile; Hartford: 7,167.1 per square mile; New Haven:6,560.7 per square mile; Waterbury: 3,746.5 per square mile) compared to the State average of 722.7 people per square mile.
Population Percent of State's PopulationConnecticut 3,518,288Bridgeport 137,304 3.90%Hartford 124,063 3.53New Haven 123,314 3.50%Waterbury 107,141 3.05%S
Source: U.S. Census Bureau, 2009 American Community Survey

3 CCM PUBLIC POLICY REPORT • A TALE OF DISPROPORTIONATE BURDEN: BRIDGEPORT, HARTFORD, NEW HAVEN, & WATERBURY
A TALE OF DISPROPORTIONATE
BURDEN
1Reference USA: www.referenceusa.com, 2010 data.
722.9
8,525.3
7,167.16,560.7
3,746.5
0
1,000
2,000
3,000
4,000
5,000
6,000
7,000
8,000
9,000
Connecticut Bridgeport Hartford New Haven Waterbury
Population Density per Square Mile
Source: Connecticut Office of Policy and Management, Municipal Fiscal Indicators, 2004 2008
CENTERS OF EMPLOYMENTClose to 100,000 Connecticut residents commute daily to Bridgeport, Hartford, New Haven, and Waterbury fortheir employment. This figure does not include the 79,443 residents of these four cities that also work in theirhometown. Bridgeport, Hartford, New Haven, and Waterbury are home to 27,985 businesses of different shapesand sizes (New Haven: 8,983; Hartford: 8,602; Bridgeport: 5,527; Waterbury: 4,873).1
Number of Commutersinto Bridgeport from:
Number of Commutersinto Hartford from:
Number of Commutersinto New Haven from:
Number of Commuters intoWaterbury from:
Stratford 3,997 West Hartford 8,116 Hamden 7,829 Watertown 2,385
Shelton 2,563 Manchester 5,200 West Haven 5,364 Naugatuck 2,162
Trumbull 2,288 East Hartford 4,859 Branford 3,701 Wolcott 1,978
Fairfield 2,244 Wethersfield 3,576 East Haven 3,577 Cheshire 1,105
Milford 2,115 Windsor 3,493 North Haven 2,864 New Haven 1,075
Monroe 1,180 Newington 3,342 Guilford 2,213 Prospect 1,003
Stamford 995 Glastonbury 3,316 Wallingford 2,210 Middlebury 747
Norwalk 795 New Britain 3,088 Milford 2,014 Southington 704
West Haven 763 Bloomfield 2,730 North Branford 1,402 Meriden 685TotalCommuters: 16,940
TotalCommuters: 37,720
TotalCommuters: 31,174
TotalCommuters: 11,844
Source: Connecticut Economic Resource Center, Town Profiles, 2010

A TALE OF DISPROPORTIONATE BURDEN: BRIDGEPORT, HARTFORD, NEW HAVEN, & WATERBURY • CCM PUBLIC POLICY REPORT 4
A TALE OF DISPROPORTIONATE
BURDEN
CENTERS OF REGIONAL SERVICESThese cities provide a multitude of services to the regions that surround them. Each is home to hospitals that providecare to the people throughout their metropolitan areas - and the attendant doctors, therapists, and other treatmentprofessionals that work at or near those facilities.
Hartford’s three tax-exempt hospitals are home to 1,559 of the 2,642 (59%) beds in Hartford County. New Haven’stwo tax-exempt hospitals are home to 1,411 of the 2,487 (57%) beds in New Haven County, while Waterbury’s twotax-exempt hospitals are home to 716 of the 2,487 (29%) beds. Bridgeport’s two tax-exempt hospitals are home to 816of the 1,954 (42%) beds in Fairfield County.2 These four cities are also home to tax-exempt colleges and universities.
Most significantly, perhaps, is that these cities provide social services for the neediest people in the state. As shownbelow, Hartford, Bridgeport New Haven, and Waterbury have a disproportionate share of Connecticut’s poor. Ofthe total Connecticut population, 1.1 percent receives Temporary Assistance for Needy Families (TANF). Yet, in Hart-ford, 5.5 percent of the population are TANF recipients, the highest percentage in the state. In Waterbury, 3.8 percentare TANF recipients, while those numbers are 3.6 percent and 2.7 percent for New Haven and Bridgeport, respectively.
This means that Connecticut’s cities have services in place like emergency shelters and food pantries to help those mostin need. The cities also tend to be the location of other kinds of non-profit, tax-exempt service providers, such ashalf-way houses for drug abusers and people released from prison. We do not know how many tax-exempt state agencyfacilities
1.1%
2.7%
5.5%
3.6% 3.8%
0.0%
1.0%
2.0%
3.0%
4.0%
5.0%
6.0%
Connecticut Bridgeport Hartford New Haven Waterbury
Temporary Assistance for Needy Families(TANF) Recipients as a % of 2008 Population
Source: Connecticut Office of Policy and Management, Municipal Fiscal Indicators 2004 2008
2 Source: Connecticut Economic Resource Center, Town Profiles, 2010.

5 CCM PUBLIC POLICY REPORT • A TALE OF DISPROPORTIONATE BURDEN: BRIDGEPORT, HARTFORD, NEW HAVEN, & WATERBURY
A TALE OF DISPROPORTIONATE
BURDEN
facilities are concentrated in the cities because the State has never done a comprehensive inventory of where they are,despite a state legislative report from the early 1990s recommending one.
These cities care for Connecticut’s worst-off citizens, alleviating much of the burden on the surrounding region.One such group is homeless people. A study by the Connecticut Coalition to End Homelessness produced a snapshotof homelessness. In January 2009, there were an estimated 2,824 sheltered households statewide. Of those, 720 (26%)were located in Hartford, 501 (18%) were located in New Haven, 181 (6%) were located in Greater Bridgeport, and120 (4%) were located in Waterbury. That means more than half of Connecticut’s homeless households were inthese four cities.
181
720
501
120
1,302
200
400
600
800
1,000
1,200
1,400
GreaterBridgeport*
Hartford New Haven Waterbury Balance ofState
Sheltered Homeless Households
Source: Connecticut Coalition to End Homelessness, Connecticut Counts 2009*The report does not list numbers for Bridgeport specifically.
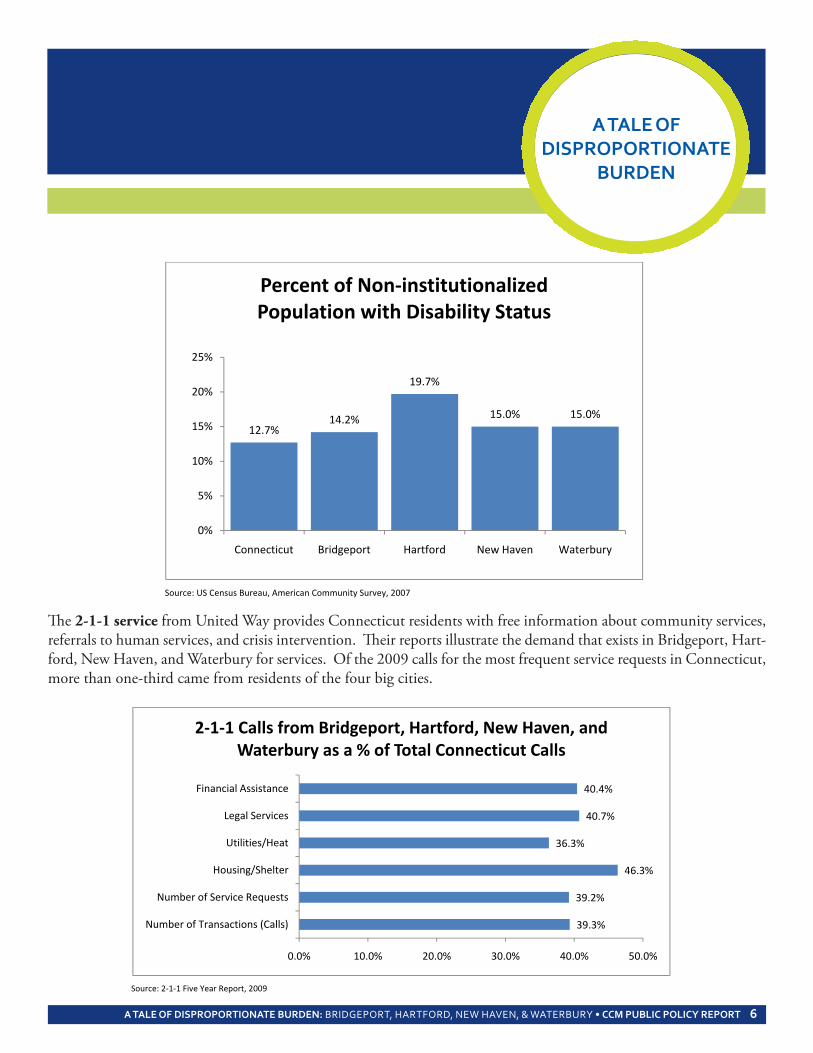
Bridgeport, Hartford, New Haven, and Waterbury also care for a higher percentage than the state average of personsclassified as having disabilities. The state has 12.7 percent of non-institutionalized population with disability status.That number is 19.7 percent in Hartford, 15 percent in New Haven and Waterbury, and 14.2 percent in Bridgeport.
A TALE OF DISPROPORTIONATE BURDEN: BRIDGEPORT, HARTFORD, NEW HAVEN, & WATERBURY • CCM PUBLIC POLICY REPORT 6
A TALE OF DISPROPORTIONATE
BURDEN
12.7%14.2%
19.7%
15.0% 15.0%
0%
5%
10%
15%
20%
25%
Connecticut Bridgeport Hartford New Haven Waterbury
Percent of Non institutionalizedPopulation with Disability Status
Source: US Census Bureau, American Community Survey, 2007
39.3%
39.2%
46.3%
36.3%
40.7%
40.4%
0.0% 10.0% 20.0% 30.0% 40.0% 50.0%
Number of Transactions (Calls)
Number of Service Requests
Housing/Shelter
Utilities/Heat
Legal Services
Financial Assistance
2 1 1 Calls from Bridgeport, Hartford, New Haven, andWaterbury as a % of Total Connecticut Calls
Source: 2 1 1 Five Year Report, 2009
The 2-1-1 service from United Way provides Connecticut residents with free information about community services,referrals to human services, and crisis intervention. Their reports illustrate the demand that exists in Bridgeport, Hart-ford, New Haven, and Waterbury for services. Of the 2009 calls for the most frequent service requests in Connecticut,more than one-third came from residents of the four big cities.

7 CCM PUBLIC POLICY REPORT • A TALE OF DISPROPORTIONATE BURDEN: BRIDGEPORT, HARTFORD, NEW HAVEN, & WATERBURY
A TALE OF DISPROPORTIONATE
BURDEN
CENTERS OF CULTUREEverybody likes to live in a nice place. When families or friends visit we like to show them the amenities of our area -the restaurants, museums, theaters and other cultural activities that help define the quality of life in a region. Con-necticut’s cities are cultural centers. It is not the same to have such amenities spread around a large area - only the“center of the wheel” can give a cultural identity to a region, not its spokes.
Connecticut is in a battle to keep young people in the state. Vital cities help support this goal. When downtownareas are bustling at night with restaurants and clubs it creates an excitement and vibrancy that is impossible in stripshopping centers. This night life also supports sales and use tax revenues. In fact, Bridgeport, Hartford, New Haven,and Waterbury’s retail sales from food services and drink ($528.6 million) account for approximately 12 percent ($30.5million) of the annual sales and use tax due in this category.3
Hartford’s Wadsworth Athenaeum, the nation’s first public museum, is one of the most respected art museums in thecountry. The same is true for the Yale museums: The Yale Center for British Art, Yale Peabody Museum, and Yale Uni-versity Art Gallery cater to 400,000 visitors annually.4 The 12 tax-exempt colleges and universities in Bridgeport, Hart-ford, and New Haven attract many public cultural and academic events for all Connecticut residents. The Yale RepertoryTheater, Long Wharf Theater and the Hartford Stage Company have national reputations for excellence. Long WharfTheater entertains over 90,000 guests in its audiences each year.
Bridgeport’s Beardsley Zoo, the only one of its kind in Connecticut, sees approximately 250,000 visitors per year, ap-proximately 15,000 of them from states other than Connecticut.5 Waterbury’s Palace Theater hosts 113,000 paid at-tendees, while its Seven Angels Theater was named a “Best In Connecticut” winner by Connecticut Magazine in 2010.6
The oldest state house in America is in Hartford. Mark Twain’s The Adventures of Huckleberry Finn; The Adventures ofTom Sawyer; and The Prince and the Pauper were all written in his Hartford home which stands as a museum today. Ap-proximately 65,000 people visit the Mark Twain House annually. On average, 80 percent of these visitors come from out-side of Connecticut. New Haven, America’s first planned city, is home to the first hamburgersandwich, first cotton gin, and what many consider to be America’s best pizzerias.8
Ten percent (171,023) of all jobs in Connecticut are in Connecticut’s culture andtourism industries. This industry yields $1.715 billion (6.9% of the State and localtotal) in State and local revenue. Arts, film, history and tourism generate more than$9 billion (5.7% of the State total) in personal income for Connecticut residents.9
3 Connecticut Department of Revenue Services, Retail Sales by Town Reports, 2009. 4 Arts Council of Greater New Haven Data, 2010. 5 Beardsley Zoo Data, 2010. 6 Palace Theater Annual Report 200708 and sevenagelstheater.org7 The Mark Twain House and Museum Data, 2010.8 Connecticut’s Visitor’s Guide: www.visitnewhaven.com, 2010. 9 Carstensen, Fred. Connecticut Commission on Culture & Tourism, 2006.

A TALE OF DISPROPORTIONATE BURDEN: BRIDGEPORT, HARTFORD, NEW HAVEN, & WATERBURY • CCM PUBLIC POLICY REPORT 8
A TALE OF DISPROPORTIONATE
BURDEN
POVERTY CHALLENGESConnecticut as a whole has the third lowest poverty rate in the nation for families (6.7%). However, the poverty ratesin Bridgeport, Hartford, New Haven, and Waterbury for families are at least twice as high as the state average. Statisticsfor individuals and families living below the poverty level, and children under eighteen living in poverty, are below.
9.4%
21.1%
31.9%
26.7%
22.8%
0%
5%
10%
15%
20%
25%
30%
35%
Connecticut Bridgeport Hartford New Haven Waterbury
Individuals with Income below the Poverty Line
Source: U.S. Census Bureau, 2009 American Community Survey
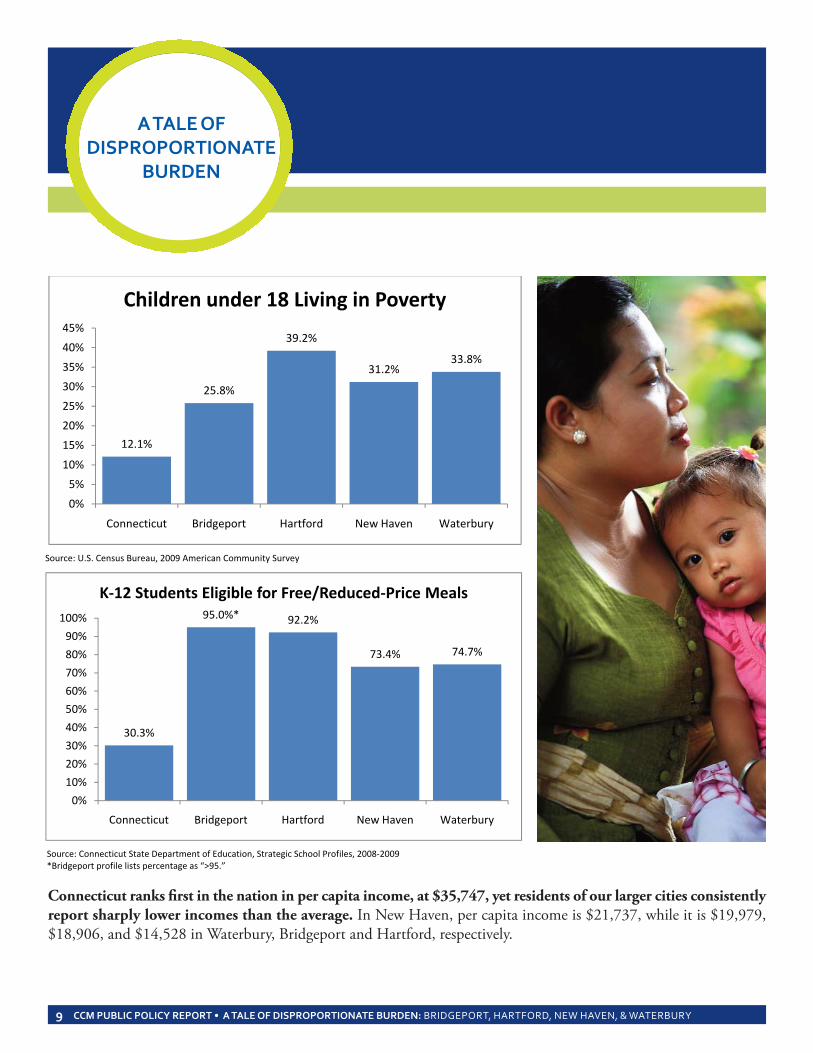
While 28.7 percent of Connecticut’s K-12 students are eligible for free/reduced-price meals, over 90 percent areeligible in both Bridgeport and Hartford. In Waterbury, 74.7 percent of students are eligible, and in New Haven,73.4 percent are eligible.
6.7%
14.4%
29.7%
18.7% 19.7%
0%
5%
10%
15%
20%
25%
30%
35%
Connecticut Bridgeport Hartford New Haven Waterbury
Families with Income below the Poverty Line
Source: U.S. Census Bureau, 2009 American Community Survey
9 CCM PUBLIC POLICY REPORT • A TALE OF DISPROPORTIONATE BURDEN: BRIDGEPORT, HARTFORD, NEW HAVEN, & WATERBURY
A TALE OF DISPROPORTIONATE
BURDEN
30.3%
95.0%* 92.2%
73.4% 74.7%
0%
10%
20%
30%
40%
50%
60%
70%
80%
90%
100%
Connecticut Bridgeport Hartford New Haven Waterbury
K 12 Students Eligible for Free/Reduced Price Meals
Source: Connecticut State Department of Education, Strategic School Profiles, 2008 2009*Bridgeport profile lists percentage as “>95.”
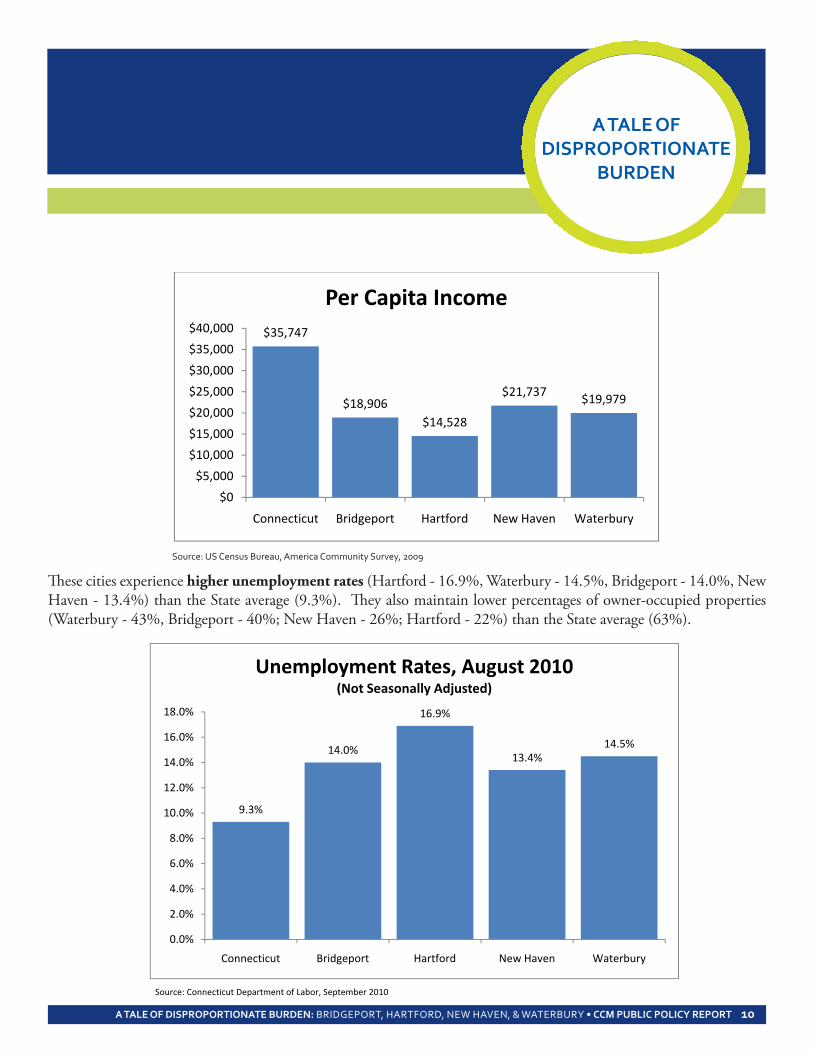
Connecticut ranks first in the nation in per capita income, at $35,747, yet residents of our larger cities consistentlyreport sharply lower incomes than the average. In New Haven, per capita income is $21,737, while it is $19,979,$18,906, and $14,528 in Waterbury, Bridgeport and Hartford, respectively.
12.1%
25.8%
39.2%
31.2%33.8%
0%
5%
10%
15%
20%
25%
30%
35%
40%
45%
Connecticut Bridgeport Hartford New Haven Waterbury
Children under 18 Living in Poverty
Source: U.S. Census Bureau, 2009 American Community Survey
A TALE OF DISPROPORTIONATE BURDEN: BRIDGEPORT, HARTFORD, NEW HAVEN, & WATERBURY • CCM PUBLIC POLICY REPORT 10
A TALE OF DISPROPORTIONATE
BURDEN
$35,747
$18,906$14,528
$21,737 $19,979
$0
$5,000
$10,000
$15,000
$20,000
$25,000
$30,000
$35,000
$40,000
Connecticut Bridgeport Hartford New Haven Waterbury
Per Capita Income
Source: US Census Bureau, American Community, 2009
These cities experience higher unemployment rates (Hartford - 16.9%, Waterbury - 14.5%, Bridgeport - 14.0%, NewHaven - 13.4%) than the State average (9.3%). They also maintain lower percentages of owner-occupied properties(Waterbury - 43%, Bridgeport - 40%; New Haven - 26%; Hartford - 22%) than the State average (63%).
9.3%
14.0%
16.9%
13.4%14.5%
0.0%
2.0%
4.0%
6.0%
8.0%
10.0%
12.0%
14.0%
16.0%
18.0%
Connecticut Bridgeport Hartford New Haven Waterbury
Unemployment Rates, August 2010(Not Seasonally Adjusted)
Source: Connecticut Department of Labor, September 2010
Source: US Census Bureau, America Community Survey, 2009
11 CCM PUBLIC POLICY REPORT • A TALE OF DISPROPORTIONATE BURDEN: BRIDGEPORT, HARTFORD, NEW HAVEN, & WATERBURY
A TALE OF DISPROPORTIONATE
BURDEN
63%
40%
22%26%
43%
0%
10%
20%
30%
40%
50%
60%
70%
Connecticut Bridgeport Hartford New Haven Waterbury
Owner Occupied Dwellings as a % of TotalDwellings
Source: CERC Town Profiles, 2010
88.6%
73.2%67.8%
80.9% 78.0%
0%
10%
20%
30%
40%
50%
60%
70%
80%
90%
100%
Connecticut Bridgeport Hartford New Haven Waterbury
Percent of Population with a HighSchool Diploma
Source: US Census Bureau, American Community Survey, 2009
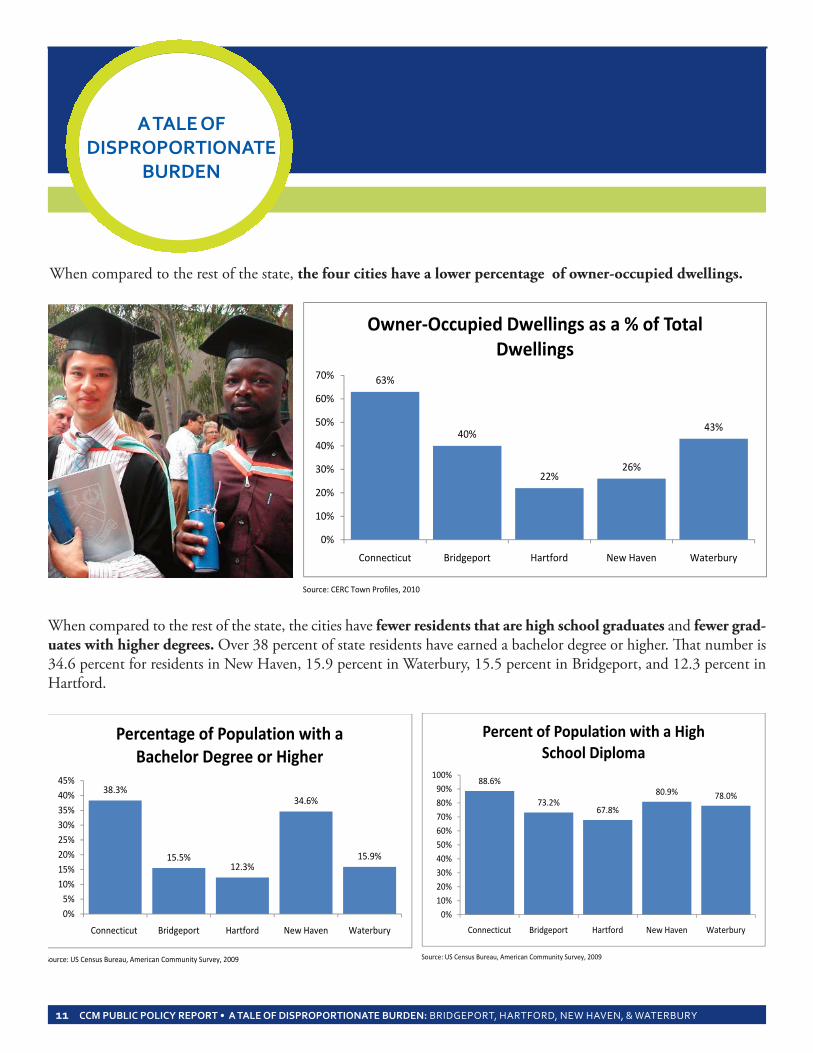
When compared to the rest of the state, the cities have fewer residents that are high school graduates and fewer grad-uates with higher degrees. Over 38 percent of state residents have earned a bachelor degree or higher. That number is34.6 percent for residents in New Haven, 15.9 percent in Waterbury, 15.5 percent in Bridgeport, and 12.3 percent inHartford.
When compared to the rest of the state, the four cities have a lower percentage of owner-occupied dwellings.
38.3%
15.5%12.3%
34.6%
15.9%
0%5%
10%15%20%25%30%35%40%45%
Connecticut Bridgeport Hartford New Haven Waterbury
Percentage of Population with aBachelor Degree or Higher
Source: US Census Bureau, American Community Survey, 2009
A TALE OF DISPROPORTIONATE BURDEN: BRIDGEPORT, HARTFORD, NEW HAVEN, & WATERBURY • CCM PUBLIC POLICY REPORT 12
A TALE OF DISPROPORTIONATE
BURDEN
A TALE OF DISPROPORTIONATE
BURDEN
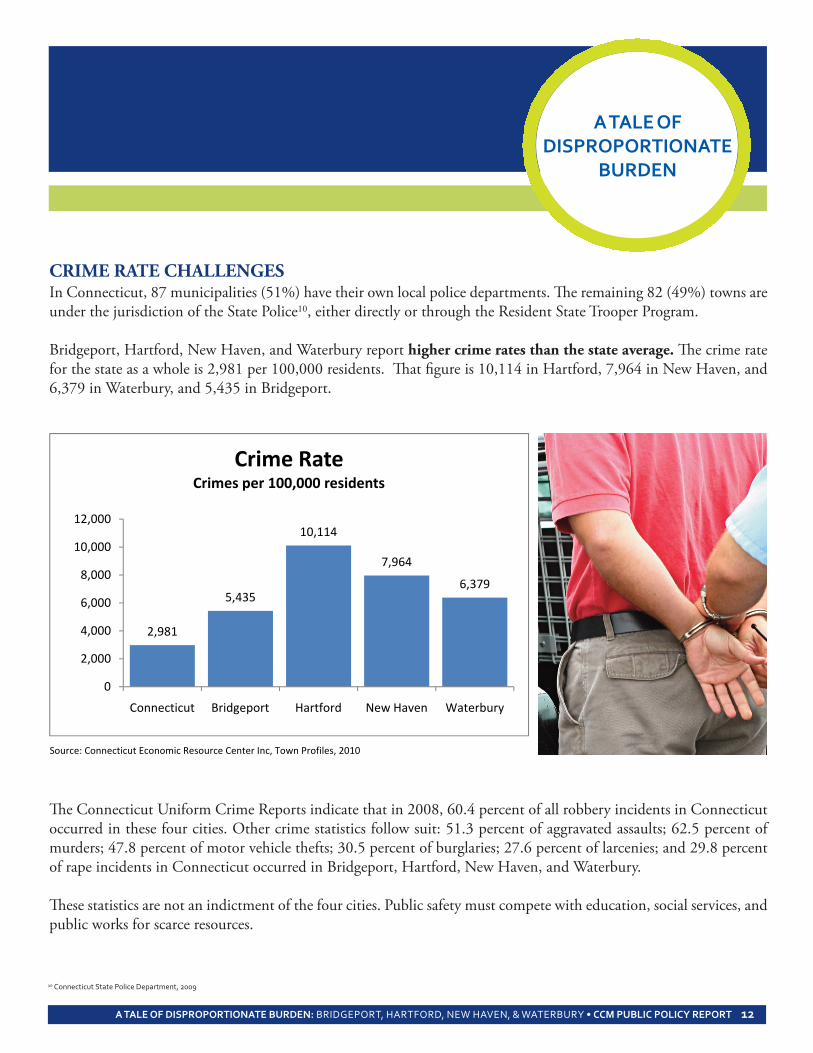
CRIME RATE CHALLENGESIn Connecticut, 87 municipalities (51%) have their own local police departments. The remaining 82 (49%) towns areunder the jurisdiction of the State Police10, either directly or through the Resident State Trooper Program.
Bridgeport, Hartford, New Haven, and Waterbury report higher crime rates than the state average. The crime ratefor the state as a whole is 2,981 per 100,000 residents. That figure is 10,114 in Hartford, 7,964 in New Haven, and6,379 in Waterbury, and 5,435 in Bridgeport.
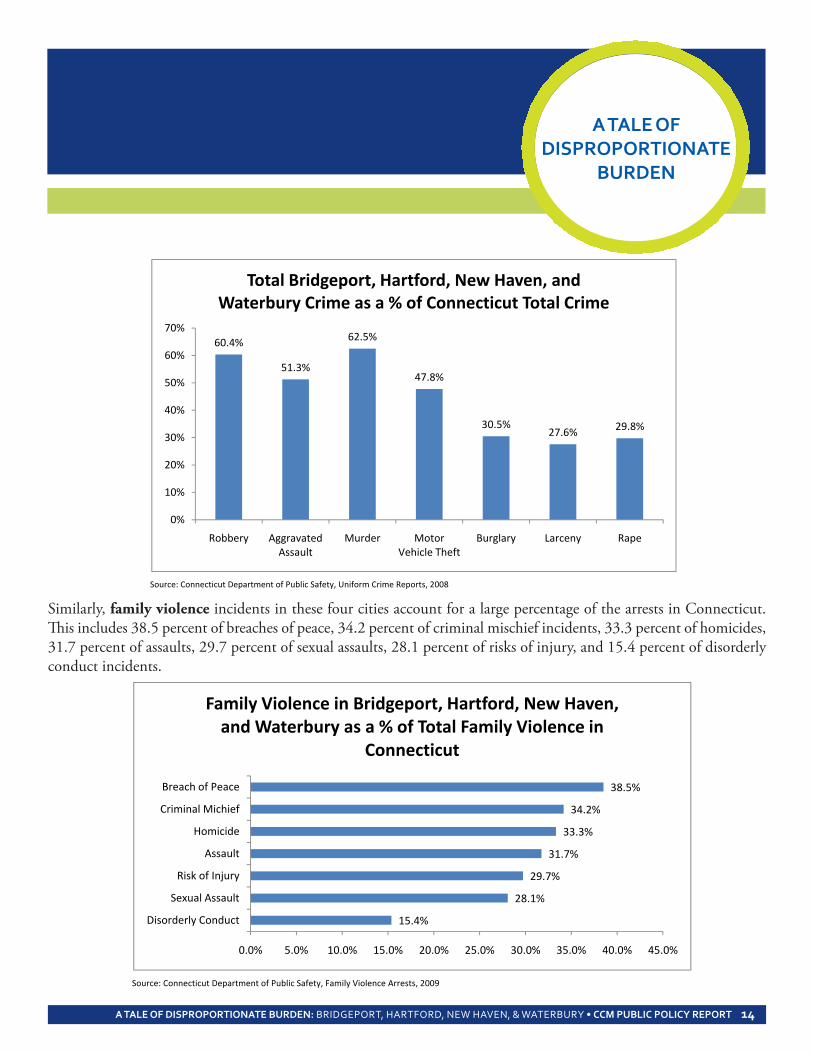
The Connecticut Uniform Crime Reports indicate that in 2008, 60.4 percent of all robbery incidents in Connecticutoccurred in these four cities. Other crime statistics follow suit: 51.3 percent of aggravated assaults; 62.5 percent ofmurders; 47.8 percent of motor vehicle thefts; 30.5 percent of burglaries; 27.6 percent of larcenies; and 29.8 percentof rape incidents in Connecticut occurred in Bridgeport, Hartford, New Haven, and Waterbury.
These statistics are not an indictment of the four cities. Public safety must compete with education, social services, andpublic works for scarce resources.
2,981
5,435
10,114
7,964
6,379
0
2,000
4,000
6,000
8,000
10,000
12,000
Connecticut Bridgeport Hartford New Haven Waterbury
Crime RateCrimes per 100,000 residents
Source: Connecticut Economic Resource Center Inc, Town Profiles, 2010
10 Connecticut State Police Department, 2009
13 CCM PUBLIC POLICY REPORT • A TALE OF DISPROPORTIONATE BURDEN: BRIDGEPORT, HARTFORD, NEW HAVEN, & WATERBURY
A TALE OF DISPROPORTIONATE
BURDEN
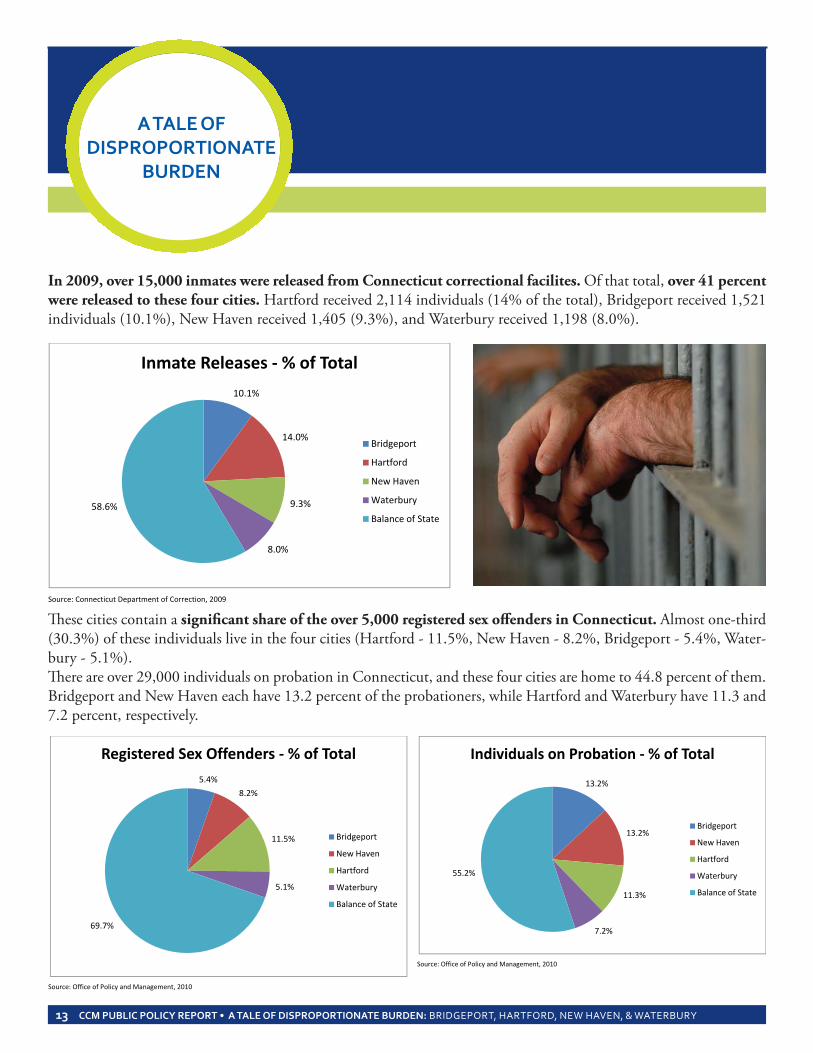
In 2009, over 15,000 inmates were released from Connecticut correctional facilites. Of that total, over 41 percentwere released to these four cities. Hartford received 2,114 individuals (14% of the total), Bridgeport received 1,521individuals (10.1%), New Haven received 1,405 (9.3%), and Waterbury received 1,198 (8.0%).
10.1%
14.0%
9.3%
8.0%
58.6%
Inmate Releases % of Total
Bridgeport
Hartford
New Haven
Waterbury
Balance of State
Source: Connecticut Department of Correction, 2009
These cities contain a significant share of the over 5,000 registered sex offenders in Connecticut. Almost one-third(30.3%) of these individuals live in the four cities (Hartford - 11.5%, New Haven - 8.2%, Bridgeport - 5.4%, Water-bury - 5.1%).There are over 29,000 individuals on probation in Connecticut, and these four cities are home to 44.8 percent of them.Bridgeport and New Haven each have 13.2 percent of the probationers, while Hartford and Waterbury have 11.3 and7.2 percent, respectively.
5.4%
8.2%
11.5%
5.1%
69.7%
Registered Sex Offenders % of Total
Bridgeport
New Haven
Hartford
Waterbury
Balance of State
Source: Office of Policy and Management, 2010
13.2%
13.2%
11.3%
7.2%
55.2%
Individuals on Probation % of Total
Bridgeport
New Haven
Hartford
Waterbury
Balance of State
Source: Office of Policy and Management, 2010
A TALE OF DISPROPORTIONATE BURDEN: BRIDGEPORT, HARTFORD, NEW HAVEN, & WATERBURY • CCM PUBLIC POLICY REPORT 14
A TALE OF DISPROPORTIONATE
BURDEN
60.4%
51.3%
62.5%
47.8%
30.5%27.6% 29.8%
0%
10%
20%
30%
40%
50%
60%
70%
Robbery AggravatedAssault
Murder MotorVehicle Theft
Burglary Larceny Rape
Total Bridgeport, Hartford, New Haven, andWaterbury Crime as a % of Connecticut Total Crime
Source: Connecticut Department of Public Safety, Uniform Crime Reports, 2008
Similarly, family violence incidents in these four cities account for a large percentage of the arrests in Connecticut.This includes 38.5 percent of breaches of peace, 34.2 percent of criminal mischief incidents, 33.3 percent of homicides,31.7 percent of assaults, 29.7 percent of sexual assaults, 28.1 percent of risks of injury, and 15.4 percent of disorderlyconduct incidents.
15.4%
28.1%
29.7%
31.7%
33.3%
34.2%
38.5%
0.0% 5.0% 10.0% 15.0% 20.0% 25.0% 30.0% 35.0% 40.0% 45.0%
Disorderly Conduct
Sexual Assault
Risk of Injury
Assault
Homicide
Criminal Michief
Breach of Peace
Family Violence in Bridgeport, Hartford, New Haven,and Waterbury as a % of Total Family Violence in
Connecticut
Source: Connecticut Department of Public Safety, Family Violence Arrests, 2009

15 CCM PUBLIC POLICY REPORT • A TALE OF DISPROPORTIONATE BURDEN: BRIDGEPORT, HARTFORD, NEW HAVEN, & WATERBURY
A TALE OF DISPROPORTIONATE
BURDEN
15 CCM PUBLIC POLICY REPORT • A TALE OF DISPROPORTIONATE BURDEN: BRIDGEPORT, HARTFORD, NEW HAVEN, & WATERBURY
HEALTH CHALLENGESBridgeport, Hartford, New Haven, and Waterbury also face health demographics that differ markedly from the stateaverage. The number of births to mothers on the HUSKY or Medicaid programs is about twice as high as the stateaverage (Hartford - 74.2%, Waterbury - 64.7%, Bridgeport - 63.2%, New Haven - 61%). These cities also suffer higherinfant mortality rates, higher rates of diabetes, and higher rates of asthma. For example, while the infant mortalityrate is 4.5 per 1,000 births for the state, Waterbury has an infant mortality rate of 8.6 per 1,000 births, nearly doublethe state average. New Haven’s rate is 8.3, Hartford’s rate is 7.6, and Bridgeport’s rate is 7.5 per 1,000 births.
34.6%
63.2%
74.2%
61.0% 64.7%
0%
10%
20%
30%
40%
50%
60%
70%
80%
Connecticut Bridgeport Hartford New Haven Waterbury
Percent of Births to Mothers onHUSKY or Medicaid
Source: CT Voices for Children, Births to Mothers with HUSKY Program and Medicaid Coverage, June 2009

A TALE OF DISPROPORTIONATE BURDEN: BRIDGEPORT, HARTFORD, NEW HAVEN, & WATERBURY • CCM PUBLIC POLICY REPORT 16
A TALE OF DISPROPORTIONATE
BURDEN
The number of people in these cities without health insurance is also significantly higher than the state average.In Connecticut, 8.8 percent of the population is uninsured. That number is 19.8 percent in Bridgeport, 16.9 percentin Hartford, 14.4 percent in New Haven, and 12.3 percent in Waterbury.
4.5
7.5 7.68.3 8.6
0
2
4
6
8
10
Connecticut Bridgeport Hartford New Haven Waterbury
Infant Mortality Rate(per 1,000 births)
Source: CERC, Town Profiles, 2010
8.8%
19.8%16.9%
14.4%12.3%
0%
5%
10%
15%
20%
25%
Connecticut Bridgeport Hartford New Haven Waterbury
Percentage of Population withoutHealth Insurance
Source: US Census Bureau, American Community Survey, 2009

17 CCM PUBLIC POLICY REPORT • A TALE OF DISPROPORTIONATE BURDEN: BRIDGEPORT, HARTFORD, NEW HAVEN, & WATERBURY
A TALE OF DISPROPORTIONATE
BURDEN
EDUCATION CHALLENGESFourteen percent (78,842 students) of Connecticut’s K-12 public school students are enrolled in the Bridgeport,Hartford, New Haven, and Waterbury school systems.11
In Connecticut, 5.4 percent of students learn English as a second language. Those numbers are significantly higherin the state’s larger cities: 14.4 percent in Hartford; 13.4 percent in Bridgeport; 12.6 percent in New Haven, and 11.4percent in Waterbury.
Students with English as a Second LanguageConnecticut 5.2%Bridgeport 13.4%Hartford 14.4%New Haven 12.6%Waterbury 11.4%
Source: CT State Dept of Education, CEDAR, 2008-09
When compared to the rest of the state, the cities have higher drop-out rates. The statewide drop-out rate is 6.8 percent. Thatnumber is 23.5 percent in Bridgeport, 15.7 percent in New Haven, 12.0 percent in Hartford, and 9.3 percent in Waterbury.
Students in these four cities generally perform below the Connecticut average on the academic performance tests.For example, the average SAT performance in the state is 508 in math, 503 in reading, and 506 in writing. Waterbury’sscores are 414 in math, 418 in reading, and 422 in writing. New Haven students average 400 in math, 409 in reading,and 416 in writing.
6.8%
23.5%
12.0%
15.7%
9.3%
0%
5%
10%
15%
20%
25%
Connecticut Bridgeport Hartford New Haven Waterbury
Cumulative Dropout Percentage RateClass of 2008
Source: CT State Dept of Education, CEDAR, 2008
11 Source: Connecticut State Department of Education, Bureau of Grants Management, 200809 Data

A TALE OF DISPROPORTIONATE BURDEN: BRIDGEPORT, HARTFORD, NEW HAVEN, & WATERBURY • CCM PUBLIC POLICY REPORT 18
A TALE OF DISPROPORTIONATE
BURDEN
Hartford students’ SAT averages are 400 in math, 395 in reading, and 399 in writing. Bridgeport students average 387in math, 391 in reading, and 396 in writing.
508 503 506
387 391 396400 395 399400 409 416414 418 422
0
100
200
300
400
500
600
Math Reading Writing
Scholastic Aptitude Test (SAT) Performance
Connecticut Bridgeport Hartford New Haven Waterbury
Source: CT State Dept of Education, CEDAR, 2008 09
48% 48%43%
55%
10%14%
8%
18%15% 15%
10%
20%
14%17%
11%
24%
15%
23%
12%
32%
0.0%
10.0%
20.0%
30.0%
40.0%
50.0%
60.0%
Math Reading Science Writing
Connecticut Academic Performance Test Results(CAPT): Students at Goal
Connecticut Bridgeport Hartford New Haven Waterbury
Source: CT State Dept of Education, CEDAR, 2008 09
REVENUE CHALLENGESBridgeport, Hartford, New Haven, and Waterbury face a multitude of revenue challenges including a high per-centage of property that is exempt -- by state mandate -- from property taxation. These tax-exempt properties in-clude colleges, hospitals, and state-owned property, which affects the equalized net grand list (ENGL) per capita.
508 503 506
387 391 396400 395 399400 409 416414 418 422
0
100
200
300
400
500
600
Math Reading Writing
Scholastic Aptitude Test (SAT) Performance
Connecticut Bridgeport Hartford New Haven Waterbury
Source: CT State Dept of Education, CEDAR, 2008 09

19 CCM PUBLIC POLICY REPORT • A TALE OF DISPROPORTIONATE BURDEN: BRIDGEPORT, HARTFORD, NEW HAVEN, & WATERBURY
A TALE OF DISPROPORTIONATE
BURDEN
The State provides payment-in-lieu-of-taxes (PILOT) reimbursements tomunicipalities for revenue lost due to some state-mandated propertytax exemptions.These grants reimburse for only a portion of lost realestate property tax revenue and have been flat for the last few years.There is no reimbursement for lost personal-property tax revenue.
The reimbursement rate is estimated to be 54 percent for colleges andhospitals and 32 percent for state-owned property. State statutes setreimbursement goals of 77 percent on college and hospital propertyand 45 percent on state-owned property (with the exception of pris-ons, which are supposed to be reimbursed at 100%).
$116 $126 $122 $122 $115 $115 $1151
$180$197
$207 $212 $212 $214 $214
65% 64%59% 58%
54% 54% 54%
0.35
0.45
0.55
0.65
0.75
0.85
0.95
0
50
100
150
200
250
$Millions
PILOT: Private Colleges and Hospital Property
State PILOT (reimbursement)
Municipal Revenue Loss due to state mandated property tax exemptions, for real estate property only. Does not include lost taxeson personal property, for which there is no state reimbursement (FY 10 and 11: Estimate)
% Municipal Reimbursement (statute specifies 77% for most such property)
Source: Adopted State Budgets, CCM Calculations
Source: Adopted State Budgets, CCM Calculations
$93 $83 $80 $80 $73.5 $73 $731
$209$199
$221 $225 $225 $225 $225
47%
38% 36% 36% 33% 33% 32%
0.2
0.3
0.4
0.5
0.6
0.7
0.8
0.9
1
0
50
100
150
200
250
$Millions
PILOT: State Owned Property
State Owned Property PILOT (reimbursement)
Municipal Revenue Loss due to state mandated property tax exemptions, for real property only. Does not include lost taxes onpersonal property, for which there is no State reimbursement (FY 11: Estimate)% Municipal Reimbursement (statute specifies 45% for most such property)
$12
$38 $39
$11$14
$48
$39
$15
$0
$10
$20
$30
$40
$50
$60
Bridgeport Hartford New Haven Waterbury
PILOT Payments and Estimated RevenueLost, FY2011 (millions $)
Total FY11 PILOT Payments Estimated Revenue Lost
Source: Adopted FY2011 State Budget, CCM Calculations
Bridgeport, Hartford, New Haven, and Waterbury loseat least $115 million in property tax revenue due tothese state-mandated exemptions and low reimburse-ment rates. This total represents lost taxes on real propertyonly and does not include revenue lost on personalproperty.
Percentage of Property Exempt from Property Taxation
New Haven 47%Hartford 44%Bridgeport 35%Waterbury 32%
Source: Connecticut Office of Policy and Management

A TALE OF DISPROPORTIONATE BURDEN: BRIDGEPORT, HARTFORD, NEW HAVEN, & WATERBURY • CCM PUBLIC POLICY REPORT 20
A TALE OF DISPROPORTIONATE
BURDEN
14.13
18.78
39.42
29.18
24.35
0.00
5.00
10.00
15.00
20.00
25.00
30.00
35.00
40.00
45.00
Connecticut Bridgeport Hartford New Haven Waterbury
Equalized Mill Rates, FY2008
Source: Connecticut Office of Policy and Management, Municipal Fiscal Indicators, 2008
$163,268
$86,765
$45,280 $51,511
$75,648
$0
$20,000
$40,000
$60,000
$80,000
$100,000
$120,000
$140,000
$160,000
$180,000
Connecticut Bridgeport Hartford New Haven Waterbury
Equalized Net Grand List per Capita,FY2008
Source: Connecticut Office of Policy and Management, Municipal Fiscal Indicators, 2008
The Connecticut ENGL per capita is $163,268, while Bridgeport, Waterbury, New Haven, and Hartford’s ENGLsare $86,765, $75,648, $51,511, and $45,280, respectively.
Given these ENGL figures, it is predictable that these cities also have average home values far below those in theirsurrounding municipalities. The median home value in Bridgeport is $250,400, while the median home value inFairfield County is $504,400; the median home value in Hartford is $195,300, while the median home value in Hart-ford County is $246,700; and the median home values are $228,600 in New Haven and $164,800 in Waterbury,while the median home value in New Haven County is $278,500.

21 CCM PUBLIC POLICY REPORT • A TALE OF DISPROPORTIONATE BURDEN: BRIDGEPORT, HARTFORD, NEW HAVEN, & WATERBURY
A TALE OF DISPROPORTIONATE
BURDEN
$250,400
$504,400
$195,300$246,700 $228,600
$164,800
$278,500
$0
$100,000
$200,000
$300,000
$400,000
$500,000
$600,000
Median Home Prices
Source: Census Bureau, 2006 2008 American Community Survey 3 Year Estimates
With such dramatic poverty indicators it is predictable that Hartford, New Haven, Waterbury, and Bridgeport rankin the top five “distressed municipalities” in Connecticut (1st, 2nd, 3rd, and 5th, respectively). The Department ofEconomic and Community Development calculates these designations based on socioeconomic criteria.
2010 Top 10 Distressed MunicipalitiesTotal Score Ranking
Hartford 1550 1New Haven 1513 2Waterbury 1505 3New Britain 1491 4Bridgeport 1487 5Meriden 1408 6New London 1394 7East Hartford 1394 8Winchester 1359 9West Haven 1351 10
Source: CT Department of and Economic and Community Development

A TALE OF DISPROPORTIONATE BURDEN: BRIDGEPORT, HARTFORD, NEW HAVEN, & WATERBURY • CCM PUBLIC POLICY REPORT 22
A TALE OF DISPROPORTIONATE
BURDEN
12 Data are from Municipal Fiscal Indicators, CT Department of Labor, and State Department of Education.13 Dreier, Peter. “Why Connecticut’s Suburbs Need Healthy Cities.” Connecticut Conference of Municipalities: March 1995.
BEYOND THE FOURWhile much focus is rightly on Bridgeport, Hartford, New Haven, and Waterbury, a number of other Connecticuttowns and cities are also dealing with similar issues. These municipalities are of varying sizes and are located in alleight counties. Some have higher-than-average populations that are at risk. Others have seen economic hardships dueto problems such as plant closings and other disinvestment. Below are some examples.12
• Over 18 percent of Danbury students are English language learners.• East Hartford’s unemployment rate is 12.5 percent.• Meriden has a crime rate of 3,699.1 per 100,000 residents.• Less than half of Middletown’s dwellings are owner-occupied• New Britain has the fourth highest percentage (3.4%) of TANF recipients in the state.• Average SAT scores in New London are 23 percent lower than the state average.• Norwalk is reliant on the property tax for over 83 percent of its revenues.• In Norwich, over 64 percent of students are eligible for free/reduced-price lunches.• Stamford’s student drop-out rate is six percent higher than the statewide average.• Over 22 percent of Windham’s population has an income below the poverty level.Many of these communities meet specific need criterias under statutory designations. A list of towns and cities andtheir designations can be found in Appendix A.
CONCLUSIONWhile other communities in Connecticut have needs - especially given the current economic downturn - it is clearthat Bridgeport, Hartford, New Haven, and Waterbury face extraordinary challenges. These cities must deal withhigh poverty rates, educational need and outcome disparities, increased crime rates, and revenue challenges. It is equallyclear that these four cities support surrounding communities as service centers, cultural hubs, and employment nuclei.Despite their numerous challenges, these cities have much to offer Connecticut residents and businesses and are crucialto the success of the state as a whole.
“The success of our central cities, their surrounding suburbs, and the state as a whole are linked. The reputation andviability of the entire metropolitan area and our state are shaped by public impressions of the central city. Allowing thecentral city to decay affects the entire metropolitan area and our state.”13 Despite tough fiscal times, state governmenthas a moral and economic imperative to provide increased assistance to Bridgeport, Hartford, New Haven, andWaterbury. Strong city hubs will yield statewide benefits for years to come. As go these cities, so goes Connecticut.

23 CCM PUBLIC POLICY REPORT • A TALE OF DISPROPORTIONATE BURDEN: BRIDGEPORT, HARTFORD, NEW HAVEN, & WATERBURY
MUNICIPAL DESIGNATIONS
Distressed Municipality - A municipality thatmeets the necessary number of quantitativephysical and economic distress thresholdswhich are eligible for the federal Urban Devel-opment Action Grant program.
Public Investment Community - A munici-pality requiring financial assistance to offset itsservice burdens, defined as being in the topquartile of the "eligibility index" scale, whichis a measure of local burden determined by cal-culating a town's disparity in relation to all mu-nicipalities.
C&D Plan Regional Center - A municipalityidentified on the State Plan of Conservationand Development as being a regional center.
Targeted Investment Community - A munic-ipality with a designated Enterprise Zone.
APPENDIX A
MunicipalityDistressedMunicipality
PublicInvestmentCommunity
C&D PlanRegionalCenter
TargetedInvestmentCommunity
Ansonia X X XAshford X
Beacon Falls XBloomfield XBridgeport X X X XBristol X X X X
Canterbury XChaplin X
Colchester XDanbury XDerby X X X
East Hartford X X X XEast Haven XEast Windsor X X
Enfield X X XGriswold XGroton X XHamden X XHampton XHartford X X X XKillingly X X X
Manchester X XMeriden X X X X
Middletown X X XMilford XMontville XNaugatuck X XNew Britain X X X XNew Haven X X X XNew London X X X X
Urban Act
Norwalk X XNorwich X X X XPlainfield XPlainville X XPlymouth X XPortland XPutnam X XSeymour XShelton X
Southington XSprague X XStafford XStamford X XSterling XStratford XThomaston XThompson XTorrington X X XVernon X X X
Voluntown XWaterbury X X X X
West Hartford XWest Haven X X XWinchester X XWindham X X X XWindsor X

The Connecticut Conference of Municipalities (CCM) is Connecticut’s statewide association of
towns and cities. CCM represents municipalities at the General Assembly, before the state ex-
ecutive branch and regulatory agencies, and in the courts. CCM provides member towns and cities
with a wide array of other services, including management assistance, individualized inquiry service,
assistance in municipal labor relations, technical assistance and training, policy development, research
and analysis, publications, information programs, and service programs such as workers’ compensation
and liability-automobile-property insurance, risk management, and energy cost-containment. Federal
representation is provided by CCM in conjunction with the National League of Cities. CCM was
founded in 1966.
CCM is governed by a Board of Directors, elected by the member municipalities, with due consideration
given to geographical representation, municipalities of different sizes, and a balance of political parties.
Numerous committees of municipal officials participate in the development of CCM policy and pro-
grams. CCM has offices in New Haven (headquarters) and in Hartford.
900 Chapel Street, 9th FloorNew Haven, Connecticut 06510-2807
Tel: (203) 498-3000Fax: (203) 562-6314
E-mail: [email protected] Site: www.ccm-ct.org
CCM - CONNECTICUT’S STATEWIDE ASSOCIATION OF TOWNS AND CITIES