A Systematic Approach to the Design of Distributed ...
36
IEEE TRANSACTIONS ON COMPUTERS 1 A Systematic Approach to the Design of Distributed Wearable Systems Urs Anliker, Jan Beutel, Matthias Dyer, Rolf Enzler, Paul Lukowicz, Lothar Thiele, Gerhard Tr¨ oster U. Anliker, R. Enzler, P. Lukowicz and G. Tr¨ oster are with the Wearable Computing Laboratory, Swiss Federal Institute of Technology (ETH), Zurich, Switzerland. Email: {anliker,enzler,lukowicz,troester}@ife.ee.ethz.ch. J. Beutel, M. Dyer and L. Thiele are with the Computer Engineering and Networks Laboratory, Swiss Federal Institute of Technology (ETH), Zurich, Switzerland. Email: {beutel,dyer,thiele}@tik.ee.ethz.ch. April 29, 2003 DRAFT
Transcript of A Systematic Approach to the Design of Distributed ...
IEEE TRANSACTIONS ON COMPUTERS 1
A Systematic Approach to the Design of
Distributed Wearable Systems
Urs Anliker, Jan Beutel, Matthias Dyer, Rolf Enzler, Paul Lukowicz,
Lothar Thiele, Gerhard Troster
U. Anliker, R. Enzler, P. Lukowicz and G. Tr¨oster are with the Wearable Computing Laboratory, Swiss Federal Institute
of Technology (ETH), Zurich, Switzerland. Email:{anliker,enzler,lukowicz,troester}@ife.ee.ethz.ch.
J. Beutel, M. Dyer and L. Thiele are with the Computer Engineering and Networks Laboratory, Swiss Federal Institute
of Technology (ETH), Zurich, Switzerland. Email:{beutel,dyer,thiele}@tik.ee.ethz.ch.
April 29, 2003 DRAFT
IEEE TRANSACTIONS ON COMPUTERS 2
Abstract
Wearable computing has recently gained much popularity as an ambitious vision for future per-
sonalized mobile systems. It targets intelligent, environment aware systems unobtrusively embedded
into the mobile environments of the human body. With the combination of complex processing
requirements, the necessity of placing sensors and input/output modules at different locations on
the user’s body, and stringent limits on size, weight and battery capacity, the design of such systems
is an inherently difficult problem.
This paper targets methods for the systematic design and quantitative analysis of wearable
architectures. It focuses on the trade-offs between different assignments of computation and com-
munication resources to individual modules. We first present a model that combines the various
factors influencing the design of a wearable system into formal cost metrics. In particular, we show
how to consistently incorporate specific wearable factors such as device placement requirements,
ergonomics, and dynamic load profiles into the model. We then present efficient and precise estima-
tion algorithms for the evaluation of different architectures with respect to our cost metrics. These
algorithms are integrated into an automatic design space exploration environment that evolves a set
of Pareto-optimal wearable architectures. Finally, we describe first quantitative results showing the
trade-offs between different architectures for a given wearable scenario.
Index Terms
Design space exploration, wearable computing, distributed architectures, application character-
ization, device modeling, multi-objective optimization.
I. INTRODUCTION
Looking beyond today’s mobile computers and electronic appliances the vision of wearable
computing proposes systems that are permanently present and active, virtually invisible,
intelligent, personal assistants. As described by Weiser [1], Mann [2], Pentland [3] and
Starner [4], [5] such a system should be an active extension of the user, enhancing his
intelligence, augmenting his ability to communicate and interact with the environment and
assisting him in a variety of everyday situations.
Obviously, wearable systems need to have many properties that make them significantly
different from a conventional mobile machine. In terms of functionality this includes situation
and context awareness, the ability to act proactively rather than just react to explicit user
commands, the ability to overlay complex information over the user’s view of the reality, a
high degree of connectivity, and a sophisticated user interface that allows the system to be used
while mobile. From the hardware point of view, three issues are of particular importance.
April 29, 2003 DRAFT

IEEE TRANSACTIONS ON COMPUTERS 3
First, the system has to execute widely varying computational loads with adequate speed
while coping with much stricter power consumption constraints than most standard mobile
systems. Second, it has to combine sensors and input/output (IO) devices placed at different
locations on the user’s body (e. g. a display in the glasses and a motion sensor on the wrist)
into a distributed heterogeneous system. Finally, a wearable system needs to be unobtrusive
that it does not interfere with the user’s activity and does not change his appearance in any
unacceptable way.
Implementing and combining those properties into a working system poses unsolved
challenges in many areas including algorithmic aspects of situation awareness, image recog-
nition, computer graphics, human computer interaction, computer architecture and electronic
packaging technology. This paper addresses the computer architecture aspects. It focuses on
the systematic exploration of the trade-offs involved in finding an optimal distribution of the
computation and communication resources of modules to be placed at different locations on
the user’s body.
The vision of wearable computing addressed in this paper might seem a radical departure
from the current notion of computing with little immediate impact. However, it is very much
in line with recent developments in mobile consumer electronics. As people get used to having
constant access to a growing number of electronic appliances (e. g. mobile phones, PDAs,
digital cameras, MP3 players), issues such as system integration, resource sharing, power
efficiency, situation awareness, seamless integration into the environment and wearability
factors become increasingly important.
A. Wearable System Design
From the above discussion the design space of a wearable system can be described by the
following, mostly conflicting global goals:
1) Functionality: providing as much of the wearable features as possible together with
task specific functionality in an efficient and user friendly manner,
2) Battery lifetime: making the system constantly operational without the need to change
or recharge batteries for as long as possible by minimizing power consumption, and
3) Wearability: comprising a variety of ergonomic criteria including size, weight, corre-
spondence between shape and placement on the body, radiation concerns, heat and
esthetic issues that are necessary for an unobtrusive system implementation.
April 29, 2003 DRAFT

IEEE TRANSACTIONS ON COMPUTERS 4
While aiming to achieve these goals the design needs to take into account four types of
constraints:
1) Usage profiles which specify the required minimal functionality and the relative im-
portance of different features. The vision of an intelligent personal assistant implies a
variable, dynamic usage profile with changing, context dependent applications.
2) Information flow given by the necessity of placing IO devices and sensors at different
locations of the body. This implies a distributed, heterogeneous system architecture.
3) Physical constraints which provide certain hard ergonomic constraints on the weight
and placement of different components on different body locations as well as the relative
importance of the different wearability criteria at different locations.
4) Hardware resources available for implementation that are determined by the state of
the art technology as well as cost, compatibility and other strategic concerns.
In summary, the design of a wearable architecture can be viewed as amulti-objective
optimization problem. For a known, but highly dynamic, context dependent usage profile,
it aims to find the optimal assignment of communication and computation resources to a
number of modules distributed over the user’s body.
For each module of such an architecture a choice must be made between providing it with
enough intelligence to perform computations locally or sending away raw data for processing
on other resources. This choice leads to different hardware implementations of both the
computing modules as well as the individual communication links resulting in a highly
heterogeneous system. Furthermore, each individual module must combine energy efficient
execution of some permanently running low-intensity sensor monitoring and evaluation tasks
with high computing power required by occasional performance bursts. As a consequence,
it can be necessary, inside individual modules, to implement heterogeneous, dynamically
configurable systems.
The dynamic nature of the usage profile implies modeling by an abstract load characteri-
zation rather than by particular applications. Such a load characterization must focus on the
temporal variations of the required computing performance and the communication pattern.
By incorporating these aspects, the design of a wearable system architecture involves
the selection of modules, their components and appropriate communication channels. That
way, the system performance as prescribed by the usage profiles is optimized with respect to
power, execution speed, a set of specialized wearability criteria and cost. Currently, no model
or systematic methodology is available that supports the designer in this complex decision
April 29, 2003 DRAFT

IEEE TRANSACTIONS ON COMPUTERS 5
process.
B. Related Work
Today most wearable systems are based on conventional notebook architectures integrated
into some sort of belt or backpack harness. For some purposes, in particular in well defined
industrial applications, such designs are justified and have proven to be successful tools
[6]–[8]. In [9], a systematic design process has been proposed for such systems.
When it comes to realizing the vision of a wearable computer as a context aware, proactive
and intelligent personal assistant, such traditional architectures are only of limited value. As
has been suggested in [10], distributed and heterogeneous systems consisting of a mixture of
low-power general-purpose processors, signal processors and special-purpose circuits seem a
much more promising approach. While this view is shared by many in the community, few
attempts have been made so far to model, evaluate and implement such systems. In particular,
except for the evaluation of the power consumption of individual devices [11], there are no
quantitative results documenting under what circumstances the distributed, heterogeneous
approach actually outperforms classical centralized architectures.
There are methods available to explore the design space of computer architectures. In
particular, if the optimization process has do deal with conflicting criteria [12], [13]. Many
known approaches to the design of architectures deal with heterogeneous systems consisting
of different sorts of components, e. g. [14]–[18]. However, there are no results available
that take into account peculiarities of distributed wearable systems capable of dealing with
dynamically varying, context dependent usage scenarios.
C. Paper Contributions
This paper develops a modeling, evaluation and design methodology that takes the partic-
ular requirements of wearable computing systems into account. To our knowledge it is the
first time that a complete methodology is defined and implemented enabling the design space
exploration of wearable computer architectures. In particular, the following new results are
described.
• A hierarchical specification model for usage scenarios is developed. It combines the
notions of tasks, applications and scenarios and enables the modeling of ad-hoc appli-
cations. At the same time, the performance and resource requirements of the algorithms
can be specified.
April 29, 2003 DRAFT

IEEE TRANSACTIONS ON COMPUTERS 6
• A wearable computing architecture is modeled in a hierarchical manner by specifying
modules consisting of individual computing resources and communication channels. The
associated parameters enable the modeling of power saving techniques such as dynamic
voltage scheduling in the case of processors and burst mode communication for wireless
links.
• Specific wearable optimization criteria are incorporated into the methodology as abstract
parameters, which can be weighed against power consumption and performance factors.
• The above models are combined to determine relevant properties of the final wearable
system and to derive formal cost metrics. To this end, efficient and precise estimation
algorithms are developed that yield performance, power consumption, cost and form
factor measures.
• The models and methods are integrated into an automatic design space exploration
environment that evolves a set of Pareto-optimal wearable architectures and therefore,
explores the various trade-offs in wearable system design.
II. OVERVIEW OF THE EXPLORATION METHODOLOGY
The goal of the exploration methodology described in this paper is to assist the designer
of a wearable system in determining, which configurations of heterogeneous computing and
communication resources distributed over the user’s body are most suitable for a given prob-
lem. As shown in Fig. 1 the method consists of three components: theproblem specification
of a particular design under investigation, anarchitecture model that spans the space of
possible solutions, and anexploration environment that conducts the search and derives the
architecture best suited to fulfill the specifications.
A. Problem Specification
The description of a specific design problem involves four steps that correspond to the four
types of design constraints mentioned in the introduction:usage profile specification, informa-
tion flow specification, physical constraints specification andhardware resource specification.
They will be described in detail in Section III and can be summarized as follows.
The usage profile specification characterizes the desired functionality through a statistical
description of the expected variations of the computational load and the communication
pattern over time. In essence, it contains a hierarchical set of task graphs together with hard
and soft timing constraints. This provides a temporal distribution of the amount and type
April 29, 2003 DRAFT

IEEE TRANSACTIONS ON COMPUTERS 7
architectures
Architecture Model Exploration Environment
set of pareto−optimal
Problem Specification
input fornext iteration
and performanceexecution cost
battery lifetime,wearability
candidatebindings
candidatearchitectures
functionality,
architecture
usage profile
bindingproblem specific model
generic model architecturegeneration
selectionarchitecture
evaluation
physical constraints
estimationperformance
task−device
hardware resources
information flow
Fig. 1. Modular exploration methodology consists of three main components: problem specification, architecture model
and exploration environment.
of computation that the system needs to perform. The specification also includes data flow
patterns that determine the inter-module communication load arising when different parts of
the computation and the input/output operations are performed on different modules.
The information flow specification assigns to all input and output related tasks in the usage
profile specification a set of body locations on, which they can be executed.
The physical constraints specification defines the wearability criteria and their relative
importance. The wearability of a system depends on many factors ranging from such obvious
and easily quantifiable aspects as size and weight to more subtle issues such as health concerns
(e.g. related to EM radiation or heat dissipation) or esthetic considerations. In general the
choice of the relevant factors also depends on a particular application as well as on the
locations at which the modules are placed. To be able to flexibly accommodate a wide range
of different criteria we use a problem specificwearability factor.
The hardware resource specification provides a set of computation and communication
channel devices that are available for the design. This includes formulas to calculate the
power consumption for different types of computation and communication load, as well as
April 29, 2003 DRAFT

IEEE TRANSACTIONS ON COMPUTERS 8
values for all the different measures used to calculate the the wearability factor.
B. Architecture Model
The architecture model comprises the main interface between the problem specification
and the exploration environment. It consists of two parts: a generic model that describes the
overall types of architectures considered by our methodology and a problem specific model
that incorporates the design constraints of the problem under consideration.
Fig. 2 shows thegeneric model on which our methodology is based. It consists of a set
of modules distributed over the user’s body. Each module contains a number of devices and
communication channel interfaces. The devices can be processors, application-specific ICs
(ASICs), sensors or IO interfaces. We assume that the devices and interfaceswithin a module
can communicate freely at negligible cost and thus ignore the intra-module connections. For
inter-module communication there exists a set of connections. Each connection consists of
one or more physical channels matching the channel interfaces of the corresponding modules.
. . . .
Module mi
Device d2
Interface i1
Interface i2
Interface i3Device d3
Device d4
Device d1
Module m1
Connection e1
Channel c1
Channel c2
Channel c3
. . . .Device d2
Interface i1
Interface i2
Interface i3Device d3
Device d4
Device d1
Connection e2
Channel c1
Channel c2
Channel c3
Connection ei
Channel c1
Channel c2
Channel c3
Fig. 2. The generic system model consists of distributed, partly connected modules containing as possible resources devices
and communication channel interfaces. The connections comprise a set of available physical channels.
The problem specific model is derived from the generic model by combining it with the
problem specification and some additional problem specific information. The model first
defines the system topology by specifying a particular subset of modules and connections
that are to be used. To incorporate the information flow requirements it also assigns to every
April 29, 2003 DRAFT

IEEE TRANSACTIONS ON COMPUTERS 9
task of the usage profile a set of modules on which it may be executed. Since input and
output tasks are associated with body locations in the problem specification, this creates a
binding between modules and body locations. Finally a set of module and interconnection
properties is defined. It contains a specification which of the devices given by the resource
specification can potentially be used for their respective implementation.
C. Exploration Environment
The exploration environment finds architectures that are valid and optimal or close to
optimal for the given design problem. The optimization criteria used for this purpose are
functionality, battery lifetime and wearability. Each architecture is derived from the problem
specific architecture model through an assignment of specific devices and channels to modules
and connections. For the architecture to be valid, the devices assigned to each module must
be a subset of the devices and channels allowed for this module defined in the problem
specific model. Furthermore the performance requirements given by the usage profile must
be satisfied.
1) Optimization Criteria: For an automatic design space exploration to work, the opti-
mization criteria must be formulated in numerical terms and this introduced in the following.
a) Functionality: The functionality itself is defined by the usage profile specification.
We assume that all valid architectures are, in principle, able to provide the functionality.
The influence of the architecture manifests itself in the delay, which will be higher for less
powerful architectures, which on the other hand are likely to consume less power and to be
smaller.
b) Battery Lifetime: To be independent of the particular battery type we use the average
system power consumption as a quantitative measure.
c) Wearability: As a measure of the wearability of a system a weighted sum of wear-
ability factors of all components will be used. This allows a flexible inclusion of different
criteria while providing a single numerical value that can be easily handled in the optimization
process.
2) Exploration Environment: As shown in Fig. 1, the generation of the desired architectures
is an iterative search process conducted in five steps. In the first step the next point to be
visited in the search space is determined by deriving one or more candidate architectures
from the problem specific model. Based on the candidate architectures the tasks specified by
the user profile are then bound to specific devices. In the third step the performance in terms
April 29, 2003 DRAFT

IEEE TRANSACTIONS ON COMPUTERS 10
of execution time and of communication delay and the execution cost (power consumption)
is calculated. In the next step the three optimization criteria functionality, battery lifetime
and wearability are determined. As a final step, a decision based on the optimization criteria
is made on how to proceed with the search. The search is either terminated or the results are
passed on to the first step as a starting point for the selection of the next point to be visited
in the search space.
The above stepwise, modular concept of the exploration environment allows different
search, performance evaluation and wearability measures to be used and freely combined.
In particular different, complex scheduling and load evaluation algorithms developed in
parallel and distributed computing can be used in the ’task-device-binding’ and ’performance
estimation’ modules.
In the current implementation we rely on an evolutionary optimization algorithm that has
been successfully used for similar problems [19]. The execution modeling is based on a
simple statistical model that abstracts from more complex scheduling and data dependence
analysis issues. The wearability quantification used for the examples is based on size, weight
and the differentiation between wired and wireless channels. Section V provides details on
the current implementation.
III. PROBLEM SPECIFICATION
A. Usage Profile Specification
The usage profile specification intends to capture the load characteristics of a wearable sys-
tem. This includes the variation of the computation intensity as well as the spatial distribution
of computation and communication.
To this end, the specification model is hierarchically structured into taskst, applicationsa
and scenarioss. Fig. 3 illustrates an example comprising three scenarios. The tasks constitute
the atomic units of computation and communication. A set of tasks are assembled into an
application. A scenario then contains a set of applications that run concurrently on the system
within predefined hard and soft timing constraints. We assume that at any given time exactly
one scenario is active. This implies that a change in the state of the wearable, e. g. when
responding to a user request, causes another scenario to become active. With regard to a given
usage profile, the percentage devoted to a particular scenario is specified by the scenario
weightWscen.
April 29, 2003 DRAFT

IEEE TRANSACTIONS ON COMPUTERS 11
time
s2 s3
a4
a5
a6
s1
a3
a3
a2
a1
a3
t1
t2
t3
a4
a1
t6
t7
t5t4
a2
a5 a6
s2
s3
s1
Fig. 3. Example of a usage profile with three scenarioss1, s2 and s3. Each scenario comprises a set of concurrently
running applications:s1 = {a1, a2, a3}, s2 = {a3, a4}, ands3 = {a5, a6}. Each application contains a set of tasks, e. g.
a5 = {t1, t2, t3} anda6 = {t4, t5, t6, t7}, represented by a DAG. At any given time, exactly one scenario is active.
1) Tasks: A task t is defined as a self-contained unit of computation that is characterized
by three parameters: the amount of input data, the computational load, and the amount of
output data. There are no restrictions on the size or complexity of a task. Thus, a task can
be a small signal processing kernel, a simple utility, or a complex computation.
To characterize the computational load of a task we use, as a first approximation, its
instruction mix. The instruction mix quantifies the amount and types of instructions required
by a task to process the input data. The instruction mix depends on the algorithm, the input
data, the compiler, and the processor’s instruction set, but is independent of any architectural
parameters of the processor such as the number of execution units, cache sizes, or the like.
To simplify the evaluation we have grouped the instructions into seven classes:
• int-cheap integer instructions (logic, shift, addition, subtraction, comparison),
• int-costly integer instructions (multiplication, division),
• fp-cheap floating-point instructions (addition, subtraction, comparison, miscellaneous),
• fp-costly floating-point instructions (multiplication, division, square root),
• load and store instructions,
April 29, 2003 DRAFT
IEEE TRANSACTIONS ON COMPUTERS 12
JPEG e
ncod
e
JPEG d
ecod
e
MPEG2
deco
de
SUSAN corn
ers
MESA te
xgen
REED dec
ode
ZIP d
ecod
e
RIJNDAEL
deco
de
ADPCM d
ecod
e
RASTAFFT
NN clas
sifica
tion
Inst
ruct
ion
clas
s pe
rcen
tage
s [%
]
0
10
20
30
40
50
60
70
80
90
100int−cheapint−costlyfp−cheapfp−costlyload/storebranchmisc
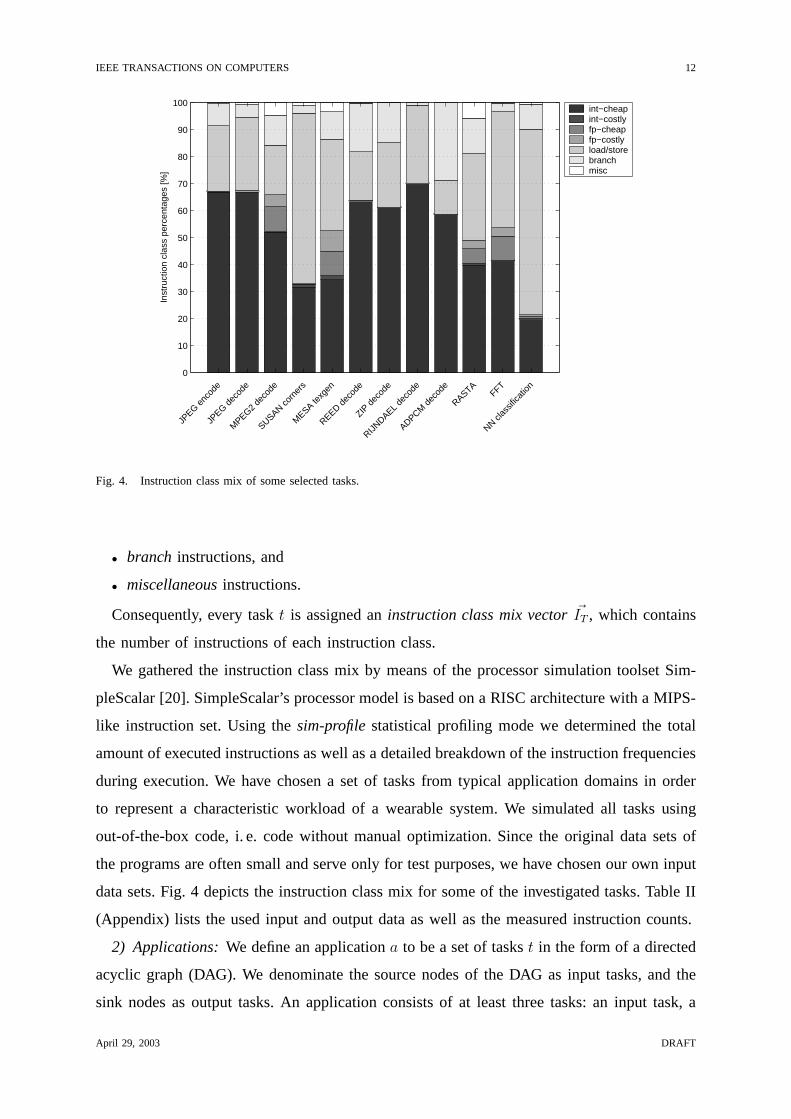
Fig. 4. Instruction class mix of some selected tasks.
• branch instructions, and
• miscellaneous instructions.
Consequently, every taskt is assigned aninstruction class mix vector �IT , which contains
the number of instructions of each instruction class.
We gathered the instruction class mix by means of the processor simulation toolset Sim-
pleScalar [20]. SimpleScalar’s processor model is based on a RISC architecture with a MIPS-
like instruction set. Using thesim-profile statistical profiling mode we determined the total
amount of executed instructions as well as a detailed breakdown of the instruction frequencies
during execution. We have chosen a set of tasks from typical application domains in order
to represent a characteristic workload of a wearable system. We simulated all tasks using
out-of-the-box code, i. e. code without manual optimization. Since the original data sets of
the programs are often small and serve only for test purposes, we have chosen our own input
data sets. Fig. 4 depicts the instruction class mix for some of the investigated tasks. Table II
(Appendix) lists the used input and output data as well as the measured instruction counts.
2) Applications: We define an applicationa to be a set of taskst in the form of a directed
acyclic graph (DAG). We denominate the source nodes of the DAG as input tasks, and the
sink nodes as output tasks. An application consists of at least three tasks: an input task, a
April 29, 2003 DRAFT

IEEE TRANSACTIONS ON COMPUTERS 13
computational task and an output task.
This representation allows to model the computation/communication trade-offs involved
in distributing the execution of an application onto different devices. To this end, the input
and output tasks are treated specially as their computational loads are defined to be zero.
This allows to assign the input and output tasks to the wearable’s IO devices, while the
computational tasks are assigned to the computing devices. This reflects the fact that many
IO devices, e. g. sensors, do not have any computation capabilities. However, if an IO device,
e. g. a smart sensor, provides computation capabilities, computational tasks can be assigned
to it as well.
3) Scenarios: The task specification determines the amount of computation and commu-
nication that needs to be performed on a wearable system. In a particular scenarios, these
figures are translated into computation and communication requirements by assigning each
application two timing parameters: The repetition frequencyR and the maximal latencyDmax,
which is acceptable for the execution.
Typically, wearable systems do not feature such stringent real-time constraints as e. g.
embedded control systems. The real-time constraints of a wearable system come rather from
applications that require a continuous, periodic processing pattern. Examples are the evalu-
ation of context sensor data or the processing of audio and video frames. Our specification
model incorporates such real-time constraints via the repetition frequencyR. However, many
applications are not real-time but latency constrained. A user request satisfied within about
100 ms is usually perceived as instantaneous. The latency constraints are thus an issue of
user preferences. The system’s user friendliness and can be treated as a soft optimization
criteria.
Fig. 5 outlines the computing power requirements of some of the investigated applications.
These performance figures were gathered by combining the measured numbers of executed
instructions of the tasks with assumed values forR or Dmax as listed in Table II (Appendix).
The results show the diverse requirements of the different application types. Note that the
ranges have been intentionally chosen large to cover a wide variety of scenarios.
B. Information Flow
The information flow specification is based on the fact that every possible input/output
signal is associated with a particular input/output task of the usage profile. Thus for example,
April 29, 2003 DRAFT

IEEE TRANSACTIONS ON COMPUTERS 14
10−2
10−1
100
101
102
103
104
JPEG e
ncod
e
JPEG d
ecod
e
MPEG2
deco
de
SUSAN corn
ers
MESA te
xgen
REED dec
ode
ZIP d
ecod
e
RIJNDAEL
deco
de
ADPCM d
ecod
e
RASTAFFT
NN clas
sifica
tion
Com
putin
g po
wer
req
uire
men
ts [M
IPS
]
Fig. 5. Computing power requirements of some selected applications.
whenever output on a display is required, an appropriate output task would be contained in
the corresponding application.
The information flow specification starts with a set of possible locationsp relevant to a
particular problem. It then assigns every taskt a subset of allowed locationsP t ⊆ P at
which it can potentially be executed.
C. Physical Constraints
Physical constraints reflect wearability consideration that determine how obtrusive the
system appears to the user. Obvious factors to include are the size, weight, EM radiation
emission, and heat dissipation of the system. However depending on the application, the
user’s personal preferences, and the location of the system components on the body different
factors might be relevant and/or they might be assigned different relative importance.
Deciding which factors are how important for the wearability of a system is up to ergonomic
research and social acceptability studies and is not discussed in this paper. Instead we focus on
providing a flexible mechanism for the inclusion of different constraints and their respective
importance in the architecture evaluation. This is done through awearability factor and a
power weight vector that are computed as described below.
April 29, 2003 DRAFT

IEEE TRANSACTIONS ON COMPUTERS 15
a) Wearability Factor: The wearability factor is calculated by awearability vector �w
and awearability weight matrix W. Each element of the vector�w is devoted to a different
factor influencing the wearability. The elements of the wearability weight matrixW specify
the relative importance of the factors addressed by the wearability vector for different body
locations, where the p-th column denotes all weights at locationp. The abstract wearability
factor of a resource placed at a particular location is then given by the product�W p · �w. These
abstract values are then used to compute the system wearability factor in section V.
b) Power Weight Vector: Batteries and power generation devices or power transmission
wires can be more or less burdensome depending on the location of the module. In addition
some body locations provide much better conditions for power generation then other. Large
area solar cells can, for example, be easily placed on the outer, upper back surface of clothing.
By contrast, energy generation in the glasses is very difficult.
To reflect the above considerations thepower weight vector �wP specifies a set of location
dependent, problem specific weights for the power consumption of modules. If a module is
placed at a locationp then its power consumption is scaled by multiplying it with thep-th
element of the vector�wP .
D. Resource Specification: Computing Devices
The resource specification describes the computing devices and communication channels
on which the system under investigation is based. It consists of three parts: (1) a definition
of a set of parameters used to describe each device or channel, (2) formulas that translate
those parameters into power consumption and delay values for a particular load specification,
and (3) a set of accordingly parameterized devices as well as a set of channels, which can
be used for the exploration.
This section concentrates on computing devices. Communication channel specification will
be described in Section III-E.
1) Specification Parameters: Each computing deviced is characterized by three groups
of parameters: execution speed, electrical parameters and wearability factor. At this stage of
the evaluation, memory architecture and memory energy consumption is not modeled, but
our framework can be easily extended. As a first approximation we assumed that memory
configuration is independent of the computing device configuration.
Execution speed: The execution speed specification consists of two parts: device clock
frequency and cycle number per instruction class. To accommodate the fact that many devices
April 29, 2003 DRAFT

IEEE TRANSACTIONS ON COMPUTERS 16
can operate at a wide frequency range depending on the system load a minimum clock
frequencyfmin and a maximumfmax are specified.
For each deviced the number of cycles for the different instruction classes are given by
the instruction class execution time vector �ID. Instructions are classified according to their
complexity as described in Section III-A.1. The average execution time is calculated from the
data sheet for each class. Non-implemented instructions are emulated by existing instructions
[21], [22]. In our implementation, we follow [23] in estimating an average number of cycles
per instruction (CPI) for superscalar devices; describing the speedup resulting from instruction
parallelism. We assume a CPI of 0.83 for a two-issue and of 0.58 for a four-issue processor.
In applications where power consumption is critical often Field-Programmable Gate Arrays
(FPGAs) and ASICs are employed for critical tasks. In these cases, the instruction based
specification described above is not applicable. Instead, they can be considered at task level.
A task implemented on an FPGA or ASIC can be incorporated directly as a task-device pair
with simulated or measured execution time, energy consumption and wearability factor.
Electrical parameters: The electrical parameters characterize the power consumption
of a device in different operation modes. They include idle powerPi, sleep powerPs and
energy consumption per cycle.
For the time being, we use idle power and sleep power from the data sheet. And we follow
the approximation from [24], the power consumption of the Hitachi SH-4 and the SA-1100
devices differs less than 10% during program execution. Consequently, we assumed as a first
order model that the consumed energy only depends on the execution time of the instructions.
To accommodate to the properties of dynamic voltage scaling (DVS) minimal and maximal
energy consumption per cycleEmin andEmax are specified.
Emin specifies the energy consumption per cycle when running at the minimum cycle rate
fmin at the lowest possible voltage. Accordingly,Emax is the maximum value for the highest
speedfmax and the required higher voltage.
The energy consumptionE at frequencyf is interpolated using the equation
E = Edyn + Estat = ρ1 ·(
f
fmin
)2
+ ρ2 · fmin
f, (1)
where the parametersρ1 andρ2 are calculated from the specifiedEmin andEmax values
[25].
April 29, 2003 DRAFT

IEEE TRANSACTIONS ON COMPUTERS 17
2) Performance Calculation: To evaluate the performance of a set of tasks the following
calculations for delay and for power consumption are carried out.
First, the execution timeTe of a taskt on deviced at a given cycle ratef is calculated
with
Te = �IT · �IDT · 1
f. (2)
The total loadLD of a deviced is
LD =∑t∈D
T te · Rt . (3)
Rt is the the task repetition frequency, which is identical to the application repetition fre-
quency. All taskt mapped to deviced have to be considered.
The device power consumptionPD is computed from the load according to
PD =
Ps for LD = 0 ,
(1 − LD)Pi + LD · E · f for 0 < LD ≤ 1 ,
not valid forLD > 1 .
(4)
The effective execution timeTef is then approximated by the following equation:
Tef =Te
1 − (LD − Te ·R)(5)
It is assumed that on average a task is completed withinTef [19]. The effective execution
time is used to verify the application’s timing constraints.
3) Device Set: The specification of the device set is based on an abstract classification of
devices into five classes: low-power and low-performance CPUs1, low-power and medium-
performance CPUs2, integer DSPs, floating-point DSPs, and desktop CPUs. For each class
representative devices have been selected and investigated as summarized in Table III (Ap-
pendix).
E. Resource Specification: Communication Channels
A communication channelc serves as interface between two modules that consume and
generate data. One objective in the design of the communication channel is to reduce the
power consumption and hardware overhead for the transmission of data as much as possible
1Includes PICs and micro controllers.
2Typically low power and system clock> 25MHz.
April 29, 2003 DRAFT

IEEE TRANSACTIONS ON COMPUTERS 18
while still catering to the dynamics of a wearable system. This goal can be achieved by
means of two well known strategies: sharing of channels between different tasks that are
exchanging data, and collecting data to enable a transmission in the form of bursts.
The purpose of this section is to derive a model that leads to the estimation of the relevant
transmission parameters such as bandwidth, packet delay and power consumption for a
shared communication channel with bursty transmission. This method will then be used
in conjunction with the corresponding estimation techniques for computing components in
order to estimate the characteristic parameters of a given wearable system architecture under
different scenarios.
The computing modules of a wearable system are linked by parameterized communication
channels. The allocation and binding of the tasks onto the modules and their components
define the communication requirements for these channels. As there may be several tasks
running simultaneously, the communication channels may be shared among them.
At first, we describe the parameters which characterize the tasks and communication
channels.
1) Communication Model: For the estimation of the communication properties we assume
that each task generates data periodically. Each of then periodic inputsk is characterized
by sendinglk data units with a periodτk. A maximal deadlineδk is associated with every
data sample of sizelk in order to specify when the transmission of the data sample needs to
be completed.
All channels are assumed to be bidirectional and to support acknowledged error free data
transfers. A channel type has a maximum data rateBmax and an end to end delayTd of
data packets. We distinguish four operating states of each channel type: transmitting where
data are transmitted with the maximal data rateBmax, receiving where data are received, idle
where the modules are still connected to each other but no data are transmitted and standby
where the power consumption is low while the device can still be controlled.
For a connection we need a receiving as well as a transmitting unit, introduced in Section II-
B as channel interfaces. Therefore, for the standby state we have a power consumption of
2 · Ps. When bursts are transmitted, the resulting power consumption isPa = Ptx + Prx .
The transition from state standby to state transmitting/receiving takes timeTi with power
consumptionPa. As long as the channel stays connected and is not transmitting any burst
the devices are in the idle state with a consumption of2 · Pi.
We consider two possible modes: in continuous mode, the channel performs the sequence
April 29, 2003 DRAFT

IEEE TRANSACTIONS ON COMPUTERS 19
idle–transmitting/receiving–idle and in burst mode, we find standby–transmitting/receiving–
standby. For the estimation it is supposed that the communication channel chooses the most
power efficient mode which still satisfies the delay and bandwidth constraints.
Modulemi
Modulemj
tx rxChannel c
Bmax Td Ti Ptx Prx Pi Ps wc
lk
δk
τk
ucontinuous
burst
Ti+Td l*
Fig. 6. The communication channel model with continuous and burst modes.
2) Continuous Mode: Here, we calculate the power consumption and communication delay
if the communication channel is used in the continuous mode, i. e. its state switches only
between transmitting/receiving and idle. The worst case delayTwc occurs, if all channels
submit their data at the same time resulting in
Twc =
∑nk=0 lkBmax
+ Td . (6)
The channel power consumption in a specific scenario is given by
PC = u · Pa + 2(1 − u) · Pi , (7)
whereu = B−1max
∑nk=1 lk/τk denotes the channel utilization.
3) Burst Mode: For modeling purposes, we assume a periodic activity of a channel. We
now calculate the maximal periodτ ∗ such that all delay constraints for the transmission
can be satisfied. In addition, we determine the maximal sizel∗ of a burst, i. e. the maximal
amount of data to be transmitted. Based on this information, we can calculate the resulting
power consumption. It can be seen that all deadlines are satisfied if the period of the channel
is τ ∗ = min1≤k≤n(δk/2). We get the worst case delay for transmitted data packets
Twc = min1≤k≤n
(δk) + Td . (8)
Considering the case when all tasks start sending their data at the same time, we get the
maximal burst size
l∗ =n∑
k=1
lk
⌈τ ∗
τk
⌉. (9)
April 29, 2003 DRAFT

IEEE TRANSACTIONS ON COMPUTERS 20
As we are switching fromtransmitting/receiving to standby and then back totransmit-
ting/receiving between two bursts, we require thatl∗/Bmax + Ti ≤ τ ∗ for using burst mode.
Finally, the resulting power consumption in burst mode can be calculated by averaging the
time intervals in which the communication channel is in its different states. As a result, we
obtain
PC = u · Pa +Ti
τ ∗· Pa + 2
(1 − u− Ti
τ ∗
)· Pi . (10)
4) Device Set: For the experimental investigations, wired and wireless channel types were
considered. Measurements of the power consumption in each operating mode were performed
using a benchtop multimeter with remote logging function and a PC to control the devices.
For those channel types that were only available as chipsets the data was derived from data
sheets. We have considered four classes: (1) low-end wireless, (2) high-end wireless, (3) low-
end wired, and (4) high-end wired. For each class different variants have been considered
(see Table IV for details) as well as different operating modes. For the wireless devices these
are the different transmit power and power saving schemes.
The power consumption was measured for fully loaded channels in receivingPrx and
transmittingPtx as well as in idlePi and standbyPs modes. Furthermore, the startup time
for initializing the device and setting up a channelTi and the round trip time of a packet
2 · Td were measured.
IV. CANDIDATE ARCHITECTURE REPRESENTATION
The generation of a candidate architecture involves two steps: (1) the combination of the
generic architecture model with information driven from the problem specification and with
additional problem specific information, this leads to the problem specific model and (2)
picking a particular configuration out of this search space.
A. Problem specific model
The problem specific model provides a set of constraints on the system topology, the
resources available on each module, and task module assignment.
1) System Topology: The system topology determines, which modules the system contains
and how they can be interconnected. It specifies a set of modulesM and an interconnection
matrix I. For each pair of modulesmi, mj the corresponding matrix elementIij is set to 1
if a connection exists between them, otherwise it is set to 0.
April 29, 2003 DRAFT

IEEE TRANSACTIONS ON COMPUTERS 21
2) Module Resource Set: The module resource set specifies the types of devices and
channels that a module can contain. For every modulem a subset of devicesDm ⊆ D is
given thatm can contain.
Similarly the implementation of each connection is restricted to a subset of channelsCij ⊆C from the set of available channels.
3) Task Resource Set: The task resource set describes on which module and on which
device a certain task can run. For each taskt it specifies a subset of modulesMt ⊆ M and
devicesDt ⊆ D on which t is allowed to be executed (see Fig. 7).
Load Specification
Device d1
Device d2
Device d3
Module m2
Architecture Specification
Application a1
Input Task t1
Task t2
Task t3
Task t4
Output Task t5
. . .
Connection e4
Channel c1
Channel c2
Device d1
Device d2
Module m1
Connection e3
Channel c1
Channel c2
Channel c3
Fig. 7. Module Resource Set: Specifies types and channels that a module can contain. Task Resource Set: Defines for
each task on which module and on which device a task can run.
B. Architecture Representation
Picking a particular architecture out of the search space defined by the problem specific
model is done throughallocation functions and bindings. For every modulem the device
allocation functionαd,mD : Dm → {0, 1} assigns to each deviced ∈ Dm the value1 (allocated)
or 0 (not allocated). In a similar way thechannel allocation function αijC : Cij → {0, 1} is
defined for each connection.
The assignment of a tasks to certain device on a certain module is done by task-device
binding.
Because of the correspondence between tasks and body locations given by the information
flow, the task binding implicitly restricts each module to a subset of certain body locations:
April 29, 2003 DRAFT
IEEE TRANSACTIONS ON COMPUTERS 22
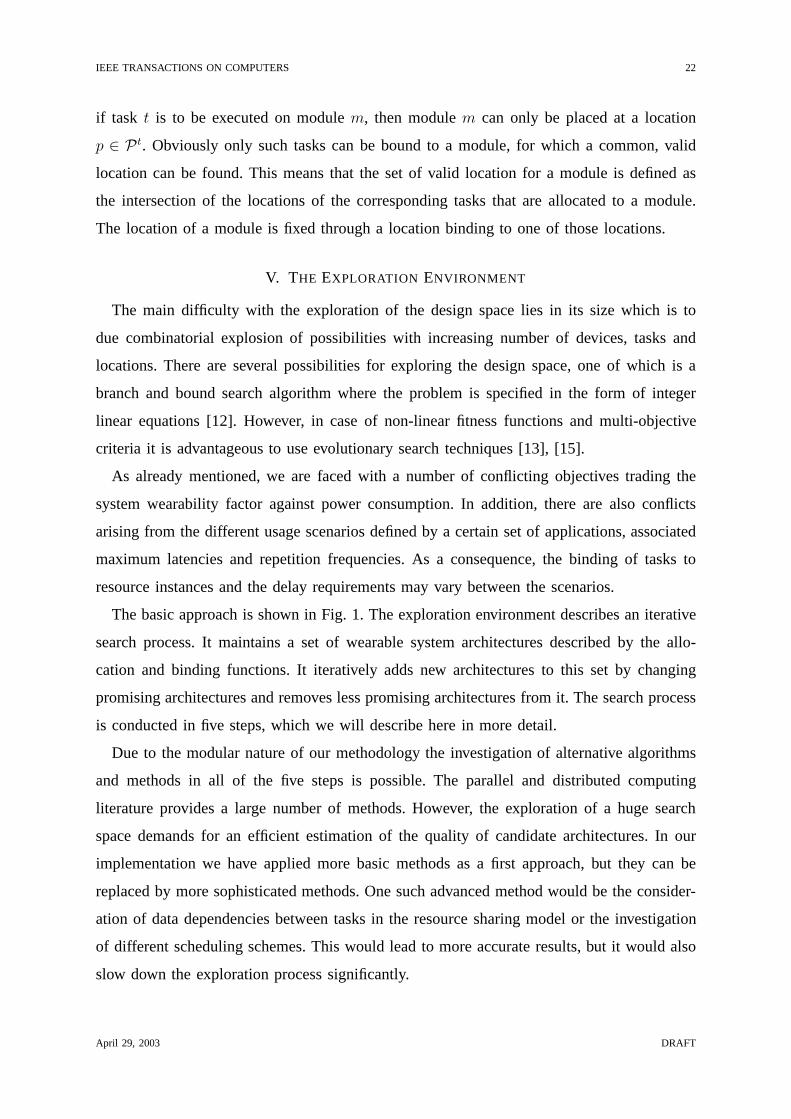
if task t is to be executed on modulem, then modulem can only be placed at a location
p ∈ Pt. Obviously only such tasks can be bound to a module, for which a common, valid
location can be found. This means that the set of valid location for a module is defined as
the intersection of the locations of the corresponding tasks that are allocated to a module.
The location of a module is fixed through a location binding to one of those locations.
V. THE EXPLORATION ENVIRONMENT
The main difficulty with the exploration of the design space lies in its size which is to
due combinatorial explosion of possibilities with increasing number of devices, tasks and
locations. There are several possibilities for exploring the design space, one of which is a
branch and bound search algorithm where the problem is specified in the form of integer
linear equations [12]. However, in case of non-linear fitness functions and multi-objective
criteria it is advantageous to use evolutionary search techniques [13], [15].
As already mentioned, we are faced with a number of conflicting objectives trading the
system wearability factor against power consumption. In addition, there are also conflicts
arising from the different usage scenarios defined by a certain set of applications, associated
maximum latencies and repetition frequencies. As a consequence, the binding of tasks to
resource instances and the delay requirements may vary between the scenarios.
The basic approach is shown in Fig. 1. The exploration environment describes an iterative
search process. It maintains a set of wearable system architectures described by the allo-
cation and binding functions. It iteratively adds new architectures to this set by changing
promising architectures and removes less promising architectures from it. The search process
is conducted in five steps, which we will describe here in more detail.
Due to the modular nature of our methodology the investigation of alternative algorithms
and methods in all of the five steps is possible. The parallel and distributed computing
literature provides a large number of methods. However, the exploration of a huge search
space demands for an efficient estimation of the quality of candidate architectures. In our
implementation we have applied more basic methods as a first approach, but they can be
replaced by more sophisticated methods. One such advanced method would be the consider-
ation of data dependencies between tasks in the resource sharing model or the investigation
of different scheduling schemes. This would lead to more accurate results, but it would also
slow down the exploration process significantly.
April 29, 2003 DRAFT

IEEE TRANSACTIONS ON COMPUTERS 23
A. Architecture Generation
In the first iteration a set of random architectures are generated. In the following iterations
new architectures are derived from promising solutions selected by the architecture selection
unit. This is done by a randomized mutator operator, which alters the device and channel
allocation to find new architectures in the search space near the existing ones.
B. Task–Device Binding
Since we have different processing demands in different scenarios, we define the task
binding for each usage scenario separately. The task binding is coupled with the architecture
generation to ensure that every task runs on an allocated target device and that the restrictions
imposed by the problem specific model and the information flow. As in the architecture
generation we perform a randomized local search to derive new task bindings from existing
ones.
C. Performance Estimation
To estimate the performance of a candidate architecture we investigate the models described
in the hardware resource specification. In particular, the estimation unit computes for each
application in a specific scenario the latency consisting of the effective execution timesTef
of the tasks and the worst case delaysTwc of the communication channels.
D =∑
Tef +∑
Twc (11)
The estimation unit also determines for all allocated devices the estimated power consump-
tion as described in section III-D and III-E.
D. Architecture Evaluation
Based on the estimated execution cost and the performance of each architecture, the
evaluation unit computes the values for the three optimization criteria.
1) Functionality: The functionality criteria is evaluated by means of the two application
timing constraintsR andDmax. While the repetition frequency is treated as a hard constraint,
we regard the maximal latency as a soft constraint. The architectures need to provide enough
performance to meet all repetition frequencies, however we allow small exceeding of the
maximal application latencies. We use the accumulated differences of the estimated latencies
D and the specified maximum latenciesDmax to measure the functionality.
April 29, 2003 DRAFT

IEEE TRANSACTIONS ON COMPUTERS 24
2) Battery Lifetime: As a quantitative measure of the battery lifetime, we use the aver-
age system power consumption. Following equations show how the power consumption is
accumulated.
The module power consumptionPmod is the sum of the power consumption of all allocated
devices and channels for a specific modulem under a given scenarios. This sum is weighed
with the element corresponding to locationp of the power weight vector�wP .
Pm,smod =
∑d∈Dm
αdD · wP · P d,s
D +1
2
∑c∈Cm
αcC · wP · P c,s
C (12)
The device power consumptionPD and the channel power consumptionPC used have
been defined in equations 4, 7 and 10.
The scenario power consumptionPscen of a specific scenarios is defined by the sum of
the module power consumptionPmod for all modulesm.
P sscen =
∑m∈M
Pm,smod (13)
Finally the system power consumption is defined by the sum of the scenario power
consumptionsPscen for all considered usage scenarioss ∈ S. The sum is weighed by the
scenario weightsWscen.
Psys =
∑s∈S P
sscen ·W s
scen∑s∈S W s
scen
(14)
3) Wearability: The module wearability factorFmod is the sum of the abstract wearability
factors of all allocated resources for a specific modulem at a given locationp. In our
case the wearability vectors of computing devices�wD and communication channels�wC are
weighted with the according weight vectors introduced in section III-C according to the
location selected for this module.
Fmmod =
∑d∈Dm
αdD · �W p · �wD +
∑c∈Cm
αcC · �W p · �wC (15)
The system wearability factorFsys is defined by the sum of the module wearability factors
Fmod of all modulesm.
Fsys =∑
m∈MFm
mod (16)
April 29, 2003 DRAFT

IEEE TRANSACTIONS ON COMPUTERS 25
E. Architecture Selection
The goal of the selection unit is to determine implementations with Pareto-optimal fitness
vectors. The architectures associated with Pareto-optimal fitness vectors represent the trade-
offs in the wearable system design.
We have used the well known evolutionary multi-objective optimizer SPEA2 [13], [26],
[27] to select promising architectures for the next iteration. It may be noted that due to the
heuristic nature of the search procedure, no statements about the optimality of the final set
of solutions can be made. However, there is experimental evidence that the found solutions
are close to the optimum even for realistic problem complexities.
VI. EXPLORATION RESULTS
In an initial wearable design space study the methodology described in this paper has been
used to simulate a wide range of systems and scenarios, some consisting of up to 100 tasks
and 130 devices. The concepts of the proposed design methodology have been applied to
characterize the WearARM [28] and WearNET [29] demonstrator platforms. In this section
however, we focus on the detailed discussion of a simple example. In doing so, we emphasize
the most important features of the simulation environment and provide first insights into the
trade-offs involved in the design of wearable computing systems. We explain the performance
gain of the pareto front compared to the the WearARM/WearNET platform.
A. Example Description
The example considers a system in a mobile environment aimed at interactively displaying
and recording JPEG images and having simple network access. Figure 8 outlines the example
system. Information is displayed on a head up display unit, which also comprises an integrated
camera for image acquisition. Speech commands via a microphone are accepted and a
simple wrist-mounted motion sensor is used as mouse replacement. In addition, the motion
sensor and the microphone are used for context monitoring. As has been shown in [29], the
combination of these two sensors together with appropriate background information on the
user’s whereabouts allow to derive complex information on his activity.
1) Usage Profile: We assume the load of the system to be specified by five scenarios. Most
of the time (70%) context monitoring and recognition tasks are running and evaluating the
motion and sound signals. The remaining 30% of the time is equally partitioned into scenarios
that combine the context monitoring applications with (1) an image display application, (2)
April 29, 2003 DRAFT

IEEE TRANSACTIONS ON COMPUTERS 26
Module visual-head
Module mainModule motion-wrist
Module microphone
Audio input:Speech recognition Video output: Head up display
Video input: Camera
Motion input: MouseControl and data processingStorage
Fig. 8. System specification for the example used in the case study. Shown are the five locations with the main assigned
input/output tasks and the interconnection of the modules.
an image recording application, (3) a speech recognition application, and (4) a set of network
access related applications.
2) Information Flow and Physical Constraints: Each input/output task is assigned to one
or several locations. In particular, the display output and the image recording input tasks are
assigned to the location (visual-head) to target a combined display/camera module worn in the
glasses. The motion sensor input tasks are assigned to a location on the wrist (motion-wrist)
and the audio input tasks to a location near the neck (microphone). A fourth location (main)
is defined somewhere on the lower back for a central computing module, which connects all
the peripherals.
The wearability weight matrix and the power weight vector are dictated by the placement,
with the locationvisual-head being highly sensitive to wearablility and power factors and
the locationmain being fairly insensitive to both.
All connections can be either wired or wireless. However, in this example wired channel
interfaces are punished by a wearability vector with increased values. In particular for the
connectionsvisual-head↔main and motion-wrist↔main, wired connections are considered
expensive because wires running between different body parts are rather disturbing.
3) Resource Specification: For the exploration of the example system we used the hardware
devices described in Sections III-D and III-E and listed in Tables III and IV (Appendix).
April 29, 2003 DRAFT

IEEE TRANSACTIONS ON COMPUTERS 27
B. Results
Fig. 9 shows the final population of a design space exploration run after 500 generations
with a population size of 100 architectures. This optimization run took less than 20 minutes
on a SunBlade 1000. Each dot in Fig. 9 represents a Pareto-optimal system architecture. This
includes the set of allocated devices in the modules, the choice of channels for the module
connections and the binding of tasks to devices for each scenario. In Table I the device and
channel allocation of three selected design points and our WearARM/WearNET system are
listed to give an example of the trade-offs involved in the wearable system design.
10 15 20 25
B
worse
better
C
A
WearArm/WearNet
30 35 40 451000
1500
2000
2500
3000
3500
wireless
wired
System Power Consumption [mW]
Sys
tem
Wea
rab
ility
Fig. 9. Final population of a design space exploration run. The dotted line represents the pareto front with the pareto
optimal design points. All points on the upper left side of the pareto front are dominated by at least one pareto point. The
figure also shows three selected architectures (A-C) and the WearArm/WearNet system for comparison.
The allocation of the channels is a dominating factor, architecture B and C have the same
CPU resources but different communication channel selection. Power and wearability differs a
factor 3. In general we can say, that in the lower right region there are solutions with wireless
April 29, 2003 DRAFT

IEEE TRANSACTIONS ON COMPUTERS 28
TABLE I
EXAMPLE IMPLEMENTATIONS OF DESIGN POINTS TAKEN FROMFIG. 9.
Designs: A B C WearArm/WearNet
Devicesa
main xScale xScale, xScale SA-1110
visual-head tms320c55xx tms320c55xx tms320c55xx tms320VC-150
motion-wrist - MSP430F13x MSP430F13x MSP430C33x
microphone - - - -
Connections to module mainb
visual-head BT P2P BT P2P CAN USB
motion-wrist RFM RFM I2C UART
microphone RFM RFM I2C UART
a see Table III (Appendix) for full name and description.b see Table IV (Appendix) for full name and description.
connections exclusively. Moving to the upper left region we find solutions that increasingly
use wired connections, which are more power efficient but less wearable.
We applied this design methodology to characterize our WearARM/WearNET system. The
fitness values are about a factor 2 away from the pareto front (see fig. 9). We can explain the
improvements need to be taken to reach the front. The StrongARM SA-1110 is exchanged
with the newest Intel ARM CPU (xScale), which has not been available during system design.
Same is true for the newer DSP in the visual module. To reach the pareto point C, we need
to switch from the standard computer connections (e.g. RS232) to more power efficient ones
(e.g. I2C Bus).
As the examples above show, we can explain the simulation results and their ordering in
the pareto front. But the search space includes so many possible solutions, that a brute force
method would take too long, nor would a designer think of all possible solutions.
We can recognize that the smallest implementation, design A, is not completely centralized.
The reason for this is the frame buffer, which always requires at least a simple processor to
be assigned to thevisual-head module. Since a device has to be allocated for this task in
any case, it may be worth to allocate a more powerful device that could also execute other
tasks like JPEG encoding and decoding. The exploration has shown to evolve to exactly this
solution.
April 29, 2003 DRAFT
IEEE TRANSACTIONS ON COMPUTERS 29
Module visual-head
BT_P2PSA-1110
Module main
MSP430F13x
RFM
xScale
BT_P2PRFM
Module motion-wrist
MSP430F13x RFM
Module microphone
RFM
Connection to external module extension
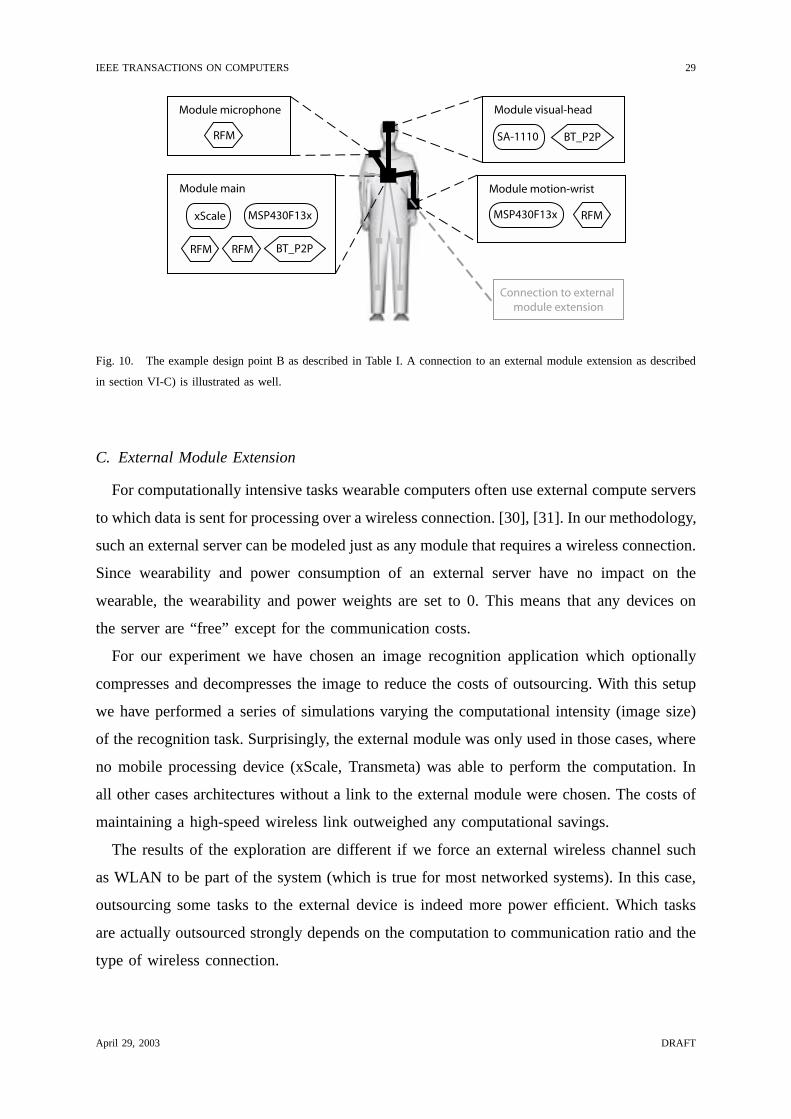
Fig. 10. The example design point B as described in Table I. A connection to an external module extension as described
in section VI-C) is illustrated as well.
C. External Module Extension
For computationally intensive tasks wearable computers often use external compute servers
to which data is sent for processing over a wireless connection. [30], [31]. In our methodology,
such an external server can be modeled just as any module that requires a wireless connection.
Since wearability and power consumption of an external server have no impact on the
wearable, the wearability and power weights are set to 0. This means that any devices on
the server are “free” except for the communication costs.
For our experiment we have chosen an image recognition application which optionally
compresses and decompresses the image to reduce the costs of outsourcing. With this setup
we have performed a series of simulations varying the computational intensity (image size)
of the recognition task. Surprisingly, the external module was only used in those cases, where
no mobile processing device (xScale, Transmeta) was able to perform the computation. In
all other cases architectures without a link to the external module were chosen. The costs of
maintaining a high-speed wireless link outweighed any computational savings.
The results of the exploration are different if we force an external wireless channel such
as WLAN to be part of the system (which is true for most networked systems). In this case,
outsourcing some tasks to the external device is indeed more power efficient. Which tasks
are actually outsourced strongly depends on the computation to communication ratio and the
type of wireless connection.
April 29, 2003 DRAFT
IEEE TRANSACTIONS ON COMPUTERS 30
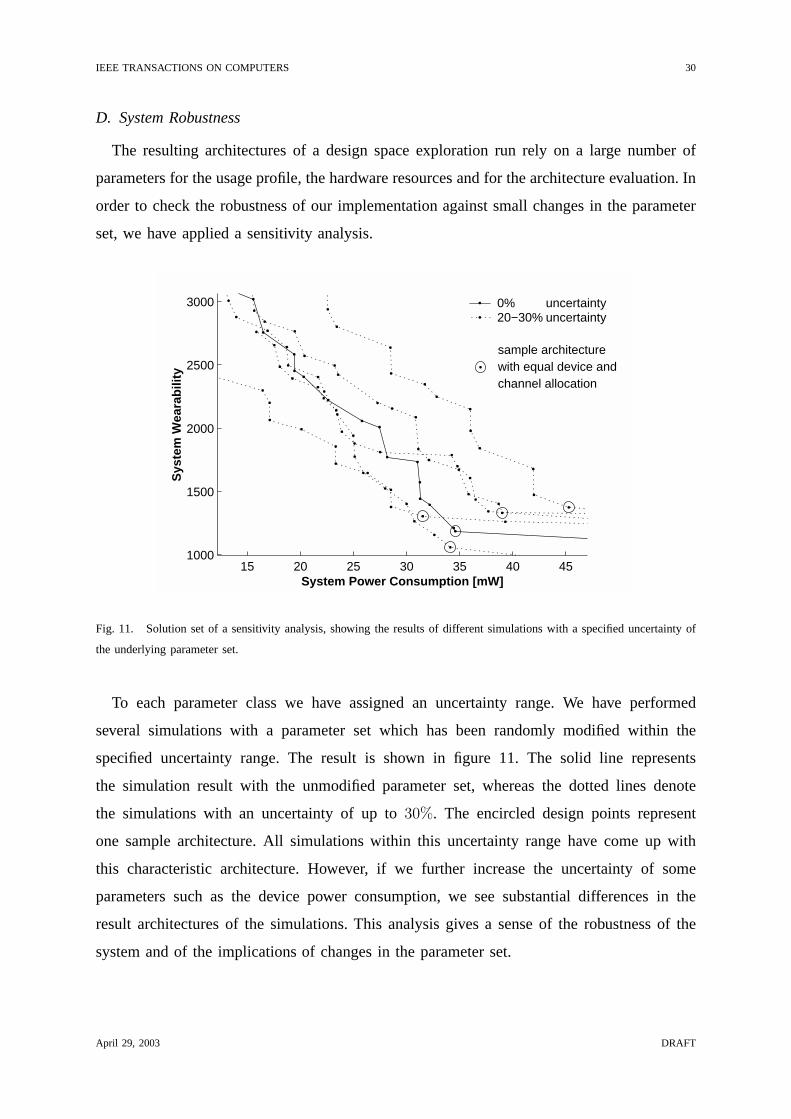
D. System Robustness
The resulting architectures of a design space exploration run rely on a large number of
parameters for the usage profile, the hardware resources and for the architecture evaluation. In
order to check the robustness of our implementation against small changes in the parameter
set, we have applied a sensitivity analysis.
15 20 25 30 35 40 451000
1500
2000
2500
3000
System Power Consumption [mW]
Sys
tem
Wea
rab
ility
0%
channel allocationwith equal device and
uncertaintyuncertainty
sample architecture
20−30%
Fig. 11. Solution set of a sensitivity analysis, showing the results of different simulations with a specified uncertainty of
the underlying parameter set.
To each parameter class we have assigned an uncertainty range. We have performed
several simulations with a parameter set which has been randomly modified within the
specified uncertainty range. The result is shown in figure 11. The solid line represents
the simulation result with the unmodified parameter set, whereas the dotted lines denote
the simulations with an uncertainty of up to30%. The encircled design points represent
one sample architecture. All simulations within this uncertainty range have come up with
this characteristic architecture. However, if we further increase the uncertainty of some
parameters such as the device power consumption, we see substantial differences in the
result architectures of the simulations. This analysis gives a sense of the robustness of the
system and of the implications of changes in the parameter set.
April 29, 2003 DRAFT

IEEE TRANSACTIONS ON COMPUTERS 31
VII. CONCLUSION AND FUTURE WORK
The vision of wearable computing addressed in this paper aims at intelligent, environment
aware systems unobtrusively embedded into the mobile environment of the human body.
The design of such heterogeneous and distributed systems needs to address a variety of
conflicting criteria. These include the ability to efficiently execute dynamic computing loads,
the necessity of placing sensors and IO modules at different locations on the user’s body,
and stringent limits on size, weight and battery capacity.
We treat the design of wearable systems as a multi-objective optimization process based
on four factors: the envisioned usage profile, the physical constraints, the information flow
requirements and the deployed hardware resources. We have derived formal cost metrics ex-
pressing these factors, based on an abstract load and architecture specification in conjunction
with a hierarchical resource specification model for computing devices and communication
channels. To this end, efficient and precise estimation algorithms were developed yielding
performance, power consumption, cost and system wearability measures. Embedded in an
automatic design space exploration environment that evolves a set of Pareto-optimal wearable
architectures, these algorithms provide a methodology for reliable, quantitative analysis and
systematic design of wearable systems. To our knowledge, this is the first time that such a
methodology has been used for the design of wearable systems.
As a validation of our work we have investigated a typical wearable application and
a system consisting of four modules (display/camera, microphone, motion sensor, main
module). In this context, quantitative results were presented, showing that under which
circumstances distributed heterogeneous architectures outperform conventional centralized
systems. We have been able to show that the allocation of the communication channels is a
dominating factor. Depending on the communication costs, a different grade of distribution
of the computation power is selected. The analysis also discusses the interaction between a
wearable system and an external server via a wireless link.
A. Future Work
Future work needs to focus on two areas: model refinements and elaborate design space
exploration.
The methodology described in this paper has been designed in such a way that further
extensions can be easily incorporated. For more accurate architecture representation the
following extensions will be investigated in the future:
April 29, 2003 DRAFT

IEEE TRANSACTIONS ON COMPUTERS 32
• an improved communication model using a communication-on-demand approach,
• the power consumption of intra-module communication,
• a more detailed representation of the device wearability that will consider intra-module
interconnection, limited module size and EM radiation.
• the memory requirements as well as the memory size, configuration and power con-
sumption, and
• mass storage requirements including the trade-offs between harddisk, flash and external
storage.
In our methodology we can model operation system overhead by just another set of tasks
in the usage profile e.g. a scheduler task. These tasks will be defined in the future.
In terms of design space exploration it is our goal to perform an extensive study based
on complex dynamic loads and different architectures. Such an exploration will provide a
systematic quantitative basis for the development of our next generation wearable systems. In
addition, the exploration will turn to investigate the impact of technology developments, as
for example specified by the SIA roadmap [32], on the architectural trade-offs. To this end,
the exploration will be based on abstract devices from the classes defined in Section III-D.3
parameterized with appropriate technology features.
APPENDIX
The appendix comprises Tables II, III and IV.
ACKNOWLEDGMENTS
The authors would like to thank Marco Laumanns, Simon K¨unzli and Samarjit Chakraborty
for their help with the simulation environment and active discussion of the models, and Tobias
Lehmann for his work on dynamic voltage scheduling.
This research is supported by ETH Zurich under the Polyproject “Miniaturized Wearable
Computing: Technology and Applications” as well as the National Competence Center in
Research on Mobile Information and Communication Systems (NCCR-MICS), a center sup-
ported by the Swiss National Science Foundation under grant number 5005-67322.
REFERENCES
[1] M. Weiser, “The computer for the 21st century,”Scientific American, vol. 265, no. 3, pp. 66–75, Sept. 1991.
[2] S. Mann, “Wearable computing as means for personal empowerment,” inProc. 3rd Int. Conf. on Wearable Computing
(ICWC), May 1998.
April 29, 2003 DRAFT

IEEE TRANSACTIONS ON COMPUTERS 33
TABLE II
CHARACTERIZATION OF SOME SELECTED APPLICATIONS. COLUMNS 2–4 SPECIFY INPUT AND OUTPUT DATA AND THE
MEASURED NUMBER OF EXECUTED INSTRUCTIONS. COLUMN 5 SHOWS THE ASSUMED TIMING CONSTRAINTS
(DEPENDING ON THE APPLICATION EITHER THE REPETITION FREQUENCYR OR THE MAXIMUM LATENCY Dmax).
COLUMN 6 LISTS THE DERIVED COMPUTING POWER REQUIREMENTS.
Application Input Data Output Data Instruction Timing Comp. Power
Count Constraints Requirements
(R or Dmax) [MIPS]
JPEG encode [33] 1280x1024 image 1280x1024 image 238,308,913 0.1 – 10 s 24 – 2,383
JPEG decode [33] 1280x1024 image 1280x1024 image 159,315,874 0.1 – 1 s 159 – 1,593
MPEG2 decode [33] 4-frame moviea 4 raw framesa 182,888,390 4 – 7.5 Hz 732 – 1,372
SUSAN corners [34] 784x576 image corner coordinates 222,384,178 0.05 – 1 s 222 – 4,447
MESA texgen [33] 500x500 image 500x500 image 75,689,503 0.03 – 0.1 s 757 – 2,271
REED decode [35] 414k binary 362k text 451,744,148 0.1 – 1 s 452 – 4,517
ZIP decode [35] 491k binary 2610k text 68,643,500 0.1 – 1 s 68 – 686
RIJNDAEL decode [36] 362k binary 362k text 32,928,120 0.1 – 1 s 33 – 329
ADPCM decode [33] 1 sec. audio 1 sec. audio 311,098 1 Hz 0.3
RASTA [33] 1 sec. audio 4.7k binary 18,254,847 1 Hz 18.3
FFT [37] 5k samples 5k samples 5,096,956 0.5 - 5 Hz 2.5 – 25
NN classification [38] 1 pattern (8 values) 1 decision value 9,785 1 – 10 Hz 0.01 – 0.1
a Video data: four frames (I-B-B-P) of dimension 352x240
[3] A. Pentland, “Wearable intelligence,”Scientific American, vol. 276, no. 1es1, Nov. 1998.
[4] T. Starner, “The challenges of wearable computing: Part 1,”IEEE Micro, vol. 21, no. 4, pp. 44–52, July 2001.
[5] ——, “The challenges of wearable computing: Part 2,”IEEE Micro, vol. 21, no. 4, pp. 54–67, July 2001.
[6] A. Smailagic and D. Siewiorek, “System level design as applied to CMU wearable computers,”J. VLSI Signal
Processing Systems for Signal, Image, and Video Technology, vol. 21, no. 3, pp. 251–263, July 1999.
[7] Charmed Technology, Inc., “Homepage,” www.charmed.com.
[8] Xybernaut Corp., “Xybernaut wearable systems,” www.xybernaut.com.
[9] A. Smailagic, D. Reilly, and D. P. Siewiorek, “A system-level approach to power/performance optimization in wearable
computers,” inProc. IEEE Computer Society Workshop on VLSI (WVLSI), 2000, pp. 15–20.
[10] C. Baber, D. J. Haniff, and S. I. Woolley, “Contrasting paradigms for the development of wearable computers,”IBM
Systems J., vol. 38, no. 4, pp. 551–565, 1999.
[11] M. Stemm and R. Katz, “Measuring and reducing energy consumption of network interfaces in hand-held devices,”
IEICE Trans. Communications, vol. E80-B, no. 8, pp. 1125–1131, Aug. 1997.
[12] G. D. Micheli, Synthesis and Optimization of Digital Circuits. McGraw-Hill, 1994.
April 29, 2003 DRAFT

IEEE TRANSACTIONS ON COMPUTERS 34
TABLE III
SOME EXAMPLE DEVICES.
Device fmin fmax Emax Type
[MHz] [MHz] [nJ]
MSP430F13x 4.15 8 2 low performance
MSP430C33xa 1.65 3.8 4 low performance
PIC16LF87x-04 4 10 0.7 low performance
uPD78083, 8bit 5 0.55 low performance
SA-1110 59 251 2.8 medium performance
XScale 150 1000 1.8 medium performance
SH-4 200 7.5 medium performance
AT91M40807 16 40 3.86 medium performance
TMS320c55xx, 16bit 200 1.7 DSP int
TMS320VC-150 75 2.7 DSP float
ADSP-2116x 100 1.9 DSP float
PowerPC 440GP 400 7.5 desktop
Ultra Sparc III 950 88.9 desktop
TM5800 367 800 7.5 desktop
a Internal multiplier.
TABLE IV
SOME EXAMPLE CHANNEL TYPES.
Channel Type Ptx Prx Pi Ps Ti 2Td Bmax
[mW] [mW] [mW] [mW] [ms] [ms] [Mbit/s]
RFM TR1000PIC 39 16 12.8 7.8 100 50 0.115
Bluetooth P2P 151 150 71 17 950 155 0.768
Bluetooth P2M 204 188 134 17 890 128 0.768
Bluetooth PC-Card 490 425 160 160 1200 77 0.768
802.11a PC-Card 1416 1429 1406 129 1000 1 54
802.11a PC-Card PSa 1558 1525 119 93 1000 2 54
802.11b PC-Card 1115 1175 1035 225 1000 1 11
802.11b PC-Card PSa 390 450 235 225 1000 63 11
100base PC-Card 505 518 389 106 1000 1 100
UART Transceiver 125 125 0.99 0.0033 10 1 0.235
USB Bridge 149 149 3.3 3.3 100 1 12
Firewire Bridge 716 716 254 1.5 100 1 400
CAN Bus Controller 33 33 1.2 0.3 100 1 1
I2C Bus Controller 7.5 7.5 7.5 0.012 10 1 0.100a Powersave mode.
April 29, 2003 DRAFT

IEEE TRANSACTIONS ON COMPUTERS 35
[13] M. Eisenring, L. Thiele, and E. Zitzler, “Handling conflicting criteria in embedded system design,”IEEE Des. Test.
Comput., vol. 17, no. 2, pp. 51–59, Apr.–June 2000.
[14] W. Wolf, Computers as Components: Principles of Embedded Computing System Design. Morgan Kaufman Publishers,
2002.
[15] T. Blickle, J. Teich, and L. Thiele, “System-level synthesis using evolutionary algorithms,”Design Automation for
Embedded Systems, vol. 3, no. 1, pp. 23–58, Jan. 1998.
[16] R. K. Gupta,Co-Synthesis of Hardware and Software for Digital Embedded Systems. Kluwer Academic Publishers,
Aug. 1995.
[17] I. Karkowski and H. Corporaal, “Design space exploration algorithm for heterogeneous multi-processor embedded
system design,” inProc. 35th Design Automation Conf. (DAC), 1998, pp. 82–87.
[18] J. Liu, P. H. Chou, N. Bagherzadeh, and F. Kurdahi, “A constraint-based application model and scheduling techniques
for power-aware systems,” inProc. 9th Int. Symp. on Hardware/Software Codesign (CODES), 2001, pp. 153–158.
[19] L. Thiele, S. Chakraborty, M. Gries, and S. K¨unzli, “Design space exploration of network processor architectures,” in
Network Processor Design 2002: Design Principles and Practices. Morgan Kaufmann Publishers, 2002.
[20] T. Austin, E. Larson, and D. Ernst, “SimpleScalar: An infrastructure for computer system modeling,”IEEE Computer,
vol. 35, no. 2, pp. 59–67, Feb. 2002.
[21] TMS320C3x General Purpose Application User Guide, Texas Intruments.
[22] ADSP-21000 Family Application Handbook Volume 1, Analog Devices, 1994.
[23] Z. Cvetanovic and D. Bhandarkar, “Performance characterization of the Alpha 21164 microprocessor using TP and
SPEC workloads,” inProc. 2nd IEEE Symp. on High-Performance Computer Architecture (HPCA), 1996, pp. 270–280.
[24] A. Sinha and A. P. Chandrakasan, “JouleTrack – a web based tool for software energy profiling,” inProc. 38th Design
Automation Conf. (DAC), 2001, pp. 220–225.
[25] J. Pouwelse, K. Langendoen, and H. Sips, “Dynamic voltage scaling on a low-power microprocessor,” inProc. 7th
ACM Int. Conf. on Mobile Computing and Networking (Mobicom), 2001, pp. 251–259.
[26] K. Deb, Multi-objective optimization using evolutionary algorithms. John Wiley, 2001.
[27] E. Zitzler, M. Laumanns, and L. Thiele, “SPEA2: Improving the strength pareto evolutionary algorithm for
multiobjective optimization,” inProc. EUROGEN 2001 – Evolutionary Methods for Design, Optimisation and Control
with Applications to Industrial Problems, 2001.
[28] P. Lukowicz, U. Anliker, G. Tr¨oster, S. Schwartz, and R. DeVaul, “The WearARM Modular, Low-Power Computing
Core,” IEEE Micro, vol. 21, pp. 16–28, May/June 2001.
[29] P. Lukowicz, H. Junker, M. St¨ager, T. von B¨uren, and G. Tr¨oster, “WearNET: A distributed multi-sensor system for
context aware wearables,” inProc. 4th Int. Conf. on Ubiquitous Computing (UbiComp), 2002.
[30] T. Truman, T. Pering, and R. Brodersen, “The InfoPad Multimedia Terminal: A Portable Device for Wireless
Information Access,”IEEE Trans. Comput., vol. 47, no. 10, pp. 1073–1087, 1998.
[31] M. Kourogi, T. Kurata, and K. Sakaue, “A panorama-based method of personal positioning and orientation and its
real-time application for wearable computers,” inProc. 5th Int. Symp. on Wearable Computers (ISWC), 2001, pp.
107–114.
[32] Semiconductor Industry Association (SIA),International Technology Roadmap for Semiconductors. Sematech Inc.,
2001.
[33] C. Lee, M. Potkonjak, and W. H. Mangione-Smith, “MediaBench: A tool for evaluating and synthesizing multimedia
and communications systems,” inProc. 30th Int. Symp. on Microarchitecture (MICRO-30), 1997, pp. 330–335.
[34] S. M. Smith and J. M. Brady, “SUSAN – a new approach to low level image processing,”Int. J. Computer Vision,
vol. 23, no. 1, pp. 45–78, May 1997.
April 29, 2003 DRAFT

IEEE TRANSACTIONS ON COMPUTERS 36
[35] T. Wolf and M. Franklin, “CommBench – a telecommunications benchmark for network processors,” inProc. IEEE
Int. Symp. on Performance Analysis of Systems and Software (ISPASS), 2000, pp. 154–62.
[36] J. Daemen and V. Rijmen,The Design of Rijndael, AES – The Advanced Encryption Standard. Springer, 2002.
[37] W. H. Press, S. A. Teukolsky, W. T. Vetterling, and B. P. Flannary,Numerical Recipes in C: The Art of Scientific
Computing, 2nd ed. Cambridge University Press, 1992.
[38] G. Stevens, “CUG396 — NNUTILS neural network,”C Users J., vol. 12, no. 2, Feb. 1994.
April 29, 2003 DRAFT