
A Synaptic Mechanism for Temporal Filtering of … Synaptic Mechanism for Temporal Filtering of ......
16
A Synaptic Mechanism for Temporal Filtering of Visual Signals Tom Baden 1. , Anton Nikolaev 1. , Federico Esposti 1 , Elena Dreosti 1 , Benjamin Odermatt 1 , Leon Lagnado 1,2 * 1 MRC Laboratory of Molecular Biology, Neurobiology Division, Cambridge, United Kingdom, 2 School of Life Sciences, University of Sussex, Brighton, United Kingdom Abstract The visual system transmits information about fast and slow changes in light intensity through separate neural pathways. We used in vivo imaging to investigate how bipolar cells transmit these signals to the inner retina. We found that the volume of the synaptic terminal is an intrinsic property that contributes to different temporal filters. Individual cells transmit through multiple terminals varying in size, but smaller terminals generate faster and larger calcium transients to trigger vesicle release with higher initial gain, followed by more profound adaptation. Smaller terminals transmitted higher stimulus frequencies more effectively. Modeling global calcium dynamics triggering vesicle release indicated that variations in the volume of presynaptic compartments contribute directly to all these differences in response dynamics. These results indicate how one neuron can transmit different temporal components in the visual signal through synaptic terminals of varying geometries with different adaptational properties. Citation: Baden T, Nikolaev A, Esposti F, Dreosti E, Odermatt B, et al. (2014) A Synaptic Mechanism for Temporal Filtering of Visual Signals. PLoS Biol 12(10): e1001972. doi:10.1371/journal.pbio.1001972 Academic Editor: Stephen A. Baccus, Stanford University School of Medicine, United States of America Received May 2, 2014; Accepted September 10, 2014; Published October 21, 2014 Copyright: ß 2014 Baden et al. This is an open-access article distributed under the terms of the Creative Commons Attribution License, which permits unrestricted use, distribution, and reproduction in any medium, provided the original author and source are credited. Data Availability: The authors confirm that all data underlying the findings are fully available without restriction. All relevant data are within the paper and its Supporting Information files. Funding: Wellcome Trust (083220). Medical Research Council, UK (MRC-LMB; no grant number applicable). The funders had no role in study design, data collection and analysis, decision to publish, or preparation of the manuscript. Competing Interests: The authors have declared that no competing interests exist. Abbreviations: AI, adaptation index; BC, bipolar cell; DC, direct current; dpf, days post fertilization; EGFP, enhanced green fluorescent protein; IP, intermediate pool; IPL, inner plexiform layer; OGB, Oregon green BAPTA; RGC, retinal ganglion cell; ROI, region of interest; RP, reserve pool; RRP, readily releasable pool. * Email: [email protected] . These authors contributed equally to this work. Introduction The retina analyzes the visual world through a series of spatio- temporal filters that establish parallel representations for trans- mission to the brain [1–4]. The anatomical organization of these channels is established in the inner plexiform layer (IPL), which is organized into five to six distinct strata containing the dendrites of as many as 20 different types of retinal ganglion cell (RGC) [2]. In each stratum, bipolar cells (BCs) with distinct filtering properties make excitatory synaptic connections with defined subsets of RGCs [5]. For instance, ‘‘transient’’ RGCs are thought to receive excitatory inputs from BCs with bandpass characteristics, while ‘‘sustained’’ RGCs receive inputs from BCs acting as low-pass filters [6]. A long-standing question is how multiple spatio-temporal filters are built using the limited numbers of neurons responding to a particular region of the visual field [7–9]. An answer might lie in reconsidering the fundamental neural element through which the visual signal is transmitted to the inner retina: although individual BCs have diverse properties, their output is transmitted through a much more numerous and heterogeneous component of neural circuits–synapses [10]. Indeed, recent evidence indicates that different synapses of the same BC transmit the visual signal with varying kinetics because of local interactions with different types of inhibitory amacrine cells [11]. Here we ask whether heterogeneous transmission of the visual signal might also reflect intrinsic variations between the various synaptic compartments of a BC. The property we concentrate on is the volume of the terminal, which is expected to influence the amplitude and kinetics of the presynaptic calcium signal controlling neurotransmission [12]. To observe the activity of multiple BC synapses we used zebrafish expressing fluorescent proteins reporting the fusion of synaptic vesicles or the presynaptic calcium signal driving fusion [13,14]. Here we demonstrate that BC terminals of different sizes tend to transform the visual signal in different ways. On average, smaller terminals generate calcium transients that are larger and faster, resulting in a higher initial gain of responses to an increase in temporal contrast followed by more profound adaptation. Small terminals also transmit high frequencies more effectively. Such differences in the outputs of small and large terminals are also observed in individual cells, which therefore have an intrinsic ability to filter visual information through channels with different gains, temporal filters and adaptive properties. Results The Volume of Bipolar Cell Terminals Determines the Gain and Kinetics of Signal Transmission In the vertebrate retina, signals from rod and cone photore- ceptors travel through BCs to be transmitted through synaptic PLOS Biology | www.plosbiology.org 1 October 2014 | Volume 12 | Issue 10 | e1001972
Transcript of A Synaptic Mechanism for Temporal Filtering of … Synaptic Mechanism for Temporal Filtering of ......

A Synaptic Mechanism for Temporal Filtering of VisualSignalsTom Baden1., Anton Nikolaev1., Federico Esposti1, Elena Dreosti1, Benjamin Odermatt1,
Leon Lagnado1,2*
1 MRC Laboratory of Molecular Biology, Neurobiology Division, Cambridge, United Kingdom, 2 School of Life Sciences, University of Sussex, Brighton, United Kingdom
Abstract
The visual system transmits information about fast and slow changes in light intensity through separate neural pathways.We used in vivo imaging to investigate how bipolar cells transmit these signals to the inner retina. We found that thevolume of the synaptic terminal is an intrinsic property that contributes to different temporal filters. Individual cells transmitthrough multiple terminals varying in size, but smaller terminals generate faster and larger calcium transients to triggervesicle release with higher initial gain, followed by more profound adaptation. Smaller terminals transmitted higher stimulusfrequencies more effectively. Modeling global calcium dynamics triggering vesicle release indicated that variations in thevolume of presynaptic compartments contribute directly to all these differences in response dynamics. These resultsindicate how one neuron can transmit different temporal components in the visual signal through synaptic terminals ofvarying geometries with different adaptational properties.
Citation: Baden T, Nikolaev A, Esposti F, Dreosti E, Odermatt B, et al. (2014) A Synaptic Mechanism for Temporal Filtering of Visual Signals. PLoS Biol 12(10):e1001972. doi:10.1371/journal.pbio.1001972
Academic Editor: Stephen A. Baccus, Stanford University School of Medicine, United States of America
Received May 2, 2014; Accepted September 10, 2014; Published October 21, 2014
Copyright: � 2014 Baden et al. This is an open-access article distributed under the terms of the Creative Commons Attribution License, which permitsunrestricted use, distribution, and reproduction in any medium, provided the original author and source are credited.
Data Availability: The authors confirm that all data underlying the findings are fully available without restriction. All relevant data are within the paper and itsSupporting Information files.
Funding: Wellcome Trust (083220). Medical Research Council, UK (MRC-LMB; no grant number applicable). The funders had no role in study design, datacollection and analysis, decision to publish, or preparation of the manuscript.
Competing Interests: The authors have declared that no competing interests exist.
Abbreviations: AI, adaptation index; BC, bipolar cell; DC, direct current; dpf, days post fertilization; EGFP, enhanced green fluorescent protein; IP, intermediatepool; IPL, inner plexiform layer; OGB, Oregon green BAPTA; RGC, retinal ganglion cell; ROI, region of interest; RP, reserve pool; RRP, readily releasable pool.
* Email: [email protected]
. These authors contributed equally to this work.
Introduction
The retina analyzes the visual world through a series of spatio-
temporal filters that establish parallel representations for trans-
mission to the brain [1–4]. The anatomical organization of these
channels is established in the inner plexiform layer (IPL), which is
organized into five to six distinct strata containing the dendrites of
as many as 20 different types of retinal ganglion cell (RGC) [2]. In
each stratum, bipolar cells (BCs) with distinct filtering properties
make excitatory synaptic connections with defined subsets of
RGCs [5]. For instance, ‘‘transient’’ RGCs are thought to receive
excitatory inputs from BCs with bandpass characteristics, while
‘‘sustained’’ RGCs receive inputs from BCs acting as low-pass
filters [6].
A long-standing question is how multiple spatio-temporal filters
are built using the limited numbers of neurons responding to a
particular region of the visual field [7–9]. An answer might lie in
reconsidering the fundamental neural element through which the
visual signal is transmitted to the inner retina: although individual
BCs have diverse properties, their output is transmitted through a
much more numerous and heterogeneous component of neural
circuits–synapses [10]. Indeed, recent evidence indicates that
different synapses of the same BC transmit the visual signal with
varying kinetics because of local interactions with different types of
inhibitory amacrine cells [11]. Here we ask whether heterogeneous
transmission of the visual signal might also reflect intrinsic
variations between the various synaptic compartments of a BC.
The property we concentrate on is the volume of the terminal,
which is expected to influence the amplitude and kinetics of the
presynaptic calcium signal controlling neurotransmission [12].
To observe the activity of multiple BC synapses we used
zebrafish expressing fluorescent proteins reporting the fusion of
synaptic vesicles or the presynaptic calcium signal driving fusion
[13,14]. Here we demonstrate that BC terminals of different sizes
tend to transform the visual signal in different ways. On average,
smaller terminals generate calcium transients that are larger and
faster, resulting in a higher initial gain of responses to an increase
in temporal contrast followed by more profound adaptation. Small
terminals also transmit high frequencies more effectively. Such
differences in the outputs of small and large terminals are also
observed in individual cells, which therefore have an intrinsic
ability to filter visual information through channels with different
gains, temporal filters and adaptive properties.
Results
The Volume of Bipolar Cell Terminals Determines theGain and Kinetics of Signal Transmission
In the vertebrate retina, signals from rod and cone photore-
ceptors travel through BCs to be transmitted through synaptic
PLOS Biology | www.plosbiology.org 1 October 2014 | Volume 12 | Issue 10 | e1001972

terminals of various sizes (Figure 1A). To survey the activity of
many BC synapses in a live animal, we imaged eight to ten days
post fertilisation (dpf) zebrafish larvae expressing sypHy, a reporter
of vesicle fusion (Figure 1B) [14,15], or SyGCaMP2, which signals
the presynaptic calcium transient [13,16]. Regions of interest
defining individual terminals in images of the IPL were generated
using an algorithm based on a Laplace operator (Figure 1B) [17],
from which we estimated the ‘‘effective terminal radius’’ (Materials
and Methods). A survey of 5,061 terminals revealed a wide
variation in radius with a mean of 1.1360.40 mm (Figure 1C,
black bars). Terminals of different sizes were not distributed
randomly through the IPL (Figures 1D and S1I): terminals in
layers 2 and 6 were significantly larger than the average across the
whole population of BCs, while terminals in layers 1, 3, 4, and 5
were significantly smaller.
How do these variations in the volume of the presynaptic
compartment affect the calcium signal that is generated when a
stimulus alters the membrane potential and the rate of calcium
influx? To investigate this question we imaged SyGCaMP2 and
measured the average response over the whole region of interest
(ROI) defining each terminal. Although this procedure will neglect
calcium gradients within the terminal, these gradients will not be
maintained when calcium influx is modulated at frequencies
relevant to vision (see below). In a sample of 932 ON terminals,
the initial rate of rise of the calcium signal elicited by a full field
step of light was approximately twice as fast in the smallest
terminals compared to the largest, and the calcium concentration
reached a higher steady-state level (Figure 1E1,2). Variations in
terminal size were also correlated with differences in the kinetics of
exocytosis, as measured in fish expressing sypHy. In a sample of
438 ON terminals, the relative rate of vesicle release in response to
the same stimulus (quantified as a percentage of vesicles released
per second) varied by a factor of at least two between the smallest
and largest terminals (Figure 1F1,2) [14,18]. A similar relationship
between release amplitude and terminal size was observed in the
OFF channel (Figure S1G).
A correlation between the size of a terminal and the amplitude
of its response was also observed when the temporal contrast of the
stimulus was increased while keeping the mean luminance
constant. Figure 1G1 shows averaged SyGCaMP2 responses to
modulation of light intensity at 1 Hz (100% contrast). The power
of the calcium signal at the fundamental frequency was greater in
small terminals (r = 0.6–1.3 mm) than in large (r = 2.1–4.1 mm),
varying by a factor of at least three across the population
(Figure 1G2).
Does the correlation between the size of the terminal
compartment and the release rate reflect the network in which
the terminal is embedded? For instance, one scenario might be
that large terminals respond with lower gain because they receive
stronger inhibitory feedback from amacrine cells. To test this
possibility, we blocked GABAergic inhibition through ionotropic
receptors by injecting 100 mM picrotoxin into the eye (Figure 2).
This manipulation increased the amplitude of the exocytic
response across terminals of all sizes, as would be expected when
feedback inhibition is reduced [18,19], but larger terminals
continued to respond with lower gain. This observation suggests
that the correlation between terminal size and release rate reflects
intrinsic properties of the terminal rather than the influence of the
network it is embedded in.
Might the correlation between stimulus-dependent changes in
the brightness of terminals and estimates of their size be caused by
a bias in the detection algorithm, perhaps causing smaller
terminals to be detected only when their fluorescence signal was
strong enough? Two lines of evidence indicated that this was not
the case. First, the distribution of terminal sizes was very similar
when measured in transgenic fish expressing synaptophysin-
enhanced green fluorescent protein (EGFP), a fluorescent marker
of synapses that is not affected by neural activity (Figure 1C, red
bars). Second, estimates of terminal size did not differ significantly
when measurements were compared under conditions of high and
low activity, as described in Figure S1 (See Methods). The results
in Figure 1 therefore indicate that the volume of the presynaptic
compartment is closely linked to the gain with which BCs transmit
the visual signal to the inner retina.
Different Calcium Dynamics in Small and Large Terminalsof Individual Bipolar Cells
Are differences in gain maintained in small and large terminals
of the same cell? We investigated this question both in vivo and invitro. In vivo experiments used zebrafish transiently expressing
Ribeye::GCaMP5 in sparse populations of BCs. Square-wave
stimuli (100% contrast) were presented at various frequencies, and
Figure 3A–3C shows results from one BC responding to a 1 Hz
stimulus. The calcium signal in the smaller of the two terminals
clearly exhibited the larger degree of modulation (Figure 3B; cf.
Figure 1G1), and the power of the response peaked at a higher
frequency (Figure 3C). Qualitatively similar results were obtained
from four BCs.
We next used slices of goldfish retina to make whole-cell
recordings directly from the large terminal of ‘‘mixed’’ BCs, which
is connected to smaller presynaptic compartments by narrow
processes. Introduction of the Ca2+ indicator Oregon green
BAPTA (OGB-5N) allowed us to compare presynaptic calcium
signals in the large and small compartments while achieving direct
electrical control of the terminal system (Figure 3D; cf. Figure 1A)
[20]. A BC generating a graded voltage response is shown in
Figure 3E. The OGB-5N signal in the smaller terminal (red) rose
faster than that in the large (black), reached more than double the
concentration, and then decayed more rapidly. Similar results
were observed in eight cells generating purely graded responses.
Many BCs in the retina of fish generate voltage spikes as well as
graded responses [16,21,22], and terminal volume also affected the
presynaptic calcium transient generated by these electrical
responses [16,21–23]. In the example in Figure 3F, the small
terminal (red) responded to each spike with a clear Ca2+ transient,
Author Summary
The process of neurotransmission involves the conversionof electrical signals into the release of a chemicalneurotransmitter from the neurons synaptic terminal,and the key trigger for this release is a rise in calciumconcentration. Accordingly, the amplitude and speed ofthis calcium signal controls the amplitude and time-courseof synaptic communication. Working on the synapticterminals of fish retinal bipolar cells, we show that thepresynaptic calcium signal and the subsequent neuro-transmitter release are shaped by the basic property ofsynapse volume. Using a combination of experimentalapproaches and computational models, we found thatlarge synapses are slow and adapt little during ongoingstimulation, while small synapses are fast and show moreprofound adaptation. This observation leads to a secondkey concept: since neurons usually have several presyn-aptic terminals that may vary in volume, a single neuroncan, in principle, forward different synaptic signals todifferent postsynaptic partners. We provide direct evi-dence that this is the case for bipolar cells of the fish retina.
Synaptic Filtering of Visual Signals
PLOS Biology | www.plosbiology.org 2 October 2014 | Volume 12 | Issue 10 | e1001972

Figure 1. Variations in terminal size, calcium signals, and vesicle release. (A) BCs transmit through multiple terminals. Left: publishedexamples of zebrafish cone BCs [64] illustrate the range of presynaptic terminal sizes. Scalebar = 10 mm. (B) BC terminals in the IPL of a zebrafish (10dpf) expressing sypHy under control of the ribeye promoter. Left: Raw image showing six strata of the IPL. Right: Overlay of ROIs defining terminals.
Synaptic Filtering of Visual Signals
PLOS Biology | www.plosbiology.org 3 October 2014 | Volume 12 | Issue 10 | e1001972
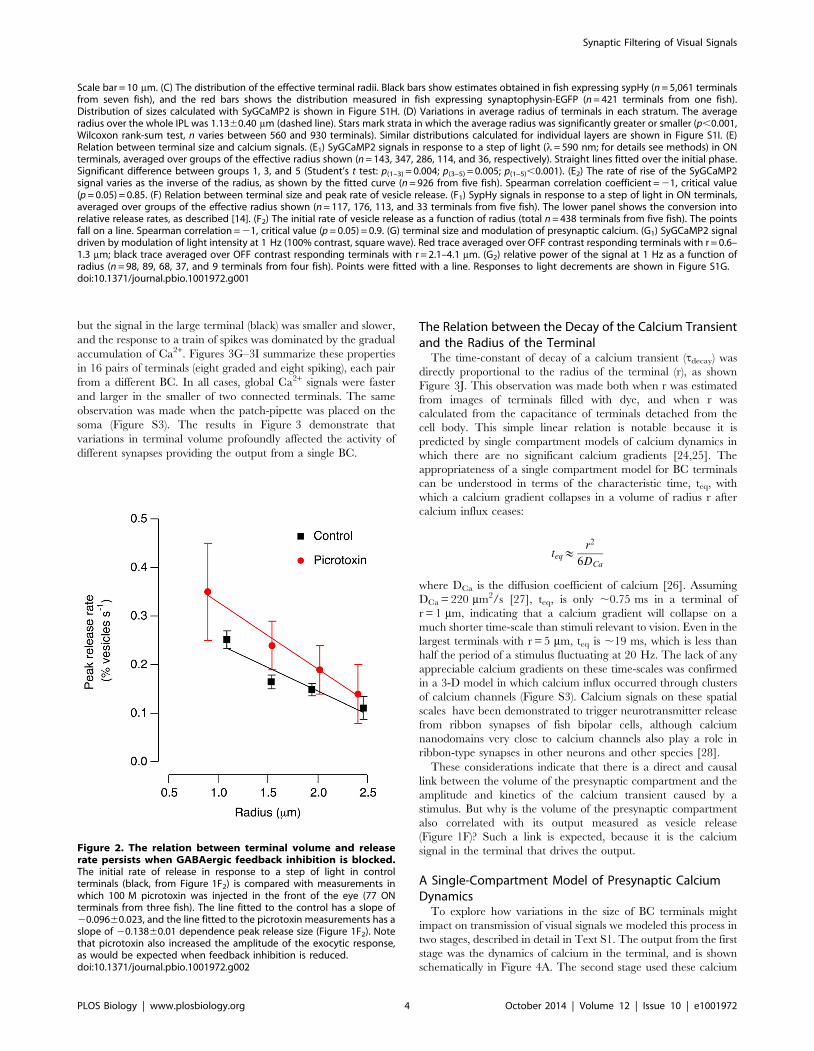
but the signal in the large terminal (black) was smaller and slower,
and the response to a train of spikes was dominated by the gradual
accumulation of Ca2+. Figures 3G–3I summarize these properties
in 16 pairs of terminals (eight graded and eight spiking), each pair
from a different BC. In all cases, global Ca2+ signals were faster
and larger in the smaller of two connected terminals. The same
observation was made when the patch-pipette was placed on the
soma (Figure S3). The results in Figure 3 demonstrate that
variations in terminal volume profoundly affected the activity of
different synapses providing the output from a single BC.
The Relation between the Decay of the Calcium Transientand the Radius of the Terminal
The time-constant of decay of a calcium transient (tdecay) was
directly proportional to the radius of the terminal (r), as shown
Figure 3J. This observation was made both when r was estimated
from images of terminals filled with dye, and when r was
calculated from the capacitance of terminals detached from the
cell body. This simple linear relation is notable because it is
predicted by single compartment models of calcium dynamics in
which there are no significant calcium gradients [24,25]. The
appropriateness of a single compartment model for BC terminals
can be understood in terms of the characteristic time, teq, with
which a calcium gradient collapses in a volume of radius r after
calcium influx ceases:
teq&r2
6DCa
where DCa is the diffusion coefficient of calcium [26]. Assuming
DCa = 220 mm2/s [27], teq, is only ,0.75 ms in a terminal of
r = 1 mm, indicating that a calcium gradient will collapse on a
much shorter time-scale than stimuli relevant to vision. Even in the
largest terminals with r = 5 mm, teq is ,19 ms, which is less than
half the period of a stimulus fluctuating at 20 Hz. The lack of any
appreciable calcium gradients on these time-scales was confirmed
in a 3-D model in which calcium influx occurred through clusters
of calcium channels (Figure S3). Calcium signals on these spatial
scales have been demonstrated to trigger neurotransmitter release
from ribbon synapses of fish bipolar cells, although calcium
nanodomains very close to calcium channels also play a role in
ribbon-type synapses in other neurons and other species [28].
These considerations indicate that there is a direct and causal
link between the volume of the presynaptic compartment and the
amplitude and kinetics of the calcium transient caused by a
stimulus. But why is the volume of the presynaptic compartment
also correlated with its output measured as vesicle release
(Figure 1F)? Such a link is expected, because it is the calcium
signal in the terminal that drives the output.
A Single-Compartment Model of Presynaptic CalciumDynamics
To explore how variations in the size of BC terminals might
impact on transmission of visual signals we modeled this process in
two stages, described in detail in Text S1. The output from the first
stage was the dynamics of calcium in the terminal, and is shown
schematically in Figure 4A. The second stage used these calcium
Scale bar = 10 mm. (C) The distribution of the effective terminal radii. Black bars show estimates obtained in fish expressing sypHy (n = 5,061 terminalsfrom seven fish), and the red bars shows the distribution measured in fish expressing synaptophysin-EGFP (n = 421 terminals from one fish).Distribution of sizes calculated with SyGCaMP2 is shown in Figure S1H. (D) Variations in average radius of terminals in each stratum. The averageradius over the whole IPL was 1.1360.40 mm (dashed line). Stars mark strata in which the average radius was significantly greater or smaller (p,0.001,Wilcoxon rank-sum test, n varies between 560 and 930 terminals). Similar distributions calculated for individual layers are shown in Figure S1I. (E)Relation between terminal size and calcium signals. (E1) SyGCaMP2 signals in response to a step of light (l= 590 nm; for details see methods) in ONterminals, averaged over groups of the effective radius shown (n = 143, 347, 286, 114, and 36, respectively). Straight lines fitted over the initial phase.Significant difference between groups 1, 3, and 5 (Student’s t test: p(1–3) = 0.004; p(3–5) = 0.005; p(1–5),0.001). (E2) The rate of rise of the SyGCaMP2signal varies as the inverse of the radius, as shown by the fitted curve (n = 926 from five fish). Spearman correlation coefficient = 21, critical value(p = 0.05) = 0.85. (F) Relation between terminal size and peak rate of vesicle release. (F1) SypHy signals in response to a step of light in ON terminals,averaged over groups of the effective radius shown (n = 117, 176, 113, and 33 terminals from five fish). The lower panel shows the conversion intorelative release rates, as described [14]. (F2) The initial rate of vesicle release as a function of radius (total n = 438 terminals from five fish). The pointsfall on a line. Spearman correlation = 21, critical value (p = 0.05) = 0.9. (G) terminal size and modulation of presynaptic calcium. (G1) SyGCaMP2 signaldriven by modulation of light intensity at 1 Hz (100% contrast, square wave). Red trace averaged over OFF contrast responding terminals with r = 0.6–1.3 mm; black trace averaged over OFF contrast responding terminals with r = 2.1–4.1 mm. (G2) relative power of the signal at 1 Hz as a function ofradius (n = 98, 89, 68, 37, and 9 terminals from four fish). Points were fitted with a line. Responses to light decrements are shown in Figure S1G.doi:10.1371/journal.pbio.1001972.g001
Figure 2. The relation between terminal volume and releaserate persists when GABAergic feedback inhibition is blocked.The initial rate of release in response to a step of light in controlterminals (black, from Figure 1F2) is compared with measurements inwhich 100 M picrotoxin was injected in the front of the eye (77 ONterminals from three fish). The line fitted to the control has a slope of20.09660.023, and the line fitted to the picrotoxin measurements has aslope of 20.13860.01 dependence peak release size (Figure 1F2). Notethat picrotoxin also increased the amplitude of the exocytic response,as would be expected when feedback inhibition is reduced.doi:10.1371/journal.pbio.1001972.g002
Synaptic Filtering of Visual Signals
PLOS Biology | www.plosbiology.org 4 October 2014 | Volume 12 | Issue 10 | e1001972

Figure 3. Different calcium signals in small and large terminals of the same cell. (A) A BC expressing GCaMP5. Large and small terminals areindicated by the blue and red arrows. Scalebar 10 mm. (B) Responses of the terminals in (A) to a stimulus modulated at 1 Hz. (C) Power spectrum ofthe responses from large and small terminals calculated for different stimulus frequencies. (D) Mixed BC filled with OGB-5N in a slice of goldfish retina.Scale bar 10 mm. (E) Spatially averaged Ca2+ signals in the small (red) and large (black) terminal during a 2 s depolarizing current step (10 pA). This BCdid not generate spikes. (F) A comparison of Ca2+ signals in the small and large terminal of a ‘‘spiking’’ BC. Each spike caused a calcium transient thatwas larger and faster in the smaller terminal. (G–I) Time constants of the calcium signal rise (trise), decay (tdecay), and peak amplitude, evaluated in 16pairs of small and large terminals. For small and large, trise = 0.2560.20 and 1.1660.64 s; tdecay = 1.4260.82 and 2.9162.05 s; amplitude = 1.2960.38and 0.6860.21 mM. All these parameters were significantly different in small and large terminals (p,0.001; Wilcoxon ranked sum, n = 16 cells fromnine adult retinae). The average radii of the small and large terminals were 1.160.3 and 5.261.2 mm, respectively. (J) Time constants of calcium decaywere directly proportional to terminal radius determined using imaging (grey, n = 32 terminals) or capacitance measurements (black, n = 20terminals). The linear fit was constrained to go through the origin. Error bars show 1 standard deviation (SD).doi:10.1371/journal.pbio.1001972.g003
Synaptic Filtering of Visual Signals
PLOS Biology | www.plosbiology.org 5 October 2014 | Volume 12 | Issue 10 | e1001972

dynamics to predict the kinetics of vesicle release, as described in
Figure 5B and below.
To model the presynaptic calcium signal, the light stimulus was
convolved with the impulse response of a BC to predict the voltage
trajectory in the soma (Figure 4A, top). BCs in goldfish have
bandpass characteristics with peak transmission varying between
about 1–14 Hz [22], and we chose a value of 9.5 Hz [29]. The
voltage response in the soma was then instantaneously mapped to
the presynaptic calcium current using the I–V relation and density
of L-type calcium channels measured in the terminal of BCs
isolated from goldfish [30]. This I–V relation is an exponential
function, changing e-fold in ,6.6 mV over the physiological range
of membrane potentials [30]. These first two steps in the model are
analogous to the linear-nonlinear (LN) model that has been used to
provide a description of responses in RGCs [7]. This model
therefore identifies the rectifying I–V relation of the calcium
current in BCs as the first major non-linearity in retinal processing.
The time-course of the presynaptic calcium signal in response to a
visual stimulus was calculated by convolving the time-course of
calcium influx with the ‘‘presynaptic calcium filter’’ predicted by
the one-compartment model, which has an impulse response
decaying with time-constant tdecay (Figure 3E and 3F). The value
of tdecay depended on the radius of the terminal, according to the
linear relation measured experimentally in Figure 3J.
To test this model of calcium dynamics we compared its
predictions with experimental measurements made with OGB-5N
Figure 4. A simple model to predict global calcium changes in the presynaptic terminal. (A) The stimulus (here a 1 Hz square wave) wasconvolved with the photoreceptor impulse response to estimate membrane voltage (top). Subsequently, the current through L-type calciumchannels was calculated based on the I–V relation and number of channels (middle). Convolution of the calcium current with the synaptic calciumimpulse response, calculated from Figure 3G, yielded an estimate of global calcium concentration over time (bottom). (B, C) Measured (B), andmodeled (C), global calcium changes in a small (red; radius = 1 mm) and large (black; radius = 3 mm) terminals responding to a 1 Hz square wavestimulus. Data in (B) from goldfish ‘‘mixed’’ BC (cf. Figure 3D–3J).doi:10.1371/journal.pbio.1001972.g004
Synaptic Filtering of Visual Signals
PLOS Biology | www.plosbiology.org 6 October 2014 | Volume 12 | Issue 10 | e1001972
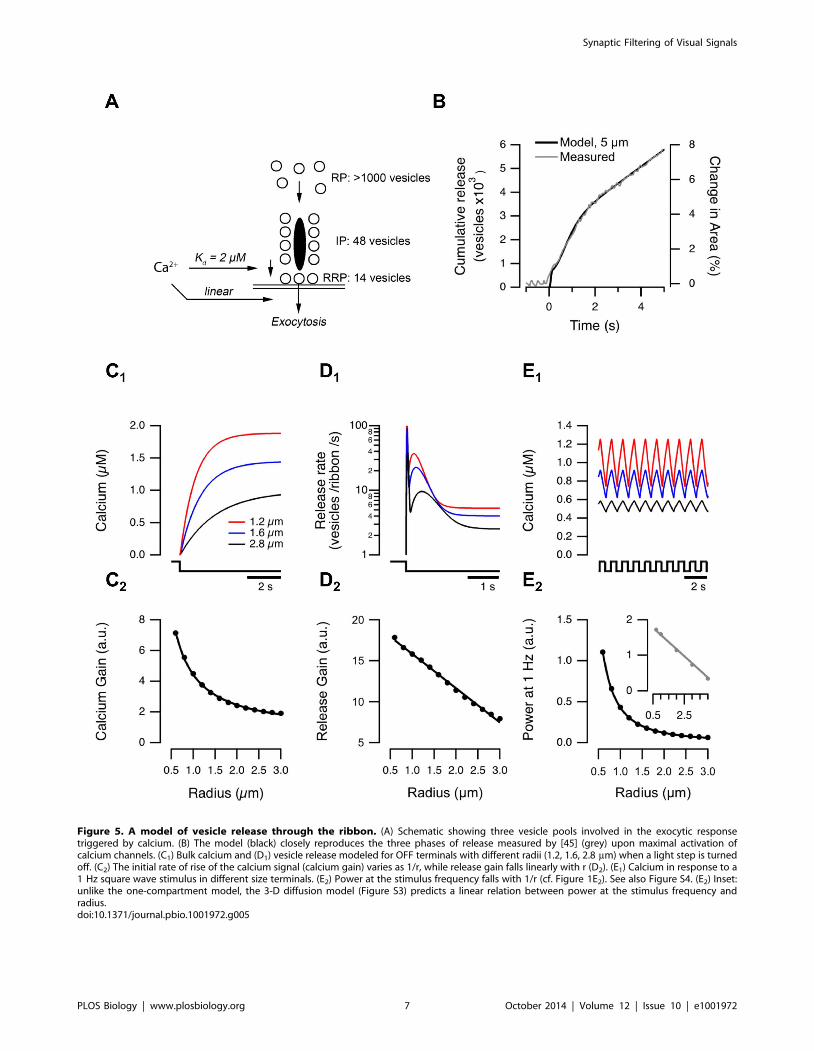
Figure 5. A model of vesicle release through the ribbon. (A) Schematic showing three vesicle pools involved in the exocytic responsetriggered by calcium. (B) The model (black) closely reproduces the three phases of release measured by [45] (grey) upon maximal activation ofcalcium channels. (C1) Bulk calcium and (D1) vesicle release modeled for OFF terminals with different radii (1.2, 1.6, 2.8 mm) when a light step is turnedoff. (C2) The initial rate of rise of the calcium signal (calcium gain) varies as 1/r, while release gain falls linearly with r (D2). (E1) Calcium in response to a1 Hz square wave stimulus in different size terminals. (E2) Power at the stimulus frequency falls with 1/r (cf. Figure 1E2). See also Figure S4. (E2) Inset:unlike the one-compartment model, the 3-D diffusion model (Figure S3) predicts a linear relation between power at the stimulus frequency andradius.doi:10.1371/journal.pbio.1001972.g005
Synaptic Filtering of Visual Signals
PLOS Biology | www.plosbiology.org 7 October 2014 | Volume 12 | Issue 10 | e1001972

in BCs from slices of goldfish retina. The calcium concentration in
the smaller of two connected synaptic compartments rose higher
and faster, and then decayed almost to baseline after each cycle of
a 1 Hz stimulus, while in the larger terminals there was an
accumulation of calcium and much smaller modulations in
concentration (Figure 4B). The model could account for these
differences by using the appropriate value of r while keeping all
other variables constant (Figure 4C).
We considered two extensions of this model. The first is the use
of three dimensions to estimate changes in calcium concentration
at the active zone: this provided a very similar prediction to the
one-compartment model (Figure S3). The second extension was to
add active conductances in the terminal leading to calcium spikes,
but again this did not alter the main conclusions that we could
draw about the impact of terminal volume on gain and kinetics
(see below and Figure S6).
A Model of Synaptic Transmission through Bipolar CellsHaving established that the model accounted adequately for
variations in the presynaptic calcium signal, we extended it to
explore the impact of terminal size on the kinetics of vesicle
release. The following properties of exocytosis at the ribbon
synapse of BCs were taken into account, all of which have been
measured experimentally.
Property 1. There are three anatomically distinct populations
of vesicles in the synaptic terminal of BCs: the rapidly-releasable
pool (RRP) docked at the active zone, the intermediate pool (IP)
attached to the ribbon behind the active zone, and the reserve pool
(RP) that is mobile across the whole terminal [31]. Based on the
assumption of a constant ribbon density (see below), the sizes of the
RRP and IP were proportional to terminal surface area, while RP
size depended on volume (equation 4 in Text S1).
Property 2. There are two kinetically distinct modes of
neurotransmission [32]: one is fast and transient [33] and the other
slow and sustained [34].
Property 3. Both modes of exocytosis can be driven by
micromolar calcium concentrations, which can be achieved in the
bulk cytoplasm [34–39].
Property 4. The spatial scale on which calcium entering
through calcium channels triggers exocytosis is of the order of
microns. The idea that microdomains of calcium control fast
release of vesicles from BCs is supported by a large number of
studies demonstrating that such release is effectively blocked by the
slow calcium buffer ethylene glycol tetraacetic acid (EGTA)
[33,35,36,40,41].
Property 5. For simplicity we assumed that the number of
ribbons, and therefore the number of L-type calcium channels, is
proportional to terminal surface area. This assumption is
tentatively supported by electron microscopy (EM) studies of
goldfish ‘‘mixed’’ BCs [42].
This model closely described the different phases of exocytosis
measured in isolated BCs stimulated by a voltage-clamp step
(Figure 5A and 5B) [35].
To assess the utility of the model, we compared its predictions
with the experimental measurements of synaptic function
illustrated in Figures 1E–1G. Variations in the initial rate of rise
of presynaptic calcium signal (Figure 5C1,2), the initial rate of
exocytosis (Figure 5D1,2), and the power of the calcium signal
elicited by a 1 Hz stimulus could all be accounted for by variations
in terminal radius, while keeping other variables constant. For
instance, the initial rate of rise of calcium in response to a step
stimulus decreased as 1/r while the rate of exocytosis was found to
decrease linearly with r in vivo (Figure 1E2 and 1F2) and the
model predicted the same (Figure 5C2 and 5D2). A notable feature
of the model was the prediction of a secondary rise in the release
rate beginning ,150 ms after stimulus onset. A second phase of
release has also been observed experimentally by monitoring
glutamate release from the BC terminal electrophysiologically in a
second voltage-clamped ‘‘sniffer cell’’ [32].
In its simplest form, the model failed to predict the exact form of
the relation between the power of the SyGCaMP2 signal and
terminal radius: power varied linearly with r in vivo (Figure 1G2),
but the model predicted that it would vary as 1/r (Figure 5E2).
This discrepancy could be corrected with a 3-D diffusion model
that captures local calcium differences during ongoing signaling
(Figure 5E2, inset).
We also explored predictions of the model to alterations in
physiological parameters, including the possibility of a nonlinear
relation between release rate and calcium concentration, and
variations in the relative threshold for L-type calcium channel
activation. These changes did not qualitatively alter the predicted
effects of terminal volume on the gain and kinetics of signal
transmission (Figure S4). The combination of experiment and
modeling presented in Figures 1–5 converges on one basic idea:
the volume of the presynaptic compartment is closely linked with
the gain and kinetics of synaptic transmission by determining the
amplitude and time-course of the presynaptic calcium transient.
This fundamental property of the synaptic compartment varies
across BCs (Figure 1D) and will therefore contribute to variations
in the gain of the visual signal transmitted to the inner retina, as
well as the way gain varies as a function of frequency.
Variations in Contrast Adaptation in Terminals ofDifferent Volume
The gain of signal transmission through the retina is not
constant, but varies continuously according to the recent history of
the stimulus [8]. Such plasticity has been studied particularly
intensively in the context of adaptation after an increase in
temporal contrast, which involves depression of excitatory synaptic
transmission from BCs to RGCs [18,43,44], likely reflecting
depletion of rapidly releasable vesicles within the terminal [45–47].
Might the size of BC terminals also impact on the process of
contrast adaptation? Larger BC terminals can contain hundreds of
thousands of vesicles, and these are more mobile than in
conventional synapses, acting to support the continuous mode of
transmission [31,34]. It might therefore be expected that larger
terminals containing more vesicles are more resistant to depres-
sion.
To quantify time-dependent changes in synaptic gain we used
an ‘‘Adaptation Index’’ (AI), calculated as the ratio between the
peak initial response to an increase in contrast and the later steady-
state response. Using a stimulus of 100% contrast modulated at
5 Hz, and assuming a constant density of vesicles in terminals of
different volume, the model predicted that the rate of vesicle
release would depress more profoundly in smaller terminals
(Figure 6A and 6B). This can be understood in terms the RRP and
IP depleting faster and to a lower steady-state in small terminals
compared to large (Figure 6A).
Assaying vesicle release in vivo using sypHy confirmed that
smaller terminals displayed greater depression (Figure 6C), and AI
decreased linearly with r (Figure 6D). The absolute values of AI
measured using sypHy were, however, lower than those predicted
by the model: in the smallest terminals, an AI of ,2.5 was
measured using sypHy, while the model predicted values of ,6.
This difference is likely to reflect the relatively low time-resolution
of sypHy measurements, causing us to underestimate the initial
peak release rate (cf. Figure 6A). Nonetheless, the model and
experimental measurements together demonstrate that the
Synaptic Filtering of Visual Signals
PLOS Biology | www.plosbiology.org 8 October 2014 | Volume 12 | Issue 10 | e1001972

geometry of the presynaptic compartment is one of the factors
determining the kinetics of vesicle depletion and, therefore,
adaptation.
It has recently been demonstrated that there are two opposing
forms of plasticity when the retina responds to an increase in
temporal contrast: while some BCs and ganglion cells adapt,
others become sensitized [18,48]. The balance between adaptation
and sensitization was also found to vary as a function of terminal
size [14,18]; on average, larger terminals tended to show less
adaptation (Figure 6C) with the largest terminals exhibiting
sensitization (Figure 6D). Sensitization of the BC output has been
shown to result from reduced inhibition from amacrine cells
[18,19,49], and so is not predicted by the simple one compartment
model.
Linear- and Non-linear Transformations of the VisualSignal: Impact of Terminal Volume
An empirical description of the relation between variations in
the intensity of light falling on the retina and the spike-rate of
ganglion cells can often be obtained using a model comprised of
Figure 6. Contrast adaptation depends on terminal size: comparison of model and experiment. (A) Top, vesicle release modeled in small(red) and large (black) terminals in response to a 5 Hz stimulus (100% contrast). Small terminals are predicted to exhibit stronger adaptation. Bottom,dynamics of three vesicle pools used in the model. RRP and IP deplete faster in small terminals while RP in small and large terminals remains nearconstant. (B) Modeled adaptation index (Methods) decreases linearly with terminal radius. (C) Adaptation of synaptic output measured in vivo wasmore profound in smaller terminals. Graph shows release dynamics of OFF terminals with r,1 mm (red) and r.1.2 mm (black) in response to a 5 Hzstimulus (cf. (A)). (D) Adaptation index decreases linearly with terminal radius, as predicted by the model (n = 236 OFF terminals from seven fish, eachbin is an average of 12 individual terminals). Spearman correlation = 20.86, critical value (p = 0.05) = 0.45. See also Figure S5.doi:10.1371/journal.pbio.1001972.g006
Synaptic Filtering of Visual Signals
PLOS Biology | www.plosbiology.org 9 October 2014 | Volume 12 | Issue 10 | e1001972

two stages: a linear transformation of the input feeding into a
rectifying non-linearity [7,50,51]. How does this linear-nonlinear
(LN) model map onto the retinal circuit [5]? Transformations of
the visual input are roughly linear through the processes of
phototransduction and transmission by the synapses of photore-
ceptors, as far down the visual pathway as the cell body of BCs
[22,43,52,53]. But what of the next neural compartment in the
visual pathway—the synaptic terminal of BCs?
Measurements of vesicle release with sypHy demonstrated
strong rectification in the synaptic output because an increase in
stimulus variance caused an increase in the mean rate of vesicle
release even when the mean luminance was held constant, as
shown in Figure 6C. This behavior is predicted by the model
(Figure 6A), where it reflects the rectifying relation between
membrane potential and the amplitude of the calcium current
(Figure 4). To test this explanation by experiment, we imaged the
presynaptic calcium signal using SyGCaMP2, while applying a
square wave stimulus modulated at 3 Hz. Figure 7A compares the
SyGCaMP2 signal averaged over two populations of terminals
that generated a significant response to this stimulus: 66 with r,
1.5 mm and 119 with r.2.5 mm. In both populations the
presynaptic calcium signal was a strongly rectifying function of
light intensity, causing a steady increase in calcium that was
graded with contrast (Figure 7B). These measurements identify
voltage-dependent calcium channels in the synaptic terminal of
BCs as being responsible for the first major non-linear transfor-
mation of the visual signal as it is transmitted through the retina.
Although the most obvious aspect of the SyGCaMP2 signal
elicited by an increase in the variance of the stimulus was a
maintained increase in presynaptic calcium, smaller fluctuations
could also be detected (Figure 1G). The power of the fluctuations
following a periodic stimulus was used to quantify the linear
component of the synaptic calcium response [22], and the power
of this linear component was ,3-fold larger in the smaller
population of terminals (Figures 1G, 7C, and 7D). Further, when
the contrast of the stimulus was varied between 10% and 100%,
the power of the linear component was directly proportional to the
power of the DC component (Figure 7E), as predicted by the
model (Figure 7G). The proportionality constant for the small
population of terminals was 2.4 times that of the large population
(Figure 7E), which was also predicted by the model. The relatively
slow response time of SyGCaMP2 (tdecay,200 ms [13]) prevented
the imaging of synaptic responses following stimuli at frequencies
greater than 3 Hz, but the results in Figure 7 demonstrate that
smaller terminals generate relatively stronger linear responses than
large terminals, and therefore encode fluctuating stimuli more
effectively.
Variations in Temporal Filtering in Terminals of DifferentVolume
How do variations in filtering of the presynaptic calcium signal
impact on the output from the synapse? Assaying vesicle release
with SypHy demonstrated that smaller terminals respond to a step
of light with higher relative release rates (Figure 1F), but the
resolution of this reporter was too low to detect modulations at
stimulus frequencies .1 Hz (i.e., the linear component of the
output). Nonetheless, the model predicted that the modulation in
release rate would be directly proportional to the steady rate once
the terminal had adapted (Figure 7F), and sypHy can be used to
assess variations in the steady-rate of release [14]. We therefore
used steady-state measurements to compare temporal filtering in
the output of small and large terminals.
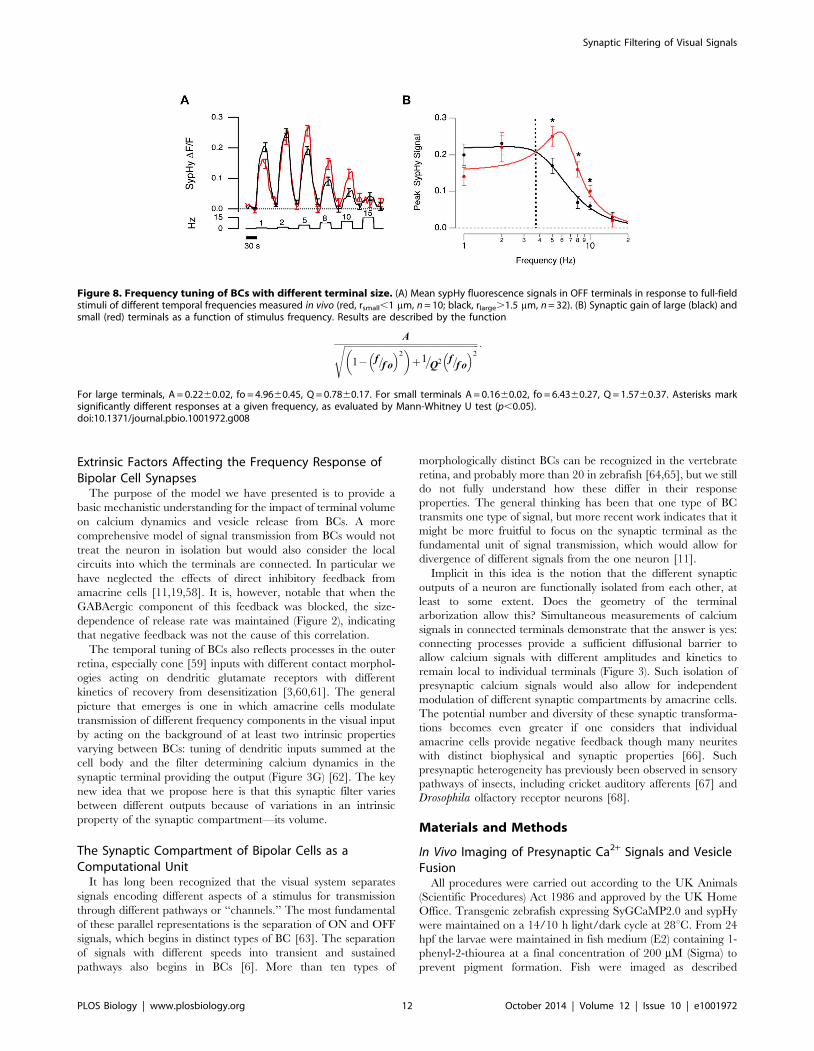
Figure 8A shows averaged sypHy signals to stimuli of varying
frequency, for two populations of terminals: small (r,1 mm) and
large (r.1.5 mm) The amplitude of the response, reflecting the
steady rate of vesicle release, is plotted as a function of frequency
in Figure 8B. Small terminals transmitted frequencies between 5
and 10 Hz significantly better than large terminals. For instance,
at a frequency of 8 Hz, the relative response of small terminals was
,2.4-fold that of large.
If the power of the modulated response is proportional to the
mean release rate, as suggested by the results in Figure 7E, these
measurements can be considered an approximation of the
‘‘transfer function’’ of the visual system up to the point that BCs
transmit the visual signal. We therefore described the measure-
ments using an expression commonly used to describe the output
of electrical circuits with some element of resonance [54]:
Affiffiffiffiffiffiffiffiffiffiffiffiffiffiffiffiffiffiffiffiffiffiffiffiffiffiffiffiffiffiffiffiffiffiffiffiffiffiffiffiffiffiffiffiffiffiffiffiffiffiffiffiffiffiffiffiffiffiffiffiffi1{ f=f o
� �2� �
z1�Q2 f=f o
� �2
s
where A is a scaling factor, fo is the center frequency, and Q is a
quality factor describing how much the response is damped. In
small terminals, Q was estimated as 1.5760.37, while in large
terminals it was 0.7860.17. Thus small terminals more obviously
maintained the bandpass characteristics of the voltage signal
measured in the cell body of BCs [22], while large terminals
damped out the resonant frequencies This behavior can now be
understood in terms of the impact of terminal volume on the
dynamics of the calcium signal controlling neurotransmitter release.
Discussion
Many BCs transmit the visual signal through multiple terminals
located in different strata of the IPL (Figure 1). Using a combination
of in vivo imaging, slice electrophysiology, and modeling, we have
found that variations in the size of these terminals will cause the
signal in a single neuron to be transformed through different
temporal filters as it is transmitted to the inner retina (Figures 1–4).
The mechanistic link is the calcium signal that controls synaptic
transmission: smaller terminals generate larger and faster calcium
transients (Figures 1–5), increasing the gain of synaptic transmission
and allowing higher frequencies to be transmitted (Figures 7 and 8).
Diversity in the properties of synaptic transmission extend to time-
dependent changes in gain: smaller terminals adapt more
completely after an increase in stimulus contrast (Figure 6). These
variations in synaptic properties will expand the number of
processing channels that can operate in parallel through the limited
number of neurons packed into a given region of the retinal network
[55,56]. These results complement recent evidence for divergence
of visual channels through individual BCs, obtained by direct
electrical stimulation of these neurons while monitoring the effects
in multiple ganglion cells [4,11,57].
Different Temporal Channels through Individual BipolarCells
The different temporal channels in the visual system were first
distinguished by recording responses of ‘‘transient’’ and ‘‘sus-
tained’’ ganglion cells in the retina [4]. These temporal channels
partly reflect processing in the inner retina, where feedback
inhibition and lateral inhibition from amacrine cells act directly on
BC terminals to alter the gain and timing of the synaptic output
[11,19,58]. Here we have described a fundamental and intrinsic
property that will contribute further to the diversity of signals that
BCs transmit—the geometry of the synaptic compartment
[11,55,56].
Synaptic Filtering of Visual Signals
PLOS Biology | www.plosbiology.org 10 October 2014 | Volume 12 | Issue 10 | e1001972

In the future, it will be important to assess the extent to which
RGCs tuned to different frequencies receive inputs from BC
terminals of different sizes. Such a study will be technically
demanding, requiring a detailed anatomical reconstruction of
IPL circuitry. Nonetheless, Figure 1D provides the first evidence
that RGCs with dendrites in different layers of the IPL will, on
average, receive excitatory input from BC terminals of different
sizes. For instance, layer 6 of the IPL contains the highest
density of large terminals, which leads to the testable prediction
that RGCs extending dendrites in this layer will be more likely
to exhibit low-pass characteristics. In contrast, layer 5 has
smaller terminals than the average, suggesting that RGCs
collecting inputs from this layer will be tuned to higher
frequencies.
Figure 7. Linear and rectifying components of contrast response vary with terminal size. (A) SyGCaMP2 responses of BC terminals tostimuli of varying contrast (3 Hz). Average DF/F of all contrast responding terminals (both ON and OFF) with r,1.5 mm (n = 66 terminals, red) and r.2.5 mm (n = 119 terminals, black). Note how these synaptic calcium responses are strongly rectifying. (B) Power of the DC component measured at0.01 Hz for stimuli shown in (A). The DC component was larger in small terminals (cf. Figure 4C). (C) Power spectrum of the response to 100%contrast (3 Hz) for small (red) and large (black) terminals. (D) Power at 3 Hz varies with contrast. See also Figure S4. (E) Power of the linear and DCcomponents are directly proportional, but the proportionality coefficient is larger for smaller terminals. The Pearson correlation coefficient was 0.99for small terminals and 0.97 for large. (F) Modeled release in response to a 3 Hz stimulus (100% contrast). (G) The model predicts that the power ofthe calcium response at 3 Hz is directly proportional to the power of the DC component, as was observed experimentally in (E). (H) Power of theexocytic response modeled for a range of stimulus frequencies. Power at the stimulus frequency varies as 1/f for both small and large terminals.doi:10.1371/journal.pbio.1001972.g007
Synaptic Filtering of Visual Signals
PLOS Biology | www.plosbiology.org 11 October 2014 | Volume 12 | Issue 10 | e1001972
Extrinsic Factors Affecting the Frequency Response ofBipolar Cell Synapses
The purpose of the model we have presented is to provide a
basic mechanistic understanding for the impact of terminal volume
on calcium dynamics and vesicle release from BCs. A more
comprehensive model of signal transmission from BCs would not
treat the neuron in isolation but would also consider the local
circuits into which the terminals are connected. In particular we
have neglected the effects of direct inhibitory feedback from
amacrine cells [11,19,58]. It is, however, notable that when the
GABAergic component of this feedback was blocked, the size-
dependence of release rate was maintained (Figure 2), indicating
that negative feedback was not the cause of this correlation.
The temporal tuning of BCs also reflects processes in the outer
retina, especially cone [59] inputs with different contact morphol-
ogies acting on dendritic glutamate receptors with different
kinetics of recovery from desensitization [3,60,61]. The general
picture that emerges is one in which amacrine cells modulate
transmission of different frequency components in the visual input
by acting on the background of at least two intrinsic properties
varying between BCs: tuning of dendritic inputs summed at the
cell body and the filter determining calcium dynamics in the
synaptic terminal providing the output (Figure 3G) [62]. The key
new idea that we propose here is that this synaptic filter varies
between different outputs because of variations in an intrinsic
property of the synaptic compartment—its volume.
The Synaptic Compartment of Bipolar Cells as aComputational Unit
It has long been recognized that the visual system separates
signals encoding different aspects of a stimulus for transmission
through different pathways or ‘‘channels.’’ The most fundamental
of these parallel representations is the separation of ON and OFF
signals, which begins in distinct types of BC [63]. The separation
of signals with different speeds into transient and sustained
pathways also begins in BCs [6]. More than ten types of
morphologically distinct BCs can be recognized in the vertebrate
retina, and probably more than 20 in zebrafish [64,65], but we still
do not fully understand how these differ in their response
properties. The general thinking has been that one type of BC
transmits one type of signal, but more recent work indicates that it
might be more fruitful to focus on the synaptic terminal as the
fundamental unit of signal transmission, which would allow for
divergence of different signals from the one neuron [11].
Implicit in this idea is the notion that the different synaptic
outputs of a neuron are functionally isolated from each other, at
least to some extent. Does the geometry of the terminal
arborization allow this? Simultaneous measurements of calcium
signals in connected terminals demonstrate that the answer is yes:
connecting processes provide a sufficient diffusional barrier to
allow calcium signals with different amplitudes and kinetics to
remain local to individual terminals (Figure 3). Such isolation of
presynaptic calcium signals would also allow for independent
modulation of different synaptic compartments by amacrine cells.
The potential number and diversity of these synaptic transforma-
tions becomes even greater if one considers that individual
amacrine cells provide negative feedback though many neurites
with distinct biophysical and synaptic properties [66]. Such
presynaptic heterogeneity has previously been observed in sensory
pathways of insects, including cricket auditory afferents [67] and
Drosophila olfactory receptor neurons [68].
Materials and Methods
In Vivo Imaging of Presynaptic Ca2+ Signals and VesicleFusion
All procedures were carried out according to the UK Animals
(Scientific Procedures) Act 1986 and approved by the UK Home
Office. Transgenic zebrafish expressing SyGCaMP2.0 and sypHy
were maintained on a 14/10 h light/dark cycle at 28uC. From 24
hpf the larvae were maintained in fish medium (E2) containing 1-
phenyl-2-thiourea at a final concentration of 200 mM (Sigma) to
prevent pigment formation. Fish were imaged as described
Figure 8. Frequency tuning of BCs with different terminal size. (A) Mean sypHy fluorescence signals in OFF terminals in response to full-fieldstimuli of different temporal frequencies measured in vivo (red, rsmall,1 mm, n = 10; black, rlarge.1.5 mm, n = 32). (B) Synaptic gain of large (black) andsmall (red) terminals as a function of stimulus frequency. Results are described by the function
Affiffiffiffiffiffiffiffiffiffiffiffiffiffiffiffiffiffiffiffiffiffiffiffiffiffiffiffiffiffiffiffiffiffiffiffiffiffiffiffiffiffiffiffiffiffiffiffiffiffiffiffiffiffiffiffiffiffiffiffiffi1{ f=f o
� �2� �
z1�Q2 f=f o
� �2
s :
For large terminals, A = 0.2260.02, fo = 4.9660.45, Q = 0.7860.17. For small terminals A = 0.1660.02, fo = 6.4360.27, Q = 1.5760.37. Asterisks marksignificantly different responses at a given frequency, as evaluated by Mann-Whitney U test (p,0.05).doi:10.1371/journal.pbio.1001972.g008
Synaptic Filtering of Visual Signals
PLOS Biology | www.plosbiology.org 12 October 2014 | Volume 12 | Issue 10 | e1001972

previously [13]. Briefly, before experiments 8–10 dpf larvae were
anesthetized in 0.016% Tricaine (Sigma) and immobilized in low
melting point agarose. To prevent eye movement a-bungarotoxin
(2 mg/ml) was injected into the extraocular space. Imaging was
performed using a custom-built multiphoton microscope,
equipped with a mode-locked Chameleon titanium-sapphire laser
(Coherent) tuned to 920 nm and controlled using ScanImage v.3.6
software [69].
The retina was imaged through an Olympus LUMPlanFI 406water immersion (0.8 NA) objective. Green emission from sypHy
and SyGCaMP2 was collected both through the objective and
through an oil condenser (ND 1.4, Olympus), filtered through
GFP filters (530/50 nm, Chroma Technology), and detected with
GaAsP photomultipliers (Hamamatsu). Images (1286128 pixels)
were acquired every 0.128 seconds, resulting in a sampling
frequency of 7.8 Hz. Full-field light stimuli were delivered using
an amber LED (590 nm) filtered through a 600/10 BP filter and
projected through a light guide onto the surface of the bath, close
to the eye of the fish. The mean intensity of light stimuli was
,26105 photons/mm2/s, which is in the low photopic range.
Importantly, optical measurements in the live retina necessarily
give rise to a background activation of photoreceptors. This is due
to direct laser activation of photopigment, but usually more
importantly, due to indirect activation of photopigments from the
emission light of excited fluophores [70]. As a result, rods are
typically saturated, and cones partially adapted, giving rise to a
low-photopic background light-level. Indeed, we observed similar
effects in our in vivo experiments (Figure S1F). However, this
background illumination was weaker than typically observed in
e.g., rabbit [70], presumably as the zebrafish retina is cone
dominated. Nevertheless, following activation of the laser scan-
ning, we typically waited 30 seconds before commencing with
additional visual stimulation to ensure the retina adapted to the
background levels attributed to the laser.
Image AnalysisMovies were processed using the SARFIA suite of analysis
routines [17] running in Igor Pro 6 (Wavemetrics). We detected
terminals on the basis of single images obtained by averaging
many frames of the movie corresponding to total integration times
of several tens of seconds. ROIs corresponding to terminals within
these averaged images were defined using a filtering algorithm
based on a Laplace operator followed by application of a
threshold, as described in detail in [17]. This algorithm will define
most or all of the ROIs that an experienced observer would
recognize by eye. To prevent bias between ON and OFF terminals
within a single field of view, the average image was obtained from
movies in which light steps were applied, and/or light intensity
modulated at 1 Hz or faster.
Estimation of Terminals Size by Two-Photon ImagingThe point-spread function of the used microscope in XY
dimension was 0.5 mm and terminals appeared larger when we
increased intensity of the 2-photon laser. We therefore tested
whether terminals might appear smaller when less active, but
found that this was not the case (as described in Figure S1 and
Text S1). Average terminal sizes were similar between different
fish (Figure S5A) and the effects of terminal size on adaptation
kinetics could be observed in individual fish (Figure S5B) as well as
in data averaged over multiple fish (Figure 6C). However, the
distribution of estimated terminal sizes in SyGCaMP2 was shifted
to larger values, compared to sypHy or Synaptophysin-EGFP fish
(Figure S1H). This is likely explained by the greater overall
brightness of SyGCaMP2. The z-resolution of the microscope was
,2 mm. Given an average radius of just above 1 micron per
terminal, this resolution was therefore large enough to avoid
underestimating the size of terminals traversed non-centrally by
the optical plane, but small enough to avoid out-of-focus terminals
contributing to the signal.
Statistical AnalysisAll statistical analysis was performed in Igor Pro 7 (Wave-
metrics). Differences in different parameters in large and small
terminals, described in Figure 3, were analyzed using Wilcoxon
signed-rank test. This test was chosen because some responses of
large and small terminals were recorded from the same neuron.
Sample sizes were not determined a priori. Analysis of the
response dynamic was automatic and no knowledge of terminal
size was used until the last moment. All animals demonstrating
robust response to light were included in the analysis. Figure 1B
represents biological replicate, representative from more than five
fields of view. No lack of reproducibility was found. All error bars
in figures show 6 1 SEM, unless stated otherwise in the legend.
Calculation of Vesicle Release RatesV9exo, the fraction of total vesicles in the terminal released per
second, was calculated from the sypHy signal according to the
equation:
V 0exo(t)~1
19Fmin
dF
dtzkendo(F{Fmin)
� ð1Þ
where F is the average fluorescence intensity over the terminal at
time t, Fmin is the intensity when the rate of vesicle release is at a
minimum, and kendo is the rate-constant of vesicle retrieval. The
calculation of this formula is described in [14,18]. Estimation of
V9exo requires differentiation of the sypHy trace, which in turn
amplifies noise, so Equation 1 was applied after smoothing with a
series of single or double exponential functions to obtain ‘‘non-
noisy’’ traces before calculation of V9exo. These fits are shown in
Figures 1F and 5C.
Slice Electrophysiology and ImagingSlices of goldfish retina were perfused with extracellular solution
containing (in mM) 120 NaCl, 2.5 CaCl2, 2 KCl, 1 MgCl2, 0.1
CaCl2, 4 HEPES, 10 glucose (pH 7.7, 255 mOsm). Experiments
were carried out at room temperature and slices visualized under
oblique infrared illumination through a 606objective (NA 0.9) on
an upright microscope. Whole cell recordings were obtained from
‘‘large’’ terminals (diameter: 4–12 mm) or from the soma of
‘‘mixed’’ BCs using 8–12 MV patch electrodes [71]. For this, we
targeted large terminals in layers 5/6. The intracellular solution
contained (in mM) 104 Kgluconate, 8 KCl, 2 MgCl2, 4 HEPES,
0.5 EGTA, 2 MgATP, 1 NaGTP, 1 NacGMP (pH 7.4, 250 Osm),
and 100 mM of the hexapotassium salt of the low affinity Ca2+
indicator OGB-5N. Recordings were left for 1–5 min to allow
time for the Ca2+-indicator to diffuse into adjacent small terminals
(diameter 1–4 mm) see also [20]. Series resistance ranged from 8–
15 MV while input resistance was .1 GV at 270 mV. Record-
ings were corrected for junction potentials (calculated as 2
11.95 mV).
OGB-5N was imaged at 40 Hz using an electron multiplying
charge coupled device (EM CCD) camera (Hamamatsu C9100).
Subsequent image analysis was performed using ImageJ, Igor Pro,
and Matlab. OGB-5N signals were quantified as changes in
fluorescence relative to background fluorescence at each pixel (DF/
Fo) and converted to estimates of absolute Ca2+ concentration:
Synaptic Filtering of Visual Signals
PLOS Biology | www.plosbiology.org 13 October 2014 | Volume 12 | Issue 10 | e1001972
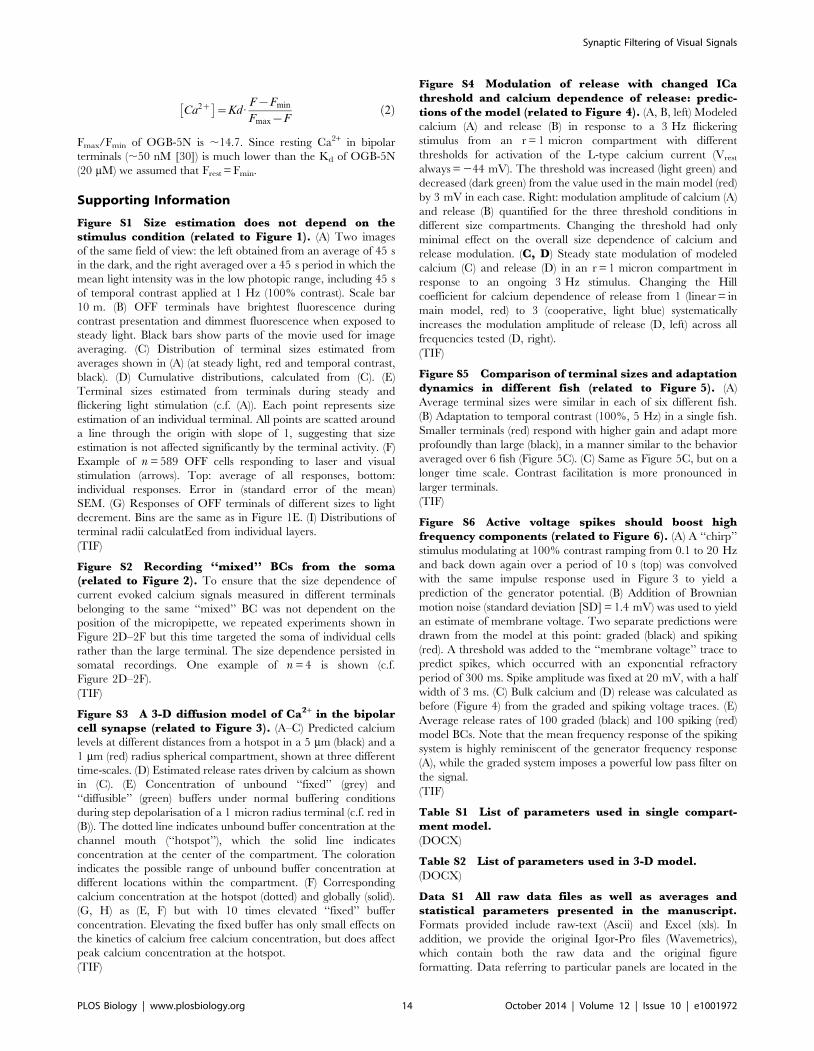
Ca2z �
~Kd:F{Fmin
Fmax{Fð2Þ
Fmax/Fmin of OGB-5N is ,14.7. Since resting Ca2+ in bipolar
terminals (,50 nM [30]) is much lower than the Kd of OGB-5N
(20 mM) we assumed that Frest = Fmin.
Supporting Information
Figure S1 Size estimation does not depend on thestimulus condition (related to Figure 1). (A) Two images
of the same field of view: the left obtained from an average of 45 s
in the dark, and the right averaged over a 45 s period in which the
mean light intensity was in the low photopic range, including 45 s
of temporal contrast applied at 1 Hz (100% contrast). Scale bar
10 m. (B) OFF terminals have brightest fluorescence during
contrast presentation and dimmest fluorescence when exposed to
steady light. Black bars show parts of the movie used for image
averaging. (C) Distribution of terminal sizes estimated from
averages shown in (A) (at steady light, red and temporal contrast,
black). (D) Cumulative distributions, calculated from (C). (E)
Terminal sizes estimated from terminals during steady and
flickering light stimulation (c.f. (A)). Each point represents size
estimation of an individual terminal. All points are scatted around
a line through the origin with slope of 1, suggesting that size
estimation is not affected significantly by the terminal activity. (F)
Example of n = 589 OFF cells responding to laser and visual
stimulation (arrows). Top: average of all responses, bottom:
individual responses. Error in (standard error of the mean)
SEM. (G) Responses of OFF terminals of different sizes to light
decrement. Bins are the same as in Figure 1E. (I) Distributions of
terminal radii calculatEed from individual layers.
(TIF)
Figure S2 Recording ‘‘mixed’’ BCs from the soma(related to Figure 2). To ensure that the size dependence of
current evoked calcium signals measured in different terminals
belonging to the same ‘‘mixed’’ BC was not dependent on the
position of the micropipette, we repeated experiments shown in
Figure 2D–2F but this time targeted the soma of individual cells
rather than the large terminal. The size dependence persisted in
somatal recordings. One example of n = 4 is shown (c.f.
Figure 2D–2F).
(TIF)
Figure S3 A 3-D diffusion model of Ca2+ in the bipolarcell synapse (related to Figure 3). (A–C) Predicted calcium
levels at different distances from a hotspot in a 5 mm (black) and a
1 mm (red) radius spherical compartment, shown at three different
time-scales. (D) Estimated release rates driven by calcium as shown
in (C). (E) Concentration of unbound ‘‘fixed’’ (grey) and
‘‘diffusible’’ (green) buffers under normal buffering conditions
during step depolarisation of a 1 micron radius terminal (c.f. red in
(B)). The dotted line indicates unbound buffer concentration at the
channel mouth (‘‘hotspot’’), which the solid line indicates
concentration at the center of the compartment. The coloration
indicates the possible range of unbound buffer concentration at
different locations within the compartment. (F) Corresponding
calcium concentration at the hotspot (dotted) and globally (solid).
(G, H) as (E, F) but with 10 times elevated ‘‘fixed’’ buffer
concentration. Elevating the fixed buffer has only small effects on
the kinetics of calcium free calcium concentration, but does affect
peak calcium concentration at the hotspot.
(TIF)
Figure S4 Modulation of release with changed ICathreshold and calcium dependence of release: predic-tions of the model (related to Figure 4). (A, B, left) Modeled
calcium (A) and release (B) in response to a 3 Hz flickering
stimulus from an r = 1 micron compartment with different
thresholds for activation of the L-type calcium current (Vrest
always = 244 mV). The threshold was increased (light green) and
decreased (dark green) from the value used in the main model (red)
by 3 mV in each case. Right: modulation amplitude of calcium (A)
and release (B) quantified for the three threshold conditions in
different size compartments. Changing the threshold had only
minimal effect on the overall size dependence of calcium and
release modulation. (C, D) Steady state modulation of modeled
calcium (C) and release (D) in an r = 1 micron compartment in
response to an ongoing 3 Hz stimulus. Changing the Hill
coefficient for calcium dependence of release from 1 (linear = in
main model, red) to 3 (cooperative, light blue) systematically
increases the modulation amplitude of release (D, left) across all
frequencies tested (D, right).
(TIF)
Figure S5 Comparison of terminal sizes and adaptationdynamics in different fish (related to Figure 5). (A)
Average terminal sizes were similar in each of six different fish.
(B) Adaptation to temporal contrast (100%, 5 Hz) in a single fish.
Smaller terminals (red) respond with higher gain and adapt more
profoundly than large (black), in a manner similar to the behavior
averaged over 6 fish (Figure 5C). (C) Same as Figure 5C, but on a
longer time scale. Contrast facilitation is more pronounced in
larger terminals.
(TIF)
Figure S6 Active voltage spikes should boost highfrequency components (related to Figure 6). (A) A ‘‘chirp’’
stimulus modulating at 100% contrast ramping from 0.1 to 20 Hz
and back down again over a period of 10 s (top) was convolved
with the same impulse response used in Figure 3 to yield a
prediction of the generator potential. (B) Addition of Brownian
motion noise (standard deviation [SD] = 1.4 mV) was used to yield
an estimate of membrane voltage. Two separate predictions were
drawn from the model at this point: graded (black) and spiking
(red). A threshold was added to the ‘‘membrane voltage’’ trace to
predict spikes, which occurred with an exponential refractory
period of 300 ms. Spike amplitude was fixed at 20 mV, with a half
width of 3 ms. (C) Bulk calcium and (D) release was calculated as
before (Figure 4) from the graded and spiking voltage traces. (E)
Average release rates of 100 graded (black) and 100 spiking (red)
model BCs. Note that the mean frequency response of the spiking
system is highly reminiscent of the generator frequency response
(A), while the graded system imposes a powerful low pass filter on
the signal.
(TIF)
Table S1 List of parameters used in single compart-ment model.
(DOCX)
Table S2 List of parameters used in 3-D model.
(DOCX)
Data S1 All raw data files as well as averages andstatistical parameters presented in the manuscript.Formats provided include raw-text (Ascii) and Excel (xls). In
addition, we provide the original Igor-Pro files (Wavemetrics),
which contain both the raw data and the original figure
formatting. Data referring to particular panels are located in the
Synaptic Filtering of Visual Signals
PLOS Biology | www.plosbiology.org 14 October 2014 | Volume 12 | Issue 10 | e1001972

respective folders. For any further information, please contact
Tom Baden at [email protected].
(ZIP)
Text S1 Supplemental information. (1) Variations in
estimates of terminal size were not correlated with variations in
terminal brightness. (2) Modeling presynaptic calcium dynamics
and vesicle release. (3) A 3-D model predicting calcium spread at
the channel mouth. (4) The effect of changing L-type calcium
channel threshold and calcium dependency of release: predictions
of the model. (5) Encoding of high frequency components using
spikes. (6) Supplemental references.
(DOCX)
Acknowledgments
We thank Jamie Johnston for criticisms of the manuscript and all members
of the lab for discussions.
Author Contributions
The author(s) have made the following declarations about their
contributions: Conceived and designed the experiments: TB AN FE ED
BO LL. Performed the experiments: TB AN FE ED BO. Analyzed the
data: TB AN FE ED BO LL. Wrote the paper: TB AN LL.
References
1. Masland RH (2001) The fundamental plan of the retina. Nat Neurosci 4: 877–
886.
2. Roska B, Werblin F (2001) Vertical interactions across ten parallel, stacked
representations in the mammalian retina. Nature 410: 583–587.
3. Wassle H (2004) Parallel processing in the mammalian retina. Nat Rev Neurosci
5: 747–757.
4. Masland RH (2012) The neuronal organization of the retina. Neuron 76: 266–
280.
5. Euler T, Haverkamp S, Schubert T, Baden T (2014). Retinal bipolar cells:
elementary building blocks of vision. Nat Rev Neurosci 15: 507–519.
6. Awatramani GB, Slaughter MM (2000) Origin of transient and sustained
responses in ganglion cells of the retina. J Neurosci 20: 7087–7095.
7. Gollisch T, Meister M (2010) Eye smarter than scientists believed: neural
computations in circuits of the retina. Neuron 65: 150–164.
8. Hosoya T, Baccus SA, Meister M (2005) Dynamic predictive coding by the
retina. Nature 436: 71–77.
9. Taylor W, Smith R (2011) Trigger features and excitation in the retina. Curr
Opin Neurobiol 21: 672–678.
10. Abbott LF, Regehr WG (2004) Synaptic computation. Nature 431: 796–803.
11. Asari H, Meister M (2012) Divergence of visual channels in the inner retina. Nat
Neurosci 15: 1581–1589.
12. Mintz I, Sabatini B, Regehr W (1995) Calcium control of transmitter release at a
cerebellar synapse. Neuron 15: 675–688.
13. Dreosti E, Odermatt B, Dorostkar M, Lagnado L (2009) A genetically encoded
reporter of synaptic activity in vivo. Nat Methods 6: 883–889.
14. Odermatt B, Nikolaev A, Lagnado L (2012) Encoding of luminance and contrast
by linear and nonlinear synapses in the retina. Neuron 73: 758–773.
15. Granseth B, Odermatt B, Royle SJ, Lagnado L (2006) Clathrin-mediated
endocytosis is the dominant mechanism of vesicle retrieval at hippocampal
synapses. Neuron 51: 773–786.
16. Dreosti E, Esposti F, Baden T, Lagnado L (2011) In vivo evidence that retinal
bipolar cells generate spikes modulated by light. Nat Neurosci 14: 951–952.
17. Dorostkar MM, Dreosti E, Odermatt B, Lagnado L (2010) Computational
processing of optical measurements of neuronal and synaptic activity in
networks. J Neurosci Methods 188: 141–150.
18. Nikolaev A, Leung KM, Odermatt B, Lagnado L (2013) Synaptic mechanisms of
adaptation and sensitization in the retina. Nat Neurosci 16: 934–941.
19. Vigh J, Vickers E, von Gersdorff H (2011) Light-evoked lateral GABAergic
inhibition at single bipolar cell synaptic terminals is driven by distinct retinal
microcircuits. J Neurosci 31: 15884–15893.
20. Kim MH, Vickers E, von Gersdorff H (2012) Patch-clamp capacitance
measurements and Ca(2)(+) imaging at single nerve terminals in retinal slices.
J Vis Exp pii: 3345.
21. Protti DA, Flores-Herr N, von Gersdorff, H (2000) Light evokes Ca2+ spikes in
the axon terminal of a retinal bipolar cell. Neuron 25: 215–227.
22. Baden T, Esposti F, Nikolaev A, Lagnado L (2011) Spikes in retinal bipolar cells
phase-lock to visual stimuli with millisecond precision. Curr Biol 21: 1859–1869.
23. Saszik S, DeVries SH (2012) A mammalian retinal bipolar cell uses both graded
changes in membrane voltage and all-or-nothing na+ spikes to encode light.
J Neurosci 32: 297–307.
24. Lagnado L, Cervetto L, McNaughton PA (1992) Calcium homeostasis in the
outer segments of retinal rods from the tiger salamander. J Pphysiol 455: 111–
142.
25. Sabatini BL, Oertner TG, Svoboda K (2002) The life cycle of Ca(2+) ions in
dendritic spines. Neuron 33: 439–452.
26. Crank J (1975) The mathematics of diffusion. 2nd edition. Oxford: Clarendon
Press.
27. Allbritton NL, Meyer T, Stryer L (1992) Range of messenger action of calcium
ion and inositol 1,4,5-trisphosphate. Science 258: 1812–1815.
28. Kim MH, Li GL, vanGersdorff H (2013) Single calcium channels and exocytosis
in sensory synapses. J Physiol 591: 3167–3178.
29. Schnapf JL, Nunn BJ, Meister M, Baylor DA (1990) Visual transduction in cones
of the monkey Macaca fascicularis. J Physiol 427: 681–713.
30. Burrone J, Lagnado L (1997) Electrical resonance and Ca2+ influx in the
synaptic terminal of depolarizing bipolar cells from the goldfish retina. J Physiol
505: 571–584.
31. Holt M, Cooke A, Neef A, Lagnado L (2004) High mobility of vesicles supports
continuous exocytosis at a ribbon synapse. Curr Biol 14: 173–183.
32. von Gersdorff H, Sakaba T, Berglund K, Tachibana M (1998) Submil-
lisecond kinetics of glutamate release from a sensory synapse. Neuron 21: 1177–
1188.
33. Mennerick S, Matthews G (1996) Ultrafast exocytosis elicited by calcium current
in synaptic terminals of retinal bipolar neurons. Neuron 17: 1241–1249.
34. Lagnado L, Gomis A, Job C (1996) Continuous vesicle cycling in the synaptic
terminal of retinal bipolar cells. Neuron 17: 957–967.
35. Neves G, Lagnado L (1999) The kinetics of exocytosis and endocytosis in the
synaptic terminal of goldfish retinal bipolar cells. J Physiol 515: 181–202.
36. Beaumont V, Llobet A, Lagnado L (2005) Expansion of calcium microdomains
regulates fast exocytosis at a ribbon synapse. Proc Natl Acad Sci U S A 102:
10700–10705.
37. Thoreson WB, Rabl K, Townes-Anderson E, Heidelberger R (2004) A highly
Ca2+-sensitive pool of vesicles contributes to linearity at the rod photoreceptor
ribbon synapse. Neuron 42: 595–605.
38. Jackman SL, Choi SY, Thoreson WB, Rabl K, Bartoletti TM, Kramer RH
(2009) Role of the synaptic ribbon in transmitting the cone light response. Nat
Neurosci 12: 303–310.
39. Rieke F, Schwartz EA (1996) Asynchronous transmitter release: control of
exocytosis and endocytosis at the salamander rod synapse. J Physiol 493: 1–8.
40. Burrone J, Neves G, Gomis A, Cooke A, Lagnado L (2002) Endogenous calcium
buffers regulate fast exocytosis in the synaptic terminal of retinal bipolar cells.
Neuron 33: 101–112.
41. Coggins M, Zenisek D (2009) Evidence that exocytosis is driven by calcium entry
through multiple calcium channels in goldfish retinal bipolar cells. J Neur-
ophysiol 101: 2601–2619.
42. von Gersdorff H, Vardi E, Matthews G, Sterling P (1996) Evidence that vesicles
on the synaptic ribbon of retinal bipolar neurons can be rapidly released.
Neuron 16: 1221–1227.
43. Baccus SA, Meister M (2002) Fast and slow contrast adaptation in retinal
circuitry. Neuron 36: 909–919.
44. Manookin MB, Demb JB (2006) Presynaptic mechanism for slow contrast
adaptation in mammalian retinal ganglion cells. Neuron 50: 453–464.
45. Burrone J, Lagnado L (2000) Synaptic depression and the kinetics of exocytosis
in retinal bipolar cells. J Neurosci 20: 568–578.
46. Jarsky T, Cembrowski M, Logan SM, Kath WL, Riecke H, et al. (2011) A
synaptic mechanism for retinal adaptation to luminance and contrast. J Neurosci
31: 11003–11015.
47. Ozuysal Y, Baccus SA (2012) Linking the computational structure of variance
adaptation to biophysical mechanisms. Neuron 73: 1002–1015.
48. Kastner DB, Baccus SA (2011) Coordinated dynamic encoding in the retina
using opposing forms of plasticity. Nat Neurosci 14: 1317–1322.
49. Li GL, Vigh J, von Gersdorff H (2007) Short-term depression at the reciprocal
synapses between a retinal bipolar cell terminal and amacrine cells. J Neurosci
27: 7377–7385.
50. Schwartz GW, Okawa H, Dunn FA, Morgan JL, Kerschensteiner D, et al.
(2012) The spatial structure of a nonlinear receptive field. Nat Neurosci 15:
1572–1580.
51. Bolinger D, Gollisch T (2012) Closed-loop measurements of iso-response stimuli
reveal dynamic nonlinear stimulus integration in the retina. Neuron 73: 333–
346.
52. Rieke F (2001) Temporal contrast adaptation in salamander bipolar cells.
J Neurosci 21: 9445–9454.
53. Schwartz G, Rieke F (2011) Perspectives on: information and coding in
mammalian sensory physiology: nonlinear spatial encoding by retinal ganglion
cells: when 1+1 not equal 2. J Gen Physiol 138: 283–290.
54. Wickert M (2013) Signals and systems for dummies. Hoboken (New Jersey):
Wiley.
Synaptic Filtering of Visual Signals
PLOS Biology | www.plosbiology.org 15 October 2014 | Volume 12 | Issue 10 | e1001972

55. Perge JA, Koch K, Miller R, Sterling P, Balasubramanian V (2009) How the
optic nerve allocates space, energy capacity, and information. J Neurosci 29:7917–7928.
56. Balasubramanian V, Sterling P (2009) Receptive fields and functional
architecture in the retina. J Physiol 587: 2753–2767.57. Msghina M, Millar AG, Charlton MP, Govind CK, Atwood HL (1999) Calcium
entry related to active zones and differences in transmitter release at phasic andtonic synapses. J Neurosci 19: 8419–8434.
58. Baccus SA (2007) Timing and computation in inner retinal circuitry. Annu Rev
Physiol 69: 271–290.59. Baden T, Euler T, Weckstrom M, Lagnado L (2013) Spikes and ribbon synapses
in early vision. Trends Neurosci 36: 480–488.60. DeVries SH, Schwartz EA (1999) Kainate receptors mediate synaptic
transmission between cones and ‘Off’ bipolar cells in a mammalian retina.Nature 397: 157–160.
61. DeVries SH, Li W, Saszik S (2006) Parallel processing in two transmitter
microenvironments at the cone photoreceptor synapse. Neuron 50: 735–748.62. Robinson J, Schmitt EA, Harosi FI, Reece RJ, Dowling JE (1993) Zebrafish
ultraviolet visual pigment: absorption spectrum, sequence, and localization. ProcNatl Acad Sci U S A 90: 6009–6012.
63. Werblin FS, Dowling JE (1969) Organization of the retina of the mudpuppy,
Necturus maculosus. II. Intracellular recording. J Neurophysiol 32: 339–355.
64. Connaughton V, Graham D, Nelson R (2004) Identification and morphological
classification of horizontal, bipolar, and amacrine cells within the zebrafishretina. J Comp Neurol 477: 371–385.
65. Li YN, Tsujimura T, Kawamura S, Dowling JE (2012) Bipolar cell-
photoreceptor connectivity in the zebrafish (Danio rerio) retina. J Comp Neurol520: 3786–3802.
66. Grimes WN, Zhang J, Graydon CW, Kachar B, Diamond JS (2010) Retinalparallel processors: more than 100 independent microcircuits operate within a
single interneuron. Neuron 65: 873–885.
67. Baden T, Hedwig B (2010) Primary afferent depolarization and frequencyprocessing in auditory afferents. J Neurosci 30: 14862.
68. Gaudry Q, Hong EJ, Kain J, de Bivort BL, Wilson RI (2013) Asymmetricneurotransmitter release enables rapid odour lateralization in Drosophila.
Nature 493: 424–428.69. Pologruto TA, Sabatini BL, Svoboda K (2003) ScanImage: flexible software for
operating laser scanning microscopes. Biomed Eng OnLIne 2: 9.
70. Euler T, Hausselt SE, Margolis DJ, Breuninger T, Castell X, et al. (2009)Eyecup scope–optical recordings of light stimulus-evoked fluorescence signals in
the retina. Pflugers Arch 457: 1393–1414.71. Palmer MJ, Hull C, Vigh J, von Gersdorff H (2003) Synaptic cleft acidification
and modulation of short-term depression by exocytosed protons in retinal
bipolar cells. J Neurosci 23: 11332–11341.
Synaptic Filtering of Visual Signals
PLOS Biology | www.plosbiology.org 16 October 2014 | Volume 12 | Issue 10 | e1001972