A Survey of State-Level Cost and Benefit Estimates of ... · This report surveys and summarizes...
109
NREL is a national laboratory of the U.S. Department of Energy, Office of Energy Efficiency & Renewable Energy, operated by the Alliance for Sustainable Energy, LLC. A Survey of State-Level Cost and Benefit Estimates of Renewable Portfolio Standards J. Heeter 1 , G. Barbose 2 , L. Bird 1 , S. Weaver 2 , F. Flores-Espino 1 , K. Kuskova-Burns 1 , and R. Wiser 2 1 National Renewable Energy Laboratory (NREL) 2 Lawrence Berkeley National Laboratory (LBNL) NREL is a national laboratory of the U.S. Department of Energy, Office of Energy Efficiency & Renewable Energy, operated by the Alliance for Sustainable Energy, LLC, under contract DE-AC36-08GO28308. Berkeley Lab’s contributions to this report were funded by the Office of Energy Efficiency and Renewable Energy (Solar Energy Technologies Office and Strategic Programs Office) of the U.S. Department of Energy under Contract No. DE-AC02- 05CH11231. This report is available at no cost from the National Renewable Energy Laboratory (NREL) at www.nrel.gov/publications. Technical Report NREL/TP-6A20-61042 LBNL-6589E May 2014
Transcript of A Survey of State-Level Cost and Benefit Estimates of ... · This report surveys and summarizes...

NREL is a national laboratory of the U.S. Department of Energy, Office of Energy Efficiency & Renewable Energy, operated by the Alliance for Sustainable Energy, LLC.
A Survey of State-Level Cost and Benefit Estimates of Renewable Portfolio Standards J. Heeter1, G. Barbose2, L. Bird1, S. Weaver2, F. Flores-Espino1, K. Kuskova-Burns1, and R. Wiser2 1 National Renewable Energy Laboratory (NREL) 2 Lawrence Berkeley National Laboratory (LBNL)
NREL is a national laboratory of the U.S. Department of Energy, Office of Energy Efficiency & Renewable Energy, operated by the Alliance for Sustainable Energy, LLC, under contract DE-AC36-08GO28308.
Berkeley Lab’s contributions to this report were funded by the Office of Energy Efficiency and Renewable Energy (Solar Energy Technologies Office and Strategic Programs Office) of the U.S. Department of Energy under Contract No. DE-AC02-05CH11231.
This report is available at no cost from the National Renewable Energy Laboratory (NREL) at www.nrel.gov/publications.
Technical Report NREL/TP-6A20-61042 LBNL-6589E May 2014

National Renewable Energy Laboratory 15013 Denver West Parkway Golden, CO 80401 303-275-3000 • www.nrel.gov
Lawrence Berkeley National Laboratory 1 Cyclotron Road Berkeley, CA 94720 510-486-4000 • www.lbl.gov
A Survey of State-Level Cost and Benefit Estimates of Renewable Portfolio Standards J. Heeter1, G. Barbose2, L. Bird1, S. Weaver2, F. Flores-Espino1, K. Kuskova-Burns1, and R. Wiser2 1 National Renewable Energy Laboratory (NREL) 2 Lawrence Berkeley National Laboratory (LBNL) NREL is a national laboratory of the U.S. Department of Energy, Office of Energy Efficiency & Renewable Energy, operated by the Alliance for Sustainable Energy, LLC, under contract DE-AC36-08GO28308.
This work was supported by the Director, Office of Science, U.S. Department of Energy under Contract Number DE- AC02-05CH11231
Berkeley Lab’s contributions to this report were funded by the Office of Energy Efficiency and Renewable Energy (Solar Energy Technologies Office and Strategic Programs Office) of the U.S. Department of Energy under Contract No. DE-AC02-05CH11231.
This report is available at no cost from the National Renewable Energy Laboratory (NREL) at www.nrel.gov/publications.
Technical Report NREL/TP-6A20-61042 LBNL-6589E May 2014

NOTICE
This report was prepared as an account of work sponsored by an agency of the United States government. Neither the United States government nor any agency thereof, nor any of their employees, makes any warranty, express or implied, or assumes any legal liability or responsibility for the accuracy, completeness, or usefulness of any information, apparatus, product, or process disclosed, or represents that its use would not infringe privately owned rights. Reference herein to any specific commercial product, process, or service by trade name, trademark, manufacturer, or otherwise does not necessarily constitute or imply its endorsement, recommendation, or favoring by the United States government or any agency thereof. The views and opinions of authors expressed herein do not necessarily state or reflect those of the United States government or any agency thereof.
This report is available at no cost from the National Renewable Energy Laboratory (NREL) at www.nrel.gov/publications.
Available electronically at http://www.osti.gov/scitech
Available for a processing fee to U.S. Department of Energy and its contractors, in paper, from:
U.S. Department of Energy Office of Scientific and Technical Information P.O. Box 62 Oak Ridge, TN 37831-0062 phone: 865.576.8401 fax: 865.576.5728 email: mailto:[email protected]
Available for sale to the public, in paper, from:
U.S. Department of Commerce National Technical Information Service 5285 Port Royal Road Springfield, VA 22161 phone: 800.553.6847 fax: 703.605.6900 email: [email protected] online ordering: http://www.ntis.gov/help/ordermethods.aspx
Printed on paper containing at least 50% wastepaper, including 10% post consumer waste.

iii
This report is available at no cost from the National Renewable Energy Laboratory (NREL) at www.nrel.gov/publications.
Acknowledgments The authors would like to thank the U.S. Department of Energy’s (DOE) Office of Energy Efficiency and Renewable Energy’s (EERE) Strategic Programs Office for primary funding support for this analysis. In particular, the authors are grateful to Steve Capanna and Jason Walsh of the Strategic Programs Office for their support of this project. Participation by Lawrence Berkeley National Laboratory (LBNL) was co-funded by EERE’s Solar Energy Technologies Office, and was made possible through long-standing support by the National Electricity Delivery Division of the DOE’s Office of Electricity Delivery and Energy Reliability.
The authors would also like to thank the following individuals for their thoughtful review: Michael Casper and Paul McCurley, National Rural Electric Cooperative Association; Trish Fields and Malcolm Woolf, Advanced Energy Economy; Ed Holt, Ed Holt and Associates; Andrew Kell, Wisconsin Public Utilities Commission; Dwight Lamberson, New Mexico Public Regulatory Commission; Will Lent and Rick Umoff, Solar Energy Industry Association; Warren Leon, Clean Energy States Alliance; Kevin Mosier, Maryland Public Service Commission; Elizabeth Salerno, American Wind Energy Association; Virinder Singh, EDF Renewable Energy; David Smithson, Texas Public Utilities Commission; as well as Jeff Logan, David Keyser, Thomas Jenkin, Gian Porro, Robin Newmark, Bobi Garrett, and Doug Arent of the National Renewable Energy Laboratory (NREL), Andrew Mills of LBNL and Kelly Knutsen, Ookie Ma, and Rich Tusing of DOE. We also wish to thank Kendra Palmer and Scott Gossett of NREL for editorial support.

iv
This report is available at no cost from the National Renewable Energy Laboratory (NREL) at www.nrel.gov/publications.
Executive Summary More than half of U.S. states have renewable portfolio standards (RPS) in place and have collectively deployed approximately 46,000 MW of new renewable energy capacity through year-end 2012. Most of these policies have five or more years of implementation experience, enabling an assessment of their costs and benefits. Understanding RPS benefits and costs is essential for policymakers evaluating existing RPS policies, assessing the need for modifications, and considering new policies.
This report surveys and summarizes existing state-level RPS cost and benefit estimates and examines the various methods used to calculate such estimates. The report relies largely upon data or results reported directly by electric utilities and state regulators. As such, the estimated costs and benefits itemized in this document do not result from the application of a standardized approach or the use of a consistent set of underlying assumptions. Because the reported values may differ from those derived through a more consistent analytical treatment, we do not provide an aggregate national estimate of RPS costs and benefits, nor do we attempt to quantify net RPS benefits at national or state levels.
The report summarizes state-level RPS costs to date and considers how those costs may evolve going forward given scheduled increases in RPS targets and cost containment mechanisms incorporated into existing policies. The report also summarizes RPS benefits estimates, based on published studies for individual states, and discusses key methodological considerations. These estimates, for example, of the social value of carbon emissions reduction and the human health impacts of reduced air emissions, are based on a variety of methodologies and assumptions. In comparison to the summary of estimated RPS costs, the summary of RPS benefits is more limited, as relatively few states have undertaken detailed benefits estimates. Further, for those states that have estimated RPS benefits, most assess only a limited number of impact types; as a consequence, some types of benefits are not reflected in this report.
RPS Costs Our analysis focuses specifically on the incremental cost of meeting RPS targets, i.e., the cost above and beyond what would have been incurred absent the RPS, over the 2010-2012 period. For states with restructured markets, we derive RPS compliance costs based on the cost of renewable energy certificates (RECs) and alternative compliance payments (ACPs). For traditionally regulated states, we instead rely upon RPS cost estimates reported directly by utilities or regulators within annual compliance reports or other regulatory filings (not prospective studies), and translate those estimates into a set of common metrics for comparison. The methods used by utilities and regulators to estimate incremental compliance costs vary considerably from state to state, in some cases reflecting statutory or regulatory requirements, and a number of states are currently engaged in processes to refine and standardize their approaches to RPS cost calculation.
Importantly, the estimated RPS costs summarized within this report must be considered in light of what the underlying data represent and the limitations therein. First and foremost, the comparisons across states are imperfect, given the varying methods and assumptions used (especially among regulated states). Second, the data presented most closely correspond to the costs borne by utilities or other load serving entities; they do not represent net costs to society,

v
This report is available at no cost from the National Renewable Energy Laboratory (NREL) at www.nrel.gov/publications.
nor do they necessarily represent the costs ultimately borne by ratepayers, such as in cases where ACPs or financial penalties are not passed through to rates or differences in the timing of when costs are incurred and recovered in rates. Third, depending upon the state and particular methodology used, the cost data may omit certain costs incurred by utilities (e.g., integration costs), as well as possible benefits. Other analysis has examined integration costs; for example, a number of U.S.-focused studies have found wind integration costs to be less than $5/MWh (Wiser and Bolinger 2013). Finally, the use of REC prices to compute RPS compliance costs in restructured markets is limited in some cases by a lack of REC price transparency and incomplete data on long-term contracts. In addition, REC prices can be quite volatile, with large swings from year to year, depending upon whether a given state or region is in surplus or deficit relative to its RPS obligations. As such, the calculated RPS compliance costs for restructured markets may not correspond well to trends in the underlying cost of renewable electricity.
Figure ES-1. Estimated incremental RPS costs compared to recent and future RPS targets
In light of what the underlying data represent and the limitations therein, the following are key findings with respect to RPS costs.
• Over the 2010-2012 period, average estimated incremental RPS compliance costs in the United States were equivalent to 0.9% of retail electricity rates when calculated as a weighted-average (based on revenues from retail electricity sales in each RPS state) or 1.2% when calculated as a simple average, although substantial variation exists around the averages, both from year-to-year and across states. Focusing on the most recent historical year available, estimated incremental RPS compliance costs were less than 2% of average retail rates for the large majority of states (see Figure ES-1).
• Among restructured markets, estimated incremental compliance costs ranged from 0.1% to 3.8% of retail rates. Expressed in terms of the cost per unit of renewable energy required, estimated incremental RPS compliance costs in these states ranged from $2-$48/MWh.
-20%-10%0%10%20%30%40%
-4%-2%0%2%4%6%8%
CT
DC
DE IL
MA
MD
ME
NH NJ
NY
OH PA RI
TX AZ
CA
CO MI
MN
MO NC
NM
OR
WA WI
Restructured Regulated
Estimated Incremental RPS Costs (Most-Recent Year)RPS Target (Most-Recent Year)RPS Target (Final Year)
Estim
ated
RPS
Cos
t (%
of A
vera
ge R
etai
l Rat
es)
RPS
Tar
get
(% o
f Ret
ail S
ales
)
* For most states shown, the most-recent year RPS cost and target data are for 2012; exceptions are CA (2011), MN (2010), and WI (2010). MA does not have single terminal year for its RPS; the final-year target shown is based on 2020. For CA, high and low cost estimates are shown, reflecting the alternate methodologies employed by the CPUC and utilities. Excluded from the chart arethose states without available data on historical incremental RPS costs (KS, HI, IA, MT, NV). The values shown for RPS targets exclude any secondary RPS tiers (e.g., for pre-existing resources). For most regulated states, RPS targets shown for the most-recent historical year represent actual RPS procurement percentages in those years, but for MO and OR represent REC retirements (for consistency with the cost data).

vi
This report is available at no cost from the National Renewable Energy Laboratory (NREL) at www.nrel.gov/publications.
Variation among those states reflects differences in RPS target levels, REC pricing, the composition of RPS resource tiers, and other factors.
• Among traditionally regulated states (excluding California), estimated incremental compliance costs varied from -0.2% (i.e., a net savings) to 3.5% of average retail rates. Variation among these states partly reflects differences in RPS procurement levels. In addition, relatively high estimated costs for a number of states are associated with the presence of distributed generation (DG) set-asides, for which compliance costs tend to be “front-loaded.” The estimated incremental costs of meeting general RPS obligations (i.e., excluding DG or solar set-asides) ranged from -$4 to $44/MWh of renewable energy procured.
• Methodological differences contribute to observed variations in these compliance cost estimates, especially among regulated states. For example, in California, two different methodologies yield derived incremental compliance cost estimates ranging from a net savings equal to 3.6% of retail rates to a net cost of 6.5%, as shown in Figure ES-1.
• Utilities in eight states assess surcharges on customer bills to recoup RPS compliance costs. These utility-reported surcharges, which represent the costs borne directly by customers, ranged in 2012 from about $0.50/month to $4.00/month for average residential customers, and on a statewide average basis, equate to roughly 0.5% to 4% of average retail electricity rates. These customer surcharges may differ from the estimated compliance costs borne by the utility for a variety of reasons, such as differences in the timing or type of costs that can be passed through to customers.
• Estimated incremental RPS compliance costs over the historical period of our analysis reflect the RPS targets applicable during those years (the open circles in Figure ES-1). Under current policies, RPS targets are scheduled to increase significantly, eventually reaching levels represented by the closed circles. Whether and the extent to which incremental RPS costs rise in tandem depends on many factors: renewable energy technology costs trends, natural gas prices, federal tax incentives, and environmental regulations, among others.
• Future RPS compliance costs are limited by cost containment mechanisms built into most RPS policies. Among those states relying principally upon an ACP mechanism for cost containment, RPS costs are effectively capped at roughly 6-9% of average retail rates in most cases. Cost caps in most other states are considerably more stringent, often limiting compliance costs to 1-4% of average retail rates. Compliance costs in several of those states have already reached or are approaching the respective caps.
RPS Benefits Policymakers often consider RPS costs within the context of broader social benefits beyond any direct cost savings that may accrue to utilities. Potential benefits of RPS policies include reduced emissions, water savings, fuel diversity, electricity price stability, and economic development. States have most commonly attempted to quantitatively assess avoided emissions and associated human health benefits, economic development impacts, and savings from reductions in wholesale electricity prices. In many cases, these assessments are required by the legislature or public utilities commission (PUC), filed as part of an integrated resource plan (IRP) docket, and prepared for regulatory commissions, energy boards, or public benefit corporations. In this work, we focused on analyses conducted as part of state-level RPS evaluations, but did not review the

vii
This report is available at no cost from the National Renewable Energy Laboratory (NREL) at www.nrel.gov/publications.
broader literature on renewable energy benefits in general. While we attempted to conduct a thorough literature review, we have likely omitted some analyses; however, this review provides an indication of the types of benefits analyses that have been conducted and the range of benefits found.
Key findings include:
• A relatively small number of RPS benefits estimates have been developed and methodologies vary considerably, which limits the ability to make comparisons and bounds the range of impacts. We identified studies for eight states that assessed the societal benefits or broader impacts of RPS policies based on our review of literature. Most studies of benefits or impacts are prospective in nature, assessing not only the current RPS impacts, but also examining future impacts, in contrast to the cost estimates previously discussed that are retrospective. Some types of benefits, such as avoided emissions, can accrue for the lifetime of the renewable energy plant, while costs are incurred typically over a shorter period.
• We identified six studies that attempted to quantify the emissions or human health benefits of state RPS policies. Most used modeling approaches to assess scenarios with and without renewable energy and some estimated the dollar values associated with emissions reductions. In some cases, emissions benefits may be captured in estimates of net incremental costs, such as if allowance prices are already embedded in wholesale electricity prices. Estimates of benefits ranged from roughly tens to hundreds of millions of dollars on an annual basis depending on the state and scenario. These estimates translate to approximately $4-23/MWh of renewable generation, depending on the study and the cost value assumed for CO2.
• Similarly, we identified six studies that attempted to quantify economic impacts of an RPS. Two used economic modeling approaches while the others used input-output models or simplified case study approaches. Often input-output models or simplified approaches estimate gross jobs, which do not account for shifts in employment that may occur, as opposed to new net jobs. A number of the studies examined economic development benefits annually or over the lifespan of the renewable energy projects, with benefits on the order of $1-$6 billion, or $22-30/MWh of renewable generation.
• Six states estimated wholesale market price reductions that resulted from an RPS (i.e., the reduction in market clearing prices resulting from an increase in the supply of low marginal-cost renewable resources), typically using electric system modeling or applying estimates from other modeling efforts. The studies generally found wholesale price reductions of about $1/MWh or less within specific markets (total generation), or price suppression benefits of $2-$50/MWh of renewable energy generation.
• Comparison of costs to benefits is challenging, even when they are reported in the same study, given that some incremental cost calculations may already take into account specific benefits, analysis time periods may differ, benefits assessments may address only particular types of benefits, and other factors. Most states for which we have identified benefits estimates did not conduct direct comparisons.
In the future, additional efforts could be undertaken to comprehensively assess the costs and benefits of state RPS policies by comparing costs and benefits directly, using similar methodologies and level of rigor. Further, additional work could be done to standardize

viii
This report is available at no cost from the National Renewable Energy Laboratory (NREL) at www.nrel.gov/publications.
incremental cost calculations within and among states provided that such cost calculations are often required by RPS statutes. Efforts in a few states are underway to address standardization of incremental cost calculations; states that have not examined standardization may see the issue arise in the future and be able to learn from the processes and outcomes of existing state standardization efforts.

ix
This report is available at no cost from the National Renewable Energy Laboratory (NREL) at www.nrel.gov/publications.
Table of Contents Acknowledgments ..................................................................................................................................... iii Executive Summary ................................................................................................................................... iv List of Figures ............................................................................................................................................ xi List of Tables .............................................................................................................................................. xi 1 Introduction ........................................................................................................................................... 1 2 Methods of Determining Cost Impact ................................................................................................. 3
2.1 Methods for Estimating Incremental RPS Costs in States with Traditionally Regulated Markets .. 4 2.1.1 Comparing to a Proxy Non-renewable Generator ............................................................. 5 2.1.2 Comparing to Market Price ............................................................................................... 6 2.1.3 Modeling Approaches ....................................................................................................... 7 2.1.4 Additional Considerations for Estimating Incremental RPS Costs in Regulated States ... 9
2.2 Approaches for Estimating Incremental RPS Costs in States with Restructured Electricity Markets .......................................................................................................................................... 11
2.3 Gross RPS Compliance Costs ........................................................................................................ 14 2.4 Including Other Expenses in RPS Cost Calculations ..................................................................... 15
2.4.1 Integration Costs and Network Transmission Costs ....................................................... 15 2.4.2 Inclusion of Administrative Expenses ............................................................................ 16 2.4.3 Treatment of Energy Efficiency Eligible to Meet RPS ................................................... 17
2.5 Summary of Methodological Considerations ................................................................................ 17 3 Incremental RPS Compliance Costs: Historical Data for 2010 to 2012 ........................................ 21
3.1 States with Restructured Markets .................................................................................................. 22 3.1.1 Methodology and Data Sources ...................................................................................... 23 3.1.2 REC Prices ...................................................................................................................... 26 3.1.3 Estimated incremental RPS Costs per Unit of Renewable Generation ........................... 29 3.1.4 Estimated incremental RPS Costs as a Percentage of Retail Rates ................................. 30
3.2 States with Regulated Markets ....................................................................................................... 33 3.2.1 Methodology and Data Sources ...................................................................................... 33 3.2.2 Estimated incremental RPS Costs per Unit of Renewable Generation ........................... 35 3.2.3 Estimated incremental RPS Cost as a Percentage of Retail Rate .................................... 36
3.3 RPS Surcharges .............................................................................................................................. 40 3.4 Assessment of Future RPS Costs and Cost Containment Mechanisms ......................................... 43
3.4.1 RPS Cost Containment Mechanisms .............................................................................. 45 4 Benefits of RPS ................................................................................................................................... 51
4.1 Emissions and Human Health ........................................................................................................ 52 4.1.1 Emissions Rate Approach ............................................................................................... 54 4.1.2 Modeling Avoided Emissions Approach ........................................................................ 54
4.2 Economic Development Impacts ................................................................................................... 56 4.2.1 Input-Output Models and Simplified Approaches .......................................................... 58 4.2.2 Economic Modeling Approach ....................................................................................... 60
4.3 Wholesale Market Price Impacts ................................................................................................... 61 5 Conclusion .......................................................................................................................................... 64 References ................................................................................................................................................. 66 Appendix: State Summaries .................................................................................................................... 79
Arizona ................................................................................................................................................. 79 California .............................................................................................................................................. 79 Colorado ............................................................................................................................................... 80 Connecticut ........................................................................................................................................... 81 The District of Columbia ...................................................................................................................... 82 Delaware ............................................................................................................................................... 82

x
This report is available at no cost from the National Renewable Energy Laboratory (NREL) at www.nrel.gov/publications.
Hawaii .................................................................................................................................................. 83 Illinois ................................................................................................................................................... 84 Iowa ...................................................................................................................................................... 85 Kansas .................................................................................................................................................. 85 Maine .................................................................................................................................................... 86 Maryland .............................................................................................................................................. 86 Massachusetts ....................................................................................................................................... 87 Michigan ............................................................................................................................................... 88 Minnesota ............................................................................................................................................. 89 Missouri ................................................................................................................................................ 89 Montana ................................................................................................................................................ 90 Nevada .................................................................................................................................................. 90 New Jersey ........................................................................................................................................... 91 New Hampshire .................................................................................................................................... 91 New Mexico ......................................................................................................................................... 92 North Carolina ...................................................................................................................................... 92 New York ............................................................................................................................................. 93 Ohio ...................................................................................................................................................... 94 Oregon .................................................................................................................................................. 95 Pennsylvania ......................................................................................................................................... 95 Rhode Island ......................................................................................................................................... 96 Texas .................................................................................................................................................... 96 Washington ........................................................................................................................................... 96 Wisconsin ............................................................................................................................................. 97

xi
This report is available at no cost from the National Renewable Energy Laboratory (NREL) at www.nrel.gov/publications.
List of Figures Figure ES-1. Estimated incremental RPS costs compared to recent and future RPS targets ................. v Figure 1. Overview of methodologies used to calculate RPS costs ..................................................... 21 Figure 2. REC spot market prices ......................................................................................................... 28 Figure 3. Estimated incremental RPS cost over time in states with restructured markets ($/MWh of
renewable electricity) ..................................................................................................................... 30 Figure 4. Estimated incremental RPS cost over time in states with restructured markets (% of retail
rates) ............................................................................................................................................... 31 Figure 5. Estimated incremental RPS cost by tier in restructured markets (% of retail rates) ............. 32 Figure 6. Estimated incremental RPS costs from RECs and ACPs in restructured markets (% of retail
rates) ............................................................................................................................................... 32 Figure 7. Estimated incremental RPS cost over time for general RPS obligations in regulated states
($/MWh of renewable electricity) .................................................................................................. 36 Figure 8. Estimated incremental RPS cost over time in regulated states (% of retail rates) ................ 38 Figure 9. RPS surcharges over time (% of retail rates) ........................................................................ 42 Figure 10. Estimated incremental RPS costs compared to recent and future RPS targets ................... 43 Figure 11. RPS cost caps compared to estimated recent historical costs ............................................. 50
List of Tables Table 1. Methods for Estimating Incremental RPS Costs ...................................................................... 5 Table 2. Publically Available Information on REC Pricing ................................................................. 13 Table 3. ACP Cost Recovery Provisions .............................................................................................. 14 Table 4. Data Sources Used to Calculate RPS Compliance Costs for Restructured States .................. 25 Table 5. ACP Rates: 2010-2012 ($/MWh) ........................................................................................... 26 Table 6. Data Sources Used to Calculate Estimated RPS Compliance Costs for Regulated States ..... 34 Table 7. Alternate RPS Incremental Cost Estimates for California (2011) .......................................... 39 Table 8. Average RPS Surcharges for Residential Customers in 2012 ................................................ 41 Table 9. Cost Containment Mechanisms .............................................................................................. 47 Table 10. Summary of State Studies of RPS Benefits and Benefits Assessed ..................................... 52 Table 11. Summary of Estimates of Emissions and Human Health Benefits of State RPS ................. 53 Table 12. Summary of Estimates of RPS Economic Impacts .............................................................. 58 Table 13. Summary of Estimates of Wholesale Market Price Impacts of Renewables Developed for
RPS ................................................................................................................................................ 61 Table 14. California Utilities’ Estimated Average RPS Costs in ¢/kWh (2003-2011) ........................ 80 Table 15. Estimated Avoided Energy Cost in ¢/kWh Purchases from Qualifying Facilities of >100
kW .................................................................................................................................................. 84 Table 16. IPA Reported Costs of Unbundled RECs and Conventional Supply (June 2009-May 2013)85 Table 17. ACP Rates for the 2013 CY (in $/MWh) ............................................................................. 87 Table 18. The Weighted Average Cost/REC for Ohio’s Electric Distribution Utilities and Electric
Service Companies in 2011 ........................................................................................................... 94

1
This report is available at no cost from the National Renewable Energy Laboratory (NREL) at www.nrel.gov/publications.
1 Introduction Renewable portfolio standards (RPS) have been widely adopted by states and have reached moderate-to-advanced stages of implementation, so that there is now sufficient experience to examine implementation costs and benefits. RPS policies call for electricity providers to acquire specific amounts of renewable energy generation over time, often as a percentage of overall electricity supplied. These policies have been a significant driver of development of new renewable capacity additions in the United States, with roughly 46 GW or two-thirds of all non-hydroelectric renewable capacity additions since 1998 occurring in states with active or impending RPS targets.1 Today, RPS policies are established in 29 states plus Washington D.C. and Puerto Rico.2 RPS policies in 22 states have been in place for five or more years, and RPS polices in five states have been in place for more than a decade; this degree of implementation experience has led to cost and benefit assessments by utilities, states, and others.
Understanding the costs and benefits of RPS policies can be important for program evaluation, understanding policy effectiveness, consideration of new policies, and assessing potential modifications to existing RPS policies. In recent years, there has been significant legislative activity to modify RPS targets (CNEE 2012), and information on RPS implementation costs across states can be particularly important for informing legislative decisions.
Information about RPS costs is also often needed to support other regulatory and legislative processes. RPS costs, in some cases, are recovered through a dedicated surcharge or tariff rider on customer bills that is adjusted regularly and approved by the public utilities commission (PUC). In these instances, utilities must estimate the costs when requesting adjustments to the surcharge. States may also conduct occasional evaluations of their RPS programs, which may be required by statute. Such evaluations are often much broader in scope than the aforementioned administrative processes, and may include analyses of benefits, such as economic development and environmental impacts.
Many states have cost containment mechanisms in place that limit RPS compliance costs and the associated impact on ratepayers (Stockmayer et al. 2012; CPI 2012). For example, several states have developed rules precluding the cost of RPS compliance from exceeding 2-4% of retail electricity rates. As a result of these provisions, utilities and PUCs must routinely evaluate RPS program costs—typically within the context of annual compliance filings or reports to the legislature—to ensure that the compliance costs do not exceed the cost caps.
In implementing RPS cost caps, surcharges, and program evaluations, states have faced methodological issues associated with determining compliance costs. In some cases, methods for calculating such costs may be briefly specified in statute or in implementing rules by the PUC. Even in cases where the broad methods are defined, there can be significant variability in utility
1 The 46 GW figure is intended as a rough proxy for the impact of state RPS programs on renewable energy development to date, and was derived by simply considering the date and location of renewable energy capacity additions. For the purpose of this tabulation, renewable additions are counted if and only if they are located in a state with an RPS policy and commercial operation began no more than one year before the first year of RPS compliance obligations in that state. 2 For additional detail, see the DSIRE database: http://www.dsireusa.org/rpsdata/index.cfm.

2
This report is available at no cost from the National Renewable Energy Laboratory (NREL) at www.nrel.gov/publications.
calculations. As a result, a number of states (e.g., New Mexico, Minnesota, Washington) have recently conducted or are currently engaged in regulatory proceedings to develop consistent RPS cost calculation methods across utilities. Some of the key challenges include assessing the incremental or above-market costs of acquiring renewable generation rather than conventional generation sources and the timeframe of the cost calculation.
While most states or utilities have estimated or collected data on compliance costs, only a few have assessed benefits quantitatively. Benefits of RPS policies can include environmental benefits, such as avoided air pollutant emissions, human health effects, and reduced water consumption, as well as fuel diversity, economic development, electricity price stability, and others. Methods used to assess benefits are substantially different than for estimating costs, and these are covered separately in this report.
This analysis adds to a relatively small, but varied, literature analyzing RPS costs across states. At the national level, cost impacts of a proposed federal RPS have been studied with the use of modeling tools (Bird et al. 2011, Fischer 2010, and Wiser and Bolinger 2007). At the state level, Morey and Kirsch (2013) use regression analysis to examine the impact of various policies, including an RPS, on electricity rates, using historical data. Chen et al. (2007) examined prospective, rather than retrospective, RPS studies, the majority of which were funded by nongovernmental organizations. Of the studies reviewed by Chen et al., 21 of 30 projected a retail rate increase of less than or equal to one percent in the RPS peak target year, while nine studies predict rate impacts above 1% and two of those studies predict rate impacts of more than 5%.
While prospective RPS studies have been conducted in many cases, in some instances at the request of state legislatures, this analysis does not utilize forward looking cost studies, but rather focuses on estimates of actual incurred costs. The approach used in our analysis focuses on estimated incurred costs so as to better determine rate changes that are attributable to RPS implementation costs rather than other factors that can influence rates.
This paper examines estimated costs and benefits from RPS implementation to date and the expected costs if they continue to evolve over time to their end target. In general, the information presented in this report can be important for policymakers and other stakeholders to understand how state RPS implementation costs and benefits compare as they evaluate existing RPS policies and consider revisions going forward. The focus of this report is on estimated costs to load serving entities subject to RPS targets; we do not focus on broader societal costs (such as federal tax subsidies). Data for this report are obtained primarily from PUC compliance filings, program evaluations conducted or authorized by state commissions, and other state-commissioned studies. Section 2 assesses current methods used to evaluate RPS costs and discusses the issues and challenges associated with various approaches. Section 3 assesses estimated RPS cost data for states where information is available, discussing underlying reasons for differences across states and the impacts of policy design (for example, the presence of solar carve-outs ). The potential to reach cost caps in coming years is also examined. Section 4 reviews quantitative benefits information, focusing on estimates of broader societal benefits prepared for formal evaluations of state-level RPS policies, often at the request of legislatures.

3
This report is available at no cost from the National Renewable Energy Laboratory (NREL) at www.nrel.gov/publications.
2 Methods of Determining Cost Impact Section 2 and Section 3 of this report survey various methods used to estimate the costs of renewable portfolio standards and summarize estimates of state RPS costs to date, relying largely upon data or results reported directly by electric utilities and state regulators. As such, the estimated costs itemized in this document do not result from the application of a standardized approach or the use of a consistent set of underlying assumptions.
Costs examined by utilities, states, and regulators may be defined as either “gross costs” or “incremental costs.” Gross costs consist of the total cost of procuring renewables to meet the RPS, while incremental costs (also referred to as “net” or “above market” costs) examine the difference between gross costs and the costs that would have been borne absent the RPS. “Incremental” is sometimes defined in different ways; here we refer to incremental cost as the additional cost of renewable electricity above and beyond what would have been incurred to procure electricity in the absence of the RPS. Most states focus on calculating the incremental costs of RPS compliance, though three (California, Kansas, and Nevada) have published estimates of gross costs. RPS benefits are discussed in Section 4.
In general, the method by which costs may be determined depends on the regulatory structure of the state.3 In traditionally regulated states, utilities commonly enter into long-term power purchase agreements (PPAs) for the electricity and renewable energy certificates (RECs) from a project, or build and own renewable generation projects directly. RECs represent the environmental attributes of renewable generation and are used to demonstrate compliance with the RPS. Because these long-term PPAs include both the electricity and the REC (referred to as a “bundled contract”), determining the “incremental” cost of the renewable energy requires a comparison to the cost of conventional generation that would otherwise have been procured. In traditionally regulated states, RPS costs are typically estimated by either the obligated utility or by the PUC. The general methodology for assessing costs has in some cases been outlined by statute or regulation; however, statutory or regulatory language can still be open to interpretation by the compliance entity, sometimes resulting in differing methodologies across utilities within a state.
In states with restructured markets, compliance entities are typically buying “unbundled” RECs, and thus, the incremental cost of RPS compliance is derived from the cost of RECs in addition to any alternative compliance payments (ACPs) made to achieve compliance. Most restructured states have ACPs that enable obligated entities to make a payment at a pre-established price in lieu of procuring renewables (e.g., $50/MWh). These essentially establish a ceiling on the cost of compliance because obligated entities would not enter into contracts to procure renewable generation above the ACP price. Though REC prices (in combination with ACPs) can be used to
3 In states with restructured markets, the traditional electric utility monopoly, where the utility provides generation, transmission, and distribution, has been split. Customers in restructured states can choose which electric service company will supply their generation. In traditionally regulated states, vertically integrated utilities provide generation, transmission, and distribution service to a captive market (i.e., franchise service territory). While there is a spectrum of restructuring, for purposes of this study, we classify the following RPS jurisdictions as operating in restructured markets: Connecticut, Delaware, Illinois, Massachusetts, Maryland, Maine, New Hampshire, New Jersey, New York, Ohio, Pennsylvania, Rhode Island, Texas, and Washington, D.C.

4
This report is available at no cost from the National Renewable Energy Laboratory (NREL) at www.nrel.gov/publications.
estimate the incremental cost of RPS compliance, it is important to note that REC prices are influenced by market supply and demand, and can fluctuate widely, thus not necessarily representing the above market costs for renewable energy, as discussed further in Section 2.2. Moreover, in addition to purchasing unbundled RECs, compliance entities in some restructured markets have begun procuring more renewables through long-term bundled PPAs, which requires a different methodology to calculate the incremental cost.
This section provides an overview of the methods used to estimate the cost impacts of an RPS; Section 3 will present the results of studies done by states as well as our calculation of RPS costs, based on REC price data, ACPs, and data from long-term contracts.
We structure the section as follows: Section 2.1 discusses methods used to estimate incremental RPS compliance costs in regulated states; Section 2.2 discusses methods used in states with restructured electricity markets; Section 2.3 discusses those states that instead report only gross costs; Section 2.4 highlights other issues that impact cost estimates; and Section 2.5 provides a summary of methodological considerations.
2.1 Methods for Estimating Incremental RPS Costs in States with Traditionally Regulated Markets
In traditionally regulated states where utilities and state agencies are estimating the incremental cost to meet the RPS, a key decision is how to determine the counterfactual scenario—absent RPS procurement, what resources would have been procured, and at what cost. After the counterfactual scenario costs are determined, they can then be subtracted from the gross RPS costs to derive an “incremental” cost of RPS compliance.
Utilities in states with traditionally regulated markets generally use one of three methods, or a combination of methods, for defining the counterfactual scenario and estimating incremental RPS costs (Table 1). In some cases, the counterfactual scenario is a particular type of conventional generator, which may be established by the Commission. In other cases, utilities use wholesale prices to determine the counterfactual scenario. Finally, many utilities use modeling approaches to determine the proxy conventional generator(s) or market prices. Table 1 outlines the primary methods for determining incremental costs in regulated markets, identifies the methods used in various regulated states, and highlights a number of key considerations within those methods, as discussed further below.

5
This report is available at no cost from the National Renewable Energy Laboratory (NREL) at www.nrel.gov/publications.
Table 1. Methods for Estimating Incremental RPS Costs
Method States Key Considerations Considerations for Multiple Methods
Compare to a proxy non-renewable generator
AZ, CA, MI, OR • What is the process for determining the conventional generator?
• Over what time period are costs calculated?
• Is a carbon adder included in the non-renewable costs?
• What fossil fuel prices are assumed?
• What additional costs are included (e.g. capacity, transmission, or ancillary services)?
• Are renewable resources that were developed before the RPS implementation included?
Compare to market price
CA, MN, WA, WI
• Is the wholesale market generation shaped to match the output of the renewable energy?
• Are energy and capacity values included?
Modeling approaches
CO, MI, MN, NM, NC
• For future scenarios, what assumptions are made about load growth, environmental regulations?
2.1.1 Comparing to a Proxy Non-renewable Generator Under this approach, utilities and states compare the cost of RPS resources to the levelized cost of some proxy conventional generator. The kind of proxy generator, and the set of costs included in the comparison, may be established by the commission or in statute. These costs may include (for both the renewable generation and conventional generation) those associated with fuel consumption, generation capacity, operations and maintenance, transmission, ancillary services, and emissions.
This approach takes a long-term perspective, looking at the levelized cost of a resource over its lifetime. It may also simplify the process for calculating incremental costs, compared to a modeling approach, though decisions about defining the proxy generator, timeframe of analysis, fuel costs, and other issues may complicate the process. In addition, the resulting estimated incremental costs may not represent what actually would have been used absent an RPS. This is because in practice, renewable generation could displace more than one generator type at different hours during the year, and may or may not have equal capacity value as the proxy generator. The generator type as well as the hours in which it is operated will impact the overall cost profile.
States have used different approaches to developing a proxy. Some examples include the following:
• The Michigan PUC files a report annually examining the cost of renewables procured under the RPS compared to the cost of a new, coal-fired power plant, as required by statute. The PUC report draws on data submitted in the rate-regulated electric providers’ annual renewable energy plans, which must demonstrate that the “life cycle cost of renewable energy acquired, less the life cycle net savings associated with the Energy Optimization Plans, did not exceed the life cycle cost of electricity generated by a new conventional coal-fired facility (MPSC 2013, 23-24).” The PUC staff developed a guidepost for the cost of a
6
This report is available at no cost from the National Renewable Energy Laboratory (NREL) at www.nrel.gov/publications.
new coal plant of $133/MWh (or $0.133/kWh), based on a 40-year life cycle and forthcoming EPA regulations.4
• In Oregon, utilities estimate incremental costs of compliance based on a combined cycle gas turbine (CCGT) proxy, unless otherwise specified by the PUC, the costs of which must be based on the most recent integrated resource plan (IRP), unless material changes have been made since then.
• Although California’s cost assessment process is being revised, the historical approach for evaluating RPS costs was to compare RPS procurement to a “market price referent” (MPR). The MPR was developed by the utilities as the modeled cost to own and operate a CCGT over multiple time periods. In its most recent RPS cost report, the CPUC used a 20-year MPR of $0.101/kWh to evaluate the utilities’ 2011 RPS portfolios (CPUC 2013a).
2.1.2 Comparing to Market Price Some states and utilities are estimating incremental RPS costs by comparing the cost of renewables procurement relative to wholesale electricity spot market prices. In order to determine the market price, a number of considerations need to be weighed, including: should the wholesale market generation be shaped to match the output of the renewable energy, and are both energy and capacity market costs considered?
States and utilities have used different approaches when comparing the cost of renewables used to meet the RPS to market price. Text Box 1 describes how utilities in Minnesota have calculated incremental RPS costs, using market price as well as modeling work. Other examples using wholesale market prices as the presumed cost absent the RPS include the following:
• In Washington, the three investor-owned utilities (IOUs) are comparing the costs of renewables to the cost of purchasing an equivalent amount of energy from the wholesale market.5 As part of this process, PacifiCorp used the wholesale market price curve shaped to the output of the renewable resource. This shaping was not done by the other IOUs. Differences in methodology and other factors led to a two-fold range in reported 2012 compliance costs estimates in Washington. PacifiCorp estimated the cost of RPS compliance at $15.73/MWh while Avista’s estimate was $20.35/MWh and Puget Sound Energy’s estimate was $43.76/MWh (Stanfield 2013a). The Washington UTC is addressing cost standardization as it considers revisions to its RPS rules (see Docket UE-131723).
• Although California has used the MPR approach, utilities have also estimated avoided costs using a market price methodology using day-ahead market price and the cost of capacity.
4 The PUC staff calculation of the renewable cost includes the cost of PUC approved contracts, with the exception of Detroit Edison’s and Consumers Energy’s solar programs, which the PUC determined to make up less than two percent of contracts approved, on a generation basis. 5 Washington’s RPS statute defines incremental costs as “the difference between the levelized delivered cost of the eligible renewable resource, regardless of ownership, compared to the levelized delivered cost of an equivalent amount of reasonably available substitute resources that do not qualify as eligible renewable resources, where the resources being compared have the same contract length or facility life” (RCW 19.285.050(1)(b)). The Washington PUC staff commented that use of the wholesale market price does not appear to meet the language specified in statute (Washington UTC 2013).

7
This report is available at no cost from the National Renewable Energy Laboratory (NREL) at www.nrel.gov/publications.
Compared to the MPR-based avoided cost estimate of $0.10/kWh, the utilities’ estimates based on market prices were much lower, roughly $0.03/kWh, which resulted in much higher estimates for incremental RPS costs (discussed further in Text Box 3). The PUC expressed concern with this approach, noting that the results would have prevented even low-cost hydro and nuclear resources from being determined cost-effective and that the calculations were based on short-run avoided costs (CPUC 2013a).
2.1.3 Modeling Approaches Modeling approaches can provide a system-wide look at the differences in resources built and dispatched with and without the addition of renewable energy (instead of just looking at one generator type or the wholesale market price). Key inputs to dispatch and capacity expansion planning models include the fuel prices for fossil generation, inclusion of environmental costs, and for models examining future scenarios, the availability of renewable energy tax credits. One advantage of the modeling approach is that it can provide a more comprehensive picture of what would have happened absent the RPS. Modeling approaches may also be able to better capture integration and transmission costs. However, modeling results are heavily dependent upon the key inputs, which are complex and subject to judgment.
States have taken different approaches to modeling approaches. Some examples include the following:
Text Box 1. Rate Impact Calculations in Minnesota Utilities in Minnesota have used different methods to estimate RPS incremental costs. Xcel Energy (MN) examined the cost of the renewable resources compared to the cost of the same amount of energy and capacity in the MISO market. To determine the renewable energy costs, they included the price paid for contracted energy or annual revenue requirements at their owned facilities (Xcel Energy 2011). Xcel Energy found that the rate impact for wind resources over 2008 and 2009 was approximately 0.7% less than market prices, though biomass resources were slightly higher (0.56% and 1.16% in 2008 and 2009, respectively). Other utilities in Minnesota had different results. Of the fourteen utilities that submitted reports, eight said that complying with the renewable standard has resulted in little or no additional costs, if not a slight savings for customers, while six utilities, including Great River Energy, reported that their efforts to comply with the policy led to increased costs for customers. Great River Energy modeled a no-RPS scenario that did not include additional non-renewable resources, then compared that with the RPS scenario in which renewable energy was added to comply with the RPS. Great River Energy found that its wind energy purchases increased retail customer bills by about 1.6%, or about $18/year for an average homeowner.

8
This report is available at no cost from the National Renewable Energy Laboratory (NREL) at www.nrel.gov/publications.
• In Colorado, statute requires that utilities estimate the incremental cost of the RPS through modeling work. Utilities must use scenario analysis, comparing the costs and benefits of the renewable energy standard plan to a plan that replaces the new renewable resources with new non-renewable resources reasonably available.
• In Minnesota, Xcel Energy used wholesale market prices to determine historic RPS costs, but used a long-term resource planning tool, Strategist, to estimate future costs. The model calculates the present value of revenue requirements for different expansion plans. Xcel developed two base models, one that met the RPS, and one that replaced all incremental wind resources with conventional resources. Three additional scenarios explored the impact of extending the PTC though 2020, placing a price on carbon dioxide emissions, and a high natural gas price scenario. There was minimal difference between the cases; the base case without the RPS resulted in 1.4% higher net present cost than the RPS case. The PTC extension, CO2 price, and high gas price cases resulted in 0.74%, 0.41%, and 0.98% higher net present costs, respectively, for the conventional resource plan than the RPS case (Xcel Energy 2011).
• In New Mexico, Public Service Company of New Mexico (PNM) calculates RPS costs for the following two years using production cost modeling. PNM models the total system costs with and without each existing and proposed renewable resources to determine the avoided fuel cost for each resource (PNM 2013a). PNM also develops a single avoided fuel cost figure, for all renewable resources, which it uses to validate the individual results and also in calculating the cost cap.
• In North Carolina, utilities use a hybrid of modeling and a proxy generator method. The incremental RPS costs are defined as those that “are in excess of the electric power supplier’s avoided costs,” where avoided costs include both energy and capacity (North Carolina G.S. 62-133.8(h)). Duke Energy uses the Commission-approved “peaker method” to determine its avoided costs. The peaker method calculates avoided costs based upon the capacity cost of a combustion turbine peaking unit plus the marginal running costs of the system, which are calculated based on simulation of Duke’s system with and without the RPS resources (Duke Energy 2010).
• In Michigan, utilities use a hybrid method when seeking to recover the RPS costs. Incremental RPS costs are specified as the difference between the gross renewable energy costs and the “transfer price”. The transfer price is determined by each utility and must reflect long-term capacity and energy, but does not need to be equivalent to the cost of a new coal-fired facility, determined by the PUC (DTE 2009). In practice, Consumers Energy has calculated the transfer price based on capacity values for a gas-fired combustion facility and energy values calculated using a dispatch model (Consumers 2009). DTE has used the annual average locational marginal prices and adjusted capacity payments, by technology, compared to a new gas-fired combustion turbine (DTE 2009).
9
This report is available at no cost from the National Renewable Energy Laboratory (NREL) at www.nrel.gov/publications.
2.1.4 Additional Considerations for Estimating Incremental RPS Costs in Regulated States
2.1.4.1 Timeframe of Cost Calculation When evaluating incremental RPS costs, regardless of method, a key consideration is the timeframe to examine.
In most cases, cost calculations are made over a longer time period and then annualized to one year.6 This recognizes that procurement to meet the RPS may be “lumpy” in nature, and that the relative cost of renewable energy to conventional alternatives will depend on future conditions, e.g., natural gas prices and environmental regulations. In states where utilities are offering an upfront solar rebate to procure supply to meet a solar carve-out, spending may be particularly front-loaded because the rebate is paying upfront for a long-term resource: for example, the utility may offer an upfront rebate per watt in exchange for the RECs produced by the system over 20 years.
For studies using the proxy generator approach, decisions will have to be made about the time over which the conventional and renewable generator costs are levelized. In Michigan, the PUC compares the costs of renewables against the 40-year life cycle cost of a coal plant. The life cycle approach and the 40-year lifetime introduce additional uncertainty into the cost of the coal plant, including uncertainty around potential future federal regulation of coal plants. For example, actual future fuel prices can differ significantly from forecasts. In addition, the costs of renewables are typically recouped over a shorter time period (15-20 years), meaning that the cost comparisons are not done over the same time period.
When examining market prices, studies consider whether to use historical market prices compared to RPS generation in each year, or to use projections of future market prices compared to the RPS resource lifetime.
On the modeling side, Missouri examines RPS compliance costs over 10 years, and then divides those costs into annual increments; if the one-year annual rate increase exceeds 1%, then the utility’s RPS obligation is decreased so that rates do not exceed 1%. In order to calculate the costs over the 10-year period, the utilities estimate their cost of compliance for each year based on an RPS-case and a no-RPS case (MO CSR 240-20.100(5)).
California is in the process of developing a cost cap for its 33% RPS. As part of the process, the CPUC staff proposed using a 10-year rolling calculation. In response to the CPUC staff proposal, some parties argued that the timeframe should be longer (e.g., 20 years), in order to match the typical length of renewable energy contracts. Others argued that the cost cap should look only at procurement in an individual year.
2.1.4.2 Inclusion of a Carbon Adder Whether using a proxy generator, wholesale market prices, or modeling tools, a carbon price could be added to the comparison scenario given that some states or utilities may have a 6 One notable exception is in New Mexico, where rules specify that cost cap calculations shall not include annualization.

10
This report is available at no cost from the National Renewable Energy Laboratory (NREL) at www.nrel.gov/publications.
preference for procuring low-carbon resources. That is, even if there were no RPS, state regulators or utilities may have wanted to incorporate a cost of carbon when making decisions about procurement (potentially in anticipation of potential future carbon regulations). However, some argue that in markets where there is currently no carbon policy, and thus utilities are not paying a cost for carbon, adding it to the non-renewable resource cost is inappropriate.
The Colorado PUC initially required that the non-RPS scenario include a carbon adder and a capacity credit. Adding these costs to the counterfactual scenario can be contentious, as there is no existing capacity market in Colorado, nor is there a state-wide price on carbon (Stockmayer et al. 2012). In its latest RPS compliance plan, Xcel Energy (Colorado) did not include a carbon price for 2014 calculations (PSCo 2013).
California’s latest MPR calculation was done in 2011, before the state’s carbon cap and trade program went into effect. The CPUC determined that the market-based forward natural gas and electricity prices should be used to calculate the implied GHG price. This methodology resulted in GHG compliance costs of $16.27/CO2 metric tonne in 2013, increasing to $36.64/CO2 metric tonne in 2020 (CPUC 2011).
2.1.4.3 Inclusion of Renewable Resources Not Driven by RPS In some cases, renewable resources that are counted towards a particular state’s RPS target may have been procured independently from the RPS. The most prevalent example would be pre-existing renewable resources that were constructed or contracted prior to the RPS. Because some states allow renewable resources that were in place at the time the RPS was passed to count toward RPS compliance, a key consideration is whether the costs of those resources are included in RPS cost estimates. Because those resources would have been developed regardless of an RPS, including the costs in an incremental cost calculation would result in overestimating RPS compliance costs. In other states, pre-existing resources are not eligible to meet the RPS, so this question is not an issue.
• In Colorado, the state’s largest IOU, Xcel Energy, recovers incremental costs through a surcharge on customer bills known as the RESA surcharge. The surcharge only covers the above market costs of new renewables and contracts signed after July 2, 2006 (the date of the commission order approving the RESA) (PSCO 2013c). Renewable resources that were online on or after January 1, 2004 are eligible to meet the RPS.
• In Kansas, some of the renewable projects were built prior to implementation of the RPS, but the costs are still being included in the cost calculation. For example, Kansas Electric Power Cooperative (KEPCo) is using exclusively hydropower that it has been purchasing since the 1980s in order to meet the RPS. The utility determined that the hydropower had no cost impact to ratepayers because it is the least expensive generation source (KEPCo 2013).
• In Oregon, Portland General Electric (PGE) determines an incremental cost for only one renewable resource, Bigelow Canyon. PGE owns and operates Bigelow Canyon, so it used its actual capital costs, O&M costs, capacity factor, as well as wind integration costs that were calculated as part of the IRP process to calculate the levelized cost of the wind farm, which is then compared to the life cycle costs of a combined cycle natural gas plant (PGE 2011). The rest of PGE’s renewable resources have been determined to have zero incremental cost. Oregon’s regulations specify that “incremental costs are deemed to be zero for qualifying

11
This report is available at no cost from the National Renewable Energy Laboratory (NREL) at www.nrel.gov/publications.
electricity from generating facilities or contracts that became operational before June 6, 2007 and for certified low-impact hydroelectric facilities under ORS 469A.025(5)” (OAR 860-083-0100(1)(i)).
• Ameren Missouri, which owns a hydro facility that is eligible to meet Missouri’s RPS, values the RECs generated by that facility at zero cost. Ameren Missouri notes that the capital and operational expenses for the facility are already included in existing rates, therefore, there are no additional costs to use the generated RECs for RPS compliance (Ameren Missouri 2013a).
Another example of renewable resources that may be procured independently from an RPS are upgrades to hydroelectric facilities, which are often treated as an eligible RPS resource. This issue has arisen in Washington, where some utilities have included the cost for efficiency upgrades at hydropower facilities. Hydropower upgrades are eligible to meet the RPS, but the upgrades were required by the Federal Energy Regulatory Commission; therefore, the upgrades would have occurred even if there were no RPS in Washington. In Washington, PacifiCorp has not included hydropower upgrades in its incremental RPS cost calculation, while Avista has included the cost of hydropower upgrades (Pacific Power 2013a; Avista 2013).
2.2 Approaches for Estimating Incremental RPS Costs in States with Restructured Electricity Markets
In restructured markets, as electricity rates are not regulated, obligated entities typically do not disclose the cost to meet RPS.7 In some restructured markets, however, information on the cost of RECs is required to be provided and these costs, along with the costs of ACPs, can be used to estimate incremental RPS costs. RECs can be purchased separately from electricity, and in such cases, it is commonly assumed that the RECs represent the incremental RPS costs, as the RECs would not have been purchased absent an RPS.8 There are, however, a variety of limitations with this approach, most notably, REC price volatility, limited REC price transparency (especially for medium- and long-term REC price contracts), and the fact that REC prices and ACPs ignore a number of potentially important costs and benefits from renewable energy.
REC prices do not necessarily reflect the underlying cost of renewable electricity generation, because they are influenced by supply and demand in the marketplace. There is substantial variability in REC prices from year to year depending on how states are meeting their RPS targets. In oversupply situations, REC prices can fall dramatically while in shortages they can rise to the level of the ACP. Therefore, cost calculations based on REC pricing can vary considerably from year to year. In the next section, we examine costs over a three-year period to try to capture this variability.
In addition, there is a lack of transparency in REC prices. Many load-serving entities enter into multi-year contracts for RECs–usually not more than three years–to meet RPS requirements. Little publically available data are available on these contracts. Spot market transaction data are available from some brokers, and can be used as a proxy, but these prices can differ from the
7 REC prices paid by utilities in regulated states are also often deemed confidential by the PUCs and therefore they are not made public. 8 For additional information on RECs, see Heeter and Bird (2011).

12
This report is available at no cost from the National Renewable Energy Laboratory (NREL) at www.nrel.gov/publications.
longer-term bilateral transactions. The source of data and assumptions about REC prices can substantially influence the cost calculation.9
In Illinois, Maine, Maryland, New Jersey, Ohio, Pennsylvania, and Washington, D.C., data on REC pricing and use of ACPs as purchased and employed by compliance entities are publically available (Table 2).10 Publically available data sources for these states provide information on the cost of the RECs retired, including those RECs that were procured under long-term contracts, which may be procured at a higher or lower price than is seen in the current spot market.
However, in New Jersey, only data on solar RECs are comprehensive, because the Board of Public Utilities (BPU) set up a system for collecting data on the price of solar RECs as of the last transaction before a REC is used for compliance. However, for Class I RECs11, the same data are not collected on every transaction. As a result, in order to estimate costs, the New Jersey Office of Clean Energy relies on REC pricing information from other sources (e.g., brokers) (NJ BPU 2011).
In Delaware, Massachusetts, New Hampshire, Rhode Island, and Texas, no such publically available source on the REC prices paid by compliance entities is available. In these states, available spot market REC pricing from REC brokers can be used to approximate the cost of RPS compliance. Broker prices may represent a small volume of transactions, however, and it is uncertain how indicative they are of the average price of all RECs used for compliance by obligated entities.
9 One example of REC price approximation comes from by New Mexico, a traditionally regulated state. Southwestern Public Service Company (SPS) used a proxy REC price to determine RPS costs associated with two bundled PPAs for wind generation. To determine a proxy REC price, SPS examined REC prices in the national, western U.S., and Texas REC markets ($0.89/MWh, $2.31/MWh, and $1/40/MWh, respectively). The proxy REC price agreed upon was $1.35/MWh, slightly less than the average of the three markets, recognizing that REC prices are decreasing and that SPS has been unable to sell existing RECs into the western U.S. REC market (NM PRC 2011). 10 REC pricing data from Maryland have been provided upon request to the PUC. Data from other states may also be available by request. 11 Class I RECs are for the primary RPS target.

13
This report is available at no cost from the National Renewable Energy Laboratory (NREL) at www.nrel.gov/publications.
Table 2. Publically Available Information on REC Pricing
State Type of Pricing Available
Frequency Data Source
Illinois Average price by product type, for each Illinois Power Agency RFP
Following approval of annual Illinois Power Agency RFP bid awards
Illinois Corporation Commission notices of RFP results
Maine Weighted average REC price and range
Annually Maine PUC reportsa
Maryland Weighted average REC price
Annually Suppliers provide data to PUC, not published
New Jersey Weighted average SREC price
Monthly Website, New Jersey Clean Energy Programb
Ohio Weighted average REC price
Annually Ohio PUC reports
Pennsylvania Weighted average REC price and REC price range
Annually Pennsylvania PUC website and reportsc
Washington, D.C.
Average REC price by resource type
Annually District PSC reportsd
a “Reports to the Legislature.” (2013). Maine Public Utilities Commission. Accessed February 2014: http://www.maine.gov/mpuc/legislative/reports.shtml. b “SREC Pricing.” (2013). New Jersey Clean Energy Program. Accessed January 2014: http://www.njcleanenergy.com/renewable-energy/project-activity-reports/srec-pricing/srec-pricing. c “Pricing.” Pennsylvania AEPS Alternative Energy Credit Program. Accessed December 2013: http://paaeps.com/credit/pricing.do. d “PSC Reports to the DC Council.” (2013). Public Service Commission of the District of Columbia. Accessed December 2013: http://www.dcpsc.org/reports/dc_council.asp. Note: Weighted average REC prices take into account the volume of RECs purchased at different prices. Washington, D.C. does not publish weighted average REC prices but does publish the average REC price by resource type. Additional REC pricing information is provided by several SREC brokers as well as PJM-GATS, the REC tracking system for the mid-Atlantic, though each source has limitations. SREC brokers provide only information on spot market transactions.12 PJM-GATS reports solar-weighted average prices for transactions in the PJM market that include pricing from long- or mid-term contracts as well as spot prices. PJM-GATS reports prices on a monthly basis based on when the SREC was issued, traded, or retired, not on when the generation occurred.13 As a result of this type of reporting and the decline in spot SREC prices, the SREC prices reported in PJM-GATS have been higher than spot market SREC prices.
One final limitation associated with relying on REC and ACP costs to estimate RPS compliance costs is that a number of potentially important costs and benefits may be omitted. For example, the approach may ignore certain integration costs associated with variable RPS resources and may not fully capture transmission capacity expansion costs. This approach, however, also ignores any cost savings that LSEs may receive as a result of the reduction in market clearing
12 For example, see www.srectrade.com or www.flettexchange.com. 13 For example, if a company contracted for SRECs that were generated in January 2010 at a given price but did not retire those SRECs until August of 2011, the January 2010 price would be reflected in PJM-GATS’s August 2011 solar weighted average price report.

14
This report is available at no cost from the National Renewable Energy Laboratory (NREL) at www.nrel.gov/publications.
prices in regional energy markets, associated with low marginal-cost renewable resources. These issues are addressed in more detail in Section 2.4.
2.2.1 Treatment of ACPs Utility ACPs are a component of RPS compliance costs. Although ACPs will always – at least initially – be a cost to the utility or supplier, whether these costs may be passed through to ratepayers varies by jurisdiction (Table 3). In some states, utilities are explicitly not allowed to receive cost recovery for ACPs. In other states, cost recovery is possible, but not guaranteed. Finally, some states allow for automatic cost recovery (though, even in these cases, retail prices charged by competitive suppliers are established through market dynamics, and so pass-through of ACPs is generally not directly observable). In some states, the funds raised by ACPs collected are used to support renewable energy project development in the state, which may further reduce overall cost impacts. While the treatment of ACPs is not important in determining the cost that the supplier will initially pay to meet the RPS, it does impact the ability of compliance entities to pass on those costs, and therefore also impacts the ultimate costs that ratepayers pay for RPS compliance.
In Ohio, Pennsylvania, and Texas, utilities are not allowed to pass through ACPs to ratepayers. In Connecticut, the ACPs are used to offset other ratepayer costs, and in New Jersey, solar ACPs are refunded to ratepayers. In Delaware, Maryland, Oregon, New Hampshire, and Washington, D.C., ACP cost recovery is possible, but not guaranteed. Finally, in Illinois, Massachusetts, Maine, New Jersey (non-solar), and Rhode Island, ACP cost recovery is automatic.
Table 3. ACP Cost Recovery Provisions
ACP cost recovery provision States Utilities not allowed to pass through ACPs to ratepayers
OH, PA, TX
ACPs used to offset other ratepayer costs or refunded to ratepayers
CT, NJ (solar)*
ACP cost recovery is possible DE, MD, OR, DC, NH ACP cost recovery is automatic IL, MA, ME, NJ (non-solar), RI
* In New Jersey, the Solar Advancement Act of 2010 required that solar ACPs be returned to ratepayers.
2.3 Gross RPS Compliance Costs Three states (Kansas, Nevada, and California) examine gross, rather than incremental, RPS costs. Gross costs are the total costs of renewable energy procurement, as opposed to incremental costs that reflect the difference between these total costs and conventional generation. There are some advantages to examining gross costs–namely, that no modeling work needs to be done, nor does a proxy conventional generator need to be assigned. While gross costs do not allow for comparison against what would have happened absent the RPS, they can help regulators understand trends in renewable pricing, and they may be used as part of a cost cap calculation. Gross compliance costs could also be used as part of a complete cost-benefit assessment, where in avoided costs would be treated as a benefit.
The Kansas Corporation Commission (KCC) develops gross costs as part of rate impact calculations. The KCC developed regulations that require each obligated utility to submit compliance reports that detail the retail revenue requirement of renewable generation used to

15
This report is available at no cost from the National Renewable Energy Laboratory (NREL) at www.nrel.gov/publications.
meet the RPS.14 Using this information as well as volumetric sales data, the KCC calculated the rate impact on a statewide basis, thus holding confidential individual utility revenue information.
In Nevada, Nevada Power and Sierra Pacific report estimated gross RPS compliance costs for approval by the Nevada PUC. Costs include the cost of purchased power and RECs, general and administrative expenses, O&M for company-owned renewable generation, as well as costs of renewable incentive programs and energy efficiency programs. Energy efficiency can be used to meet up to 25% of the RPS target through 2014, and then this provision phases out so that by 2025, energy efficiency cannot meet any part of the RPS target.
The California PUC is in the process of developing a method for calculating and implementing a cost containment mechanism, as required by SB 2(1X), signed in 2011. The new method will replace the MPR methodology that was calculated on an annual basis by PUC staff. The California PUC staff proposal outlines a process that would calculate a procurement expenditure limit based on an IOU’s RPS gross procurement expenditures divided by the IOU’s total revenue requirement on a rolling 10-year basis (CPUC 2013b).
2.4 Including Other Expenses in RPS Cost Calculations In some cases, factors that affect the economic value or costs of renewable resources may not be reflected in REC prices or in the costs that utilities and states include when estimating the incremental cost of RPS resources. Although typically RPS cost assessments look exclusively at the cost of renewable generation or RECs, some assessments also include information about non-renewable generation that is eligible for the RPS (e.g., energy efficiency) or indirect and/or administrative expenses.
2.4.1 Integration Costs and Network Transmission Costs Two costs in particular – integration costs and network transmission costs – are often not allocated to the renewable generator and are instead borne by other users or by the power system. Thus, although these costs are not typically included in RPS incremental cost estimates, this section provides information on other estimates of integration and network transmission costs.
In the U.S. numerous studies estimate integration costs for wind to be less than $5/MWh even with very high wind penetration levels (>20% penetration on an energy basis), though some smaller individual utilities estimate costs up to $12/MWh, and one utility (Idaho Power) estimated cost over $18/MWh (Wiser and Bolinger 2013).
Aside from forward looking studies, two other indicators of integration costs are actual integration tariffs charged to wind generators in particular balancing areas (which may already be reflected in REC prices for those wind generators) and backward looking assessments of integration costs by system operators with significant amounts of wind. Retrospective analysis of actual wind balancing reserves and integration costs in ERCOT (with 8.5% wind penetration on an energy basis) resulted in wind integration costs on the order of $1.2/MWh (Maggio 2012). Actual wind integration charges by several different entities in the U.S. (Bonneville Power
14 The retail revenue requirement is defined as: (Rate base * Rate of return) + O&M + Administrative & General Expenses + Depreciation + Taxes.

16
This report is available at no cost from the National Renewable Energy Laboratory (NREL) at www.nrel.gov/publications.
Administration, Westar Energy, Puget Sound Energy, and the Nebraska Public Power District) range from $0.70 to $6.85/MWh (Wiser and Bolinger 2013).
Network transmission upgrades (as opposed to dedicated grid-tied assets) are used by multiple resources on the grid and often have many beneficiaries. Challenges in quantifying benefits for specific beneficiaries of long-lived transmission assets has led to network transmission costs often being allocated to loads rather than particular generators. In these cases, the cost of renewable resources will not reflect the cost of network transmission investments needed to deliver power to leads. One assessment of the costs of transmission for wind implied by various planning studies in the U.S. found a median transmission cost of $15/MWh (Mills et al. 2012).
California’s Section 910 Report acknowledges that for indirect costs, “it does not appear that the utilities use a consistent methodology to track these expenditures, that these costs are tracked in a manner that allows clear attribution to the RPS program, or that it is always possible to determine what portion of the costs should be attributed to the RPS program” (e.g., transmission costs) (CPUC 2013a, p. 5).
In Minnesota, however, utilities are required to estimate the rate impact of the RPS, including energy purchases, generation facility acquisition and construction, and transmission improvements (Minn. Stat. Section 216B.1691 Subd. 2e.). Xcel Energy (MN) recognized that new transmission lines have multiple benefits, making it difficult to allocate costs; as such, they only provide a “rough estimate” of transmission costs associated with the RPS (Xcel Energy 2011, p. 10).
The New Mexico Public Regulation Commission (PRC) ruled in November 2013—after years of discussion about how to calculate costs pursuant to the state’s cost cap—that cost calculations can include O&M, back-up and load following generation, off-system sales opportunity impacts, or other facilities and improvements or functions that may be required (NM PRC 2013a). In January 2014, however, the PRC agreed to re-hear the case, as requested by the New Mexico Independent Power Producers (NMIPP). NMIPP argues that the new cost methodology includes “expansive new costs of renewable energy while narrowing the benefits of renewable energy (NMIPP 2013, p. 10-11)” and does not reflect the intent of the states’ RPS policy or the comments submitted in the case.
2.4.2 Inclusion of Administrative Expenses Another methodological consideration is whether to include other indirect costs, such as administrative expenditures. Administrative expenses may also be easy to track on a gross basis, but difficult to determine on an incremental basis, as it is likely unknown what the administrative expenses would have been to procure non-RPS resources.
Although most states have not addressed administrative expenses, in Nevada, utilities include administrative expenses in their gross cost calculations and in Colorado, administrative expenses are limited by statute to 10% of total annual RPS revenue collection. However, Colorado utilities can request a waiver during the ramp-up stage of the RPS program. This presumably acknowledges that administrative expenses may be higher in initial years due to start-up costs.

17
This report is available at no cost from the National Renewable Energy Laboratory (NREL) at www.nrel.gov/publications.
2.4.3 Treatment of Energy Efficiency Eligible to Meet RPS Seven state RPS policies (Michigan, Ohio, Pennsylvania, Connecticut, Hawaii, Nevada, and North Carolina) include energy efficiency as an eligible resource (though energy efficiency is being phased out as an eligible resource in Nevada). These policies cap the amount of energy efficiency that can be used and to the extent that data are available, energy efficiency is generally being used to the maximum amount allowed (Heeter and Bird 2013).
Little cost data on energy efficiency being used to meet RPS policies are available. However, Michigan looks at the weighted average cost of energy efficiency and incorporates that figure into the cost of RPS compliance. The weighted average cost of energy efficiency was $20/MWh, compared to the weighted average cost of renewable energy at $83/MWh. Together, the combined weighted average cost of energy efficiency and renewable energy was $46/MWh.
In Connecticut, the state uses a separate tier for energy efficiency. Compliance is achieved through the use of credits, and some price information is available for those credits from brokers.
Pennsylvania publishes data on an annual basis for its Tier II RPS, for which energy efficiency is eligible, but appears to not be making a major contribution. Of over 9,000 registered facilities, there are only a dozen energy efficiency or demand side management (DSM) facilities. In addition, in 2012, there were no EE or DSM credits retired to meet the RPS.
2.5 Summary of Methodological Considerations In order to assess the impact of RPS policies, incremental cost estimates are preferable, rather than estimates of gross costs. While gross compliance costs can help understand trends in renewable pricing, if not netted out from benefits, they can overestimate the actual policy costs since other energy sources would have been used to meet loads absent the RPS. The use of renewable sources could displace some need for fossil fuels use in existing generators, and, in many cases, could displace the need for other fossil-fuel-based generation capacity.
At the same time, calculating incremental costs can be challenging; given the number of ways in which incremental cost calculation methodologies can differ, several state PUCs have begun discussions about how to standardize RPS cost calculations. These standardization efforts are underway or recently concluded in California, Delaware, Minnesota, Oregon, and Washington (see Text Box 2 for more detail).

18
This report is available at no cost from the National Renewable Energy Laboratory (NREL) at www.nrel.gov/publications.
Currently, incremental RPS costs are being examined in traditionally regulated states by comparing RPS costs to a proxy generator, to market electricity prices, or through modeling approaches. Each of these three methodologies has advantages and disadvantages:
• Using a proxy generator may be a simpler approach but may not represent what actually would have happened absent an RPS as well as using wholesale market prices or a modeling approach. The proxy generator may not be the type of resource that is always displaced, because the renewable resources may displace different types of resources over the course of the day. In Minnesota, Minnesota Power submitted comments to the PUC suggesting that
Text Box 2. State PUC Cost Standardization Efforts
In California, the PUC is developing a methodology to calculate spending limits to meet the state’s 33% RPS requirement. The PUC has issued a staff proposal on the methodology; stakeholders have developed alternative proposals and comments on all proposals are due in March 2014 (CPUC 2014).
Rulemaking is underway in Delaware to clarify the state’s RPS cost cap provision. Draft regulations specify that the Division of Energy & Climate will determine the cost of compliance, which will then be review by the Director. The Division Director shall then determine the whether to freeze RPS requirements. As part of that determination, draft regulations specify that the Director may consider benefits such as price suppression, savings in health and mortality costs, and economic development benefits from renewable energy deployment in the state. (DE DNREC 2013)
The Minnesota PUC is developing a uniform reporting system for RPS rate impact data. The PUC is currently accepting comments on general guiding principles for cost impacts as well as on a uniform reporting system. The general guiding principles proposed by the PUC staff include: Foster transparency; support consistency, coordination and non-burdensome administration; provide realistic representation of baseline, actual (to date) and future expected costs; and enable comparison across utilities. (MN PUC 2013).
In Oregon, a methodology for calculating incremental RPS costs was developed but it was noted that the assumptions would be modified as utilities gained more experience with the incremental cost calculation. The PUC held workshops in 2012 and 2013 to discuss such issues; the PUC approved a stakeholder agreement in January 2014. The agreement continues use of a CCCT as a proxy generator. The parties did not agree on whether a capacity payment should be included, but they did agree that utilities should consider incorporating a capacity value. Utilities will also provide an additional scenario that assumes reduction in long-term fuel price risk. (PUC OR 2014)
Rulemaking is underway in Washington, where the PUC has an open rulemaking to address modifications to the RPS (UE-131723). Some stakeholders have expressed interest in creating a uniform approach to calculating incremental costs of RPS.

19
This report is available at no cost from the National Renewable Energy Laboratory (NREL) at www.nrel.gov/publications.
using a combined cycle proxy unit could understate the costs of the RPS because natural gas is not the marginal unit in both on- and off-peak time periods.15
• Comparing to a wholesale market price requires determining a number of variables, including whether wholesale market generation is shaped to match the output of renewable energy. In Washington State, utilities have taken different approaches towards shaping the wholesale market generation, and the Washington UTC is examining cost standardization.
• Modeling approaches can more fully explore alternative options beyond using a single proxy generator and can assess capacity savings. However, stakeholders may disagree on the appropriate modeling inputs, for example, whether to include carbon or other adders in the non-RPS scenario. If a carbon price is added to the cost of non-renewable generation, then the resulting incremental cost will be lower than if a carbon price is not added.
Within each primary methodology (proxy generator, market price, or modeling), a number of key considerations can influence the magnitude of the resulting incremental cost:
• Including pre-RPS renewables. Including pre-RPS renewables in the cost calculation will overestimate the cost of meeting the RPS, since the pre-RPS renewables would have been developed regardless of the RPS policy.
• Indirect expenditures. Indirect expenditures, such as integration costs, transmission or distribution expenditures, or administrative expenditures, can be challenging to quantify, as they may be related to both renewable and non-renewable energy; if including indirect expenditures in an incremental RPS cost calculation, the indirect expenditures should also be incremental. If the RPS were not implemented, there would likely be expenses associated with procuring non-renewable generation.
• Plant lifetime. Assumptions about the operating life of a non-renewable plant can introduce uncertainty about future fuel costs. For example, fuel costs for a coal or natural gas plant become more uncertain when a longer plant life is assumed. For renewable resources, the assumed lifetime can also impact the levelized cost of the generation.
• Annualizing costs. Annualizing costs can account for the “lumpiness” of renewable energy procurement, but may obscure annual ratepayer impact. If a utility is making large investments on a non-annual timeframe, it may see higher costs in some years than others. For example, if a utility is operating a solar rebate program, it may provide upfront financial incentives in exchange for the RECs produced by the solar system over its lifetime.
• Including energy efficiency. Including energy efficiency in an incremental RPS cost calculation provides an assessment of total policy costs, where standards are combined, but could complicate the ability to assess the renewable energy costs. However, most states have moved to separate standards or tiers for renewable energy and energy efficiency, which eliminates competition between the two resource types (Heeter and Bird 2013).
In restructured markets, incremental RPS costs are typically calculated using REC prices. This reflects the cost that load serving entities must pay to achieve compliance, but may not reflect the
15 The Minnesota PUC is currently considering accepting comments on the utility cost impact reports required by statute (Docket E999/CI-11-852).

20
This report is available at no cost from the National Renewable Energy Laboratory (NREL) at www.nrel.gov/publications.
cost of developing renewable generation in the region. In addition to some of the considerations listed above, using a REC price approach can be limited because REC prices may fluctuate dramatically based on supply and demand considerations, which can substantially differ from the levelized cost of the renewable energy developed. The treatment of ACPs will also influence how closely the costs incurred by the compliance entity track the costs passed on to ratepayers. Another consideration is the source of the data on REC prices. PUCs collecting data on the price of RECs retired to meet the RPS will have a more precise representation of the RPS costs, compared to using prices from a broker.
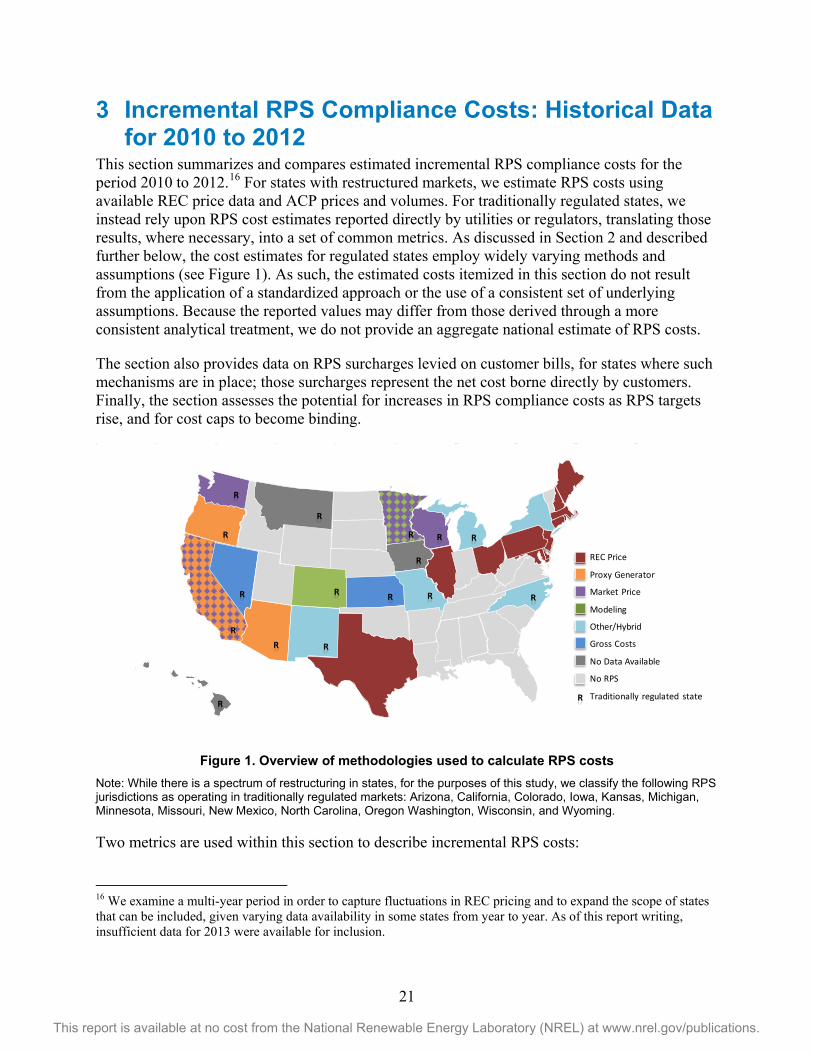
21
This report is available at no cost from the National Renewable Energy Laboratory (NREL) at www.nrel.gov/publications.
3 Incremental RPS Compliance Costs: Historical Data for 2010 to 2012
This section summarizes and compares estimated incremental RPS compliance costs for the period 2010 to 2012.16 For states with restructured markets, we estimate RPS costs using available REC price data and ACP prices and volumes. For traditionally regulated states, we instead rely upon RPS cost estimates reported directly by utilities or regulators, translating those results, where necessary, into a set of common metrics. As discussed in Section 2 and described further below, the cost estimates for regulated states employ widely varying methods and assumptions (see Figure 1). As such, the estimated costs itemized in this section do not result from the application of a standardized approach or the use of a consistent set of underlying assumptions. Because the reported values may differ from those derived through a more consistent analytical treatment, we do not provide an aggregate national estimate of RPS costs.
The section also provides data on RPS surcharges levied on customer bills, for states where such mechanisms are in place; those surcharges represent the net cost borne directly by customers. Finally, the section assesses the potential for increases in RPS compliance costs as RPS targets rise, and for cost caps to become binding.
Figure 1. Overview of methodologies used to calculate RPS costs Note: While there is a spectrum of restructuring in states, for the purposes of this study, we classify the following RPS jurisdictions as operating in traditionally regulated markets: Arizona, California, Colorado, Iowa, Kansas, Michigan, Minnesota, Missouri, New Mexico, North Carolina, Oregon Washington, Wisconsin, and Wyoming. Two metrics are used within this section to describe incremental RPS costs:
16 We examine a multi-year period in order to capture fluctuations in REC pricing and to expand the scope of states that can be included, given varying data availability in some states from year to year. As of this report writing, insufficient data for 2013 were available for inclusion.
REC Price
Proxy Generator
Market Price
Modeling
Other/Hybrid
Gross Costs
No Data Available
No RPS
Traditionally regulated state
RR
R
R
R
R
R
R R R
R
R R R
R
R
R

22
This report is available at no cost from the National Renewable Energy Laboratory (NREL) at www.nrel.gov/publications.
• Dollars-per-MWh ($/MWh) of renewable energy required or procured. This metric represents the average incremental cost of RPS resources relative to conventional generation. It answers the question: On average, how much more was paid for renewable energy than for an equivalent amount of conventional generation?
• Percentage of average retail electricity rates. This metric represents the dollar magnitude of incremental RPS costs relative to the total cost of retail electricity service (generation, transmission, and distribution). It answers the question: How significant are RPS costs compared to the overall cost of retail electricity service, and what impact might that have on electricity prices faced by consumers?
Several general caveats about the estimated incremental cost data must be stated up front. First, comparisons across states are highly imperfect, given the widely varying methods and assumptions employed to estimate incremental costs. This is particularly true among regulated states where we rely upon estimates produced by utilities and regulators. To the extent possible, we highlight instances where these methodological differences may be a particularly significant driver for the results observed, though ultimately the available information does not allow for a rigorous analysis of this issue. Second, the incremental cost data represent the estimated net cost of RPS compliance to utilities (or to LSEs, more generally). Accordingly, they do not represent net costs to society at large, which would require a broader set of considerations (some of which are discussed in Section 4). Utility compliance costs also should not be equated to ratepayer costs, as the two may diverge for a variety of reasons.17 Third, the incremental cost estimates presented here may omit both certain costs and benefits borne by utilities. Elsewhere within the report, we discuss the potential magnitude of perhaps the most significant of these omitted items: on the cost-side, integration and network transmission costs (see Section 2) and among the benefits, wholesale electricity market price suppression (see Section 4).
3.1 States with Restructured Markets In restructured markets with competitive retail markets, RPS compliance obligations are generally placed on LSEs, and compliance is achieved through the purchase and retirement of RECs. Retail suppliers in these markets typically do not have long-term certainty regarding their load obligations, and therefore typically purchase RECs through short-term transactions (e.g., spot market purchases or two- to three-year “strips”) for unbundled RECs. In recent years, longer-term (i.e., 10- to 20-year) contracting for bundled or unbundled RECs has become more prevalent, particularly among default service suppliers and as the result of requirements or programs established to facilitate financing for renewable project developers. 18
Many RPS policies divide the overall RPS target into multiple resource tiers or classes, each with an associated percentage target. These typically consist of some combination of a “main tier” for those resources deemed to be most preferred or most in need of support (e.g., new wind, solar, 17 For example, ACPs and financial penalties are costs to the utility but are not always allowed to be recovered from ratepayers, or are often used to fund customer rebate programs. More generally, in regulated markets, the timing and extent to which RPS costs are passed through to ratepayers is subject to the ratemaking process within each state, while in competitive markets, the degree to which RPS compliance costs are passed through to retail electricity prices depends upon the competitive dynamics of the market. 18 Default service, sometimes also called Provider of Last Resort service, is the retail supply option for customers that do not choose a competitive retail supplier, and is often provided by the regulated distribution service company.

23
This report is available at no cost from the National Renewable Energy Laboratory (NREL) at www.nrel.gov/publications.
geothermal, biomass, small hydro); one or more “secondary tiers” (e.g., existing renewables that pre-date the RPS, large hydro, municipal solid waste); and a solar or distributed generation (DG) set-aside. Most states with restructured markets include an ACP mechanism whereby an LSE may alternatively meet its obligations through issuing a payment to the program administrator, the dollar amount of which is determined by multiplying the LSE’s shortfall by a specified ACP price. In effect, the ACP price serves as a cap on REC prices, at least when ACPs can be recovered from ratepayers, as LSEs generally would not pay more than the ACP rate for RECs.
3.1.1 Methodology and Data Sources In general, we estimate incremental RPS compliance costs based on REC and ACP prices and volumes for each tier.19 For several states, exceptions (New York) or slight variations (Illinois and Delaware) on this approach were used.20 Again, these estimates represent the costs borne by LSEs, which may differ from the costs ultimately borne by customers, especially in cases where ACPs are not recoverable from customers. We translate these dollar costs into $/MWh by dividing by the amount of renewable generation required, and into a percentage of average retail electricity rates based on obligated LSEs’ retail sales and average statewide retail electricity prices published by the U.S. Energy Information Administration (EIA) (EIA 2013).
The primary data sources used to compute incremental RPS costs are summarized in Table 4. For REC prices, we rely on PUC-reported data for the average price of RECs used for compliance in each year, wherever such data are available. Those prices, which are often based on data reported confidentially by individual LSEs, are presumed to reflect the cost of all RECs retired to fulfill the RPS obligation in each year, including short-term purchases of varying durations as well as RECs purchased under longer-term contracts. If PUC-reported REC price data are unavailable, we instead use the average of monthly spot market prices published by REC brokers (Marex Spectron for main tier and secondary tier RECs and a combination of sources for SRECs). Broker-reported spot market data were supplemented, when possible, with REC pricing data for any long-term contracts that may have been in effect during the 2010-2012 period. Data on long-term contract pricing for New England states was provided by Sustainable Energy Advantage (SEA) and for Delaware was obtained from Delmarva Power & Light’s Integrated Resource Plans.21 Volumes of REC retirements and ACPs are generally based on ex post data published in utility or PUC compliance reports or otherwise obtained directly from PUC staff. ACP prices are typically established by statute or regulation; main-tier and secondary-tier ACPs are generally 19 Specifically, incremental costs are calculated according to: 𝐶 = ∑ ��𝑃𝑅𝐸𝐶,𝑖 × 𝑄𝑅𝐸𝐶,𝑖� + �𝑃𝐴𝐶𝑃,𝑖 × 𝑄𝐴𝐶𝑃,𝑖��𝑛
𝑖=1 , where C is the calculated incremental compliance cost (in dollars) for a particular state in a particular CY, n is the number of resource tiers within the RPS, PREC is the average annual REC price, QREC is the number of RECs retired for RPS compliance purposes, PACP is the ACP price, and QACP is the number of ACPs issued. 20 For New York, we calculate incremental RPS costs based on reported expenditures by the New York State Energy Research and Development Agency (NYSERDA), which procures RECs on behalf of the state’s IOUs. Those expenditures consist primarily of costs to procure RECs for the main tier and the cost of incentive programs for the distributed generation set-aside, as well as administrative costs. For Illinois, compliance costs for default service load are based estimates reported directly by the Illinois Power Agency (IPA), which reflect the cost of RECs procured by IPA on behalf of default service customers. For Delaware, 2012 compliance costs for Delmarva are based on the surcharge collections, which are a direct pass-through of REC costs. 21 SEA provided data on long-term REC contract pricing based on its own internal research and analysis. For bundled contracts, SEA estimated the implied REC price premium based on a comparison of the bundled renewable PPA prices to market prices for energy and capacity.

24
This report is available at no cost from the National Renewable Energy Laboratory (NREL) at www.nrel.gov/publications.
are either fixed over time or increase with inflation, while solar ACPs often decline according to a pre-specified schedule (see Table 5 for ACP rates in effect during 2010-2012).
There are various limitations inherent in our approach to estimating incremental RPS costs for restructured markets, including the following:
• Omitted costs and savings. As noted previously, REC and ACP costs do not capture the full range of costs and benefits to the LSE. Of particular note, perhaps, are the omission of integration costs and the omission of savings from reductions to wholesale energy market clearing prices. As discussed in Section 2, wind integration cost studies have yielded a wide range of estimates, though generally less than $5/MWh up to relatively high penetration levels. Wholesale market price reductions, in comparison, have often been estimated through modeling to be on the order of $1/MWh or less (for all generation in the market). However, this price suppression benefit expressed as a fraction of renewable energy generation can be substantially larger in some cases, with estimates ranging from $2-50/MWh, as discussed further in Section 4.
• Limited REC price transparency and liquidity. Broker-published REC price indices may be a poor proxy for the average price of all RECs used for compliance. This may occur in cases where a significant portion of REC transactions are occurring through long- or medium-term contracts and/or if broker prices are based on a small volume of transactions, in which case they may not even be representative of spot market prices as a whole. We attempted to mitigate these potential issues by relying, wherever possible, upon PUC-published average REC prices and available long-term contract data. However, for some states and years, spot market index prices were the only available data source and were therefore used in isolation (specifically, for DC in 2012, New Jersey in 2012, Ohio in 2010, Pennsylvania in 2012, and Texas in 2010-2012).
• REC price volatility. Although not a limitation of the methodology, per se, REC prices–and hence RPS compliance costs–can be quite volatile, with large swings from year-to-year depending on whether the state is under- or over-supplied. This fundamental feature of many RPS markets tends to complicate and obscure cross-state comparisons and long-term temporal trends of RPS compliance costs. This volatility also underscores the importance of recognizing that REC prices in any particular year do not necessarily reflect the underlying incremental levelized cost of renewable generation.
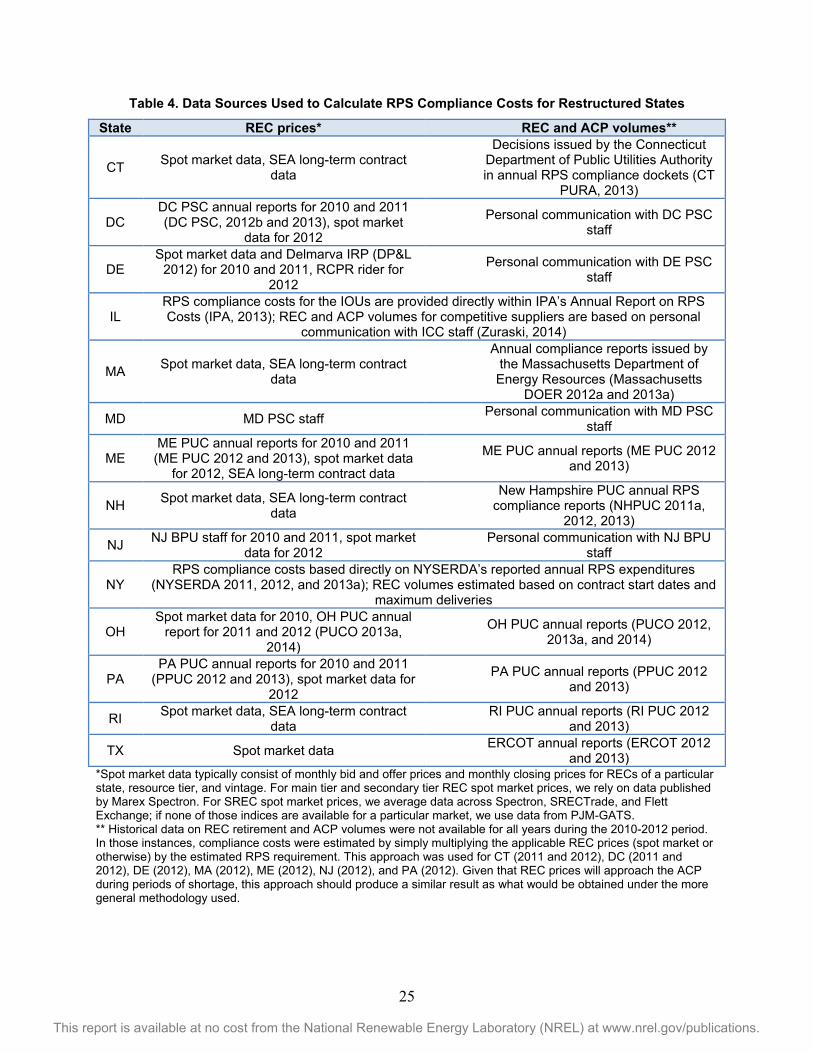
25
This report is available at no cost from the National Renewable Energy Laboratory (NREL) at www.nrel.gov/publications.
Table 4. Data Sources Used to Calculate RPS Compliance Costs for Restructured States
State REC prices* REC and ACP volumes**
CT Spot market data, SEA long-term contract data
Decisions issued by the Connecticut Department of Public Utilities Authority in annual RPS compliance dockets (CT
PURA, 2013)
DC DC PSC annual reports for 2010 and 2011 (DC PSC, 2012b and 2013), spot market
data for 2012
Personal communication with DC PSC staff
DE Spot market data and Delmarva IRP (DP&L
2012) for 2010 and 2011, RCPR rider for 2012
Personal communication with DE PSC staff
IL RPS compliance costs for the IOUs are provided directly within IPA’s Annual Report on RPS Costs (IPA, 2013); REC and ACP volumes for competitive suppliers are based on personal
communication with ICC staff (Zuraski, 2014)
MA Spot market data, SEA long-term contract data
Annual compliance reports issued by the Massachusetts Department of Energy Resources (Massachusetts
DOER 2012a and 2013a)
MD MD PSC staff Personal communication with MD PSC staff
ME ME PUC annual reports for 2010 and 2011 (ME PUC 2012 and 2013), spot market data
for 2012, SEA long-term contract data
ME PUC annual reports (ME PUC 2012 and 2013)
NH Spot market data, SEA long-term contract data
New Hampshire PUC annual RPS compliance reports (NHPUC 2011a,
2012, 2013)
NJ NJ BPU staff for 2010 and 2011, spot market data for 2012
Personal communication with NJ BPU staff
NY RPS compliance costs based directly on NYSERDA’s reported annual RPS expenditures
(NYSERDA 2011, 2012, and 2013a); REC volumes estimated based on contract start dates and maximum deliveries
OH Spot market data for 2010, OH PUC annual
report for 2011 and 2012 (PUCO 2013a, 2014)
OH PUC annual reports (PUCO 2012, 2013a, and 2014)
PA PA PUC annual reports for 2010 and 2011
(PPUC 2012 and 2013), spot market data for 2012
PA PUC annual reports (PPUC 2012 and 2013)
RI Spot market data, SEA long-term contract data
RI PUC annual reports (RI PUC 2012 and 2013)
TX Spot market data ERCOT annual reports (ERCOT 2012 and 2013)
*Spot market data typically consist of monthly bid and offer prices and monthly closing prices for RECs of a particular state, resource tier, and vintage. For main tier and secondary tier REC spot market prices, we rely on data published by Marex Spectron. For SREC spot market prices, we average data across Spectron, SRECTrade, and Flett Exchange; if none of those indices are available for a particular market, we use data from PJM-GATS. ** Historical data on REC retirement and ACP volumes were not available for all years during the 2010-2012 period. In those instances, compliance costs were estimated by simply multiplying the applicable REC prices (spot market or otherwise) by the estimated RPS requirement. This approach was used for CT (2011 and 2012), DC (2011 and 2012), DE (2012), MA (2012), ME (2012), NJ (2012), and PA (2012). Given that REC prices will approach the ACP during periods of shortage, this approach should produce a similar result as what would be obtained under the more general methodology used.

26
This report is available at no cost from the National Renewable Energy Laboratory (NREL) at www.nrel.gov/publications.
Table 5. ACP Rates: 2010-2012 ($/MWh)
State Main Tier Secondary Tier Solar/DG Set-aside CT $55 $55 n/a DC $50 $10 $500 DE $25-80 $25-80 $400-500 IL $5-14 (ComEd territory)
$4-10 (Ameren territory) n/a Same as Main Tier
MA $60.9-$64.0 $25.00-26.28 (existing RE) $10-10.5 (waste-energy)
$550-600
MD $40 $15 $400 ME $60.9-$64.0 n/a n/a NH $55-60.9 (Class I RE)
$25 (Thermal) $29.9-31.5 (Class III) $26.5-29.9 (Class IV)
$55-160
NJ $50 $50 $658-693 OH $45-$47.6 n/a $350-400 PA $45 $45 $550.2** RI $60.9-64 $60.9-64 n/a TX $50 n/a n/a
* ACP rates for IL have been translated into the typical units of $/ MWh of renewable energy, for comparison to other states. ** Fluctuates according to a formula as follows: 200% X (market value of SRECs + levelized value of solar rebates). The current value applies to 2008/2009. 3.1.2 REC Prices REC spot market prices for the 2007-2013 period are presented in Figure 2, which differentiates between REC prices for the main tier, secondary tier, and solar set-aside in each state, as applicable.22 As shown, REC spot market prices vary considerably over time, according to shifts in the balance of supply and demand (sometimes induced by revisions to RPS rules and eligibility requirements), but do not necessarily correspond well to trends in underlying renewable energy technology costs. REC prices also vary considerably across states, though main tier REC prices tend to be clustered regionally among the ISO-NE and PJM states, where inter-state REC trade is most prevalent. Solar set-aside markets, in comparison, tend to be somewhat more balkanized, as many states effectively limit eligibility to in-state systems.
Within the narrower timeframe of our historical analysis period (2010-2012), main tier REC prices in northeastern states rose from roughly $15/MWh as regional REC supplies tightened and shortfalls emerged. As of year-end 2012, main tier RECs in all New England states other than Maine were trading near their respective ACP prices ($55/MWh in Connecticut and New Hampshire and roughly $65 in Massachusetts and Rhode Island). Ohio In-State RECs followed the opposite trajectory, trading at a relatively high price of roughly $30/MWh in 2010 before dropping steadily over the course of 2011 and bottoming out below $5/MWh throughout 2012. Main tier RECs in all other states have remained in a prolonged period of oversupply and have traded below $5/MWh more or less continuously since 2010.
22 The figure also differentiates between prices for Ohio In-State and Out-of-State RECs, and between the multiple secondary tiers in Massachusetts and New Hampshire. For information on what kinds of resources are included in each state’s RPS tiers, refer to the state RPS policy summaries posted on DSIRE: http://www.dsireusa.org.

27
This report is available at no cost from the National Renewable Energy Laboratory (NREL) at www.nrel.gov/publications.
Secondary tier REC markets, which typically trade below main tier REC prices because of lower technology costs or inclusion of pre-existing resources, have also been persistently oversupplied in most states, with prices generally remaining below $1/MWh. Notable exceptions are Massachusetts and New Hampshire, where significant shortfalls have arisen and secondary tier REC prices have remained relatively high (at or near their respective ACP prices). Massachusetts has two secondary tiers: a Class II tier for existing renewables (of the same technology types as qualify for the main tier) and a Waste Energy tier for municipal solid waste. The Massachusetts Class II market has remained undersupplied, due in large part to a shortage of existing biomass units that meet the requisite emissions criteria (DOER 2012b). New Hampshire similarly has two secondary tiers: Class III for existing biomass and landfill gas and Class IV for existing small hydro. Although the state has sufficient in-state resources to meet the targets, both tiers have experienced shortfalls due to competition for those RECs with neighboring states.
SREC prices have historically been significantly higher than main tier or secondary tier REC prices due to the higher underlying technology costs for solar and correspondingly higher ACPs. Throughout 2010, for example, SREC prices for most state markets were trading in the $200-$350/MWh range (and above $600/MWh in New Jersey, which had a much higher solar ACP and higher solar targets). The lone exception is New Hampshire, where SREC prices have remained persistently low. This is partly due to the fact that the state allows participation by SRECs generated in other states, including SRECs produced in Massachusetts that are ineligible for that state’s solar set-aside and SRECs produced in other northeastern states without an RPS solar set-aside. In addition, under certain circumstances, utilities are able to claim title to SRECs produced by customer-sited PV systems in New Hampshire without any payment to the customer.
Within the past several years, however, many SREC markets have become significantly oversupplied as a result of steeply falling PV module prices and, to varying degrees, the availability of financial incentives for solar. SREC prices have correspondingly dropped, in some cases quite precipitously. As of year-end 2012, SRECs in Delaware, Maryland, New Hampshire, New Jersey, Ohio, and Pennsylvania were trading near or below $100/MWh (in some cases well below). SREC prices in Massachusetts also fell markedly over the course of 2012, though not as far as in other states, due partly to the state’s SREC clearinghouse, which serves as a partial price support mechanism.23 In addition, Massachusetts announced in 2013 that it would expand its solar set-aside targets. Only in Washington, D.C. have SREC prices followed a generally increasing trajectory over the period shown; the market has remained undersupplied due partly to its unique geographical constraints (i.e., a single urban area with limited potential for large projects), and also due to a tightening of the geographical eligibility rules in 2011.
23 Massachusetts Department of Energy Resources (DOER) administers an annual auction, with a fixed-price of $300/MWh (less a $15/MWh administrative fee), in which any unsold SRECs from the previous year can be deposited for sale. There is no guarantee that SRECs placed into the auction will be sold, and thus the auction price serves only as a “soft” price floor.

28
This report is available at no cost from the National Renewable Energy Laboratory (NREL) at www.nrel.gov/publications.
Figure 2. REC spot market prices
$0
$10
$20
$30
$40
$50
$60
$70
$80
Jan-
07
Jul-0
7
Jan-
08
Jul-0
8
Jan-
09
Jul-0
9
Jan-
10
Jul-1
0
Jan-
11
Jul-1
1
Jan-
12
Jul-1
2
Jan-
13
Jul-1
3
Jan-
14
CT DC DE IL MAMD ME NH NJ OH-InOH-Out PA RI TX
nom
inal
$/M
Wh
Main Tier
$0
$5
$10
$15
$20
$25
$30
$35
$40
Jan-
07
Jul-0
7
Jan-
08
Jul-0
8
Jan-
09
Jul-0
9
Jan-
10
Jul-1
0
Jan-
11
Jul-1
1
Jan-
12
Jul-1
2
Jan-
13
Jul-1
3
Jan-
14
CT DCDE MA-IIMA-WE MDME NH-IIINH-IV NJPA RI
nom
inal
$/M
Wh
Secondary Tier
$0
$100
$200
$300
$400
$500
$600
$700
$800
Jan-
07
Jul-0
7
Jan-
08
Jul-0
8
Jan-
09
Jul-0
9
Jan-
10
Jul-1
0
Jan-
11
Jul-1
1
Jan-
12
Jul-1
2
Jan-
13
Jul-1
3
Jan-
14
DC DEMA MDNH NJOH-In OH-OutPA
nom
inal
$/M
Wh
Solar Set-Aside
Sources: Spectron, SRECTrade, Flett Exchange, PJM-GATS, and NJ Clean Energy Program. Depending on the source used, plotted values are either the mid-point of monthly average bid and offer prices, the average monthly closing price, or the weighted average price of all RECs transacted in the month, and generally refer to SREC prices for the current or nearest future compliance year traded in each month. In Main Tier and Solar Set-Aside graphics, "OH-In" and "OH-Out" refer to OH In-State and OH Out-of-State RECs. In the Secondary Tier graphic, MA-II and MA-WE refer to MA Class II and MA Waste Energy RECs, respectively, while NH-III and NH-IV refer NH Class III and Class IV RECs.

29
This report is available at no cost from the National Renewable Energy Laboratory (NREL) at www.nrel.gov/publications.
3.1.3 Estimated incremental RPS Costs per Unit of Renewable Generation We use the spot market REC prices reported in Figure 2, in combination with the other data described in Tables 4 and 5, to estimate total incremental RPS compliance costs in each state. The results of those calculations are presented in Figure 3 in terms of $/MWh of renewable energy required. In effect, these values are an estimate of the weighted average price of all RECs retired and ACPs made in each year, across all tiers. Note that the years shown in Figure 3 and all subsequent figures correspond to each state’s definition of “compliance year” (CY), which begins on June 1 in Delaware, Illinois, New Jersey, and Pennsylvania.
The variation in these estimated costs–ranging from well below $10/MWh to upwards of $60/MWh–partly reflects differences in REC and ACP prices across states and years. For example, low main-tier REC prices in Maryland, Pennsylvania, and Texas, as shown previously in Figure 2, led to correspondingly low incremental RPS costs in those states (less than $5/MWh across the years shown). Conversely, relatively high and progressively increasing main tier REC prices among northeastern states underlie the trends in RPS incremental costs show in Figure 3.
Of some note are Ohio and Delaware, which both experienced relatively high estimated RPS costs compared to contemporaneous spot market REC prices. In the case of Ohio, the discrepancy was most pronounced in 2011 when the state’s distribution utilities paid an average of $110.55/MWh for in-state non-solar RECs (PUCO 2013a) compared to spot market prices ranging from roughly $10-$30/MWh and ACP rates of $46/MWh. The PUC subsequently ruled that one of the state’s utilities, FirstEnergy, substantially overpaid for RECs, and ordered the utility to refund its customers $43.3 million for excess REC purchase costs over the 2009-2011 period (PUCO 2013b). In the case of Delaware, the state’s lone distribution utility, Delmarva Power & Light, has met much of its compliance obligation with long-term bundled PPAs, and the above-market costs of those resources are greater than spot market REC prices.24 The per-MWh compliance costs rose over the 2010-2012 period as an increasing share of the compliance obligations were met through those long-term PPAs.
Aside from differences in REC pricing, the variations in estimated incremental RPS costs shown in Figure 3 also reflect the differing mixes of resource tiers within each state’s RPS. In particular, average incremental RPS costs were generally low for states with large secondary tier targets, as those tiers are typically characterized by low REC prices. The most pronounced example is Maine, where the secondary tier for existing resources constituted roughly 85-90% of the overall RPS requirement each year. Conversely, states with higher solar set-aside requirements tended to have higher incremental RPS costs, given that SREC prices have generally been relatively high compared to other tiers. For example, New Jersey and Washington, D.C. both had relatively high solar set-aside targets over the 2010-2012 period, contributing to relatively high average estimated incremental costs for the RPS as a whole, at least in some years. The decline in SREC prices in most markets over the 2010-2012 period, however, tended to dampen the impact of
24 Based on Delmarva’s 2012 IRP, above-market costs for RPS contracts in 2012 were projected to be $53/MWh for its three wind PPAs (in aggregate), $179/MWh for the Dover SunPark solar PPA, $241/MWh for the collection of PPAs with smaller solar projects, and $268/MWh for the Bloom fuel cell project (Delmarva Power & Light 2012). Delmarva’s RPS surcharge, which serves to recover the entirety of the above-market costs of the utility’s RPS resources costs in each year, equated to an average above-market cost of $55/MWh in 2012.

30
This report is available at no cost from the National Renewable Energy Laboratory (NREL) at www.nrel.gov/publications.
solar requirements on overall RPS compliance costs, and in the case of New Jersey led to a marked decline in average per-MWh RPS compliance costs.
Figure 3. Estimated incremental RPS cost over time in states with restructured markets ($/MWh of
renewable electricity)
3.1.4 Estimated incremental RPS Costs as a Percentage of Retail Rates RPS compliance costs can alternatively be expressed as a percentage of retail electricity rates, which we calculate as the ratio of the dollar value of RPS compliance costs to total revenues from retail electricity sales in each year. Unlike the data presented in the previous section, RPS compliance costs measured as a percentage of retail rates are a directly tied to the size of the target (given that higher targets, all else being equal, correspond to higher dollar costs associated with REC and ACP purchases) and are, in effect, normalized to the retail cost of electricity in each state. To reiterate, compliance costs denoted in these terms are not necessarily equivalent to actual retail rate impacts (such as for states where ACP costs are not recovered from ratepayers).
As shown in Figure 4, estimated incremental RPS costs in most states constituted less than 2% of average retail rates over the 2010-2012 period (with an average in 2012 of 1.4%).25 Clearly though, some variation exists across states and years, with estimated costs ranging from below 0.5% of retail rates in many states up to 3-4% in Delaware and Massachusetts in 2012. That variation reflects many of the same fundamental underlying drivers discussed above (e.g., differences in REC pricing and differences in the mix of resource tiers). Variation in Figure 4 further reflects differences in the size of the RPS targets across states and over time. It is for this reason that, in most states, estimated costs increased over the period shown as the RPS percentage targets ramped up (the most notable exception being New Jersey, where the decline in SREC prices more than offset the impact of the increasing RPS targets). We discuss further at 25 Several of the states included in Figure 4 have independently published their own estimates of RPS compliance costs (CEEEP and R/ECON 2011; LEI 2012; NHPUC 2011b; ME PUC 2012; ME PUC 2013; NJ BPU 2011; NYSERDA 2013b). Those analyses are often based on similar methods as used within the present study, and thus not surprisingly, the results are generally consistent.
01020304050607080
CT
DC
DE IL
MA
MD
ME
NH NJ
NY
OH PA RI
TX
201020112012
Estimated Incremental Cost of RPS*(Average Cost of RECs+ACPs Across All Tiers)
* Incremental costs are estimated from REC and ACP prices and volumes for each compliance year, which may differ from calendar years. If available, REC prices are based on average prices reported by the PUC (DC, IL, MD, ME, OH, NJ, PA); they are otherwise based on published spot market prices, supplemented with data on long-term contract prices where available. Incremental costs for NY are based on NYSERDA's annual RPS expenditures and estimated REC deliveries.
nom
inal
$/M
Wh

31
This report is available at no cost from the National Renewable Energy Laboratory (NREL) at www.nrel.gov/publications.
the end of this section some considerations related to how RPS costs may evolve going forward given continued increases in RPS targets over the next decade.
Figure 4. Estimated incremental RPS cost over time in states with restructured markets (% of retail
rates)
Figure 5 shows the estimated incremental cost associated with each resource tier and its relative contributions to total RPS costs in each state. These data are averaged over the 2010-2012 period in order to smooth out fluctuations associated with large swings in REC prices from year to year. For most states, main tier requirements represented the bulk of total RPS compliance costs, though a number of notable exeptions exist. In Washington, D.C. and New Jersey, which had both relatively high solar set-aside targets and relatively high SREC prices, solar set-aside costs constituted the majority of total RPS costs over 2010-2012 and were on the order of 1% of average retail electricity rates. New York’s DG set-aside has similarly constitituted a large fraction, roughly 50%, of total RPS costs. In Massachusetts and New Hampshire, where shortages in the secondary tiers have led to high REC prices, the costs of the secondary tier requirements were relatively significant and, in the case of New Hampshire, represented the bulk of total RPS costs.
0%
1%
2%
3%
4%
5%C
T
DC
DE IL
MA
MD
ME
NH NJ
NY
OH PA RI
TX
2010 2011 2012
Estimated Incremental Cost of RPS*(Percent of Average Statewide Retail Electricity Rate)
* Incremental costs are estimated from REC and ACP prices and volumes for each compliance year, which may differ from calendar years. If available, REC prices are based on average prices reported by the PUC (DC, IL, MD, ME, OH, NJ, PA); they are otherwise based on published spot market prices, supplemented with data on long-term contract prices where available. Incremental costs for NY are based on NYSERDA's annual RPS expenditures and estimated REC deliveries.

32
This report is available at no cost from the National Renewable Energy Laboratory (NREL) at www.nrel.gov/publications.
Figure 5. Estimated incremental RPS cost by tier in restructured markets (% of retail rates)
RPS estimated compliance costs in most states with restructured markets consist of some combination of direct REC procurement and ACPs or penalties (which, in some cases, may be directed toward programs or funds to support renewables deployment). RPS rules in some states may prohibit or limit the ability of suppliers from passing through the cost of ACPs or penalties to ratepayers (as discussed earlier in Section 2). In most states, the majority of RPS obligations were met with RECs during the 2010-2012 period (or at least for those years with available data). As such, REC costs constituted the overwhelming bulk of total RPS costs in most states, as shown in Figure 6. The three primary exceptions are Massachusetts, New Hampshire, and Rhode Island, where significant shortages in one or more years led to a substantial quantity of ACPs.
Figure 6. Estimated incremental RPS costs from RECs and ACPs in restructured markets (% of
retail rates)
0%
1%
2%
3%
4%
5%
CT
DC
DE IL
MA
MD
ME
NH NJ
NY
OH PA RI
TX
Solar/DG Set-AsideMain TierSecondary Tier(s)
Estimated Incremental Cost of RPS (2010-2012 Avg.)*(Percent of Average Statewide Retail Electricity Rate)
* Incremental costs are estimated from REC and ACP prices and volumes for each compliance year, which may differ from calendar years. If available, REC prices are based on average prices reported by the PUC (DC, IL, MD, ME, OH, NJ, PA); they are otherwise based on published spot market prices, supplemented with data on long-term contract prices where available. Incremental costs for NY are based on NYSERDA's annual RPS expenditures and estimated REC deliveries.
0%
1%
2%
3%
4%
5%
CT
DC
DE IL
MA
MD
ME
NH NJ
NY
OH PA RI
TX
ACPs & PenaltiesRECs
Estimated Incremental Cost of RPS (2010-2012 Avg.)*(Percent of Average Statewide Retail Electricity Rate)
* Incremental costs are estimated from REC and ACP prices and volumes, averaged over the 2010-2012 compliance years, based on those years for which data are available. Only 2010 data available for CT and DC. If available, REC prices are based on average prices reported by the PUC (DC, IL, MD, ME, OH, NJ, PA); they are otherwise based on published spot market prices, supplemented with data on long-term contract prices where available. For IL, ACP costs reflect the requirement that competitive suppliers must meet at least 50% of RPS target with ACPs. NY does not have ACPs or penalties; all costs are therefore associated with REC procurement and program administration.

33
This report is available at no cost from the National Renewable Energy Laboratory (NREL) at www.nrel.gov/publications.
3.2 States with Regulated Markets For states with traditionally regulated electricity markets, where RPS obligations are met principally through long-term bundled PPAs and/or utility-owned renewable generation, states and utilities estimate the incremental RPS costs by comparing the gross cost of RPS resources procured against the counterfactual cost of resources that would have been procured but for the RPS. As discussed in Section 2, states and utilities can, and have, employed a variety of methods to estimate incremental RPS compliance costs in regulated RPS states. We have not developed independent cost estimates, but rather, have synthesized estimates published by utilities and regulators in regulated RPS states, and have translated those data into a common set of metrics for comparison.
In particular, we summarize incremental RPS compliance cost estimates for eleven regulated states where sufficient data were available. For California, two separate estimates are presented based on different underlying methodologies, and those results are summarized and discussed separately in Text Box 3. Although the focus throughout the section is on incremental costs, we present data on gross compliance cost estimates for two states (Kansas and Nevada) where data on incremental costs are unavailable (Text Box 4).
3.2.1 Methodology and Data Sources The specific RPS cost studies synthesized for this report are listed in Table 6. For most traditionally regulated states, the cost data are derived primarily from utility compliance reports where RPS compliance costs are reported ex post, in some cases for ratemaking purposes and/or to demonstrate compliance with any applicable cost caps. For New Mexico, the RPS cost data are instead based on prospective cost estimates from annual procurement plans, while data for California and Wisconsin are based on estimates developed or published by the state PUC. In general, the cost data are limited to IOUs, either because only those entities are subject to the RPS or because only those entities issue public compliance reports, though the data for Minnesota, North Carolina, Washington, and Wisconsin also include publically owned utilities with RPS obligations.
Table 6 also highlights several important caveats and complexities. First, incremental cost data are wholly unavailable for a number of regulated RPS states (Hawaii, Iowa, Kansas, Montana, and Nevada; see the Appendix for discussions of available cost data for those states) or are available for only a subset of utilities or years. Second, although we present data on a statewide basis, estimated costs for individual utilities may differ from the statewide average. Where possible, we note within the text where variations among utilities in a given state are particularly significant. Third, the methods and conventions used by utilities and regulators when estimating incremental RPS costs vary considerably (and are often not completely transparent). The comparisons across states are thus necessarily imperfect, though to the extent possible, we discuss qualitatively how methodological differences may impact the results. Finally, there are often disconnects in regulated states between the timing of RPS obligations and when costs are incurred. For example, utilities often procure renewable resources in advance of their compliance obligations, and some utilities provide up-front incentives for renewable DG (in effect, providing an up-front payment for RECs generated over the lifetime of the systems). In general, the data we report represent estimated costs incurred by utilities in each year and therefore correspond to actual renewable energy procurement in that year. For several states, though, the data instead

34
This report is available at no cost from the National Renewable Energy Laboratory (NREL) at www.nrel.gov/publications.
represent the estimated incremental cost of renewable energy applied towards the requirement in each year (which may differ both in quantity and in the underlying resources from the renewable energy procured in the same year). These differences in accounting methods are noted within the text, where relevant.
Table 6. Data Sources Used to Calculate Estimated RPS Compliance Costs for Regulated States
State Data Source* Coverage Methodology and Key Conventions
AZ Utility compliance reports IOUs (2010-2012)
Incremental costs as a percent of retail rates calculated from IOUs’ annual RPS expenditures, consisting of administrative costs, above-market costs for utility-scale RE, and DG incentive program costs; excludes committed (but not yet spent) incentives
CA CPUC Section 910 report IOUs (2011 only)
Two alternative methods used: Proxy generator (levelized cost of CCGT) and market prices (see Text Box 3)
CO Utility compliance reports PSCo (2010-2012) Modeling: PSCo compares system wide costs with and
without post-2006 RPS resources
MI Utility compliance reports
Detroit Edison, Consumers Energy, Wisconsin Electric, Alpena (2010-2012)
Hybrid approach: avoided energy costs based on projected market prices (DTE) or modeling (Consumers); avoided capacity costs based on proxy generator (CT)
MN Utility rate impact reports
Great River, Minnesota Power, Minnkota, MMPA, Missouri River, SMMPA, Otter Tail (2010 only)
Market prices: compare PPA prices to MISO LMPs; significant methodological variations**
MO Utility compliance reports and plans IOUs (2011-2012) Costs based on only solar REC and solar rebate costs;
no non-solar compliance costs***
NC Utility compliance reports Varies by year****
Hybrid approach: avoided energy costs based on modeling and avoided capacity costs based on proxy generator (CT).
NM Utility procurement plans and compliance reports
SPS (2010-2012) PNM (2010 and 2012 only)
SPS: Modeling for avoided energy costs, proxy generator (CT) for avoided capacity costs; and REC prices. PNM: Modeling for avoided fuel costs; no avoided capacity costs included
OR Utility compliance reports
PGE and PacifiCorp (2011/2012 only) Proxy generator (levelized cost of CCGT)
WA IOU compliance reports and I-937 filings with WA Dept. of Commerce
Statewide (2012 only)
Market prices: Most utilities compare RPS resource revenue requirements to market prices; significant methodological variation
WI Wisconsin Public Service Commission RPS cost report
Statewide (2010 only)
Market prices: Compares levelized cost of new renewable generation built/procured over the 2006-2010 period to MISO LMPs
* Data Sources: AZ (APS 2011, 2012, 2013; TEP 2011, 2012, 2013; UNS 2011, 2012, 2013), CA (CPUC 2013a), CO (PSCO 2013a), MI (DTE 2011, 2012, 2013a; Consumers 2011, 2012, 2013a; Wisconsin Electric 2011, 2012, 2013; Alpena 2011, 2012, 2013), MN (Great River 2011, Minnesota Power 2011, SMMPA 2011, Minnkota 2011, MMPA 2011, Missouri River Energy Services 2011, Otter Tail 2011), MO (Ameren Missouri 2013b; KCPL 2012, 2013; KCPL GMO 2012, 2013), NC (Dominion 2012, 2013; Duke 2012, 2013; GreenCo 2012; NCEMPA 2011, 2012, 2013; NCMPA1 2011, 2012, 2013; Progress Energy Carolinas 2011, 2012, 2013; Halifax 2013; Town of Winterville 2013; Town of Fountain 2013), NM (SPS 2009, 2012, 2013; PNM 2009 and 2013b), OR (PGE 2011, 2012, 2013; Pacific Power 2011, 2012, 2013b), WA (Avista 2013; PacifiCorp 2013b; PSE 2013; WDOC 2013), WI (WPSC 2012) ** For example, some utilities include capacity credits, curtailment costs, transmission costs, and/or financial transmission rights costs/revenues; some use hourly LMPs, while others use average peak and off-peak prices; most consider only post-2006 renewables. *** For MO, compliance costs were calculated from data provided in the compliance plans and reports, rather than using the reported “rate impacts”, which could not be readily compared within the summary figures in this report. In performing these calculations, compliance costs associated with the non-solar requirements in 2011 and 2012 were assumed to be zero, as those obligations were met entirely with pre-existing renewables procured prior to enactment of the RPS. **** Depending on the year, a different set of utilities included data on incremental compliance costs within their annual filings. The state’s largest utility, Progress Energy, included such data in all years. The state’s other IOUs, Duke Energy and Dominion, included incremental cost data for 2011 and 2012, as did a number of smaller publically owned utilities.

35
This report is available at no cost from the National Renewable Energy Laboratory (NREL) at www.nrel.gov/publications.
3.2.2 Estimated incremental RPS Costs per Unit of Renewable Generation Figure 7 presents estimated incremental cost data in terms of $/MWh of renewable energy procured, focusing on resources procured for each state’s general RPS obligations (that is, excluding any solar or DG set-aside).26 These data are, in effect, the average estimated above-market cost (i.e., implicit REC price) of the various contracts and projects procured for general RPS obligations in each state, based on the particular methodology used by the reporting entity. This information was available for only seven states, including California, which is discussed separately in Text Box 3.
Among the six states in Figure 7, average estimated incremental costs were generally near or below roughly $20/MWh. Incremental costs in Wisconsin were somewhat higher ($44/MWh) for the single year available (2010). As noted in Table 6, the Wisconsin PSC estimated compliance costs using historical Midwest energy spot market prices as the basis for avoided costs, and those market prices were particularly depressed in 2010 as a result of the economic downturn (WI PSC 2012). At the opposite end of the spectrum is Oregon, where average utility estimates of incremental compliance costs were actually negative for the years shown; that is, RPS resources were determined to cost less, on a statewide average basis, than the proxy non-renewable resources that would have otherwise been procured.27 In part, this reflects the integrated resource planning process in the state, through which the state’s two large IOUs have procured cost-effective renewable resources on economic grounds, as well as opportunistic purchases of low-cost unbundled RECs.28
The variation in estimated costs observed in Figure 7 reflects a number of considerations. Although most of the states shown have relied primarily on wind power to meet general RPS obligations, wind energy costs vary across states and regions (e.g., due to differences in wind speeds and the vintage of wind projects installed). The cost of non-renewable power, which forms the basis for the avoided cost of renewable energy, also varies regionally, depending on the fuel mix, market structure, and other factors.
Methodological differences also undoubtedly play some role. In particular, reliance upon wholesale electricity market prices as the reference point for estimating incremental RPS costs (i.e., the approach used in Washington and Wisconsin) may capture fewer sources of avoided cost than the other approaches used, thereby resulting in somewhat higher RPS compliance cost estimates. At a minimum, reliance upon historical wholesale market prices as the basis for avoided costs can yield volatile results, given potentially wide fluctuations in wholesale electricity market prices from year-to-year. This is illustrated by the data for Wisconsin, where the PSC estimated RPS compliance costs for 2008 (which is outside our period of analysis and thus not included in Figure 7) to be considerably lower than in 2010 ($27/MWh in 2008 vs. $44/MWh in 2010), as a result of higher wholesale electricity market prices in 2008.
26 We focus here on general RPS obligations because of the complications associated with calculating the incremental cost of DG set-asides in $/MWh terms and lack of the requisite data. DG set-aside costs are, however, included in subsequent figures where RPS costs are presented as a percentage of average retail rates. 27 Of the two utilities with compliance obligations in 2011-2012, only PacifiCorp estimated net cost savings from its RPS resources, while Portland General Electric estimated a slight increase in revenue requirements. 28 The IOUs are allowed to meet up to 20% of their RPS obligation in each year with unbundled RECs.

36
This report is available at no cost from the National Renewable Energy Laboratory (NREL) at www.nrel.gov/publications.
Figure 7. Estimated incremental RPS cost over time for general RPS obligations in regulated states ($/MWh of renewable electricity)
3.2.3 Estimated incremental RPS Cost as a Percentage of Retail Rate Estimated incremental costs are presented as a percentage of average retail rates in Figure 8, which includes a larger set of states than in the prior figure, as a result of greater data availability. As explained previously, these data essentially represent the dollar value of annual estimated compliance costs as a percentage of total retail electricity costs. Again, comparability across states is somewhat limited by the differences in methods and conventions used by the utilities and regulators that developed these cost estimates.
As shown on the left-hand side of Figure 8, estimated RPS costs during 2010-2012 were generally at or below 2% of average retail rates for many states, though these costs span a wide range. At the low end is Oregon, where estimated incremental RPS costs were negative, as discussed above. Estimated compliance costs in Missouri were also quite low, on account of the fact that the state’s utilities were able to meet the entirety of their non-solar obligations in 2011 and 2012 with banked RECs from renewable resources procured prior to enactment of the RPS (and which thus entail no incremental compliance costs). Thus the data in Figure 8 represent solely the estimated cost of solar REC purchases and solar rebates issued for compliance with the state’s solar set-aside. Note that for both Oregon and Missouri, the data are based on the estimated incremental cost of resources applied towards the RPS requirement in the years shown, but utilities in these states procured substantially greater amounts of renewables, banking the excess for compliance in future years.29
29 Data on the incremental cost of the renewable energy procured in each year are not available for Oregon or Missouri, but the available information suggests that those costs could, at least for some utilities, be less than the amounts shown in Figure 8, even though they would be based on a larger volume of renewable energy. In Missouri, for example, both KCP&L and KCP&L GMO indicated that “all non-solar renewable additions caused revenue requirements to decrease” (KCPL 2013; KCPL GMO 2013); including those resources in the cost calculations would therefore reduce the estimated rate impact.
-10
0
10
20
30
40
50
AZ
CO MI
OR
WA WI
2010 2011 2012
nom
inal
$/M
Wh
* Incremental cost of general RPS obligations (i.e., RPS obligations excluding any set-asides) are based on utility- or PUC-reported estimates. Data for AZ and CO are based only on the single largest utility in each state (APS and PSCo, respectively). States omitted if data on the incremental costs of general RPS obligations are unavailable (HI, IA, KS, MT, NV) or if available data cannot be translated into the requisite form for this figure (MN, NC, NM, MO). See Text Box 3 for data on CA.
Estimated Incremental Cost of General RPS Obligations*(Average Above-Market Cost of Utility RPS Procurement)

37
This report is available at no cost from the National Renewable Energy Laboratory (NREL) at www.nrel.gov/publications.
At the opposite end are Arizona, Colorado, and New Mexico, where statewide average estimated incremental costs ranged from 3-4% of average retail rates in most years. Higher estimated RPS costs in those states are associated with several factors. To a significant degree, they can be attributed to DG and/or solar set-aside requirements in those states, which, as shown on the right-hand side of Figure 8, constituted the bulk of total estimated RPS compliance costs in most years. Important to understand, however, is that the apparently high cost of the DG set-asides is partially due to the fact that the costs are heavily front-loaded: rebates and performance-based incentives are paid upfront (or over several initial years of production) in exchange for RECs delivered over each DG system’s lifetime. Those costs have declined somewhat over time, though, as utilities in these states have reduced incentive levels and moved away from upfront rebates. In addition to the impact of the DG set-aside, RPS costs in Colorado are also relatively high, owing to the fact that Colorado’s RPS procurement levels were substantially higher than other states shown in Figure 8. In particular, the state’s largest utility, Xcel Energy, attained renewable procurement levels equal to 15% to 22% of retail sales over the 2010-2012 period, compared to renewables procurement levels of 5-10% in most of the other states in Figure 8.30 For Arizona, an additional factor contributing to the relatively high estimated incremental RPS costs in Figure 8 is that those data include administrative expenses (unlike in most other states), which add roughly 10% to total RPS costs for the years shown.
Importantly, the statewide averages presented in Figure 8 may mask variability in RPS costs among utilities within some states. In Washington, for example, all three IOUs as well as the state’s largest municipal utility reported costs for 2012 on the order of 0.5-1.4% of retail rates, but many of the smaller publically owned utilities reported higher costs (in several cases as high as 8-9%). Substantial variability was also evident among Minnesota utilities, which reported RPS costs in 2010 ranging from 0.1%-8.6% of average retail rates (though most were within the range of 1-3%). For New Mexico, the statewide averages are based on only two utilities (PNM and SPS), but those utilities reported divergent costs for 2012: 1.9% for PNM vs. 4.4% for SPS. In general, this intra-state variability is rooted in many of the same factors that drive differences in RPS costs across states – e.g., differences in procurement levels, resource costs, and cost calculation methodologies – though teasing out the relative significance of these underlying drivers is typically not feasible.
Unlike restructured markets, where compliance is often enforced through ACP mechanisms, RPS targets in regulated states are generally enforced through the potential for the PUC to assess penalties. Although utilities in regulated states have occasionally been subject to administrative penalties for RPS non-compliance, no significant penalties were levied over the 2010-2012 period in any of the states listed in Figure 8. Thus, the entirety of the costs shown consists of costs associated with renewable electricity purchases.
30 Incidentally, Xcel’s renewable energy procurement well-exceeded its RPS targets over the 2010-2012, which ranged from 5-12% of retail sales. Thus, the company’s RPS costs for those years includes costs associated with renewable energy credits that were banked for use in subsequent CYs, thus potentially reducing RPS procurement costs in those future years.

38
This report is available at no cost from the National Renewable Energy Laboratory (NREL) at www.nrel.gov/publications.
Figure 8. Estimated incremental RPS cost over time in regulated states (% of retail rates)
-1%0%1%2%3%4%5%6%
AZ
CO MI
MN
MO NC
NM
OR
WA WI
2010 2011 2012
* Incremental costs are based on utility- or PUC-reported estimates and are based on either RPS resources procured or RPS resources applied to the target in each year. Data for AZ include administrative costs, which are grouped in "General RPS Obligations" in the right-hand figure. Data for CO are for Xcel only. Data for NM in the left-hand figure include SPS (2010-2012) and PNM (2010 and 2012), but include only SPS in the right-hand figure. States omitted if data on RPS incremental costs are unavailable (HI, IA, KS, MT, NV).
Estimated Incremental Cost of RPS* (Percent of Average Statewide Retail Electricity Rate)
0%1%2%3%4%5%6%
2010 2011 2012 2010 2011 2012 2011 2012
AZ CO NM
DG and/or Solar Set-AsideGeneral RPS Obligations

39
This report is available at no cost from the National Renewable Energy Laboratory (NREL) at www.nrel.gov/publications.
Text Box 3. Estimated incremental RPS Costs in California The California PUC has issued several reports related to the cost of the state’s RPS. The March 2013 report, entitled Report to the Legislature in Compliance with Public Utilities Code Section 910, provided data on gross RPS expenditures for each of the state’s three IOUs, along with two sets of avoided cost estimates that can be used to compute incremental costs (i.e., gross costs minus avoided costs). One set of avoided cost estimates are based on the state’s MPR, which is intended to estimate the all-in cost of a CCGT and is used by the CPUC as a proxy for long-term electricity market prices when calculating the above-market costs of individual RPS contracts. The other set of avoided cost estimates, which were provided by the utilities, are based on day-ahead CAISO energy market prices and the cost of capacity in the CAISO market. As shown below, these alternate avoided cost estimates yield dramatically different results when used to calculate incremental RPS costs. Relative to the MPR, the estimated incremental cost of the RPS in 2011 was negative (i.e., the RPS yielded net cost savings), equal to -$24/MWh of renewable energy procured or -3.6% of average retail rates. In contrast, relative to short-term market prices, estimated incremental RPS costs in 2011 were equivalent to $43/MWh or 6.5% of average retail rates. At a minimum, these results clearly demonstrate the importance of assumptions about the costs avoided through increasing the use of renewable energy.
Table 7. Alternate RPS Incremental Cost Estimates for California (2011)
RPS Procurement (% of Retail
Sales)
Estimated Incremental Costs Calculated using MPR as
Avoided Cost
Estimated Incremental Costs Calculated using Spot Market
Prices as Avoided Cost
$/MWh % of Retail Rates $/MWh % of Retail
Rates PG&E 20% -28 -4.0% 36 5.2% SCE 21% -14 -2.3% 53 8.6% SDG&E 21% -49 -7.6% 22 3.4% Average 20% -24 -3.6% 43 6.5%

40
This report is available at no cost from the National Renewable Energy Laboratory (NREL) at www.nrel.gov/publications.
3.3 RPS Surcharges RPS costs may be recovered from ratepayers through a dedicated surcharge or tariff rider (i.e., a “line-item” on the customer’s bill), often adjusted periodically and subject to review and approval by the PUC. In contrast to the preceding RPS compliance cost data, which represent the incremental costs borne by utilities or LSEs, surcharges represent the incremental costs borne directly by customers. As demonstrated and discussed below, the costs passed through to customers via RPS surcharges may differ from the compliance costs borne by the utility. This can occur for any number of reasons, including, for example, discrepancies between estimated and actual costs, limitations on the recovery of ACP costs, and statutory caps on the surcharge.
Line-item surcharges on customer bills are currently used to recover RPS compliance costs in eight states (Arizona31, Colorado, Delaware, Michigan, North Carolina, New York, Ohio, and Rhode Island), though in some cases only by a subset of utilities or LSEs.32 These surcharges are denominated in various ways: as volumetric $/kWh charges in Arizona, Delaware, Ohio, New York, and Rhode Island; as a percentage of the total bill in Colorado, and as fixed monthly 31 Arizona Public Service is in the process of transitioning the cost of utility-owned renewable resources developed through the AZ Sun Program into its rate base. Thus, going forward, the RPS surcharge will no longer represent the totality of RPS-related costs borne by ratepayers, as some of those costs will be embedded in base rates. 32 A number of other states, including New Mexico, use surcharges to recover only a subset of RPS compliance costs, while other costs are recovered through base rates or through broader fuel adjustment surcharges that include non-renewable resource costs. Within this section, however, we focus only on states where RPS-specific surcharges are used to recover the entirety of RPS compliance costs.
Text Box 4. Gross RPS Compliance Costs in Kansas and Nevada Only gross RPS compliance costs have been reported for Kansas and Nevada. In Kansas, the utilities submit annual filings to the KCC, reporting the gross revenue requirements of their renewable energy procurement. Those cost data are confidential, but the KCC issues a public summary report that aggregates the data across utilities, and reports gross revenue requirements of renewable purchases per kWh of retail sales. In its report for the 2012 compliance year, the KCC found that the gross statewide costs of all renewable purchases constituted an average of 0.16 cents/kWh of retail sales, which equates to 1.7% of statewide average retail rates in that year (KCC 2013). In Nevada, the state’s two IOUs include estimates in their annual RPS compliance reports for gross RPS expenditures, consisting of the cost of purchased power, RECs, incentives and rebate programs. For 2013, these costs were estimated at $273 million and $139 million, for Nevada Power and Sierra Pacific, respectively, which equates to an average gross cost per unit of renewable energy of approximately $64/MWh across the two utilities (NV Energy 2013). For reference, we estimate incremental RPS costs using the utilities’ published long-term avoided cost rate, which in their 2012 integrated resource plan was equal to $30/MWh (NV Energy 2012). Using that value, we estimate average incremental RPS cost to be equal to roughly $34/MWh of renewable energy procured, or 8% of average retail rates.

41
This report is available at no cost from the National Renewable Energy Laboratory (NREL) at www.nrel.gov/publications.
customer charges in Michigan and North Carolina. For ease of comparison, Table 8 compares utility-specific surcharges in 2012, for residential customers specifically, translated into units of dollars-per-customer-per-month ($/customer-month).33 As shown, residential surcharges ranged from roughly $0.50/month or less for some utilities to $3-4/month for many others.
Table 8. Average RPS Surcharges for Residential Customers in 2012
State Utility 2012 Surcharge ($/customer-mo.)*
AZ Arizona Public Service** $3.84 Tucson Electric Power $3.15 UNSE/Citizens $4.50
CO Public Service Colorado (Xcel) $1.44 Black Hills Energy $2.04
DE Delmarva Power & Light $4.29 MI Detroit Edison Co. $3.00
Consumers Energy Inc. $0.52 Indiana Michigan $0.07 Wisconsin Electric Co. $3.00 Alpena Power $0.24
NC Progress $0.56 Duke $0.49
NY Central Hudson $2.02 Consolidated Edison $1.07 Orange and Rockland $1.86 New York State Electric & Gas $1.64 Niagara Mohawk $1.92 Rochester Gas & Electric $1.85
OH Cleveland Electric Illuminating (FirstEnergy) $3.25 Dayton Power & Light $0.59 Ohio Edison (FirstEnergy) $2.49 Toledo Edison (FirstEnergy) $3.02
RI Narragansett Electric** $1.08 * Data Sources: AZ (ACC 2012a; ACC 2012b; ACC 2012c), CO (PSCO 2013a; Black Hills 2013), DE (DPL 2012a), MI (MPSC 2013), NC (NC PUC 2012), NY (NY PSC 2014), OH (DP&L 2011; Ohio Edison 2011; Cleveland Electric Illuminating Co. 2011; Toledo Edison Company 2011), RI (RI PUC 2013). ** For Arizona Public Service, we show the surcharge level in effect during the first six months of the year; the surcharge was subsequently lowered when a portion of the costs of utility-owned renewables were moved into the rate base. Narragansett Electric also revised its surcharges mid-year; we show the weighted average surcharge for the calendar year. Statewide average RPS surcharges across all customer classes over the 2010-2012 period are summarized in Figure 9 and expressed as a percentage of average statewide retail electricity rates. As shown, surcharges ranged from less than 1% of average retail rates in a number of states (North Carolina, Ohio, and Rhode Island) to roughly 4% in Delaware, reflecting many of
33 For those states where some translation to these units was performed, we did so using EIA data for residential customer count, revenues, and sales by utility (EIA 2013).

42
This report is available at no cost from the National Renewable Energy Laboratory (NREL) at www.nrel.gov/publications.
the same drivers discussed previously–e.g., differences in the size of the targets, cost of resources procured, and reliance upon front-loaded incentives for solar or DG rebates.
Importantly, RPS surcharge costs borne by customers may, and often do, differ from the estimated incremental RPS costs borne by utilities or other LSEs. This can be seen in Figure 9 by comparing the average surcharges to the estimated incremental RPS costs for the corresponding years (which correspond in most cases to the data presented earlier in Figure 3 for restructured markets and in Figure 8 for regulated states).34 In Colorado–where, not incidentally, the state’s largest utility has well-surpassed its RPS targets–estimated utility compliance costs exceeded average surcharge collections in each year of the period shown. The RPS surcharge in Colorado is capped at 2%, and utilities may carry forward any deficit to be collected in future years. Similarly, in Rhode Island, the average customer surcharge in 2011 represented just 0.05% of retail rates, compared to estimated utility costs of roughly 1% of retail rates; this mismatch was the result of a true-up associated with over-charges in the previous year.
In other states, the converse has occurred, where surcharge collections have exceeded utility compliance costs. This was the case in Michigan over the entirety of the 2010-2012 period, where utility compliance costs ranged from 0.2% to 1.2% of retail rates, but surcharges averaged roughly 2% of retail rates in each year. The surcharges levied by the state’s two large IOUs are based on projected long-term annual average RPS compliance costs; in effect, the utilities plan to over-collect in early years and under-collect in later years, in order to smooth out the rate impacts of RPS compliance over time. Notably, however, both utilities requested significant reductions for their surcharges for 2013, with Detroit Edison proposing a reduction in its residential surcharge from $3.00 to $0.43 per month, and Consumers Energy proposed to eliminate its residential surcharge.
Figure 9. RPS surcharges over time (% of retail rates)
34 Incremental RPS cost data for Ohio are omitted from Figure 9 as the surcharges apply only to a subset of utilities (First Energy and Dayton Power & Light) and comparable cost data are not available for those particular utilities.
0%
1%
2%
3%
4%
5%
6%
AZ
CO DE MI
NC
NY
OH RI
2010 Surcharge2011 Surcharge2012 SurchargeEst. Incremental RPS Costs
* Surcharge data represent statewide averages for investor-owned utilities (AZ, CO, DE, MI, NC, NY) or default service providers (OH, RI). The DE surcharge commenced in 2012. Incremental RPS Costs represent compliance costs and generally correspond to the values presented previously in Figure 3 and Figure 8 . Incremental RPS cost data for OH are omitted from this figure, as the surcharges apply only to First Energy and Dayton Power & Light, and comparable cost data are not available.
Average RPS Surcharges*(Percent of Average Statewide Retail Electricity Rate)

43
This report is available at no cost from the National Renewable Energy Laboratory (NREL) at www.nrel.gov/publications.
3.4 Assessment of Future RPS Costs and Cost Containment Mechanisms
Estimated RPS compliance costs over our historical period of analysis are a function partly of the RPS targets applicable during those years. As shown in Figure 10, which summarizes estimated RPS compliance cost data for the most-recent historical year available for each state, the corresponding RPS targets or procurement levels in those years (i.e., the open circles within the figure) ranged from 2% to 22% of retail sales, but in most cases were within a band of 4-8% (excluding secondary tiers).35
Though there is certainly some relationship between the stringency of the target or procurement level and the magnitude of estimated compliance costs (e.g., Colorado had relatively high RPS procurement levels and high costs, while Ohio had a correspondingly low RPS target and low costs), a variety of other conditions have also strongly impacted compliance costs. As discussed previously, such factors include–among other things–regional REC supply/demand balance, the presence of solar or DG set-asides, and the cost calculation methodology, itself.
Figure 10. Estimated incremental RPS costs compared to recent and future RPS targets
Over the 2010-2012 period, average estimated RPS compliance costs in the United States were equivalent to 0.9% of retail electricity rates when calculated as a weighted-average (based on 35 The open circles in Figure 10 represent somewhat different things depending on the state, and are intended to be consistent with the corresponding cost data. For restructured states, the open circles represent RPS targets, as the costs are based on the total volume of REC purchases and ACPs. For most regulated states, the cost data represent the cost of RPS-eligible procurement (sometimes excluding pre-existing RPS resources), and thus the open circles represent the corresponding quantity of RPS-eligible resources procured. For two regulated states, Oregon and Missouri, the cost data are instead based on only the cost of renewable energy applied towards the target, and thus the open circles represent the corresponding quantity of renewable energy.
-20%-10%0%10%20%30%40%
-4%-2%0%2%4%6%8%
CT
DC
DE IL
MA
MD
ME
NH NJ
NY
OH PA RI
TX AZ
CA
CO MI
MN
MO NC
NM
OR
WA WI
Restructured Regulated
Estimated Incremental RPS Costs (Most-Recent Year)RPS Target (Most-Recent Year)RPS Target (Final Year)
Estim
ated
RPS
Cos
t (%
of A
vera
ge R
etai
l Rat
es)
RPS
Tar
get
(% o
f Ret
ail S
ales
)
* For most states shown, the most-recent year RPS cost and target data are for 2012; exceptions are CA (2011), MN (2010), and WI (2010). MA does not have single terminal year for its RPS; the final-year target shown is based on 2020. For CA, high and low cost estimates are shown, reflecting the alternate methodologies employed by the CPUC and utilities. Excluded from the chart arethose states without available data on historical incremental RPS costs (KS, HI, IA, MT, NV). The values shown for RPS targets exclude any secondary RPS tiers (e.g., for pre-existing resources). For most regulated states, RPS targets shown for the most-recent historical year represent actual RPS procurement percentages in those years, but for MO and OR represent REC retirements (for consistency with the cost data).

44
This report is available at no cost from the National Renewable Energy Laboratory (NREL) at www.nrel.gov/publications.
revenues from retail electricity sales in each RPS state) or 1.2% when calculated as a simple average, although substantial variation exists around the averages, both from year-to-year and across states.36 Going forward, RPS targets will rise, reaching their peak in most states within the 2020-2025 timeframe. These final-year targets, also shown in Figure 10 (the closed circles), rise to anywhere from 7% to 33% of retail sales, but in most cases to at least 15%. Compared to the RPS targets or procurement levels for the most recent historical year, the final-year RPS targets constitute, on average, roughly a three-fold increase in RPS obligations. All else remaining constant, one would expect RPS costs, in absolute dollar terms, to rise as additional renewable generation is added to meet the higher final targets set by existing policies.
Whether and the extent to which RPS compliance costs increase over time will, of course, depend on a great many factors. First and foremost, perhaps, is the underlying cost of renewable energy technologies, and whether they continue to decline as they have in recent years. Second is the price of natural gas, as gas-fired electricity is generally the baseline against which market-based REC prices or the calculated above-market costs of renewables are established. Third, RPS costs may be significantly impacted by changes to state and federal tax incentives for renewables–in particular, the federal production tax credit (PTC), which (as of this writing) expired at the end of 2013, and the federal investment tax credit (ITC), which is scheduled to decline from 30% to 10% in 2017–as these tax incentives reduce the costs borne directly by utilities. Fourth, environmental policies related to the power sector, such as federal greenhouse gas regulations and air pollution regulations, could have a significant impact on RPS costs, by raising the cost of non-renewable resources and thereby reducing the incremental cost of renewables. And finally, future RPS costs could potentially be affected–in particular, constrained–by cost containment mechanisms built into many state RPS policies, which, if they became binding, would also limit achievement of the RPS targets.
To gauge the potential trajectory of future RPS compliance costs, one can look to the various prospective RPS cost studies that have been conducted for individual states or utilities. An earlier meta-analysis by Chen et al. (2007) synthesized the results of 28 distinct state or utility-level RPS cost impact analyses, finding that 70% of the studies in their sample projected retail electricity rate increases of no greater than 1% in the year that each modeled RPS policy reaches its peak percentage target. Five of the studies projected net reductions in retail rates, while two studies projected rate impacts greater than 5%. Much has changed on the RPS landscape since the time of that study, however, as many states have increased their RPS targets and/or added set-aside provisions, and renewable energy technology costs have fallen significantly while natural gas prices have simultaneously declined.
More-recent prospective RPS cost analyses have estimated rate impacts in the final target year equal to roughly: 10% in California (CPUC 2009), 2.2-4.8% in Connecticut (CEEEP and R/ECON 2011), 7.9% in Delaware (Delmarva Power & Light 2012), 1.1-2.6% in Maine (LEI 2012), 0.3-1.7% for Northern States Power in Minnesota (Xcel Energy 2011), 2.2% for Great River Energy in Minnesota (Great River Energy 2011), and a 0.5% reduction in North Carolina
36 California is excluded from the calculation of this average, given the lack of a single point estimate.

45
This report is available at no cost from the National Renewable Energy Laboratory (NREL) at www.nrel.gov/publications.
(RTI International 2013).37 As with retrospective RPS cost analyses, the scope, methodology, and assumptions also vary widely among prospective cost studies, limiting their comparability to one another and to the historical cost data presented earlier. They nevertheless provide an illustrative range when considering how RPS costs may evolve as the targets rise.
3.4.1 RPS Cost Containment Mechanisms Given the inherent uncertainty in future RPS costs, and the desire among policymakers to limit the potential burden to ratepayers, most RPS policies include one or more cost containment mechanisms or “off-ramps” (see Table 9). Various approaches are used, though the most common are ACPs and rate impact/revenue requirement caps.
• ACPs. Typical of restructured markets, ACPs function as a backstop compliance option for LSEs. As such, they effectively cap REC prices and thus RPS compliance costs (though exceptions may exist, as discussed below).
• Rate impact/revenue requirement caps. Many states cap RPS costs in terms of a maximum allowed percentage of revenue requirements, costs, or customer bills. This kind of mechanism is most common among regulated states, though is also employed in several restructured markets, in conjunction with ACPs. Caps generally apply to incremental RPS costs (though one state, Kansas, applies its cap to gross procurement costs), with varying methods used to calculate the cost of RPS resources and avoided non-renewable resources.
• Surcharge caps. Two states, Michigan and North Carolina, have statutory caps on RPS surcharges, denominated in terms of a maximum dollar cost per customer. In addition, Colorado has a statutory rate impact cap of 2%, but the PUC has, in effect, operationalized this as a surcharge cap, allowing the utilities to incur costs beyond the cap and defer the balance.
• Renewable energy contract price caps. Caps may be placed on individual RPS contract prices–as in Montana, where RPS contract prices are capped based on the avoided costs of an equivalent non-renewable resource.
37 For California, the estimated rate impact represents the projected increase in electricity costs to meet a 33% RPS in 2020 relative to a scenario in which gas-fired generation is used to meet all new resource needs. For Connecticut, the range in estimated rate impacts corresponds to varying REC price assumptions and represents the projected cost in 2020, relative to a scenario in which RPS targets are held constant at 2010 levels. For Delaware, the rate impact estimate is for the 2022/2023 CY rather than the final RPS target year (2025/2026). For Maine, the range in estimated rate impacts corresponds to varying REC price assumptions. For Xcel, the rate impact estimates represent the incremental cost of the company’s RES compliance plan in 2020, relative to an otherwise least-cost plan, across several scenarios. For Great River Energy, the rate impact estimate represents the net present value of the increase in revenue requirements over the 2013-2027 period, rather than the impact in the final target year, and furthermore represent the percentage increase in wholesale prices to the company’s distribution utility customers. For North Carolina, the rate impact estimate represents the projected incremental costs in 2021 of the state’s RPS and other “clean energy policies”; the net cost savings are largely attributable to energy efficiency savings used to meet a portion of the RPS requirements. In addition to the set of studies listed above, NYSERDA conducted a recent RPS evaluation, estimating that, for the 2002-2037 period, the state’s current RPS portfolio would yield a slight reduction in average retail rates, with wholesale market price reduction benefits more than offsetting REC purchase costs (NYSERDA 2013b).

46
This report is available at no cost from the National Renewable Energy Laboratory (NREL) at www.nrel.gov/publications.
• Renewable energy funding caps. Where specific programs are established for the purpose of RPS procurement (e.g., New York), cost containment may occur through statutory or regulatory limits on program budgets.
• Financial penalties. Texas has a pre-specified penalty that can function largely like an ACP in terms of its containment of REC prices and incremental RPS costs. Other states may also levy financial penalties for non-compliance, but often either those penalties cannot be passed through to ratepayers and/or the penalty rate is not pre-specified, and thus they do not function as a cost containment mechanism, per se.
Aside from cost containment mechanisms with some prescribed numerical limit, such as those listed above, regulators in many states often have some level of discretionary power to control RPS costs. Some RPS laws grant the PUC the authority to delay or freeze RPS requirements, or grant waivers to individual utilities, if costs would be deemed excessive (e.g., under a force majeure clause). Regulators also often have the ability to review and approve PPAs and/or cost recovery for RPS resources, and thereby limit the costs incurred.
Importantly, cost containment mechanisms may sometimes serve as only a “soft” cap, depending upon the specifics of their design. In states with ACPs, for example, utilities might conceivably pay a higher price for RECs than the ACP level if ACPs are not recoverable or when RECs are purchased through long-term bundled PPAs. Similarly, rate impact or revenue requirement caps may be voluntary; in Washington, for example, a utility may opt to abide by the cap but is not obliged to do so. More generally, cost containment under many of the above mechanisms may be imperfect to the extent that certain costs or benefits are not fully counted. For a broader discussion of the design and limitation of RPS cost containment mechanisms, see Stockmayer et al. (2012).

47
This report is available at no cost from the National Renewable Energy Laboratory (NREL) at www.nrel.gov/publications.
Table 9. Cost Containment Mechanisms State Cost Containment Mechanism(s) Details of Cost Containment Mechanism(s) Applicable to Final Target Year AZ No specific cap CA No specific cap (under development) CO Rate impact/revenue requirement cap 2% (IOUs and coops) or 1% (municipal utilities) of each customer’s annual electricity bill CT ACP $55 (Class I and Class II) DC ACP $50 (Tier I and Solar), $10 (Tier II) DE Rate impact/revenue requirement cap For IOUs, 3% (total RPS) and 1% (Solar) of total retail electricity costs; for municipal utilities, 4% (total RPS); rulemaking currently underway
ACP $80 (Non-Solar), $500 (Solar) HI No specific cap IA No specific cap IL Rate impact/revenue requirement cap 2.015% of average 2007 retail rates
ACP Applicable only to alternative retail electricity suppliers, which are required to meet at least 50% of RPS obligation with ACPs; equal to average REC price paid by IPA
KS Rate impact/revenue requirement cap 1% of retail revenue requirement (gross RPS costs) MA ACP $73.7 (Class I Non-Solar), $30.3 (Class II-Existing RE), $12.1 (Class II-Waste Energy), $384, (Class I Solar-SREC I program), $316 (Class I Solar-
SREC II program) MD ACP $40 (Tier I Non-Solar), $15 (Tier II), $50 (Tier I Solar)
Rate impact/revenue requirement cap 10% (Tier I Non-Solar), 1% (Tier I Solar) of retail sales revenue ME ACP $70.9 (New renewables tier) MI Surcharge cap $3.00/month (residential), $16.58/month (small commercial), $187.50/month (large commercial and industrial) MN No specific cap MO Rate impact/revenue requirement cap 1% of retail revenue requirements* MT Renewable energy contract price cap Capped at avoided costs for most utilities NC Surcharge cap $34/year (residential), $150/year (commercial), $1,000/year (industrial) NH ACP $62.1 (Class I-New RE), $28.2 (Class I-Thermal), $62.1 (Class II-Solar), $40.1 (Class III-Existing Biomass), $33.8 (Class IV-Existing Small Hydro) NJ ACP $50 (Tier I and Tier II), $239 (Solar) NM Rate impact/revenue requirement cap 3% of total revenue
Per-customer cost cap For customers using >10 million kWh/year, $99,000/year (2012 dollars) or 2% of their bills, whichever is less NV No specific cap NY Renewable energy fund cap PSC Order establishing program budget through final target year OH Rate impact/revenue requirement cap 3% of generation costs ACP $61.0 (Non-Solar), $50 (Solar) OR Rate impact/revenue requirement cap 4% of annual retail revenue requirements
ACP Established bi-annually by Oregon PUC ($110 for 2014 and 2015) PA ACP $45 (Tier I Non-Solar and Tier II), 2x market value of RECs (Tier I Solar) RI ACP $73.9 TX Financial penalty $50/MWh, could be passed through by competitive suppliers WA Rate impact/revenue requirement cap 4% of annual retail revenue requirements WI No specific cap Note: All ACP rates identified are in units of $/MWh and represent the scheduled ACP rate for the final RPS target year. Several states (MA, ME, NH, OH, RI) adjust ACP rates for some or all tiers annually based on inflation; in these cases, we estimate the ACP rates for the final RPS target year using the CPI projection from the EIA Annual Energy Outlook 2014 Early Release. For MA, where the Class I-New RE tier has no final target year, we estimate the non-solar ACPs for 2020, and show the scheduled solar ACP rates for that year as well. Note: In states without specific caps, cost containment may still occur through regulatory oversight (e.g., authority of the PUC to delay or freeze RPS requirements if costs are deemed burdensome, review and approval of contracts and cost recovery, etc.). *Interpretation and implementation of the MO cost cap is currently subject to substantial debate.

48
This report is available at no cost from the National Renewable Energy Laboratory (NREL) at www.nrel.gov/publications.
In Figure 11, we have translated, where possible, the cost containment mechanisms outlined in Table 9 into the equivalent maximum percentage increase in average retail rates, for the year in which each state’s RPS target reaches its peak.38 In effect, these values represent the maximum potential annual RPS cost, subject to the various caveats discussed above, for the single year in which each state reaches its final target. For comparison, Figure 11 also presents estimated statewide-average RPS costs for the most recent historical year available (i.e., the same data presented in Figure 10). Excluded from Figure 11 are those states currently without any mechanism to cap total incremental RPS costs, though some of those states may have other kinds of mechanisms or regulatory processes to limit RPS costs.
States relying upon ACPs as their primary cost containment mechanism are grouped on the left-hand side of the figure. Among those states, RPS costs are generally capped at the equivalent of 6-9% of average retail rates.39 The effective caps are somewhat higher in Massachusetts (16%) and New Jersey (13%) due to relatively high solar set-aside targets and/or ACP levels.40 As shown, estimated recent RPS compliance costs in this set of states are generally well below the corresponding caps. To a significant extent, this is simply because current RPS targets are well below the final-year targets, and cost caps are arithmetically related to the final-year targets. Rising RPS targets will put upward pressure on REC prices, which in many of the Northeastern states are already near their respective ACPs. At the same time, ACP rates will generally remain fixed (in either real or nominal terms) or, in the case of many states’ solar ACPs, will decline over time. Of particular note, solar ACPs in Washington D.C., Maryland, and Ohio are scheduled to decline to $50/MWh, from current levels of $350-500/MWh. This combination of possible upward pressure on REC prices and fixed or declining ACPs could constrain achievement of RPS targets and push total compliance costs towards the maximum levels shown in Figure 11. That outcome is not foregone of course, if continued reductions in renewable energy costs and/or increases in wholesale power prices restrain growth in REC prices.
States with some form of cost containment other than, or more binding than, an ACP are grouped on the right-hand side of Figure 11. In general, cost caps among these states are relatively restrictive, typically ranging from the equivalent of 1-4% of average retail rates. Not surprisingly, cost caps have already become binding in several of these states. In particular, utilities in New Mexico have, on a number of occasions, requested and been granted reductions in their RPS obligations in order to remain within the overall rate impact cap (termed the “Reasonable Cost Threshold”) and/or to remain within the per-customer cost cap for large customers. Also, utilities in Missouri (not included in Figure 11) have sought waivers from solar rebate requirements included in the RPS law, in order to remain within the state’s cost cap. 38 Figure 11 excludes three states–Pennsylvania, Kansas, and Missouri–with numeric cost caps that cannot be expressed on a sufficiently comparable basis to the other states. Pennsylvania is excluded, because the ACP rate for its solar set-aside is not pre-defined. Kansas’s cost cap applies to gross costs, rather than incremental costs. Missouri’s cost cap is currently subject to substantial debate, and a binding ruling on its interpretation has not yet been issued. 39 Although not included in the figure, Pennsylvania’s main tier and secondary tier ACPs equate to effective cost cap of 7.4% of average retail rates for the final target year. In comparison, RPS costs for the most recent historical year (2012) equated to 0.2% of retail rates. 40 Massachusetts’s RPS does not have a single terminal year. For the purpose of constructing Figure 11, the cost cap was calculated based on RPS targets in 2020. This is the year when the state’s cost cap reaches a local maximum, declining in the years immediately following as the solar ACP rates decline and the SREC-I program expires.

49
This report is available at no cost from the National Renewable Energy Laboratory (NREL) at www.nrel.gov/publications.
Several other states appear to have surpassed their caps, but for various reasons those caps have not yet been binding. In Colorado, Xcel Energy has a 2% cap on its RPS surcharge. The utility–which, not incidentally, has far-surpassed its RPS procurement targets–has been allowed to incur costs in excess of the surcharge amount and defer the balance forward for collection from ratepayers in later years (Stockmayer et al. 2012). In Delaware, Delmarva Power & Light’s RPS procurement costs for 2012 appear to have exceeded the 3% cost cap; however, the administrative rules for implementation of the cap are still under development (as of this writing), and it is therefore not yet practically enforceable. Finally, Kansas had statewide average renewable energy costs in 2012 equivalent to 1.7% of average retail rates, which is greater than the 1% rate impact cap for the RPS (KCC 2013). However, the 2012 costs are based on all renewables procured by the state’s utilities, beyond just those resources attributed to the RPS (Solorio 2014).
Other states are approaching or could begin to approach their respective caps. For example, Illinois, North Carolina and Ohio all have relatively low cost caps (1-2% of average retail sales) and targets that rise considerably over the coming decade. In Oregon as well, cost caps may become an issue for some utilities, even though historical compliance costs have been quite low. Portland General Electric, in particular, has forecasted sizeable increases in its RPS rate impacts over the next five years that reach or exceed the 4% rate cap under a number of scenarios. New York is also likely to hit its cap, though this is by design, as the cap is based on a schedule of revenue collections adopted by the PSC and deemed necessary for achievement of the target. In Montana, the cost cap effectively prohibits any net cost from RPS resources. Thus far, the cap has not been binding–no doubt the result of the high quality wind resource sites in the state–but the sheer restrictiveness of the cap suggests that it could at some point become limiting.
Of the states on the right-hand side of Figure 11, Texas and Michigan are both seemingly at low risk of reaching their cost caps, even though the caps are on par with other states within the group. In the case of Texas, scheduled increases in the RPS target are relatively small, and installed renewable capacity in the state already well-exceeds the final-year (2015) target. Given the low REC prices that have prevailed to-date, RPS compliance costs in Texas would thus seem unlikely to approach the state’s cost cap. In Michigan, the cost cap is specified in terms of a maximum customer surcharge, and the state’s two large IOUs reduced their surcharges substantially in 2014. In their latest RPS procurement plans, both utilities project attainment of their RPS targets going forward, without any significant increase in surcharges (DTE 2013b; Consumers 2013b).

50
This report is available at no cost from the National Renewable Energy Laboratory (NREL) at www.nrel.gov/publications.
Figure 11. RPS cost caps compared to estimated recent historical costs
0%
5%
10%
15%
20%
CT
DC
MA
MD
ME
NH NJ RI
CO DE IL MI
MT
NM NC NY
OH
OR TX WA
Cost Containment Based on ACP Other Cost Containment Mechanisms
Historical Compliance Cost Estimate (Most-Recent Year)Effective Cost Cap (Max Retail Rate Increase)
* For states with multiple cost containment mechanisms, the cap shown here is based on the most-binding mechanism. MA does not have a single terminal year for its RPS; the calculated cost cap shown is based on RPS targets and ACP rates for 2020. "Other cost containment mechanisms" include: rate impact/revenue requirement caps (DE, KS, IL, NM, OH, OR, WA), surcharge caps (CO, MI, NC), renewable energy contract price cap (MT), renewable energy fund cap (NY), and financial penalty (TX). Excluded from the chart are those states currently without any mechanism to cap total incremental RPS costs (AZ, CA, IA, HI, KS, MN, MO, NV, PA, WI),though some of those states may have other kinds of mechanisms or regulatory processes to limit RPS costs.
RPS Cost Containment Mechansims*(Equivalent Maximum Percentage Increase in Average Retail Rates)

51
This report is available at no cost from the National Renewable Energy Laboratory (NREL) at www.nrel.gov/publications.
4 Benefits of RPS The estimated RPS incremental costs reported earlier are net costs that account for a narrow set of benefits–namely the benefits that accrue to the utility, in the form of reduced costs for conventional generation. However, policymakers often consider RPS costs within the broader context of the possible benefits of those policies to society at large. Potential societal benefits of RPS policies include air emissions reductions, health benefits, fuel diversity, electricity price stability, energy security, and economic development (EPA 2011; Cory and Swezey 2007). Often RPS legislation includes language indicating that the policy is designed to achieve particular goals, such as these.
This section summarizes RPS benefits estimates, based on published studies for individual states, and discusses key methodological considerations. As such, the estimated benefits itemized in this document do not result from the application of a standardized approach or the use of a consistent set of underlying assumptions. Because the reported values may differ from those derived through a more consistent analytical treatment, we do not provide an aggregate national estimate of RPS benefits, nor do we attempt to quantify net RPS benefits at national or state levels. Benefits estimates, for example, of the social value of carbon emissions reduction and the human health impacts of reduced air emissions, are based on a variety of methodologies and assumptions. In comparison to the summary of estimated RPS costs, the summary of RPS benefits is more limited, as relatively few states have undertaken detailed benefits estimates. Further, for those states that have estimated RPS benefits, most assess only a limited number of impact types; as a consequence, some types of benefits are not reflected in this report.
Estimating the broader impacts of RPS policies (and other types of policies in general) 41 can be challenging. The level of rigor in assessment can vary substantially and a variety of methods can be employed (Leon 2012), depending on available resources to conduct modeling or detailed assessments. When preparing RPS evaluations, many states have qualitatively discussed benefits while a smaller number have attempted to develop quantitative estimates.
Comparison of estimated costs to benefits is also challenging, even when they are reported in the same study, given that some incremental cost calculations may already take into account certain benefits, analysis time periods may differ, benefits assessments may address only particular types of benefits, and other factors. In addition, certain benefits (e.g., avoided emissions) may accrue for the lifetime of the renewable plant, while costs are incurred over a shorter period. One study conducted by NYSERDA does offer a direct comparison of RPS benefits and costs finding that the New York RPS yielded a net present value benefit of $1.6 to $3.5 billion, with the range depending primarily on assumptions of the value of CO2 savings (NYSERDA 2013b). Massachusetts also compared estimated compliance costs to the benefits, primarily price suppression effects, showing 2012 costs of $111 million compared to benefits of $328 million in the same year (EOHED and EOEEA 2011). Most other states for which we have identified benefits estimates did not conduct direct comparisons.
41 In this analysis, we focus on the impacts of RPS policies in particular, but do not examine the impacts of other renewable energy policies. While RPS policies can have positive impacts, there are other types of policies that could have equivalent impacts, potentially at lower cost.

52
This report is available at no cost from the National Renewable Energy Laboratory (NREL) at www.nrel.gov/publications.
Table 10 summarizes studies identified in our literature review that quantitatively assess benefits of state RPS policies in current or future years. Based on our review of studies, states have most commonly attempted to quantitatively assess avoided emissions and human health benefits, economic development impacts, and wholesale electricity price reductions. The studies identified include those required by statute, filed as part of an IRP docket, and prepared for regulatory commissions, energy boards, or public benefit corporations. Most of these studies are prospective in nature, assessing not only the current RPS impacts, but also examining future impacts, in contrast to the cost estimates previously discussed that are retrospective. Results from third-party studies referenced in the aforementioned documents are also included here. While we attempted to conduct a thorough literature review, we have likely omitted some analyses. However, this review provides an indication of the types of benefits analyses that have been conducted and the range of benefits found. In this analysis, we did not review the broader literature on renewable energy benefits in general, but are focused only on analyses conducted as part of state-level RPS evaluations.
Table 10. Summary of State Studies of RPS Benefits and Benefits Assessed
State Emissions and Health
Economic Development
Impacts
Wholesale Market Impacts
Study required?
Source
CT As part of IRP The Brattle Group et al.
2010
CEEEP and R/ECON 2011
DE As part of IRP DPL 2012b IL IPA 2013
ME LEI 2012 MA
EOHED and EOEEA 2011
MI MPSC 2013 NY NYSERDA 2013b; 2013c OH PUCO 2013a
PUCO 2013c OR ODOE 2011
Note: The results found in a single report may have been classified under more than one category. The following sections review estimated benefits and impacts of state-level RPS policies, with respect to 1) emissions and human health; 2) economic development; and 3) wholesale market price impacts. We summarize the estimated benefits and methods used in studies identified in the literature review, which were often prepared for state legislatures or commissions. While methods for developing benefits estimates differ substantially from methods used to assess policy costs, this information can provide context for considering the cost of RPS policies presented earlier.
4.1 Emissions and Human Health One of the most often quantified environmental benefits of renewable energy is the avoided air pollutant emissions and associated human health benefits. Typically, estimates of avoided emissions focus on carbon dioxide (CO2), sulfur oxides (SOX), and nitrogen oxides (NOX). In some cases, the human health benefits of these reduced emissions are estimated as well by applying monetary values to, for example, the reduced morbidity or mortality from air quality

53
This report is available at no cost from the National Renewable Energy Laboratory (NREL) at www.nrel.gov/publications.
improvements. In other instances, monetary impacts are estimated based on the avoided cost of compliance with environmental regulations.
There are two common approaches to estimating RPS emissions impacts. The most robust approach is to conduct detailed modeling of the electric system with and without the renewable generation to determine the mix of plants that would be operating and the overall system emissions in each scenario. This approach yields the most robust results because it accounts for the operation of the facilities at each hour of the day—renewable facilities may be displacing different types of conventional generators throughout the course of a day. A simplified approach is to estimate the marginal generating unit that would typically not be operating as a result of the renewable generator and apply the unit’s emission rate to the displaced generation. This approach is simplified and yields approximate results. Table 11 summarizes estimates of the emissions and associated monetary benefits from RPS policies for several states where data are available.
Table 11. Summary of Estimates of Emissions and Human Health Benefits of State RPS
State Estimated Benefit
Benefits $/MWh of
RE
Avoided CO2/MWh
Period Description Source
CT Not estimated
N/A 0.39-0.53 tons/MWh
2020 Avoided CO2 emissions of 0.39-0.53 tons/MWh of renewable generation
Brattle Group et al. 2010
OH Not estimated
N/A N/A 2014
CO2 emissions reduced from 116.36 million metric tons in reference case to 116.16 (-0.17%), and to 115.79 (-0.5%) in scenarios
PUCO 2013c
ME $13 million $7/MWh 0.57 tons/MWh
Annual
Avoided allowance costs for 96 tons for SO2, 1,629 tons for NOX and 1.1 million tons for CO2. CO2 valued at $12/ton.
LEI 2012
DE $980 - $2,200 million*
N/A N/A 2013 – 2022
Human health benefits due to improvements in air quality from emission reductions in power generation and other sectors
DPL 2012b
IL $75 million $11/MWh** 0.79 tons/MWh**
2011
Avoided allowance costs for 5,481,327 tons of CO2 and 4,765 tons of NOX. CO2 valued at $5/ton.
IPA 2013
NY
Not estimated
N/A N/A 2002-2006
4,028 tons of NOX, 8,853 tons of SO2, and 4.1 million tons of CO2
NYSERDA 2013a
$312 - $2,196 million***
$3–22/MWh
0.05 tons/MWh
2002 – 2037
Value of avoiding 50.29 million tons of CO2. CO2 valued at $15 /ton and $85/ton.**
NYSERDA 2013b
$48 million $0.5/MWh N/A 2002 – 2037
Value of avoiding 278 pounds of mercury, 15,214 tons of NOX and 14,987 tons of SO2
NYSERDA 2013b
*Delaware estimates reported in $2010 dollars. **Estimated based on 6.9 million MWh of renewable energy needed to meet the 2011 RPS requirements (IPA 2010, Zuraski 2014). *** The estimated monetary impact is a net present value calculation reported in $2012, thus the avoided tons of CO2
multiplied by values of $15/ton and $85/ton differs from the reported $312 - $2,196 million.

54
This report is available at no cost from the National Renewable Energy Laboratory (NREL) at www.nrel.gov/publications.
4.1.1 Emissions Rate Approach In our literature review, we identified only one state—Maine—that used a simplified emission rate method to estimate the avoided emissions.
Maine. Maine’s PUC (MPUC) retained London Economics International (LEI) to analyze the costs and benefits of RPS compliance, as required by the state legislature.42 To estimate emissions benefits, LEI used half of the aggregate nameplate capacity of wind generation projects proposed in the ISO New England interconnection queue located in Maine, or 625 MW, to calculate impacts (LEI 2012). LEI calculated avoided emissions by assuming that natural gas-fired generation was displaced by the renewable energy generated under Maine’s RPS. Using U.S. EPA average emission rates for natural gas-fired generation, LEI calculated an annual reduction of 96 tons for SO2, 1,629 tons for NOX, and 1.1 million tons for CO2. The annual monetary value of avoided emissions was calculated at $13 million based on allowance prices of $0.80/ton for SO2 (based on the current forwards), $20/ton for NOX (based on the current forwards), and $12/ton for CO2 (LEI 2012). 4.1.2 Modeling Avoided Emissions Approach Several states have conducted more detailed electric system modeling to understand avoided emissions. The following are examples of this approach.
Connecticut. As part of their IRP for Connecticut, a private consultant and two electric distribution companies used the Day-Ahead Locational Market Clearing Prices Analyzer (DAYZER) model to simulate resource dispatch and measure economic impacts and emission levels for the ISO New England region. The study compared the RPS requirements as of 2010 with lower levels of ISO-wide renewable energy deployment under five scenarios and also varied assumptions regarding natural gas prices, carbon prices, and load growth. Using this methodology, the study found avoided CO2 emissions of between 0.39 tons/MWh and 0.53tons/MWh of renewable generation (The Brattle Group et al. 2010).
Delaware. The electric distribution company Delmarva Power and Light (DPL) used a group of modeling tools to calculate the expected emissions from power plants in the PJM Delmarva zone between 2012 and 2022 as part of its 2012 IRP for Delaware. The study assessed the impact of not only the RPS, but also demand side management programs, energy efficiency programs, and emission controls for coal plants. DPL’s results show a reduction in CO2, SO2, and NOX emissions from power plants of approximately 30%, 66%, and 56%, respectively, from 2012 levels, in 2022 (DPL 2012b). Human health benefits over the 2013-2022 period for Delaware due to the improvements in air quality, including reductions from the transportation and other sectors, were estimated to be between $980 million and $2.2 billion for Delaware, and between $13 and $29 billion for the mid-Atlantic Region. Monetized benefits of improvements in air quality were based on estimates of reduced health effects specifically related to ozone and particulate matter-related morbidity and mortality (e.g., from chronic bronchitis, emergency room visits for asthma). DPL estimated that the health-related costs associated with power plant
42MPUC was tasked with examining direct investment, induced effects, job creation, and other benefits resulting from a diversified electricity generation fleet.

55
This report is available at no cost from the National Renewable Energy Laboratory (NREL) at www.nrel.gov/publications.
emissions in Delaware during the same period ranges between $2.5 and $6.8 billion (DPL 2012b).
Illinois. The Illinois Power Agency (IPA), an independent agency established by the legislature to procure power for the state’s two largest electric utilities to comply with the RPS, prepares an annual report as required by statute that includes RPS compliance status and an analysis of costs and benefits. To assess RPS benefits, IPA hired a private consultant to model the electricity market. The study examines both PJM and MISO markets, both of which operate in Illinois, with and without renewable generation to calculate emission reductions and effects on locational marginal prices (LMP) for calendar year 2011 (an historical rather than prospective analysis). The study used the MarSi model, a software tool developed by GEMS for electricity market simulations. The reduction in emissions directly attributable to renewable energy generation amounted to 5,481,327 tons of CO2 and 4,765 tons of NOX. Using trading values for emission allowances of $10,000/ton of NOX and $5/ton of CO2, IPA calculated a total emission cost reduction of approximately $75 million due to renewable energy generation (IPA 2013).
New York. NYSERDA has examined historical and future emissions reductions as part of its annual RPS performance reports and also within periodic RPS evaluations. In its 2012 historical performance report (covering the 2006-2012 period), NYSERDA found emissions reductions attributable to renewable energy generation of approximately 4,028 tons of NOX, 8,853 tons of SO2, and 4.1 million tons of CO2 (NYSERDA 2013a).
In 2013, NYSERDA completed an historical and forward-looking assessment of the New York RPS Main Tier, as required by the Public Service Commission, focusing on compliance status, direct economic impacts, cost-benefits analyses, and resource availability and costs.43 The study estimated avoided carbon emissions and other electric system impacts using ICF International’s Integrated Planning Model (IPM). The study considered main tier renewable energy projects with signed contracts as of December 31, 2012, referred to as the Current Portfolio. The avoided emissions calculated for the Current Portfolio over the course of the 2002-2037 study period44 were 50.29 million tons of CO2, 278 pounds of mercury, 15,214 tons of NOX, and 14,987 tons of SO2 (NYSERDA 2013b). Using $15/ton and $85/ton as boundaries for the value of avoiding CO2 emissions, NYSERDA estimated a present value between $312 million and $2,196 million. For monetization of health benefits from criteria pollutants, NOX and SO2 were valued at $3,500/ton and $1,100/ton, respectively. A value of $194.5 million/ton was used for mercury. Avoided emissions of NOX, SO2, and mercury were estimated to produce $48 million in health benefits (NYSERDA 2013b).
Ohio. The Public Utilities Commission of Ohio (PUCO) used PROMOD IV, a nodal electricity market simulation tool, to quantify changes in generator emissions that occur as a result of Ohio’s Alternative Energy Portfolio Standard (AEPS). The study examined two scenarios over calendar year 2014. The first scenario considered projects that were operational at the time of the study; the second considered projects that had been approved by the Ohio Power Siting Board,
43 The Main Tier of NY’s RPS includes larger power generation plants in the utility side of the meter and accounts for approximately 92% of the total RPS requirement. 44 This period spans over the life of the systems in the current portfolio.

56
This report is available at no cost from the National Renewable Energy Laboratory (NREL) at www.nrel.gov/publications.
but were not operational. The results for each of these scenarios were compared to a scenario where “no utility-scale renewable resources are developed within Ohio.” CO2 emissions were reduced relative to this no utility-scale renewable resources scenario from 116.36 million metric tons to 116.16 for the first scenario, a change of -0.17% in, and to 115.79 million metric tons, in the second scenario, a change of -0.5% (PUCO 2013c).
Overall, estimates of air quality benefits range from on the order of tens to hundreds of million dollars annually or about $4-$22/MWh of renewable generation, with some studies presenting a wide range of estimates depending on assumptions. Often, the value of CO2 emissions benefits (Table 11) drives the estimates, because of the magnitude of those reductions, compared to reductions of other air pollutants. In order to calculate the estimated monetary impact of avoided CO2 emissions, the tons of avoided CO2 emissions can be multiplied by the value of the CO2. Thus, assumptions regarding the value of CO2 influence results considerably. An interagency assessment of the social cost of carbon found a range from $11 to $89/metric ton of CO2 for the year 2010 (in $2007 dollars) depending on the discount rate used (Interagency Working Group on Social Cost of Carbon 2013). The NYSERDA study used a similar range ($15/ton and $85/ton) for valuing avoided CO2 emissions, while most of the other studies examined used a single estimate of the value of CO2 typically consistent with the lower end of the range (or below) estimates reported by the interagency working group. Maine’s assessment valued CO2 at $12/ton (LEI 2012) and the IPA assessment valued CO2 at $5/ton (IPA 2013).
There are a number of considerations with respect to methods of assessing air emissions impacts that can influence their ability to be compared to incremental costs. In cases where cap and trade policies are in place, renewable energy may not provide emissions reductions from capped pollutants, unless there is a set-aside for renewable energy. At the same time, even in this instance the increased production of emissions-free renewable electricity will reduce the cost of complying with the cap-and-trade program, as proxied by the marginal allowance price. If allowance prices are used to estimate benefits, however, it is important to ensure that they are not already captured in the estimated incremental cost of the renewable energy. Allowance prices should already be embedded in wholesale electricity prices, for example, so if wholesale prices are used in cost calculations, then those estimates should already take into account these impacts. Similarly, if a proxy plant used to calculate the incremental cost of the RPS includes allowance prices or carbon costs, then these emissions impacts are captured in the incremental cost assessment. Another factor that complicates comparison is that often benefits estimates are forward looking, while the incremental costs are based on historical compliance. For these reasons, it is difficult to compare these estimates to the incremental costs discussed earlier; however, treatment of these issues varies from state to state.
4.2 Economic Development Impacts Economic development impacts are also of significant interest in evaluating RPS policies. Often policymakers seek to achieve economic development goals with RPS policies; therefore, these impacts are generally of interest, and in some cases, their quantification is required by the state legislature.
Economic impacts of renewable energy development resulting from an RPS include impacts on the number of jobs, direct investment from construction and operation of facilities, tax revenues, as well as indirect and induced economic impacts, which result from the purchase of goods and

57
This report is available at no cost from the National Renewable Energy Laboratory (NREL) at www.nrel.gov/publications.
services.45 An RPS can also affect electricity prices, which can impact economic activity. One key issue is whether the assessment examines gross impacts (e.g., new jobs supported) versus net impacts that consider shifts in employment. Understanding net impacts associated with the development of new renewable energy projects requires more detailed analysis of changes in the operation of other generating units, fuel usage, utility revenues, electricity prices, and residential and commercial energy expenditures (Steinberg et al. 2011). Many states focus on the boundary of impacts within the state, but in reality, shifts in jobs may occur within the region. Furthermore, some assessments focus on only one particular aspect of the economic impacts.
A variety of methods can be employed to conduct economic assessments; these involve varying degrees of rigor. Simplified methods, which yield estimates of gross impacts, include input-output models or case study approaches often focused on specific renewable energy facilities. Input-output models, the most common method used in gross impact analysis, calculate the direct, indirect, and induced economic impacts by quantifying relationships between sectors in an economy at a point in time, but cannot analyze changes in electricity prices (e.g., IMPLAN, RIMS II). More sophisticated economic modeling tools can also be used to assess net impacts, including: 1) econometric models that assess impacts on the economy; and 2) computable general equilibrium models (CGE models) that examine the flow of goods and services through the economy (see U.S. EPA 2011 for more detail on methods and models available). Table 12 summarizes estimates of the economic impacts of RPS policies for several states.
45 See the RIMS II user’s guide for more in-depth discussion of these components, Bureau of Economic Analysis, Department of Commerce, https://www.bea.gov/regional/pdf/rims/RIMSII_User_Guide.pdf, accessed January 30, 2014.

58
This report is available at no cost from the National Renewable Energy Laboratory (NREL) at www.nrel.gov/publications.
Table 12. Summary of Estimates of RPS Economic Impacts
State Estimated Benefit/Impact
Benefits $/MWh of RE
Period Description Source
CT Negative to positive GSP impact
N/A Through 2020
Modeling showed retail electricity prices increased 0.86% to 3.48%, which reduced gross state product (GSP) 0.01% to 0.03%. One scenario showed an increase in GSP of 0.02%
CEEEP and R/ECON 2011
IL $3003 million* $14/MWh* Construction Construction impact of the 23 largest wind farms installed by 2012
IPA 2013; Loomis 2013
$140 $16/MWh
Annual, during project lifespan
Annual operational impacts from onsite labor, local revenue and induced impacts
IPA 2013; Loomis 2013
ME
$1,140 million $24/MWh Construction 2% increase in GSP LEI 2012
$7.3 million $4/MWh
Annual, during project lifespan
$6.3 million annually in tax revenue for local governments and $1 million of revenue/year for private landowners during the operating life of the projects
LEI 2012
MI $159.8 million N/A Construction Economic impacts of four wind farms built in Michigan
MPSC 2013
NY
$1,252** million $13/MWh Project
lifespan
Present value of the total direct investments in NY during the life of the projects
NYSERDA 2013b
$921 million $9/MWh Project lifespan Cumulative impact on GSP NYSERDA
2013b
OR Not estimated N/A Project lifespan
Estimated jobs resulting from renewable energy projects, based on survey
ODOE 2011
*Illinois benefits estimates converted from $2008 to $2012. Calculations per MWh are estimated assuming a 30% capacity factor and for the construction benefits, spread over generation for a 25-year project life. **New York estimates are in net present value and $2012. 4.2.1 Input-output Models and Simplified Approaches The following states conducted assessments using input-output models, case studies, or anecdotal information on the impacts of particular renewable energy facilities to assess economic impacts. These typically assess gross impacts.
Illinois. In 2012, Illinois State University used the Jobs and Economic Development Impact (JEDI) model,46 an input-output model for estimating gross economic impacts, to estimate the state-level economic impacts of the 23 largest wind farms installed in Illinois at the time of the analysis (Loomis et al. 2013). The results showed that 3,335 MW47 of nameplate wind capacity could support a total economic impact of $5.98 billion over the estimated 25-year life of the 46 The JEDI model was developed by NREL and is publically available at: http://www.nrel.gov/analysis/jedi/. 47 For comparison, Illinois had 3,568 MW of cumulative wind capacity by the end of 2012.
59
This report is available at no cost from the National Renewable Energy Laboratory (NREL) at www.nrel.gov/publications.
projects (IPA 2013). The study also estimated that the projects would support 19,047 full-time equivalent jobs during construction periods with a total payroll of more than $1.1 billion, 814 permanent jobs with an annual payroll of nearly $48 million, $28.5 million in annual property taxes, and $13 million annually in extra income for Illinois landowners who lease their land to wind farm developers (Loomis et al. 2013).
Maine. In addition to assessing emissions benefits, the LEI report for the Maine PUC (see Emissions and Human Health section) quantified the economic impacts of RPS compliance using Maine-specific multipliers from the Regional Input-Output Modeling System (RIMS II), which was developed by the U.S. Bureau of Economic Analysis. LEI used half of the aggregate capacity of the wind projects proposed to be built in Maine, or 625 MW, as an input for the RIMS II model. Assuming an average cost of $2,563/kW for wind generation capital costs and assuming 35% of the total investment, or roughly $560 million, stays in Maine, LEI estimated that the investment supported $1,140 million (2%) in GSP and roughly 11,700 jobs during construction, plus $6.3 million annually in tax revenue for local governments and $1 million of revenue/year for private landowners during the operating life of the projects (LEI 2012). LEI also calculated the potential increase in electricity prices resulting from a higher RPS requirement and REC price and its effect on jobs and Maine’s GSP. LEI used RIMS II multipliers to calculate that a 10% RPS requirement with a REC price of $33/MWh48 would lead to a reduction in GSP of 0.06% and the loss of 129 jobs statewide (LEI 2012).
Michigan. The Michigan Public Service Commission (MPSC) is required by state statute to submit to the legislature an annual report on the implementation of the state’s RPS and its cost-effectiveness, including the impact on employment. In its 2013 report, the MPSC included information on the economic impacts of wind farms owned by two utilities, although no information was provided on the methods used to determine these impacts (MPSC 2013). Consumers Energy reported that the construction of the 100-MW Lake Winds Energy Park wind farm resulted in more than $4 million in direct payments to Michigan vendors, $4.8 million in indirect economic impact, plus more than $1 million in induced impacts. DTE Energy estimated its three wind parks, one constructed per year through 2013, contribute $150 million in total economic benefits to Michigan.
Oregon. Oregon Department of Energy (ODOE), which is required by law to evaluate the impact of the state’s RPS on employment, surveyed Oregon RPS-eligible facilities to assess economic impacts in 2011. Nine of twelve non-solar facilities surveyed reported 82 full-time equivalents employed at the time of the study. Reported salaries ranged between $30,000 and $70,000 for administration jobs, $50,000 to $125,000 for managerial jobs, and $30,000 and $65,000 for O&M jobs (ODOE 2011). In addition, prospective wind facilities of 35 MW or greater anticipated the creation of 6 to 40 permanent operation jobs and between 120 and 475 temporary construction jobs per wind farm. Portland General Electric also provided information about its 450-MW Biglow Canyon wind farm, which employed about 200,000 person hours (about 95 FTEs) during each of the three phases of construction (ODOE 2011).
48 The RPS requirement was 3% and REC price was $24/MWh at the time of the study.

60
This report is available at no cost from the National Renewable Energy Laboratory (NREL) at www.nrel.gov/publications.
4.2.2 Economic Modeling Approach In our review, we identified assessments conducted for the following states using more detailed modeling approaching, including use of econometric models. While these assessments utilized more detailed modeling approaches, in some instances they focused on only one aspect of the economic impacts of the RPS. Connecticut. In 2011 the Center for Energy, Economic, and Environmental Policy (CEEEP) at Rutgers and the Rutgers Economic Advisory Service (R/ECON) employed the R/ECON econometric model, which examines net effects, to show the “direction and magnitude” of the effects that the RPS requirement could have on Connecticut’s economy. The team modeled a comparison scenario to serve as a baseline, in which current RPS requirements continue unchanged until 2020 and REC prices are set to $0. Five additional scenarios consider different REC prices and the job impacts associated with energy efficiency programs and a solar carve-out. In the six scenarios, the study assumed no additional direct jobs would be supported in Connecticut as a result of the RPS outside the solar carve-out considered in one scenario. In four of the five scenarios, retail electricity prices increased between 0.86% and 3.48%, which in turn reduced the GSP between 0.01% and 0.03%. In contrast, the Flat RPS scenario, which is the same as the Comparison scenario (except the RPS is kept flat after 2010), saw an increase in GSP of 0.02%. Price increases also put downward pressure on non-agricultural jobs, creating a loss of 880 to 2,790 jobs across the state. The two scenarios with absolute jobs higher than the Comparison scenario were the Flat RPS (560 jobs) and the Solar Carve-out (130 jobs) scenarios (CEEEP and R/ECON 2011).
New York. In New York, energy suppliers contracted through RPS solicitations are required to report direct economic benefits every three years to demonstrate compliance with the requirement that at least 85% of said benefits accrue to the state. NYSERDA calculated that in-state economic benefits average $27/MWh, in 2012 dollars, for Main Tier projects with contracts as of December 31, 2012, based on data reported by energy suppliers. NYSERDA estimated the present value of the total direct investments in New York during the life of the projects at $1,252 million, compared to an estimated ratepayer cost of $431 million49 (NYSERDA 2013b).
Using REMI’s PI+ model,50 NYSERDA estimated a net increase of 668 direct, indirect, and induced jobs per year during the study period (2002-2037), equivalent to approximately 24,000 job-years, including jobs added, saved, and lost. The cumulative impact on GSP is approximately $921 million (net present value, 2012 dollars). This number includes direct impacts from the construction and O&M of renewable energy plants, a net increase on the percentage of energy produced in-state, wholesale energy price reductions, and net capital and operation costs reductions (NYSERDA 2013b).
Overall, states have estimated economic impacts on the order of hundreds of millions of dollars for the construction period (one-time), and in some cases tens of millions of dollars in annual economic benefits over the project lifetime. These estimates translate to about $22-$30/MWh of renewable generation. One study found that the RPS led to electricity price increases that
49 Present values calculated in 2012 dollars with a 5.5% discount rate. 50 The REMI model is a combination of input-output, computational general equilibrium, and econometric models.

61
This report is available at no cost from the National Renewable Energy Laboratory (NREL) at www.nrel.gov/publications.
reduced gross state product by less than 1%. The methods and assumptions used to conduct assessments vary considerably across states with several states using screening or simplified approaches, while others have used more detailed modeling. For those studies that estimate gross impacts (e.g., jobs supported), an obvious limitation is the lack of consideration of net job impacts and therefore an inability to capture the true economy-wide impact of increased use of renewable energy. Often, the studies evaluated are limited by focusing on only one particular aspect of the economic impacts.
4.3 Wholesale Market Price Impacts Finally, in some cases, studies have attempted to assess reductions in wholesale market prices resulting from additional renewable generation (see Table 13). Renewable generation can depress wholesale market prices by eliminating more expensive generating sources from the dispatch stack, which reduces the market clearing price that is paid to all generators. Dispatch modeling can be used to estimate these impacts by running scenarios with and without the renewable generation on the system. Wholesale price suppression benefits differ from the benefits previously covered in that they pertain to electricity rates and wholesale prices, which could be embedded in cost calculations, depending on methods used.
Table 13. Summary of Estimates of Wholesale Market Price Impacts of Renewables Developed for RPS
State Estimated Benefit
Benefit $/MWh of
RE
Period Description Source
ME $4.5 million $2/MWh 2010
Savings for consumers from reduced electricity prices. Extrapolating from a study by ISO-NE, LEI estimated that 625 MW new wind in Maine would reduce wholesale prices by $0.375/MWh of total Maine retail sales.
LEI 2012
MA $328 million ~$50/MWh 2012
Savings for consumers from reduced wholesale electricity prices.
EOHED and EOEEA 2011
IL $177 million
$26/MWh 2011
Renewable energy lowers wholesale prices, by $1.3/MWh (all generation) due to low operating costs.
IPA 2013
MI N/A N/A 2011 2% decline in wholesale prices attributed to wind generation, net imports, and decrease in load.
Potomac Economics 2012
NY $455 million*
$5/MWh Project lifespan
Savings for consumers from reduced wholesale energy and capacity prices.
NYSERDA 2013b; 2013c
OH Not estimated N/A 2014
Renewable energy lowers wholesale prices by $0.05-$0.17/MWh (all generation).
PUCO 2013c
*Net present value calculation reported in $2012.
Illinois. IPA’s model of the Eastern Interconnection, as described in the Emissions and Human Health section, was also used to calculate wholesale market price reductions. Because wind

62
This report is available at no cost from the National Renewable Energy Laboratory (NREL) at www.nrel.gov/publications.
power does not have fuel costs—it is a zero-marginal cost resource—it can result in reducing wholesale power prices by displacing more expensive generation sources. IPA’s modeling shows an estimated average reduction in LMPs of $1.30/ MWh attributable to renewable energy produced in Illinois in 2011. The model estimates an average LMP of $36.40/MWh when Illinois renewable energy fleet is excluded, and $35.10/MWh when it is included (IPA 2013).
Maine. MPUC’s consultants, LEI, cited an ISO New England study that estimated average clearing prices for different levels of wind penetration installed in the western part of Maine by 2016 (Coste 2011). In a scenario where there were no transmission constraints, 1 GW of wind reduced wholesale prices by about $0.60/MWh. Assuming a linear relationship between cost reductions and added wind capacity, LEI estimated that 625 MW of new wind in Maine would reduce wholesale prices by $0.375/ MWh. Considering annual retail sales of roughly 12,000 GWh and assuming that the savings are passed 100% to retail consumers, LEI calculated annual savings of $4.5 million for ratepayers from reduced electricity prices (LEI 2012).
Massachusetts. At the direction of the state legislature, the executive offices of Housing and Economic Development (EOHED) and Energy and Environmental Affairs (EOEEA) prepared a report in 2011 on the costs and benefits of various policies, including the state’s renewable and alternative portfolio standards. The report notes that there are a number of potential benefits of renewable generation, but bases its calculation primarily on the price suppression benefit resulting from the addition of renewable and alternative energy resources. The study relies on estimates of price suppression effects from the Cape Wind contract proceeding, in which the DPU reviewed estimates provided by various parties. To estimate the RPS benefits, the study assumes price suppression grows linearly in proportion to the amount of renewable energy generation. Using a total benefit value of approximately $50/MWh for the renewable and alternative sources added to the grid each year,51 the report estimates aggregate benefits of $328 million for CY 2012 (EOHED and EOEEA 2011). Michigan. In its 2013 report, the MPSC also included information on wholesale market impacts from wind energy in MISO based on a study by the grid operator. The introduction of the Dispatchable Intermittent Resources (DIR) program in June 2011 allowed wind to participate in MISO’s real-time energy market like other power resources and set market prices of negative $20/MWh on average, due to low marginal operating costs and PTCs (MPSC 2013). The independent market monitor for MISO reported that two-thirds of the 2% decline in energy prices in 2011 was attributable to a decline in average load, increased generation by “intermittent resources”, and an increase in net imports (Potomac Economics 2012).
New York. NYSERDA calculated wholesale price reductions using IPM to model the effect on capacity and energy prices from the addition of renewable energy assets in the Current Portfolio. The average price difference in $/MWh was multiplied by total load levels (adjusted for utilities that self-supply) to estimate consumer savings due to RPS resources. Savings accrue because most load-serving entities in the state have divested of generation resources and procure energy to serve loads from wholesale markets, although wholesale price reduction benefits would not accrue where generation is procured through long-term contracts committed prior to the
51 The number was taken from the Cape Wind contract proceeding (DPU 10-54 Revised RR-DPU-NG-4).
63
This report is available at no cost from the National Renewable Energy Laboratory (NREL) at www.nrel.gov/publications.
development. Total net present value of price suppression benefits were estimated at $455 million over the lifetime of the renewable resources (2002-2037) (NYSERDA 2013b; NYSERDA 2013c).
Ohio. PUCO calculated wholesale price reductions for the two scenarios described in the Emissions and Human Health section. In the first scenario, which considers only those projects that are already operational, wholesale prices are reduced by approximately 0.15%, from $32.25 /MWh to $32.20/MWh. In the second scenario, which considers all approved projects, wholesale prices are reduced by approximately 0.51%, from $32.25/MWh to $32.08/ MWh (PUCO 2013c).
While the studies summarized here show estimated reductions in wholesale electricity prices on the order of about $1/MWh or less, the impact on overall reduced costs to consumers can be large since the price suppression effect in any given hour is applied to the entire demand in that hour. Estimates presented above represent price suppression benefits of about $2-$50/MWh of renewable generation. Typically, these wholesale price estimates have been derived through modeling of the electricity system. One difficulty in directly comparing these estimates to costs is that wholesale price suppression is a short term effect that could change over time with changing market conditions. In addition, these estimates focus on energy prices, but do not attempt to assess capacity-related impacts or the need for new transmission or infrastructure investments that may be required with renewable generation. Another consideration is that while consumers benefit from lower wholesale market prices, the reductions represent transfer payments from generators to consumers.

64
This report is available at no cost from the National Renewable Energy Laboratory (NREL) at www.nrel.gov/publications.
5 Conclusion This report surveys and summarizes existing state-level RPS cost and benefit estimates and examines the various methods used to calculate such estimates. The report relies largely upon data or results reported directly by electric utilities and state regulators. As such, the estimated costs and benefits itemized in this document do not result from the application of a standardized approach or the use of a consistent set of underlying assumptions.
The report summarizes state-level RPS costs to date and considers how those costs may evolve going forward, given scheduled increases in RPS targets and cost containment mechanisms incorporated into existing policies. The report also summarizes RPS benefits estimates, based on published studies for individual states, and discusses key methodological considerations. These estimates, for example of the social value of carbon emissions reduction and the human health impacts of reduced air emissions, are based on a variety of methodologies and assumptions. In comparison to the summary of estimated RPS costs, the summary of RPS benefits is more limited, as relatively few states have undertaken detailed benefits estimates. Further, for those states that have estimated RPS benefits, most assess only a limited number of impact types; as a consequence, some types of benefits are not reflected in this report.
This survey of RPS costs and benefit estimates across states finds that in the most recent year with data available, costs were estimated to be equivalent to less than 2% of retail rates in 17 states, with 10 of these states having estimated costs equivalent to less than 1% of retail rates. The remaining 8 states have costs that are estimated to be equivalent to 2% to 4% of retail rates, averaging the two estimates for California. A limited number of states have developed quantitative benefits estimates, which vary widely in both methodology and magnitude. Benefits estimates have been most commonly developed for avoided emissions and associated air quality improvements, economic development, and wholesale electricity price suppression effects. Because the reported cost and benefit values may differ from those derived through a more consistent analytical treatment, we do not provide an aggregate national estimate of RPS costs and benefits, nor do we attempt to quantify net RPS benefits at national or state levels.
Estimates of costs are limited by available data and the wide variety of methods and assumptions employed. This analysis focuses on comparing estimated incremental costs, which are most appropriate for assessing RPS policy because they net out costs that would otherwise have been incurred to serve loads if the RPS did not exist, such as the need for other forms of generation. We use a standardized method to derive incremental costs in restructured markets based on REC prices, ACP levels, and compliance obligations. Key limitations of this method include omission of other potential policy costs, a lack of REC price transparency, and incomplete data on long term contracts. While REC prices reflect compliance costs, they do not necessarily reflect the cost of renewable technology deployment because they can be strongly influenced by market supply and demand conditions. In regulated states, comparisons of costs are complicated by our reliance on estimates produced by utilities and regulators, who utilize a wide variety of methods and assumptions.
The primary methods used in regulated states for estimating incremental RPS costs are: 1) to compare the cost of renewable generation to that of a proxy generator (a plant type that is most likely to be displaced by the renewable generation); 2) to compare to wholesale electricity

65
This report is available at no cost from the National Renewable Energy Laboratory (NREL) at www.nrel.gov/publications.
market prices; or 3) to conduct electric system modeling with and without the renewable generation. While the modeling approach can provide a more detailed estimate of the resource mix if an RPS were not implemented, assumptions for inputs can significantly influence results. Simplified proxy methods may provide useful perspective on costs, but yield less comprehensive results. In various approaches, assumptions regarding plant lifetime and methods of annualizing costs are important considerations that can significantly affect estimates. The inclusion of costs associated with pre-RPS renewables can lead to overestimates of RPS costs while inclusion of efficiency and indirect expenditures may make it challenging to directly assess costs resulting from the addition of new renewable generation.
Despite differences and uncertainties in cost methodologies, RPS costs are typically bounded by the presence of policy mechanisms to cap costs. Most states have a way to contain RPS costs, typically through either a cap, based on either retail electricity rates or revenue requirements, or by allowing ACPs. Estimated incremental RPS costs in most states are well below the respective cost caps, although a few states are currently operating at or near them.
RPS costs can be considered in the context of policy benefits, although again there are limitations in the ability to compare estimates. While RPS policies have the potential to offer a variety of environmental and social benefits, often only a few types of benefits have been quantified. States have most commonly attempted to estimate avoided emissions and associated human health benefits, economic development impacts, and savings associated with reductions in wholesale electricity prices; in many cases, these assessments have been required by the legislature or PUC. In some cases, the same impacts may be captured in the assessment of incremental costs. In addition, methodologies and level of rigor vary widely, making comparisons challenging.
Going forward, more could be done to comprehensively assess the costs and benefits of state RPS policies. Instead of looking separately at incremental costs and benefits, future analysis could compare costs and benefits directly within and among states, using a consistent methodology and level of rigor.
In addition to more comprehensive analysis of cost and benefits, additional work could be done to standardize incremental cost calculations within and among states, given that incremental cost calculations are often required by RPS statutes. Efforts within a few states are underway to address standardization of incremental cost calculations; states that have not examined standardization may see the issue arise in the future and be able to learn from the processes and outcomes of existing state standardization efforts.
States in restructured markets may find it beneficial to promote REC price transparency, particularly as those markets move towards greater use of long-term contracting. REC price transparency could be encouraged by requiring RPS-obligated entities to report REC prices on a confidential basis to the PUC; prices could then be publically reported only on an aggregated basis.

66
This report is available at no cost from the National Renewable Energy Laboratory (NREL) at www.nrel.gov/publications.
References Ailworth, E. (2013). “Suddenly, Wind Is Competitive with Conventional Power Sources.” BostonGlobe.com. Accessed December 4, 2013: http://www.bostonglobe.com/business/2013/09/22/suddenly-wind-competitive-with-conventional-power-sources/g3RBhfV440kJwC6UyVCjhI/story.html.
Alpena Power Company (Alpena). (2011). “Renewable Energy Annual Report for 2010.”
Alpena. (2012). “Renewable Energy Annual Report for 2011.”
Alpena. (2013). “Renewable Energy Annual Report for 2012.”
Ameren Missouri. (2013a). Renewable Energy Standard Compliance Report: 2012. Prepared in compliance with 4 CSR 240-20.100. April 15. http://psc.mo.gov/CMSInternetData/Electric/Renewable%20Energy/2012%20Reports/2012%20Ameren%20Missouri%20Renewable%20Energy%20Standard%20Compliance%20Report.pdf.
Ameren Missouri. (2013b). Renewable Energy Standard Compliance Plan: 2013-2015. Prepared in Compliance with 4 CSR 240-20.100. May 28, 2013.
Anderson, A.; White, S.; Gibson, B.; Hagedorn, L. (2012) . “The Economic Benefits of Kansas Wind Energy.” Polsinelli Shugart and Kansas Energy Information Network. Accessed February 2014: http://sftp.polsinelli.com/files/upload/StudyKansasWind2012.pdf.
Arizona Corporate Commission (ACC). (2012a). Decision No. 72737. In the Matter of Arizona Public Service Company – Approval of its 2012 Renewable Energy Standard Implementation Plan and Request for Reset of Renewable Energy Adjustor. January 18, 2012.
ACC. (2012b). Decision No. 72736. In the Matter of Tucson Electric Power Company – Application for Approval of its 2012 Renewable Energy Standard and Tariff Implementation Plan. January 13, 2012.
ACC. (2012c). Decision No. 72738. In the Matter of UNS Electric, Inc. Application for Approval of its 2012 Renewable Energy Standard and Tariff Implementation Plan. January 18, 2012.
Arizona Public Service Company (APS). (2011). “2010 Renewable Energy Standard Compliance Report.”
APS. (2012). “2011 Renewable Energy Standard Compliance Report.”
APS. (2013). “2012 Renewable Energy Standard Compliance Report.” http://www.pinnaclewest.com/files/ehs/2012/APS_RES_Compliance_Report_2012.pdf.
Avista Corporation. (2013). “Renewable Target Compliance Report of Avista Corporation.” Filed with Washington State Utilities and Transportation Commission, May 31, 2013.
Bird, L., Chapman, C., Logan, J., Sumner, J., & Short, W. (2011). Evaluating renewable portfolio standards and carbon cap scenarios in the U.S. electric sector. Energy Policy, 39(5), 2573–2585. doi:10.1016/j.enpol.2011.02.025
Black Hills/Colorado Electric Utility Company. (2013). “2012 Renewable Energy Compliance Report.”

67
This report is available at no cost from the National Renewable Energy Laboratory (NREL) at www.nrel.gov/publications.
The Brattle Group, Connecticut Light & Power, and The United Illuminating Company. (2010). “Integrated Resource Plan for Connecticut.” http://www.ct.gov/deep/lib/deep/air/ozone/ozoneplanningefforts/att-c.pdf.
California Public Utilities Commission (CPUC). (2009). 33% Renewables Portfolio Standard: Implementation Analysis Preliminary Results.
CPUC. (2011). “Market Price Referent (MPR).” http://www.cpuc.ca.gov/PUC/energy/Renewables/mpr.
CPUC. (2013a). “Report to the Legislature in Compliance with Public Utilities Code Section 910.” http://www.cpuc.ca.gov/NR/rdonlyres/53A5AE33-0954-4342-B8F2-1A04F67DFFB6/0/Section910Report.pdf.
CPUC. (2013b). Administrative Law Judge’s Ruling Requesting Comments on Staff Proposal for a Methodology to Implement Procurement Expenditure Limitations for the Renewables Portfolio Standard Program, Rulemaking 11-05-005, Filed July 23, 1013. http://docs.cpuc.ca.gov/PublishedDocs/Efile/G000/M073/K350/73350639.PDF.
CPUC. (2014). Administrative Law Judge’s Ruling Revising Schedule for Filings to Develop a Procurement Expenditure Limitation for the California Renewables Portfolio Standard, Rulemaking 11-05-005, Filed January 29. Caperton, R. (2012). “Renewable Energy Standards Deliver Affordable, Clean Power; Right-Wing Attacks on These Standards Are Misguided.” Center for American Progress. April 11.
Center for Energy, Economic, and Environmental Policy (CEEEP), and Rutgers Economic Advisory Service (R/ECON). (2011). “A Review of Connecticut’s Renewable Portfolio Standards.” http://www.ctenergy.org/pdf/RPSFINAL.pdf.
Center for the New Energy Economy (CNEE). (2012). “State Renewable Portfolio Standards Hold Steady or Expand in 2013 Session.” http://www.aeltracker.org/graphics/uploads/2013-State-By-State-RPS-Analysis.pdf.
Chen, C.; Wiser, R.; Bolinger, M. (2007). “Weighing the Costs and Benefits of State Renewables Portfolio Standards: A Comparative Analysis of State-Level Policy Impact Projections.” LBNL-61590. Berkeley, CA: Lawrence Berkeley National Laboratory.
The Cleveland Electric Illuminating Company. (2011). “Revised Tariff PUCO No. 13 Changes to Riders AER, DRR, DUN, LEX, PUR and NDU.”
Climate Policy Institute (CPI). (2012). “Limiting the Cost of Renewables: Lessons for California.” http://climatepolicyinitiative.org/wp-content/uploads/2012/06/Limiting-the-Cost-of-Renewables-Lessons-for-California.pdf.
Colorado Public Utilities Commission (CO PUC). (2013). “Colorado Renewable Energy Standard.” http://cdn.colorado.gov/cs/Satellite?blobcol=urldata&blobheadername1=Content-Disposition&blobheadername2=Content-Type&blobheadervalue1=inline%3B+filename%3D%22Legislative+Brief+-+Renewable+Energy+Standard+Issues+%26+Topics.pdf%22&blobheadervalue2=application%2Fpdf&blobkey=id&blobtable=MungoBlobs&blobwhere=1251850255390&ssbinary=true.

68
This report is available at no cost from the National Renewable Energy Laboratory (NREL) at www.nrel.gov/publications.
Connecticut Public Utilities Regulatory Authority (CT PURA). (2013). Decision Docket No. 11-09-03, November 21, 2013.
Consumers Energy Company (Consumers). (2009). “Direct Testimony of Hubert W. Miller III on Behalf of Consumers Energy Company.” Case Nos. U-15805 and U-15889. February.
Consumers. (2011). “Consumers Energy Company’s 2010 Renewable Energy Annual Report.”
Consumers. (2012). “Consumers Energy Company’s 2011 Renewable Energy Annual Report.”
Consumers. (2013a). “Consumers Energy Company’s 2012 Renewable Energy Annual Report.”
Consumers. (2013b). Application of Consumers Energy Company for Biennial review of its Renewable Energy Plan. May 28, 2013.
Consumers. (2013c). “Application for Approval of 2013 Amended Renewable Energy Plan and Proof of Service.” http://efile.mpsc.state.mi.us/efile/docs/17301/0057.pdf
Consumers Energy, DTE Energy, and MEGA. (2012). “Joint Response from Consumers Energy, DTE Energy, and MEGA.”
Cory, K.S.; Swezey, B.G. (2007). “Renewable Portfolio Standards in the States: Balancing Goals and Rules.” The Electricity Journal 20 (4); pp. 21–32. Accessed February 2014: http://www.sciencedirect.com/science/article/pii/S1040619007000358.
Coste, W. (2011). “2011 Economic Study Update.” ISO-NE Planning Advisory Committee.
Database of State Incentives for Renewables & Efficiency (DSIRE). (2013). “Renewables Energy Standard.” Accessed February 2014: http://www.dsireusa.org/incentives/index.cfm?EE=1&RE=1&SPV=0&ST=0&searchtype=RPS&sh=1.
DSIRE. (2013). “Delaware Renewables Portfolio Standard.” DSIRE USA. Accessed February 2014: http://www.dsireusa.org/incentives/incentive.cfm?Incentive_Code=DE06R.
Dayton Power & Light Company (DP&L). (2011). “Second Amended Application of the Dayton Power and Light Company to Update its Alternative Energy Rider.”
Delaware Department of Natural Resources and Environmental Control (DE DNREC). (2013). Proposed Register Notice SAN #2012-03: 102 Implementation of Renewable Energy Portfolio Standards Cost Cap Provision. Accessed March 2014: http://regulations.delaware.gov/register/december2013/proposed/17%20DE%20Reg%20600%2012-01-13.htm.
Delmarva Power & Light Company (DPL). (2012a). Delaware Electric Renewable Portfolio Compliance Rate (RPCR) Table. Accessed February 2014: http://www.delmarva.com/_res/documents/rpcr_table-qfcp_rate.pdf
DPL. (2012b). “2012 Integrated Resource Plan.” Accessed February 2014: http://depsc.delaware.gov/electric/12-544%202012%20IRP.pdf.

69
This report is available at no cost from the National Renewable Energy Laboratory (NREL) at www.nrel.gov/publications.
Detroit Edison (DTE). (2009). “Detroit Edison’s Renewable Energy Plan Testimony & Exhibits (revised).” Case No. U-15806-RPS. March 6.
DTE. (2011). “The Detroit Edison Company Renewable Energy Plan Annual Report for 2010.”
DTE. (2012). “The Detroit Edison Company Renewable Energy Plan Annual Report for 2011.”
DTE. (2013a). “DTE Electric Company’s 2012 Renewable Energy Annual Report,” August 30, 2013.
DTE. (2013b). DTE Electric Company’s Application for Biennial Review and Approval of Its Amended Renewable Energy Plan. June 3, 2013.
Dominion North Carolina Power. (2012). “North Carolina 2012 REPS Compliance Report of Dominion North Carolina Power for Calendar Year 2011.”
Dominion North Carolina Power. (2013). “North Carolina 2013 REPS Compliance Report of Dominion North Carolina Power for Calendar Year 2012.”
Duke Energy. (2010). “Duke Energy Carolinas’ Initial Statement. In the Matter of Biennial Determination of Avoided Cost Rates for Electric Utility Purchases from Qualifying Facilities – 2010. Docket No. E-100, Sub 127. Filed Nov 1.
Duke Energy Carolinas. (2012). “Duke Energy Carolinas’ REPS Cost Recovery Rider and 2011 REPS Compliance Report.”
Duke Energy Carolinas. (2013). “Duke Energy Carolinas’ REPS Cost Recovery Rider and 2012 REPS Compliance Report.”
U.S. Energy Information Administration (EIA). (2013). “Electric Power Annual, Detailed State Data.” Accessed February 2014: http://www.eia.gov/electricity/data/state
Executive Office of Housing and Economic Development (EOHED) and Executive Office of Energy and Environmental Affairs (EOEEA). 2011. “Recent Electricity Market Reforms in Massachusetts: A Report of Benefits and Costs.” Accessed February 2014: http://www.mass.gov/eea/docs/doer/publications/electricity-report-jul12-2011.pdf.
Electric Reliability Council of Texas (ERCOT). (2012). “ERCOT’s 2011 Report on the Texas Renewable Energy Credit Trading Program.”
ERCOT. (2013). “ERCOT’s 2012 Report on the Texas Renewable Energy Credit Trading Program.”
ERCOT (2014). Annual Renewable Energy Generation. https://www.texasrenewables.com/publicReports/rpt8.asp.
Engblom, A. (2013). “Michigan Could Triple RPS without Breaking Cost Caps, State Report Concludes.” Accessed February 2014: http://www.snl.com/InteractiveX/article.aspx?id=25724794&KPLT=4.
Fischer, C. (2010). Renewable Portfolio Standards: When Do They Lower Energy Prices? Energy Journal, 31(1), 101–119.
Great River Energy. (2011). “Initial RES Rate Impact Report,” Minnesota Public Utilities Commission Docket No. E-999/CI-11-852, October 25, 2011.

70
This report is available at no cost from the National Renewable Energy Laboratory (NREL) at www.nrel.gov/publications.
GreenCo Solutions, Inc. (2012). “2011 RPS Compliance Report.”
Halifax Electric Membership Corporation. (2013). “Annual REPS Compliance Report for 2012.”
Haugen, D. (2011). “Are Renewable Standards Driving up Utility Rates?” Midwest Energy News. Accessed February 2014: http://www.midwestenergynews.com/2011/05/17/are-renewable-standards-driving-up-utility-rates/.
Hawaiian Electric Company (HECO). (2012). “2012 Renewable Portfolio Standard Status Report.” Accessed February 2014: http://puc.hawaii.gov/wp-content/uploads/2013/07/RPS-HECO-2012.pdf.
Hawaii Public Utilities Commission (HPUC). (2012). “Public Utilities Commission, State of Hawaii Annual Report.” Accessed February 2014: http://puc.hawaii.gov/wp-content/uploads/2013/04/PUC-Annual-Report-Fiscal-Year-2011-12.pdf.
Heeter, J.; Bird, L. (2013). “Including Alternative Resources in State Renewable Portfolio Standards: Current Design and Implementation Experience.” Energy Policy (61); pp. 1388-1399. NREL/JA-6A20-59126. http://dx.doi.org/10.1016/j.enpol.2013.05.067.
Heeter, J.; Bird, L. (2011). “Status and Trends in U.S. Compliance and Voluntary Renewable Energy Certificate Markets (2010 Data).” NREL/TP-6A20-52925. Golden, CO: NREL, http://www.nrel.gov/docs/fy12osti/52925.pdf.
Illinois Power Agency (IPA). (2010). “Order: Petition for Approval of Procurement Plan.” 10-0563. December 21.
Interagency Working Group on Social Cost of Carbon (2013). Technical Support Document: - Technical Update of the Social Cost of Carbon for Regulatory Impact Analysis - Under Executive Order 12866, May 2013 (revised November 2013). http://www.whitehouse.gov/sites/default/files/omb/assets/inforeg/technical-update-social-cost-of-carbon-for-regulator-impact-analysis.pdf IPA. (2011). “2012 Power Procurement Plan.” Accessed February 2014: http://www2.illinois.gov/ipa/Documents/IPA_2012_Procurement_Plan_Conforming_to_ICC_Order_in_DKT_11-0660.pdf.
IPA. (2013). “2013 Annual Report: The Costs and Benefits of Renewable Resource Procurement in Illinois Under the Illinois Power Agency and Illinois Public Utilities Acts.” http://www2.illinois.gov/ipa/Documents/201304-IPA-Renewables-Report.pdf.
Kansas City Power & Light (KCPL). (2012). 2011 Renewable Energy Standard Compliance Report. Prepared in Compliance with 4 CSR 240-20.100. April 15, 2012.
KCPL. (2013). 2012 Renewable Energy Standard Compliance Report. Prepared in Compliance with 4 CSR 240-20.100. May 28, 2013.
Kansas City Power & Light Greater Missouri Operations (KCPL GMO). (2012). 2011 Renewable Energy Standard Compliance Report. Prepared in Compliance with 4 CSR 240-20.100. April 15, 2012.
KCPL GMO. (2013). 2012 Renewable Energy Standard Compliance Report. Prepared in Compliance with 4 CSR 240-20.100. May 28, 2013.

71
This report is available at no cost from the National Renewable Energy Laboratory (NREL) at www.nrel.gov/publications.
Kansas Corporation Commission (KCC). (2013). Retail Rate Impact Report. Docket No. 13-GIME-391-GIE. March 5.
Kansas Electric Power Cooperative (KEPCo). (2013). “Update Of Kansas Electric Power Cooperative, Inc.” Kansas Corporation Commission. Docket No. 13-GIME-391-GIE. Received Jan 16.
Kauai Island Utility Cooperative (KIUC). (2012). “Kauai Island Utility Cooperative Renewable Portfolio Standards (RPS) Status Report.” Accessed February 2014: http://puc.hawaii.gov/wp-content/uploads/2013/07/RPS-KIUC-2012.pdf.
Leon, W. (2012). Evaluating the Benefits and Costs of a Renewable Portfolio Standard: A Guide for States. Prepared by the Clean Energy Group, Montpellier, Vermont. Accessed February 2014: http://www.cleanenergystates.org/assets/2012-Files/RPS/CESA-RPS-evaluation-report-final-5-22-12.pdf.
London Economics International LLC (LEI). (2012). “MPUC RPS Report 2011 - Review of RPS Requirements and Compliance in Maine”. Maine Public Utilities Commission. Accessed February 2014: http://www.maine.gov/tools/whatsnew/attach.php?id=349454&an=1.
Loomis, D.; Hayden, J.; Noll, S. (2013). “Economic Impact, Wind Energy Development in Illinois”. Center for Renewable Energy, Illinois State University. Accessed February 2014: http://renewableenergy.illinoisstate.edu/downloads/publications/2012EconomicImpactReportForWeb.pdf.
Maine Public Utilities Commission (ME PUC). (2012). “Annual Report on New Renewable Resource Portfolio Requirement,” Presented to the Joint Standing Committee on Energy, Utilities, and Technology.
ME PUC. (2013). “Annual Report on New Renewable Resource Portfolio Requirement,” Presented to the Joint Standing Committee on Energy, Utilities, and Technology. March 31, 2013.
Maggio, D.J. (2012). “Impacts of Wind-Powered Generation Resource Integration on Prices in the ERCOT Nodal Market.” In 2012 IEEE Power and Energy Society General Meeting, 1–4, doi:10.1109/PESGM.2012.6344611.
Massachusetts Department of Energy Resources (DOER). (2012a). “Massachusetts RPS & APS Annual Compliance Report for 2010.”
Massachusetts DOER. (2012b). “Evaluation of the Massachusetts RPS Class II Program: Market Analysis, Reliance on ACP Mechanism, and Policy Recommendations.” Massachusetts Department of Energy Resources, Accessed February 2014: http://www.mass.gov/eea/docs/doer/pub-info/rps-class-2-evaluation.pdf.
Massachusetts DOER, Executive Office of Energy & Environmental Affairs, and Commonwealth of Massachusetts. (2013a). “Massachusetts RPS & APS Annual Compliance Report for 2011.” Accessed February 2014: http://www.mass.gov/eea/docs/doer/rps-aps/rps-aps-2011-annual-compliance-report.pdf.
Massachusetts DOER. (2013b). “Alternative Compliance Payment Rates.” Accessed February 2014: http://www.mass.gov/eea/energy-utilities-clean-tech/renewable-energy/rps-aps/retail-electric-supplier-compliance/alternative-compliance-payment-rates.html.

72
This report is available at no cost from the National Renewable Energy Laboratory (NREL) at www.nrel.gov/publications.
Michigan Public Service Commission (MPSC). (2013). “Report on the Implementation of the P.A. 295 Renewable Energy Standard and the Cost-Effectiveness of the Energy Standards.” Accessed February 2014: http://www.michigan.gov/documents/mpsc/implementation_of_PA295_renewable_energy_411615_7.pdf
Mills, A.; Wiser, R.; Porter, K. (2012). “The Cost of Transmission for Wind Energy: A Review of Transmission Planning Studies.” Renewable and Sustainable Energy Reviews 16 (1); pp. 1–19.
Minnesota Power. (2011). “Renewable Energy Cost Impact Report.” Minnesota Public Utilities Commission Docket No. E-999/CI-11-852, October 25, 2011.
Minnesota Public Utilities Commission (MN PUC). (2013). Notice of Comment Period on Cost Impact Reports. November 6. Docket E-999/CI-11-852. Accessed February 2014: https://www.edockets.state.mn.us/EFiling/edockets/searchDocuments.do?method=showPoup&documentId={7F395491-972D-4BA1-B6BA-5927A4F40C60}&documentTitle=201311-93396-01
Minnkota Power. (2011). “Renewable Energy Cost Impact Report.” Minnesota Public Utilities Commission Docket No. E-999/CI-11-852, October 25, 2011.
Missouri Code of Standard Regulations (CSR). 240-20.100(5): Electric Utility Renewable Energy Standard Requirements.
Missouri River Energy Services. (2011). “Renewable Energy Cost Impact Report.” Minnesota Public Utilities Commission Docket No. E-999/CI-11-852, October 19, 2011.
Minnesota Municipal Power Agency (MMPA). (2011). “Renewable Energy Cost Impact Report,” Minnesota Public Utilities Commission Docket No. E-999/CI-11-852, October 24, 2011.
Minnesota Statutes. 216B.1691: Renewable Energy Objectives, Subdivision 2e: Rate impact of standard compliance; report.
Montana Public Service Commission (MT PSC). (2012). “Montana 2011 RPS Compliance Summary”. N2012.1.1. http://psc.mt.gov/Docs/ElectronicDocuments/pdfFiles/N2012-1-1_IN_20121219_RPSComplianceSummary.pdf.
Morey, M.J.; Kirsch, L.D. (2014). Retail rate impacts of state and federal electric utility policies. The Electricity Journal. 26(3), 35-49. http://dx.doi.org/10.1016/j.tej.2013.03.001
New Hampshire Public Utilities Commission (NHPUC). (2011a). “Annual RPS Compliance Report for 2010.”
NHPUC. (2011b). “2011 Renewable Energy Portfolio Standard Review.” Accessed February 2014: http://www.puc.state.nh.us/sustainable%20Energy/RPS/RPS%20Review%202011.pdf.
NHPUC. (2012). “Annual RPS Compliance Report for 2011.”
NHPUC. (2013). “Annual RPS Compliance Report for 2012”. Concord, NH. Accessed November 26, 2013: http://www.puc.nh.gov/Sustainable%20Energy/Electric%20Renewable%20Portfolio%20Standard%20Program/2012%20Annual%20RPS%20Compliance%20Report.pdf.

73
This report is available at no cost from the National Renewable Energy Laboratory (NREL) at www.nrel.gov/publications.
New Jersey Board of Public Utilities (NJ BPU). (2011). New Jersey’s Renewable Portfolio Standard Rules, 2010 Annual Report. Accessed February 2014: http://www.njcleanenergy.com/files/file/Final_2010_Annual_Report_for_New_Jersey_RPS.pdf.
New Mexico Public Regulation Commission (NM PRC) (2013a). Final order amending rule 17.9.572 NMAC: Renewable energy for electric utilities, Case No. 13-00152-UT.
NM PRC. (2013b). Final order on recommended decision. Case No. 13-00233-UT.
New Mexico Independent Power Producers (NMIPP). (2013). Motion for rehearing of final orders, in the matter of amending rule 17.9.275 NMAC: Renewable energy for electric utilities, Case No. 13-00152-UT.
NM PRC (2011). Final order adopting amended certification of stipulation. Case No. 10-00395-UT. Accessed February 2014: http://164.64.85.108/infodocs/2011/12/PRS20168559DOC.PDF.
New York State Energy Research and Development Authority (NYSERDA). (2011). “The New York State Renewable Portfolio Standard Performance Report: Program Period December 31, 2010.”
NYSERDA. (2012). “The New York State Renewable Portfolio Standard Performance Report through December 31, 2011.”
NYSERDA. (2013a). “The New York State Renewable Portfolio Standard Performance Report, Through December 31, 2012.” Accessed February 2014: http://www.nyserda.ny.gov/Publications/Program-Planning-Status-and-Evaluation-Reports/-/media/Files/Publications/PPSER/NYSERDA/2013-rps-report.pdf.
NYSERDA. (2013b). “NYSERDA Renewable Portfolio Standard Main Tier 2013 Program Review, Volume 2 — Main Tier Current Portfolio Analysis”. Albany, NY.
NYSERDA. (2013c). “NYSERDA Renewable Portfolio Standard Main Tier 2013 Program Review, Volume 1 — Main Tier Current Portfolio Analysis.” Albany, NY. http://www.nyserda.ny.gov/Publications/Program-Planning-Status-and-Evaluation-Reports/-/media/Files/EDPPP/Energy-and-Environmental-Markets/RPS/RPS-Documents/2013/2013-RPS-volume-1.pdf.
New York State Public Service Commission (NY PSC). (2014). “Effective Electric Tariff Documents.” Accessed February 2014: https://www2.dps.ny.gov/ETS/search/searchShortcutEffective.cfm?serviceType=ELECTRIC
North Carolina Public Utilities Commission (NC PUC). (2012). “Annual Report Regarding Renewable Energy and Energy Efficiency Portfolio Standard in North Carolina.”
NC PUC. (2013). Docket No. E-100, Sub 113, November 27, 2013. Public Staff’s Order Modifying the Poultry and Swine Waste Set-Aside Requirements and Granting Other Relief.
North Carolina Eastern Municipal Power Agency (NCEMPA). (2011). “2010 REPS Compliance Report.”
NCEMPA. (2012). “REPS Compliance Report for Calendar Year 2011.”
NCEMPA. (2013). “REPS Compliance Report for Calendar Year 2012.”

74
This report is available at no cost from the National Renewable Energy Laboratory (NREL) at www.nrel.gov/publications.
North Carolina Municipal Power Agency 1 (NCMPA1). (2011). “2010 REPS Compliance Report.”
NCMPA1. (2012). “REPS Compliance Report for Calendar Year 2011.”
NCMPA1. (2013). “REPS Compliance Report for Calendar Year 2012.”
North Carolina General Statutes (G.S.). 62-133.8(h): Cost Recovery and Customer Charges.
NV Energy. (2012). “IRP supply side plan, transmission plan, economic analysis and financial plan.” Accessed February 2014: https://www.nvenergy.com/company/rates/filings/IRP/NPC_IRP/images/Vol_16.pdf.
NV Energy. (2013). “Renewable Portfolio Standard Annual Report.”
Ohio Edison. (2011). “Revised Tariff PUCO No. 11 Change to Riders AER, DRR, DUN, LEX, PUR and NDU.”
Oregon Administrative Rules (OAR). 860-083-0100(1)(i): Incremental Costs.
Oregon Department of Energy (ODOE). (2011). “Employment Assessment of the Oregon RPS.” Accessed February 2014: http://www.oregon.gov/energy/docs/general/2011RPSAssessment.pdf.
Oregon Administrative Rules (OAR). 860-083-0100: Incremental Costs.
Otter Tail Power Company (Otter Tail). (2011). “Renewable Energy Cost Impact Report,” Minnesota Public Utilities Commission Docket No. E-999/CI-11-852, October 24, 2011.
Pacific Power. (2011). “PacificCorp’s Renewable Portfolio Standard Implementation Plan (2013-2017).” Accessed February 2014: https://www.pacificpower.net/content/dam/pacific_power/doc/About_Us/Rates_Regulation/Oregon/OR_RPS_Implementation_Plan_2013-2017_12-30-11.pdf.
Pacific Power. (2012). “PacifiCorp’s Renewable Portfolio Standard Oregon Compliance Report for 2011.”
Pacific Power. (2013a). “PacifiCorp Renewable Report Washington,” Filed with Washington State Utilities and Transportation Commission, May 31, 2013.
Pacific Power. (2013b). “PacifiCorp’s Renewable Portfolio Standard Oregon Compliance Report for 2012.”
Pennsylvania Public Utility Commission (PPUC). (2012). “2011 Annual Report Alternative Energy Portfolio Standards Act of 2004.” Harrisburg, PA.
PPUC. (2013). “2012 Annual Report Alternative Energy Portfolio Standards Act of 2004.” Harrisburg, PA. Accessed February 2014: http://www.puc.pa.gov/electric/pdf/AEPS/AEPS_Ann_Rpt_2012.pdf.
Portland General Electric (PGE). (2011). “PGE 2011 Renewable Portfolio Standard Implementation Plan.” Accessed February 2014: http://www.oregon.gov/energy/RENEW/RPS/docs/PGE_2011_RPS_Implementation_Plan.pdf.
PGE. (2012). “PGE 2011 Renewable Portfolio Standard Compliance Report.” June 1, 2012.

75
This report is available at no cost from the National Renewable Energy Laboratory (NREL) at www.nrel.gov/publications.
PGE. (2013). “PGE 2012 Renewable Portfolio Standard Compliance Report.” June 1, 2013.
Potomac Economics. (2012). “2011 State of the Market Report for the MISO Electricity Markets.” Accessed February 2014: http://www.potomaceconomics.com/uploads/midwest_reports/2011_SOM_Report.pdf.
Progress Energy Carolinas. (2011). “Renewable Energy and Energy Efficiency Portfolio Standard (“REPS”) Compliance Report.”
Progress Energy Carolinas. (2012). “Renewable Energy and Energy Efficiency Portfolio Standard (“REPS”) Compliance Report.”
Public Service Commission of the District of Columbia (DC PSC). (2012a). “Public Service Commission of the District of Columbia Notice of Final Rulemaking.” Accessed February 2014: http://www.dcpsc.org/pdf_files/commorders/dcmr15/Chapter29.pdf.
DC PSC. (2012b). “2012 Report on the Renewable Energy Portfolio Standard,” March 29, 2012.
DC PSC. (2013). “2013 Report on the Renewable Energy Portfolio Standard,” April 1, 2013.
Public Service Commission of Maryland (PSCM). (2013). “Renewable Energy Portfolio Standard Report, with Data for Compliance Year 2011”. Baltimore, MD. Accessed February 2014: http://webapp.psc.state.md.us/intranet/Reports/2013%20Renewable%20Energy%20Portfolio%20Standard%20Report.pdf.
Public Service Company of Colorado (PSCO). (2013a). “2012 Renewable Energy Standard Compliance Report.”
PSCO. (2013b). “2014 Renewable Energy Standard Plan.” Accessed February 2014: http://xcelenergy.com/staticfiles/xe/Regulatory/Regulatory%20PDFs/CO-RES-Plan-2014-Vol-1.pdf.
PSCO. (2013c). “Electric Rates: Electric Commodity Adjustment.” Accessed February 2014: http://www.xcelenergy.com/staticfiles/xe/Regulatory/Regulatory%20PDFs/CO-Short-Term-Medical-Exemption-Program/Exhibit-B.pdf.
Public Service Company of New Mexico (PNM). (2009). “Public Service Company of New Mexico Renewable Energy Portfolio Procurement Plan for 2010.”
PNM. (2013a). “Public Service Company of New Mexico Renewable Energy Portfolio Procurement Plan for 2014.” Filed July 1. Case 13-00183-UT.
PNM. (2013b). “Annual Renewable Energy Portfolio Report for 2012.” Filed July 1.
Public Utilities Commission of Ohio (PUCO). (2012). “Alternative Energy Portfolio Standard Report 2009 & 2010 Compliance Years.” Case No. 12-1100-EL-ACP, April 16, 2012.
PUCO. (2013a). “Alternative Energy Portfolio Standard Report by the Public Utilities Commission to the General Assembly of the State of Ohio for the 2011 Compliance Year.” Public Utilities Commission of Ohio, July 10, 2013.

76
This report is available at no cost from the National Renewable Energy Laboratory (NREL) at www.nrel.gov/publications.
PUCO. (2013b). “Opinion and Order.” Public Utilities Commission of Ohio, Case No. 11-5201-EL-RDR, Issued August 7, 2013.
PUCO. (2013c). “Renewable Resources and Wholesale Price Suppression.” Accessed February 2014: http://www.midwestenergynews.com/wp-content/uploads/2013/09/PUCO-renewable-energy-standard-study.pdf.
PUCO. (2014). “Draft Alternative Energy Portfolio Standard Report by the Public Utilities Commission to the General Assembly of the State of Ohio for the 2012 Compliance Year.” January 14, 2014.
Public Utility Commission of Oregon (PUC OR). (2014). Investigation into RPS Implementation Plans: Stipulation Adopted. Order No. 14034, Entered January 29.
Puget Sound Energy (PSE). (2012). “Annual Reporting Requirements Renewable Energy Target.” Accessed February 2014: http://www.pse.com/aboutpse/EnergySupply/Documents/Renewable_Energy_Target_Report.pdf.
PSE. (2013). “Updated Renewable Energy Target Report.” Filed with Washington State Utilities and Transportation Commission, July 22, 2013.
Rhode Island Public Utilities Commission (RI PUC). (2012). “Rhode Island Renewable Energy Standard Annual RES Compliance Report for Compliance Year 2010.”
RI PUC. (2013). “Rhode Island Renewable Energy Standard Annual RES Compliance Report 2011.” RI - 2011 RES Compliance Report.pdf
RTI International. (2013). “The Economic, Utility Portfolio, and Rate Impact of Clean Energy Development in North Carolina.” RTI Project Number 0213597.000.
Solorio, L. (Feb. 18, 2014). Email to Barbose, G., Lawrence Berkeley National Laboratory. Kansas Corporation Commission, Topeka, KS.
Southern Minnesota Municipal Power Agency (SMMPA). (2011). “Renewable Energy Cost Impact Report.” Minnesota Public Utilities Commission Docket No. E-999/CI-11-852, October 25, 2011.
Southwestern Public Service Company (SPS). (2009). “Southwestern Public Service Company 2010 Annual Renewable Energy Portfolio Procurement Plan.”
SPS. (2012). “Southwestern Public Service Company 2012 Annual Renewable Energy Portfolio Procurement Plan.” Accessed February 2014: http://www.xcelenergy.com/staticfiles/xe/Regulatory/Regulatory%20PDFs/NM-RPS-2012/CLB-2-2012-RPS-Plan-for-2014.pdf.
SPS. (2013). “Southwestern Public Service Company 2013 Annual Renewable Energy Portfolio Procurement Plan.”
Stanfield, J. (2013a). “Washington Regulators to Affirm RPS Compliance Targets for State’s Investor-Owned Utilities.” SNL Financial (August 1).
Stanfield. J. (2013b). “Xcel Energy Finds Wind Prices Competitive with Other Generation on Colo. System.” SNL Financial (May 31).
http://www.midwestenergynews.com/wp-content/uploads/2013/09/PUCO-renewable-energy-standard-study.pdf

77
This report is available at no cost from the National Renewable Energy Laboratory (NREL) at www.nrel.gov/publications.
Steinberg, D.; Porro, G.; Goldberg, M. (2012). Preliminary Analysis of the Jobs and Economic Impacts of Renewable Energy Projects Supported by the Section 1603 Treasury Grant Program. NREL / TP-6A20-52739. Golden, CO: NREL.
Stockmayer, G.; Finch, V.; Komor, P.; Mignogna, R. (2012). “Limiting the costs of renewable portfolio standards: A review and critique of current methods.” Energy Policy (42); pp. 155-163. http://dx.doi.org/10.1016/j.enpol.2011.11.060.
Tomich, J. (2013). “Ameren Agrees to $92 Million in Solar Rebates.” St. Louis Post-Dispatch. Accessed December 2013: http://www.stltoday.com/business/local/ameren-agrees-to-million-in-solar-rebates/article_3a39257d-3607-5e7d-9d2d-2e8b9e153e9a.html.
Toledo Edison Company. (2011). “Revised Tariff PUCO No. 8 Changes to Riders AER, DRR, DUN, LEX, PUR and NDU.”
Town of Fountain. (2013). “2013-2015 Compliance Plan and 2012 Compliance Report.”
Town of Winterville. (2013). “2013-2015 Compliance Plan and 2012 Compliance Report.”
Tucson Electric Power Company (TEP). (2011). “Tucson Electric Power Company 2010 RES Compliance Report.”
TEP. (2012). “Tucson Electric Power Company 2011 RES Compliance Report.” Accessed February 2014: http://www.azcc.gov/Divisions/Utilities/2011%20TEP%20REST.pdf.
TEP. (2013). “Tucson Electric Power Company 2012 RES Compliance Report.”
UNS Electric, Inc. (UNS). (2011). “UNS Electric, Inc. 2010 RES Compliance Report.”
UNS. (2012). “UNS Electric, Inc. 2011 RES Compliance Report.”
UNS. (2013). “UNS Electric, Inc. 2012 RES Compliance Report.”
U.S. EPA. (2011). “Assessing the Multiple Benefits of Clean Energy: A Resource for States.” Accessed February 2014: http://epa.gov/statelocalclimate/resources/benefits.html; http://epa.gov/statelocalclimate/documents/pdf/epa_assessing_benefits.pdf.
Washington Department of Commerce (WDOC). (2013). “2012 EIA Utility Reports.” http://www.commerce.wa.gov/Programs/Energy/Office/Utilities/Pages/EnergyIndependence.aspx.
Washington Utilities and Transportation Commission (UTC). (2013). “Staff Comments of the Washington Utilities and Transportation Commission, in the matter of Evaluating Electric Utility Renewable Portfolio Standard Reports under the Energy Independence Act, RCW 19.285 and WAC 480-109.” Dockets UE-131056, UE-131063 and UE-131072. July 1. http://www.wutc.wa.gov/rms2.nsf/177d98baa5918c7388256a550064a61e/c278195fab5f473988257b9b00660d75!OpenDocument.
Wisconsin Statutes. 196.378: Renewable resources.

78
This report is available at no cost from the National Renewable Energy Laboratory (NREL) at www.nrel.gov/publications.
Wiser, R.; Bolinger, M. (2013). “2012 Wind Technologies Market Report”. DOE/GO-102013-3948. Washington, D.C.: U.S. Department of Energy, http://www1.eere.energy.gov/wind/pdfs/2012_wind_technologies_market_report.pdf.
Wiser, R.; Bolinger, M. (2007). Can deployment of renewable energy put downward pressure on natural gas prices? Energy Policy. 35(1). 295-306. http://dx.doi.org/10.1016/j.enpol.2005.11.021
Xcel Energy. (2011). Renewable Energy Standard Rate Impact Report. Minnesota Public Utilities Commission. Docket No. E999/CI-11-852 (October 25).
Zuraski, R. (Jan. 3, 2014). Email to Barbose, G., Lawrence Berkeley National Laboratory. Illinois Commerce Commission, Springfield, IL.

79
This report is available at no cost from the National Renewable Energy Laboratory (NREL) at www.nrel.gov/publications.
Appendix: State Summaries Arizona Arizona’s RPS requires 15% of electricity be derived from renewable energy by 2025, with 30% (i.e., 4.5% of total retail sales in 2025) of this energy derived from distributed resources. IOUs and electric power cooperatives serving retail customers in Arizona--with the exception of distribution companies with more than half of their customers outside Arizona--are subject to the standard (DSIRE 2012).
APS and Tucson Electric Power (TEP) fully complied with their CY 2012 requirements, which include a substantial distributed generation component. In 2012, APS reports total RPS procurement of 1,507,021 MWh, or 5.3% of retail sales, with total distributed generation of 503,498 MWh (APS 2013). APS’s 2011 reported above-market renewable generation cost, which came from PPAs and utility-owned solar facilities, was $11.28/MWh of renewable electricity, dropping to $9.63/MWh in 2012 (APS 2012; APS 2013).
TEP reports total purchased renewable energy at $4,809,557, which exceeded the target of 279,963,210 RECs representing 3% of its retail energy sales for 2011 (9,332,107 MWh) (TEP 2012). TEP did not list renewable generation cost in MWh in its compliance report.
RPS costs are recovered through a surcharge on customer bills. Average residential customer monthly surcharges in 2012 were $3.15 for TEP, $3.84 for APS, and $4.50 for UNSE/Citizens (ACC 2012a; ACC 2012b; ACC 2012c). The residential tariff surcharges are higher than what is seen in other stares with surcharges, partially reflecting the fact that Arizona’s RPS has a substantial distributed generation requirement.
California California’s RPS has a 33% target for all electric retailers by 2020. In 2011, Pacific Gas and Electric Company (PG&E), Southern California Edison (SCE), and San Diego Gas & Electric Company (SDG&E) spent approximately $1,017 million, $1,341 million, and $170 million, respectively, on direct RPS procurement, whereas RPS deliveries represented 19.8%, 21.1%, and 20.8% of the utilities’ retail sales, respectively (CPUC 2013). In 2011, the utilities’ RPS portfolios (in dollar terms) were primarily comprised of geothermal (35%), wind (34%), and biomass (12%). Table 14 provides a summary of California utilities’ average RPS costs from 2003-2011. These data represent gross RPS procurement costs.

80
This report is available at no cost from the National Renewable Energy Laboratory (NREL) at www.nrel.gov/publications.
Table 14. California Utilities’ Estimated Average RPS Costs in ¢/kWh (2003-2011)
Utility 2003 2004 2005 2006 2007 2008 2009 2010 2011 Southern California
Edison 7.5 7.6 7.6 7.5 8.0 9.3 7.9 8.2 8.5
Pacific Gas and Electric Company
6.5 6.5 6.4 6.6 7.5 8.2 7.0 7.4 7.3
San Diego Gas & Electric
Company52
5.4 5.3 5.3 5.3 5.2 5.8 5.4 5.9 5.1
Source: CPUC 2013
In California, two sets of incremental cost estimates have been used to compute RPS incremental costs, resulting in average incremental costs ranging from -2.4 ¢/kWh to 4.3 ¢/kWh in 2011.The MPR methodology, developed by the CPUC, is used to determine whether an “RPS contract selected from a competitive solicitation had above-market costs associated with it” (CPUC 2013, p.9). The 10-year and 20-year MPRs for contracts with a 2011 start date are 8.8 ¢/kWh and 10.1 ¢/kWh, respectively, based on 2009 MPR calculations.53 Using the MPR methodology, incremental cost calculations for 2011 were negative, equaling -2.4 ¢/kWh of renewable energy procured, or -3.6% of average retail rates.
The other set of incremental cost estimates, provided by the utilities, is based on day-ahead CAISO energy market prices and the cost of capacity in the CAISO market (CPUC 2013a). These incremental cost calculations in 2011 were 2.2 ¢/kWh for SDG&E, 3.6 ¢/kWh for PG&E, and 5.3 ¢/kWh for SCE.
The CPUC is currently in the process of developing a cost containment mechanism for the RPS. In 2013, the CPUC proposed using a Procurement Expenditure Limitation (PEL) methodology to calculate RPS containment mechanism, replacing the MPR method, which is composed of a ratio of an IOU’s RPS procurement expenditures (actual money spent by the IOU to fulfill its PPAs and operate its facilities over 10 years) to its total forecasted revenue requirement (the initial year equals the IOU’s effective revenue requirement, escalated by 2.75% over the course of 10 years) (CPUC 2013).
Colorado Colorado’s RPS has a 30% mandate for IOUs and a 20% mandate for cooperative and municipal utilities by 2020, with 3% of retails sales coming from distributed generation. Cooperative and municipal utilities with less than 100,000 meters are only required to meet 10% renewables by 2020 (DSIRE 2013). Colorado’s RPS offers a 1.25 multiplier for projects installed before January 1, 2015 and a 3.00 multiplier for projects installed before July 1, 2015. 52 SDG&E’s RPS cost includes RECs starting in 2009. 53 The 2011 adopted values are current, but they apply only to RPS contracts with start dates in 2012 and beyond (CPUC 2013).

81
This report is available at no cost from the National Renewable Energy Laboratory (NREL) at www.nrel.gov/publications.
The major IOUs in Colorado–Xcel Energy (Public Service Company of Colorado) and Black Hills–have had no difficulty meeting targets. In fact, Xcel has been able to procure more renewable energy than required. In 2012, for example, Xcel generated or procured 6.3 million RECs as opposed to the required 3.5 million (PSCO 2013a).
Xcel has been able to buy wind power through PPAs at prices competitive to what it sees for natural gas. Two recent wind PPAs were signed for $27.50/MWh, escalating in future years, with a 25-year levelized cost of $35/MWh (Stanfield 2013b). The estimated incremental RPS costs are determined through scenario analysis that compares the costs and benefits of the current RPS plan to a plan that replaces the new renewable energy with new non-renewable resources available. In 2011, Xcel had the equivalent of 16% of its retail sales from renewable energy (or 20%, when including the 1.25 multiplier for in-state projects), but was only required to have 12% renewable energy (CO PUC 2013).
Colorado PUC rules stipulate that the retail rate impact can be calculated as the difference between the cost of the renewable energy purchases and the cost of new fossil fuel-based energy for generation RPS-related costs and can be recovered through the Renewable Energy Standard Adjustment (RESA) surcharge, which is capped at 2% of annual customer bills. As of 2012, PSCo’s 2% monthly customer surcharge was equivalent to roughly $1.44, on average, for residential customers, while Black Hills Energy’s average residential customer surcharge was roughly $2.04 (PSCO 2013a; Black Hills 2013). To date, Xcel has spent more than 2%, but deferred the additional spending for collection in later years.
Connecticut Connecticut’s RPS requires each electric supplier and each electric distribution company (EDC) wholesale supplier to obtain at least 23% of its retail load by using renewable energy, in addition to obtaining at least 4% of its retail load by using combined heat and power (CHP) systems and energy efficiency, for a total of 27% by 2020 (DSIRE 2012). Connecticut uses a separate tier for energy efficiency, for which compliance is achieved through the use of credits, and some of the information on prices is available from brokers.
In 2008, in aggregate, 3,070,869 Connecticut eligible RECs were used to comply with the RPS requirements, of which 1,534,981 were Class I RECs. Only 4% of Class I renewable energy is coming from Connecticut, 45% from Maine, 29% from New Hampshire, and the rest from Massachusetts, New York, Rhode Island, Quebec, and Vermont. Approximately 74% of the Class I RECs used for 2008 RPS compliance were obtained from biomass plants, particularly wood, followed by 28% of RECs generated from methane gas from landfill facilities (Department of Public Utility Control 2011).
In 2008, there were 17 electric suppliers and 2 EDCs subject to the Connecticut RPS; 6 suppliers (32%) did not meet the RPS, but this was by slim margins. Two of the state’s largest utilities, Connecticut Light & Power Company and the United Illuminating Company, were in 100% compliance with 2008 RPS requirements. Companies that fail to comply with the RPS requirements are required to pay an ACP of $55/MWh for Class I RECs, which is used to offset other ratepayer costs (Department of Public Utility Control 2011). The aggregate ACP paid by all suppliers for 2008 was $113,730.

82
This report is available at no cost from the National Renewable Energy Laboratory (NREL) at www.nrel.gov/publications.
Findings from the Connecticut Center for Energy, Economic, and Environmental Policy and the Rutgers Economic Advisory Service indicate that future impact of the RPS on Connecticut’s electricity prices is between less than 1% and 3.5% of the typical residential electricity bill in 2020. The economic and energy impacts of Connecticut’s RPS requirements were estimated using R/ECON Connecticut, an econometric model based on historical data for Connecticut and the United States.
The District of Columbia The District of Columbia has an RPS requirement of 20% by 2020 that applies to all retail sales in the district. The RPS requirement includes a solar carve-out of 2.5% by 2023. Only systems less than 5 MW in capacity and located within the District of Columbia54 are eligible for the carve-out (DSIRE 2013). RECs retired to meet the solar carve-out can be used to meet the main RPS requirement as well (DCPSC 2012).
In 2010, energy suppliers reported 100% compliance with the main requirement and 97% compliance with the solar carve-out. In 2011, the Public Service Commission of the District of Columbia (DC PSC) reported that a total of over 469,000 RECs were used for main tier compliance–excluding carve-outs–for a total cost of approximately $820,000 and an average REC price of $1.75. Roughly half of the RECs retired were generated in 2011 while the other half was equally split between 2010 and 2009 (DC PSC 2013).
Since the inception of this RPS, black liquor gasification has consistently been used as the primary source of RECs; black liquor typically costs less than other RPS-eligible resources. Landfill gas and wood waste are the two other most prevalent sources of renewable energy used for compliance in the region. Collectively, these three generation technologies accounted for 94% of total main tier compliance in 2011, and their average costs per REC ranged between $1.42/MWh and $1.94/MWh. That year the solar carve-out requirement was 0.4% and 5,896 SRECs were retired for compliance. In 2011, the average cost of SRECs was $300/MWh. Recent 2013 SREC prices from the Flett Exchange and SRECTrade were around $375/MWh to $386/MWh (DCPSC 2013).The main tier ACP is set at $50 (DCPSC 2013). In 2011, the total reported RPS compliance cost was $2.6 million, of which ACPs totaled $229,500 (most of these payments came from one electricity supplier unable to acquire enough SRECs) (DCPSC 2013).
Delaware Delaware’s RPS requires retail electricity suppliers to purchase 25% of the electricity sold in the state from renewable sources by 2025, with at least 3.5% from solar photovoltaic (PV) (DSIRE 2013). Beginning in CY 2012, the RPS applies to the state’s only electric distribution company, Delmarva Power & Light.
In CY 2011, Delaware was in 99% compliance, with a total of 554,259 MWh RECs (15,741 MWh from solar, 517,245 from new non-solar, and 21,273 from existing non-solar resources).
Delmarva Power estimates that total costs to comply with the RPS are $45 million from 2013-2014, increasing to $83 million from 2022-2023 (Delmarva Power & Light Company 2012). As 54 Alternatively, the systems may be connected to a distribution feeder serving the District of Columbia.

83
This report is available at no cost from the National Renewable Energy Laboratory (NREL) at www.nrel.gov/publications.
far as rate impacts on customer bills are concerned, Delmarva forecasts that the RPS is likely to affect a typical 1,000 kWh residential monthly bill by $6.60 in CY 2013; this impact is expected to increase to $15.15 a month in CY 2022 (Delmarva Power & Light Company 2012).
The total cost cap for Delmarva Power & Light Company is 1% for solar, which includes compliance with PV requirements. If the utility’s total retail cost of electricity exceeds 1%, then the RPS requirement for solar may be frozen at the percentage for the year in which the freeze is implemented. The total cost cap for Delmarva Power & Light Company is 3% for eligible energy resources; if the utility’s total retail cost of electricity exceeds the 3%, then the RPS requirement may be frozen at the percentage for the year in which the freeze is implemented. Delaware also has an ACP set at $25-$80/MWh (DSIRE 2013).
The Department of Natural Resources and Environmental Control (DNREC) is in the process of developing rules for calculating the cost of compliance with the RPS, which may include provisions for “netting” the costs or including costs that are avoided by renewable energy resources, such as air emissions costs. “Netting” RPS avoidance costs of renewable energy may significantly reduce the impact on customer bills (Delmarva Power & Light Company 2012).
Draft regulations specify that the Division of Energy & Climate will determine the cost of compliance, which will then be review by the Director. The Division Director shall then determine the whether to freeze RPS requirements. As part of that determination, draft regulations specify that the Director may consider benefits such as price suppression, savings in health and mortality costs, and economic development benefits from renewable energy deployment in the state. (DE DNREC 2013)
Hawaii Hawaii’s RPS requires each electric utility that sells electricity for consumption in the state to achieve net electricity sales from renewable energy of 15% by 2015, 25% by 2020, and 40% by 2030. Starting in 2015, electrical energy savings from energy efficiency and solar water heating technologies will be excluded from counting towards the RPS. In 2012, 1,276,234 MWh were generated from purely renewable resources, fulfilling 13.9% of the RPS requirement for the Hawaiian Electric Companies consisting of Hawaii Electric Light and Maui Electric Company (HECO).
According to HECO, long-term fixed price contracts for renewable energy are cost-effective compared to avoided energy costs (see Table 15). The Oahu generation cost includes seven PPAs, of which one was biomass generated at approximately 26 ¢/kWh, two for wind at a cost of 21 to 23 ¢/kWh, three for PV between 22 and 23 ¢/kWh, and one for waste to energy at 21 ¢/kWh (HECO 2012).

84
This report is available at no cost from the National Renewable Energy Laboratory (NREL) at www.nrel.gov/publications.
Table 15. Estimated Avoided Energy Cost in ¢/kWh Purchases from Qualifying Facilities of >100 kW55
Hawaiian Electric Company
Hawaii Electric Light
Maui Division Maui Electric Company Lanai Division
Molokai Division
On peak 22.697 20.657 19.990 34.669 29.473 Off peak 16.041 15.652 19.318 29.076 26.646
Source: HECO 2012 Kauai Island Utility Cooperative (KIUC) serves the island of Kauai only. In 2012, KIUC’s RPS portion that was met by electrical energy generated using renewable energy was 40,793 MWh, which is greater than 50% of the total 2012 10% RPS requirement of 43,315 MWh (KIUC 2012).
By the end of 2012, renewables accounted for 15% of KIUC electricity sales. The 6 MW solar array at Port Allen is the largest solar facility in Hawaii. It supplies almost 10% of KIUC’s daytime electrical load and annually produces about 3% of the total energy used on Kauai. Under a 20-year contract, KIUC pays 20 ¢/kWh for solar power.
In 2008, the Hawaii Public Utilities Commission (HPUC) approved a penalty of $20/MWh for any shortfall in procuring renewable electricity to meet the RPS requirements (HPUC 2012). In Hawaii, utilities may petition the HPUC for a waiver of a penalty for failure to meet the RPS if contracts for procuring generation or renewable energy credits are above-market price for other available resources (Stockmayer et al. 2012).
Illinois Illinois’s RPS requires IOUs and alternative retail electric suppliers (ARES) to achieve a 25% RPS target by 2026, of which 75% of the requirement must be from wind, 60% wind for ARES, 1% from distributed generation and thereafter (IOUs only), and 6% from solar in 2016 and thereafter (1.5% of total sales in 2026) (DSIRE 2013). In-state renewable energy is given preference, although out-of-state RE purchases may also count towards compliance.
Renewable energy procurement is done through the Illinois Power Agency (IPA), whose purpose is to develop electricity procurement plans, including for RPS compliance, for IOUs supplying over 100,000 Illinois customers. The IPA plans and administers the competitive procurement processes that result in bilateral agreements between the utilities and wholesale electric suppliers (DSIRE 2013). In 2010, IPA solicited bids for 20-year long-term power purchase agreements (LTPPAs) to purchase up to 2 million MWh of renewable energy and the associated RECs each year, representing approximately 3.5% of the overall portfolio. Under these contracts, a single price was set for the bundled product (energy plus REC) with a 2% per annum cost escalator over the term of the contracts.
REC prices shown in Table 16 are calculated from the average cost of RECs and energy procured by IPA. For the LTPPAs, where RECs are purchased with energy (“bundled”), IPA estimates the REC cost by subtracting the cost of conventional generation from the total cost of 55 The methodology for the avoided cost calculation was developed prior to 1995 and is currently publically unavailable in an electronic format.

85
This report is available at no cost from the National Renewable Energy Laboratory (NREL) at www.nrel.gov/publications.
the renewable energy contract (the price of energy and RECs bundled together). In 2011, the IOUs were in 100% compliance with RPS obligations.
Table 16. IPA Reported Costs of Unbundled RECs and Conventional Supply (June 2009-May 2013)
Company RECs (¢/kWh)
Conventional supply (¢/kWh)
ComEd 0.8
3.4
Ameren 0.7 3.4 Source: IPA 2013
Note: REC costs are the average actual cost of RECs procured by IPA; for RECs procured with energy (“bundled”) under the 2010 LTPPAs, IPA estimates the REC cost by subtracting the energy price from the bundled cost.
Starting in 2007, the RPS costs are limited to either 2.015% of the amount paid per kWh in 2007, or the amount paid in 2011, whichever is greater (DSIRE 2013).
Iowa Iowa’s RPS requires its two IOUs, MidAmerican Energy and Alliant Energy Interstate Power & Light (IPL), to own or contract for a combined total of 105 MW of renewable generating capacity, of which MidAmerican Energy contributes 55.2 MW (52.57% of demand) and IPL contributes 49.8 MW (47.43% of demand) (DSIRE 2013). In 2001, a voluntary goal of 1,000 MW of wind generating capacity by 2010 was established. By the end of 2012, Iowa’s installed wind capacity totaled 5,133 MW (IWEA 2012). The two utilities have fully met their obligations since 1999.
As of 2011, the Iowa Utilities Board (IUB) staff estimated that 19-20% of all electricity generated in the state comes from wind (IUB 2011), much of which is used to meet RPS policies in surrounding states.
Kansas Kansas’s Renewable Energy Standard (RES) requires the state’s IOUs and cooperative utilities to generate or purchase 10% of their electricity from eligible renewable resources in the years 2011-2015, 15% in the years 2016-2019, and 20% by 2020. Unlike most other states, Kansas’s standard is based on generation capacity (i.e., generally the gross capacity owned or leased by a utility less the auxiliary power used to operate the facility) (DSIRE 2013).
Kansas public utilities have already complied with the 10% threshold, and are on their way to meeting the 15% requirement, primarily from wind resources. In 2012, there was oversupply of RECs in the region for two of Kansas’s larger utilities: Empire generated an excess of 291.9 MW and Westar generated an excess of 280.8 MW. Importantly, for renewable capacity generated in Kansas, utilities are awarded an additional 10% credit toward their requirements, thus incentivizing utilities to keep the renewable projects within the state (as of November 2012, there were 19 wind projects currently in operation or under construction).
Costs for Kansas are measured on a gross basis. The KCC estimated statewide 2012 RPS gross costs of about 0.16 ¢/kWh, meaning that the RPS counts for about 0.16 ¢/kWh of the 9.2 ¢/kWh retail electricity cost in 2012 across the state, or about 1.7% (KCC 2013). The Kansas RPS

86
This report is available at no cost from the National Renewable Energy Laboratory (NREL) at www.nrel.gov/publications.
places a 1% cap on the rate impact of compliance based on gross compliance costs. Given that the statewide impact of 1.7% exceeds the 1% cap on rate impact, it can be assumed that at least one utility has compliance costs exceeding the cap; however, utility specific cost information is held confidential by the KCC.
Additional gross cost information on wind projects in Kansas was estimated by Polsinelli Shughart and Kansas Energy Information Network. The study estimated the gross costs of new wind power in Kansas to be between $35 and $45/MWh (Anderson et al. 2012). Maine Maine’s RPS requires IOUs to supply at least 10% of their total electric sales using electricity generated from renewable sources classified as Class I (resources that have come online after September 1, 2005) by 2017 and for each year thereafter. Existing renewable energy resources are classified as Class II and must supply at least 30% of total electric sales by 2017 (DSIRE 2013).
In 2010, the RPS requirement for new renewable resources (Class I) was 3%, or close to 333,000 MWh. The cost of purchased Class I RECs ranged from $5.76/MWh to $43/MWh with a total cost of $8.1 million (LEI 2012). The average reported procurement cost of Class I RECs was $24/MWh. Only two out of 30 suppliers chose to pay the ACP at the rate of $62/MWh for a total cost of $22,500 in 2010 (LEI 2012).
Over 80% of purchased RECs were produced within the State of Maine and biomass has been the major resource for satisfying the Class I RPS requirements. Renewable resources located in Maine contributed significantly to RPS Class I compliance in Connecticut and Massachusetts, accounting for over 30% of the New England Class I RPS compliance requirement in 2009 (LEI 2012).
London Economics International LLC (LEI) calculated the compliance costs for Maine’s Class I RPS and found that in 2010, the cost was 0.07 ¢/kWh. LEI calculated the RPS retail rate impact on Maine’s consumers by multiplying the RPS percent requirement by the annual electricity retail sales and the market price of RECs. To assess the potential impact on retail rates if RPS policies and/or REC market prices change, LEI implemented an analytical “what if” consideration for both a higher RPS requirement as well as lower REC prices based on the 2010 compliance cost scenario. Based on the 2010 compliance scenario, the ratepayer impact of the current 3% RPS was found to be 0.57% of the current average retail rate, or 37¢/month for residential customers, assuming a REC price of $24/MWh. Ratepayer impacts for the RPS at 10% was estimated to be 1.90% or $1.24/month for households assuming REC prices remain at $24/MWh, and 1.07% of the current average retail rate and 70¢/month, assuming REC prices of $13.50/MWh (LEI 2012).
Maryland Maryland’s RPS requires all utilities and competitive retail suppliers to sell a minimum percentage of renewable energy at the retail level. In 2013 that requirement was 7.95%, which will grow to 18% in 2022. Electricity suppliers must obtain 2% of retail sales from solar resources by 2020. In 2013, Maryland enacted an offshore wind carve-out of up to 2.5% of retail
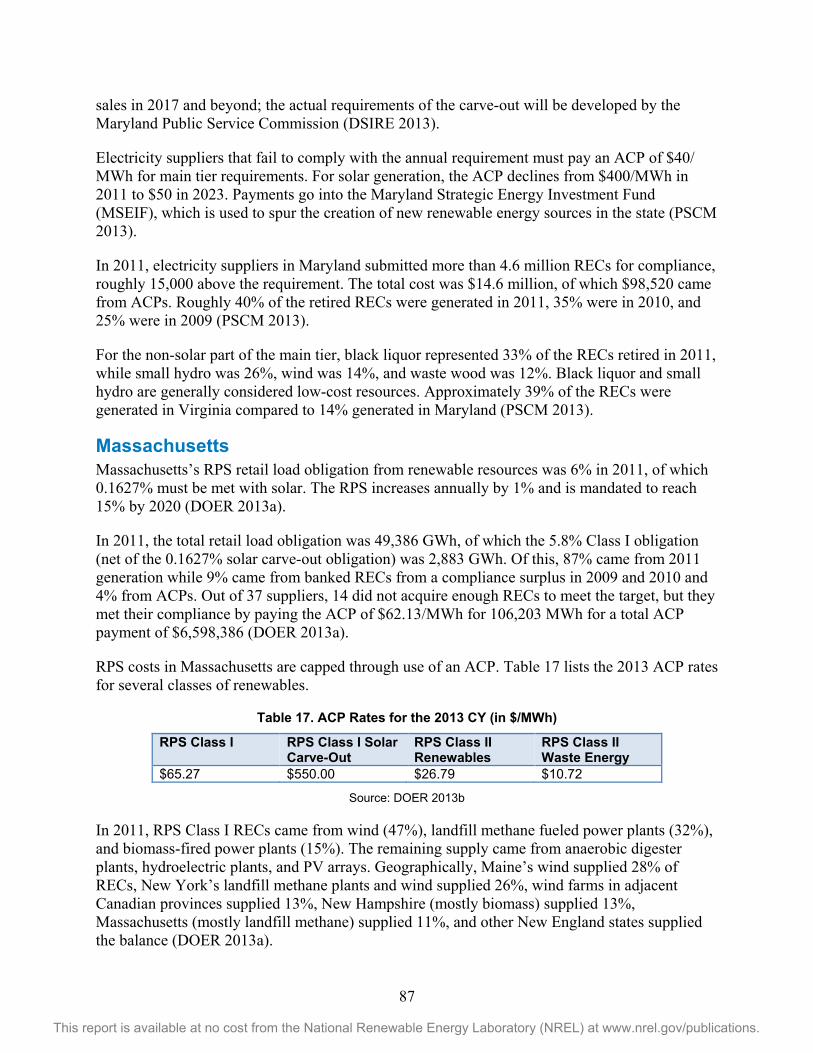
87
This report is available at no cost from the National Renewable Energy Laboratory (NREL) at www.nrel.gov/publications.
sales in 2017 and beyond; the actual requirements of the carve-out will be developed by the Maryland Public Service Commission (DSIRE 2013).
Electricity suppliers that fail to comply with the annual requirement must pay an ACP of $40/ MWh for main tier requirements. For solar generation, the ACP declines from $400/MWh in 2011 to $50 in 2023. Payments go into the Maryland Strategic Energy Investment Fund (MSEIF), which is used to spur the creation of new renewable energy sources in the state (PSCM 2013).
In 2011, electricity suppliers in Maryland submitted more than 4.6 million RECs for compliance, roughly 15,000 above the requirement. The total cost was $14.6 million, of which $98,520 came from ACPs. Roughly 40% of the retired RECs were generated in 2011, 35% were in 2010, and 25% were in 2009 (PSCM 2013).
For the non-solar part of the main tier, black liquor represented 33% of the RECs retired in 2011, while small hydro was 26%, wind was 14%, and waste wood was 12%. Black liquor and small hydro are generally considered low-cost resources. Approximately 39% of the RECs were generated in Virginia compared to 14% generated in Maryland (PSCM 2013).
Massachusetts Massachusetts’s RPS retail load obligation from renewable resources was 6% in 2011, of which 0.1627% must be met with solar. The RPS increases annually by 1% and is mandated to reach 15% by 2020 (DOER 2013a).
In 2011, the total retail load obligation was 49,386 GWh, of which the 5.8% Class I obligation (net of the 0.1627% solar carve-out obligation) was 2,883 GWh. Of this, 87% came from 2011 generation while 9% came from banked RECs from a compliance surplus in 2009 and 2010 and 4% from ACPs. Out of 37 suppliers, 14 did not acquire enough RECs to meet the target, but they met their compliance by paying the ACP of $62.13/MWh for 106,203 MWh for a total ACP payment of $6,598,386 (DOER 2013a).
RPS costs in Massachusetts are capped through use of an ACP. Table 17 lists the 2013 ACP rates for several classes of renewables.
Table 17. ACP Rates for the 2013 CY (in $/MWh)
RPS Class I RPS Class I Solar Carve-Out
RPS Class II Renewables
RPS Class II Waste Energy
$65.27 $550.00 $26.79 $10.72
Source: DOER 2013b
In 2011, RPS Class I RECs came from wind (47%), landfill methane fueled power plants (32%), and biomass-fired power plants (15%). The remaining supply came from anaerobic digester plants, hydroelectric plants, and PV arrays. Geographically, Maine’s wind supplied 28% of RECs, New York’s landfill methane plants and wind supplied 26%, wind farms in adjacent Canadian provinces supplied 13%, New Hampshire (mostly biomass) supplied 13%, Massachusetts (mostly landfill methane) supplied 11%, and other New England states supplied the balance (DOER 2013a).

88
This report is available at no cost from the National Renewable Energy Laboratory (NREL) at www.nrel.gov/publications.
In 2013, Fitchburg Gas and Electric Light Company, along with National Grid, NSTAR Electric Company, and Western Massachusetts Electric Company, collectively entered into PPAs to acquire their pro rata share of the total renewable energy output and RECs from six wind energy projects, with a combined capacity of 565 MW (MPUC 2013). If approved, utilities will pay an average price of less than 8 ¢/kWh over the course of these contracts compared with projected prices of about 10 ¢/kWh for coal, 11 ¢/kWh for nuclear, and 14 ¢/kWh for solar (Ailworth 2013). The commercial operation dates associated with these projects range from November 2014 to December 2016 and total generation is expected to reach 4 million MWh (MPUC 2013).
Michigan Michigan’s RPS requires all utilities to generate 10% of their retail electricity sales from renewable resources by 2015. There are additional renewable energy capacity requirements for large utilities above 1 million retail customers, such as Consumers Energy and Detroit Edison, which must respectively procure 200 MW and 300 MW by the end of 2013 and 500 MW and 600 MW by 2015. In addition, the RPS allows utilities to use energy efficiency and advanced cleaner energy systems to meet a limited portion of the requirement (DSIRE 2013).
According to projections, providers are on track to meet the 2015 requirement, with renewable generation expected to account for 9% of power supply in 2015 and the remainder to be fulfilled with RECs banked from previous years. The first RPS CY in Michigan was 2012, but in 2011, electric providers were well positioned to meet the 2012 standard. In 2012, electric providers reported a total of 11,501,525 available RECs and 116,570 Advanced Cleaner Energy Credits, equivalent to about 4.4% of retail sales (MPSC 2013).
The Michigan Public Service Commission (MPSC) approved contracts in 2011 and 2013 for new wind capacity that have levelized gross costs of $61-$64/MWh and $50-$60/MWh, respectively (Engblom 2013). The renewable energy weighted average gross cost of these contracts over the life cycle of the systems is $91/MWh.56
56 Renewable energy cost data are based on levelized costs that are provided in the renewable energy contract approval process.
89
This report is available at no cost from the National Renewable Energy Laboratory (NREL) at www.nrel.gov/publications.
Based on estimates from DTE Energy and Consumers Energy, from 2008-2012 the rate impact from the RPS is approximately 0.3–0.6 ¢/kWh for residential customers (or 2–4%) and 0.1–0.3 ¢/ kWh (or 1–3%) for business customers (Consumers Energy, DTE Energy, and MEGA 2012). Utility providers can recover the RPS incremental costs of compliance through MPSC’s approval of a monthly surcharge per meter on customers’ bills. Consumers Energy’s surcharge is currently 52¢ for residential; between 90¢ and $14.40 for small commercial; and between $3.60 and $90.00 for large commercial and industrial customers. At the end of 2012, DTE Energy’s surcharge was set at the statutory maximum of $3.00 for residential; $16.58 for small commercial; and $187.50 for large commercial or industrial (Consumers Energy, DTE Energy, and MEGA 2012). Citing lower-than-expected renewable energy project costs, Consumers Energy has proposed to eliminate its surcharges as of the July 2014 billing cycle (Consumers 2013c).
Minnesota Minnesota’s RPS requires Xcel Energy (Northern States Power) to obtain 31.5% by 2020, including 1.5% solar. Other utilities have separate requirements. Public utilities are required to obtain 26.5% renewable energy by 2025, including 1.5% solar. Non-public utilities are required to obtain 25% renewable energy by 2025 but do not have a solar requirement (DSIRE 2013).
In 2012, Northern States Power met the RPS requirement of 13% with 5,637,456 MWh of RECs. Northern States Power has generated surplus RECs each year since 2008. The REC bank provides them the flexibility to defer the installation of new renewables and use banked RECs to comply with RPS obligations (Xcel Energy 2011).
Of the fourteen utilities that submitted compliance reports, eight stated that complying with the RPS has resulted in little or no additional costs, if not slight savings for customers. Northern States Power reported that its renewable investments have been cost-effective and actually kept prices in 2008-2009 about 0.7% lower than they would have been without renewables. Northern States Power calculated the rate impact by determining the difference between the costs of implementing and not implementing the RPS, and then by determining the cost difference on a ¢/kWh basis by dividing the costs by total retail sales (Xcel Energy 2011).
Six utilities, including Great River Energy (GRE), reported that their efforts to comply with the policy are leading to increased costs for customers. GRE found that its wind energy purchases increased retail customer bills by about 1.6%, or about $1.50/month for an average residential customer (Haugen 2011).
Missouri Missouri’s RPS requires IOUs to procure renewable energy or RECs for 15% of electricity sales, including 2% from solar by 2021. Municipal utilities and electric cooperatives are not subject to the standard. RECs can be used to meet up to 10% of the total obligation and must be generated in the CY in which they are retired. In-state renewable energy generation receives a multiplier of 1.25 compared to out-of-state generation.

90
This report is available at no cost from the National Renewable Energy Laboratory (NREL) at www.nrel.gov/publications.
In 2011, Ameren Missouri, Empire, KCP&L, and KCP&L Greater Missouri Operations (GMO) were 100% in compliance with the RES. In 2012, Ameren acquired a total of 319,489 RECs under a 15-year PPA with the Pioneer Prairie Wind Farm (Ameren Missouri 2013).
Missouri’s RPS requires IOUs to offer rebates of at least $2/W for customer-sited solar electric systems of 25 kW or less beginning in 2010. Systems of 100 kW or less qualify for rebates on the first 25 kW of installed capacity (DSIRE 2013). The largest electric utility in the state, Ameren Missouri, was expecting to reach the limit on allowable expenditures on renewables by the end of 2013, but reached a settlement with state regulators to continue solar rebates to customers who install solar systems until expenditures reach $91.9 million (Tomich 2013). Of the $91.9 million, $22 million in rebates has already been paid out, helping support about 11 MW of solar in the state (Tomisch 2013). The Missouri Public Utilities Commission (MPUC) can excuse utilities from the RPS if compliance costs exceed standard increases retail electricity rates by more than 1% (DSIRE 2013).
Montana Montana’s RPS requires load serving entities with 50 customers or more to obtain renewable energy equivalent to 15% of retail sales by 2015. Utilities that fail to fulfill their requirements must pay a penalty of $10/MWh. Alternatively, utilities may seek a short-term waiver from compliance. Excess RECs may be carried over for up to two subsequent CYs. Between 2012 and 2014, public utilities must purchase all the RECs and electricity generated by community projects, which are defined as renewable power plants less than 25 MW, majority-owned by local people (DSIRE 2013).
In CY 2011, a total of 691,872 RECs were needed for compliance in Montana. Eligible electricity providers retired 694,986 RECs and $481 was paid in ACPs (the lowest amount paid in ACPs since the inception of the program). Excess RECs will be carried over for subsequent CYs (MT PSC 2012).
Nevada Nevada’s RPS requires utilities to obtain 25% of their total electricity sales from renewable sources by 2025. The solar carve-out is set at 5% through 2015, but increases to 6% of the portfolio requirement starting in 2016. Energy efficiency qualifies as an eligible resource for RPS, but is limited to 25% of the requirement in 2013 and 2014, declining over time and becoming ineligible to meet targets in 2025 and beyond (DSIRE 2013).
In addition, NV Energy (formerly Nevada Power and Sierra Pacific Power) is required to retire 800 MW of coal-fired electric generators by 2020 and acquire 900 MW of power from cleaner facilities, including at least 350 MW from renewable energy facilities (DSIRE 2013). The utility must issue a request for proposals for 100 MW of generating capacity from new renewable energy facilities each year from 2014-2016. The final 50 MW of generating capacity from new renewable energy facilities must be operational by 2022. These requirements are separate from the 25% RPS requirement, but portfolio energy credits (PECs) associated with these projects can apply to meet the RPS requirements (DSIRE 2013).

91
This report is available at no cost from the National Renewable Energy Laboratory (NREL) at www.nrel.gov/publications.
In 2012, both Nevada Power and Sierra Pacific Power exceeded RPS compliance requirements, supplying a total of 4,225,710 MWh and 2,317,174 MWh respectively, including energy efficiency savings. The estimated total 2013 compliance cost comprised of purchased power, REC procurement, and incentives and rebate programs is $273,230,993 and $139,052,000 for Nevada Power and Sierra Pacific Power, respectively (NV Energy 2013). This resulted in gross RPS costs of $65/MWh for Nevada Power and $60/MWh for Sierra Pacific Power. In Nevada Energy’s 2012 integrated resource plan (NV Energy 2012), a long-term avoided cost rate of $30/MWh is calculated. If this avoided cost rate is subtracted from the gross RPS costs, the resulting costs are $35/MWh and $30/MWh, for Nevada Power and Sierra Pacific Power, respectively.
The bulk of expenses for Nevada Power were for purchased power and REC procurement ($195 million). Sierra Pacific Power’s spending was more evenly split between purchased power and RECs ($77 million), and rebate programs for solar, hydro, and wind ($56 million).
New Jersey New Jersey’s RPS requires each electricity provider to procure 22.5% of the electricity it sells from qualifying renewables by 2021. There is a solar specific carve-out of 4.1% by 2028 in addition to a 1,100 MW offshore wind resource requirement (DSIRE 2013).
In 2010, public utilities retired a total of 3,627,069 Class I RECs; compliance using RECs was nearly 100%, with only one utility paying three ACPs. Class I REC prices were reported at an all-time low of $2/MWh by the end of 2010. For the solar target, 123,717 MWh of SRECs were retired in 2010 while suppliers paid the solar ACP of $693/MWh for the remaining 47,373 MWh (NJ BPU 2011).
New Jersey’s Office of Clean Energy estimates the total cost of compliance with the 2010 RPS was $122 million, with the solar requirement estimated to have cost $109 million. The solar costs included $32.8 million of SACP payments, plus more than $76 million in SRECs. The Class I requirements are estimated to have cost approximately $11 million. In 2010, the cumulative weighted average price of SRECs was $615.50/MWh (The Office of Clean Energy and in New Jersey’s Board of Public Utilities 2011).
New Hampshire New Hampshire’s RPS requires electricity providers to procure 24.8% of retail sales in 2025 from renewable resources. Of that total, 15% must come from new renewable facilities and 0.3% from solar generators. In 2013, ACPs for new renewable requirements are $55/ MWh for electric technologies, including solar, and $25/ MWh for thermal (DSIRE 2013).
For the 2012 CY, the electricity providers were required to procure 3% new renewables and 0.15% solar. ACPs totaled $9.3 million, equivalent to 260,957 MWh of RECs, or roughly 44% of the total estimated requirement (NHPUC 2013).
According to the New Hampshire PUC (2011), the total cost of compliance (including RECs and ACPs) was $18,601,556, with the average cost per kWh of $0.0017, meaning that a typical residential ratepayer (using about 500 kWh/month) would pay about 85¢/month (NH PUC 2011).

92
This report is available at no cost from the National Renewable Energy Laboratory (NREL) at www.nrel.gov/publications.
For regulated utilities, 98% of compliance was met with RECs, and 2% with ACPs. For competitive electricity suppliers, 67% of compliance was met with RECs, and 33% with ACPs (NH PUC 2011).
New Mexico New Mexico’s RPS requires that IOUs have 15% of retail electricity sales from renewable energy by 2015 and 20% by 2020. It also requires that the targets be met with diverse resources, including 30% wind, 20% solar, 5% other technologies, and 3% distributed generation (by 2015). Rural electric cooperatives must maintain renewable energy at 5% of retail sales by 2015 with annual increases at a rate of 1% to 10% in 2020 and beyond. (DSIRE 2013).
Southwestern Public Service Company (SPS) purchases bundled wind energy from two New Mexico wind facilities; the cost of the RECs is estimated at $1.35/MWh, per a settlement agreement in SPS’s last base rate case (SPS 2012). SPS calculates the projected cost of RPS compliance as the REC cost multiplied by the MWh requirement. For 2014, they estimate the cost of compliance for wind generation at $499,709. To calculate the costs bundled solar energy, SPS estimates the REC costs at $10/MWh; for other solar facilities, the incremental cost is the above-avoided costs (SPS 2012). The total cost of solar for 2014 is projected to be $11,792,771 (SPS 2012).
In 2013, SPS is complying with the RPS by entering into three 20-year PPAs for nearly 700 MW of wind. If the PPAs are approved, assuming customer use of 800 kWh/month, the retail rate is projected to decrease by 60¢ (NM PRC 2013b).
The New Mexico Public Regulation Commission (PRC) has set a cost cap in order to temporarily exempt utilities from meeting the RPS if they spend more than 3% of their gross annual revenues on renewables (Stanfield 2013). All three of the state’s IOUs have either requested waivers from their total RPS obligations and/or have requested modifications to their specific set-aside requirements, in order to remain within the rate impact cap. The Public Service Company of New Mexico (PNM) cap is 2.50% and 2.75% in 2013 and 2014, respectively. PNM’s cost cap methodology was based on projected revenues for 2013 and 2014 from electric charges to retail customers and separately calculated revenue contributions attributable to the customers subject to the rate impact cap (PNM 2013).
North Carolina North Carolina’s Renewable Energy and Energy Efficiency Portfolio Standard (REPS) requires IOUs to supply 12.5% of retail electricity sales from eligible energy resources by 2021. Municipal utilities and electric cooperatives must meet a target of 10% eligible energy resources by 2018.The overall target for renewable energy includes technology-specific targets of 0.2% solar by 2018, 0.2% energy recovery from swine waste by 2018, and 900,000 MWh of electricity derived from poultry waste by 2014 (DSIRE 2013).
Progress Energy Carolinas Inc. (PEC) indicated that it will be able to comply with the 2012 solar set-aside (0.07% of 2011 retail sales), but will be unable to meet its 2012 swine waste and poultry waste set-aside requirements. Utilities in North Carolina jointly filed to have the swine
93
This report is available at no cost from the National Renewable Energy Laboratory (NREL) at www.nrel.gov/publications.
and poultry waste set-aside requirements delayed until 2014; the North Carolina PUC staff has agreed with this recommendation (NC PUC 2013).
RTI International and La Capra Associates, Inc. (2013) calculated the rate impact of REPS compared to the conventional portfolio by dividing the difference in total generation costs by projected North Carolina retail sales. The result is an estimate of the ¢/kWh impact customers can expect to see in their bills as a direct result of REPS. For a typical North Carolina residential customer, assuming use of 1,151 kWh of electricity/month, the monthly estimated savings amount to almost 50¢ in 2012 and more than $1.00 by 2024 (RTI International 2013).The data show that over the 20-year period of REPS, electricity rates are expected to be lower than they would have been if North Carolina had continued to use only conventional generation sources, resulting in $173 million in generation cost savings compared to the conventional portfolio by 2026.
New York New York’s RPS requires IOUs to procure 30% of electricity sales from renewables by 2015, of which 20.7% will be from existing renewable energy facilities, and 1% is expected to be met through voluntary green power sales.
The New York State Energy and Research Authority (NYSERDA), which procures renewables for the utilities through its main tier and customer-sited tier programs, requires 10.4 million MWh of renewable energy annually in 2015. By the end of 2012, NYSERDA already achieved the main tier and customer-sited tier 2015 targets at 47% and 33%, respectively (NYSERDA 2013a).
The aggregate MWh weighted average award price (RECs only) from the seven Main Tier solicitations is $19.25/ MWh. The seventh solicitation, completed in 2011, yielded the highest weighted average award price ($28.70/ MWh). The third solicitation, completed in 2008, resulted in the lowest award price ($14.75/MWh) (NYSERDA 2013a). Wind power is the predominant generating technology in the Main Tier, capturing 1,653 MW of new renewable capacity under contract, of which 1,561 MW was in operation at the end of 2012 (NYSERDA 2013a).
NYSERDA conducted a cost-benefit analysis to determine the renewable energy premium (incentive cost) and the retail rate impact from the RPS. The renewable energy premium was calculated by modeling the costs to construct, operate, and maintain a renewable facility over its useful life and comparing those costs to revenue streams from the market and other sources, such as federal incentive programs. If revenues from renewable sources exceed the costs, the investment is cost-effective. Then, the retail rate impact is calculated by dividing the total above-market costs (as determined by the premiums paid) by total annual electricity expenditures in New York (NYSERDA 2013b). The maximum annual net rate impact of the RPS was 0.12% over the study period (2002-2037). Retail rates are expected to decrease by about $23 million over the study period compared to a total retail expenditure level of $256 billion for New York ratepayers (NYSERDA 2013b).

94
This report is available at no cost from the National Renewable Energy Laboratory (NREL) at www.nrel.gov/publications.
Ohio Ohio’s Alternative Energy Portfolio Standard (AEPS) requires that electricity retailers, excluding municipal utilities and electric cooperatives provide 25% of their electricity from alternative energy by 2025. Half must come from wind, hydropower, geothermal, and biomass resources. Of that 12.5%, 0.5% must come from solar energy. At least half of the renewable energy must be generated in-state and energy efficiency qualifies for fulfilling the requirement (DSIRE 2012).
In 2011, the total statewide AEPS compliance obligation net of the solar carve-out was approximately 1.3 million MWh, which slightly exceeded the required REC compliance obligation. The total solar carve-out obligation, including deficiencies from previous years that were rolled forward to 2011, was 42,089 MWh, with nearly 100% of the requirement having been satisfied (PUCO 2013).
The Ohio Public Utilities Commission (PUCO) calculated the weighted average REC cost for electric distribution and electric service companies based on the information provided in the utilities’ 2011 compliance reports (see Table 18).57
Table 18. The Weighted Average Cost/REC for Ohio’s Electric Distribution Utilities and Electric Service Companies in 2011
Category Electric Distribution Utilities (average $/REC)
Electric Service Companies (average $/REC)
Ohio Solar 228.7 307.7 Other Solar 157.8 148.1 Ohio Non-Solar 110.5 20.8 Other Non-Solar 19.4 5.97
Source: PUCO 2013 Several utilities recover administrative costs and the cost of REC purchases through an alternative energy resource rider (AER-R) on customer bills, which may not exceed 3% of retail rates. PUCO’s cost cap methodology consists of comparing incremental costs (not including ACPs which utilities cannot recover from ratepayers) to “reasonable expected costs of generation,” which may not necessarily include the net retail revenue requirement, depreciation, tax gross-up, and a rate of return (Stockmayer et al. 2012, p. 157). Utilities may not count construction or environmental expenditures of generation resources that are passed on to consumers through a surcharge against the 3% cap (Stockmayer et al. 2012). In 2012, the RPS monthly surcharge for residential customers was $5.76 and $0.77 for FirstEnergy (Ohio Edison, Cleveland, Toledo Edison) and Dayton Power & Light, respectively (DP&L 2011; Ohio Edison 2011; Cleveland Electric Illuminating Co. 2011; Toledo Edison Company 2011).
In 2013, PUCO studied the changes in wholesale electricity prices and generator emissions that are likely to occur as a result of the AEPS. In the scenario which only includes operational projects, wholesale electricity prices are estimated to be reduced by approximately 0.15% in 2014 (PUCO 2013). 57 Compliance markets continue to evolve, so prices provided in Table 19 should not be interpreted as indicative of current market prices.

95
This report is available at no cost from the National Renewable Energy Laboratory (NREL) at www.nrel.gov/publications.
Oregon Oregon’s RPS requires the largest utilities to supply 15% of their retail electricity sales from renewable sources by 2015, 20% by 2020, and 25% by 2025. In addition 20 MW-AC of solar PV systems (sized 500 kW to 5 MW) must be installed by 2020. Utilities with less than 1.5% of state load must meet a 5% RPS, while utilities with 1.5% to 3% of state load must meet a 10% RPS by 2025. However, utilities that buy into or sign a contract for new coal power are subject to the “large utility” standards. At least 8% of Oregon’s retail electrical load will come from small-scale renewable energy projects with a capacity of 20 MW or less by 2025 (DSIRE 2012).
Oregon’s two largest utilities, PacifiCorp and Portland General Electric Company (PGE), have met 100% of the 2011 RPS compliance obligations. In 2011, PacifiCorp reported 650,729 MWh of banked RECs that were used to meet the RPS. At the end of 2011, PacifiCorp owned 1,031 MW of wind-powered generation capacity and had entered into PPAs for the output from 749 MW of wind capacity (Pacific Power 2012).
For CY 2012, PGE reported that it would meet the RPS with 140,800 unbundled RECs.58 PGE’s projected annual revenue requirement is $1,709,111,606 and the total cost of RPS compliance for CY 2012 is $3,859,811. The cost of compliance as a percentage of the revenue requirement is 0.23% (PGE 2013). PacifiCorp calculated the incremental cost of compliance at -.60% for 2011, meaning that the RPS lowered costs (Pacific Power 2012).
The Oregon PUC established the ACP at a rate of $50/MWh for 2011. In addition, there is a rate impact cap. If compliance costs exceed 4% of the utility’s annual revenue requirement for a CY, electric utilities are not required to fully comply with the RPS during that year (DSIRE 2012).
Pennsylvania Pennsylvania’s Alternative Energy Portfolio Standard (AEPS) requires electric distribution companies and electric generation suppliers to supply 18% of electricity using alternative energy resources including energy efficiency measures by 2021. A solar requirement of 0.5% is included in the Tier I requirement under the same schedule. For non-solar resources, the ACP is fixed at $45/MWh. Solar ACPs are calculated as 200% of the sum of the average cost for solar Alternative Energy Credits (AECs) plus the levelized value of non-Pennsylvania upfront rebates for solar PV systems (DSIRE 2012; PPUC 2013).
For CY 2012, the AEPS requirement was 0.0325% for solar, 3.4675% for non-solar Tier I resources, and 6.2% for Tier II. The average price of unbundled AECs for solar was $180.39, $5.23 for non-solar Tier I resources, and $0.17 for Tier II. In total, the annual compliance requirement was 13,877,487 MWh, fulfilled by Load Serving Entities (LSEs) at an estimated total cost of $35,867,115.59 In CY 2012, no ACPs were required. The three main technologies used to generate Tier I AECs in CY 2012 were wind, wood and solid biomass, and black liquor gasification, which contributed with 50%, 12%, and 11% of the total retired AECs, respectively.
58 The total cost of bundled RECs was redacted due to the proprietary nature of information. 59 The average AEC price for each tier was used in this estimate, even though average prices were calculated by PPUC using only data from the subset of AECs for which there was a known price.

96
This report is available at no cost from the National Renewable Energy Laboratory (NREL) at www.nrel.gov/publications.
Pumped-storage hydropower was used to generate 65% of the retired Tier II AECs in CY 2012, followed by waste coal, with 16.5% (PPUC 2013).
Rhode Island Rhode Island’s RES requires the state’s retail electricity providers to supply 16% of their electricity sales from renewable resources by the end of 2019. The requirement began at 3% at the end of 2007, and then increases an additional 0.5%/year through 2010, 1%/year from 2011 through 2014, and 1.5%/year from 2015 through 2019. Aside from the RES, “The Long-Term Contracting Standard for Renewable Energy” requires electric distribution companies enter into long-term contracts for 90 MW in capacity by 2014 from new renewable energy facilities, of which 3 MW must come from in-state solar facilities (DSIRE 2013).
In CY 2011, the statewide RES was met with 27.3% biomass, 12.2% wind, and 5.0% hydro resources. Seventeen entities had Rhode Island RES obligations and a total of 201,129 MWh were retired for RES compliance. A total of 84,402 MWh or 29.6% valued at $5,243,896 of RES compliance was met with ACPs at a rate of $62.13/MWh (PUC 2011).
Narragansett Electric incurred costs of $8.43 million to meet the 2001 new and existing RES obligations. In 2010, the RES charge was .00123¢/kWh representing a rate impact of 62¢/month for an average residential payer. As of April 2011, the RES charge turned into a bill credit of .00031¢/kWh or approximately .15 ¢/month (PUC 2011). In 2012, the average annual RES charge was estimated to be .00182¢/kWh, resulting in a rate impact of $1.08/month.
Texas Texas’s RPS requires all municipally-owned utilities, generation and transmission cooperatives, and distribution cooperatives that offer customers a choice of retail providers; retail electric providers (REPs); and IOUs that have not been unbundled under deregulation to acquire a total of 5,880 MW of renewable energy resources by 2015 (about 5% of the state’s electricity demand), including a target of 500 MW of renewable energy capacity from resources other than wind, and 10,000 MW by 2025 (DSIRE 2013).
Renewable energy generation totaled 29.9 million MWh in 2013, with wind accounting for 28.9 million MWh (ERCOT 2014). In CY 2012, the total RPS requirement for all retail entities, after adjustments for previous true-ups as required by the Texas Public Utility Commission (PUCT), was 12,119,614 RECs (PUCT 2012).
As of 2012, Texas penalizes entities $50/MWh if a utility falls short of compliance with the RPS targets (Stockmayer et al. 2012). However, with over 12,000 MW of renewable generation capacity, Texas has exceeded its goal of 10,000 MW by 2025.
Washington Washington’s RES requires all electric utilities that serve more than 25,000 customers to obtain 15% of their electricity from new renewable resources by 2020 and pursue “cost-effective” energy conservation (DSIRE 2013).

97
This report is available at no cost from the National Renewable Energy Laboratory (NREL) at www.nrel.gov/publications.
In CY 2012, Puget Sound Energy (PSE) met initial 2012 RES requirements of 3% with more than 635,958 RECs and could already potentially reach the 9% 2016 goal if it uses its excess RECs. According to the utility’s 2012 compliance report, the incremental costs of eligible renewable resources were $27.83 million (PSE 2012). PacifiCorp plans to pursue compliance in through the purchasing of RECs while PSE and Avista have developed new renewable energy generation resources and are purchasing RECs. All three IOUs have met the 2012 target.
The incremental cost of a renewable resource is defined as the difference between the levelized cost of the renewable resource compared to an equivalent non-renewable resource. PSE’s calculation of the cost of non-renewable resources included capacity cost, energy cost, and imputed debt. If the incremental cost is greater than 4% of its revenue requirement, as established by the Washington UTC, then a utility will be considered in compliance with the RES.
The Renewable Northwest Project and NW Energy Coalition found a lack of consistency in the incremental cost calculations employed by the three utilities (Stanfield 2013a). The costs of compliance, as reported by the utilities in 2012, were $15.73/MWh for PacifiCorp, $20.35/MWh for Avista, and $43.76/MWh for PSE. These costs made up the following portions of the revenue requirements for each utility: 0.61% 0.80%, and 1.36% respectively. The Washington UTC is addressing cost standardization as it considers revisions to its RPS rules (Docket UT-131723).
Wisconsin Wisconsin’s RPS has a goal of 10% of all electric energy consumed in the state to be supplied by renewable energy by the end of 2015 (Wis. Stat. § 196.378). Each electric provider in the state has its own RPS requirement, ranging from 6.64% to 22.47%, depending on how much renewable electricity it provided in 2003 (PSCW 2013). Collectively, utilities in Wisconsin had met three-quarters of the 2015 RPS requirement by 2010. Also, all 118 electric providers met their individual 2010 RPS requirement (PSCW 2012).
In 2012, the Public Service Commission of Wisconsin (PSCW) estimated the costs of statewide RPS compliance to be between 1% and 1.1% of the utilities’ revenue requirements for calendar years 2008 through 2010. Using two similar methods, the PSCW compared the levelized cost of electricity produced by the renewable energy sources added after the enactment of the state’s RPS with the marginal cost of energy in the Midwest regional energy market (PSCW 2012).