A Survey of Labour Market Demands, 2013 AKBmpms.rks-gov.net/Portals/0/Librat/English-Hulumtimi i...
56
Transcript of A Survey of Labour Market Demands, 2013 AKBmpms.rks-gov.net/Portals/0/Librat/English-Hulumtimi i...

A Survey of Labour Market Demands, 2013 ‐ AKB
2
Editor: Dr.Agim Shahini, President of AKB
Liman Asllani, Coordinator for Prizren
Dr. prof. Mustaf Pllana
Publishedby: AllianceofKosovar Businesses
Dateofpublication: March, 2014
©:aleancakosovarebizneseve
Supported by: Ministry of Labour and Social Welfare


A Survey of Labour Market Demands, 2013 ‐ AKB
4
6.2 Main types of education/training.................................................................................................... 48
6.3 Training provider........................................................................................................................... 48
6.4 Training duration........................................................................................................................... 49
6.5 Training support.............................................................................................................................. 50
Conclusions....................................................................................................................................... 52
Recommendations............................................................................................................................ 55


A Survey of Labour Market Demands, 2013 ‐ AKB
6
B. Figures
Content Page
Figure 1 Type of enterprises 15
Figure 2 Number of enterprises and employees by economic sector 17
Figure 3 Expected placement in future 18
Figure 4 Success of enterprises in 12 past months 19
Figure 5 Classification of employees by occupation 20
Figure 6 Classification of employees by occupation and gender 21
Figure 7 Manners of filling the vacancies 22
Figure 8 Vacancies by occupation 24
Figure 9 Vacancies by occupationin 12 next months 26
Figure 10 Reasons for not filling the vacancies 27
Figure 11 Plans of the company to overtake the problem of lack of employees 28
Figure 12 Quotes for employment of foreign citizensby economic sector 30
Figure 13 Quotes for employment of foreign citizensby 10 most sought occupations 31
Figure 14 Average monthly salary 35
Figure 15 Salaries by sector 36
Figure 16 Salaries by gender 37
Figure 17 Salaries byskills 38
Figure 18 Salaries by age 38
Figure 19 Salaries by region 39
Figure 20 Types of contracts of employees 40
Figure 21 Employment contracts by timeframe 41
Figure 22 Facilities / Benefits for employees 42
Figure 23 Implementation of labour law in enterprises 44
Figure 24 Obstacles on implementation of labour law 44
Figure 25 Definition of the minimum salary by ESC 45
Figure 26 Definition of the minimum salaryon creation of new vacancies 46
Figure 27 Difficulties to find qualified employees by occupation 47
A Survey of Labour Market Demands, 2013 ‐ AKB
7
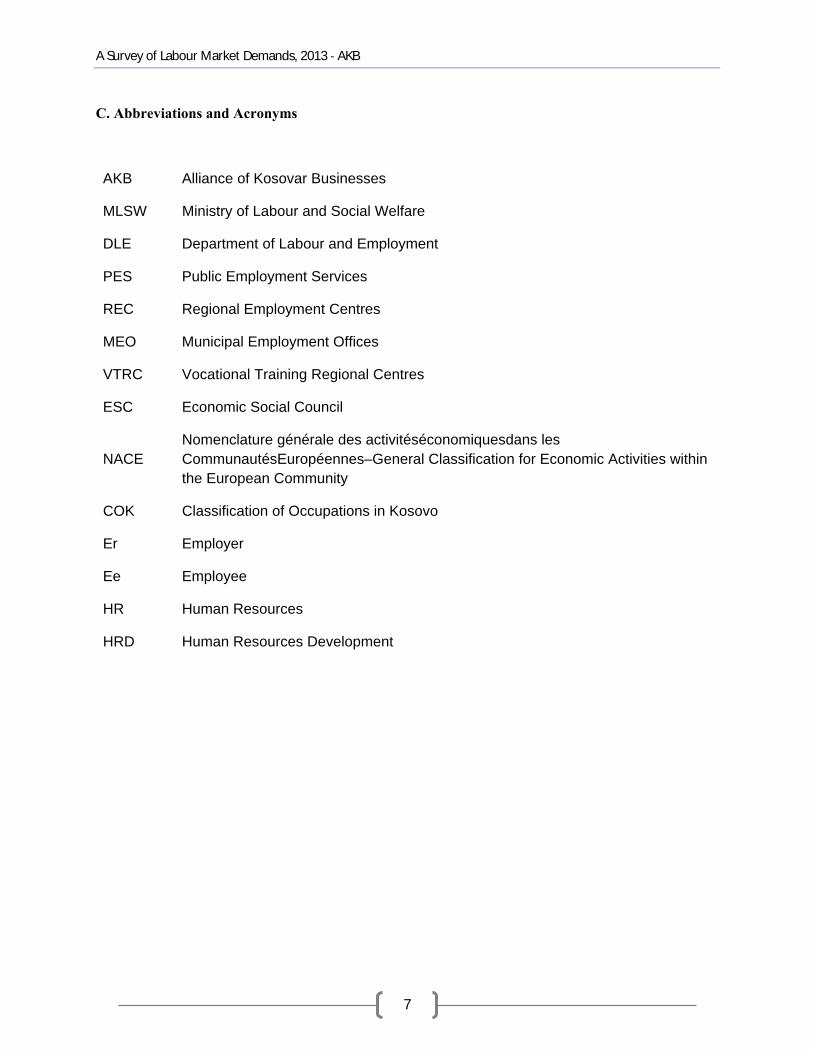
C. Abbreviations and Acronyms
AKB Alliance of Kosovar Businesses
MLSW Ministry of Labour and Social Welfare
DLE Department of Labour and Employment
PES Public Employment Services
REC Regional Employment Centres
MEO Municipal Employment Offices
VTRC Vocational Training Regional Centres
ESC Economic Social Council
NACE Nomenclature générale des activitéséconomiquesdans les CommunautésEuropéennes–General Classification for Economic Activities within the European Community
COK Classification of Occupations in Kosovo
Er Employer
Ee Employee
HR Human Resources
HRD Human Resources Development

A Survey of Labour Market Demands, 2013 ‐ AKB
8
Introduction
Alliance ofKosovar Businesses in continuity as in the previous years, this year as well is conducting a
labour marketdemand survey. This survey is supported by the Ministry of Labour and Social Welfare.
The key aim of this Survey has been the identification of labour market needs.
Trends in the labour market and the dynamics of various activities require specific and annual study
considering that it is in a process of permanent development and accompanied with rapid changes.
Labour market is characterised with challenges which require studying, and such surveys must be of
special interest. Economic developments, in particular the labour market is very important, which in one
way are characterised with reduction of social problems, enhancement of quantitative and qualitative
services for jobseekers in Kosovo.Likewise, for creation of conditions and possibilities for employment
and vocational trainings in conformity with the labour market demands.
Significant occurring changes in the labour market remain important, along with the reflection of
employer and employee. Contribution of employers has always been highly valued due to the fact of
qualitative data extraction in order for policy making to be based on facts and evidence.
Labour market demand for increase of skills of labour force, respectively of development of human
capital to be arranged in harmony with the needs of the labour market, therefore the Alliance of Kosovar
Businessesand the Ministry of Labour and Social Welfarein cooperation also with otherlocal partnersand
international organisations have made continuous efforts in order to make the labour market to be in
coherence with the demands. The labour force demand must be addressed to other relevant stakeholders
who have the real possibility of increasing their knowledge and capabilities.
The Alliance of Kosovar Businessesin cooperationwith the Ministry of Labour and Social Welfarehave
coordinated their activities for undertaking this Surveyby dividing this study into several parts, such as:
General aspects
Quotes for employment of foreign citizens
Vacancies by occupation,
Vocational training enhancement,
Average salary and
Employment conditions.

A Survey of Labour Market Demands, 2013 ‐ AKB
9
Aim
The aim of this Survey is to continuously have record of the labour market in order to have the drafting of employment policies in harmony with market demands. Information remains the key important resource; therefore such studies help all labour market
stakeholders, in particular decision and policy makers.
Information on labour market not only forMinistry of Labour and Social Welfare and the Ministry of
Education, Science and Technology, but for all local and international institutions there will be created a
real and factual mirror on the dynamics of labour market development.
Drafting employment and vocational training policies in the labour market without having qualitative
registry or data and without undertaking a proper scientific study of the labour market, the expected
results will never be achieved.
The current situation in the labour market, the level of professional capacities and skills of human
resources (HR) compared to needs of the labour market forMLSW and for other institutions would be the
key information from which the employment policies are to be developed.
So, through Public Employment Services (PES) there would continuously be developed the quality of
services provided by employment offices for unemployed, employment consultancy would develop
further, training consultancy, consultancy for occupational orientation, consultancy for career orientation,
self-employment etc.
Thereforethe aim of this survey is to collect required information on:
Current situation in the labour market.
Currentneeds for Human Resources (HR),
Challenges and difficulties in the Human ResourcesDevelopment (HRD)
Plans for HRD at enterprises
Directing activities of PES as per requirements of labour market
Orientation of activities of VTC-s based on labour market needs
Distribution of such information to the partners.

A Survey of Labour Market Demands, 2013 ‐ AKB
10
Methodology
The survey process has been conducted through the method of questioning interviews, by directly
contacting the responsible persons of the selected enterprises, the interview was done one to one.
Questions and questionnaires were prepared in a way as to achieve the foreseen aims and were
synchronised with each other.
Questionnaire was divided in some main parts as below:
A. General questions about the enterprise
B. Quotes for employment of foreigners
C. Personnel recruitment
D. Study of average salary
E. Work conditions for the employees
F. Training needs
Questions were mainly standardised, and they were synchronised as per their character, and they are:
Economic entities by NACE (Nomenclature générale des activitéséconomiquesdans les
CommunautésEuropéennes–General Classification of the Economic Activities within the
European Community).
Determining the Quote for employment of foreign citizens in Kosovo according to economic
activity and by occupational nomenclature.
Employees by occupation based on COK (Classification of Occupations in Kosovo based on the
nomenclature of occupations according to the system 2 digit and 6 digit)
Vacancies by occupation based on COK
Anticipation about Vacancies by occupations in future
Difficulties on finding employees by occupation
Manner of filling the vacancies by Employers
Training needs for recruitment of employees

A Survey of Labour Market Demands, 2013 ‐ AKB
11
Training needs for existing staff
Training needs identified by entities which gave positive answer.
Average salary in country level
Average salary by sectors of activities
Average salary byskills
Average salary byregion
Work conditions
Employment contracts of employees
Definition of minimum salaries by ESC
Benefits of employees
Etc.
Definitions
Analysis during this Survey for Vacancies and offers for vocational training has been focused in ten most
soughtoccupations by their number (top 10), because it is not possible to include all occupations, whereas
“other occupations” representing the occupations which are distributed in lower number by demand.
Whereas the Quote for employment of foreign citizens except top 10 most sought positions the list for all
demanded profiles has been reflected.
Nomenclature of Economic Activities (NEA) is oriented in the international standard classification of
economic activities, NACE (Rev. I), but still not completely suitable:
o (A) agriculture / forestry
o (B) fishing
o (C) mining
o (D) production
o (E) electricity / gas / water
o (F) construction
o (G) trade
o (H) hoteliers / gastronomy
o ( I ) transport / communications

A Survey of Labour Market Demands, 2013 ‐ AKB
12
o (J / K) finance / real estate etc.
o (M) education
o (N) / social care
o (O) services (NGO) / organisations
Economic Sectors
Primary sector ( A-B)
Secondary sector (C-F),
Tertiary sector (G-O,Q).
Occupational classes
1. Legislator, high officials and managers
2. Professionals
3. Other similar technicians and professionals
4. Clerks
5. Employees of services and sale workers in shops and in market
6. Qualified agricultural and fishery workers
7. Craftsmen and similar workers
8. Operators and assemblers of equipment and machinery
9. Elementary professions
10. Armed forces

A Survey of Labour Market Demands, 2013 ‐ AKB
13
SAMPLES
The criteria for selection of the sample were as follows:
Number of employees (5 or more employees),
Economic activity of enterprises according to NACE and
Regional distribution.
Labour market demands survey was conducted in 2100 businesses, whereas we have received responses
from 1480 businesses or 70.5%.
Survey has covered all the regions of Kosovo by taking into consideration the number of registered
enterprisesand those which have 5 or more employees.
Interviewing the respondents, logical check, entering into database of records, analysis of data and editing
were developed in the period of December 2013 until March 2014.

A Survey of Labour Market Demands, 2013 ‐ AKB
14
1. General aspects of enterprises
Responsiveness of enterprises -in the labour market survey 2100 enterprises were under focus, and the
norm of responses is considered to be quite high, having in consideration that 1480 enterprises or 70.4%
of them responded.
Periods of registration of enterprises were mainly representing those enterprises which were registered in
the last decade, or saying it differently after year 2000 and on, thus representing more than 70% of
enterprises.
Existence of enterprises in the market is very importantas this is the element to show that the market of
Kosovo has testified stability and sustainability. Although our enterprises have gone through an economic
transition they have still easily faced the challenges of the time.
1.1. Enterprises by type
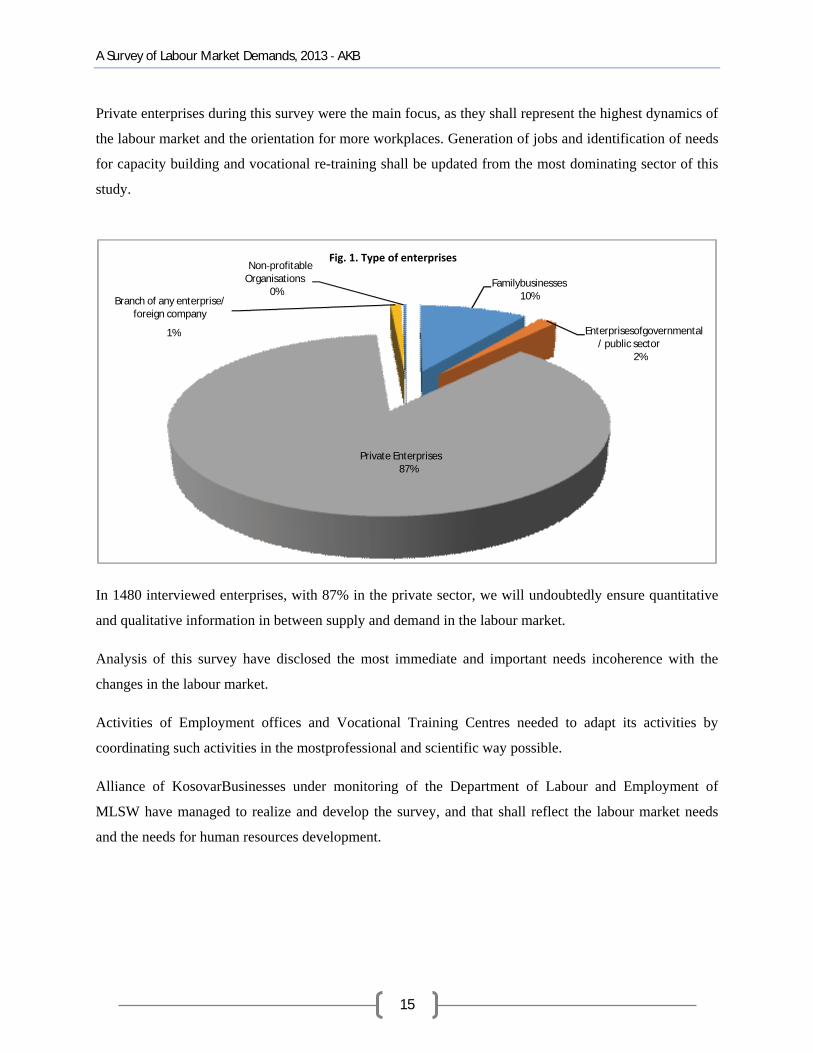
More than 87% of surveyed businesses are mainly enterprises of private sector and based on this, our
analysis has been focused on those enterprises without excluding family businesses too, where their share
is 9.8%, and the enterprises of governmental and public sector by 1.7%, followed by non profitable
organisations and branches of foreign companies having a share of 0.3% respectively 1.0.
Based on this result, private enterprises in the labour market testify a maximum presence and the most
important one of our study, having also the family businesses with a significant percentage.
Table 1. Type of enterprises
No Description Total Percentage (%)
1 Family business 145 9.8%
2 Private enterprises 1291 87.2%
3 Enterprise of governmental / public sector 25 1.7%
4 Branch of any enterprise/foreign company 15 1.0%
5 Non profitable organisations 4 0.3%
Total 1480 100%
A Survey of Labour Market Demands, 2013 ‐ AKB
15
Private enterprises during this survey were the main focus, as they shall represent the highest dynamics of
the labour market and the orientation for more workplaces. Generation of jobs and identification of needs
for capacity building and vocational re-training shall be updated from the most dominating sector of this
study.
In 1480 interviewed enterprises, with 87% in the private sector, we will undoubtedly ensure quantitative
and qualitative information in between supply and demand in the labour market.
Analysis of this survey have disclosed the most immediate and important needs incoherence with the
changes in the labour market.
Activities of Employment offices and Vocational Training Centres needed to adapt its activities by
coordinating such activities in the mostprofessional and scientific way possible.
Alliance of KosovarBusinesses under monitoring of the Department of Labour and Employment of
MLSW have managed to realize and develop the survey, and that shall reflect the labour market needs
and the needs for human resources development.
Familybusinesses10%
Enterprisesofgovernmental/ public sector
2%
Private Enterprises87%
Branch of any enterprise/ foreign company
1%
Non‐profitable Organisations
0%
Fig. 1. Type of enterprises
A Survey of Labour Market Demands, 2013 ‐ AKB
16
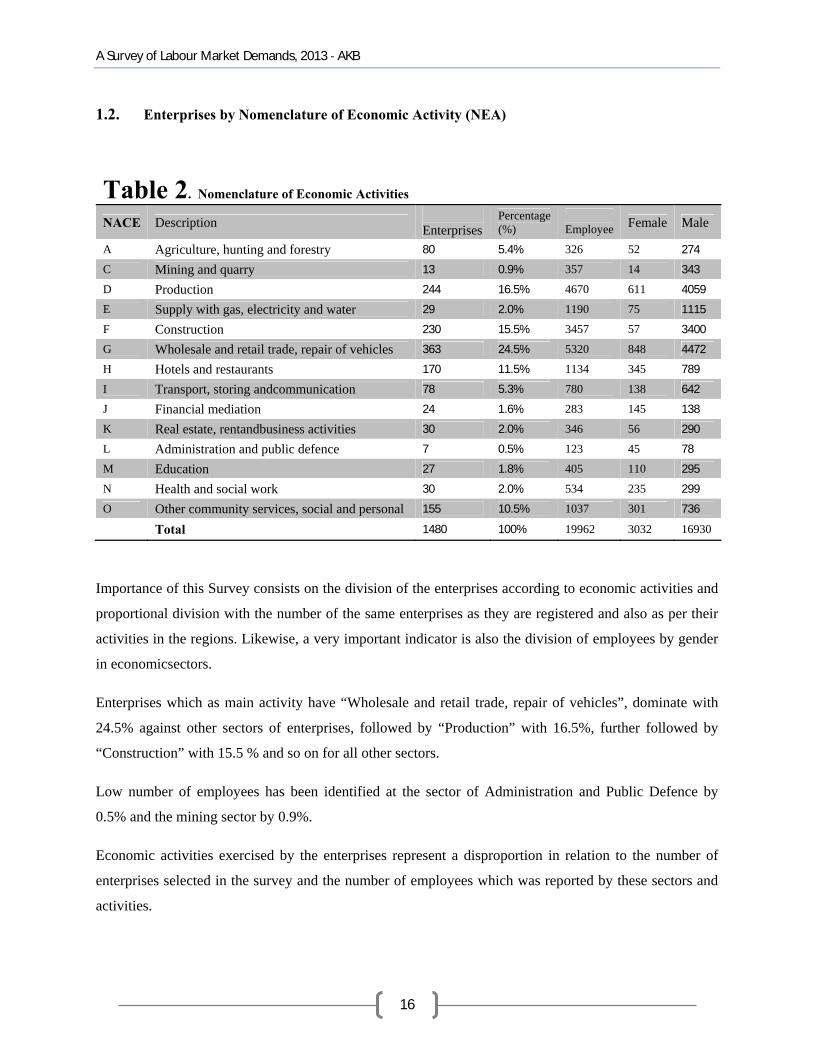
1.2. Enterprises by Nomenclature of Economic Activity (NEA)
Table 2. Nomenclature of Economic Activities
NACE Description Enterprises
Percentage (%)
Employee Female Male
A Agriculture, hunting and forestry 80 5.4% 326 52 274
C Mining and quarry 13 0.9% 357 14 343
D Production 244 16.5% 4670 611 4059
E Supply with gas, electricity and water 29 2.0% 1190 75 1115
F Construction 230 15.5% 3457 57 3400
G Wholesale and retail trade, repair of vehicles 363 24.5% 5320 848 4472
H Hotels and restaurants 170 11.5% 1134 345 789
I Transport, storing andcommunication 78 5.3% 780 138 642
J Financial mediation 24 1.6% 283 145 138
K Real estate, rentandbusiness activities 30 2.0% 346 56 290
L Administration and public defence 7 0.5% 123 45 78
M Education 27 1.8% 405 110 295
N Health and social work 30 2.0% 534 235 299
O Other community services, social and personal 155 10.5% 1037 301 736
Total 1480 100% 19962 3032 16930
Importance of this Survey consists on the division of the enterprises according to economic activities and
proportional division with the number of the same enterprises as they are registered and also as per their
activities in the regions. Likewise, a very important indicator is also the division of employees by gender
in economicsectors.
Enterprises which as main activity have “Wholesale and retail trade, repair of vehicles”, dominate with
24.5% against other sectors of enterprises, followed by “Production” with 16.5%, further followed by
“Construction” with 15.5 % and so on for all other sectors.
Low number of employees has been identified at the sector of Administration and Public Defence by
0.5% and the mining sector by 0.9%.
Economic activities exercised by the enterprises represent a disproportion in relation to the number of
enterprises selected in the survey and the number of employees which was reported by these sectors and
activities.

A Survey of Labour Market Demands, 2013 ‐ AKB
17
Based on the prepared and made questions about the sectors of activity of each enterprise, findings show
that in total 19962 employees were identified, where out of them 3032 employees are of female gender or
approximately 15%.
The highest number of employees is in“Wholesale and retail trade, repair of vehicles”, by 5320 persons
employed, followed by high number of employees in “Production” by 4670 employees, “Construction”
by 3457 employees, thus followed for each activity of each enterprise (see. fig.2).
Enterprises as their main activity have shown the main and two other secondary and tertiary activities
which they shall exercise at the labour market. But the focus of the survey was the primary activity.
1.3. Placement
At the question related to the number of
persons employed, including the interviewed
person during this period of time, and also
comparing of how many persons or
employees the enterprise had in the previous year. Findings have shown positive figures and indicators
were progressive. Based on such a result, our analysis testifies that placement into new jobs has increased
by 2.75%.
This year (2013) number of employees engaged is 19962 persons, whereas in the previous year (2012) the
same enterprises have declared to have had 19427 employees. Comparison of these two years testifies a
growing trend for employment.
Year 2013 is characterised with a slight increase of employment for Kosovar enterprises.
Table 3. Placement by year in enterprises
Year 2012 2013 Increase
Employees 19427 19962 2.75%
A C D E F G H I J K L M N O
Enterprises 80 13 244 29 230 363 170 78 24 30 7 27 30 155
Workers 326 357 4670 1190 3457 5320 1134 780 283 346 123 405 534 1037
Fig. 2: No. Enterprises and workers according to NACE

A Survey of Labour Market Demands, 2013 ‐ AKB
18
Important is the fact that Kosovo during2013has not shown negative trends with decrease of economic
development, but in contrary there have been opened many new workplaces. Undoubtedly the investment
that has been undertaken by the government in the infrastructure and other sectors is seen clearly to have
contributed in the positive trends of employability.
1.4. Employment expectations during 12 coming months
Expectations for employment in 12
coming months more or less remain
constant, thus, such anticipations of
employers in employmentaspect
provide the changes foreseen to happen
in the labour market.
Based on this question, the respondents respectively 905 employers have expressedthat 61% thatthe
employment will remain the same, respectively it will not change, whereas 455 enterprises have declared
that it will increase for
31% and only 120
enterprises declared
that the employment
will decrease for 8%.
Optimism of the
employers for increase
of employment is
shownat1/3 of
respondents also based on these percentages for increase of employment are encouraging.
Tab.4. Expected employment in 12 coming months
No Description Enterprises Percentage 1 Increases 455 31% 2 Decreases 120 8% 3 Remains same 905 61%
Total 1480 100%
Increases,31%
Decreases, 8%
Remains same,61%
Fig.3: Expected employment in 12 coming months in percentage

A Survey of Labour Market Demands, 2013 ‐ AKB
19
1.5. Success of the organisation during 12 past months
Important during this survey has also
been the trend of sales of enterprises
which occurred 12 past months.
Majority of enterprises have testified
for the same situation or 61% of them believe that labour market remained the samein the 12 past months.
Whereas 26% of enterprises have expressed that during 12 past months in the labour market there was
marked a progress and a significant increase.
But 13% of
enterprises have
stressed that there is
a completely
different situation
and they have shown
a decrease or fall in
the labour market.
Thus, it shows that in
general we have had
a stable situation
without any
significant crisis with
a modest percentage of increaseor a situation of constant condition for 12 months of the last year.
1.6. Classification of employees by occupation
Survey on labour market demands reflects distribution of employees according to the nomenclature of
occupations where leading are “Basic occupations” with 23%, followed by “Craftsmen and similar
employees” with 18% and “assistants” with 16%, and so on (see tab. 6).
Tab.5. Success of the enterprise during 12 past months
No Description Enterprises Percentage 1 Increases 384 26% 2 Decreases 196 13% 3 Remains the same 900 61%
Total 1480 100%
Increases, 26%
Decreases, 13%
Remains the Same, 61%
Fig.4: Success of the enterprise during 12 past months

A Survey of Labour Market Demands, 2013 ‐ AKB
20
Table 6. Employees classified by occupation
ISCO Description
Total Percentage (%)
Female Male
1 Senior manager 1294 6% 106 1188
2 Professionals 2390 12% 385 2005
3 Technicians and Professional Co-operators 1259 6% 270 989
4 Assisting employees 3205 16% 880 2325
5 Service employeesand sale in shop and market 1884 9% 498 1386
6 Qualified employees, Agriculture and Fishing 358 2% 37 321
7 Craftsmen and similar employees 3580 18% 98 3482
8 Operators and Assemblers of machinery equipment 1497 7% 83 1414
9 Basic occupations 4495 23% 675 3820
Total 19962 100% 3032 16930
Survey is also important because of the fact that reflection of data based on occupations indicates which
are the dominating occupations in Kosovo economy, in fact where employment is concentrated and in
what occupation.
This occupational distribution is also reflection of data by gender where one more argument is presented
regarding quality of data.
In fact the highest employment is by male gender (85%), whereas employment of females is in a
percentage not higher thane 15%. In all occupations the male employment is dominant (see fig.6)
6%
12%
6%
16%
9%
2%
18%
7%
23%
Senior manager
Professionals
Technicians and Professional Co-operators
Assisting employees
Service employees and sale in shop and market
Qualified employees, Agriculture and Fishing
Craftsmen and similar employees
Operators and Assemblers of machinery equipment
Basic occupations
Fig.5: Employees of enterprises by occupation

A Survey of Labour Market Demands, 2013 ‐ AKB
21
2. Vacancies
2.1. Manners of filling the job vacancies
Vacancies still remain very important issues, therefore Employers still apply different forms for filling the
vacant positions.
As to how the vacancies were filled during this period of time, this survey is going to provide more
findings. Although awareness and culture of work is increasing constantly about how the selection is
conducted through more advanced forms such as public notices or public employment services.
Employment still remains a challenge, but unemployment which is quite high in figures often also omits
the possibility for professional manners of recruitment.
Table 7. Manners of filling the vacant job positions
No. Methods Mainly Second method Total Percentage (%)
1 Through advertisements 644 73 717 37.8% 2 Through education/training institutions 46 27 73 3.8% 3 Through public employment services 252 181 433 22.8% 4 Through friends and family 352 225 577 30.4% 5 Through promotion in enterprise 42 57 99 5.2%
Total 1336 563 1899 100.0%
0 1000 2000 3000 4000 5000
Senior manager
Professionals
Technicians and Professional Co‐operators
Assisting employees
Service employees and sale in shop and market
Qualified employees, Agriculture and Fishing
Craftsmen and similar employees
Operators and Assemblers of machinery equipment
Basic occupations
Fig.6: Staff of enterprises according to professional and gender division
Female
Male

A Survey of Labour Market Demands, 2013 ‐ AKB
22
Mainly based on the results, the highest number of employees is done “Through advertisements”, with
37.8%, whereas through“Family and friends”, with 30.4% followed by “Public employment services”,
with 22.8%, and through education and training institutions and through promotion of employment in
enterprise by 3.8% respectively 5.2% (see tab.7).
Filling of vacancies based on this analysis verifies that results are relatively good even though still
remaining in the second position with employment “Through family and friends” a category which is
quitespecific,and maybe it interlinks with the nature of our businesses where the majority are small
enterprises with less than10 employees (1-9).
It is important that the employers select also public employment services for filling the vacant job
positionschoose advertisements and this percentage is growing from year to year and also the public
employment servicesresulting in a quite high percentage of participation.
Second method – Employers declare that the second method of filling the vacancies is done through
relatives and friends and through the public employment services(see fig 7).
The main reason at the second method for filling the vacant places as a second option chooses the public
employment services, because these offices have a considerable number of unemployed who are
registered and are of many profiles and finally selection is made through such services.
644
46
252
352
42
73
27
181
225
57
0 100 200 300 400 500 600 700 800
Through advertisements
Through education/training institutions
Through public employment services
Through friends and family
Through promotion in enterprise
Fig: 7. Manners of filling the vacant job positions
Mainly
Second method

A Survey of Labour Market Demands, 2013 ‐ AKB
23
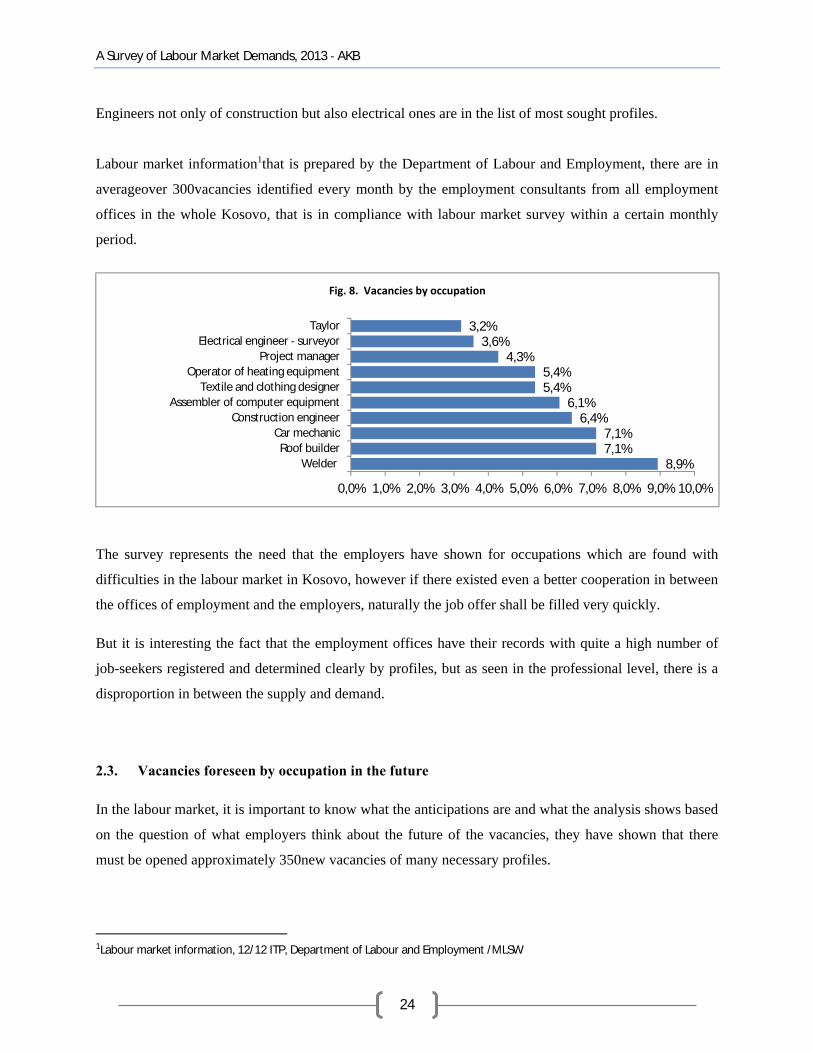
2.2. Vacancies according to the nomenclature of occupation
As part of this survey there have been identified a considerable number of requests from employers for
job vacancies that approximately reach280 job vacancies.Here are presented 10 most sought occupations,
whereas other occupations refer to occupations with smaller number.
Table 8. Vacancies according to occupations
Code Description Total Percentage
7212.03 Welder 25 8.93%
7131.01 Roof builder 20 7.14%
7231.02 Car mechanic 20 7.14%
2142.02 Construction engineer 18 6.43%
8283.04 Assembler of computer equipment 17 6.07%
3471.01 Textile and clothing designer 15 5.36%
8163.03 Operator of heating equipment 15 5.36%
2419.09 Project manager 12 4.29%
2143.12 Electrical engineer ‐ surveyor 10 3.57%
7433.03 Taylor 9 3.21%
Other occupations 119 42.50%
Total 280 100%
The requests of employers respectively requests for vacancies are different, so that because of such
diverse natures of requests then we made a selection of those job vacancies where requests were more
than (10 most requested job vacancies). These vacancies are found within this time period while the
survey was developed.
Realistically it is seen in the figure that the highest number of requests for new vacancies came
from“welder” with8.93% followed by “Roof builder” with7.14%, further followed by “Car mechanic”
by7.14% and “civil construction engineer” with6.43% and so on.
Based on offers for these job vacancies which have been declared by the employers we come to the
conclusion thatthe following profiles are identified in sectors of construction andinfrastructure. Sector of
construction is on its progress of economic development and very important for the Kosovar economy.
Taylor is also a much sought profile in the field of textile and in the top list of most sought profiles is
ranked as 9th on the list.
A Survey of Labour Market Demands, 2013 ‐ AKB
24
Engineers not only of construction but also electrical ones are in the list of most sought profiles.
Labour market information1that is prepared by the Department of Labour and Employment, there are in
averageover 300vacancies identified every month by the employment consultants from all employment
offices in the whole Kosovo, that is in compliance with labour market survey within a certain monthly
period.
The survey represents the need that the employers have shown for occupations which are found with
difficulties in the labour market in Kosovo, however if there existed even a better cooperation in between
the offices of employment and the employers, naturally the job offer shall be filled very quickly.
But it is interesting the fact that the employment offices have their records with quite a high number of
job-seekers registered and determined clearly by profiles, but as seen in the professional level, there is a
disproportion in between the supply and demand.
2.3. Vacancies foreseen by occupation in the future
In the labour market, it is important to know what the anticipations are and what the analysis shows based
on the question of what employers think about the future of the vacancies, they have shown that there
must be opened approximately 350new vacancies of many necessary profiles.
1Labour market information, 12/12 ITP, Department of Labour and Employment /MLSW
8,9%7,1%7,1%
6,4%6,1%
5,4%5,4%
4,3%3,6%
3,2%
0,0% 1,0% 2,0% 3,0% 4,0% 5,0% 6,0% 7,0% 8,0% 9,0% 10,0%
Welder
Roof builder
Car mechanic
Construction engineer
Assembler of computer equipment
Textile and clothing designer
Operator of heating equipment
Project manager
Electrical engineer ‐ surveyor
Taylor
Fig. 8. Vacancies by occupation

A Survey of Labour Market Demands, 2013 ‐ AKB
25
The highest number of vacancies for the sought occupations in the future, majority of them refer
to“carpenter of furniture”with10.9% followed by “Doctor, advisor/doctor, advisor for medical insurance”
with10.0%, further on followed by “Team leader of car mechanics and assemblers of industrial machinery
and other machinery” with8.3%, “Financial analyst”, 7.7%and so on.
Table. 9: Vacancies by occupation
Code Description Total Percentage
7422.05 Carpenter of furniture 38 10.9%
2229.06 Doctor ‐ advisor, advisors for health insurance 35 10.0%
7233.01 Car mechanic group leader / assembler of industrial and other machinery 29 8.3%
2411.04 Financial analyst 27 7.7%
3411.01 Stocks agent 25 7.1%
3119.03 Technician of textile technology 20 5.7%
2149.01 Engineer / wood engineer 19 5.4%
2411.08 Finance expert / auditor / accountant 13 3.7%
7241.16 Electrical appliance repairer 12 3.4%
7233.13 Maintenance worker for pneumatic and hydraulic equipment 11 3.1%
Other occupations 121 34.6%
Total 350 100%
Employment offices of the Department of Labour and Employment of MLSW according to registers
possess quite a high number of job-seekersclassified according to occupation profiles. But it would be
ideal if cooperation between employers and employment offices to enhance further their cooperation in
order to seek jobseekers who may suit to such profiles and to create the possibility for job mediation.
But when seeing the methods of filling the vacancies, considering that one of these methods which is
10,90%
10,00%
8,30%
7,70%
7,10%
5,70%
5,40%
3,70%
3,40%
3,10%
0,00% 2,00% 4,00% 6,00% 8,00% 10,00% 12,00%
Carpenter of furniture
Doctor ‐ advisor, advisors for health insurance
Car mechanic group leader
Financial analyst
Stocks agent
Technician of textile technology
Engineer / wood engineer
Finance expert / auditor / accountant
Electrical appliance repairer
Maintenance worker for pneumatic and hydraulic equipment
Fig.9. Vacancies y occupation in 12 next months

A Survey of Labour Market Demands, 2013 ‐ AKB
26
mainly applied is through relatives and friends. Where opportunities for a quick employment or for a
matching of the supply and demand is further hampered.
Important is that according to information the employment offices are in daily contact with the employers
requesting for vacancies for any mediation in employment for the job-seekers.
Based on the analysis there have been identified many other even more specific occupations, which have
come out as a result of this survey, but such demands from the employers remain to be coordinated with
employment offices and to coordinate with supply and demand.
2.4. Difficulties on finding employees
Difficulties for finding employees are quite much present for filling the vacant jobs, out of1480economic
entities893enterprises stated that they do not face difficulties and only587of them declared that they face
difficulties to fill the vacancies.
But each enterprise has its own reasons, but which are the reasons declared by the employers for the
difficulties on finding the employees for filling the vacancies?! In our analysis several reasons are listed
(see tab. 10).
Fig.10: Reasons for not filling the vacant positions
No. Description Total No Yes
1 In general the low number of job‐seekers 68 38 30
2 People not interested for a certain job 90 39 51
3 The offered salary is very low 85 55 30
4 Conditions of work not so attractive 48 35 13
5 Lack of career opportunities 55 22 33
6 Candidates lack the necessary work experience 75 15 60
7 Candidates have low motivation 45 17 28
8 Candidates have low qualifications/skills 65 12 53
9 Candidates have low level of education 56 8 48
Total 587 241 346
It results that 90 enterprises indicate thatthere is “Lack of interest of people for this job”, whereas39of
them declare that there is not a particular reason which would make difficult filling the vacant job
positions.

A Survey of Labour Market Demands, 2013 ‐ AKB
27
Another difficulty appearing as quite challenging is that of “Salaries offered which are very low”,where
85 enterprises stated this difficulty whereas 30 of them responded that this difficulty does not exist for
filling the vacant job positions.
Another reason is Motivation, Low Salaries that are offered thus indicating as significant difficulties for
filling the job vacancies. Realistically in the diagram there are presented several reasons which indicate
the difficulties that have been met on realization and fulfilment of the job vacancies.
We consider that attention is to be paid to these demandsof employers in the labour market and to
recommend to all relevant stakeholdersthat the difficulties which are faced are quite challenging and the
reasons which they show is that there must be created the preconditions for minimising such difficulties
in the labour market.
2.5. Plans of enterprises for overtaking the problem of lack of employees
Tab. 11. Plans of enterprises to overtake lack of employees
No. Description Yes (%)
No (%) No response
(%) 1 Increase of salaries to make the vacant position more attractive 23.6% 27.64% 48.72%
2 Further training of labour force so enterprises can fill the vacancies 30.4% 39.19% 30.41%
3 Re‐definition of existing workplaces 17.0% 26.69% 56.28%
4 Use of technology as substitute of labour force 12.5% 19.53% 67.97%
5 Enrichment of recruitment channels 30.4% 21.62% 47.97%
6 Application of a governmental scheme for employment or training 57.4% 15.68% 26.89%
38
39
55
35
22
15
17
12
8
30
51
30
13
33
60
28
53
48
0 10 20 30 40 50 60 70 80 90 100
In general the low number of job‐seekers
People not interested for a certain job
The offered salary is very low
Conditions of work not so attractive
Lack of career opportunities
Candidates lack the necessary work experience
Candidates have low motivation
Candidates have low qualifications/skills
Candidates have low level of education
Fig.10: Reasons for not filling the vacant job positions
No
Yes

A Survey of Labour Market Demands, 2013 ‐ AKB
28
In fact enterprises must create strategies for overtaking the problem of the lack of employees. Usually
amongst the key problems is found to be “Further training of labour force of the enterprise for filling in
the vacant positions”, where 39% stressed that this is a problem. Moreover, “raise of salaries in order to
make the job more attractive” is identified by 27.64% ofrespondents whereas23.6% of enterprises
consider that it is not a problem whereas48.72% have not given any response.
“Application for any governmental schemes of employment or training”for filling the vacant positions
where15.68% of enterprises assert and 57.4% of other enterprises are against such a plan as a solution for
overtaking the lack of employee candidates for such jobs, whereas no response is provided for 26.89% of
enterprises.
Redefinition of existing workplaces also is a possibility for overtaking these problems, where26.69% of
enterprises assert this fact, whereas17.0% do not agree and do not see as a solution through this activity,
whereas56.28% do not respond. (whereas as for other plans it can also be seen in the figure 11).
3. Quotesforemploymentofforeigncitizens
In 2009, the Assembly of Kosovo, aiming at setting up and application of legal provisions for issuing
work permits and for employment of foreigners in the Republic of Kosovo adopted the Law on Issuing
Work Permits for Work and Employment to Foreign Citizens in the Republic of Kosovo (No. 03/L-136,
date: 10.07.2009).
Increase of salariesto make the vacant
position moreattractive
Further training oflabour force so
enterprises can fillthe vacancies
Re‐definition ofexisting workplaces
Use of technologyas substitute of
labour force
Enrichment ofrecruitment
channels
Application of agovernmental
scheme foremployment or
training
Yes (%) 23,60% 30,40% 17,00% 12,50% 30,40% 57,40%
No (%) 27,64% 39,19% 26,69% 19,53% 21,62% 15,68%
No response (%) 48,72% 30,41% 56,28% 67,97% 47,97% 26,89%
Fig.11. Plans of the companies for solving the problem of lack of employees for vacant positions

A Survey of Labour Market Demands, 2013 ‐ AKB
29
In 2010, Ministry of Labour and Social Welfare issued the Administrative Instruction for employment of
foreign citizens in the Republic of Kosovo (from 08.03. 2010), when it entered into force, implementation
of this law commenced thus regulating the employment relationship for foreign citizens wishing to work
in the Republic of Kosovo.
In Kosovo, even before this law was adopted, a considerable number of foreign citizens worked in various
working organisations, but after this date, all foreign citizens are obliged to be equipped with a work
permit. These jobs are legalised, through employment offices which have played an important role at
identification of quite a large number of foreign citizens who are employed.
But adoption of the law by the Assembly of Kosovo repealed the law on issuing work and employment
permit to foreign citizens in the Republic of Kosovo with number No. 03/L-136 / dated: 10.07.2009 and
thus we now have in force the Law on Foreigners No. 04/L – 219 (published in the Official Gazette). This
law regulates issuance of work permit and obliges the Ministry of Labour and Social Welfare (MLSW) to
prepare the annual Quote for employment of foreign citizens in the Republic of Kosovo. Following
preparation of the quote for employment, upon recommendation from Social Economic Council (SEC)
MLSWadopts and executes it in accordance with the law.
Social Economic Council and MLSW have taken the decision for the Employment Quote to be
prepared by Alliance of Kosovar Businesses considering that it is the same entity is also preparing the
Survey of Labour Market Demands.
3.1. Quoteofemploymentforforeigncitizensbyeconomicsector
Table 12 Quote of employment of foreign citizens byeconomic sector
Total 1457
Education 123
Agriculture, hunting and forestry 10
Hotels and Restaurants 122
Mining and quarries 52
Financial mediation 100
Construction 399
Production 135
Healthcare 105
Other community, social and personal services. 30
Transportand communication 348
Wholesale and retail trade, repair of vehicles etc. 33

A Survey of Labour Market Demands, 2013 ‐ AKB
30
Two sectors with the highest number of requests for employment of foreign citizens are construction with
399 and transport/communication with 348 requests, followed by other sectors such as production with
135 requests and education with 123 requests. Other sectors have a smaller number of requests (see
tab.12).
Investments in the sector of construction and in that of transport/communication have also shown the highest growth of requests for employment.
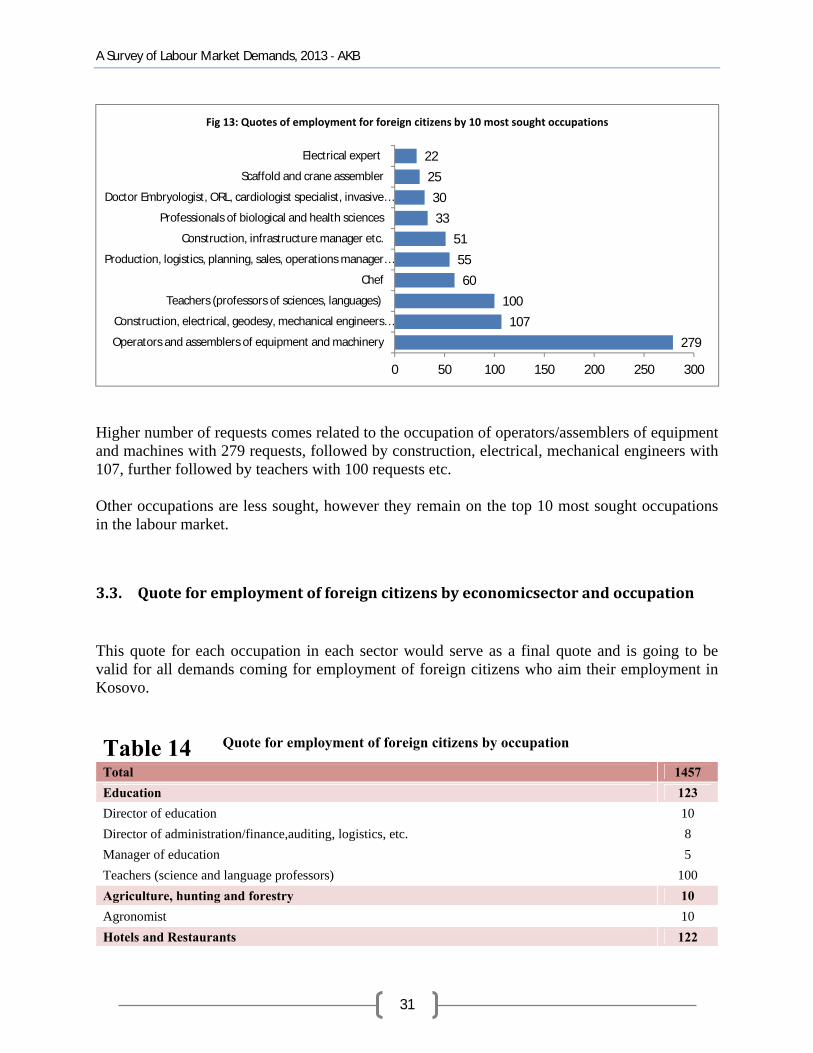
3.2. Quoteofemploymentforforeignersby10mostsoughtoccupations
Table 13 Quote of employment for foreigners by 10 most sought occupations
Operators and assemblers of equipment and machinery 279
Construction, electrical, geodesy, mechanical engineers etc. 107
Teachers (professors of sciences, languages) 100
Chef 60
Production, logistics, planning, sales, operations manager etc. 55
Construction, infrastructure manager etc. 51
Professionals of biological and health sciences 33
Doctor Embryologist, ORL, cardiologist specialist, invasive cardio-surgeon, vascular surgeon etc. 30
Scaffold and crane assembler 25
Electrical expert 22
123
10
122
52
100
399
135
105
30
348
33
0 50 100 150 200 250 300 350 400 450
Education
Agriculture, hunting and forestry
Hotels and Restaurants
Mining and quarries
Financial mediation
Construction
Production
Healthcare
Other community, social and personal services.
Transport and communication
Wholesale and retail trade, repair of vehicles etc.
Fig.12. Quote for employment of foreign citizens by economic sector
A Survey of Labour Market Demands, 2013 ‐ AKB
31
Higher number of requests comes related to the occupation of operators/assemblers of equipment and machines with 279 requests, followed by construction, electrical, mechanical engineers with 107, further followed by teachers with 100 requests etc. Other occupations are less sought, however they remain on the top 10 most sought occupations in the labour market.
3.3. Quoteforemploymentofforeigncitizensbyeconomicsectorandoccupation This quote for each occupation in each sector would serve as a final quote and is going to be valid for all demands coming for employment of foreign citizens who aim their employment in Kosovo.
Table 14 Quote for employment of foreign citizens by occupation
Total 1457
Education 123
Director of education 10
Director of administration/finance,auditing, logistics, etc. 8
Manager of education 5
Teachers (science and language professors) 100
Agriculture, hunting and forestry 10
Agronomist 10
Hotels and Restaurants 122
279
107
100
60
55
51
33
30
25
22
0 50 100 150 200 250 300
Operators and assemblers of equipment and machinery
Construction, electrical, geodesy, mechanical engineers…
Teachers (professors of sciences, languages)
Chef
Production, logistics, planning, sales, operations manager…
Construction, infrastructure manager etc.
Professionals of biological and health sciences
Doctor Embryologist, ORL, cardiologist specialist, invasive…
Scaffold and crane assembler
Electrical expert
Fig 13: Quotes of employment for foreign citizens by 10 most sought occupations

A Survey of Labour Market Demands, 2013 ‐ AKB
32
Music instrumentalist 5
Chef 60
Massaging 20
Hotel manager 12
Manager of logistics, planning of logistics, sales, operations,auditing, finance etc. 10
Singer 15
Mining and quarry 52
Designer 5
Director of finance, audit, logistics, storage etc. 4
Electrical, geodesy, construction, mechanical engineer etc. 6
Laboratory operator - Quality Controller 4
Supervisor of income and finance, quality, food, electronic equipment etc. 5
Logistic, planning, production, sales, operation, audit, finance manager etc. 11
Professional of engineering sciences, etc. 5
Specialistof production 7
Mine manager 5
Financial enterprise 100
Business administrator 3
Financial agencies 10
Credit analyst 5
Certified auditor 3
Director of finance, audit, logistics, storage etc. 19
Finance operator 5
Expert for bank cards 4
Manager of finance, logistics, planning, sales, operations,auditing etc. 6
Maintenance of ICT equipment 10
Software program developer for cash-machine 14
Specialised guard in transportation of cash money 10
Banking services officer 11
Construction 399
Architect 15
Designer 8
Project manager 7
Expert of geo-techniques 10
Blacksmith 8
Construction, electrical, geodesy, mechanical engineer etc. 107
Installer of frames and reinforcement 12
Controller of construction 6
Laboratory operator - Quality Controller 5
Supervisor of income and finance, quality, food, electronic equipment etc. 13
Construction, infrastructure manager etc. 51

A Survey of Labour Market Demands, 2013 ‐ AKB
33
Maintenance operator of production section 7
Master of heavy machinery 10
Elevator assembler 4
Assembler of scaffolds, cranes 25
Steel processor 9
Professional of construction sciences etc. 16
Welder 10
Electrical expert 22
Driver of heavy machinery 16
Expert of signalling 6
Technician of machines, quality, safety, environment etc. 18
Topography 14
Production 135
Product designer 7
Director of production section etc. 5
Expert for production of socks 2
Expert for tapestry of furniture 13
Expert forfireplace 3
Expert for industrial machinery 7
Manager of production, logistics, planning, sales, operations. 55
Master of garnitures 17
Pastry cook 7
Professional of engineering andindustrial sciences 4
Technician of machines, quality, safety, environment, sanitary, etc. 3
Technologist 5
Furniture clothing craftsman 4
Carpentry 3
Health 105
Doctor Embryologist, ORL, cardiologist specialist, invasive cardio-surgeon, vascular surgeon etc. 30
Physiotherapist 5
Nurse at cardiology, surgical hall etc. 4
Massager 15
Professional of biological and health science 33
Specialist of radiology, oncology, obstetrics, surgery, cardiology, urology etc. 10
Technician of healthcare, quality, safety, environment, sanitary, etc. 8
Other community, social and personal services. 30
Hairdresser (hairpiece) 20
Professional explorer in social field 10
Transport andcommunication 348
Airplane mechanic 7
Car mechanic 8

A Survey of Labour Market Demands, 2013 ‐ AKB
34
Electrical, mechanical engineer etc. 20
Supervisor of electronic equipment, technology etc. 5
Manager of logistics, planning, production, sales, operations, audit, finance etc. 5
Operators and assemblers of equipment and machines 6
Professional of engineering sciences, ICT etc. 5
Programmer, developer of software programs 9
Operators and assemblers of equipment and machines 279
Specialist of transport 4
Wholesale and retail trade, repair of vehicles etc. 33
Manager of sales, logistics, planning, operations, etc. 10
Seller and repairer of gold and silver 5
Trader 18
A Survey of Labour Market Demands, 2013 ‐ AKB
35
4. Average salary
4.1. Average salary in Kosovo
Raise of salaries has become an element of everyday discussion,
and studying the average salary in Kosovo in this survey has been a
challenge. Considering that salaries determine the work also as an
activity which is related to the employer and employee in the aspect
of employment relationship.
Our study has put under its focus the trend of increase of salaries,
because this increase often has been made only after the pressure
from the labour unions and not as a result of necessary increase
because of increase of prices in the market.
Survey was realised for labour market demands in the whole territory of Kosovo covering1480 employers
respectively business entities representing about19962employees.
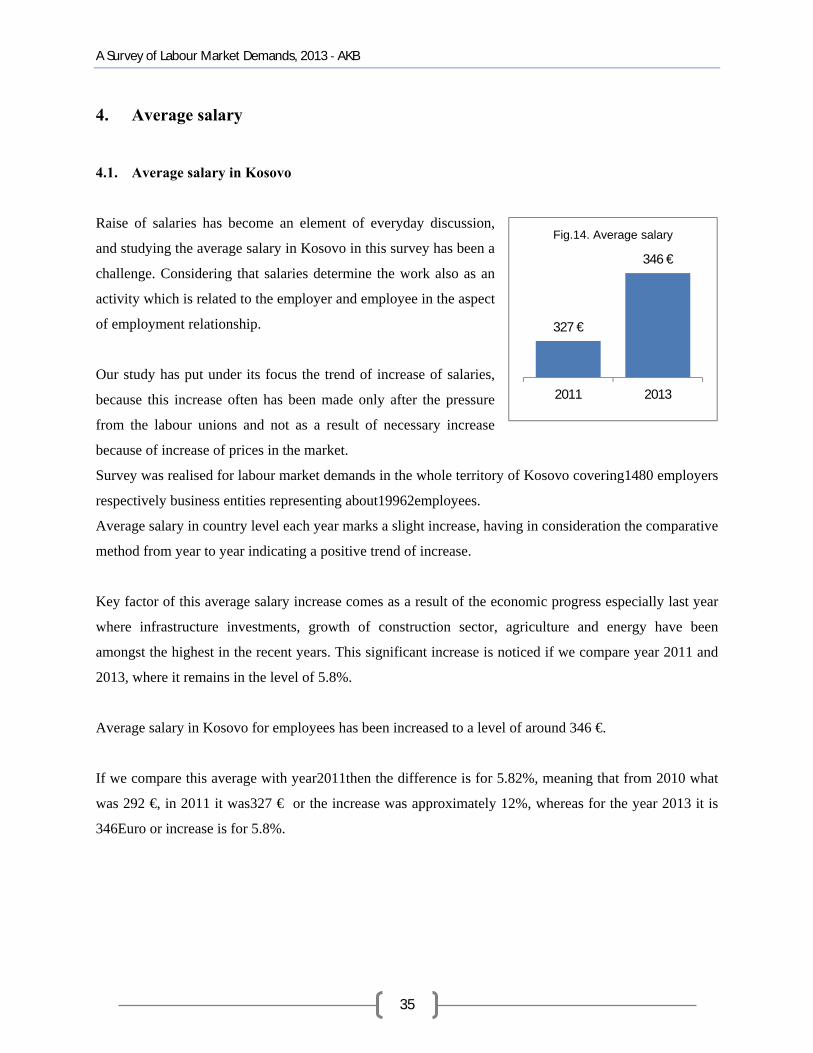
Average salary in country level each year marks a slight increase, having in consideration the comparative
method from year to year indicating a positive trend of increase.
Key factor of this average salary increase comes as a result of the economic progress especially last year
where infrastructure investments, growth of construction sector, agriculture and energy have been
amongst the highest in the recent years. This significant increase is noticed if we compare year 2011 and
2013, where it remains in the level of 5.8%.
Average salary in Kosovo for employees has been increased to a level of around 346 €.
If we compare this average with year2011then the difference is for 5.82%, meaning that from 2010 what
was 292 €, in 2011 it was327 € or the increase was approximately 12%, whereas for the year 2013 it is
346Euro or increase is for 5.8%.
327 €
346 €
2011 2013
Fig.14. Average salary

A Survey of Labour Market Demands, 2013 ‐ AKB
36
4.2. Salaries by Economic Activity
Average salaries paid by economic activity represents a disproportion in between different sectors,
likewise at some economic sectors there is a significant increase, whereas in other economic sectors the
increase is a bit slighter. The highest average salary has been paid in the sector of financial mediation
with amount of 488Euroduring 2013 more than 27 Euro or 5,9% is the increase compared to the previous
year. Followed by the sector of construction with 388Euro or increase is for 8.4%.Further followed by
economic sector of mining and quarries coming with 377Euro or10.6% more than in the previous year
(for other sectors see on tab. 15).
Table 15. Nomenclature of Economic Activities
NACE Description 2011 2013 Increase
A Agriculture, hunting and forestry 265 € 298 € 12.5%
C Mining and quarry 341 € 377 € 10.6%
D Production 313 € 323 € 3.2%
E Supply with gas, electricity and water 386 € 395 € 2.3%
F Construction 358 € 388 € 8.4%
G Wholesale and retail trade and repair of vehicles 299 € 328 € 9.7%
H Hotels and restaurants 288 € 291 € 1.0%
I Transport, storing and communication 344 € 353 € 2.6%
J Financial mediation 461 € 488 € 5.9%
K Real estate, rent and business activities 381 € 389 € 2.1%
L Administration and public protection 300 € 329 € 9.7%
M Education 331 € 370 € 11.8%
N Health 351 € 376 € 7.1%
O Other community services, social and personal 313 € 376 € 7.7%
298 €
377 €
323 €
395 €
388 €
328 €
291 €
353 €
488 €
389 €
329 €
370 €
376 €
337 €
0 € 100 € 200 € 300 € 400 € 500 € 600 €
Agriculture, hunting and forestry
Mining and quarry
Production
Supply with gas, electricity and water
Construction
Wholesale and retail trade, repair of vehicles
Hotels and restaurants
Transport, storing and communication
Financial mediation
Real estate, rent and business activities
Administration and public defence
Education
Health and social work
Other community services, social and personal
Fig. 15: Salaries by Economic Activity

A Survey of Labour Market Demands, 2013 ‐ AKB
37
Salaries paid by economic sector represent not only discrepancy in between sectors but also represent
difference of average salary paid in country level which is 346Euro.
Sectors still remaining under the average level are the sector of agricultureandadministration, (see tab.15).
In a completely special way, regarding the average paid salaries from sectors of activity (economic
activities),there is an increase in majority of cases if we compare salaries with the same period of the
previous year, reflecting the positive trend in the general aspect (seeSurvey on labour market demands
2011)2.
4.3. Salaries by Gender
Female gender again remains discriminated in the aspect of salary, so the average salary paid for the
female gender remains under the average salary paid in
country scale, which is 346Euro. Whereas male benefit
higher salaries than the Kosovar average.
Female gender for 2013 was paid with 311Euro, 8Euro more
than in 2011. Whereas male have benefited an average salary
in 2013 in amount of353Euro, or 21Euro more than in 2011
which was332 Euro.Increase at the male gender has become
2 times higher than increase for female gender.
When analysing salary by gender, and when comparing this
salary with the average salary for the previous year, both of them benefited by an increase.But it must be
noted that this increase also comes as a result of economic progress which was realised in the recent
years.
As for salaries by gender there is identified a difference on increase of female employees and male
employees, while the average monthly salary for male employees has increased by about6.3% in annual
average since 2011, at the same time the salary for women employees has a significant increase of
about2.6% (see Survey on labour market demands 2011).
2Survey of Labour Market 2011, AKB
311 €
353 €
Female Male
Fig.16. Salaries by gender

A Survey of Labour Market Demands, 2013 ‐ AKB
38
4.4. Salaries by level of qualification
Average salaries paid by the level of
educational qualifications are in direct
correlation, workers with a higher level of
education still are the best paid who receive an
average salary of about439 €.
Employees with secondary qualification
receive salaries of 340 €.
Employees with lower qualification earn an average monthly salary of about 272 € (see fig. 17).
In continuation employees with higher education have reached an average salary in country level higher
than346 Euro. Whereas secondary qualification is under the proportion of average salary in Kosovo,
while employees with level of lower qualification have realised a salary significantly lower than the
average salary.
4.5. Salaries by age
Average salary paid for age groups slightly
vary from each other but again a balance is
seen thinking that the average age adults are
paid better than the young age groups and old
age groups.
Salary paid as over - proportional is for the age
group of 40-55, and the salary for age group
25-39, (see fig 18)
Average salary paid to employees of ages 15-24 years old with 311Euro and for age group 55+ with 287,
the salaries which are under the proportion of average salaries which is 346Euro in country level (see
fig.18).
311 €349 €
385 €
287 €
15‐24 25‐39 40‐55 55+
Fig.18. Average salary by age group
272 €340 €
439 €
elemenatry sec. school High school
Fig.17: Average salary by level of qualification

A Survey of Labour Market Demands, 2013 ‐ AKB
39
4.6. Salaries by region
The highest average salaries
in2013were paid in the region of
Prishtina (368 €) andFerizaj (357
€) whereas as for other regions
far lower salaries were paid in
the region ofGjakova (321 €) and
inMitrovica (329 €).
General development regarding allocation of salaries by region aims to take a look into constant regional
divergences in comparison with earlier results.
Like in2011employees who work within one region have shown results of increase of average paid salary
in monthly basis.
But, the highest increase in
salaries for 2013 was realised
in the region ofFerizaj with
11%, then followed by the
region ofMitrovica with 10%,
(see. Tab.
16).WhereasGjakovahas the
lowest increase of only 2%.
Table 16. Salaries by Region
Region 2011 2013 Difference
Ferizaj 320 € 356€ 11%
Gjakova 314 € 321€ 2%
Gjilan 316 € 343€ 8%
Mitrovica 299 € 329€ 10%
Peja 321 € 349€ 9%
Prishtina 343 € 368€ 7%
Prizren 328 € 344€ 5%
356 €
321 €
343 €
329€
349 €
368 €
344 €
Ferizaj Gjakovë Gjilan Mitrovicë Pejë Prishtinë Prizren
Fig. 19. Salaries by region

A Survey of Labour Market Demands, 2013 ‐ AKB
40
4.7. Salaries by occupation
Table 17. Salaries by occupation
ISCO Description Average salary (Euro)
1 Senior manager 426 €
2 Professionals 395 €
3 Technicians and Professional Co-operators 329 €
4 Assisting employees 326 €
5 Employees of services and sale in shops and market 321 €
6 Qualified employees in Agriculture and Fishing 277 €
7 Craftsmen and similar jobs 353 €
8 Operator and Assembler of machine equipment 338 €
9 Basic occupations 313 €
Salaries by occupation represent divergences in average salaries paid by occupational aspect.
Average highest salaries paid for senior managers from 426Euro, then professionals with395Euro,
craftsmen and similar workers with 353Euro. While paid average salary is 346Euro in country level,
many other occupational salaries are under the proportion of average salary like agriculture employees,
followed by basic professions with 311Euro etc., (seefig. 20).
426 €
395 €
329 €
326 €
321 €
277 €
353 €
338 €
313 €
0 € 50 € 100 € 150 € 200 € 250 € 300 € 350 € 400 € 450 €
Senior manager
Professionals
Technicians and Professional Co‐operators
Assisting employees
Employees of services and sale in shops and market
Qualified employees in Agriculture and Fishing
Craftsmen and similar jobs
Operator and Assembler of machine equipment
Basic occupations
Fig. 20. Average salary by occupation (Euro)

A Survey of Labour Market Demands, 2013 ‐ AKB
41
5. Work Conditions
5.1. Registration of enterprises
Selection of enterprises was focused to those enterprises which are registered and have fiscal number, our
focus has been to legal enterprises which exercise a certain business activity. Therefore all surveyed
enterprises were registered and in harmony with the law on business registration.
Whereas as regards to employees in these enterprises is different and is characterised in various forms
such as types of contracts, duration and other work conditions.
5.2. Types of employment contracts
Table18: Types of contracts
No. Description Employee Percentage
1 In written 12658 63.4%
2 Verbal 1489 7.5%
3 Nocontract 4502 22.6%
4 No response 1313 6.6%
5 Total 19962 100%
There are several types of contracts which are signed by the employers and employees.Findings in our
survey show in fact that 63.4 % or 12658employees have regular contracts (in written) signed between
employers and employees.
Whereas 7.5 % or 1489of employees have verbal
agreement for their job, and 22.6 % or
4502employees do not have contracts at all,
whereas without response 6.6% or 1313
employees.
Signing of employment contracts either in
written or verbally between employer and
employee testify quite a stable condition or
towards improvement having in consideration high degree of signing contracts.
63,4%
7,5%
22,6%
6,6%
In written Verbal No contract No response
Fig.21: Types of employment contracts

A Survey of Labour Market Demands, 2013 ‐ AKB
42
Whereas22.6% of employees did not have employment contracts signed but it must be mentioned that this
category has a fall when having in consideration that in the survey of year 2011 thiscategory was
approximately with24.0 % of employees without employment contracts.
Without response or 6.6% of employees do not have a defined status in this aspect. But some enterprises
have not responded because in some cases there was lack of information about signing contracts taking
into consideration that many enterprises do not have the internal organisation or the structuring is non-
functional and the sector of human resources does not exist for giving an accurate response.
5.2.1. Employment contracts with termed duration
At our question about the contracts “your employees have, what is their duration normally”, enterprises
provided us with the following answer:
Contractswith indefinite
time are found to have
8759 employees or 43.9
%, whereas with a defined
timesigned by the
employees (12-36 months)
there were approximately
4471 employees or 22.4%,
whereas seasonal contracts
(less than 12 months)
participate with 917 employees or by 4.6%.
Table 19. Employment contracts by termed duration
No Description Employees Percentage
1 With indefinite time 8759 43.9%
2 Defined time (12 ‐ 36 months) 4471 22.4%
3 Seasonal(less than 12 months) 917 4.6%
4 Without contracts 4502 22.6%
5 No response 1313 6.6%
Total 19962 100%
43,90%
22,40%
4,60%
22,60%
6,60%
With indefinitetime
Defined time(12 ‐ 36months)
Seasonal (lessthan 12months)
Withoutcontracts
No response
Fig. 22: Contracts by time frame


A Survey of Labour Market Demands, 2013 ‐ AKB
44
But based on this, the position of employees is encouraging although the percentage of benefits must be
higher. Thus, based on this the monitoring and evaluation mechanisms of implementation of laws which
protect the employee rights are challenged.
Representatives of employees often address and raise the issues for not realising them as specified by law,
thus, such issues are to be elaborated at all influential bodies.
5.4. Labour Law enforcement in enterprises
Based on this survey, enterprises
have stressed out that the labour
law is enforced in level of
71.4%. Whereas 22% of
enterprises have declared that
they do not observe it and
6.6%have not responded.
Labour law must necessarily be
enforced, even if that may be
partly enforced. Although this law has been under focus of discussions, especially for certain articles,
amendments and supplementations of the law are important to be made in consensus by allsocial partners.
Thus many of obstacles appearing in implementation of labour law must be necessarily resolved.
Yes71.4%
No22.0%
No response6.6%
Fig.24: Labour Law enforcement
25,9%
65,0%
60,3%
48,2%
51,8%
33,2%
11,8%
33,6%
17,0%
50,8%
42,2%
13,5%
12,8%
20,5%
18,9%
29,7%
47,8%
30,2%
42,3%
12,4%
31,9%
21,5%
26,8%
31,4%
29,4%
37,2%
40,4%
36,1%
40,7%
36,8%
0% 20% 40% 60% 80% 100%
Transport or its payment
Meal or payment for meals
Annual paid leave (during holiday time)
Medical paid leave
Retirement pension
Payment for service
Medical insurance
Bonuses/awarding for good performance
Education and training courses
Occupational safety/protective clothing or…
Fig.23: Benefits of Employees Yes No Undeclared

A Survey of Labour Market Demands, 2013 ‐ AKB
45
5.5. Main obstacles on labour law enforcement
The employers see the main obstacles for failure to observe the labour law in some aspects as positive and
some as negative.
As to how the obstacles on labour law enforcement are evaluated, where in all enterprises a quite
worrying problem appears considering that 40.8.%of them expressed that medical leave compensation is
an obstacle and only 6.3% of them consider that it is not an obstacle, whereas 52.9% have not responded.
The employment contract also seems to face obstacles where 33.7% see it as an obstacle and only 7.4% of
them consider it not to be an obstacle and 58.9% have not responded to this question. (for more see fig.
Table.21: Obstacles on labour law enforcement
Description Withoutobstacles withobstacles
No response
Duration of maternity leave 5.3% 32.6% 62.1%
Compensation of medical leave 6.3% 40.8% 52.9%
Employment contract 7.4% 33.7% 58.9%
Non‐enforcement in all enterprises 9.3% 22.4% 68.3%
Lack of labour law provisions and regulations 3.2% 18.7% 78.1%
Additional payments ‐ allowances 2.2% 20.1% 77.8%
Defining working hours 7.4% 22.1% 70.5%
Annual leave 4.3% 32.6% 63.1%
5,3%
6,3%
7,4%
9,3%
3,2%
2,2%
7,4%
4,3%
32,6%
40,8%
33,7%
22,4%
18,7%
20,1%
22,1%
32,6%
62,1%
52,9%
58,9%
68,3%
78,1%
70,5%
63,1%
0,0% 20,0% 40,0% 60,0% 80,0% 100,0%
Duration of maternity leave
Compensation of medical leave
Employment contract
Non‐enforcement in all enterprises
Lack of labour law provisions and regulations
Additional payments ‐ allowances
Defining working hours
Annual leave
Fig. 25: Obstacles on labour law enforcement
Without obstacles with obstacles No response

A Survey of Labour Market Demands, 2013 ‐ AKB
46
25).
Maternity leave is an overburden for the Kosovar economy and it increases the possibility of
discrimination of female gender for employment. According to the employers duration of maternity leave
period(32,6%) declare that is an obstacle on implementation of the labour law, where only 5.3% declare
that it is not a problem and no response we have from62.1%. (See fig. 25)
5.6. Definition of minimum salary by the Economicand Social Council
Definition of minimum salary for 47% of enterprises is considered as good, but Not good is considered by
25% of enterprises and 16% of enterprises express that it is not necessary and11% do not give a response.
Definition of minimum salary by Economic and Social Council (ESC) for employers indicate that the
minimum salary is
not necessary for
Kosovar economy
and not so justifiable
for dividing by age
group. A remark of
employers was
related to the fact of
defining the
minimum salary in
two categories.
Tab. 22. Definition of minimum salary
Nr. Description Enterprises Percentage
1 Good 792 47%
2 Not good 375 25%
3 Unnecessary 243 16%
4 No response 160 11%
Total 1480 100%
47%good
25%not good
16%unnecesary
11%No response
Fig. 26: Definition of minimum salary by ESC

A Survey of Labour Market Demands, 2013 ‐ AKB
47
Division into age groups is considered as discriminating. Salaries must be left to the free market because
this way we see as an interfering into the relation of employer-employee character, in fact the free market
economy determines this issue best.
Also determining of the minimum salary does not encourage formal employment, knowing that majority
of registered enterprises exercising the economic activity in Kosovo are small enterprises and definition
of a benchmark minimum salary by ESC may increase the informality.
5.6.1. Definition of minimum salary influence on creation of job vacancies
Definition of minimum salary for 70 % of enterprises isconsidered that shall not have effect and shall not
influence directly on creation of job vacancies.Maybe in many cases the employers for one certain
category of employees with easiness shall solve their issue based on the minimum wage.
But 14% of enterprises consider that definition of minimum salaryshall have its’ effects and shall
negatively influence and the rights will be abused in regard to vacancies. Definition of minimum salary
by age complicates even more the situation by showing dissatisfaction to the employees and a significant
concern too.
So, response is not
given by
approximately 16%
of employers
regarding the effect
of definition of
minimum salaryat
job generation.
Definition of
minimum salary is
specified by criteria
but they would need
to be modified at every year beginning.
70%No influence
14%With influence
16%No response
Fig.27: Definition of minimum salary on creating new vacancies

A Survey of Labour Market Demands, 2013 ‐ AKB
48
The minimum salaryfor the foreign investors maybe would be encouraged, because it is a decision that
would show the formal side as solved or legally it would reflect the minimum salaryas reference in case
any investment would be planned.
6. Training needs
6.1. Trainings provided during 12 last months
Training of employees is very important having in consideration that enhancement of skills of employees
must develop parallel to trends and economic development. Thus, the enterprises have shown that during
12 last months have provided training to approximately 1009employees.
On the other aspect, our study has been focused in 1480enterprises and these enterprises have stated that
only 5.1% of all employees in these enterprises have acquired education or trainings for new skills.
6.2. Main types of education/training
Main types of education and traininghave been divided into job training where87.2 % have been of this
category and 12.8% were training/education not destined for job. The fact itself that the highest
percentage of trainings was for job testifies that the employers continuously insist on acquisition of
occupational skills of the staff itself in order to raise the capacities.
Tab. 23. Main types of education/training
No. Description Total Percentage
1 Training for job 880 87.2%
2 Training/education not for job 129 12.8%
Total 1009 100%

A Survey of Labour Market Demands, 2013 ‐ AKB
49
6.3. Training provider The highest level of provided Trainings was from the enterprises themselves by 62.8 %, whereas private
training providers were with 6.8% public providers of training were30.3% for all employees.
Tab. 24. Education/training provider No. Description Total Percentage
1 Your enterprise 634 62.8%
2 Institution / Private training provider 69 6.8%
3 Institution / Public training provider 306 30.3%
Total 1009 100%
6.4. Training duration
Trainings have had a certain time limit where mainly dominates duration from one month but less than 3
months with 41.5%, followed by 1 week – 1 month in 30.3%, then less than one week with 23.2 %,and so
on.

A Survey of Labour Market Demands, 2013 ‐ AKB
50
6.5. Training support
Training of employees
has been mainly
supported by enterprises
themselves in a level of
54.1%, whereas many
trainings were supported
by employees
themselves, meaning that
there were self-initiatives with 25.3%. Whereas donators supported 17.6% and the governmental
institutions supported by 3.0%.
Important in this case is financing by employees themselves witnessing a very high motive on acquisition
of skills and creation of new skills.
6.6. Deficient occupations and providing training opportunities
It has become very difficult to find qualified employees as stated by the employers, calculating them as
deficit qualifications in the labour market and for which professional needs arise: Car mechanic with 34
requests, Administrator of system with 24 requests, Designer for textile and clothing 24 requests,
followed by Chef with 17 requests and so on (see tab 27).
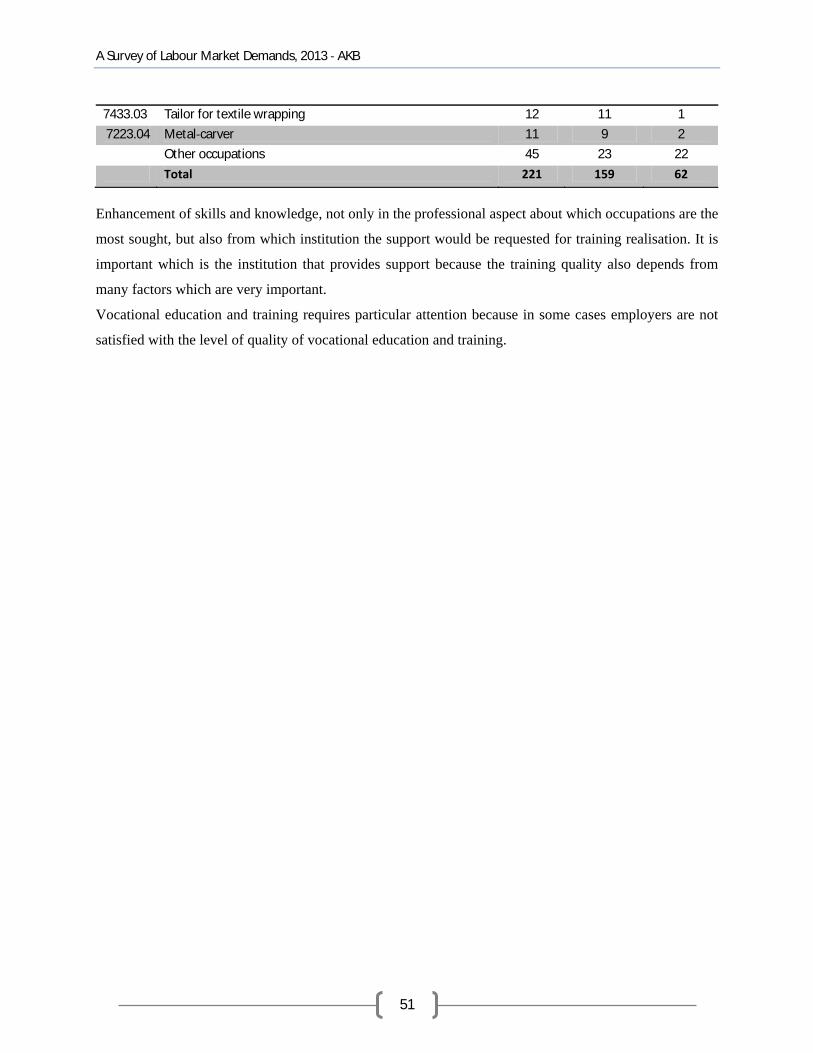
Table27: Deficit occupation for training and request for selection of training provider ISCO Description Total Private
Institution Public
Institution
7231.02 Car mechanic 34 22 12
2131.07 System administrator 24 17 7
3471.01 Designer of textile and clothing 24 21 3
5122.04 Chef 17 15 2
2143.09 Electrical engineer for automation fixing 14 12 2
7422.04 Furniture assembler 14 11 3
8334.01 Heavy truck (crane inclusive) driver 13 10 3
8123.03 Operator of machines for production of windows and doors from plastic
13 8 5
Table26: Training support
No. Description Trainees Percentage
1 Enterprise 546 54.1%
2 Employees 255 25.3%
3 Government and Donators 30 3.0%
4 Donators 178 17.6%
4 Total 1009 100%
A Survey of Labour Market Demands, 2013 ‐ AKB
51
7433.03 Tailor for textile wrapping 12 11 1
7223.04 Metal‐carver 11 9 2
Other occupations 45 23 22
Total 221 159 62
Enhancement of skills and knowledge, not only in the professional aspect about which occupations are the
most sought, but also from which institution the support would be requested for training realisation. It is
important which is the institution that provides support because the training quality also depends from
many factors which are very important.
Vocational education and training requires particular attention because in some cases employers are not
satisfied with the level of quality of vocational education and training.


A Survey of Labour Market Demands, 2013 ‐ AKB
53
The largest number of vacancies for the requested occupations in future, majority of them are
referred as “carpenter of furniture“ with 10.9% followed by “Doctor, advisor/doctor, health care
insurance advisor” with10.0%, followed by “Leader of mechanic group and assembler of
industrial machinery and other machinery” by 8.3%, “Financial Analyst”, 7.7%.
Two sectors with the highest number of requests for employment of foreign citizens is
constructionwith 399 and transport/communication with 348 requests, followed by other sectors
such as production with 135 requests and education with 123 requests. Other sectors have a lower
number of requests.
The highest number of requests comes from the occupation of operator/assembler of equipment
and machinery with 279 requests, further followed by construction, electrical, mechanical
engineer with 107 requests, followed by teachers with 100 requests.
The average salary in Kosovo for the employees has been increased to the level of about 346 €.
If we compare this average with year 2011 then the difference is for 5.82%, meaning that from
2010 what was 292 €, in 2011 it was 327 € or the increase was approximately 12%, whereas for
the year 2013 it is 346 Euro or increase is for 5.8%.
Female gender for 2013 was paid with 311Euro, 8Euro more than in 2011. Whereas male have
benefited an average salary in 2013 in amount of353Euro, or 21Euro more than in 2011 which
was 332 Euro. Increase at the male gender has become 2 times higher than increase for female
gender.
Average salaries paid by the level of educational qualifications are in direct correlation, workers
with a higher level of education still are the best paid who receive an average salary of about 439
€. Employees with secondary qualification receive salaries of 340 €.Employees with lower
qualification earn an average monthly salary of about 272 €.
Based on this survey the enterprises have declared that they respect the labour law in level of
71.4%. Whereas 22% of enterprises declared that they do not respect the labour law and 6.6% did
not respond.
A Survey of Labour Market Demands, 2013 ‐ AKB
54
The highest level of provided Training by enterprises themselves was with 62.8 %, whereas the
private providers of training had the ratio of 6.8% Public training providers reached the ratio of
30.3% for all employed people.
Trainings of employees were mainly supported by enterprises themselves in level of
54.1%,whereas many trainings were supported by employees themselves meaning that they had
self-initiative by 25.3%. Whereas donators supported 17.6% and from governmental institutions
by 3.0%.
It has become very difficult to find qualified employees as stated by the representatives of the
enterprises, especially in the deficit staff groups in the labour market, such qualifications would
be necessary for certain occupations: Car mechanicwith 34 requests, system administrator with 24
requests, Designer for textile and clothing with 24 requests followed by chef with 17 requests and
so on.

A Survey of Labour Market Demands, 2013 ‐ AKB
55
Recommendation
We recommend the Ministry of Labour and Social Welfare that through policies of employment,
respectively active measures in the labour market todesign measures for a general inclusion for all
categories of jobseekers. Also growth of entries in vocational training in proportion to registration
of unemployed in employment offices.
Coordination of activities with the Ministry of Education, Science and Technology in particular
when referring to harmonisation of curricula based on the labour market demands.
Vocational Training Centres must take into consideration the deficit occupations which are in the
Labour Market of Kosovo,and through this Survey and other surveys in order to define in the best
way possible the activities for enhancement of the occupational training for the job seekers in
order to further enhance their knowledge.
Role of businesses along with the MLSW and MEST is very high at identification of needs and at
defining the employment policies and for education and training based on these needs. Businesses
are very important in this triangle.
A kind of mechanism has to be created for monitoring and evaluating implementation of policies
of employment and education/training policies.
Awareness must be raised for the declaration of vacant job positions to also go through
employment offices and not through other forms.

A Survey of Labour Market Demands, 2013 ‐ AKB
56