A Survey of Concussion Powders
13
Page 402 Selected Pyrotechnic Publications of K.L. and B.J. Kosanke An earlier draft appeared in Journal of Pyrotechnics, No. 5, 1997. A Survey of Concussion Powders K. L. and B. J. Kosanke PyroLabs, Inc., 1775 Blair Road, Whitewater, CO 81527, USA ABSTRACT A collection of six commercial concussion powders were test fired in concussion mortars to determine internal mortar pressure, air blast pressure, and the duration of air blast positive phase. The internal mortar pressures for various powder types and load masses ranged from less than 200 to nearly 100,000 psi (700 MPa). For the same powder loads, the air blast pressures at a distance of approximately 70 in. (1.8 m), ranged from 0.07 to 1.7 psi (12 kPa). This corresponds to sound pressure levels (peak—ultra fast—linear) ranging from 148 to 175 dB, and relative loudness values ranging from 1.0 to 6.8. For the same powder loads, the durations of positive phase ranged from nearly 4 ms down to 0.7 ms. Keywords: concussion powder, blast wave, mor- tar pressure, sound pressure level, loudness Introduction In an earlier article, [1] the results of a fairly de- tailed study of one commercial concussion pow- der (Pyropak™) were reported. The present article reports on a study of a collection of concussion powders from various manufacturers. Since it was not practical to repeat the full study for each of the other concussion powders, it was decided to com- pare the performance of the powders at only a few selected load masses. All suppliers of concussion powder known to the authors were contacted; all but one agreed to participate in the study and pro- vided samples of their powders. Since beginning this study, the catastrophic failure of a concussion mortar (without injury) has been reported. [2] This increased both the interest and the relevance of this study, and provided the impetus for an early release of some of the re- sults. [3] The present article is a more thorough presentation and discussion of those results. It should be noted that the purpose of this study was to measure the performance characteris- tics of the concussion powders. The purpose was not to rate the performance of the concussion powders. To rank the concussion powders, it would first be necessary to establish a set of eval- uation criteria; however, those criteria are likely to be different for various users with different appli- cations. Hopefully, this study provides basic in- formation that both users and manufacturers will find useful, or at least interesting. Background In its most common form, a concussion mortar consists of a thick, cylindrical steel bar, welded to a heavy base plate. The mortar contains a combus- tion chamber (barrel), produced by drilling a hole on-axis into the top end of the steel bar. The mor- tar used in this study was 2 in. (50 mm) in outer diameter, with a 1-in. (25-mm) hole drilled to a depth of 4.5 in. (115 mm). The construction of the mortar is illustrated in Figure 1, which also shows it loaded with a charge of powder and an electric match for ignition. Upon ignition, because of the confinement provided within the combustion chamber, the concussion powder burns explosively, see Figure 2. The high internal pressure causes the combus- tion products (gases and solid particles) to be ac- celerated upward. As the gases exit the end (mouth) of the mortar, they expand to produce a shock wave that is heard and felt by the audience. As a result of the ejection of combustion products, a downward recoil force is produced. In a previ- ous study, it was demonstrated that the shape of the recoil force curve follows the shape of the in- ternal pressure curve. [1a] Further, it was demon- strated that the magnitude of the recoil force de- pended on the rigidity of the surface under the mortar. Accordingly, the value of collecting recoil data is diminished and that data was not generated in this study.
Transcript of A Survey of Concussion Powders

Page 402 Selected Pyrotechnic Publications of K.L. and B.J. Kosanke
An earlier draft appeared in Journal of Pyrotechnics, No. 5, 1997.
A Survey of Concussion Powders
K. L. and B. J. Kosanke PyroLabs, Inc., 1775 Blair Road, Whitewater, CO 81527, USA
ABSTRACT
A collection of six commercial concussion powders were test fired in concussion mortars to determine internal mortar pressure, air blast pressure, and the duration of air blast positive phase. The internal mortar pressures for various powder types and load masses ranged from less than 200 to nearly 100,000 psi (700 MPa). For the same powder loads, the air blast pressures at a distance of approximately 70 in. (1.8 m), ranged from 0.07 to 1.7 psi (12 kPa). This corresponds to sound pressure levels (peak—ultra fast—linear) ranging from 148 to 175 dB, and relative loudness values ranging from 1.0 to 6.8. For the same powder loads, the durations of positive phase ranged from nearly 4 ms down to 0.7 ms.
Keywords: concussion powder, blast wave, mor-tar pressure, sound pressure level, loudness
Introduction
In an earlier article,[1] the results of a fairly de-tailed study of one commercial concussion pow-der (Pyropak™) were reported. The present article reports on a study of a collection of concussion powders from various manufacturers. Since it was not practical to repeat the full study for each of the other concussion powders, it was decided to com-pare the performance of the powders at only a few selected load masses. All suppliers of concussion powder known to the authors were contacted; all but one agreed to participate in the study and pro-vided samples of their powders.
Since beginning this study, the catastrophic failure of a concussion mortar (without injury) has been reported.[2] This increased both the interest and the relevance of this study, and provided the impetus for an early release of some of the re-sults.[3] The present article is a more thorough presentation and discussion of those results.
It should be noted that the purpose of this study was to measure the performance characteris-tics of the concussion powders. The purpose was not to rate the performance of the concussion powders. To rank the concussion powders, it would first be necessary to establish a set of eval-uation criteria; however, those criteria are likely to be different for various users with different appli-cations. Hopefully, this study provides basic in-formation that both users and manufacturers will find useful, or at least interesting.
Background
In its most common form, a concussion mortar consists of a thick, cylindrical steel bar, welded to a heavy base plate. The mortar contains a combus-tion chamber (barrel), produced by drilling a hole on-axis into the top end of the steel bar. The mor-tar used in this study was 2 in. (50 mm) in outer diameter, with a 1-in. (25-mm) hole drilled to a depth of 4.5 in. (115 mm). The construction of the mortar is illustrated in Figure 1, which also shows it loaded with a charge of powder and an electric match for ignition.
Upon ignition, because of the confinement provided within the combustion chamber, the concussion powder burns explosively, see Figure 2. The high internal pressure causes the combus-tion products (gases and solid particles) to be ac-celerated upward. As the gases exit the end (mouth) of the mortar, they expand to produce a shock wave that is heard and felt by the audience. As a result of the ejection of combustion products, a downward recoil force is produced. In a previ-ous study, it was demonstrated that the shape of the recoil force curve follows the shape of the in-ternal pressure curve.[1a] Further, it was demon-strated that the magnitude of the recoil force de-pended on the rigidity of the surface under the mortar. Accordingly, the value of collecting recoil data is diminished and that data was not generated in this study.

Selected Pyrotechnic Publications of K.L. and B.J. Kosanke Page 403
Figure 3 illustrates a typical blast overpressure profile. Before the arrival of the blast wave at the pressure sensor, there is no indication (with re-spect to pressure) that an explosion has taken place or that the blast wave is approaching. When the leading edge of the blast shock wave arrives, it produces an essentially instantaneous rise in pres-sure from ambient to some maximum value. Thereafter, the pressure gradually decays back to
ambient pressure. This portion of the blast wave is referred to as the positive phase. Following the positive phase, there usually is a negative phase, during which pressure drops below ambient. In essence, this is caused by over expansion of the gases, wherein the outward rush of air continues beyond that necessary to relieve the pressure pro-duced by the explosion. Thus, a partial vacuum forms at the seat of the explosion, producing the negative phase of the blast wave. It is less extreme than the positive phase and lasts longer.
Figure 3. An illustration of a typical overpressure profile (blast wave) produced by an explosion.
Sound pressure level (SPL, in decibels, dB) is a physically measurable quantity and can be cal-culated from blast overpressure measurements using the relationship shown in equation 1.[4,5][a] Using the recognized standard reference level of 0.0002 dyn/cm2 and converting pressure to pounds per square inch (psi), this becomes equation 2.
20 logo
PSPL
P= ⋅ (1)
170.8 20 log SPL P= + (2)
where Po is the standard reference value of 0.0002 dyn/cm2. As can be seen, there is a logarithmic relationship between sound pressure level and peak overpressure (P).
Loudness is a subjective measure of sound lev-el, dependent on the processing of nerve impulses by the brain. The loudness scale is linear, such that a sound with a loudness value twice that of another sound will be perceived by a typical lis-tener to be twice as loud. Loudness values (N, in sones) can be calculated from sound pressure lev-els using the relationship shown in equation 3.[5]
High Pressure Gases Move Upward
Exiting High Velocity Gases Expand
Explosive Burning of Powder Load
Downward Recoil Force
ExpandingGases
Figure 2. An illustration of the firing of a concus-sion mortar.
Explosion Chamber
Concussion Flash Powder
Electric Match Leg Wires
Concussion Mortar
Base Plate
Figure 1. An illustration of the construction and setup of a concussion mortar.

Page 404 Selected Pyrotechnic Publications of K.L. and B.J. Kosanke
log 0.03 1.2nN L= − (3)
( )0.03 1.210 SPLN − (4)
where Ln, loudness level, is equal to SPL in dB for a 1000 Hz tone. Thus, for this study equation 4 was used to calculate approximate loudness.
Because loudness expressed in sones is not a unit of measure with which many readers are ac-customed, in this article, loudness is reported as relative loudness. The least loud average concus-sion mortar air blast was assigned a value of 1.0. Thus a concussion mortar blast reported as pro-ducing sound with a relative loudness of 2.0 or 5.0 will be one perceived by the average listener to be approximately two or five times as loud, respec-tively.
In addition to the loudness of a concussion mortar blast, the tonal quality of the sound may also be of interest. That is to say, does the sound produced tend toward being a sharp crack or a more mellow boom? The feature of a blast wave that is thought to correlate with perceived tonal quality is the duration of the positive and negative phases. All else being equal, shorter phase dura-tions are expected to be heard more nearly as sharp cracks, and longer phases as more mellow booms. There are at least two reasons for being somewhat cautious about proclaiming that tonal quality correlates with phase duration. First is that tonal quality is a subjective (mental) response to a physical stimulus (the blast pressure wave), and the brain may not process this information as one might expect that it might.[6] Second is that the authors are not aware of any comprehensive study of perceived tonal quality as functions of blast wave phase duration.
It is also conjectured that the rate of rise of the leading edge of the positive phase (dP/dt) may affect tonal quality. It is expected that sharper ris-es may be perceived as being sharper sounding. However, at the short distance at which measure-ments of the blast waves were made in this study, all had a near instantaneous pressure rise.
While on the subject of tonal quality of blast waves, it is appropriate to mention that the subject is made more complicated because a complex re-lationship has been demonstrated between per-ceived loudness and tonal quality for pure tones.[6] Further, the results for a brief study of spectator responses to the sounds produced by fireworks salutes, suggests a strong correlation between
loudness and tonal quality, which, however, is in the opposite direction as that reported for pure tones.[6,7] Accordingly, for the purpose of this arti-cle, it will only be assumed that tonal quality cor-relates with phase duration, at least for equally loud sounds.
Experimental Method[b]
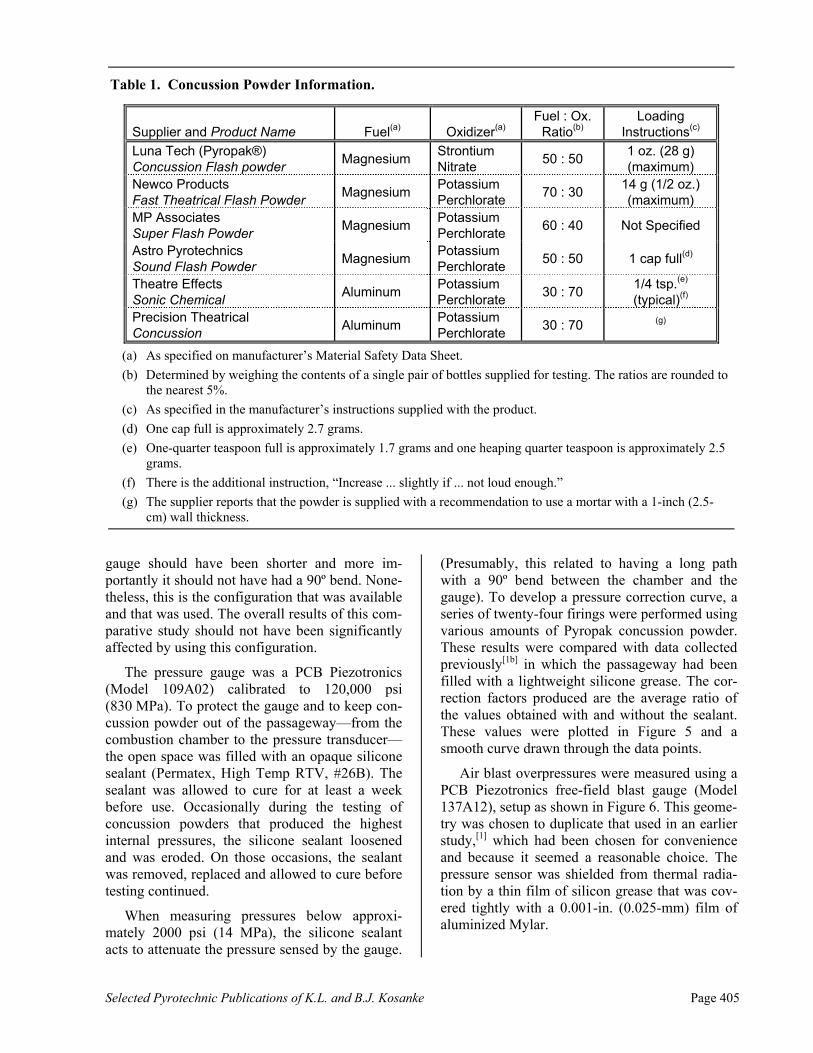
Table 1 lists information regarding the binary concussion powders (so-called A–B mixes) used in this study. The powders are listed in order of the internal mortar pressures they produced, from the lowest to highest pressure. Most of the infor-mation in the table was gathered from Material Safety Data Sheets and user instructions provided by the manufacturers. One exception is the fuel to oxidizer ratios that were obtained by simply weighing the contents of the containers for the two components and rounding to the nearest 5%. Not included in Table 1 is information about par-ticle size of the components; it was felt this would be proprietary information of the manufacturers. It should also be noted that some of these samples were provided several years ago; thus, it is possi-ble that the manufacturers will have made changes in their formulations, which are not reflected in this study. Further, Astro Pyrotechnics has an-nounced that they have discontinued the general sale of their concussion powder.
The test concussion mortar had been modified, as shown in Figure 4, to allow attachment of a quartz piezoelectric pressure transducer for re-cording internal pressure during its firing. Unfor-tunately, in retrospect, this was not the ideal con-figuration. The length of passage to the pressure
Figure 4. An illustration showing the installation of the pressure transducer.
Selected Pyrotechnic Publications of K.L. and B.J. Kosanke Page 405
gauge should have been shorter and more im-portantly it should not have had a 90º bend. None-theless, this is the configuration that was available and that was used. The overall results of this com-parative study should not have been significantly affected by using this configuration.
The pressure gauge was a PCB Piezotronics (Model 109A02) calibrated to 120,000 psi (830 MPa). To protect the gauge and to keep con-cussion powder out of the passageway—from the combustion chamber to the pressure transducer—the open space was filled with an opaque silicone sealant (Permatex, High Temp RTV, #26B). The sealant was allowed to cure for at least a week before use. Occasionally during the testing of concussion powders that produced the highest internal pressures, the silicone sealant loosened and was eroded. On those occasions, the sealant was removed, replaced and allowed to cure before testing continued.
When measuring pressures below approxi-mately 2000 psi (14 MPa), the silicone sealant acts to attenuate the pressure sensed by the gauge.
(Presumably, this related to having a long path with a 90º bend between the chamber and the gauge). To develop a pressure correction curve, a series of twenty-four firings were performed using various amounts of Pyropak concussion powder. These results were compared with data collected previously[1b] in which the passageway had been filled with a lightweight silicone grease. The cor-rection factors produced are the average ratio of the values obtained with and without the sealant. These values were plotted in Figure 5 and a smooth curve drawn through the data points.
Air blast overpressures were measured using a PCB Piezotronics free-field blast gauge (Model 137A12), setup as shown in Figure 6. This geome-try was chosen to duplicate that used in an earlier study,[1] which had been chosen for convenience and because it seemed a reasonable choice. The pressure sensor was shielded from thermal radia-tion by a thin film of silicon grease that was cov-ered tightly with a 0.001-in. (0.025-mm) film of aluminized Mylar.
Table 1. Concussion Powder Information.
Supplier and Product Name
Fuel(a)
Oxidizer(a)
Fuel : Ox. Ratio(b)
Loading Instructions(c)
Luna Tech (Pyropak®) Concussion Flash powder
Magnesium Strontium Nitrate
50 : 50 1 oz. (28 g) (maximum)
Newco Products Fast Theatrical Flash Powder
Magnesium Potassium Perchlorate
70 : 30 14 g (1/2 oz.) (maximum)
MP Associates Super Flash Powder
Magnesium Potassium Perchlorate
60 : 40 Not Specified
Astro Pyrotechnics Sound Flash Powder
Magnesium Potassium Perchlorate
50 : 50 1 cap full(d)
Theatre Effects Sonic Chemical
Aluminum Potassium Perchlorate
30 : 70 1/4 tsp.(e) (typical)(f)
Precision Theatrical Concussion
Aluminum Potassium Perchlorate
30 : 70 (g)
(a) As specified on manufacturer’s Material Safety Data Sheet.
(b) Determined by weighing the contents of a single pair of bottles supplied for testing. The ratios are rounded to the nearest 5%.
(c) As specified in the manufacturer’s instructions supplied with the product.
(d) One cap full is approximately 2.7 grams.
(e) One-quarter teaspoon full is approximately 1.7 grams and one heaping quarter teaspoon is approximately 2.5 grams.
(f) There is the additional instruction, “Increase ... slightly if ... not loud enough.”
(g) The supplier reports that the powder is supplied with a recommendation to use a mortar with a 1-inch (2.5-cm) wall thickness.

Page 406 Selected Pyrotechnic Publications of K.L. and B.J. Kosanke
0 500 1000 1500 2000 2500 30000.8
1.0
1.2
1.6
2.0
2.4
Observed Pressure (psi)
Co
rre
ctio
n F
act
or
Figure 5. Graph of factors used to correct mortar pressures for the presence of silicone sealant.
(ground)18"
36"
60"
ConcussionMortar
Free FieldBlast Gauge
OverpressureSignal
Figure 6. An illustration of the physical setup used to collect concussion mortar air blast over-pressures. (For conversion of units, 1 in. = 25.4 mm)
The electric matches used to ignite the concus-sion powders in this study were Daveyfire SA-2000. The electric matches were installed near the bottom of the powder charge (see Figure 1). The procedure was to insert the match until it touched the bottom of the mortar, and then withdraw it approximately 1/8 in. (3 mm). Over the course of these and earlier tests, the diameter of the electric match hole in the mortar had eroded quite large, to an irregular diameter of approximately 0.25 in. (0.5 cm). In addition, prior repeated use of the mortar had also eroded the bore of the combustion chamber to approximately 1.05 in. (2.7 cm). It is likely these erosions caused the measured internal mortar pressures to be slightly less than might otherwise have been the case.
Output from both PCB transducers (internal mortar pressure and blast overpressure) were fed to amplifying power supplies (PCB Model 480D09) and recorded using digital oscilloscopes.
Permanent storage and plotting of the data was accomplished using a computer.
Typically each concussion powder was tested with loads of 7, 14, 21, and 28 g. However, when any concussion powder load mass produced an internal pressure that approached 100,000 psi (700 MPa) for any individual firing, or if a series of firings produced pressures that averaged more than 30,000 psi (200 Mpa), no greater loads of that powder were tested. When these values were exceeded for light powder loads, additional tests with various low mass loads were performed.
Results
In this section, the results of the test firings are reported without comment. (The discussion of the results is deferred until the next section.) The re-sults from the individual firings are reported in Tables 2 through 7. Typically, there were three test firings for each load mass with each powder. However, in some cases additional firings were conducted. Sometimes this was because of a fail-ure to successfully capture both types of pressure data for reasons such as data being off-scale. Oth-er times this was the result of some initial testing being performed in a test chamber in which it was felt that there was insufficient space above the concussion mortar to collect reliable air blast data. [This was only a problem for those concussion powders with formulations that were particularly fuel rich (i.e., Pyropak’s and Newco’s.)] This is discussed further in the next section.
In Tables 2 through 7, the column headed “Pres.” presents the data from internal mortar pressure measurements. The column “FWHM” is an ab-breviation for Full Width at Half Maximum. This is simply the width of the internal pressure peak, measured at one half of its peak value. It is an in-dication of the width of the pressure peaks. When the pressure curves have a simple shape (see Fig-ure 7B in the next section), FWHM is a reasona-bly good indicator of relative peak width. Howev-er, when the pressure peaks have an irregular or complex shape (see the other curves of Figure 7) this is a less reliable indicator, but it is still some-what useful. The column titled “P. Imp.” presents pressure impulse data, the area under the internal mortar pressure versus time curves. The column headed “Blast” reports peak air blast overpressure results. The column titled “Pos. Ph.” presents the duration of the positive phase portion of the air blast wave. Finally, the column headed “B. Imp.”
Selected Pyrotechnic Publications of K.L. and B.J. Kosanke Page 407
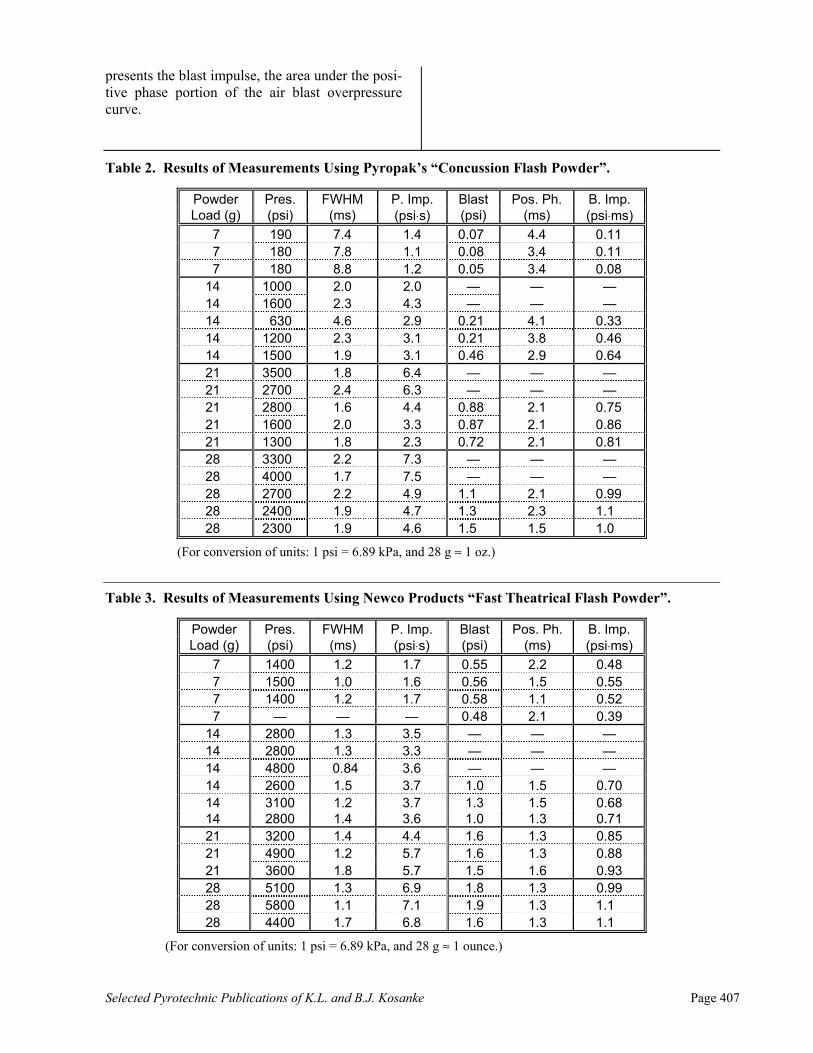
presents the blast impulse, the area under the posi-tive phase portion of the air blast overpressure curve.
Table 2. Results of Measurements Using Pyropak’s “Concussion Flash Powder”.
Powder Pres. FWHM P. Imp. Blast Pos. Ph. B. Imp. Load (g) (psi) (ms) (psi⋅s) (psi) (ms) (psi⋅ms)
7 190 7.4 1.4 0.07 4.4 0.11 7 180 7.8 1.1 0.08 3.4 0.11 7 180 8.8 1.2 0.05 3.4 0.08
14 1000 2.0 2.0 — — — 14 1600 2.3 4.3 — — — 14 630 4.6 2.9 0.21 4.1 0.33 14 1200 2.3 3.1 0.21 3.8 0.46 14 1500 1.9 3.1 0.46 2.9 0.64 21 3500 1.8 6.4 — — — 21 2700 2.4 6.3 — — — 21 2800 1.6 4.4 0.88 2.1 0.75 21 1600 2.0 3.3 0.87 2.1 0.86 21 1300 1.8 2.3 0.72 2.1 0.81 28 3300 2.2 7.3 — — — 28 4000 1.7 7.5 — — — 28 2700 2.2 4.9 1.1 2.1 0.99 28 2400 1.9 4.7 1.3 2.3 1.1 28 2300 1.9 4.6 1.5 1.5 1.0
(For conversion of units: 1 psi = 6.89 kPa, and 28 g ≈ 1 oz.)
Table 3. Results of Measurements Using Newco Products “Fast Theatrical Flash Powder”.
Powder Pres. FWHM P. Imp. Blast Pos. Ph. B. Imp. Load (g) (psi) (ms) (psi⋅s) (psi) (ms) (psi⋅ms)
7 1400 1.2 1.7 0.55 2.2 0.48 7 1500 1.0 1.6 0.56 1.5 0.55 7 1400 1.2 1.7 0.58 1.1 0.52 7 — — — 0.48 2.1 0.39
14 2800 1.3 3.5 — — — 14 2800 1.3 3.3 — — — 14 4800 0.84 3.6 — — — 14 2600 1.5 3.7 1.0 1.5 0.70 14 3100 1.2 3.7 1.3 1.5 0.68 14 2800 1.4 3.6 1.0 1.3 0.71 21 3200 1.4 4.4 1.6 1.3 0.85 21 4900 1.2 5.7 1.6 1.3 0.88 21 3600 1.8 5.7 1.5 1.6 0.93 28 5100 1.3 6.9 1.8 1.3 0.99 28 5800 1.1 7.1 1.9 1.3 1.1 28 4400 1.7 6.8 1.6 1.3 1.1
(For conversion of units: 1 psi = 6.89 kPa, and 28 g ≈ 1 ounce.)
Page 408 Selected Pyrotechnic Publications of K.L. and B.J. Kosanke
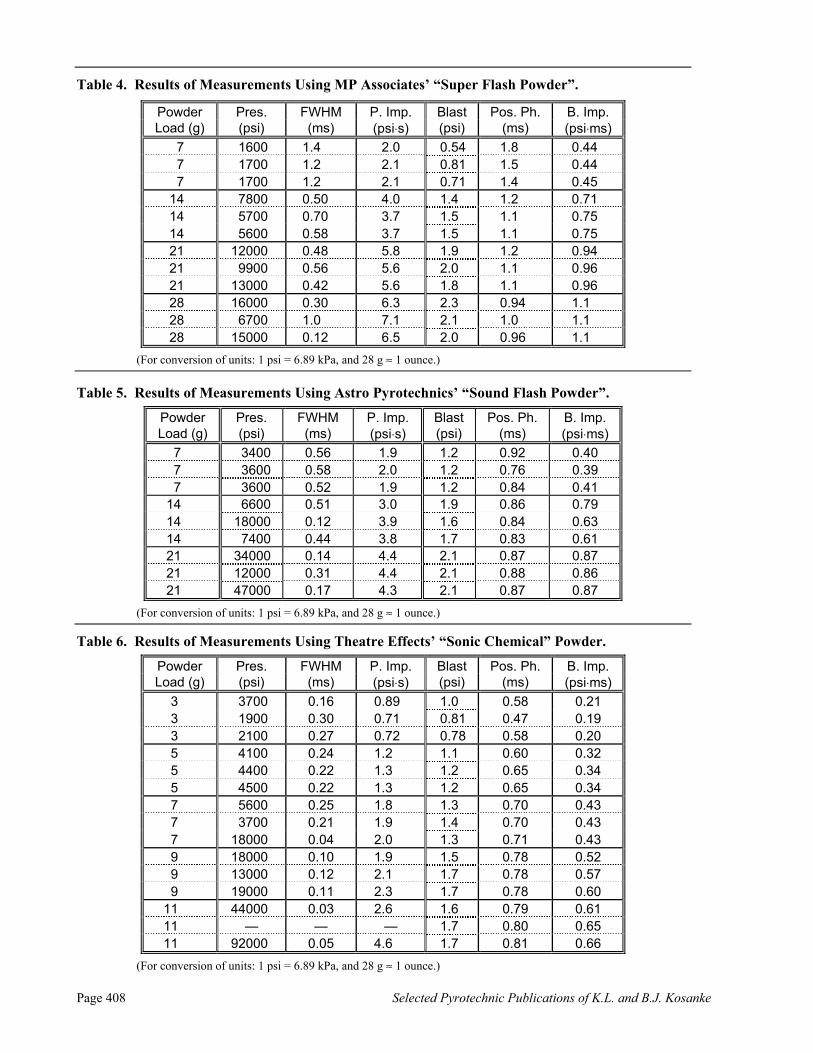
Table 4. Results of Measurements Using MP Associates’ “Super Flash Powder”.
Powder Pres. FWHM P. Imp. Blast Pos. Ph. B. Imp. Load (g) (psi) (ms) (psi⋅s) (psi) (ms) (psi⋅ms)
7 1600 1.4 2.0 0.54 1.8 0.44 7 1700 1.2 2.1 0.81 1.5 0.44 7 1700 1.2 2.1 0.71 1.4 0.45
14 7800 0.50 4.0 1.4 1.2 0.71 14 5700 0.70 3.7 1.5 1.1 0.75 14 5600 0.58 3.7 1.5 1.1 0.75 21 12000 0.48 5.8 1.9 1.2 0.94 21 9900 0.56 5.6 2.0 1.1 0.96 21 13000 0.42 5.6 1.8 1.1 0.96 28 16000 0.30 6.3 2.3 0.94 1.1 28 6700 1.0 7.1 2.1 1.0 1.1 28 15000 0.12 6.5 2.0 0.96 1.1
(For conversion of units: 1 psi = 6.89 kPa, and 28 g ≈ 1 ounce.)
Table 5. Results of Measurements Using Astro Pyrotechnics’ “Sound Flash Powder”.
Powder Pres. FWHM P. Imp. Blast Pos. Ph. B. Imp. Load (g) (psi) (ms) (psi⋅s) (psi) (ms) (psi⋅ms)
7 3400 0.56 1.9 1.2 0.92 0.40 7 3600 0.58 2.0 1.2 0.76 0.39 7 3600 0.52 1.9 1.2 0.84 0.41
14 6600 0.51 3.0 1.9 0.86 0.79 14 18000 0.12 3.9 1.6 0.84 0.63 14 7400 0.44 3.8 1.7 0.83 0.61 21 34000 0.14 4.4 2.1 0.87 0.87 21 12000 0.31 4.4 2.1 0.88 0.86 21 47000 0.17 4.3 2.1 0.87 0.87
(For conversion of units: 1 psi = 6.89 kPa, and 28 g ≈ 1 ounce.)
Table 6. Results of Measurements Using Theatre Effects’ “Sonic Chemical” Powder.
Powder Pres. FWHM P. Imp. Blast Pos. Ph. B. Imp. Load (g) (psi) (ms) (psi⋅s) (psi) (ms) (psi⋅ms)
3 3700 0.16 0.89 1.0 0.58 0.21 3 1900 0.30 0.71 0.81 0.47 0.19 3 2100 0.27 0.72 0.78 0.58 0.20 5 4100 0.24 1.2 1.1 0.60 0.32 5 4400 0.22 1.3 1.2 0.65 0.34 5 4500 0.22 1.3 1.2 0.65 0.34 7 5600 0.25 1.8 1.3 0.70 0.43 7 3700 0.21 1.9 1.4 0.70 0.43 7 18000 0.04 2.0 1.3 0.71 0.43 9 18000 0.10 1.9 1.5 0.78 0.52 9 13000 0.12 2.1 1.7 0.78 0.57 9 19000 0.11 2.3 1.7 0.78 0.60
11 44000 0.03 2.6 1.6 0.79 0.61 11 — — — 1.7 0.80 0.65 11 92000 0.05 4.6 1.7 0.81 0.66
(For conversion of units: 1 psi = 6.89 kPa, and 28 g ≈ 1 ounce.)
Selected Pyrotechnic Publications of K.L. and B.J. Kosanke Page 409
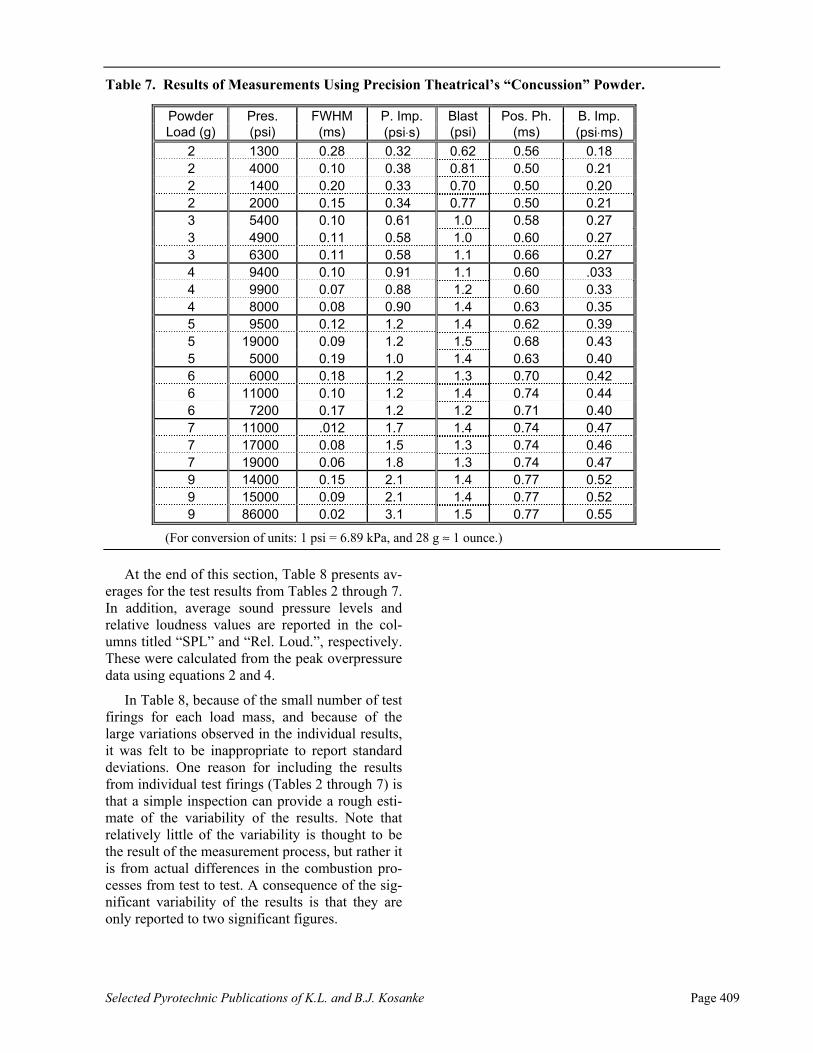
Table 7. Results of Measurements Using Precision Theatrical’s “Concussion” Powder.
Powder Pres. FWHM P. Imp. Blast Pos. Ph. B. Imp. Load (g) (psi) (ms) (psi⋅s) (psi) (ms) (psi⋅ms)
2 1300 0.28 0.32 0.62 0.56 0.18 2 4000 0.10 0.38 0.81 0.50 0.21 2 1400 0.20 0.33 0.70 0.50 0.20 2 2000 0.15 0.34 0.77 0.50 0.21 3 5400 0.10 0.61 1.0 0.58 0.27 3 4900 0.11 0.58 1.0 0.60 0.27 3 6300 0.11 0.58 1.1 0.66 0.27 4 9400 0.10 0.91 1.1 0.60 .033 4 9900 0.07 0.88 1.2 0.60 0.33 4 8000 0.08 0.90 1.4 0.63 0.35 5 9500 0.12 1.2 1.4 0.62 0.39 5 19000 0.09 1.2 1.5 0.68 0.43 5 5000 0.19 1.0 1.4 0.63 0.40 6 6000 0.18 1.2 1.3 0.70 0.42 6 11000 0.10 1.2 1.4 0.74 0.44 6 7200 0.17 1.2 1.2 0.71 0.40 7 11000 .012 1.7 1.4 0.74 0.47 7 17000 0.08 1.5 1.3 0.74 0.46 7 19000 0.06 1.8 1.3 0.74 0.47 9 14000 0.15 2.1 1.4 0.77 0.52 9 15000 0.09 2.1 1.4 0.77 0.52 9 86000 0.02 3.1 1.5 0.77 0.55
(For conversion of units: 1 psi = 6.89 kPa, and 28 g ≈ 1 ounce.)
At the end of this section, Table 8 presents av-erages for the test results from Tables 2 through 7. In addition, average sound pressure levels and relative loudness values are reported in the col-umns titled “SPL” and “Rel. Loud.”, respectively. These were calculated from the peak overpressure data using equations 2 and 4.
In Table 8, because of the small number of test firings for each load mass, and because of the large variations observed in the individual results, it was felt to be inappropriate to report standard deviations. One reason for including the results from individual test firings (Tables 2 through 7) is that a simple inspection can provide a rough esti-mate of the variability of the results. Note that relatively little of the variability is thought to be the result of the measurement process, but rather it is from actual differences in the combustion pro-cesses from test to test. A consequence of the sig-nificant variability of the results is that they are only reported to two significant figures.

Page 410 Selected Pyrotechnic Publications of K.L. and B.J. Kosanke
Table 8. Average Results for the Various Sources of Concussion Powder.
Powder Pres. FWHM P. Imp. Blast Pos. Ph. B. Imp. SPL Rel. Load (g)(a) (psi) (ms) (psi⋅s) (psi) (ms) (psi⋅ms) (dB) Loud.
LP 7 180 8.0 1.2 0.07 3.7 0.10 148 ≡1.0 LP 14 1200 2.6 3.1 0.29 3.6 0.47 160 2.3 LP 21 2500 1.9 4.7 0.82 2.1 0.81 169 4.4 LP 28 2900 2.0 5.8 1.3 2.0 1.0 173 5.8 N 7 1400 1.1 1.7 0.54 1.7 0.48 165 3.4 N 14 3300 1.3 3.6 1.1 1.4 0.70 172 5.2 N 21 3900 1.5 5.3 1.6 1.4 0.89 175 6.5 N 28 5100 1.4 6.9 1.8 1.3 1.1 176 7.0 MP 7 1700 1.3 2.1 0.69 1.6 0.44 168 4.0 MP 14 6400 0.59 3.8 1.5 1.1 0.74 174 6.3 MP 21 12000 0.49 5.6 1.9 1.1 0.95 176 7.3 MP 28 13000 0.47 6.6 2.1 0.97 1.1 177 7.7 A 7 3500 0.55 1.9 1.2 0.84 0.40 172 5.5 A 14 11000 0.36 3.6 1.7 0.84 0.68 175 6.8 A 21 31000 0.17 4.3 2.1 0.87 0.87 177 7.7 A 28 (b) (b) (b) (b) (b) (b) (b) (b)
TE 3 2600 0.24 0.77 0.86 0.54 0.20 170 4.5 TE 5 4300 0.23 1.3 1.2 0.63 0.33 172 5.5 TE 7 10000 0.17 1.9 1.3 0.70 0.43 173 5.7 TE 9 17000 0.11 2.1 1.6 0.78 0.56 175 6.5 TE 11 68000 0.04 3.6 1.7 0.80 0.64 175 6.8 TE 13 (b) (b) (b) (b) (b) (b) (b) (b)
PT 3 5500 0.11 0.59 1.0 0.61 0.27 171 4.9 PT 5 11000 0.13 1.1 1.4 0.64 0.41 174 6.0 PT 7 16000 0.09 1.7 1.3 0.74 0.47 173 5.7 PT 9 38000 0.09 2.4 1.4 0.77 0.53 174 6.0 PT 11 (b) (b) (b) (b) (b) (b) (b) (b)
(For conversion of units: 1 psi = 6.89 kPa, and 28 g ≈ 1 ounce.)
(a) LP = Luna Tech / Pyropak; N = Newco Products; MP = MP Associates; A = Astro Pyrotechnics; TE = Thea-tre Effects; PT = Precision Theatrical.
(b) Pressure limit criterion was exceeded for the next lower load mass; no test was performed for this load mass.
Discussion of Results
For test firings of the most fuel-rich concus-sion powders, it was found that credible data could not be collected in a blast chamber with on-ly an 8-foot (2.4 m) ceiling. The air blast peak shapes observed were seriously distorted com-pared with those collected in a larger chamber and for less fuel-rich powders. This observation may be consistent with the most fuel-rich powders producing a portion of their blast wave from a fuel-air explosion above the mortars.
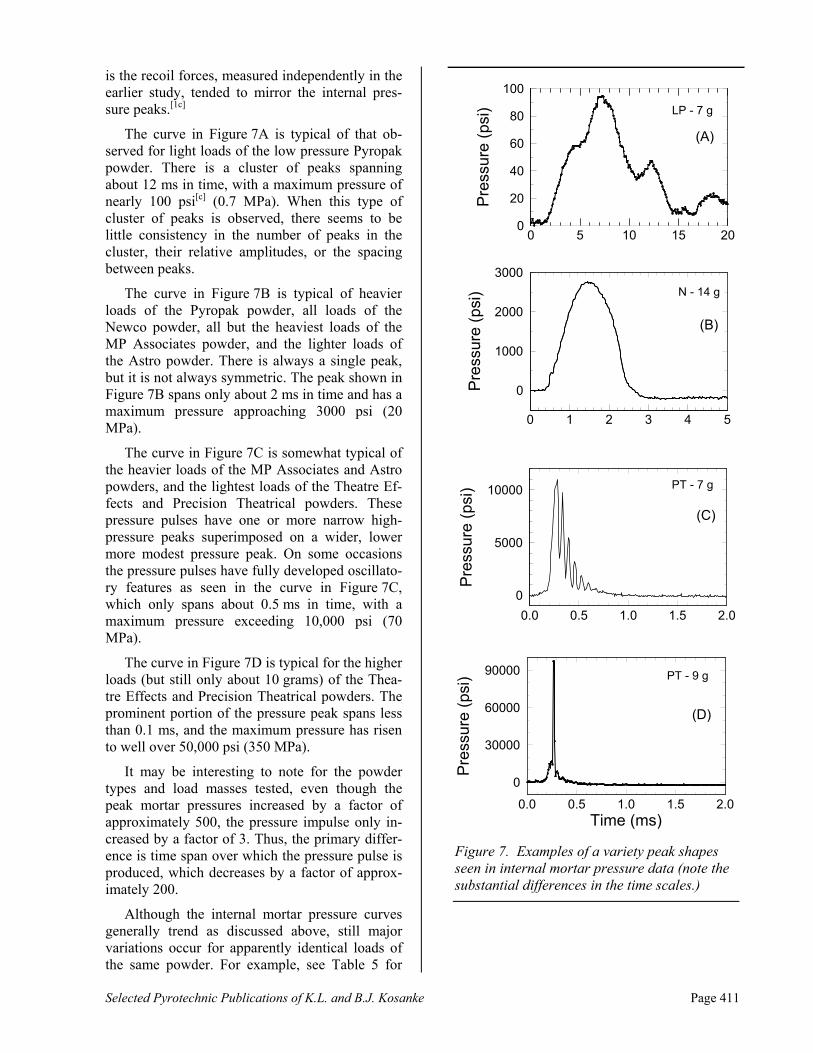
In this study, as in an earlier study,[1] a large degree of variability was observed for internal mortar pressure pulse shapes. Examples of these shapes are shown in Figure 7. It is likely that the peak shapes are real and reflect differences in the combustion process. This is because the type of pressure pulse shape observed tends to be predict-able, based on load mass and powder type. Fur-ther, it has not been possible to postulate a simple model for how a problem with the instrumentation could produce such widely varying shapes with consistent pressure impulses (peak areas). Another reason to believe the various peak shapes are real
Selected Pyrotechnic Publications of K.L. and B.J. Kosanke Page 411
is the recoil forces, measured independently in the earlier study, tended to mirror the internal pres-sure peaks.[1c]
The curve in Figure 7A is typical of that ob-served for light loads of the low pressure Pyropak powder. There is a cluster of peaks spanning about 12 ms in time, with a maximum pressure of nearly 100 psi[c] (0.7 MPa). When this type of cluster of peaks is observed, there seems to be little consistency in the number of peaks in the cluster, their relative amplitudes, or the spacing between peaks.
The curve in Figure 7B is typical of heavier loads of the Pyropak powder, all loads of the Newco powder, all but the heaviest loads of the MP Associates powder, and the lighter loads of the Astro powder. There is always a single peak, but it is not always symmetric. The peak shown in Figure 7B spans only about 2 ms in time and has a maximum pressure approaching 3000 psi (20 MPa).
The curve in Figure 7C is somewhat typical of the heavier loads of the MP Associates and Astro powders, and the lightest loads of the Theatre Ef-fects and Precision Theatrical powders. These pressure pulses have one or more narrow high-pressure peaks superimposed on a wider, lower more modest pressure peak. On some occasions the pressure pulses have fully developed oscillato-ry features as seen in the curve in Figure 7C, which only spans about 0.5 ms in time, with a maximum pressure exceeding 10,000 psi (70 MPa).
The curve in Figure 7D is typical for the higher loads (but still only about 10 grams) of the Thea-tre Effects and Precision Theatrical powders. The prominent portion of the pressure peak spans less than 0.1 ms, and the maximum pressure has risen to well over 50,000 psi (350 MPa).
It may be interesting to note for the powder types and load masses tested, even though the peak mortar pressures increased by a factor of approximately 500, the pressure impulse only in-creased by a factor of 3. Thus, the primary differ-ence is time span over which the pressure pulse is produced, which decreases by a factor of approx-imately 200.
Although the internal mortar pressure curves generally trend as discussed above, still major variations occur for apparently identical loads of the same powder. For example, see Table 5 for
0
20
40
60
80
100
Pre
ssur
e (p
si)
0 5 10 15 20
LP - 7 g
(A)
0
1000
2000
3000
Pre
ssur
e (p
s i)
0 1 2 3 4 5
N - 14 g
(B)
0
5000
10000
Pre
ssur
e (p
si)
0.0 0.5 1.0 1.5 2.0
PT - 7 g
(C)
0
30000
60000
90000
Pre
ssur
e ( p
si)
0.0 0.5 1.0 1.5 2.0Time (ms)
PT - 9 g
(D)
Figure 7. Examples of a variety peak shapes seen in internal mortar pressure data (note the substantial differences in the time scales.)
Page 412 Selected Pyrotechnic Publications of K.L. and B.J. Kosanke
21-gram loads of the Astro powder. Here the max-imum pressures were 34, 12, and 47 kpsi (230, 80, and 320 MPa, respectively). Despite the large var-iation in peak internal pressure, pressure impulse and air blast overpressures are much more con-sistent. The pressure impulses were 4.4, 4.4, and 4.3 psi·s (30, 30, and 29 kPa·s), respectively, and the peak air blast overpressures were all 2.1 psi (14 kPa). In this case, the total energy being re-leased and the sound pressure levels are quite con-sistent. Independent of concussion powder type, this was found to be generally true; air blast pres-sures correlate better with pressure impulse than with peak internal mortar pressure.
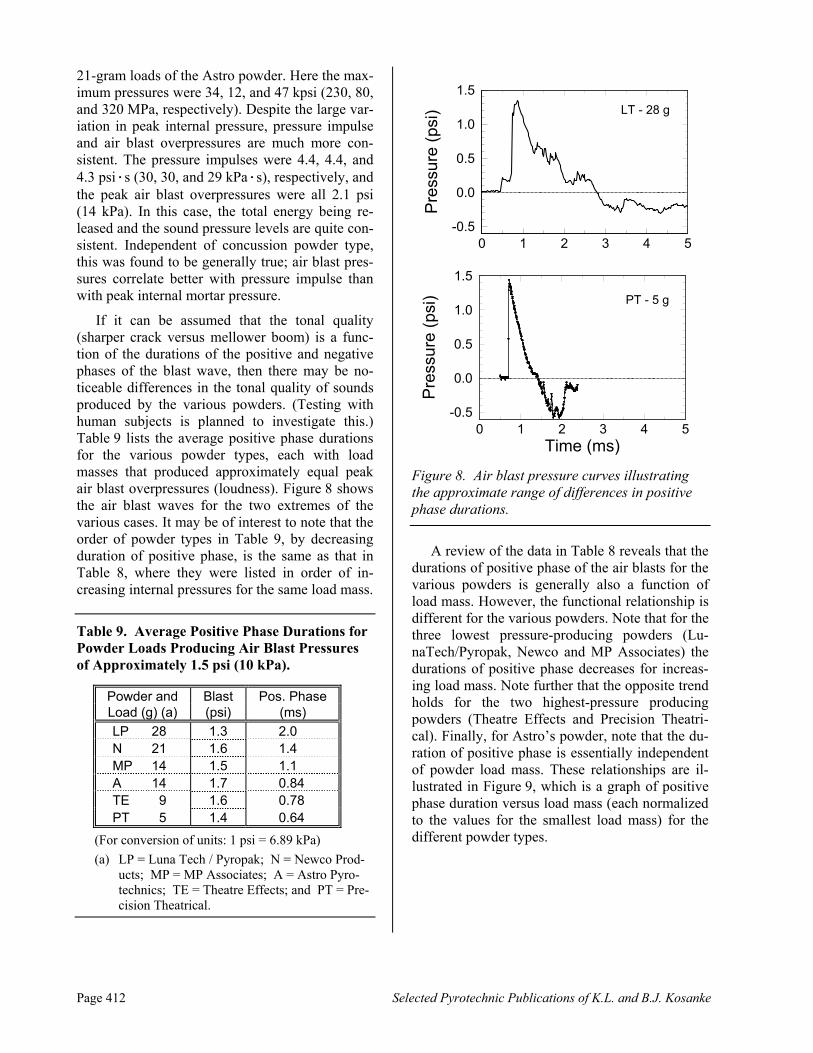
If it can be assumed that the tonal quality (sharper crack versus mellower boom) is a func-tion of the durations of the positive and negative phases of the blast wave, then there may be no-ticeable differences in the tonal quality of sounds produced by the various powders. (Testing with human subjects is planned to investigate this.) Table 9 lists the average positive phase durations for the various powder types, each with load masses that produced approximately equal peak air blast overpressures (loudness). Figure 8 shows the air blast waves for the two extremes of the various cases. It may be of interest to note that the order of powder types in Table 9, by decreasing duration of positive phase, is the same as that in Table 8, where they were listed in order of in-creasing internal pressures for the same load mass.
Table 9. Average Positive Phase Durations for Powder Loads Producing Air Blast Pressures of Approximately 1.5 psi (10 kPa).
Powder and Blast Pos. Phase Load (g) (a) (psi) (ms)
LP 28 1.3 2.0 N 21 1.6 1.4 MP 14 1.5 1.1 A 14 1.7 0.84 TE 9 1.6 0.78 PT 5 1.4 0.64
(For conversion of units: 1 psi = 6.89 kPa)
(a) LP = Luna Tech / Pyropak; N = Newco Prod-ucts; MP = MP Associates; A = Astro Pyro-technics; TE = Theatre Effects; and PT = Pre-cision Theatrical.
-0.5
0.0
0.5
1.0
1.5
Pre
ssu
re (
psi)
0 1 2 3 4 5
LT - 28 g
-0.5
0.0
0.5
1.0
1.5
Pre
ssu r
e (p
s i)
0 1 2 3 4 5Time (ms)
PT - 5 g
Figure 8. Air blast pressure curves illustrating the approximate range of differences in positive phase durations.
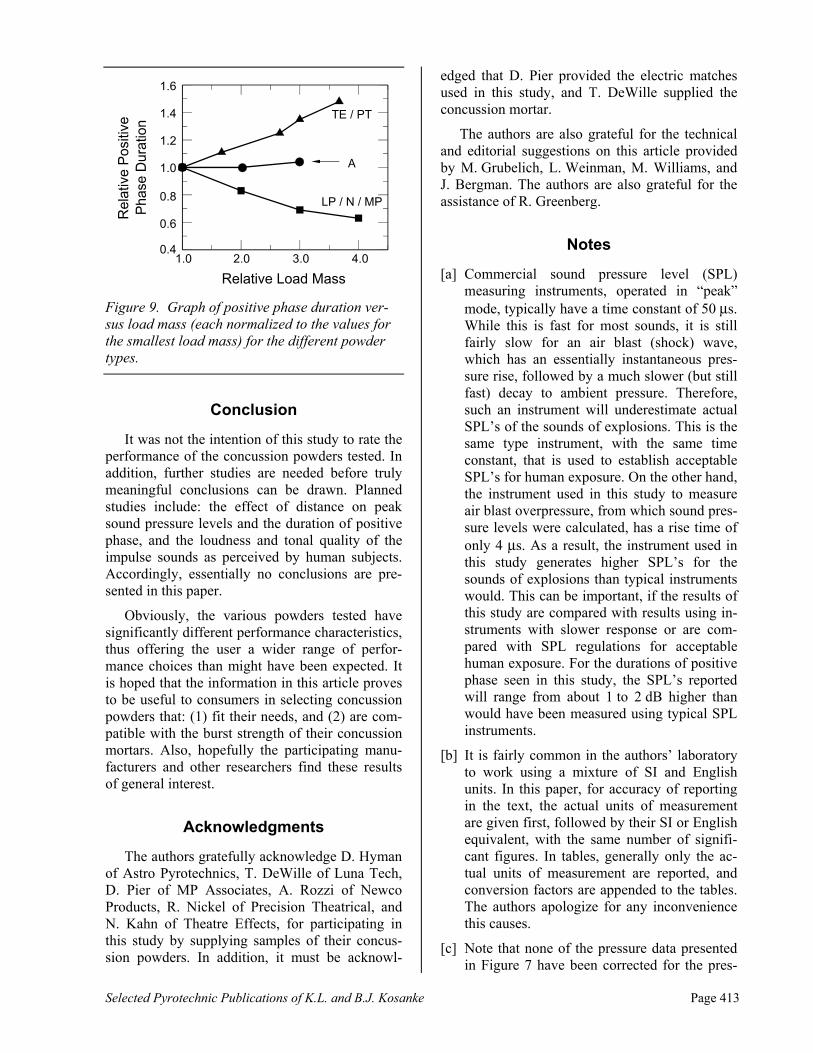
A review of the data in Table 8 reveals that the durations of positive phase of the air blasts for the various powders is generally also a function of load mass. However, the functional relationship is different for the various powders. Note that for the three lowest pressure-producing powders (Lu-naTech/Pyropak, Newco and MP Associates) the durations of positive phase decreases for increas-ing load mass. Note further that the opposite trend holds for the two highest-pressure producing powders (Theatre Effects and Precision Theatri-cal). Finally, for Astro’s powder, note that the du-ration of positive phase is essentially independent of powder load mass. These relationships are il-lustrated in Figure 9, which is a graph of positive phase duration versus load mass (each normalized to the values for the smallest load mass) for the different powder types.
Selected Pyrotechnic Publications of K.L. and B.J. Kosanke Page 413
TE / PT
A
LP / N / MP
1.0 2.0 3.0 4.00.4
0.6
0.8
1.0
1.2
1.4
1.6
Relative Load Mass
Rel
ativ
e P
ositi
ve
Pha
se D
urat
ion
Figure 9. Graph of positive phase duration ver-sus load mass (each normalized to the values for the smallest load mass) for the different powder types.
Conclusion
It was not the intention of this study to rate the performance of the concussion powders tested. In addition, further studies are needed before truly meaningful conclusions can be drawn. Planned studies include: the effect of distance on peak sound pressure levels and the duration of positive phase, and the loudness and tonal quality of the impulse sounds as perceived by human subjects. Accordingly, essentially no conclusions are pre-sented in this paper.
Obviously, the various powders tested have significantly different performance characteristics, thus offering the user a wider range of perfor-mance choices than might have been expected. It is hoped that the information in this article proves to be useful to consumers in selecting concussion powders that: (1) fit their needs, and (2) are com-patible with the burst strength of their concussion mortars. Also, hopefully the participating manu-facturers and other researchers find these results of general interest.
Acknowledgments
The authors gratefully acknowledge D. Hyman of Astro Pyrotechnics, T. DeWille of Luna Tech, D. Pier of MP Associates, A. Rozzi of Newco Products, R. Nickel of Precision Theatrical, and N. Kahn of Theatre Effects, for participating in this study by supplying samples of their concus-sion powders. In addition, it must be acknowl-
edged that D. Pier provided the electric matches used in this study, and T. DeWille supplied the concussion mortar.
The authors are also grateful for the technical and editorial suggestions on this article provided by M. Grubelich, L. Weinman, M. Williams, and J. Bergman. The authors are also grateful for the assistance of R. Greenberg.
Notes
[a] Commercial sound pressure level (SPL) measuring instruments, operated in “peak” mode, typically have a time constant of 50 μs. While this is fast for most sounds, it is still fairly slow for an air blast (shock) wave, which has an essentially instantaneous pres-sure rise, followed by a much slower (but still fast) decay to ambient pressure. Therefore, such an instrument will underestimate actual SPL’s of the sounds of explosions. This is the same type instrument, with the same time constant, that is used to establish acceptable SPL’s for human exposure. On the other hand, the instrument used in this study to measure air blast overpressure, from which sound pres-sure levels were calculated, has a rise time of only 4 μs. As a result, the instrument used in this study generates higher SPL’s for the sounds of explosions than typical instruments would. This can be important, if the results of this study are compared with results using in-struments with slower response or are com-pared with SPL regulations for acceptable human exposure. For the durations of positive phase seen in this study, the SPL’s reported will range from about 1 to 2 dB higher than would have been measured using typical SPL instruments.
[b] It is fairly common in the authors’ laboratory to work using a mixture of SI and English units. In this paper, for accuracy of reporting in the text, the actual units of measurement are given first, followed by their SI or English equivalent, with the same number of signifi-cant figures. In tables, generally only the ac-tual units of measurement are reported, and conversion factors are appended to the tables. The authors apologize for any inconvenience this causes.
[c] Note that none of the pressure data presented in Figure 7 have been corrected for the pres-

Page 414 Selected Pyrotechnic Publications of K.L. and B.J. Kosanke
ence of the silicone sealant. This only affects pressures less than about 2000 psi. For exam-ple, if corrected, the peak pressure in Fig-ure 7A would actually be nearly 200 psi and not 100 psi as shown.
References
1) K. L. and B. J. Kosanke and T. DeWille, “Concussion Mortar Internal Pressure, Recoil, and Overpressure as Functions of Powder Mass”, Journal of Pyrotechnics, No. 1 (1995) [a] pp 30–31; [b] pp 29–30; [c] p 31.
2) S. W. Wilson, “Important Industry Warning—Potential Failure of Concussion Mortars”, Fireworks Business, No. 151 (1996) p 2.
3) K. L. and B. J. Kosanke, “Brief Summary of Concussion Powder Test Results”, Fireworks Business, No. 153 (1996) p 2.
4) Encyclopedia of Physics, 2nd ed., VCH Pub-lishers (1991) p 22.
5) Van Nostrand’s Scientific Encyclopedia, 5th ed., Van Nostrand Reinhold (1976) p 25.
6) F. A. Geldard, The Human Senses, 2nd ed., John Wiley & Sons (1972) pp 196–205.
7) Data collected by K. L. and B. J. Kosanke and M. Carter at the 1997 Western Winter Blast (annual convention) of the Western Pyrotech-nic Association to be reported in a future arti-cle.


![Bryan Concussion General Audience - 2015.pptx [Read-Only] · 2015-09-03 · CONCUSSION ‐16,400,000 MTBI and Post‐Concussion Syndrome ‐ 141,000 Concussion Management ‐1,550,000](https://static.fdocuments.us/doc/165x107/5fb548e39d237d0cb0684f4f/bryan-concussion-general-audience-2015pptx-read-only-2015-09-03-concussion.jpg)