A Survey about Men’s Health · 4 OVERALL HEALTH STATUS A Bright Health Report Compared to Nearly...
20
1 A Survey about Men’s Health Prepared For: American Academy of Family Physicians Prepared By: Harris Poll
Transcript of A Survey about Men’s Health · 4 OVERALL HEALTH STATUS A Bright Health Report Compared to Nearly...

1
A Survey about Men’s Health
Prepared For:
American Academy of Family Physicians
Prepared By:
Harris Poll
2
Research Method and Note about the Report
Research Method
These surveys were conducted online within the United States between April 30-May 2, 2007, among 2,282 adults (aged 18 and over), among whom 1,157 are males, and between April 15-19, 2016, among 2,016 adults (aged 18 and over), among whom 916 are males, by Harris Poll on behalf of AAFP via its Quick Query omnibus product.
Results were weighted for age within gender, region, race/ethnicity, income, and education where necessary to align them with their actual proportions in the population. Propensity score weighting was also used to adjust for respondents’ propensity to be online.
All sample surveys and polls, whether or not they use probability sampling, are subject to multiple sources of error which are most often not possible to quantify or estimate, including sampling error, coverage error, error associated with nonresponse, error associated with question wording and response options, and post-survey weighting and adjustments. Therefore, Harris Poll avoids the words “margin of error” as they are misleading. All that can be calculated are different possible sampling errors with different probabilities for pure, unweighted, random samples with 100% response rates. These are only theoretical because no published polls come close to this ideal.
Respondents for this survey were selected from among those who have agreed to participate in online surveys. The data have been weighted to reflect the composition of the adult population. Because the sample is based on those who agreed to participate in our panel, no estimates of theoretical sampling error can be calculated.
A Note about Reading the Report The percentage of respondents has been included for each item.
o An asterisk (*) signifies a value of less than one-half percent. o A dash represents a value of zero. o Percentages may not always add up to 100% because of computer rounding or the
acceptance of multiple responses.

3
How to Read Data Tables: Key Terms & Statistical Significance Testing
Tabs or Cross-tab(s): This is short for cross-tabulations, or data tables. Raw survey data are tabulated to depict the results based on aggregate groups of respondents, typically, the “Total” sample, as well as subgroups that can be compared against one another to see if there are statistically significant differences among them (e.g., men vs. women). Banner: A banner is essentially a set of cross-tabs. Banner point: A banner point is a column in the data tables – a single banner, or page of cross-tabs, can typically include about 20 columns, or banner points (depends partly on the banner point titles/labels). Banner points enable us to compare two or more groups to one another to see if there are statistically significant differences among them (e.g., the data for “men” would be contained in one banner point and “women” in another, with the two columns stat-tested against one another to determine if the differences are statistically significant). Statistical significance testing: Two or more banner points can be tested for significant differences based on a statistical formula called a t-test – whether or not a difference between 2 or more groups is significant depends not only on the magnitude of the difference, but also on the sizes of the samples being compared (i.e., the smaller the samples, the larger a difference would have to be in order to be considered statistically significant). Significance testing is done at the 95% confidence level, and the test is performed on percentages as well as means. Each subgroup is contained in a banner point and assigned a letter. When the percentage of one subgroup is significantly different from the percentage of another subgroup, the letter representing one of the two samples appears next to the percentage (or mean) of the other sample. For example, the proportion of males answering “yes” to a particular question may be compared to the percentage of females answering “yes” to the same question, as follows:
In the table below, the male sample is assigned the letter B and the female sample is assigned the letter C.
67% of women said “yes” – a proportion that is significantly greater than the 57% of males who said “yes.”
To indicate that women are significantly more likely to say “yes” than are men, the letter B (i.e., the letter assigned to the male subgroup) appears next to the “67%” in the female column.
Similarly, the 37% of men who said “no” is significantly greater than the 29% of women who said “no,” so the letter C (i.e., the letter assigned to the female subgroup) appears next to the “37%” in the male column.
It is these letters that indicate statistically significant differences among two or more subgroups – if there are no letters next to a percentage, then the differences are not statistically significant and may not be described as true differences in attitude or behavior among subgroups.
Gender
Total Male Female
(A) (B) (C)
Unweighted Total 977 488 489
Weighted Total 967 464 503
Yes 611 274 337
63% 57% 67%B
No 319 171 148
33% 37%C 29%
Don’t Know 37 18 19
4% 4% 4%

4
OVERALL HEALTH STATUS
A Bright Health Report Compared to Nearly a Decade Ago – But Not When Compared to Women
The status of men’s health in 2016 is mixed, leaning slightly more positively than negatively. About 1 in
2 men (an improvement over the past decade) now rate their health as excellent or very good, but about
1 in 5 remain on the other end of the spectrum at fair/poor. Approximately 1 in 2 men (up from nine
years ago) have been diagnosed with at least one chronic health condition like high blood pressure,
diabetes or arthritis. And, when compared to their female peers, men actually tend to be more
pessimistic about their current health status.
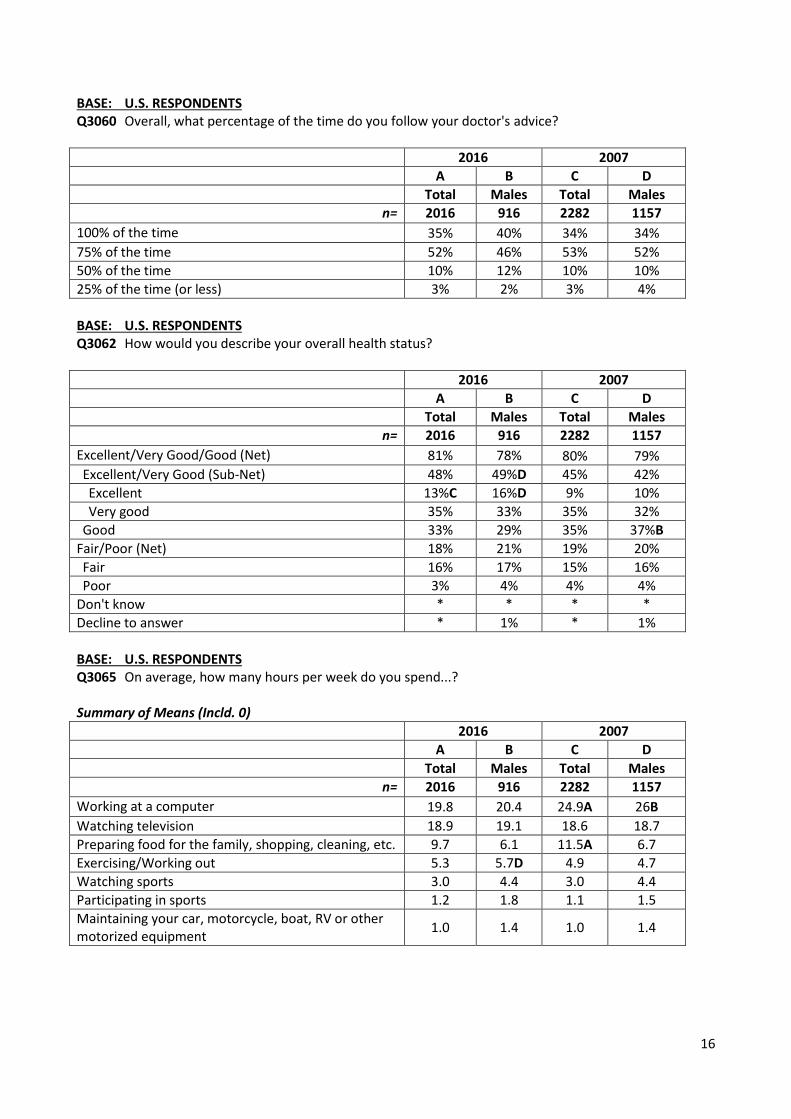
About half of U.S. men (49%) describe their overall health status as excellent/very good, a jump up from only 42% in 2007. And only about one-fifth (21%) say fair/poor, essentially the same as in 2007.
o Men are less likely to rate themselves positively (good or higher) than women are (78% vs 84% respectively).
o And, certain groups of men are much more optimistic: Northeasterners (83%), 18-34 year olds (85%), college graduates (88%), the employed (87%), the affluent (85%) and parents of children under 18 (84%).
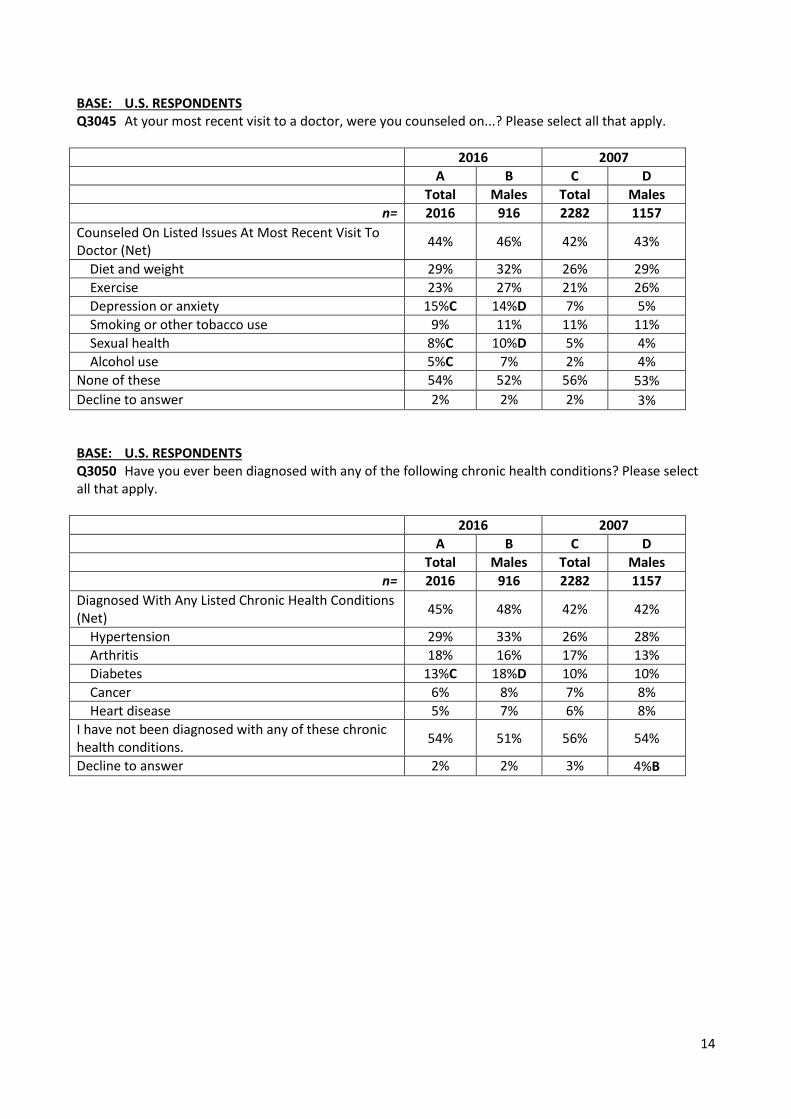
However, also trending upward in certain cases, nearly half of men (48% in 2016; 42% in 2007) have been diagnosed with at least one of the following chronic health conditions, more so for men than women for everything but arthritis. (Also, not surprisingly the diagnosis of all health conditions below increases with age.)
o Hypertension (high blood pressure) (33% in 2016; 28% in 2007) o Diabetes (18% in 2016; 10% in 2007) o Arthritis (16% in 2016; 13% in 2007) o Cancer (8% in both 2016 and 2007) o Heart disease (7% in 2016; 8% in 2007)
5
DOCTOR-PATIENT COMMUNICATION
Doctor Knows Best Most of the Time, But Not All of the Time
In general, men seem to have a fairly open and comprehensive dialogue with their doctors. The vast
majority appears comfortable and feels like it is relatively easy to talk to their doctors. At their most
recent doctor visit, nearly 1 in 2 men received advice from their doctor about something, predominantly
healthy behaviors like diet and exercise. That said, only about 4 in 10 men say they follow their doctors’
advice completely faithfully (i.e., 100% of the time), on the rise from 2007. Notably, men appear to get
more advice from their doctors – and follow it more closely – than women do.
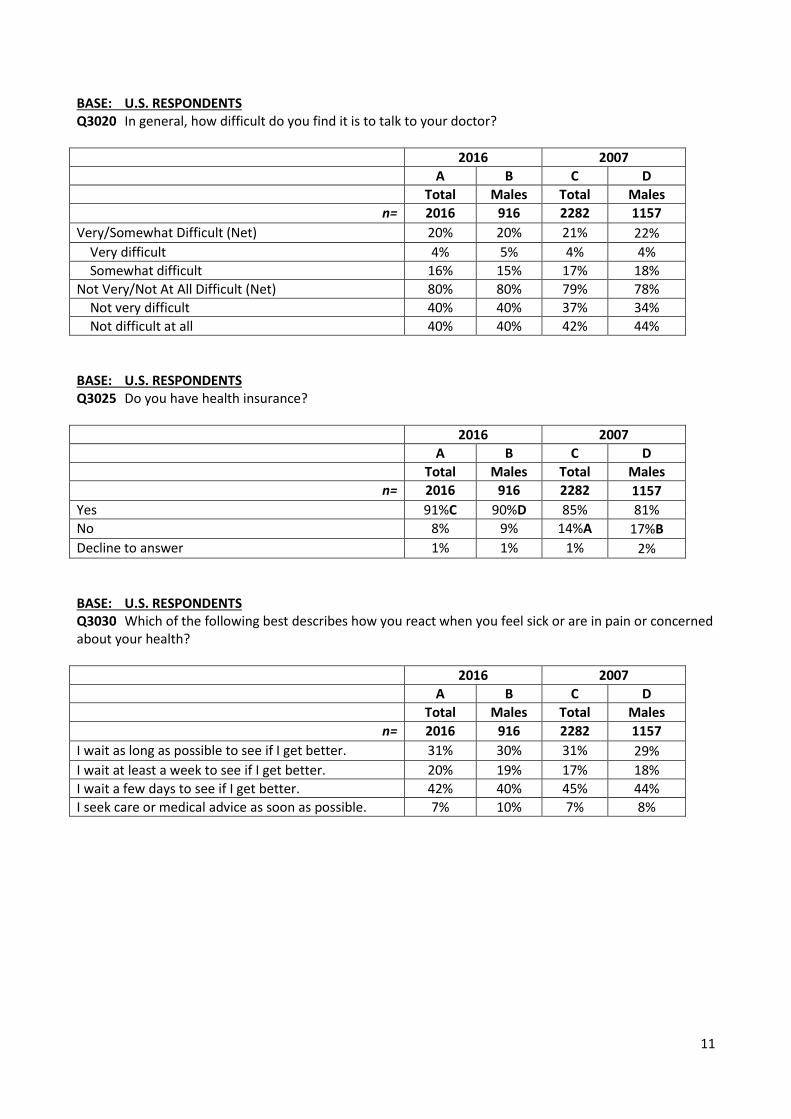
8 in 10 (80%) find it to be not very or not all difficult to talk to their doctor. Only a rare 5% find it very difficult.
o Difficulty talking to a doctor declines with age. (18-34 years (26%), 35-44 years (27%), 45-54 years (16%), 55-64 years (21%) and 65+ years (5%)).
o Some men (which may be a function of age) find it more challenging to talk to their doctor: parents of kids under 18 (27%), those who aren’t married (25%), and Westerners (28%).
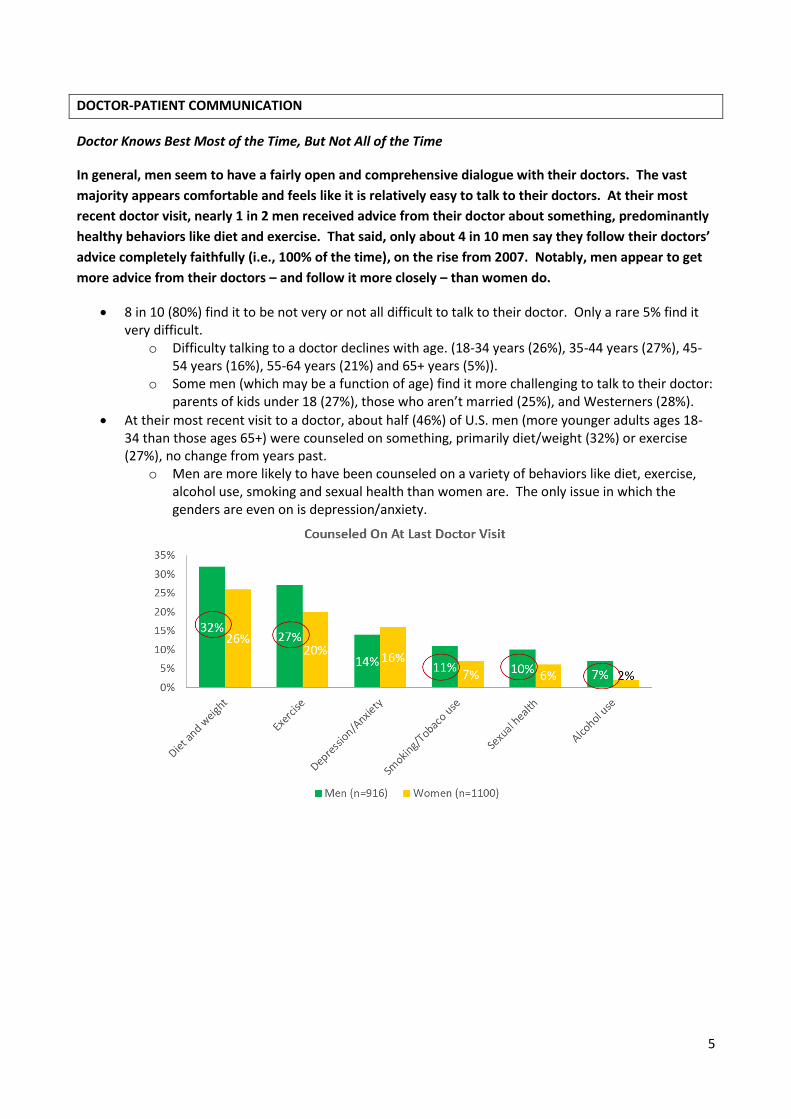
At their most recent visit to a doctor, about half (46%) of U.S. men (more younger adults ages 18-34 than those ages 65+) were counseled on something, primarily diet/weight (32%) or exercise (27%), no change from years past.
o Men are more likely to have been counseled on a variety of behaviors like diet, exercise, alcohol use, smoking and sexual health than women are. The only issue in which the genders are even on is depression/anxiety.

6
Only 4 in 10 men (40%) follow their doctor’s advice 100% of the time, up from 34% in 2007. Most (58%) say they follow their doctor’s advice 50-75% of the time.
o Men are more likely to follow their doctor’s advice all the time than women are (40% vs 31% respectively), where women are more likely to make veer off and make some decisions on their own.
o Senior men ages 65+ (63%) (and correspondingly retired men (55%), married men (46%), and those with no young children in the household (44%)) are by far the most likely to follow their doctor’s advice consistently.
ACTION TAKEN (WHEN SICK)
Few Men Rush to Care – But Still More than Women Do
The vast majority of U.S. men do not seek care right away when they are concerned about their health,
sick or in pain. In general, men wait a few days or a week to see if they feel better and about 3 in 10
push it as long as possible before reaching out for help. (Notably, though still in very small proportions
but against gender stereotypes, men are more than twice as likely to seek care right away than women
are.)
Far more than almost one decade ago, most men today have one main place they turn when they aren’t
feeling well or need medical advice, and it appears that this one place is a doctor’s office. Though of
note, men seem to be less reliant on the traditional doctor’s office than women are.
Similar to 2007, there is no uniform opinion among men about how quickly they respond when they feel sick or in pain or are concerned about their health. That said, most (90%) do not seek care or advice right away but wait at least some time before seeking treatment.
o The majority wait at least a few days (40%) or a week (19%) to see if they get better, but 3 in 10 (30%) admit they wait as long as possible. Those ages 35-44 are more likely to wait it out (41%), while older men ages 45+ (48%); the affluent (49%) and retired men (51%) are more likely to delay only a few days to see if their health status resolves before seeking care.
o Men are more likely to take care of themselves as soon as possible than women are (10% vs 4% respectively).
Way up from 2007, 7 in 10 U.S. men today (70% in 2016; 58% in 2007) say there is one place they usually go when they are sick or want advice about their health.
o 87% seek treatment when they are sick. The majority of men (58%) usually go to a doctor’s office, but slightly less than they did in 2007 (63%) and much less than women today (69%). 13% of men do not go anywhere when they are sick.
o Slightly more than about a decade ago, almost 8 in 10 (79% in 2016; 74% in 2007) have a regular doctor they usually see when they are sick or want medical advice.
o Age has a strong impact on use of medical resources. Boomers ages 55-64 (75%) and Seniors ages 65+ (85%) are more likely than their younger peers (18-34 years (67%), 35-44 years (62%), 45-54 years (59%)) to rely on one place for treatment, typically a traditional doctor’s office and to have one main doctor they see for health advice/support (98%). Younger adults 18-44 (38%) are more inclined to do nothing when they are sick and to reach out to a private clinic (12%) or emergency room (6%).

7
ACTION TAKEN (PREVENTIVELY)
Men Take Some Proactive Steps to Care for Themselves – But Not a Top Priority
Nearly all U.S. men have taken some action to care for their own health. More than 9 in 10 have had at
some point completed a physical exam, and about 8 in 10 have had a blood cholesterol test (but these
figures drop precipitously to about half who have done so recently in the past year). Far fewer have
gotten checked for either prostate cancer or colon cancer in the past year, and about half have never
chosen to do these particular tests.
Almost 6 in 10 men say something acts as a barrier to them going to the doctor, but it appears more like
a perceived lack of necessity than anything else (either feeling that they aren’t sick enough or it’s not
compelling enough). Interestingly more than 1 in 3 men (up from a quarter nearly one decade ago) say
their partner has a significant influence on whether they go to the doctor or not; the impact of a partner
is now much stronger for men than for women.
When it comes to staying fit, men seem to be doing a somewhat better job than they were about 10
years ago, as routine exercise has increased dramatically for men since 2007. But that said, men still
appear to lead more sedentary than active lives, spending an average of 20 hours per week in front of a
computer and another 19 hours in front of a TV. In general, men choose to spend more time working
out regularly than women do, but still far less on average exercising (6 hours per week) and playing
sports (2 hours per week) than looking at a screen.
Nearly all U.S. men have at some point had a complete physical exam (93%) and a blood cholesterol test (81%), but only about 1 in 2 (54% exam; 52% cholesterol test) have done it in the past year.
o About 1 in 2 men have never had a colon cancer screening (50% in 2016; 57% in 2007) or a blood test for prostate cancer (45% in 2016; 51% in 2007), and many fewer have done these tests recently within the past year (16% for colon cancer; 32% for prostate cancer).
o Men are more likely to have had a recent physical exam today than back in 2007 (52% in 2016 vs 45% in 2007 for within the past year; and 68% in 2016 vs 63% in 2007 for within the past two years).

8
o All these activities increase with age, with older men (especially Seniors) being more likely to take medical tests like cholesterol (85%), prostate (66%) and colon cancer (30%) and have to have had complete physical exams (73%). This is also true for those who have household incomes above $50K (61%); college graduates (60%) and married men (62%).
Almost 6 in 10 men (59%), especially those ages 18-44 (73%); employed adults (67%); and parents of young children (74%), say something prevents them from going to the doctor, predominantly feeling like they need to be extremely sick (31%); or feeling like they have no reason to go because they are healthy (21%).
Among those who have a spouse/significant other, 8 in 10 men (80%) say their partner has at least some influence over their decision to go to the doctor. A major increase from 2007, men are much more highly influenced today by their partners and much more than women are (37% of men say “a lot of influence” in 2016, compared to only 27% of men in 2007 and 17% of women in 2016).
On average, U.S. men spend about 19 hours each week working at a computer (down from 26 hours in 2007); 20 hours watching television; 6 hours preparing food for their family (less than women in general); and a little over 1 hour maintaining their car or other vehicle (more than women in general).
o Most of these activities follow expected demographic shifts. For example, employed adults are more likely to be in front of a computer working (22 hours) and older adults ages 45+ (22 hours) and those with less than $50K in HHI (23 hours) spend more time in front of the television.
When it comes to sports and exercise, men on average engage on a weekly basis more than women do, including exercising or working out (6 hours for men in 2016, up from 5 in 2007; and 5 hours for women in 2016); watching sports (4 hours for men; 2 hours for women); and participating in sports (2 hours for men; less than 1 hour for women).
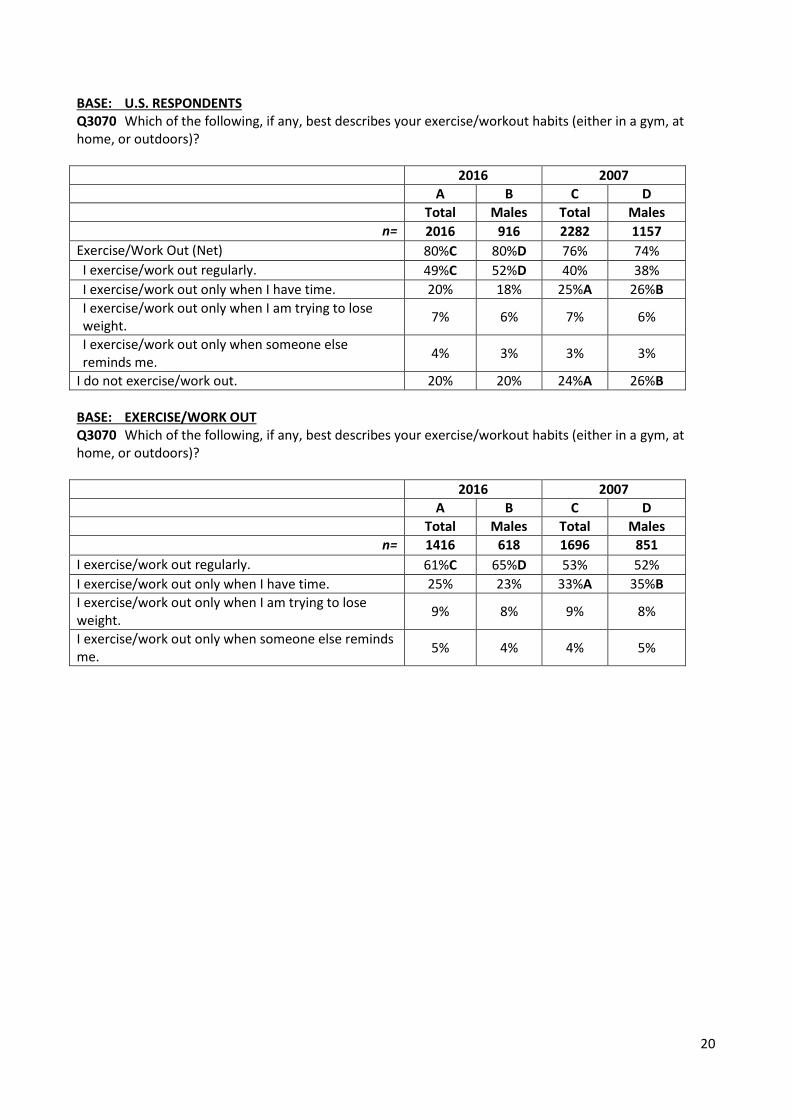
o More than half of men (52%) say they exercise or work out regularly (compared to 46% of women), though still about one-fifth of men (20%) never do. This is a huge leap for men from 2007, when only 38% of men said they exercised regularly. In 2007, men were more likely to say they either didn’t exercise (26% vs 20% in 2016) or they only exercised when they had time (29% vs 18% in 2016).
o Exercising increases with wealth (90% of those with HHI $75K+) and college education (90%), but declines with age. (18-34 years (87%), 35-44 years (81%), 45-54 years (78%), 55-64 years (74%) and 65+ years (73%)).

9
The vast majority of men (90%), in particular Seniors (99%), retired adults (96%), those with $75K+ in income (95%) and the college educated (96%), have access to health insurance, compared to only 81% of men in 2007.

10
SURVEY DATA
BASE: U.S. RESPONDENTS Q3005 Is there one place you usually go when you are sick or want advice about your health?
2016 2007
A B C D
Total Males Total Males
n= 2016 916 2282 1157
Yes 71%C 70%D 60% 58%
No 29% 30% 40%A 42%B
BASE: U.S. RESPONDENTS Q3010 Where do you usually go for treatment when you are sick?
2016 2007
A B C D
Total Males Total Males
n= 2016 916 2282 1157
Seek Treatment When Sick (Net) 88% 87% 88% 85%
Doctor’s office 64% 58% 68%A 63%
Private clinic or health center 8% 9% 6% 6%
Public clinic or health center 6%C 6%D 4% 3%
Hospital emergency room 3% 3% 2% 2%
VA/Military hospital/Clinic 2% 4% 4% 5%
Hospital outpatient department 2% 3% 2% 2%
Other 3% 4% 3% 2%
I don’t seek treatment when I’m sick. 12% 13% 12% 15%
BASE: U.S. RESPONDENTS Q3015 Do you have a regular doctor or health professional you usually see when you are sick or want medical advice?
2016 2007
A B C D
Total Males Total Males
n= 2016 916 2282 1157
Yes 81% 79% 77% 74%
No 19% 21% 23% 26%
11
BASE: U.S. RESPONDENTS Q3020 In general, how difficult do you find it is to talk to your doctor?
2016 2007
A B C D
Total Males Total Males
n= 2016 916 2282 1157
Very/Somewhat Difficult (Net) 20% 20% 21% 22%
Very difficult 4% 5% 4% 4%
Somewhat difficult 16% 15% 17% 18%
Not Very/Not At All Difficult (Net) 80% 80% 79% 78%
Not very difficult 40% 40% 37% 34%
Not difficult at all 40% 40% 42% 44%
BASE: U.S. RESPONDENTS Q3025 Do you have health insurance?
2016 2007
A B C D
Total Males Total Males
n= 2016 916 2282 1157
Yes 91%C 90%D 85% 81%
No 8% 9% 14%A 17%B
Decline to answer 1% 1% 1% 2%
BASE: U.S. RESPONDENTS Q3030 Which of the following best describes how you react when you feel sick or are in pain or concerned about your health?
2016 2007
A B C D
Total Males Total Males
n= 2016 916 2282 1157
I wait as long as possible to see if I get better. 31% 30% 31% 29%
I wait at least a week to see if I get better. 20% 19% 17% 18%
I wait a few days to see if I get better. 42% 40% 45% 44%
I seek care or medical advice as soon as possible. 7% 10% 7% 8%

12
BASE: U.S. RESPONDENTS Q3035 When was the last time you received any of the following? Summary of Within The Past Year
2016 2007
A B C D
Total Males Total Males
n= 2016 916 2282 1157
Blood cholesterol test 55%C 54% 50% 51%
Complete physical exam 54%C 52%D 48% 45%
Blood test for prostate cancer 17% 32% 16% 32%
Colon cancer screening 15% 16% 14% 17%
Summary of Within The Past 2 Years
2016 2007
A B C D
Total Males Total Males
n= 2016 916 2282 1157
Complete physical exam 70% 68% 67% 63%
Blood cholesterol test 68%C 69% 64% 64%
Colon cancer screening 26% 31% 24% 28%
Blood test for prostate cancer 23% 43% 20% 39%
Summary of Within The Past 5 Years
2016 2007
A B C D
Total Males Total Males
n= 2016 916 2282 1157
Complete physical exam 80% 79% 78% 76%
Blood cholesterol test 75% 74% 73% 72%
Colon cancer screening 37% 42% 33% 37%
Blood test for prostate cancer 27% 50% 23% 46%
Summary of More Than 5 Years Ago
2016 2007
A B C D
Total Males Total Males
n= 2016 916 2282 1157
Complete physical exam 13% 14% 15% 16%
Colon cancer screening 8%C 8% 5% 6%
Blood cholesterol test 5% 6% 7% 6%
Blood test for prostate cancer 3% 5% 2% 4%

13
Summary of Never
2016 2007
A B C D
Total Males Total Males
n= 2016 916 2282 1157
Blood test for prostate cancer 70% 45% 75%A 51%
Colon cancer screening 55% 50% 62%A 57%B
Blood cholesterol test 20% 19% 21% 22%
Complete physical exam 7% 7% 7% 8%
Summary of Ever
2016 2007
A B C D
Total Males Total Males
n= 2016 916 2282 1157
Complete physical exam 93% 93% 93% 92%
Blood cholesterol test 80% 81% 79% 78%
Colon cancer screening 45%C 50%D 38% 43%
Blood test for prostate cancer 30%C 55% 25% 49%
BASE: HAVE SPOUSE/SIGNIFICANT OTHER Q3040 How much influence does your spouse or significant other have over your decision to go to the doctor?
2016 2007
A B C D
Total Males Total Males
n= 1373 628 1578 826
Spouse/Significant Other Has Influence Over Decision To Go To Doctor (Net)
71% 80% 70% 78%
A lot of influence 27%C 37%D 19% 27%
Some influence 45% 43% 52%A 51%B
No influence at all 29% 20% 30% 22%
14
BASE: U.S. RESPONDENTS Q3045 At your most recent visit to a doctor, were you counseled on...? Please select all that apply.
2016 2007
A B C D
Total Males Total Males
n= 2016 916 2282 1157
Counseled On Listed Issues At Most Recent Visit To Doctor (Net)
44% 46% 42% 43%
Diet and weight 29% 32% 26% 29%
Exercise 23% 27% 21% 26%
Depression or anxiety 15%C 14%D 7% 5%
Smoking or other tobacco use 9% 11% 11% 11%
Sexual health 8%C 10%D 5% 4%
Alcohol use 5%C 7% 2% 4%
None of these 54% 52% 56% 53%
Decline to answer 2% 2% 2% 3%
BASE: U.S. RESPONDENTS Q3050 Have you ever been diagnosed with any of the following chronic health conditions? Please select all that apply.
2016 2007
A B C D
Total Males Total Males
n= 2016 916 2282 1157
Diagnosed With Any Listed Chronic Health Conditions (Net)
45% 48% 42% 42%
Hypertension 29% 33% 26% 28%
Arthritis 18% 16% 17% 13%
Diabetes 13%C 18%D 10% 10%
Cancer 6% 8% 7% 8%
Heart disease 5% 7% 6% 8%
I have not been diagnosed with any of these chronic health conditions.
54% 51% 56% 54%
Decline to answer 2% 2% 3% 4%B

15
BASE: U.S. RESPONDENTS Q3055 Which of the following, if any, prevent you from going to the doctor? Please select all that apply.
2016 2007
A B C D
Total Males Total Males
n= 2016 916 2282 1157
Something Prevents From Going To The Doctor (Net) 62% 59% 60% 58%
I only go to the doctor if I am extremely sick. 33% 31% 35% 36%
I am healthy -- I have no reason to go to a doctor. 20% 21% 20% 23%
I prefer to treat myself naturally. 12% 9% 11% 12%
I don't like doctors. 11% 9% 9% 8%
I am afraid of finding out that something is wrong with me.
10% 10% 9% 7%
I don't have time to go to the doctor. 9% 7% 13%A 12%B
I don't have health insurance. 5% 5% 10%A 11%B
I don't know of a good doctor in my area. 5% 5% 5% 4%
Something else 7% 5% 8% 6%
Nothing 37% 39% 38% 39%
Decline to answer 1% 1% 2% 3%
16
BASE: U.S. RESPONDENTS Q3060 Overall, what percentage of the time do you follow your doctor's advice?
2016 2007
A B C D
Total Males Total Males
n= 2016 916 2282 1157
100% of the time 35% 40% 34% 34%
75% of the time 52% 46% 53% 52%
50% of the time 10% 12% 10% 10%
25% of the time (or less) 3% 2% 3% 4%
BASE: U.S. RESPONDENTS Q3062 How would you describe your overall health status?
2016 2007
A B C D
Total Males Total Males
n= 2016 916 2282 1157
Excellent/Very Good/Good (Net) 81% 78% 80% 79%
Excellent/Very Good (Sub-Net) 48% 49%D 45% 42%
Excellent 13%C 16%D 9% 10%
Very good 35% 33% 35% 32%
Good 33% 29% 35% 37%B
Fair/Poor (Net) 18% 21% 19% 20%
Fair 16% 17% 15% 16%
Poor 3% 4% 4% 4%
Don't know * * * *
Decline to answer * 1% * 1%
BASE: U.S. RESPONDENTS Q3065 On average, how many hours per week do you spend...? Summary of Means (Incld. 0)
2016 2007
A B C D
Total Males Total Males
n= 2016 916 2282 1157
Working at a computer 19.8 20.4 24.9A 26B
Watching television 18.9 19.1 18.6 18.7
Preparing food for the family, shopping, cleaning, etc. 9.7 6.1 11.5A 6.7
Exercising/Working out 5.3 5.7D 4.9 4.7
Watching sports 3.0 4.4 3.0 4.4
Participating in sports 1.2 1.8 1.1 1.5
Maintaining your car, motorcycle, boat, RV or other motorized equipment
1.0 1.4 1.0 1.4

17
BASE: U.S. RESPONDENTS Q3065 On average, how many hours per week do you spend...? Summary of Means (Excld. 0)
2016 2007
A B C D
Total Males Total Males
n= 2016 916 2282 1157
Working at a computer 22.0 22.5 26.0A 27.4B
Watching television 19.7 20.3 19.0 19.0
Preparing food for the family, shopping, cleaning, etc. 10.3 6.8 12.3A 7.5
Exercising/Working out 6.8 7.3 6.4 6.3
Watching sports 5.7 6.4 6.0 6.7
Participating in sports 4.9 5.0 4.9 4.9
Maintaining your car, motorcycle, boat, RV or other motorized equipment
2.7 3.0 2.5 2.7
BASE: U.S. RESPONDENTS Q3065 On average, how many hours per week do you spend...? Maintaining your car, motorcycle, boat, RV or other motorized equipment
2016 2007
A B C D
Total Males Total Males
n= 2016 916 2282 1157
None 64% 52% 60% 51%
Spend At Least One Hour Per Week Doing This (Net) 36% 48% 40% 49%
1 hour 20% 24% 23% 25%
2 hours 8% 13% 9% 13%
3 hours 2% 2% 2% 3%
4 hours 1% 2% 1% 2%
5 hours 2% 3% 2% 3%
6+ hours 3% 4% 2% 4%
Mean (Incl. 0) 1.0 1.4 1.0 1.4

18
Watching sports
2016 2007
A B C D
Total Males Total Males
n= 2016 916 2282 1157
None 47% 30% 50% 35%
Spend At Least One Hour Per Week Doing This (Net) 53% 70% 50% 65%
1 hour 9% 10% 10% 10%
2 hours 9% 10% 10% 12%
3 hours 6% 7% 5% 6%
4 hours 5% 8% 4% 6%
5 hours 7% 9% 6% 8%
6+ hours 16% 25% 16% 24%
Mean (Incl. 0) 3.0 4.4 3.0 4.4
Participating in sports
2016 2007
A B C D
Total Males Total Males
n= 2016 916 2282 1157
None 76% 64% 77% 69%
Spend At Least One Hour Per Week Doing This (Net) 24% 36% 23% 31%
1 hour 6% 8% 5% 6%
2 hours 5% 8% 5% 8%
3 hours 2% 3% 2% 3%
4 hours 2% 4% 2% 3%
5 hours 2% 4% 3% 4%
6+ hours 7% 11% 5% 8%
Mean (Incl. 0) 1.2 1.8 1.1 1.5
Exercising/Working out
2016 2007
A B C D
Total Males Total Males
n= 2016 916 2282 1157
None 21% 21% 24% 25%
Spend At Least One Hour Per Week Doing This (Net) 79% 79% 76% 75%
1 hour 8% 8% 7% 7%
2 hours 9% 8% 10% 11%
3 hours 9% 8% 12% 12%B
4 hours 7% 6% 7% 6%
5 hours 12% 11% 13% 12%
6+ hours 34%C 38%D 27% 26%
Mean (Incl. 0) 5.3 5.7D 4.9 4.7

19
Working at a computer
2016 2007
A B C D
Total Males Total Males
n= 2016 916 2282 1157
None 10%C 9%D 4% 5%
Spend At Least One Hour Per Week Doing This (Net) 90% 91% 96%A 95%B
1 hour 3%C 3% 1% 2%
2 hours 3% 2% 2% 2%
3 hours 2% 3% 2% 1%
4 hours 3% 2% 2% 2%
5 hours 5% 5% 4% 3%
6+ hours 75% 75% 86%A 85%B
Mean (Incl. 0) 19.8 20.4 24.9A 26B
Watching television
2016 2007
A B C D
Total Males Total Males
n= 2016 916 2282 1157
None 4%C 6%D 2% 2%
Spend At Least One Hour Per Week Doing This (Net) 96% 94% 98%A 98%B
1 hour 1% 1% 2% 2%
2 hours 4%C 3% 2% 2%
3 hours 3% 3% 2% 3%
4 hours 3% 3% 3% 2%
5 hours 6% 4% 6% 4%
6+ hours 80% 80% 83% 84%
Mean (Incl. 0) 18.9 19.1 18.6 18.7
Preparing food for the family, shopping, cleaning, etc.
2016 2007
A B C D
Total Males Total Males
n= 2016 916 2282 1157
None 6% 10% 7% 11%
Spend At Least One Hour Per Week Doing This (Net) 94% 90% 93% 89%
1 hour 6% 9% 5% 8%
2 hours 10%C 14% 7% 12%
3 hours 7% 9% 8% 9%
4 hours 5% 6% 5% 7%
5 hours 12% 13% 12% 12%
6+ hours 54% 40% 57% 41%
Mean (Incl. 0) 9.7 6.1 11.5A 6.7
20
BASE: U.S. RESPONDENTS Q3070 Which of the following, if any, best describes your exercise/workout habits (either in a gym, at home, or outdoors)?
2016 2007
A B C D
Total Males Total Males
n= 2016 916 2282 1157
Exercise/Work Out (Net) 80%C 80%D 76% 74%
I exercise/work out regularly. 49%C 52%D 40% 38%
I exercise/work out only when I have time. 20% 18% 25%A 26%B
I exercise/work out only when I am trying to lose weight.
7% 6% 7% 6%
I exercise/work out only when someone else reminds me.
4% 3% 3% 3%
I do not exercise/work out. 20% 20% 24%A 26%B
BASE: EXERCISE/WORK OUT Q3070 Which of the following, if any, best describes your exercise/workout habits (either in a gym, at home, or outdoors)?
2016 2007
A B C D
Total Males Total Males
n= 1416 618 1696 851
I exercise/work out regularly. 61%C 65%D 53% 52%
I exercise/work out only when I have time. 25% 23% 33%A 35%B
I exercise/work out only when I am trying to lose weight.
9% 8% 9% 8%
I exercise/work out only when someone else reminds me.
5% 4% 4% 5%