

A sugar distribution network: Designing and planning sugar distribution network: Designing and...
31
Transcript of A sugar distribution network: Designing and planning sugar distribution network: Designing and...
Tale of a battle!
Angry producers Naughty merchants vs
Agenda
• The problem
• Classification of provinces and customers
• Distribution channels/methods
• Refinement/Distribution/Storage planning
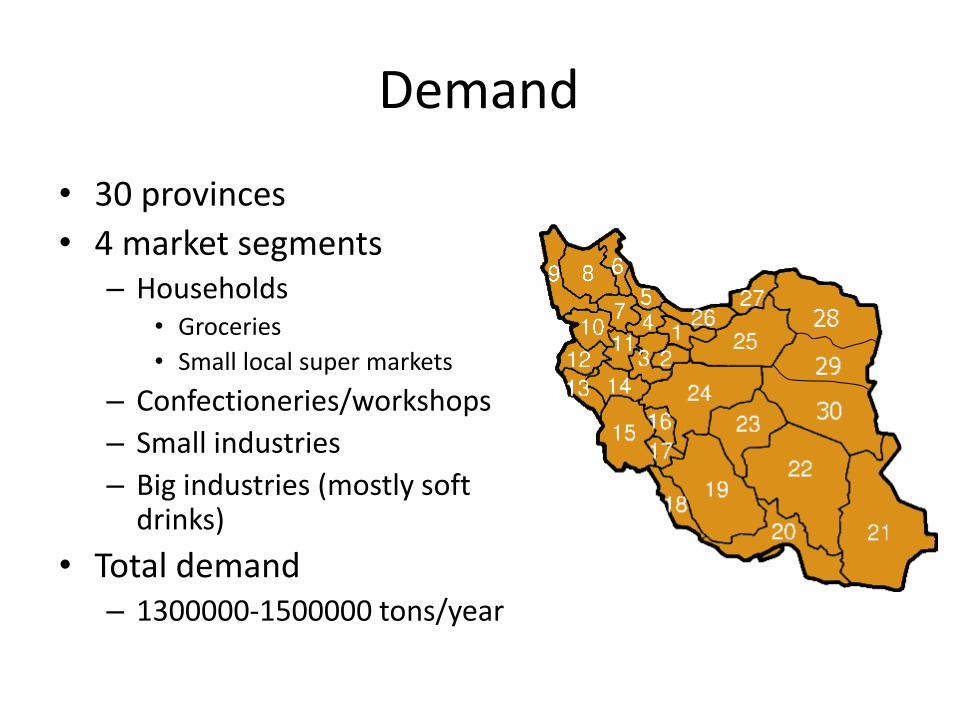
Demand
• 30 provinces
• 4 market segments – Households
• Groceries
• Small local super markets
– Confectioneries/workshops
– Small industries
– Big industries (mostly soft drinks)
• Total demand – 1300000-1500000 tons/year

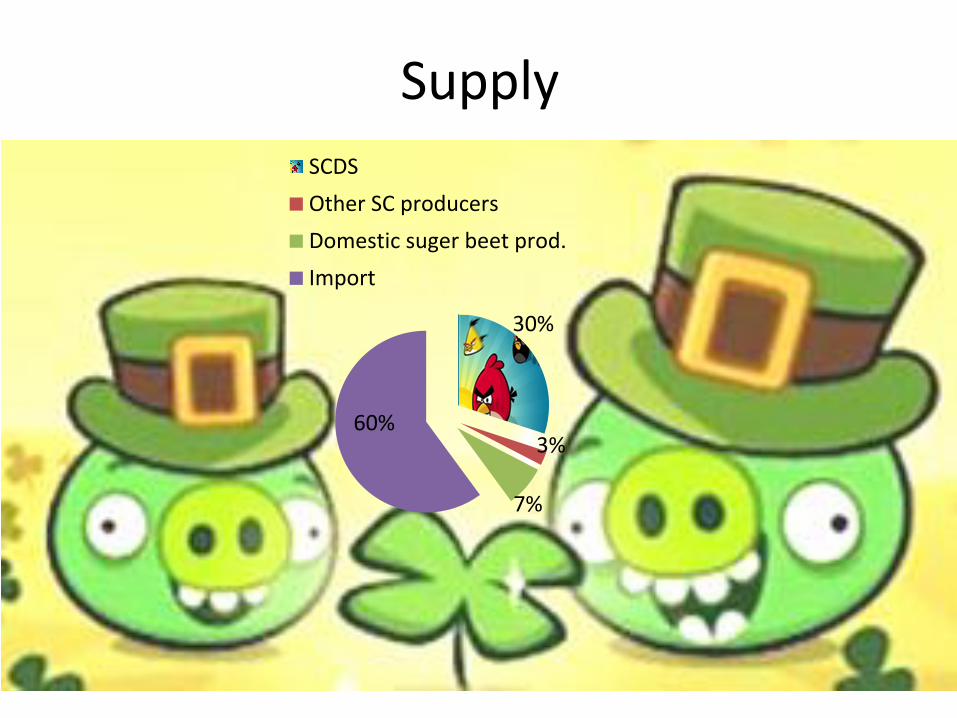
Supply
• Domestic production – Sugar cane
• SCDS: 350000 tons/year • others
– Sugar beets
• Import
Khuzestan
Supply
30%
3%
7%
60%
SCDS
Other SC producers
Domestic suger beet prod.
Import
Strategy
• To be independent of the merchants (partly)
• To have own distribution network
• Closer contact with final customers
• Higher profit margin
• More competitiveness
Steps
• Classification of the provinces into sale regions
• Finding proper distribution methods for different market segments in the regions
• Assigning agents to the provinces
• Deciding on intermediate warehouses
• Operational production/distribution planning
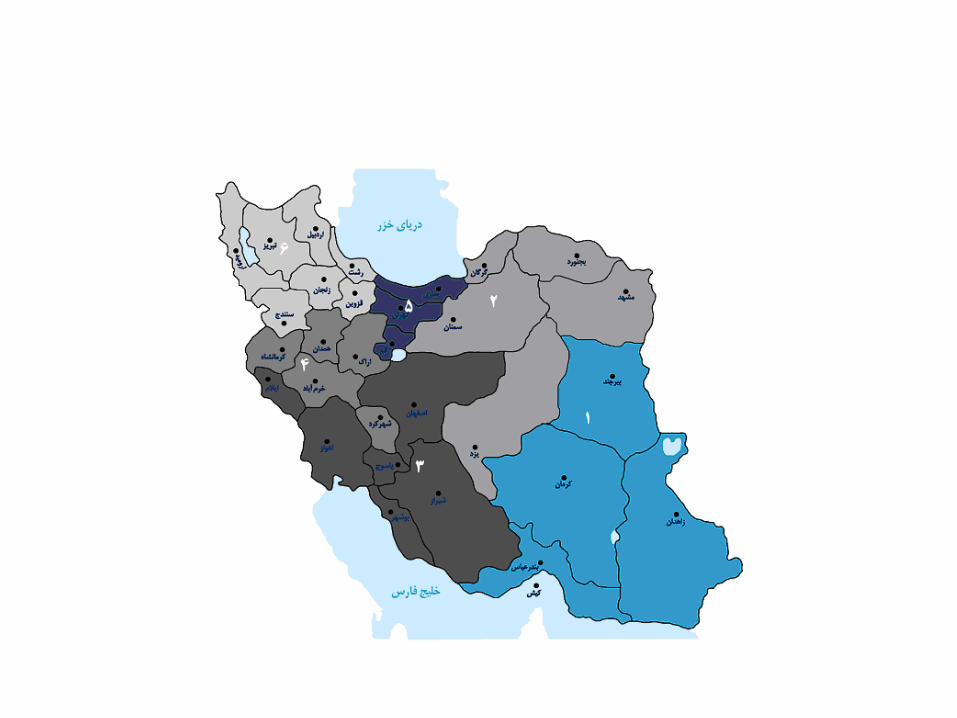
Categorization of provinces
• Constructing sale regions
• Applying the same distribution method and organization for the provinces of the same region
• Goal : to put similar AND adjacent provinces in the same region
Steps
• Definition of indicators
• Data gathering
• Categorization algorithms
• Comparison of solutions of different categorization algorithms
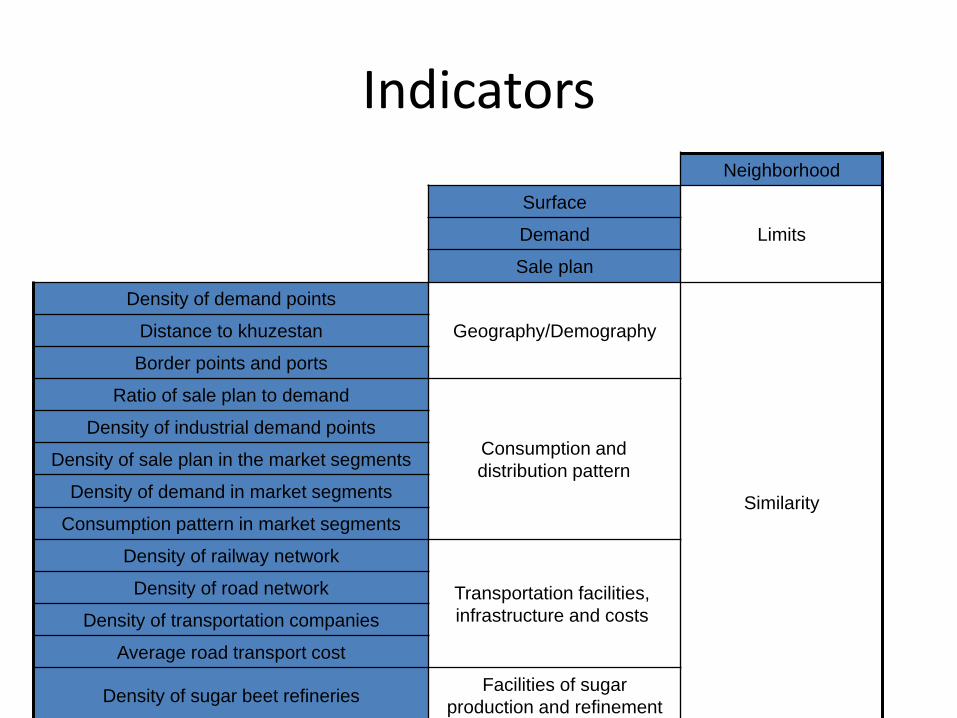
Indicators Neighborhood
Surface
Limits Demand
Sale plan
Density of demand points
Geography/Demography
Similarity
Distance to khuzestan
Border points and ports
Ratio of sale plan to demand
Consumption and
distribution pattern
Density of industrial demand points
Density of sale plan in the market segments
Density of demand in market segments
Consumption pattern in market segments
Density of railway network
Transportation facilities,
infrastructure and costs
Density of road network
Density of transportation companies
Average road transport cost
Density of sugar beet refineries Facilities of sugar
production and refinement
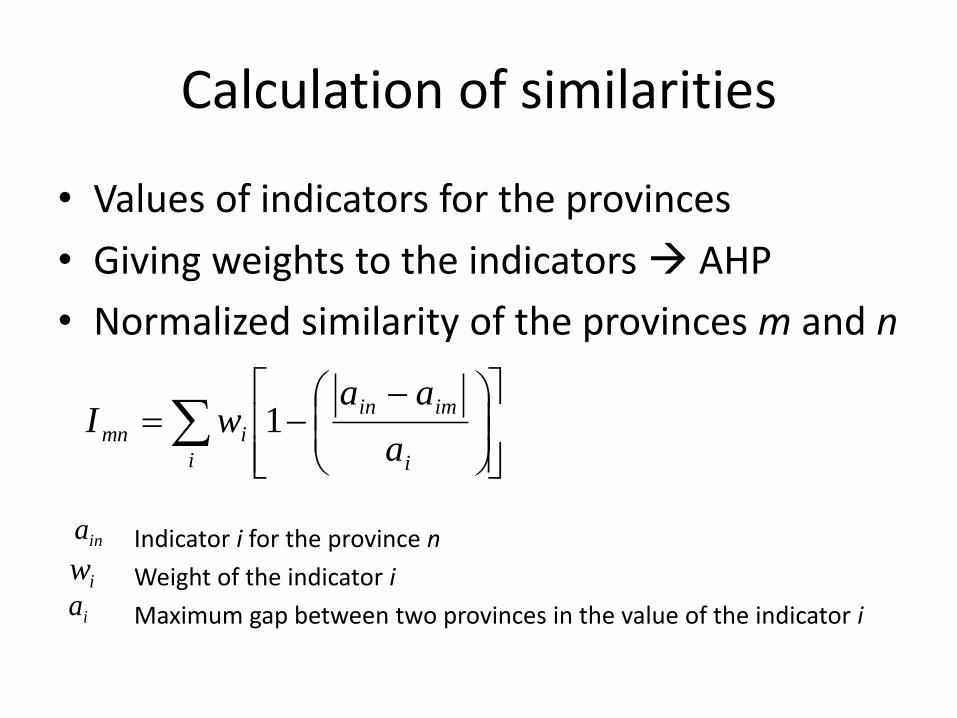
Calculation of similarities
• Values of indicators for the provinces
• Giving weights to the indicators AHP
• Normalized similarity of the provinces m and n
i i
imin
imna
aawI 1
ina Indicator i for the province n
Weight of the indicator i
Maximum gap between two provinces in the value of the indicator i
iw
ia
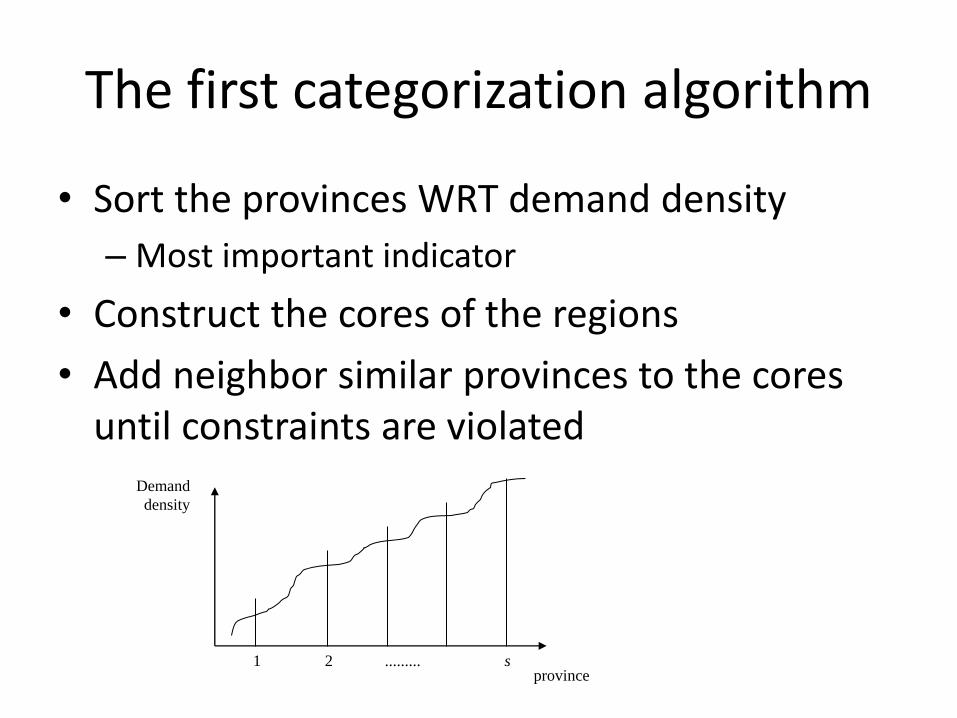
The first categorization algorithm
• Sort the provinces WRT demand density
– Most important indicator
• Construct the cores of the regions
• Add neighbor similar provinces to the cores until constraints are violated
Demand
density
province 1 2 ......... s
Region
1
Region
2
Region
3
Region 4
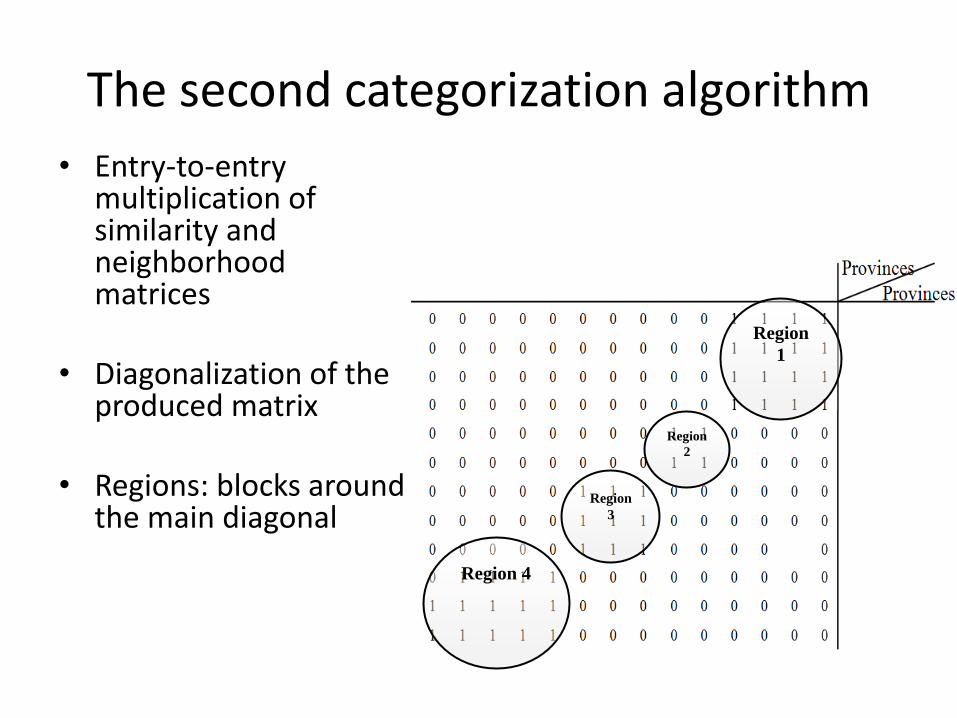
The second categorization algorithm
• Entry-to-entry multiplication of similarity and neighborhood matrices
• Diagonalization of the produced matrix
• Regions: blocks around the main diagonal
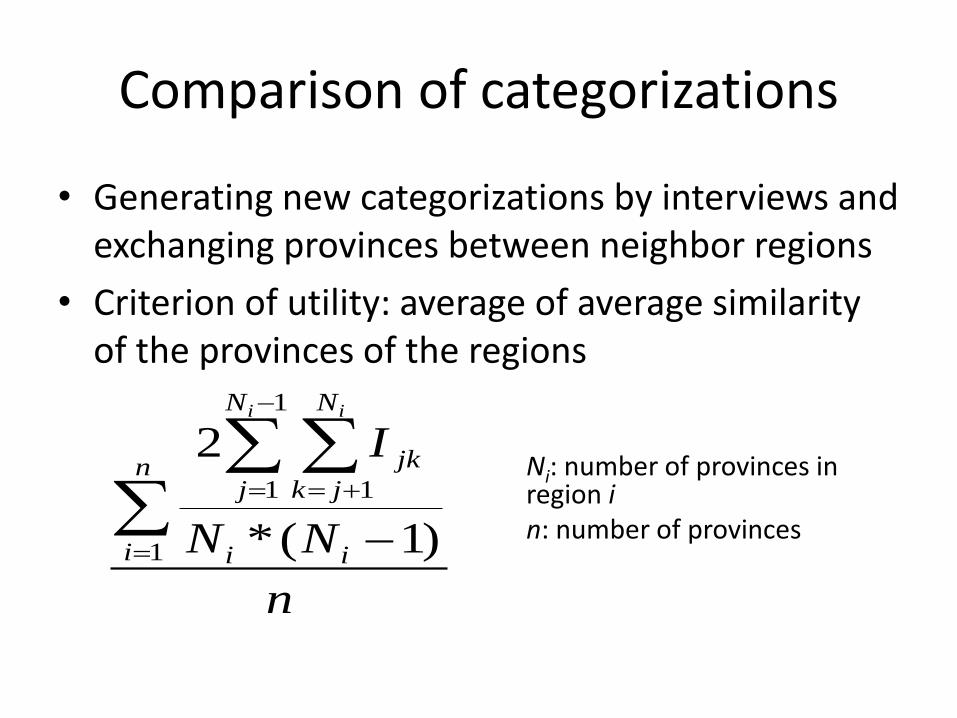
Comparison of categorizations
• Generating new categorizations by interviews and exchanging provinces between neighbor regions
• Criterion of utility: average of average similarity of the provinces of the regions
n
NN
In
i ii
N
j
N
jk
jk
i i
1
1
1 1
)1(*
2Ni: number of provinces in region i n: number of provinces
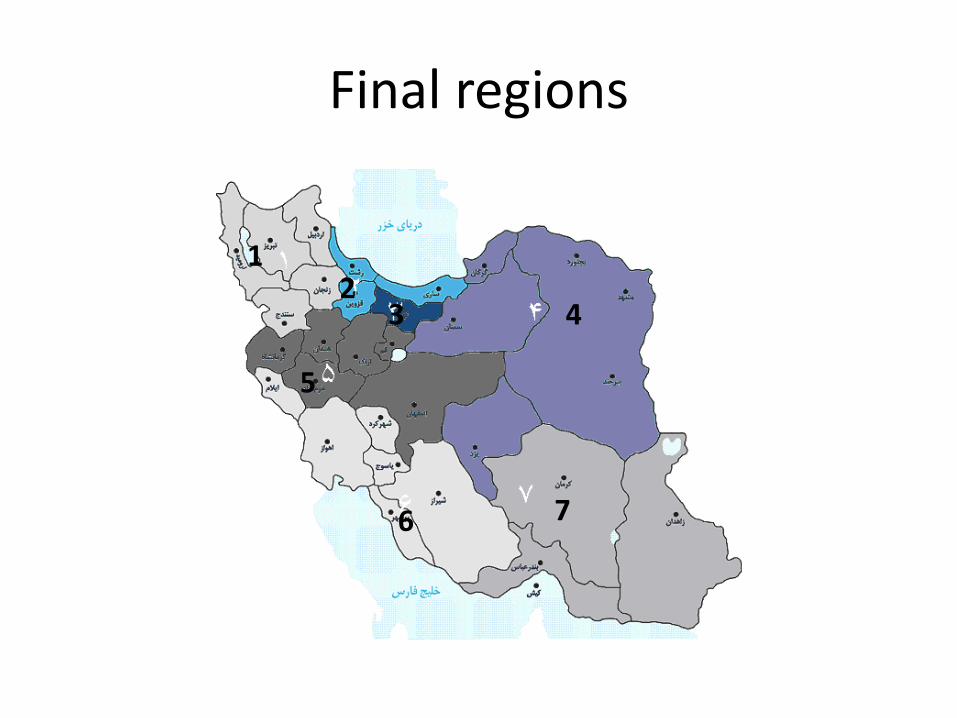
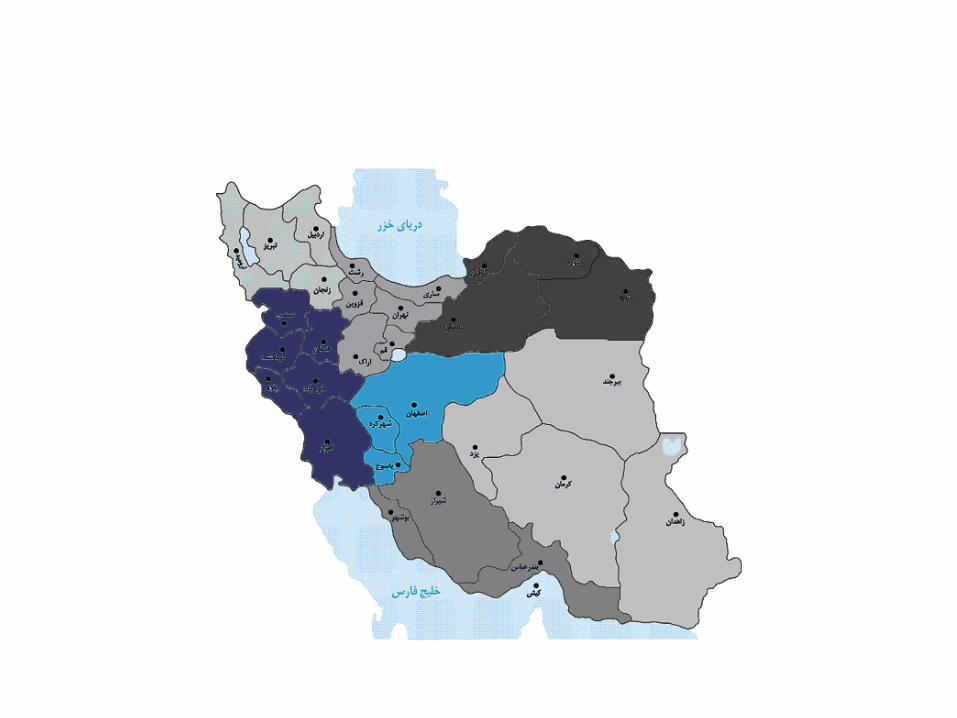
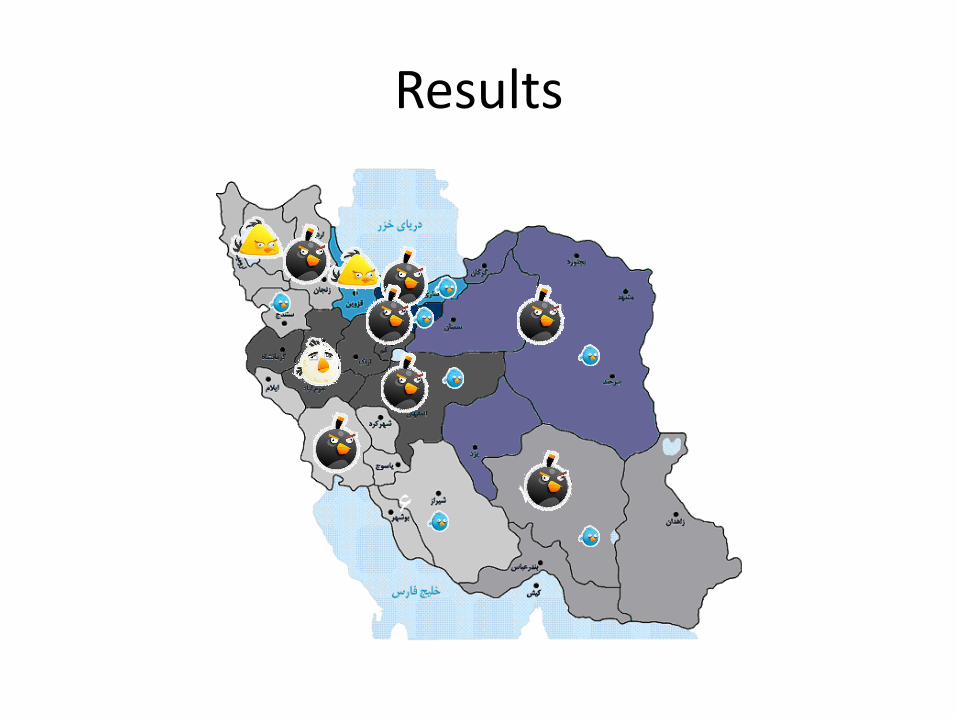
Final regions
6
5
4 3 2
1
7
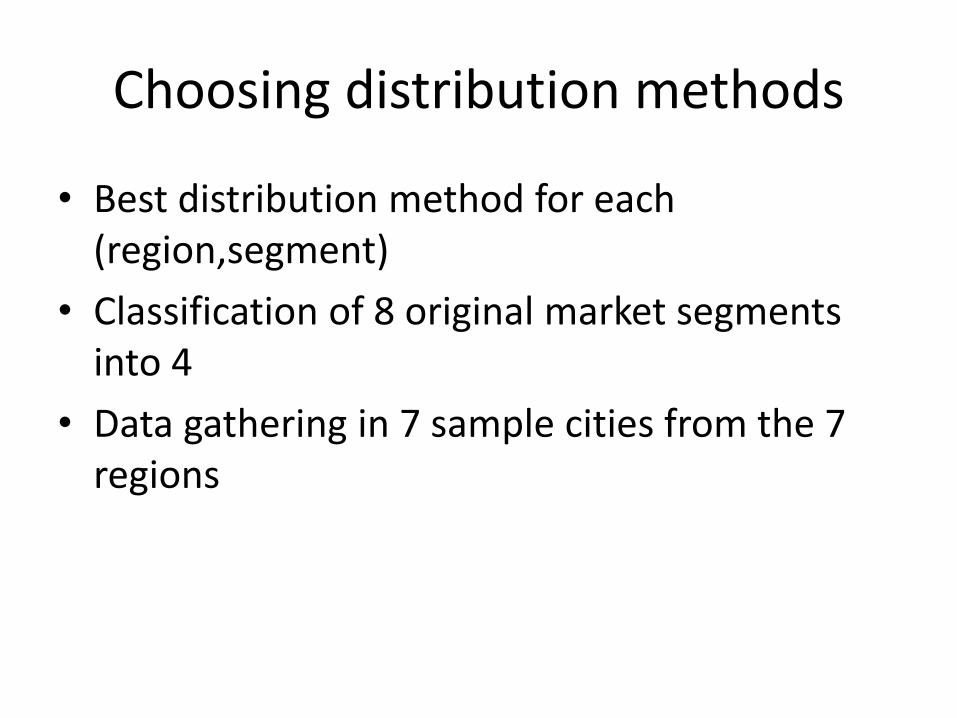
Choosing distribution methods
• Best distribution method for each (region,segment)
• Classification of 8 original market segments into 4
• Data gathering in 7 sample cities from the 7 regions
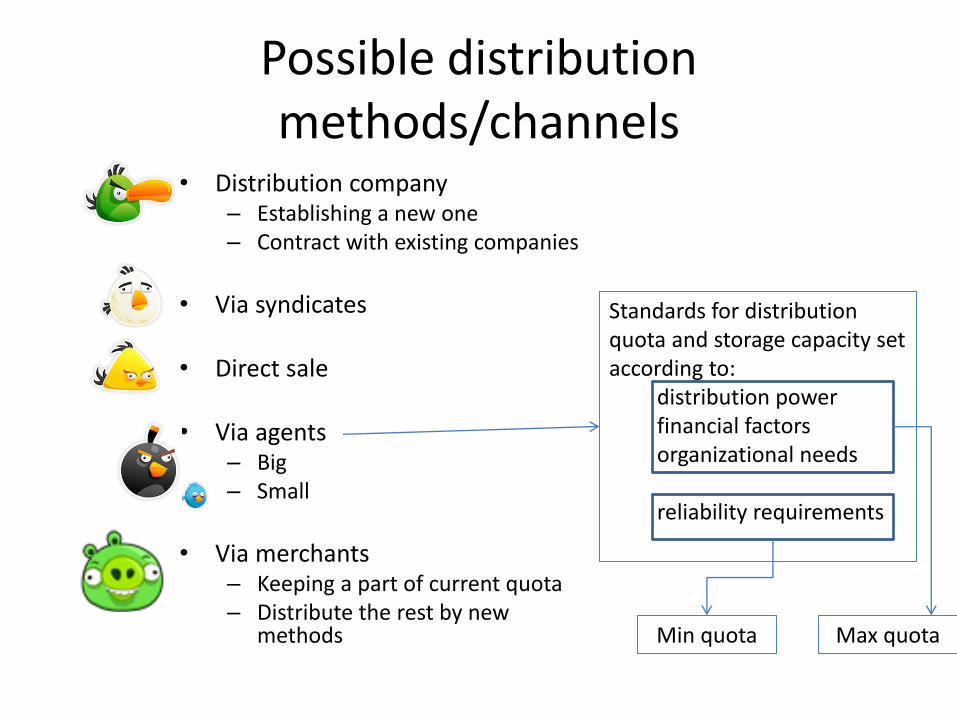
Possible distribution methods/channels
• Distribution company – Establishing a new one – Contract with existing companies
• Via syndicates
• Direct sale
• Via agents
– Big – Small
• Via merchants
– Keeping a part of current quota – Distribute the rest by new
methods
Standards for distribution quota and storage capacity set according to:
distribution power financial factors organizational needs reliability requirements
Max quota Min quota
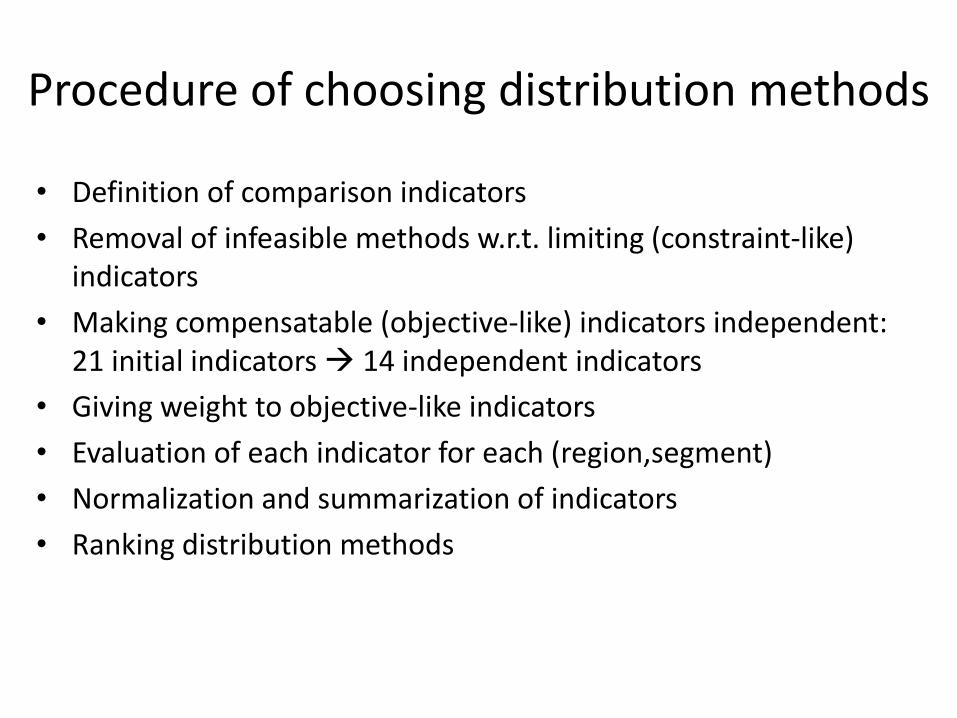
Procedure of choosing distribution methods
• Definition of comparison indicators
• Removal of infeasible methods w.r.t. limiting (constraint-like) indicators
• Making compensatable (objective-like) indicators independent: 21 initial indicators 14 independent indicators
• Giving weight to objective-like indicators
• Evaluation of each indicator for each (region,segment)
• Normalization and summarization of indicators
• Ranking distribution methods
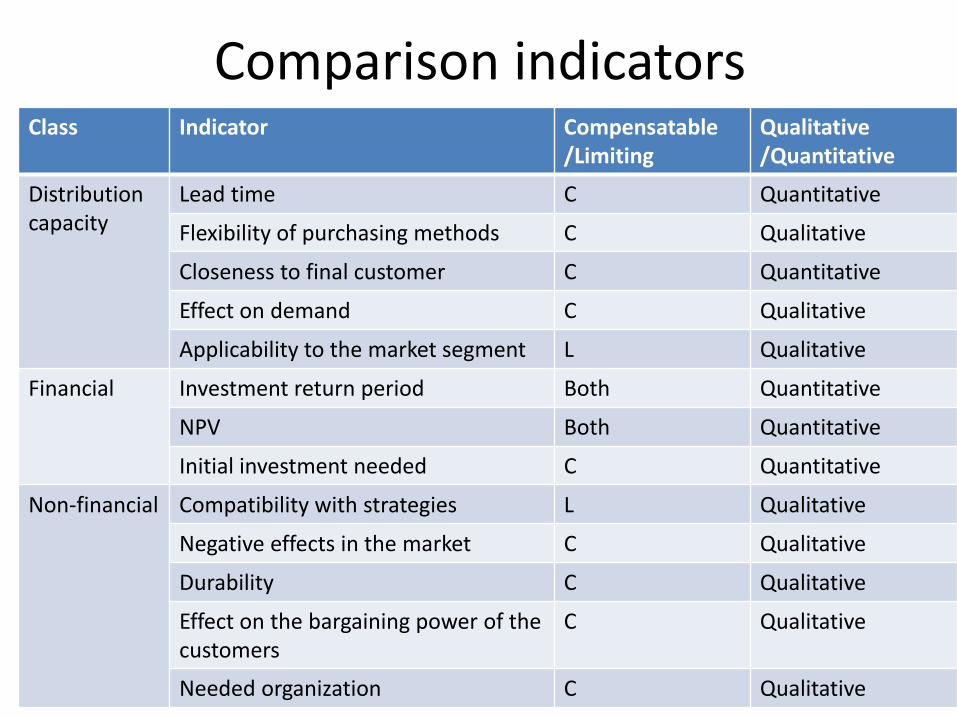
Comparison indicators Class Indicator Compensatable
/Limiting Qualitative /Quantitative
Distribution capacity
Lead time C Quantitative
Flexibility of purchasing methods C Qualitative
Closeness to final customer C Quantitative
Effect on demand C Qualitative
Applicability to the market segment L Qualitative
Financial Investment return period Both Quantitative
NPV Both Quantitative
Initial investment needed C Quantitative
Non-financial Compatibility with strategies L Qualitative
Negative effects in the market C Qualitative
Durability C Qualitative
Effect on the bargaining power of the customers
C Qualitative
Needed organization C Qualitative
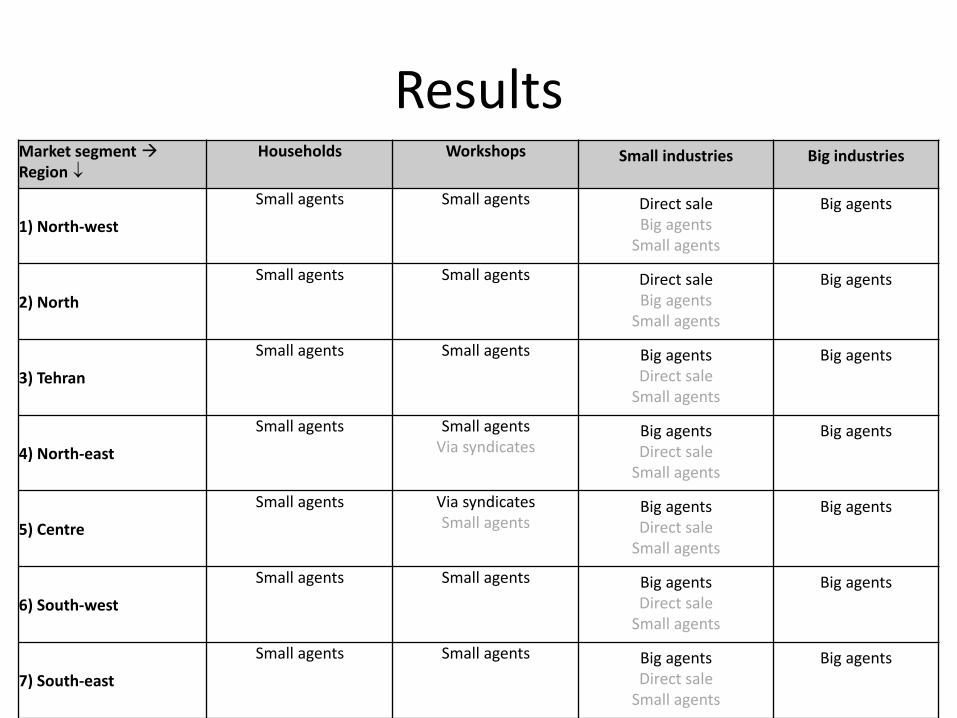
Results Big industries Small industries Workshops Households Market segment
Region
Big agents Direct sale Big agents
Small agents
Small agents Small agents
1) North-west
Big agents Direct sale Big agents
Small agents
Small agents Small agents
2) North
Big agents Big agents Direct sale
Small agents
Small agents Small agents
3) Tehran
Big agents Big agents Direct sale
Small agents
Small agents Via syndicates
Small agents
4) North-east
Big agents Big agents Direct sale
Small agents
Via syndicates Small agents
Small agents
5) Centre
Big agents Big agents Direct sale
Small agents
Small agents Small agents
6) South-west
Big agents Big agents Direct sale
Small agents
Small agents Small agents
7) South-east
Results
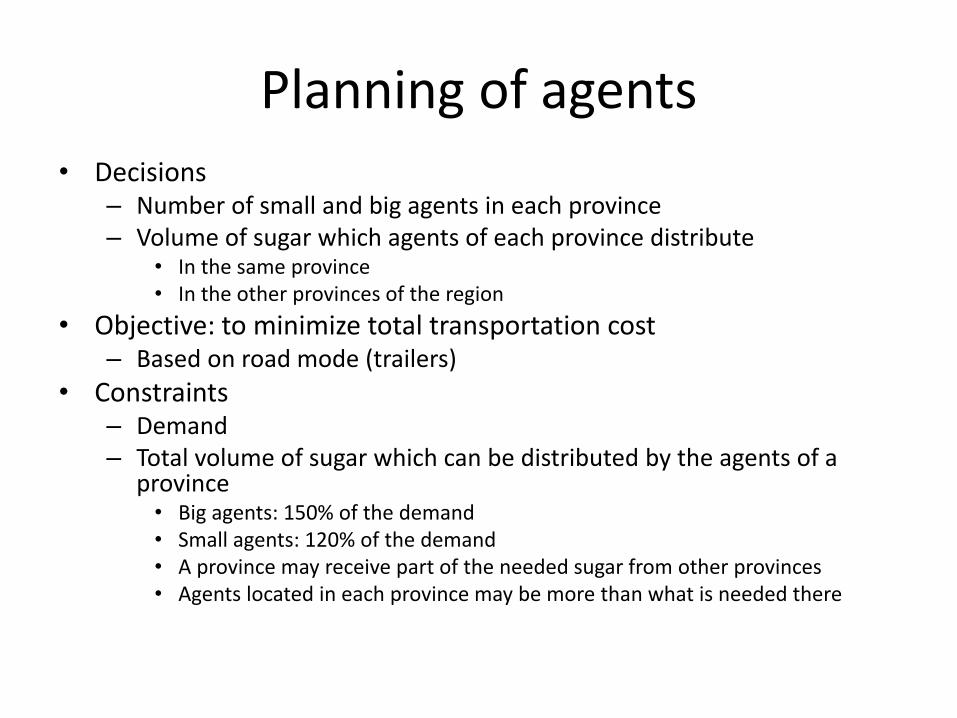
Planning of agents • Decisions
– Number of small and big agents in each province – Volume of sugar which agents of each province distribute
• In the same province • In the other provinces of the region
• Objective: to minimize total transportation cost – Based on road mode (trailers)
• Constraints – Demand – Total volume of sugar which can be distributed by the agents of a
province • Big agents: 150% of the demand • Small agents: 120% of the demand • A province may receive part of the needed sugar from other provinces • Agents located in each province may be more than what is needed there
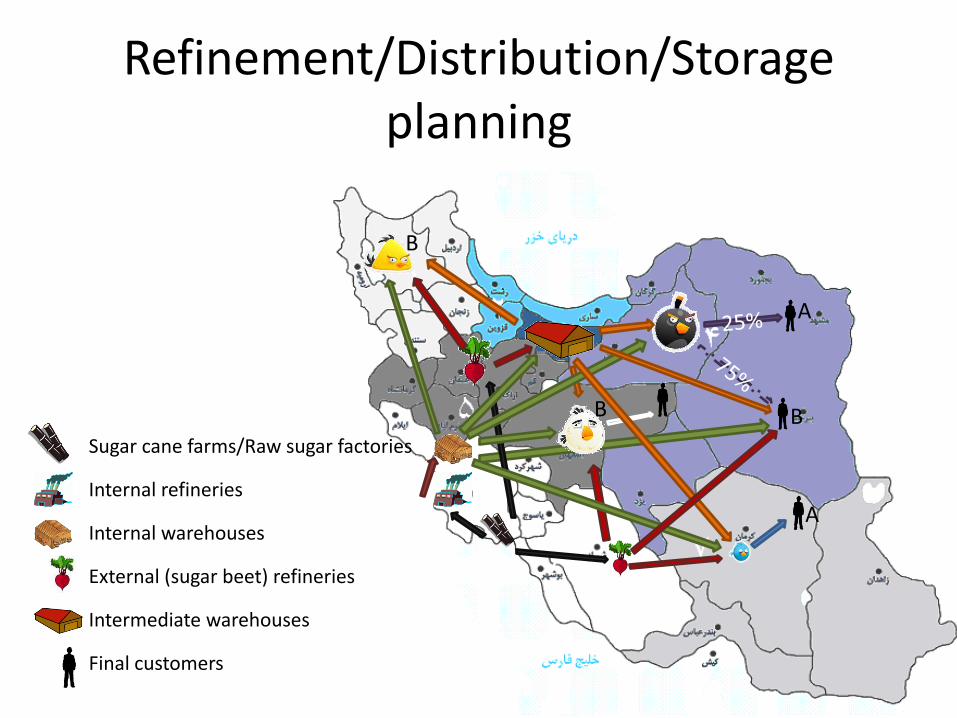
Refinement/Distribution/Storage planning
Sugar cane farms/Raw sugar factories
Internal refineries
Internal warehouses
External (sugar beet) refineries
Intermediate warehouses
Final customers
A
A
B
B
B
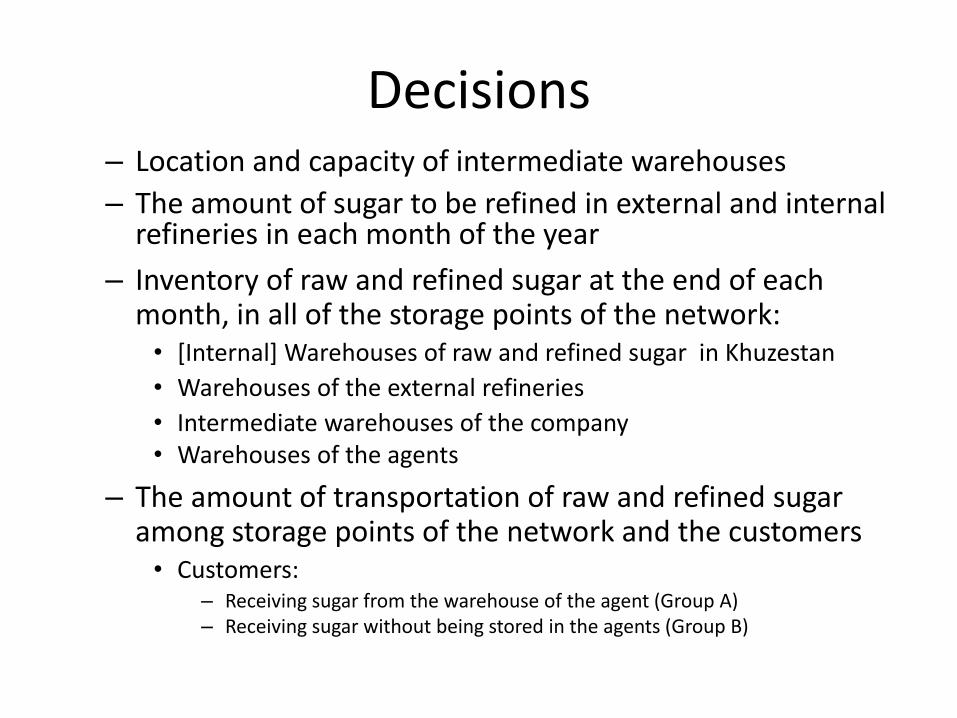
Decisions – Location and capacity of intermediate warehouses
– The amount of sugar to be refined in external and internal refineries in each month of the year
– Inventory of raw and refined sugar at the end of each month, in all of the storage points of the network:
• [Internal] Warehouses of raw and refined sugar in Khuzestan
• Warehouses of the external refineries
• Intermediate warehouses of the company • Warehouses of the agents
– The amount of transportation of raw and refined sugar among storage points of the network and the customers
• Customers: – Receiving sugar from the warehouse of the agent (Group A) – Receiving sugar without being stored in the agents (Group B)
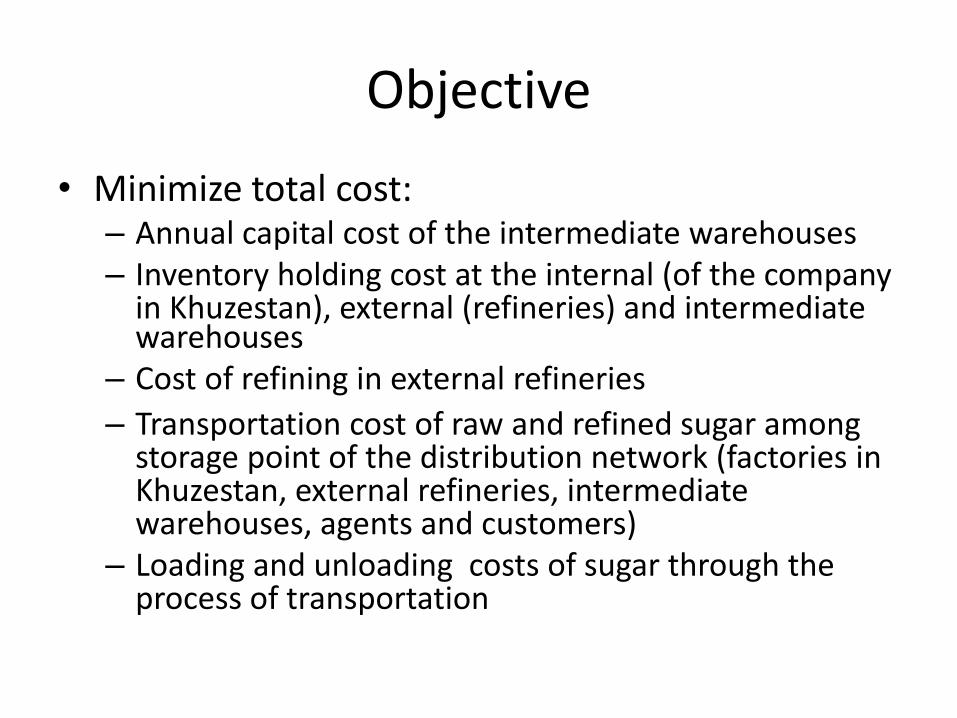
Objective
• Minimize total cost: – Annual capital cost of the intermediate warehouses – Inventory holding cost at the internal (of the company
in Khuzestan), external (refineries) and intermediate warehouses
– Cost of refining in external refineries
– Transportation cost of raw and refined sugar among storage point of the distribution network (factories in Khuzestan, external refineries, intermediate warehouses, agents and customers)
– Loading and unloading costs of sugar through the process of transportation
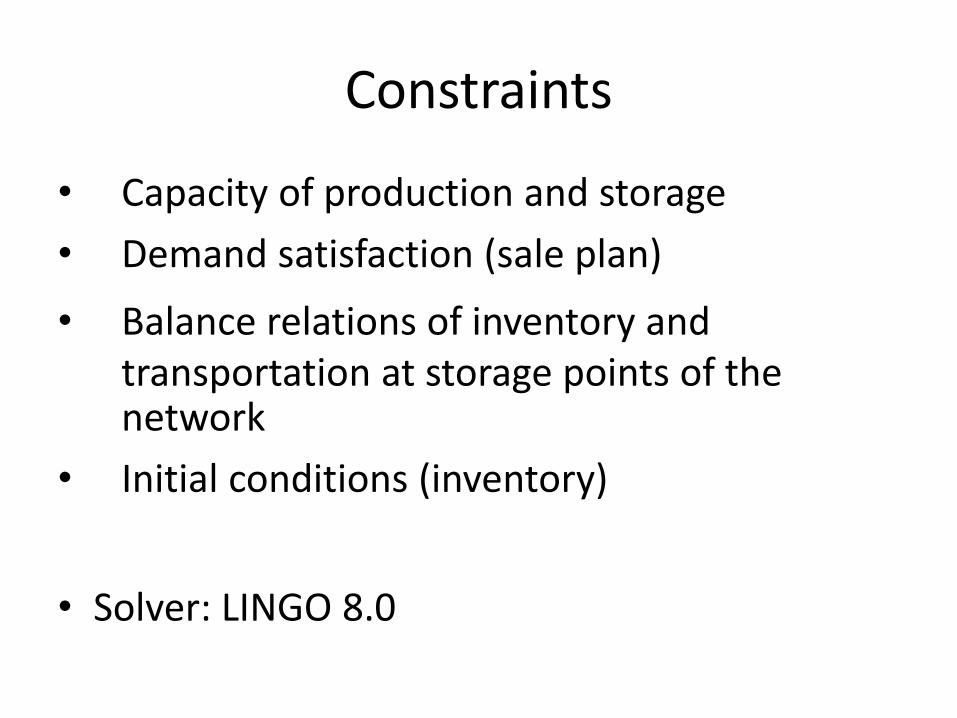
Constraints
• Capacity of production and storage
• Demand satisfaction (sale plan)
• Balance relations of inventory and transportation at storage points of the network
• Initial conditions (inventory)
• Solver: LINGO 8.0
What happened at the end?
• Sad ending: the distribution sub-company failed
• The merchants dominate the market – Massive imports
– Dumping prices
• Tactical/Operational planning cannot work when strategy is poor