A Study on Wealth Creation (1994-99) - Motilal Oswal · been accorded on the basis of the speed of...
24
Raamdeo Agrawal / Taher Badshah (91-22) 207 3809 Volume VI No. 36, February 02, 2000 Motilal Oswal Securities Ltd., Queen's Mansion, A. K. Nayak Marg, Behind Khadi Gramodyog, Fort, Mumbai 400 001 Tel: (91-22) 207 1379 Fax: (91-22) 207 6686 Sustained earnings growth is the biggest driver for wealth creation. High-growth companies (>25% p.a.) account for 76% of the wealth created. Information technology companies are among the fastest wealth creators. High earnings growth firms with high RoE, bought at a reasonable PE/Earnings Growth ratio (PEG), create maximum wealth. A Study on Wealth Creation (1994-99) MOSt THE CAGR % of Rank THE Wealth Inquire FASTEST adjusted based BIGGEST Created Rank Mkt.Cap. on size in Rs. Cr. ('94 to '99) ('94 to '99) 1 Satyam Computers 136.9 1 Hindustan Lever 34110 2 Wipro 122.8 2 Wipro 18159 3 BFL Software 117.1 3 ITC 15591 4 Infosys Technologies 101.8 4 Infosys Technologies 9145 5 Information Tech 100.0 5 Ranbaxy Labs. 4650 6 Fujitsu ICIM 88.8 6 Glaxo (India) 4632 7 NIIT 80.5 7 NIIT 4422 8 Amara Raja Batteries 75.9 8 Satyam Computers 4141 9 Pentafour Software 62.5 9 BHEL 3962 10 DSQ Software 60.3 10 Castrol India 3482 TM TM C M Y K
Transcript of A Study on Wealth Creation (1994-99) - Motilal Oswal · been accorded on the basis of the speed of...

Raamdeo Agrawal / Taher Badshah (91-22) 207 3809 Volume VI No. 36, February 02, 2000
Motilal Oswal Securities Ltd., Queen's Mansion, A. K. Nayak Marg, Behind Khadi Gramodyog, Fort, Mumbai 400 001Tel: (91-22) 207 1379 Fax: (91-22) 207 6686
Ø Sustained earnings growth is the biggest driver for wealth creation. High-growthcompanies (>25% p.a.) account for 76% of the wealth created.
Ø Information technology companies are among the fastest wealth creators.
Ø High earnings growth firms with high RoE, bought at a reasonable PE/Earnings Growthratio (PEG), create maximum wealth.
A Study on Wealth Creation (1994-99)
MOSt THE CAGR % of Rank THE WealthInquire FASTEST adjusted based BIGGEST CreatedRank Mkt.Cap. on size in Rs. Cr.
('94 to '99) ('94 to '99)
1 Satyam Computers 136.9 1 Hindustan Lever 34110 2 Wipro 122.8 2 Wipro 18159
3 BFL Software 117.1 3 ITC 15591
4 Infosys Technologies 101.8 4 Infosys Technologies 9145 5 Information Tech 100.0 5 Ranbaxy Labs. 4650
6 Fujitsu ICIM 88.8 6 Glaxo (India) 4632
7 NIIT 80.5 7 NIIT 4422 8 Amara Raja Batteries 75.9 8 Satyam Computers 4141
9 Pentafour Software 62.5 9 BHEL 3962
10 DSQ Software 60.3 10 Castrol India 3482
TM
TM
C M Y K

2
C M Y K
Contents
Concept, Objective & Methodology 3
The Wealth Creator Group v/s BSE Sensex 4
Wealth Creators ~ Business Analysis 5,6
Wealth Creators ~ Business Economics 7
Wealth Creators ~ Indian Companies v/s MNCs 8
Wealth Creators ~ DuPont Analysis 9
Significance of Growth 10
Characteristics of Growth 11
Valuation of Growth 12
How to Value Growth? 13,14
Wealth Creators ~ Effect of Profit Growth on Price Performance 15
Wealth Creators ~ Effect of Profitable Growth on Price Performance 16
Some Thoughts for the Future 17
Appendix I ~ Wealth Creators 18,19
Appendix II ~ Wealth Creators (Alphabetically listed) 20,21
Appendix III ~ PEG Table 22

3
C M Y K
Concept, Objective & Methodology
Purpose
Equity markets worldwide have become the biggest source of Wealth Creation. The worldmarket capitalisation grew 20% during 1999, adding approximately $5 trillion, on the back of $6trillion added during 1998. The smart increase in the global market capitalisation implores in totake a closer look at the creation of wealth in the past and the possible ramifications for theIndian market as well. It may be noted that the Indian markets too have added almost $100 bnin market cap during 1999, an increase of 65%.
As Philip Fisher rightly says, "It seems logical that before even thinking of buying any commonstock, the first step is to see how money has been most successfully made in the past."
The Wealth Creation study is aimed primarily at achieving this objective.
Concept
Wealth Creation is the process by which a company enhances the market value of capital entrustedto it by its shareholders. It is a basic measure of success for any commercial venture. WealthCreation is achieved by rational actions of a company in a sustained manner.
For an investor, wealth created by his company is the difference between the market value of hisholdings and his investment cost (adjusted for dilutions). Equity investments are associated witha greater degree of risk and hence, for an equity investor, wealth created by his company must begreater than that from other relatively low-risk assets.
At the time of making an investment decision we are familiar with the financial statistics of thecompany, its management, products, price etc. Yet do we stop to ask ourselves, "Does thiscompany have the ability to create great wealth for us on a sustained basis?" We hope this study(the fourth in the series) brings us closer to an answer.
Objective
To find the financial characteristics of those companies that have created wealth for theirshareholders in the recent past. This would enable us to identify future Wealth Creators.
Methodology
For the purpose of our study*, we have identified the top 100 Wealth Creators for the periodApril 1994 to March 1999 in the Indian Stock Market. These companies have the distinction ofadding atleast Rs.100 crores to their market capitalisation over this period, adjusted for dilutions.We have termed this group the "MOSt-Inquire 100 Wealth Creators". The ranks have thenbeen accorded on the basis of the speed of Wealth Creation i.e. compounded growth in wealthover the period of study.
* The database used for this study is that of Capitaline Olé and Trends.
4
C M Y K
The Wealth Creator Group v/s BSE Sensex
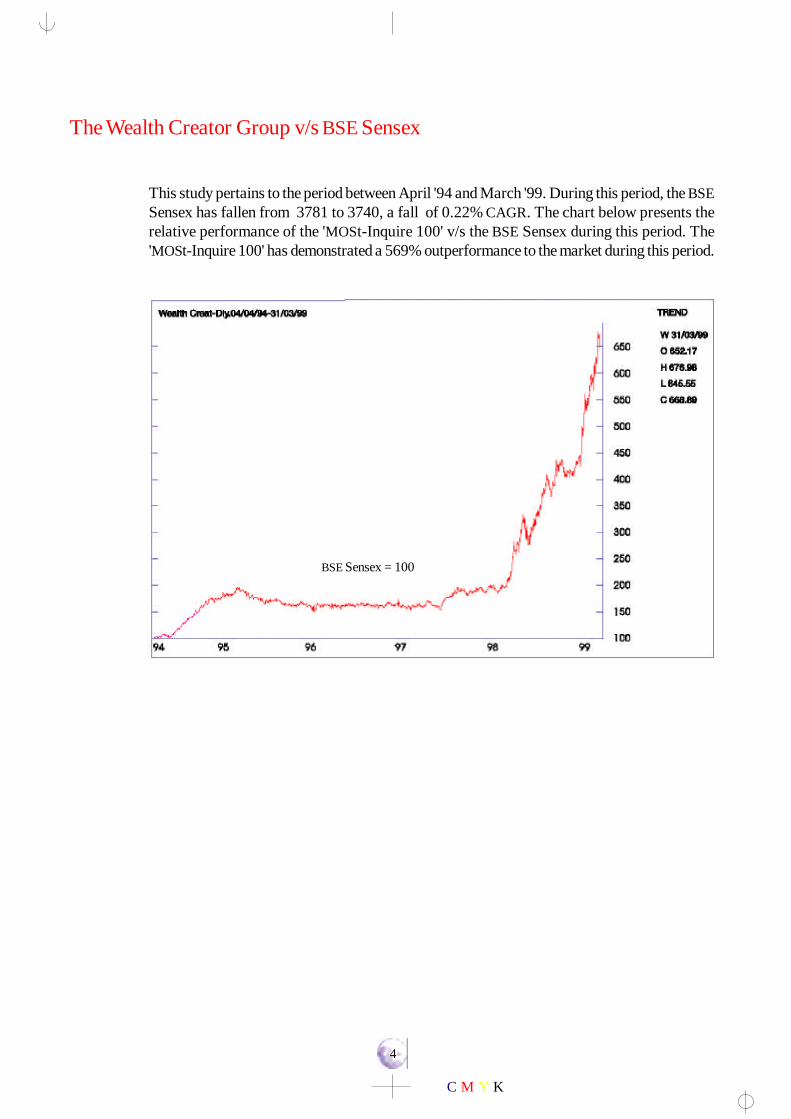
This study pertains to the period between April '94 and March '99. During this period, the BSESensex has fallen from 3781 to 3740, a fall of 0.22% CAGR. The chart below presents therelative performance of the 'MOSt-Inquire 100' v/s the BSE Sensex during this period. The'MOSt-Inquire 100' has demonstrated a 569% outperformance to the market during this period.
BSE Sensex = 100

5
C M Y K
Wealth Creators ~ Business Analysis
I Nature of BusinessThe evolution of information technology as a wealth creating business,seen in the last study, now appears complete. Against three infotechfirms that figured in the ten fastest wealth creators between 1993-98,the ten fastest wealth creators between 1994-99 consist of nineinfotech firms. Moreover, the total representation of infotech companieshas increased from 5% during 1993-98 to 20% in 1994-99.
Continuing its past trend, businesses such as pharmaceuticals, FMCGand automobiles dominate the wealth creators, constituting 53% ofthe group, against 48% in the previous year and has contributed to62% of wealth created.
II Business ActivityThe importance of focus in business cannot be over-emphasised.Almost 96% of companies in our Wealth Creators list have followeda focused and consistent business policy.
Business Activity 1999 Business Activity 1998
Industry No. of Contribution to RoCE RoCE Cos. Wealth Created % 1999 1994
FMCG 19 38.9 31.4 23.4Information Tech. 20 30.2 31.3 21.5Pharmaceuticals 21 14.1 18.5 21.7Automobiles 13 8.8 21.4 23.9Engineering 6 3.2 11.8 12.3Media/Telecom 2 1.1 25.8 18.1Petrochemicals 1 0.7 13.3 11.8Consumer Durables 2 0.3 17.7 2.6Cement 1 0.2 22.5 17.8Chemicals 2 0.2 24.5 7.6Banking & Finance 1 0.1 46.7 32.9Aluminium 1 0.1 39.5 -6.0Others 11 2.1 26.0 23.1Total 100 100.0 22.7 18.8

6
C M Y K
Wealth Creators ~ Business Analysis (Contd.)
III Product AttributeThe technological edge to a product is an important source of wealthcreation. Companies with a greater element of technology in theirproduct lines have a greater propensity to create wealth. Almost 60%of the wealth creators have technology as a feature of their productlines. Over the past four years, technology has emerged as a keyattribute of wealth creators consistently. Commodity companies, onthe other hand, are represented inconsistently. This further highlightsthe fact that commodity businesses do not create wealth on a consistentbasis.
IV Consumer ProfileConA strong consumer or service franchise is critical to wealth creation.
Consumer products and service-oriented businesses constitute 83%of the wealth creators compared to 70% a year earlier. Intermediateproduct companies formed only 17% of wealth creators, a fallout ofa smaller representation of commodity companies.
umer product and service-oriented businesses have increased theirrepresentation in the Inquire Wealth Creators' list over the previousyear.Consumer Profile 1999 Consumer Profile 1998
Product Attribute 1999 Product Attribute 1998

7
C M Y K
Wealth Creation is concurrent with the overall improvement in the economics of abusiness.
Ø Companies (from the 'MOSt-Inquire 100'), with a RoCE of less than 10%,numbered 22 in 1994. This has reduced to nine in 1999.
Ø At the other end of the spectrum, in the year 1994, 28 companies earnedreturns in excess of 30% on invested capital. This swelled to 42 companiesby 1999.
Ø Of the 28 companies that started off with a RoCE of over 30% in the baseyear, 61% have retained their positions in the top RoCE bracket, implyingthat businesses with good economics generally tend to get better with time.
Wealth Creators ~ Business Economics
Wealth Creators - Business RoCE
Year
8
C M Y K
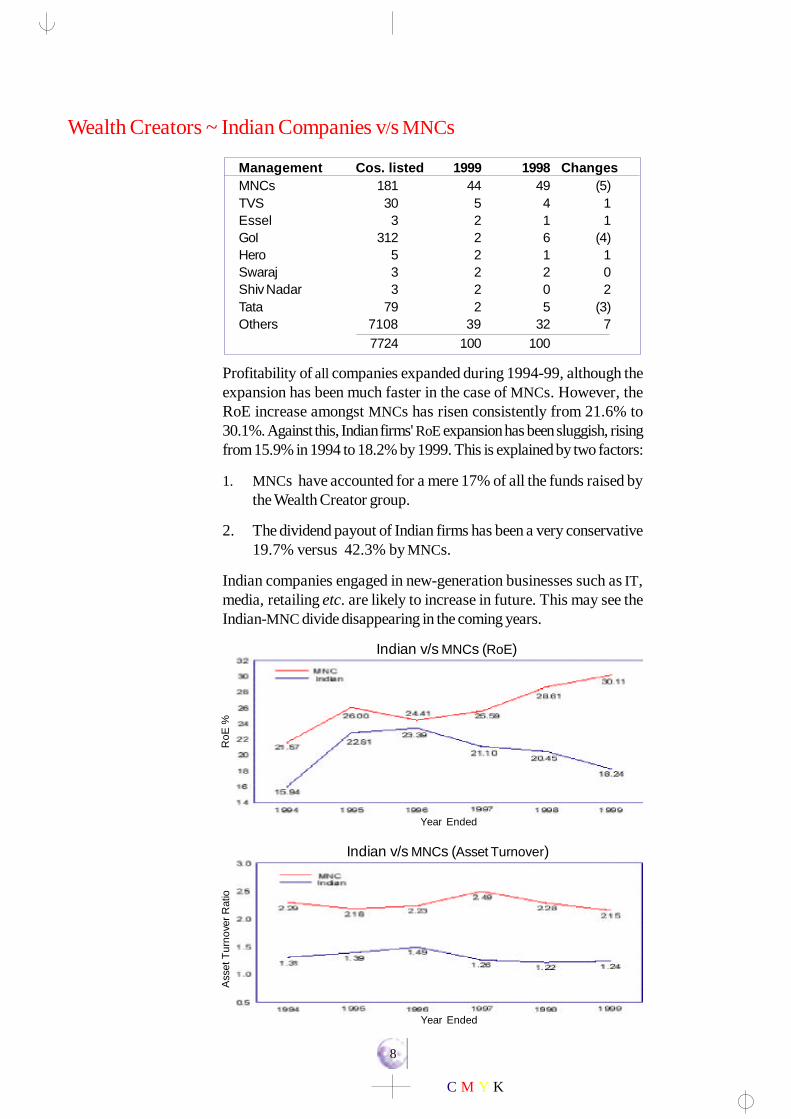
Wealth Creators ~ Indian Companies v/s MNCs
Profitability of all companies expanded during 1994-99, although theexpansion has been much faster in the case of MNCs. However, theRoE increase amongst MNCs has risen consistently from 21.6% to30.1%. Against this, Indian firms' RoE expansion has been sluggish, risingfrom 15.9% in 1994 to 18.2% by 1999. This is explained by two factors:
1. MNCs have accounted for a mere 17% of all the funds raised bythe Wealth Creator group.
2. The dividend payout of Indian firms has been a very conservative19.7% versus 42.3% by MNCs.
Indian companies engaged in new-generation businesses such as IT,media, retailing etc. are likely to increase in future. This may see theIndian-MNC divide disappearing in the coming years.
Management Cos. listed 1999 1998 ChangesMNCs 181 44 49 (5)TVS 30 5 4 1Essel 3 2 1 1GoI 312 2 6 (4)Hero 5 2 1 1Swaraj 3 2 2 0Shiv Nadar 3 2 0 2Tata 79 2 5 (3)Others 7108 39 32 7
7724 100 100
RoE
%
Indian v/s MNCs (RoE)
Indian v/s MNCs (Asset Turnover)
Ass
et T
urno
ver R
atio
Year Ended
Year Ended
9
C M Y K
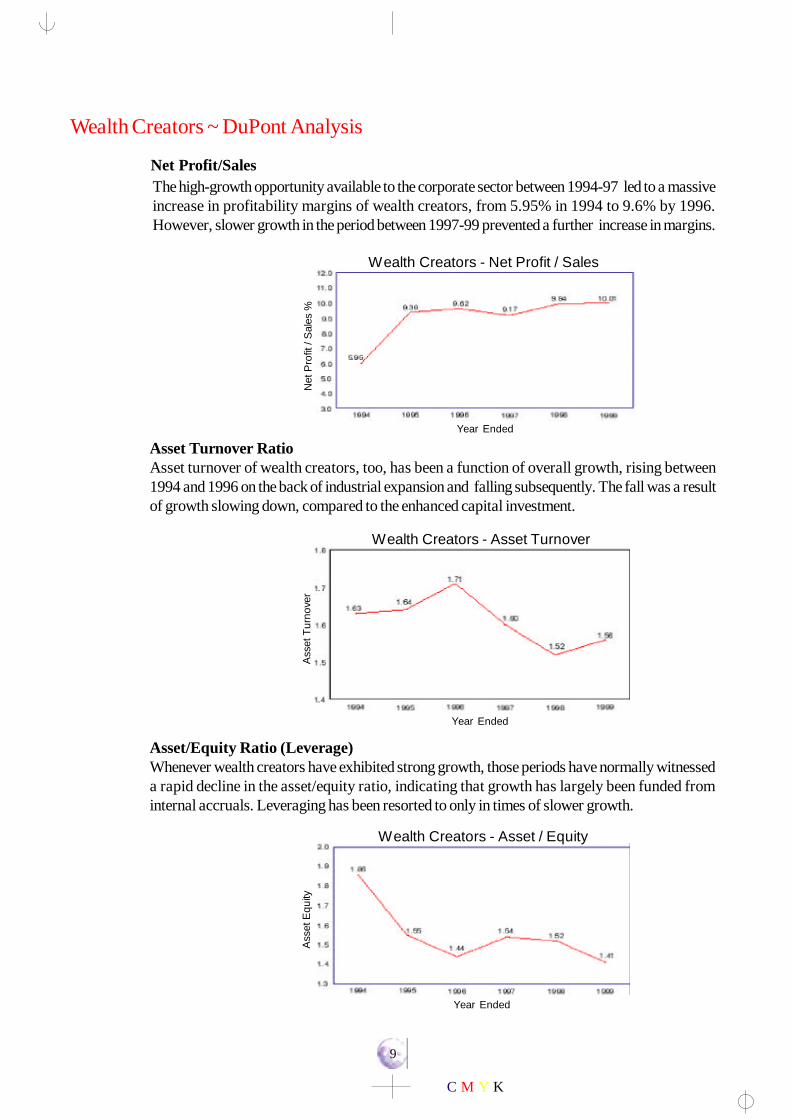
Asset Turnover RatioAsset turnover of wealth creators, too, has been a function of overall growth, rising between1994 and 1996 on the back of industrial expansion and falling subsequently. The fall was a resultof growth slowing down, compared to the enhanced capital investment.
Asset/Equity Ratio (Leverage)Whenever wealth creators have exhibited strong growth, those periods have normally witnesseda rapid decline in the asset/equity ratio, indicating that growth has largely been funded frominternal accruals. Leveraging has been resorted to only in times of slower growth.
The high-growth opportunity available to the corporate sector between 1994-97 led to a massiveincrease in profitability margins of wealth creators, from 5.95% in 1994 to 9.6% by 1996.However, slower growth in the period between 1997-99 prevented a further increase in margins.
Net Profit/Sales
Wealth Creators ~ DuPont Analysis
Year Ended
Year Ended
Year Ended
Wealth Creators - Asset / Equity
Ass
et E
quity
Wealth Creators - Asset Turnover
Wealth Creators - Net Profit / Sales
Ass
et T
urno
ver
Net
Pro
fit /
Sal
es %

10
C M Y K
Significance of Growth
Earnings growth and earning power are the key drivers to wealth creation. Wealth creators, over thelast three studies, have been showing accelerated earnings growth, accompanied by an acceleration inmarket capitalisation as well. The high growth rates that the new-generation businesses are likelyto demonstrate is expected to further increase the significance of growth in stock valuations in thecoming years.
The value of any company depends primarily on three factors:
1. Current profit2. Current capital employed3. Future growth in profits and profitability
'All prices depend upon someone's estimate of future income' - Burr Williams
Performance of top 10 Wealth Creators 1991-96 1992-97 1993-98 1994-99
Fastest Wealth Creators (Top 10) 5 year Mcap. CAGR % 82.8 42.4 62.7 94.4Fastest Wealth Creators (Top 10) 5 year Earnings CAGR % 45.0 50.7 72.0 73.6
EPS Growth RoE / RoCE
Future Profits Future Profitability
Current Profits / Profitability
V V

11
C M Y K
Characteristics of Growth
Consistency, profitability and sustainability are the key drivers to the valuation of growth.
Consistency of growth
Cyclical growth is much more difficult to predict compared to secular growth. Secular or consistentgrowth hence commands much higher valuations. In short, what gets measured gets valued.
Profitable growth
For growth to become self-financing and capable of generating free-cash flows, it must beprofitable. Earnings growth achieved at a significant capital cost may not be as valuable.
Sustainability of growth
The current value of companies depends considerably on the perceived longevity of their earningsgrowth. The greater the sustainability of such earnings growth, the better is likely tobe the valuationof such growth.
Profit Growth of the 'MOSt-Inquire 100'
Ø The median profit growth of the ‘MOSt-Inquire 100’ during the period between 1994-99 is31.8% CAGR.
Ø The median profit growth of the BSE Sensex companies is 23.2% during this period.
Ø The top ten wealth creators in the ‘MOSt-Inquire 100’ registered a median CAGR of 95%in earnings.
Ø Barring four, all other companies in the ‘MOSt-Inquire 100’ have recorded earnings growth.
Ø Companies with more than 25% p.a. growth in earnings have contributed to 76% of thetotal wealth created.
Ø Only 117 companies have earnings growth in excess of 25% p.a. between 1994-99. Ofthese, 65 companies are wealth creators.
Profitability of the 'MOSt-Inquire 100'
Ø The median RoCE of the ‘MOSt-Inquire 100’ increased from 22.6% in 1994 to 29% by1999.
Ø The median RoE of the ‘MOSt-Inquire 100’ expanded from 19% in 1994 to 24% by 1999.
Ø Almost 66% of the companies of the 'MOSt-Inquire 100' have increased their RoCE / RoEin this period.

12
C M Y K
Valuation of Growth
The magic of compounding
What makes growth valuable is its power to compound returns over a period of time. Theconcept of compounding can have a significant impact on investment returns (refer compoundingcurve below).
Infosys - An example of compounding returns:
The effect of compounding earnings growth on stock returns is best illustrated with theperformance of Infosys over the past five years.
Ø EPS grew @68.4% p.a. during 1994-99.Ø RoE increased from 29% in 1994 to 78%* by 1999, a CAGR of 22%.Ø P/E grew @21.6% p.a. during 1994-99.Ø The combined effect was a 102% CAGR in stock price during 1994-99.
Thus, high earnings growth (68.4%), high profitability growth (22% p.a) bought at a sufficientlylow PEG (0.4), led to compounded returns of 102% for shareholders
* Adjusted for capital raised through the ADR issue during 1998-99.
Compounding Curve
Pric
e P
erfo
rman
ce
RoE
(%)
Pro
fit G
row
th
Term
inal
val
ue
Growth rate %

13
C M Y K
How to Value Growth?
What is the right PEG?
Earnings compounded at different rates of growth result in different levels ofthe terminal book value. The graph below depicts the PEG when earnings arecompounded at rates between 10% and 100% for a specified period of eightyears.
Ø Earnings that compound @10% p.a. when bought at a PEG of 1, leads torecovery of capital in eight years.
Ø Earnings that compound @50% p.a. can be purchased upto a PEG of 1.48to ensure capital recovery in eight years.
Ø For earnings that compound @100% p.a. (though high growth rates are byitself unsustainable beyond a particular level), one could pay a PEG of even5.1, and still ensure capital recovery in eight years.
The appropriate PEG for any stock would vary substantially with respect to itsunderlying growth rate.
Growth rate %
PE
G
PEG at different growth rates leading to recovery of capital in 8 years
14
C M Y K
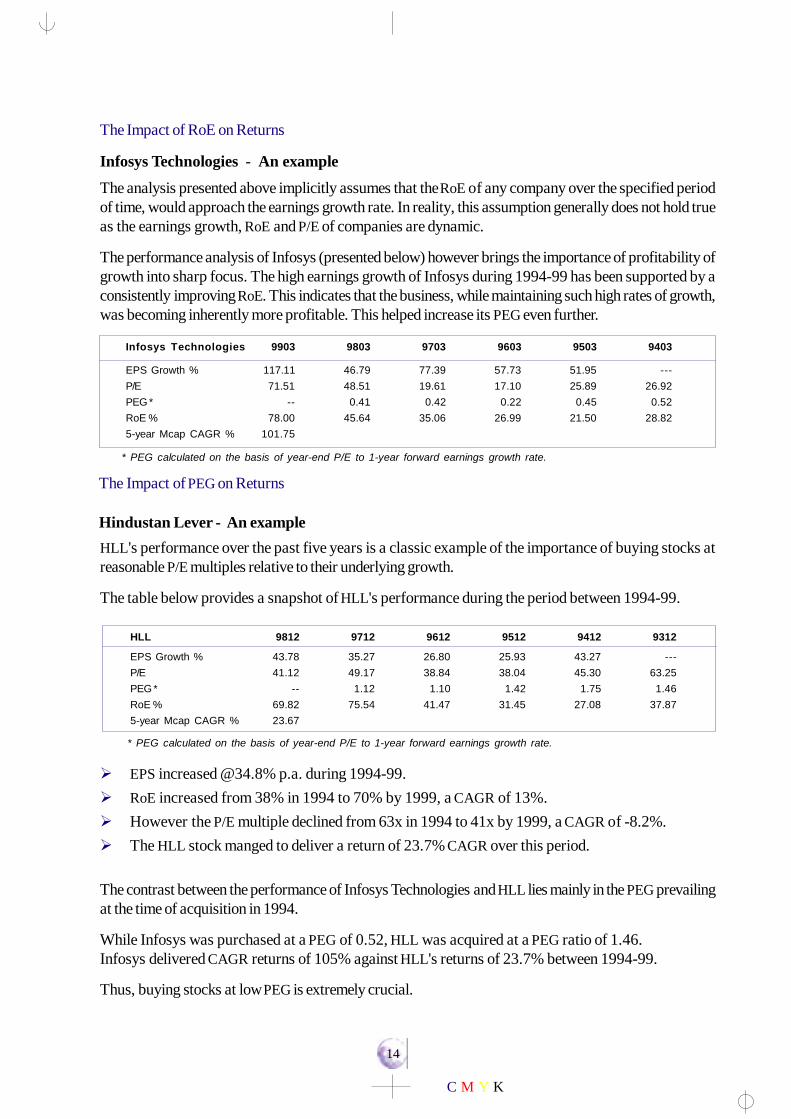
The Impact of PEG on Returns
Hindustan Lever - An example
HLL's performance over the past five years is a classic example of the importance of buying stocks atreasonable P/E multiples relative to their underlying growth.
The table below provides a snapshot of HLL's performance during the period between 1994-99.
Ø EPS increased @34.8% p.a. during 1994-99.Ø RoE increased from 38% in 1994 to 70% by 1999, a CAGR of 13%.Ø However the P/E multiple declined from 63x in 1994 to 41x by 1999, a CAGR of -8.2%.Ø The HLL stock manged to deliver a return of 23.7% CAGR over this period.
The contrast between the performance of Infosys Technologies and HLL lies mainly in the PEG prevailingat the time of acquisition in 1994.
While Infosys was purchased at a PEG of 0.52, HLL was acquired at a PEG ratio of 1.46.Infosys delivered CAGR returns of 105% against HLL's returns of 23.7% between 1994-99.
Thus, buying stocks at low PEG is extremely crucial.
HLL 9812 9712 9612 9512 9412 9312
EPS Growth % 43.78 35.27 26.80 25.93 43.27 ---P/E 41.12 49.17 38.84 38.04 45.30 63.25PEG * -- 1.12 1.10 1.42 1.75 1.46RoE % 69.82 75.54 41.47 31.45 27.08 37.875-year Mcap CAGR % 23.67
The Impact of RoE on Returns
Infosys Technologies - An example
The analysis presented above implicitly assumes that the RoE of any company over the specified periodof time, would approach the earnings growth rate. In reality, this assumption generally does not hold trueas the earnings growth, RoE and P/E of companies are dynamic.
The performance analysis of Infosys (presented below) however brings the importance of profitability ofgrowth into sharp focus. The high earnings growth of Infosys during 1994-99 has been supported by aconsistently improving RoE. This indicates that the business, while maintaining such high rates of growth,was becoming inherently more profitable. This helped increase its PEG even further.
Infosys Technologies 9903 9803 9703 9603 9503 9403
EPS Growth % 117.11 46.79 77.39 57.73 51.95 ---P/E 71.51 48.51 19.61 17.10 25.89 26.92PEG * -- 0.41 0.42 0.22 0.45 0.52RoE % 78.00 45.64 35.06 26.99 21.50 28.825-year Mcap CAGR % 101.75
* PEG calculated on the basis of year-end P/E to 1-year forward earnings growth rate.
* PEG calculated on the basis of year-end P/E to 1-year forward earnings growth rate.

15
C M Y K
Wealth Creators ~ Effect of Profit Growth on Price Performance
Ø The ‘MOSt-Inquire 100’ have been arranged on the basis of their PEG i.e. the ratio of their P/Emultiples as on 1994 to their earnings CAGR during 1994-99.
Ø The group has been divided into two parts on the basis of their median PEG of 0.83. Companies witha PEG above 0.83 are denoted as 'HIGH PEG' stocks and those below 0.83 as 'LOW PEG' stocks.
Ø The groups have then been further sub-divided on a cut-off market capitalisation CAGR of 25%.
ObservationOf the 50 LOW PEG stocks (QI), 68% have given superior returns. Quadrant I has a median marketcapitalisation CAGR of 45%.
ConclusionStocks bought at a LOW PEG have a tendency to deliver far superior returns.
ObservationAmongst the HIGH PEG stocks (QIII) 70% have given very low returns. The 34 companies in QuadrantIII have a median market capitalisation CAGR of only 13%.
ConclusionStocks purchased at a HIGH PEG ratio find it difficult to manage very high returns.
"P/E multiples, in isolation, provide no indication to valuation. No P/E multiple can be regarded as HIGHor LOW unless it is measured relative to a stock’s underlying earnings growth potential." The PEG, hence,becomes an important yardstick for valuation of growth.
PEG 1994
Low
1635
15
Pric
e Pe
rfor
man
ce
34
MCap. CAGR (45.2%)MCap. CAGR (30.6%)
MCap. CAGR (13.4%) MCap. CAGR (15.6%)
QIQII
QIII QIV
CastrolHLLNestleGlaxo
Bajaj AutoBataSB PharmaExide
InfosysSatyamPTL, HeroHonda
Blue StarIPCLBHELPentasoft
137%
25%
0%
Low (0.01)High (10.54) Median (0.83)
Earnings CAGR (28.3%) Earnings CAGR (26.9%)
Earnings CAGR (27.2%) Earnings CAGR (51.3%)

16
C M Y K
Wealth Creators ~ Effect of Profitable Growth on Price Performance
Low (0.01)
The ‘MOSt-Inquire 100’ have been arranged on the basis of their PEG i.e. the ratio of their P/E multiplesas on 1994 to their earnings CAGR during 1994-99.
The group has been divided into two parts on the basis of their median PEG of 0.83. Companies with aPEG above 0.83 are denoted as 'HIGH PEG' stocks and those below 0.83 as 'LOW PEG' stocks.
The groups have then been further sub-divided on the basis of the median RoE of 24% at the end of1999.
ObservationsMedian CAGR of the market capitalisation of Quadrant I is the highest at 46% p.a.
ConclusionThe fastest wealth creators are, thus, companies purchased at LOW PEG ratios and at discounts to theirterminal RoE which is reflected in Quadrant I.
ObservationsQuadrant III recorded the least returns at 12.2% p.a.
ConclusionStocks bought at high PEG but with declining RoE do not provide good returns.
High (10.54)
H = High M = Median L = Low
PEG 1994
Low
2426
24
RoE
199
9
26
CAGR
H - 88.8
M - 12.2
L - 4.0
CAGR
H -101.8
M - 21.8
L - 7.5
CAGR
H - 43.6
M - 24.1
L - 6.5
CAGR
H -136.9
M - 46.0
L - 21.3
QII
QIII QIV
QI
Median (0.83) 64%
24%
-23%

17
C M Y K
Some thoughts for the future
Though the past is a guide to the future, an investor's quest is to identify future wealthcreators. A few companies that can emerge as future wealth creators have beenmodelled as per the PEG/RoE matrix presented earlier.
LowHigh PEG
Low
RoE
QII
QIII QIV
QI
Some trends in the future which could very significantly influence business performanceand their valuations are outlined below.
Ø The age and income profile of the Indian population and its irreversible nature,can trigger a huge revolution in the consumer goods sector. Businesses builtupon a strong consumer franchise could hence flourish.
Ø The New Economy businesses such as IT, multimedia and entertainment arelikely to display very high growth rates. Such high rates of growth are likely toredefine business valuations. However, the one caveat, we would like to offeris the sustainability of the present valuations is questionable.
Ø Market capitalisation has become the barometer of wealth creation. Corporatesengaged in traditional businesses too, would increasingly orient their actions toenhance market capitalisation.
Ø Information technology, as a business, would drive the efficiency of otherbusinesses. But, in the process, it is likely to become an engine of growth.
Ø Valuation of stocks in the domestic market will be impacted by global valuations.
Wipro (2.8, 36%)HLL (1.6, 56%)Infosys (2.6, 26%)
Asian Paints (0.7, 27%)Hero Honda (0.4, 40%)Mico (0.7, 24%)Electrosteel (0.3, 35%)
Figures in brackets represent estimated 1 year forward PEG, RoE respectively.RoE of Infosys computed without adjustments for cash holdings.
Hence, look for stocks with:1. Earnings growth >25% p.a.2. RoE / RoCE >25%.3. PEG well below 1.0.

18
C M Y K
DUPONT 1999 DUPONT 1994 CAGR (94-99)%
Inquire Company NP/ Sales/ Asset / NP/ Sales/ Asset / WealthRank Name Sales Asse ts Equity Sales Asse ts Equity Created Earnings
1 Satyam Computer 19.3 1.0 2.2 37.5 0.3 1.0 136.9 91.52 Wipro 6.3 2.5 1.7 2.9 2.2 2.7 122.8 75.93 BFL Software 25.4 1.9 1.0 13.4 0.2 1.0 117.1 186.44 Infosys Tech. 26.6 0.9 1.0 27.9 1.1 0.9 101.8 75.65 Information Tech. 29.6 1.1 1.1 23.8 1.1 1.0 100.0 44.56 Fujitsu ICIM 10.1 0.8 1.7 0.8 2.4 2.1 88.8 25.17 NIIT 23.7 1.3 1.2 21.9 1.2 1.2 80.5 51.68 Amara Raja Batteries 27.3 1.2 1.1 9.2 0.6 4.0 75.9 98.39 Pentafour Software 22.7 0.9 1.1 25.2 1.1 1.2 62.5 71.610 DSQ Software 8.8 1.2 2.2 8.8 0.4 2.2 60.3 62.511 Vikas WSP 25.8 0.9 1.6 18.2 0.9 0.9 59.1 85.812 Swaraj Engines 12.7 2.9 1.3 8.6 2.9 1.5 54.6 45.413 Silverline Inds. 37.4 1.5 0.5 22.8 0.8 1.0 53.8 42.614 Tata Infotech 11.8 2.2 1.1 11.3 2.4 1.1 49.6 28.615 India Nippon Elec. 12.1 2.1 1.3 11.4 1.9 1.8 49.4 34.616 Rolta India 36.1 0.5 1.5 31.1 0.2 1.4 48.0 46.917 HCL Infosystems 6.6 2.6 1.7 5.4 2.8 1.3 46.3 23.718 Hero Honda Motors 7.9 4.4 1.1 4.2 3.3 1.8 45.8 51.019 Punjab Tractors 13.2 3.2 1.0 6.5 2.6 1.3 44.7 48.920 Tata Elxsi 2.9 2.3 1.3 n.a. 0.4 3.2 44.2 56.721 Digital Equipment 22.0 2.9 1.0 1.4 1.9 1.6 43.6 99.722 Indian Shaving 9.3 2.0 1.3 n.a. 1.1 1.2 41.6 36.123 Moser Baer (I) 20.2 0.6 2.0 14.2 32.3 0.1 40.9 81.124 Abbott Labs (I) 0.4 2.5 2.7 4.3 3.7 1.3 40.4 (30.1)25 Raasi Cement 5.8 1.7 1.7 0.6 1.4 5.2 39.5 75.026 Infar (India) 5.9 2.5 1.6 5.2 2.3 1.7 39.1 21.427 Monsanto Chem. 9.8 2.6 1.3 5.1 6.5 1.0 39.0 53.228 TVS Electronics 1.3 1.7 2.1 4.2 1.9 2.6 38.8 (11.1)29 PSI Data System 14.3 2.8 1.3 11.9 2.0 1.8 38.2 22.430 Navneet Publications 15.6 1.5 1.1 5.1 2.4 2.8 37.2 58.831 BurroughsWellcome 13.7 1.6 1.0 3.6 2.3 1.6 35.1 35.532 Hindustan Inks 15.7 1.5 1.6 11.0 1.3 2.5 34.2 63.833 Glaxo (India) 10.9 2.4 1.0 2.0 3.0 2.0 33.0 53.034 Mastek 14.9 1.4 1.2 19.9 1.1 1.1 32.6 21.935 Balaji Indl. Corp. 0.9 1.0 4.3 3.9 3.6 1.9 31.7 10.736 Elect. Steel Cast. 16.2 1.3 1.6 5.6 1.1 2.2 31.2 60.837 Zee Telefilms 27.0 0.9 1.3 40.3 0.5 1.0 30.6 46.038 Cadbury India 5.9 2.1 1.1 4.8 1.9 1.3 30.1 25.339 Britannia Inds. 3.9 3.8 1.8 2.8 4.6 1.3 29.6 27.240 Carrier Aircon 8.8 3.4 1.0 6.0 1.9 1.6 29.5 55.041 Rhone-Poulenc (I) 14.6 2.3 1.1 1.2 1.1 5.7 29.4 87.742 Madras Aluminium 30.4 1.3 1.0 n.a. 0.0 (0.8) 29.1 30.243 Global Tele-Systems 11.8 1.0 2.0 4.1 2.8 4.5 28.6 65.644 Thomas Cook (I) 23.9 0.6 1.8 24.1 0.8 1.8 27.4 19.045 Berger Paints 6.5 1.9 1.7 2.3 2.9 2.3 26.8 48.846 Pfizer 5.3 3.0 1.0 5.4 2.3 1.9 26.7 4.747 Novartis India 10.5 2.6 1.0 3.4 2.7 1.6 26.5 38.148 E Merck (India) 10.5 2.3 1.2 3.9 1.8 1.9 25.2 42.149 Pidilite Industries 11.3 1.5 1.6 6.2 1.2 2.3 25.1 33.050 Hindustan Lever 8.5 5.1 1.1 6.2 4.6 1.2 24.9 44.6
Appendix I'MOSt-Inquire 100' ~ Wealth Creators

19
C M Y K
DUPONT 1999 DUPONT 1994 CAGR (94-99)%
Inquire Company NP/ Sales/ Asset / NP/ Sales/ Asset / WealthRank Name Sales Asse ts Equity Sales Asse ts Equity Created Earnings
51 Smith. B. Pharma 8.9 2.8 0.9 7.6 2.3 1.0 24.5 25.652 Intl. Best Foods (2.9) 0.8 3.3 4.9 1.7 1.5 24.3 (210.0)53 TVS Suzuki 6.3 2.9 1.8 6.6 4.3 2.3 24.0 35.454 ITC 17.7 1.0 1.6 8.8 1.7 2.1 23.2 24.855 OTIS Elevator 8.5 2.8 1.0 3.6 2.2 1.0 22.8 42.756 Wartsila NSD 5.7 2.1 1.2 1.6 1.4 2.1 22.5 69.057 CRISIL 34.4 0.8 0.9 37.4 0.6 0.8 22.5 30.158 Munjal Showa 7.7 2.4 1.2 5.0 1.8 1.7 22.4 38.759 Godfrey Phillips 9.6 2.3 1.3 4.8 3.1 1.8 21.3 30.460 Smith. B. Consumer 14.6 2.6 0.9 11.0 2.6 1.1 21.2 31.061 Blue Star 3.4 2.4 1.8 2.5 3.5 1.7 21.1 21.962 Orchid Chemicals 10.9 0.8 2.5 13.8 0.3 2.7 20.7 119.363 Bausch & Lomb 16.5 1.2 1.0 n.a. 0.5 2.7 20.2 411.664 German Remedies 15.5 1.7 1.1 6.8 1.7 1.8 19.2 35.265 BHEL 8.7 2.0 1.0 4.1 1.4 2.2 17.7 31.866 Fulford (India) 3.2 4.7 1.6 1.6 4.5 1.9 17.3 29.967 Cipla 19.5 1.2 1.1 6.4 1.5 2.7 16.5 51.068 Nestle India 5.6 3.0 1.9 6.6 2.1 1.2 16.4 19.469 Henkel Spic (I) (3.4) 0.9 7.7 n.a. 0.0 4.6 16.2 (7.1)70 Dr. Reddy’s Labs. 13.6 0.8 1.2 15.7 2.0 1.3 15.7 15.571 Guj. Gas Company 13.4 1.6 1.5 16.3 1.3 1.8 15.6 20.172 Hoechst Marion 4.2 1.9 1.7 2.8 1.6 2.3 15.2 16.773 Ranbaxy Labs. 11.7 0.8 1.2 11.3 1.3 2.2 14.7 19.774 Sundram Fasteners 9.7 1.2 1.7 5.3 1.5 2.8 13.5 29.675 P&G Hygiene 14.1 2.5 1.1 6.3 1.9 1.2 13.4 29.776 Exide Industries 6.2 1.0 2.6 4.0 1.1 2.6 13.4 38.177 Knoll Pharma 9.1 2.3 1.0 5.1 2.8 1.7 13.0 25.678 Morepen Labs. 13.7 0.7 2.1 16.1 1.3 1.2 12.5 53.479 Jagatjit Industries 5.0 0.9 3.3 3.8 1.2 4.5 11.5 15.380 Birla 3M 6.6 1.6 1.7 1.8 0.9 1.2 11.5 73.681 IPCL 0.9 0.6 1.9 5.3 0.6 2.4 11.2 (19.9)82 Kodak India 1.1 2.3 1.8 2.2 4.0 2.2 10.9 11.083 Sundaram Clayton 9.9 1.2 1.1 5.3 1.3 1.6 10.9 28.384 Essel Packaging 17.2 0.5 1.3 21.8 0.7 2.5 10.4 24.385 Goodyear India 3.1 3.6 0.9 1.3 3.1 1.5 9.7 35.986 Widia India 13.9 1.1 1.2 6.4 1.3 2.0 9.7 34.187 Parke Davis (I) 3.7 2.1 2.5 5.2 4.5 1.3 9.6 (0.4)88 Dabur India 5.7 1.7 2.0 4.6 1.4 1.9 9.5 28.789 Hind Lever Chem. 4.7 4.8 1.3 1.4 14.2 2.0 9.3 68.090 Bajaj Auto 18.2 1.0 1.1 11.0 1.9 1.4 8.6 30.091 Insilco 10.0 0.6 1.4 n.a. 0.3 3.1 7.5 36.292 Wyeth Lederle 12.0 2.0 1.0 7.4 2.9 1.2 7.3 23.093 Vesuvius India 20.9 0.9 1.1 n.a. 0.0 0.1 6.9 119.194 Castrol India 19.1 2.1 1.0 10.1 2.0 1.3 6.5 34.695 Nicholas Piramal 11.5 0.9 1.4 15.9 0.5 1.4 6.0 21.896 ICI (India) 7.8 1.8 1.5 5.4 2.6 1.6 5.7 11.797 Bata India 3.5 2.0 2.1 4.3 3.0 1.6 5.3 4.098 Cummins India 11.5 1.5 1.0 8.4 1.9 1.5 4.9 16.999 Reckitt & Colman 7.7 2.8 1.1 7.5 2.1 1.0 4.9 19.1100 Mahindra & Mahindra 6.8 1.2 1.9 4.8 1.5 1.9 4.0 27.5
Appendix I'MOSt-Inquire 100' ~ Wealth Creators (Contd.)

20
C M Y K
Appendix II Wealth Created P/E PE/G * RoE
Inquire Company Amount CAGR 1999 1994 1994 1999 1994Rank Name Rs.Cr. %
24 Abbott Labs (I) 319.1 40.4 n.a. 32.6 (1.1) 2.7 20.4 526.38 Amara Raja Batteries 254.9 75.9 6.7 10.2 0.1 35.6 22.0 4.665 BHEL 3962.2 17.7 10.7 13.5 0.4 17.7 12.0 8.690 Bajaj Auto 3036.4 8.6 13.6 27.6 0.9 20.0 29.8 8.235 Balaji Indl. Corp 225.2 31.7 52.8 7.6 0.7 4.2 26.5 52.097 Bata India 632.0 5.3 59.5 36.9 9.2 14.2 20.7 31.563 Bausch & Lomb 199.4 20.2 25.6 (14.1) 0.1 20.9 (55.0) 11.745 Berger Paints 122.5 26.8 7.4 7.1 0.1 21.0 15.6 11.83 BFL Software 1030.6 117.1 42.7 103.9 0.6 46.9 2.3 42.180 Birla 3M 143.5 11.5 41.8 372.2 5.1 17.8 2.1 90.261 Blue Star 159.0 21.1 13.9 9.8 0.4 15.4 15.1 34.539 Britannia Inds. 1955.2 29.6 68.6 63.8 2.3 26.5 16.2 53.331 BurroughsWellcome 716.8 35.1 36.5 30.2 0.9 22.6 13.4 19.657 CRISIL 186.3 22.5 23.9 33.5 1.1 24.7 17.5 33.738 Cadbury India 1077.0 30.1 60.2 47.1 1.9 13.7 11.4 75.240 Carrier Aircon 365.0 29.5 16.9 38.5 0.7 28.5 18.3 10.694 Castrol India 3481.8 6.5 29.2 43.7 1.3 40.3 26.1 24.867 Cipla 1703.2 16.5 24.3 68.8 1.3 25.5 25.7 67.598 Cummins India 300.6 4.9 18.8 32.1 1.9 17.9 24.5 33.688 Dabur India 736.9 9.5 37.1 79.0 2.7 19.2 12.0 87.121 Digital Equipments 1108.6 43.6 23.4 86.8 0.9 63.9 4.3 95.170 Dr. Reddy’s Labs. 1339.8 15.7 44.1 30.9 2.0 13.5 42.8 78.010 DSQ Software 771.0 60.3 43.3 49.5 0.8 22.5 7.8 71.248 E Merck (India) 802.6 25.2 45.2 89.8 2.1 28.4 13.3 37.536 Elect. Steel Cast. 196.5 31.2 4.3 8.2 0.1 34.8 13.9 14.584 Essel Packaging 163.6 10.4 15.8 17.1 0.7 12.2 40.0 36.376 Exide Industries 353.6 13.4 18.4 33.1 0.9 15.6 11.8 19.06 Fujitsu ICIM 758.1 88.8 254.8 21.1 0.8 13.8 3.9 880.966 Fulford (India) 130.6 17.3 57.5 88.5 3.0 23.9 13.6 42.164 German Remedies 366.4 19.2 23.7 46.0 1.3 30.1 20.5 27.633 Glaxo (India) 4631.6 33.0 63.3 85.2 1.6 26.8 11.8 45.643 Global Tele-Systems 603.8 28.6 12.3 5.0 0.1 22.9 51.5 89.659 Godfrey Phillips 508.9 21.3 17.1 23.7 0.8 29.5 26.4 11.585 Goodyear India 104.8 9.7 14.9 13.8 0.4 10.4 6.0 19.471 Guj. Gas Company 262.3 15.6 18.3 19.8 1.0 32.7 37.5 26.617 HCL Infosystems 1693.2 46.3 34.1 14.0 0.6 29.4 19.1 43.269 Henkel Spic (I) 285.0 16.2 (86.4) (15.5) 2.2 (22.6) (37.8) n.a.18 Hero Honda Motor 2952.3 45.8 28.8 35.2 0.7 40.4 25.0 35.989 Hind. Lever Chem. 361.2 9.3 15.8 76.5 1.1 28.8 39.2 15.532 Hindustan Inks 106.0 34.2 5.9 12.8 0.2 36.4 35.2 13.650 Hindustan Lever 34109.6 24.9 56.0 84.4 1.9 47.6 33.0 70.472 Hoechst Marion 821.3 15.2 73.6 73.4 4.4 13.7 10.1 112.181 IPCL 1178.6 11.2 93.7 13.7 (0.7) 1.0 7.8 97.996 ICI (India) 230.3 5.7 14.5 18.7 1.6 21.5 21.9 13.415 India Nippon Elec. 142.9 49.4 19.3 15.6 0.5 31.7 38.9 20.322 Indian Shaving 1791.1 41.6 123.6 (50.9) 0.2 24.6 (20.2) 159.726 Infar (India) 191.7 39.1 38.9 30.8 1.4 23.9 20.0 36.15 Information Tech. 880.4 100.0 24.5 2.9 0.1 37.6 26.5 160.14 Infosys Tech. 9145.4 101.8 71.5 26.9 0.4 23.5 28.2 362.191 Insilco 109.3 7.5 47.6 (13.5) 0.1 8.8 (27.5) 47.9
'MOSt-Inquire 100' ~ Wealth Creators (Alphabetically listed)
LatestP/E
(02.02.2000)
* Computed using 1994 P/E & 5-year earnings CAGR between 1994 - '99.

21
C M Y K
Appendix II'MOSt-Inquire 100' ~ Wealth Creators (Contd.)
Wealth Created P/E PE/G * RoE
Inquire Company Amount CAGR 1999 1994 1994 1999 1994Rank Name Rs.Cr. %
52 Intl. Best Foods 117.1 24.3 (121.0) 33.0 (0.2) (7.2) 11.9 n.a.54 ITC 15590.6 23.2 37.9 38.6 1.6 28.8 32.0 28.779 Jagatjit Inds. 245.6 11.5 21.4 12.1 0.8 14.8 20.6 16.977 Knoll Pharma 504.6 13.0 41.9 70.0 2.7 21.0 24.6 32.782 Kodak India 106.6 10.9 48.4 25.3 2.3 4.4 18.9 106.042 Madras Aluminium 113.9 29.1 2.5 (1.7) 0.0 40.1 19.2 8.8100 Mahindra & Mahindra 583.7 4.0 10.3 22.8 0.8 15.4 13.4 24.834 Mastek 213.1 32.6 34.0 19.9 0.9 24.1 25.2 420.627 Monsanto Chem. 233.2 39.0 25.6 33.0 0.6 32.3 33.2 20.378 Morepen Labs. 128.1 12.5 8.0 15.1 0.3 19.0 25.9 41.323 Moser Baer (I) 178.0 40.9 9.6 3.8 0.0 25.2 26.9 46.258 Munjal Showa 100.1 22.4 13.2 25.0 0.6 22.0 15.6 10.830 Navneet Publications 335.2 37.2 20.4 9.7 0.2 25.2 34.1 47.068 Nestle India 2883.6 16.4 64.4 76.2 3.9 31.2 15.9 48.395 Nicholas Piramal 703.3 6.0 25.5 25.0 1.1 14.7 10.6 39.07 NIIT 4422.2 80.5 44.6 30.8 0.6 37.9 29.2 73.147 Novartis India 2145.0 26.5 39.8 55.2 1.4 26.9 14.9 55.462 Orchid Chemicals 143.9 20.7 7.6 84.8 0.7 20.9 10.4 17.855 OTIS Elevator 329.8 22.8 24.4 50.9 1.2 24.2 8.1 25.975 P&G Hygiene 973.0 13.4 38.1 77.5 2.6 40.6 14.2 31.087 Parke Davis (I) 188.8 9.6 71.6 43.5 (117.4) 19.4 29.3 77.59 Pentafour Software 2133.3 62.5 21.0 10.7 0.1 21.5 35.4 53.246 Pfizer 1024.8 26.7 120.9 49.7 10.5 15.2 23.2 117.949 Pidilite Inds. 361.6 25.1 14.5 20.8 0.6 27.7 17.8 28.029 PSI Data System 421.1 38.2 82.3 39.3 1.8 54.0 42.5 243.419 Punjab Tractors 2391.8 44.7 22.4 25.6 0.5 42.1 21.7 16.725 Raasi Cement 354.5 39.5 21.1 34.1 0.5 16.8 4.2 68.073 Ranbaxy Labs. 4650.1 14.7 49.4 38.3 1.9 11.1 31.7 73.199 Reckitt & Colman 399.9 4.9 51.2 93.7 4.9 23.8 16.1 32.641 Rhone-Poulenc (I) 418.1 29.4 20.0 148.1 1.7 38.5 7.2 19.216 Rolta India 912.6 48.0 25.1 15.7 0.3 24.3 10.2 70.31 Satyam Computer 4141.5 136.9 58.0 14.8 0.2 43.6 12.1 215.113 Silverline Inds. 1212.4 53.8 33.3 20.8 0.5 27.7 18.7 155.760 Smith. B. Consumer 1955.9 21.2 38.1 53.6 1.7 35.4 30.6 28.551 Smith. B. Pharma 1059.2 24.5 47.2 48.1 1.9 22.4 17.4 27.283 Sundaram Clayton 106.9 10.9 15.1 28.9 1.0 12.5 10.6 41.174 Sundram Fasteners 167.4 13.5 12.4 24.5 0.8 19.9 23.1 25.812 Swaraj Engines 312.1 54.6 22.4 15.7 0.3 49.1 37.5 16.920 Tata Elxsi 332.6 44.2 145.4 (9.5) 0.1 8.8 (68.8) 250.714 Tata Infotech 1782.0 49.6 44.8 21.7 0.8 29.4 28.7 26.944 Thomas Cook (I) 906.5 27.4 72.0 46.4 2.4 24.3 35.4 37.728 TVS Electronics 116.8 38.8 108.8 9.9 (0.9) 4.5 21.0 296.353 TVS Suzuki 748.3 24.0 13.6 20.5 0.6 33.0 65.7 14.293 Vesuvius India 111.3 6.9 22.2 514.6 4.3 21.5 1.5 15.611 Vikas WSP 360.2 59.1 9.9 25.2 0.3 38.5 14.0 36.156 Wartsila NSD 226.6 22.5 32.1 131.1 1.9 14.0 5.0 21.986 Widia India 112.2 9.7 11.8 31.3 0.9 19.3 16.2 11.22 Wipro 18158.7 122.8 164.4 42.0 0.6 27.3 16.7 959.592 Wyeth Lederle 1102.6 7.3 49.2 21.4 0.9 23.9 25.2 34.537 Zee Telefilms 1277.4 30.6 30.7 65.0 1.4 31.9 20.9 387.6
LatestP/E
(02.02.2000)
* Computed using 1994 P/E & 5-year earnings CAGR between 1994 - '99.

22
C M Y K
Appendix III'MOSt-Inquire 100' ~ PEG Table
1 2 3 4 5 6 7 8
10 0.110 0.231 0.364 0.511 0.672 0.849 1.044 1.25820 0.060 0.132 0.218 0.322 0.446 0.596 0.775 0.99030 0.043 0.100 0.173 0.268 0.392 0.553 0.762 1.03440 0.035 0.084 0.153 0.249 0.383 0.571 0.835 1.20450 0.030 0.075 0.143 0.244 0.396 0.623 0.965 1.47860 0.027 0.069 0.138 0.247 0.422 0.701 1.149 1.86470 0.024 0.066 0.136 0.255 0.458 0.803 1.389 2.38580 0.023 0.063 0.136 0.267 0.503 0.928 1.694 3.07190 0.021 0.061 0.137 0.282 0.557 1.080 2.073 3.960100 0.020 0.060 0.140 0.300 0.620 1.260 2.540 5.100
x
V
V
V
V
Years
Gro
wth
%y
Sample calculation
Assume a stock with Re. 1 in earnings bought at a P/E ratio of 50. The initial investment outlay i.e. the pricepaid for the stock is Rs. 50.
Assume further, that the earnings for the stock compound at the rate of 50% p.a. over the next 5 years. Thestock is hence purchased at a PEG of 1.0 (i.e. PE=50, earnings growth rate = 50%).
The cumulative value of such compounded earnings stream at the end of 5 years equates to Rs. 19.60.
Thus, the stock if purchased at Rs. 19.60 would result in capital recovery in 5 years. The PEG at which thestock should be bought is 0.396 (i.e. 19.6/50). Similarly, stocks which can be expected to grow at 100%p.a. can be bought upto a PEG of 0.62, for capital recovery in the same period of 5 years.
The table below indicates the relative PEG one can pay for stocks of companies for varying growth rates (y)leading to recovery of invested capital over a specified period of (x) years.
P/E 10 20 30 40 50 60 70 80 90 100
10 6.21 12.42 18.63 24.84 31.05 37.26 43.46 49.67 55.88 62.0920 4.02 8.04 12.06 16.08 20.09 24.11 28.13 32.15 36.17 40.1930 2.69 5.39 8.08 10.77 13.47 16.16 18.85 21.55 24.24 26.9340 1.86 3.72 5.58 7.44 9.30 11.16 13.02 14.87 16.73 18.5950 1.32 2.63 3.95 5.27 6.58 7.90 9.22 10.53 11.85 13.1760 0.95 1.91 2.86 3.81 4.77 5.72 6.68 7.63 8.58 9.5470 0.70 1.41 2.11 2.82 3.52 4.23 4.93 5.63 6.34 7.0480 0.53 1.06 1.59 2.12 2.65 3.18 3.70 4.23 4.76 5.2990 0.40 0.81 1.21 1.62 2.02 2.42 2.83 3.23 3.63 4.04100 0.31 0.63 0.94 1.25 1.56 1.88 2.19 2.50 2.81 3.13
x VV
V
V
Gro
wth
%y
PEG table
PE tableThe table below indicates the 5-year forward PE for stocks bought at current PE(x) for earnings growth (y)

C M Y K
Buy : > 15% Add : 5% to 15% Hold : - 5% to + 5% Reduce : - 15% to - 5% Sell : < - 15% (all relative to BSE Sensex)
For more copies or other information contact Motilal Oswal - Inquire Research Call: (9122) 207 3809/1379 Fax (9122) 207 6686E-Mail: [email protected]
For Sales Call: (9122) 281 2500 (Institutional: Nilesh Jain, Retail: Ajay Punjabi)This document is for information purposes only. In no circumstances should it be used or considered as an offer to sell or a solicitation of any offer to buy or sell the securities or commodities
mentioned in it. The information in this document has been obtained from sources believed reliable, but we do not represent that it is accurate or complete, and it should not be relied upon as such.
N O T E S