A study on vessel deficiency risk assessment based on PSC ...
67
World Maritime University World Maritime University The Maritime Commons: Digital Repository of the World Maritime The Maritime Commons: Digital Repository of the World Maritime University University Maritime Safety & Environment Management Dissertations Maritime Safety & Environment Management 8-27-2017 A study on vessel deficiency risk assessment based on PSC A study on vessel deficiency risk assessment based on PSC inspection data from Tokyo MOU inspection data from Tokyo MOU Jingfeng Wang Follow this and additional works at: https://commons.wmu.se/msem_dissertations Part of the Public Administration Commons, and the Risk Analysis Commons This Dissertation is brought to you courtesy of Maritime Commons. Open Access items may be downloaded for non-commercial, fair use academic purposes. No items may be hosted on another server or web site without express written permission from the World Maritime University. For more information, please contact [email protected].
Transcript of A study on vessel deficiency risk assessment based on PSC ...

World Maritime University World Maritime University
The Maritime Commons: Digital Repository of the World Maritime The Maritime Commons: Digital Repository of the World Maritime
University University
Maritime Safety & Environment Management Dissertations Maritime Safety & Environment Management
8-27-2017
A study on vessel deficiency risk assessment based on PSC A study on vessel deficiency risk assessment based on PSC
inspection data from Tokyo MOU inspection data from Tokyo MOU
Jingfeng Wang
Follow this and additional works at: https://commons.wmu.se/msem_dissertations
Part of the Public Administration Commons, and the Risk Analysis Commons
This Dissertation is brought to you courtesy of Maritime Commons. Open Access items may be downloaded for non-commercial, fair use academic purposes. No items may be hosted on another server or web site without express written permission from the World Maritime University. For more information, please contact [email protected].
i
WORLD MARITIME UNIVERSITY
Dalian, China
A STUDY ON VESSEL DEFICIENCY RISK
ASSESSMENT BASED ON PSC INSPECTION DATA
FROM TOKYO MOU
By
WANG JINGFENG
The People’s Republic of China
A research paper submitted to the World Maritime University in partial fulfillment
of the requirements for the award of the degree of
MASTER OF SCIENCE
(MARITIME SAFETY AND ENVIRONMENTAL MANAGEMENT)
2017 Copyright SD1719, 2017
ii
DECLARATION
I certify that all the material in this research paper that is not my own work has been
identified and that no material is included for which a degree has previously been
conferred on me.
The contents of this research paper reflect my own personal views, and are not necessarily
endorsed by the University.
Signature: ……XXXX…..
Date: ………....July 3rd
2017……..
Supervised by: XXXX
XXXX
Assessor: ………………………………………
Co- Assessor: …………………………………..

iii
ACKNOWLEDGEMENT
This paper is completed under the guidance of my supervisor Prof. Wang Fengwu from
DMU. In the process of writing this paper, Prof. Wang gave me a lot of help and support
about the choice of research topic, structure of the paper and the content of the article.
And before my dissertation was finalized, Prof. Wang put forward suggestions that are of
great use for my paper. I would like to express our heartfelt thanks to Prof. Wang.
Besides, thank our teachers —professors and experts in WMU and DMU who use their
knowledge and wisdom to teach me how to think and what I should do in my work.
Knowledge acquired in this one-year’s study would be the wealth of my whole life.
In the paper collection and writing process, I also received selfless support from my
colleagues in Lianyungang MSA. Now I’d like to take this opportunity to express my
gratitude!
I’m really honored to have the opportunity to return to my alma mater to continue my
study. Thanks to Lianyungang MSA and WMU, I can finally grasp this chance to
improve myself. This one-year study will be an unforgettable experience in my life.
Friendship with teachers and classmates I met here would last forever. Finally, my
partners in Group 2, thanks.

iv
ABSTRACT
Title: A Study on Vessel Deficiency Risk Assessment Based on PSC Inspection Data
from Tokyo MOU
Degree: Master of Science (M.Sc)
The rapid development of the shipping industry has brought great challenges to ship
supervision for the Maritime Safety Department in every country or region. The increase
in the number of ships, as well as the implementation of the new maritime conventions,
have created a contradiction between the limited regulatory resources and the growing
number of regulatory objects. At this stage of the mechanism for ship selection, it
narrows down the number of target ships to a certain range, but it is still difficult to meet
the growing regulatory requirements. Therefore, seeking a more optimized risk
assessment of ship deficiencies has become an inevitable problem for Port State
Inspection for all States.
This paper introduces the 5-year PSC inspection data from Tokyo Memorandum, and
analyses the quantity and distribution of ship deficiencies and detainable deficiencies in
detail. And based on the Tokyo Memorandum PSC inspection data, the method of
cluster analysis is used to find out the relationship between the ship’s deficiency risks
and the inherent factors of the ship, thus greatly reducing the number of target ships.
The result of cluster analysis can further screen the ships at berth within the scope of the
competent authorities, and provide the corresponding reference for PSCOs targeting the
ships. However, it is unavoidable that the objects of this analysis may be omitted.
Besides, due to the limitation of the author’s expertise, the result may not reflect the
actual ships completely. But some rules that are obtained are surely helpful in PSC
inspection.
KEY WORDS- Deficiency; PSC; Tokyo MOU; ship risk
v
TABLE OF CONTENTS
DECLARATION...................................................................................................................................ii
ACKNOWLEDGEMENT .................................................................................................................. iii
ABSTRACT ..........................................................................................................................................iv
TABLE OF CONTENTS...................................................................................................................... v
1 Introduction ................................................................................................................................... 1
1.1 Research Background ........................................................................................................ 1 1.2 Purpose of this paper ......................................................................................................... 2
2 Introduction of Asia Pacific Region PSC inspection.................................................................... 3
2.1 Brief introduction of Tokyo-MOU organization ................................................................ 3 2.2 Tokyo Memorandum New Inspection Regime (NIR) general introduction ........................ 4 2.3 Working procedures of PSC inspection ............................................................................. 7 2.4 Applicable Conventions for PSCOs ................................................................................... 9
3 Analysis of PSC Data in Asia-Pacific Region............................................................................. 10
3.1 Introduction of target ship selection system ..................................................................... 10 3.2 Analysis of PSC data from Tokyo MOU........................................................................... 12
3.2.1 Overview on PSC inspections in Asia-Pacific region .............................................. 12 3.2.2 Detainable ships in Asia-Pacific region .................................................................. 14
3.3 Deficiencies distribution .................................................................................................. 15 4 Cluster analysis ............................................................................................................................ 19
4.1 Benefit of cluster analysis ................................................................................................ 19 4.2 K-means cluster analysis.................................................................................................. 20
5 Evaluation of ship deficiencies risk via cluster analysis ............................................................ 22
5.1 Analysis of Flag State - Cluster Analysis ......................................................................... 22 5.1.1 Correlation analysis between parameters and variables in cluster analysis ........... 27 5.1.2 Regression analysis of parameters and variables in cluster analysis ...................... 28
5.2 Analysis of classification society - Cluster Analysis ........................................................ 29 5.3 Analysis of type of ships - Cluster Analysis ...................................................................... 36
6 Conclusion ................................................................................................................................... 39
References ............................................................................................................................................ 41
Annex I: The structure of Tokyo MOU organization ...................................................................... 45
Annex 2: List of certificates and documents ..................................................................................... 46
Annex 3: Comparison of Deficiencies by Categories ........................................................................ 50
Annex 4: Comparison of most frequently reserved deficiencies ..................................................... 52
Annex 5: PORT STATE INSPECTIONS PER FLAG .................................................................... 54
Annex 6: PORT STATE INSPECTIONS PER RECOGNIZED ORGANIZATION ................... 57
Annex 7: PORT STATE INSPECTIONS PER SHIP TYPE........................................................... 60

1
1 Introduction
1.1 Research Background
With the development of science and economy, the shipping industry (e.g.: the
increasingly large-scale, specialization and high-speed of ships) plays an increasingly
important role in the development of the national economy. However, the frequent
maritime accidents not only cause a huge loss of economic property and casualties, but
also lead to a huge damage to the environment. So, each country or region have adopted
a series of measures to reduce ship accidents, and to improve the level of safety
management for the shipping industry. Among these, Port State Control (PSC)
inspection is one of the very effective methods.
The background of the Port State Control originated from the issue of the AMOCO
CADIZ with Liberia flag in March 17, 1978, which is grounded at Portsall Reef at 3
miles from the Brittany Peninsula in France, resulting in a serious oil pollution of
230,000 tons of crude oil leakage (Ai Yazhao, 2003). The convenience flag makes the
traditional shipping countries a sharp decline in the shipping industry, coupled with the
rising oil spill accidents. As a result, there are big problems in the implementation of the
International Maritime Conventions. Thus, PSC inspection comes into being.
China is one of the 20 member states of the Tokyo Memorandum and has played an
active role in fulfilling the goals of International Marine Organization—"Safe, Secure
and Efficient Shipping on Clean Oceans". If China wants to change from a big shipping
country to a country with more power on shipping, it is important to develop the
maritime technology and strengthen the supervision of ships and oceans as well. PSC
inspection is a significant part of China's implementation of the International Maritime
Conventions, and it is the last line of defense for the maritime security and pollution
prevention. In recent years, more and more attention is paid to PSC inspection by many
countries.

2
1.2 Purpose of this paper
The author is one of PSC officers in Lianyungang Maritime Safety Administration, who
has an in-depth contact with the PSC inspection work. It is very technical in content,
which not only needs a wealth of experience in the sea of PSCOs, but also needs the
PSCOs familiar with the International Maritime Conventions. However, due to the
increasing number of International Maritime Conventions coming into force, it is hard
for PSCOs to know all of these conventions. For example, there is one maritime
convention — the POLAR CODE and five amendments entering into force (Xu
Chunsong, Han Jialin, 2017). The content of PSC inspection has developed from the
initial concerning of ship navigation safety and marine environmental protection to
concerning the interests and wellbeing of the seafarers. Due to the large content of
International Maritime Conventions, there is more time and strength needed in the
process of PSC inspection, which leads to the dropping of the inspection on some
sub-standard ships because of the tight sailing date. For example, Lianyungang, where
the author works, has such a phenomenon that the D.P.R. of Korea flag or other
convenience flag with Korean crew ships reach the port during the weekends when the
PSC inspection station is not on duty under ship agency’s arrangements in order to
escape from the PSC inspection. This is clearly contrary to the original intention of the
PSC inspection.
I believe that the inspection of the ship does not need to be exhaustive. While
maintaining the normal inspection coverage, it is urgent to improve the efficiency of
inspection. In this paper, I will analyze the data of Tokyo MOU PSC in recent 5 years,
and analyze the inherent points of the ships, such as the flag, the management company,
the classification society, the ship type, tonnage, etc. Through the analysis of these
elements, results will be obtained as for where the ship deficiencies exists and what
ships should be inspected thoroughly, achieving a targeted PSC inspection and changing
the drawbacks of current PSC inspection.

3
2 Introduction of Asia Pacific Region PSC inspection
2.1 Brief introduction of Tokyo-MOU organization
The Tokyo Memorandum began operation on 1 April 1994 and now has 20 member
States, five observer States and seven international observing organizations (Annex 1).
“The Tokyo MOU is one of the most active regional port State control (PSC)
organizations in the world. The organization consists of 20 member Authorities in the
Asia-Pacific region. The main objective of the Tokyo MOU is to establish an effective
port State control regime in the Asia-Pacific region through co-operation with its
members and agreement of their activities, to eliminate substandard shipping so as to
promote maritime safety, to protect the marine environment and to safeguard working
and living conditions on board.
Tokyo MOU strives to:
- develop and maintain effective and efficient PSC system in the region;
- enhance the status and performance of the MOU;
- promote joint initiatives and co-operation with other regional PSC regimes; and
- improve transparency, communication and relationship with the industry.” (Tokyo
MOU website)

4
Picture 2-1: Tokyo MOU organizational structure
Source: Tokyo MOU website http://www.tokyo-mou.org/organization/organizational_
structure.php
2.2 Tokyo Memorandum New Inspection Regime (NIR) general introduction
The past inspection regime of Tokyo MOU is based on the ship's target factor and risk to
determine the priority inspection of the PSC. The New Inspection Regime of Tokyo
MOU highly draws on the Paris MOU target ship selection mechanism and now the
Tokyo MOU NIR divides the ship into 3 groups: low-risk ships, medium-risk ships and
high-risk ships. The inspection window were 9 to 18 months, 5 to 8 months, 2 to 4
months separately (Table 2-1). When the ship’s inspection window is open, PSCOs may
carry out PSC inspection for the target ship. In other words, ships may be inspected
because they are within the time window of inspection (Priority II). When the date is
5
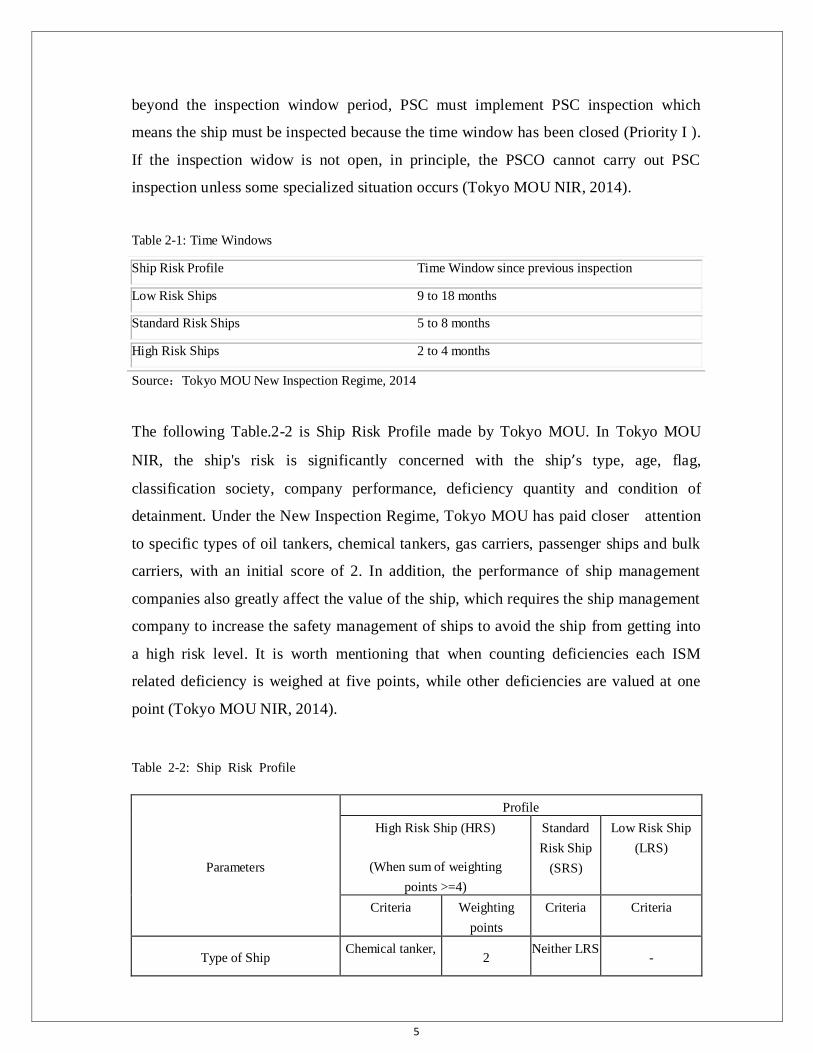
beyond the inspection window period, PSC must implement PSC inspection which
means the ship must be inspected because the time window has been closed (Priority I ).
If the inspection widow is not open, in principle, the PSCO cannot carry out PSC
inspection unless some specialized situation occurs (Tokyo MOU NIR, 2014).
Table 2-1: Time Windows
Ship Risk Profile Time Window since previous inspection
Low Risk Ships 9 to 18 months
Standard Risk Ships 5 to 8 months
High Risk Ships 2 to 4 months
Source:Tokyo MOU New Inspection Regime, 2014
The following Table.2-2 is Ship Risk Profile made by Tokyo MOU. In Tokyo MOU
NIR, the ship's risk is significantly concerned with the ship’s type, age, flag,
classification society, company performance, deficiency quantity and condition of
detainment. Under the New Inspection Regime, Tokyo MOU has paid closer attention
to specific types of oil tankers, chemical tankers, gas carriers, passenger ships and bulk
carriers, with an initial score of 2. In addition, the performance of ship management
companies also greatly affect the value of the ship, which requires the ship management
company to increase the safety management of ships to avoid the ship from getting into
a high risk level. It is worth mentioning that when counting deficiencies each ISM
related deficiency is weighed at five points, while other deficiencies are valued at one
point (Tokyo MOU NIR, 2014).
Table 2-2: Ship Risk Profile
Parameters
Profile
High Risk Ship (HRS)
(When sum of weighting
points >=4)
Standard
Risk Ship
(SRS)
Low Risk Ship
(LRS)
Criteria Weighting
points
Criteria Criteria
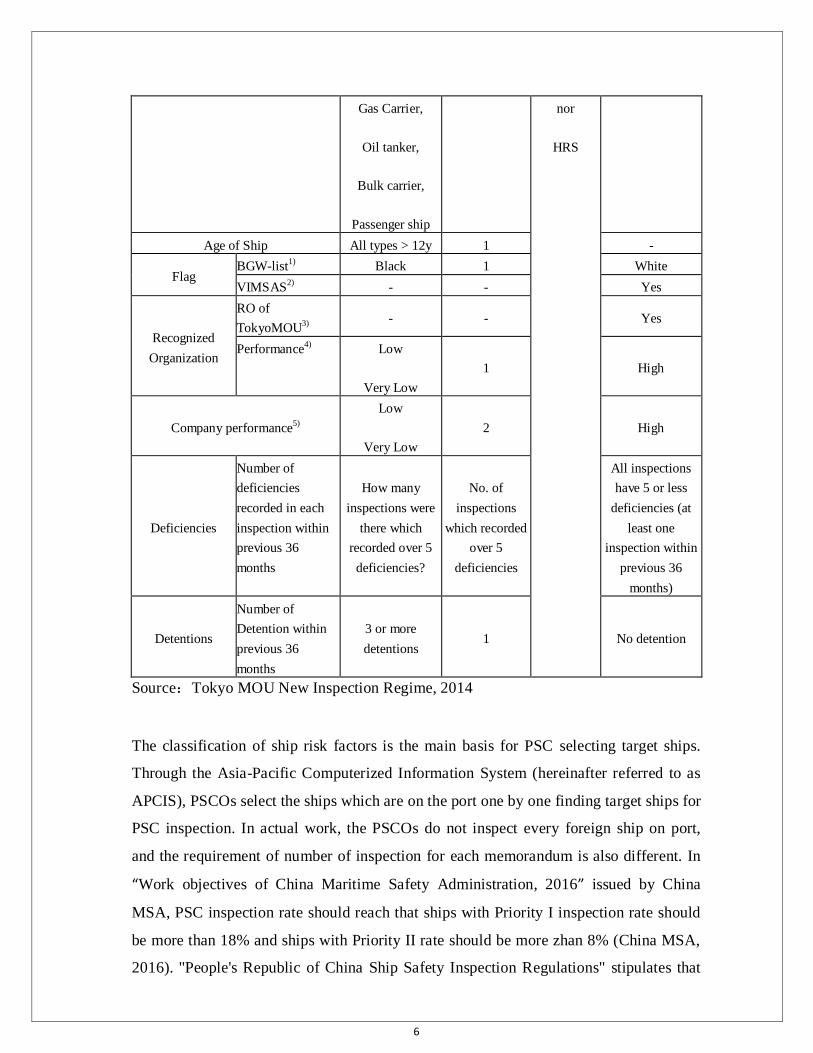
Type of Ship Chemical tanker,
2 Neither LRS
-
6
Gas Carrier,
Oil tanker,
Bulk carrier,
Passenger ship
nor
HRS
Age of Ship All types > 12y 1 -
Flag BGW-list
1) Black 1 White
VIMSAS2)
- - Yes
Recognized
Organization
RO of
TokyoMOU3)
- - Yes
Performance4)
Low
Very Low
1 High
Company performance5)
Low
Very Low
2 High
Deficiencies
Number of
deficiencies
recorded in each
inspection within
previous 36
months
How many
inspections were
there which
recorded over 5
deficiencies?
No. of
inspections
which recorded
over 5
deficiencies
All inspections
have 5 or less
deficiencies (at
least one
inspection within
previous 36
months)
Detentions
Number of
Detention within
previous 36
months
3 or more
detentions 1 No detention
Source:Tokyo MOU New Inspection Regime, 2014
The classification of ship risk factors is the main basis for PSC selecting target ships.
Through the Asia-Pacific Computerized Information System (hereinafter referred to as
APCIS), PSCOs select the ships which are on the port one by one finding target ships for
PSC inspection. In actual work, the PSCOs do not inspect every foreign ship on port,
and the requirement of number of inspection for each memorandum is also different. In
“Work objectives of China Maritime Safety Administration, 2016” issued by China
MSA, PSC inspection rate should reach that ships with Priority I inspection rate should
be more than 18% and ships with Priority II rate should be more zhan 8% (China MSA,
2016). "People's Republic of China Ship Safety Inspection Regulations" stipulates that

7
every ship’s law enforcement activities requires two persons. Take Lianyungang MSA
for example, there are six PSCOs in PSC inspectors station. Each time, they can be
divided into only three groups to carry out PSC inspection. Apart from half an hour’s
drive from workplace to port, one PSC inspection will take about four hours to complete.
Overall speaking, a complete PSC inspection takes about one business day from
selecting the target ship to the PSC report entry. If the ship is detained, the period of
time required will be longer.
2.3 Working procedures of PSC inspection
On November 30, 2011, the International Maritime Organization (IMO) adopted
Resolution A.1052 (27)—“Port State Control Procedure, 2017” in the 27th general
assembly agenda, which invites all Contracting Governments to implement these Port
State Control procedures when carrying out PSC inspections. The full text of the
procedure replaces“Port State Control Procedure, 1995”,which is the customary use. It
is the second procedure relating to the implementation process of Port State Control
since the Global Port State Surveillance Regional Organization established (Hu Ronghua,
2013). Before PSCOs board the ship, they will give a general look to the appearance of
the ship, such as paint conditions, rotten candles or pitting, rusty spot, etc., to obtain the
initial impression of the ship. After boarding, PSCOs will check the ship's certificate and
the relevant documents at first. If all the certificates of the ship are valid, and the basic
impression and the visual situation of the ship are in good condition, PSCOs will believe
that this ship is managed well, PSC inspection activity will stop and clear report will
be issued to the ship; Otherwise, PSCOs has clear grounds to believe that the equipment
onboard or ship crews does not meet the requirements of the conventions, a detailed
inspection will be carried out. Finally, a PSC report with actions taken will be issued to
the ship according to the inspection results. Picture 2 is the general process of PSC
inspection procedure.

8
Picture 2-2: PSC inspection flow chart
Source: the Author’s drawing according to Resolution A.1052(27), IMO

9
It should be noted that, in the actual PSC inspection work, despite the fact that there are
rules stated in Resolution A1052 (27) and in "People's Republic of China Ship Safety
Inspection Regulations", yet basically there is no initial inspection for the ship, and in
most cases, more detailed inspection would be carried out. We can see that there are 66
certificates that require PSCOs to inspect in ―Procedures for Port State Control, 2011‖
(see Annex 2). These do not include the MLC conventions and polar rules that have
come into force in recent years, and BWM convention which is coming into effect. As a
result, it is more likely that PSCO will need to inspect more certificates on the horizon.
In addition, the Annexes that are given by Resolution A.1052 (27) refer to MARPOL,
SOLAS, STCW, Tonnage, Load Line conventions, the ship’s documents, anti-pollution
equipment, ship structures, life-saving, fire fighting, minimum manning, drills, crew
operations and procedures, etc. In the implementation of international conventions,
PSCOs need to face different types of ships, different ship ages, crews from different
nations, diverse types of ship equipment. So many inspection items mentioned above
make PSCOs exhausted and unable to inspect the ship from all aspects in the inspection
process.
2.4 Applicable Conventions for PSCOs
The laws and regulations for PSC inspection are mainly based on the relevant provisions
of the international conventions, while the states are the parties to these conventions. In
accordance with the provisions of the applicable conventions, the PSC officers may
inspect the foreign vessels arriving at their port. Most of the international conventions
come from two organizations: the International Maritime Organization (IMO) and the
International Labour Organization (ILO). Relevant convections are listed as follows:
―− the International Convention on Load Lines, 1966;
− the Protocol of 1988 relating to the International Convention on Load Lines, 1966, as
amended;
− the International Convention for the Safety of Life at Sea, 1974, as amended;
− the Protocol of 1978 relating to the International Convention for the Safety of Life at
Sea, 1974;

10
− the Protocol of 1988 relating to the International Convention for the Safety of Life at
Sea, 1974;
− the International Convention for the Prevention of Pollution from Ships 1973, as
modified by the Protocol of 1978 relating thereto, as amended;
− the International Convention on Standards for Training, Certification and
Watchkeeping for Seafarers, 1978, as amended;
− the Convention on the International Regulations for Preventing Collisions at Sea,
1972;
− the International Convention on Tonnage Measurement of Ships, 1969;
− the Merchant Shipping (Minimum Standards) Convention, 1976 (ILO Convention No.
147);
− the Maritime Labour Convention, 2006;
− the International Convention on the Control of Harmful Anti-fouling Systems on Ships,
2001; and
− the Protocol of 1992 to amend the International Convention on Civil Liability for Oil
Pollution Damage, 1969.‖ (Tokyo MOU, 2015)
Due to the development and renewal of the maritime convention, the PSC inspection of
the ship is constantly changing with the modifications of conventions, but there is one
standard that the PSC inspection always obeys —―Old ships apply to old rules, new
ships comply with new regulations‖. This means that the PSCOs should not only be
familiar with new conventions, but also know about ancient regulations. This situation
traps PSCOs in trouble. For example, there are two important amendments (81
Amendments, 2000 Amendments), FSA code, FSS code, and ISM, ISPS code in SOLAS
convention. PSCOs should know all about them. Although some of the conventions
seem to be the same, yet in fact there are big differences. All these make it difficult for
PSCOs to remember all the conventions.
3 Analysis of PSC Data in Asia-Pacific Region
3.1 Introduction of target ship selection system
11
Asia Pacific Computerized Information System (APCIS) is an independent computer
information center in Vladivostok, Russia, which was officially launched on January 1,
2000. The data for the database is provided by the members of Tokyo MOU and all data
is available for the members to review to enhance the transparency of the information
(Xu, R.et al., 2007). China PSC Computerized Information System refers to the Chinese
port state monitoring computer information system, the main data from APCIS. The
system can provide PSC inspection report entry, checking and data statistics functions.
In PSC inspection, the selection of target ships is done through this system.
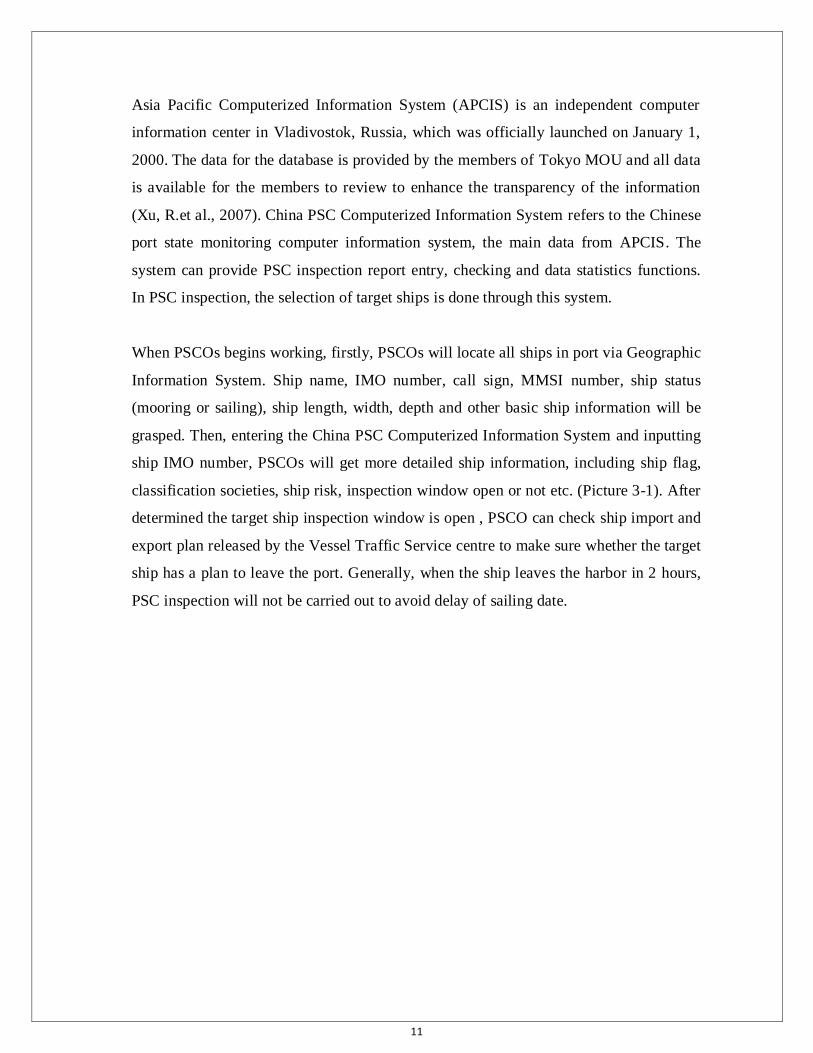
When PSCOs begins working, firstly, PSCOs will locate all ships in port via Geographic
Information System. Ship name, IMO number, call sign, MMSI number, ship status
(mooring or sailing), ship length, width, depth and other basic ship information will be
grasped. Then, entering the China PSC Computerized Information System and inputting
ship IMO number, PSCOs will get more detailed ship information, including ship flag,
classification societies, ship risk, inspection window open or not etc. (Picture 3-1). After
determined the target ship inspection window is open , PSCO can check ship import and
export plan released by the Vessel Traffic Service centre to make sure whether the target
ship has a plan to leave the port. Generally, when the ship leaves the harbor in 2 hours,
PSC inspection will not be carried out to avoid delay of sailing date.
12
Picture. 3-1: CPCIS window
Source: CPCIS, available from: http://218.25.179.238:7001/pscchina/LoginAction.do?action=login
3.2 Analysis of PSC data from Tokyo MOU
3.2.1 Overview on PSC inspections in Asia-Pacific region
Every PSC inspection generates an inspection report that, inter alia, contains detailed
information on the deficiencies noted (including 0 for no deficiency) together with
relevant vessel particulars such as the flag of registry, IMO vessel number, vessel type,
year built, and date of inspection (Cariou, P., Jr, M. Q. M., & Wolff, F. C., 2008).
Although there are a lot of conventions mentioned in Item 2.3, it is impossible that all
these conventions are the key points of PSC inspection. Seven of the most important
conventions in the international regulatory framework for maritime safety serve as the
bases upon which the regime of PSC has been institutionalized. (Domijan-Arneri, M.,
2002). These are SOLAS, MARPOL, Load Lines, STCW, COLREG, TONNAGE,
Minimum Standard Convention (ILO 147) (Ademuni-Odeke, 1997). According to the
Tokyo-MOU PSC Annual Report (2011~2015), this paper will give a brief introduction
on the distribution data of ship deficiencies and detainable deficiencies.

13
Table 3.1: PSC inspection data statistics in Asia-Pacific Region, 2011-2015
Inspection time (year) 2011 2012 2013 2014 2015
No. of inspections 28,627 30,929 31,018 30,405 31,407
No. of inspections with no deficiencies 9,977 11,679 12,228 11,376 12,265
No. of inspections with deficiencies 18,650 19,250 18,790 19,029 19,142
No. of deficiencies 103,549 100,330 95,263 89,560 83,606
No. of detentions 1,562 1,421 1,395 1,203 1,153
Source: the author’s calculation, data from the Tokyo MoU (2011–2015).
Picture 3.2: PSC inspection data in Asia-Pacific region, 2011~2015
Source: the author’s drawing, data from the Tokyo MoU (2011–2015).
In the past five years, there has been an upward trend in PSC inspection number in the
Asia-Pacific region. The number of inspections rose from 28,627 in 2011 to 31,407 by
2015, and the number of ships with deficiencies and ships without deficiencies also
increased accordingly. In the situation of an increase trend in the number of ship PSC
inspections, we should pay attention to two aspects. On the one hand, from the view of
global economic situation, the world economic growth rate is extremely slow, and there
may even be a trend of economic recession. Shipping economy itself is a kind of
staple commodity, which has been seriously influenced by the trend of global economic

14
conditions (Qin Junwei, 2016). From 2013 onwards, there is an obvious decrease in the
number of ships arriving at port. However, because of the weak economic situation, the
shipping market is speeding up to weed out the old age ships. For example, among the
251 ships inspected by the Lianyungang MSA PSC station in 2016, 130 ships are under
10 years old, accounting for 51.8 percent of the total number of PSC inspections, and
there are even 37 ships which has been used for less than 5 years (keel laid after 2012),
taking up to 14.7 percent of the total number of inspected ships. There is a relatively
large advantage for these ships in the PSC inspection, and a large quantity of them
would pass PSC inspection without any deficiencies (Authors' calculation, 2017). On the
other hand, the Tokyo Memorandum's old inspection mechanism is that all ships (except
special circumstances) should receive a PSC inspection every 6 months, while the New
Inspection Regime has a greater change in target ship’s selection system. The Tokyo
MOU NIR came into effect in January 1, 2014 (Sun Yujie, 2013). This also shows that,
in the past five years, more frequent ships are inspected in Asia-Pacific region.
3.2.2 Detainable ships in Asia-Pacific region
Picture 3-3: Number of detentions in Asia-Pacific region, 2011~2015
Source: Author’s drawing, data from the Tokyo MoU (2011–2015).
Different from an upward trend in the total number of PSC inspection, from 2011 to
2015, the number of ship detention is declining. There are more than 1,500 ships
detained in 2011, and then an obvious decreasing trend is seen from then on.
Approximately 100 detained ships are reduced each year, and in 2015, there are only
15
1,153 ships detained. As for the reason, I suppose there are 2 points. As mentioned in
Item 3.2.1, ships with old ages have no competitors in the current shipping market. And
the Tokyo MOU NIR pays more attention to the safety management system of both
ships and ship management companies, which means the seafarers on board and ship
management company should continuously strengthen the safety management in order
to have a better performance to the company.
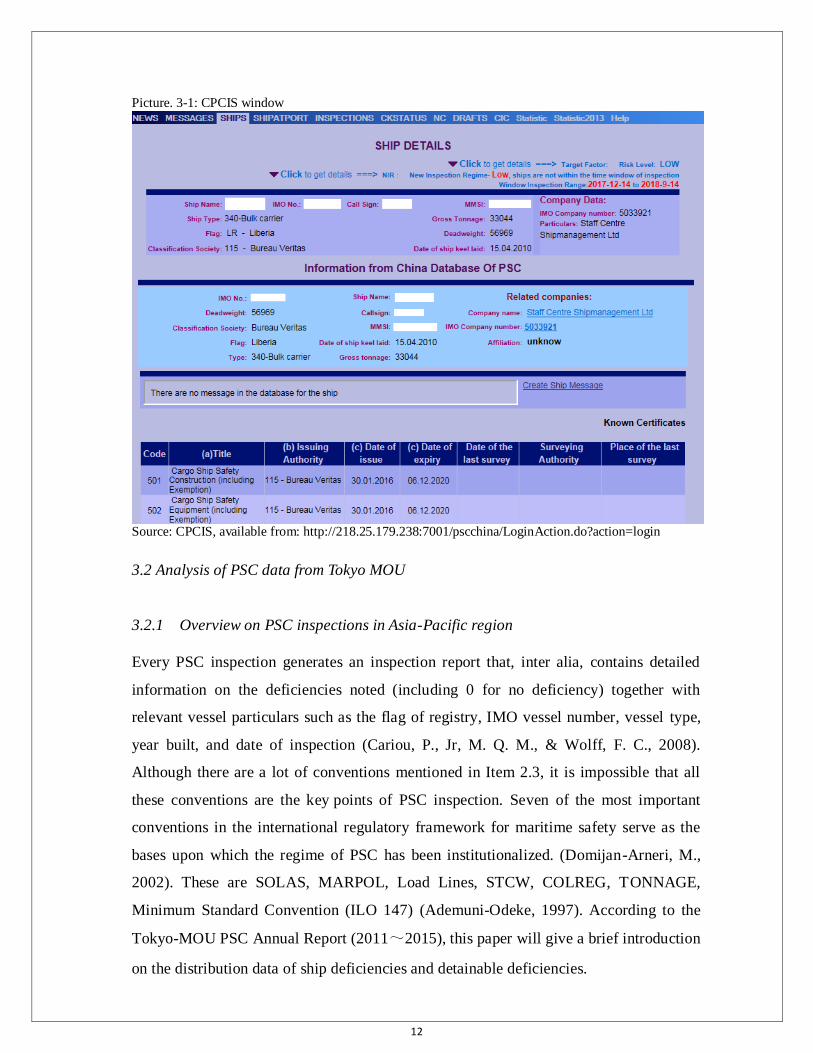
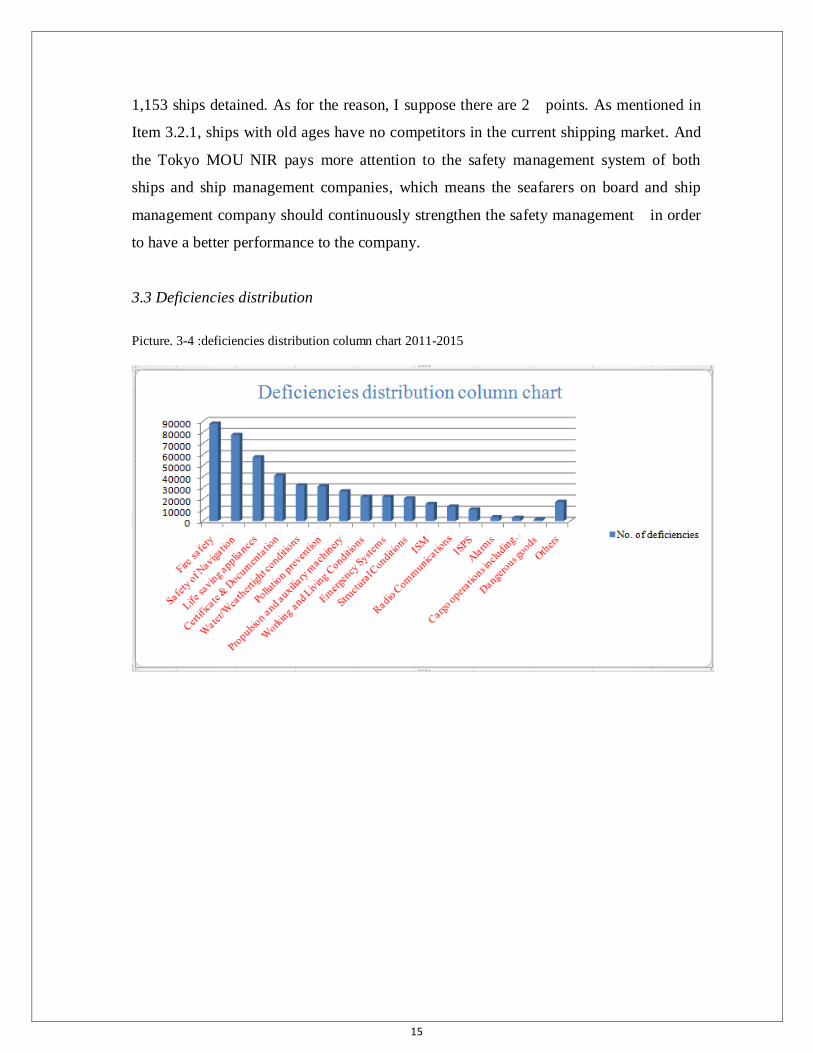
3.3 Deficiencies distribution
Picture. 3-4 :deficiencies distribution column chart 2011-2015

16
Picture 3-5 :deficiencies distribution pie chart 2011-2015
Source : Picture 6 7, Authors’s caculation, data from the Tokyo MOU (2011-2015).
The column chart and pie chart compares figures for deficiencies of different categories
in Tokyo MOU PSC inspection data statistics from 2011 to 2015. It is clear that Fire
Safety is the most concentrated area than any other deficiencies, with 87,972 items
accounting for 18.2 percent of PSC deficiencies. Safety of Navigation occupies the
second place that 77,684 items were found in this 5-year period time, about 2 percent
lower than Fire Safety. Life-saving apparatus is also significant with 11.9% of the total
number of deficiencies. As for Certificate & Documentation, there are plenty of
deficiencies because every convention has its provision about issuing certificates.
Therefore, this item ranks the 4th
position (41,055, 8.5%). In terms of
Water/Watertight conditions, 32,184 deficiencies were found in 5 years, accounting for
6.7%. Pollution prevention (MARPOL) has always drawn PSCOs’ attention, especially
the oil pollution prevention (MARPOL Annex I) and sewage water pollution prevention
(MARPOL Annex IV), the number of this item is a little smaller than Water/Watertight
conditions, with 31,256 deficiencies, followed by Propulsion and auxiliary machinery.
This is because there is plenty of hydraulic equipment in the engine room which may
easily leak. When PSC inspection is carried out, if the engine room could be kept
clean, it will leave a better impression on PSCOs, and the possibility of clear report will
be greater. Although there are only 15,390 ISM deficiencies were found, that is about
5,000 on average, more attention still needs to be paid to this item. PSCOs is very

17
careful about writing ISM deficiencies on report because once there are ISM deficiencies,
there are problems in safety management of the ships. As a consequence, when ISM
deficiency is issued, the ship will be detained in all probability. Worse still, the ship
management company will be affected and additional audit might be carried out for
company to make sure SMS runs well. MLC convention came into effect on August 20,
2013, so there is hardly any figure for this item. Other items, such as ISPS, Radio
Communication, Alarms and so on, occupied less proportion. Here, we will not discuss
them one by one.
Picture 3-6: Most frequently detainable deficiencies column chart
Source : Authors’s caculation, data from the Tokyo MOU (2011-2015)
Picture 3-6 is the column chart that illustrates the most frequently detainable deficiencies
from 2011 to 2015. It is clear that Lifeboats (Life saving apparatus), ISM, Fire-dampers
(Fire safety) and Oil filter equipment are in the detainable deficiencies concentrated area.
These items are mainly related to SOLAS convention Chapter II-1,II-2,III & IX and
MARPOL convention Annex I.
From the Tokyo-MOU's PCS inspection data statistics (2011~2015), Life-saving
apparatus is the most important. Although in PSC inspection, the number of Life-saving
apparatus deficiencies found were less than the figure of Fire safety and Safety of
Navigation yet among a total number of 6,734 detained ships, there are 782 ships
detained because of Life-saving deficiencies, accounting for 11.6 percent and is higher

18
than any others. Especially in some cold area, the lifeboat engine is difficult to be started
because of poor maintenance. Fire safety ranks the second place: 632 ships were
detained due to fire fighting deficiencies. In the PSC inspection in the Asia-Pacific
region, the requirements for engine room fire dampers are very stringent. According to
SOLAS CII / R47, R38 (b), R69 (a), all the main inlets and outlets of ventilation systems
should be able to be closed outside the ventilated area; the operating position of the
closing device should be easily accessible and there should be obvious permanent marks
indicating whether the closing device is in the open position or in the closed position.
The requirement is very clear that the ventilation system should be able to be closed
outside the ventilated area. If not, detention is inevitable. Statistics also show that the
Emergency system is the key point in PSC inspection. The main defective aspects of
Emergency system are: emergency generator failure, emergency fire pump malfunction,
emergency illumination out of order, emergency escape trunk blockage, no signs or
emergency lighting, no emergency steering drills, life saving, fire fighting, failure of oil
spill to meet the requirement of convections, and so on. It is worth mentioning that, ―the
rest time of crews‖ currently draws PSCOs’ attention, especially after MLC
convention came into effect (Wang Qi, 2014). In 2014, Paris MOU and Tokyo MOU
jointly held the ―STCW Convention crew rest time Concentrated Inspection Campaign‖.
According to the Paris MOU announced the CIC result, there were 16 ships that are
severely detained during the campaign (14% of the total number of detention) and 11 of
the 16 detained ships were general cargo ship / multi-purpose ship (70%), 3 bulk carrier
ships (19%), 1 container ship and 1 ship of other type (Bao Junzhong, 2015). In July
2010, a total number of 293 foreign ships received Australia Maritime Safety
Administration’s (AMSA) PSC inspection, of which 23 ships were detained (Huang Zhi,
2011). Among the detained ships, there were eight ships that were given the deficiencies:
“SMS’s failure to ensure watch keeping hours are correctly recorded;Masters unable to
ensure watch keepers are rested as per STCW‖. The rest time of the seafarers is not only
related to the implementation of the STCW and MLC Convention, but also related to
provisions of the ISM. Therefore, in the situation that the ship is detained due to the rest
time of crews, usually coupled by the SMS-related deficiencies .

19
It is true that the ship is a dynamic system with many elements (Raphael Baumler, 2017).
Via analyzing the Tokyo-MOU PSC inspection data, there is no doubt that dealing with
big data is conducive to finding objective laws. In the 251 ships inspected by the
Lianyungang Maritime Safety Administration in 2016, the most frequent deficiencies
were 10-Safety of Navigation,07-Fire safety,11-Life saving appliances, with the figure
227, 225, 154 respectively (Author’s statistics, 2017). This result is highly consistent
with the result analyzed in Chapter 3.3. This shows that the inherent factors of the ships
can be qualitatively analyzed to find the internal rules of these data. The author believes
that the three important elements are: ship’ Flag, classification societies and ship type
determine the number of ship deficiencies and defect-free pass rate. In the next chapters,
this paper will discuss the relationship between the ships’ defects and the three elements
through cluster analysis.
4 Cluster analysis
4.1 Benefit of cluster analysis
A ship has many properties, and in many cases, we cannot predict the status of the ship
management. In the area where the author works, excellent management can make the
ship obtain excellent performance in the PSC inspection. For example, ships under the
management of some famous shipping management company, such as, Maersk Line
Swiss Mediterranean Shipping, France Dafei Shipping, China Taiwan Evergreen
Shipping, Germany Habar Laoard Shipping, China CSCL and other world-renowned
management companies. Because of its ISM system running in place, even if the ship
has an old age, the ship still maintains excellent operating conditions. However, there are
plenty of world's shipping companies whose management quality we cannot control,
which makes the analysis of ship management situation impossible.
However, cluster analysis can classify the ships into different groups according to the
similarity of ship properties to find the relationship between ship property and ship
management. Clustering analysis is better at classifying fuzzy data than other data
analysis methods. In the case of seemingly less relevant data, the relationship between
20
elements is found. It is more intuitive in the selection of ships when the ship’s
management situation and its inherent factors is linked.
4.2 K-means cluster analysis
Cluster analysis is one of the most important data analysis methods that has been widely
used in many applications, including pattern recognition, data analysis, image processing,
and market research (Han, J., Kamber, M., & Chiang, J.,1997). Clustering divides a
group of data objects into multiple classes or clusters. There is a high degree of
similarity for the object in the same class or cluster, and there are huge differences in
different clusters of objects and the optimal number of clusters is unknown beforehand.
This belongs to an unsupervised learning method.
At present, many domestic and foreign scholars have proposed a variety of clustering
methods. Typical clustering methods include: Partitioning Method, Hierarchical Method,
Grid-based Method, Density-Based Method and Model-based Method (Xiang, P. S.,
2011). Among so many clustering algorithms, the k-means algorithm is one of the most
widely used algorithms. Compared with other algorithms, the k-means algorithm has the
characteristics of simple algorithm, fast and stable clustering effect. The algorithm is
relatively scalable and efficient. K-means algorithm is widely used in a wide range of
applications, including image and voice data compression (Chinrungrueng, C., 1993;
Lloyd, S., 1982), data preprocessing of system modeling by radial basis function
network (Moody, J., & Darken, C. J., 2008), task decomposition in heterogeneous
neural network structures (Chinrungrueng, C., 1993), bioinformatics (Jiang, D., Tang, C.,
& Zhang, A., 2004) and other emerging areas. Therefore, it is necessary to study the
optimization of k-means algorithm.
The K-means algorithm divides M data objects into k clusters, where k is the number of
clusters previously set by the user. Let X = { k clusters of M data objects divided by
K-means algorithm }. Suppose X = {x1, x2,„,xm ,„,xM}is a set of M data objects.
The N features of each data object are represented by F ={f1 , f2,„,fn ,„,fN}, then
each data object can be expressed as xm ={xm1, xm2,„,xmn ,„,xmN }, where xmn

21
is the nth attribute value of the mth object. C ={c1 , c2,„,ck ,„,cK} denotes the
kth clustering center, ckn is the set of K clustering centers. ck ={ck1 ,ck2 ,„,ckn ,„,
ckN } represents the kth cluster center of the nth attribute. The dissimilarity
measure between the data object xm and the clustering center ck is called
diss(xm ,ck ). The smaller the diss(xm ,ck ) value is, the greater the likelihood that the
data object xm belongs to the clustering center ck . In general, the Euclidean distance
diss(xm ,ck ) is:
diss xm , ck = diss xmn , ckn Nn=1
(1)
Where diss( xm ,ck )=|xmn , ckn |2 is the dissimilarity of xm and ck on the nth
attribute fn .
According to Eq. (1), the optimal clustering result is found for any data object xm and
its corresponding clustering center ck in the data set, so that the sum of the distance
between the whole data set and the clustering center on its clustering is the smallest:
Minimize S U, c = umk × d xmn , ckn Nn=1
Kk=1
Mm=1
(2)
Clustering center:
ckn = umk ×xmn
Mm =1
umkMm =1
, k=1,2,„,K; n=1,2, „,N
(3)
After several iterations, until the clustering center tends to be stable, it shows that when
the clustering reaches all or local stability, the clustering process is terminated.

22
5 Evaluation of ship deficiencies risk via cluster analysis
This paper analyzes the safety management status of ships through 5 years’ inspection
data, and explores the relationship between the ship flag, the classification society and
the ship’s type with the number of deficiencies. Three indexes (i.e.: the defect-free rate,
the average number of deficiencies and the detention rate) are used to evaluate the ship’s
deficiency situation.
The ship without deficiency rate indicates that the ship is in good condition and that the
index is obtained by the number of defect-free ships divided by the initial number of
inspected ships. The higher the value of this rate, the better managed the ship occupy the
number of inspected ships. The number of mean defects also reflects the quality of the
ship. The data is obtained by dividing the total number of deficiencies by the number of
defective ships. The smaller the number of average deficiency, the better the ship's
condition. Besides, the average number of defects is also a reflection of the management
situation; The detained ships indicate poor quality and the detention rate is obtained by
dividing the detained ships by the total number of inspected ships. The smaller the value
of this index is, the better quality the ships are of.
5.1 Analysis of Flag State - Cluster Analysis
Adopting zero defect rate, the average deficiencies per ship and the detention percentage
(%) are taken as the variables of the cluster analysis. The zero defect pass rate is the
derived field, which is calculated as (No. of inspection -No of inspection with
deficiencies) / No. of inspection. The case marker variable is the categorical variable for
the ―Flag‖. Utilizing k-means clustering analysis algorithm, set k = 3, the analysis results
are as follows:
Table 5-1: Initial clustering center
Cluster
1 2 3
Average deficiencies per ship 11.43 13.00 4.00
Detention percentage (%) 85.71 .00 50.00
Defect-free rate .13 .00 .00
The table represents the initial cluster center, it is a case in general.

23
Table 5-2 : Iteration history1
Iteration Changes in the cluster center
1 2 3 1 2 3
1 .000 10.852 14.193 4 .000 .499 2.477
2 .000 .557 4.406 5 .000 .602 2.222
3 .000 .256 1.597 6 .000 .000 .000
The clustering analysis is a process of iteration and convergence. The default number of
iterations is 100, and it can be seen from Table 5 that the number of iterations of the
clustering process is 6 and the clustering center is provided after each iteration.
Table 5-3: Clusters of Flags
Case NO.
Flag Cluster Distance Case NO.
Flag Cluster Distance Case NO.
Flag Cluster Distance
1 Panama 2 1.698 42 United States 2 3.003 83 United Arab
Emirates (UAE) 2 2.557
2 Hong Kong,
China 2 3.063 43 Bangladesh 2 6.809 84 Solomon Islands 2 2.743
3 Liberia 2 1.811 44 Vanuatu 2 1.987 85 New Zealand 2 3.814
4 Singapore 2 2.497 45 Togo 2 6.73 86 Bahrain 2 4.745
5 Marshall Islands 2 0.647 46 France 2 4.718 87 Samoa 3 5.865
6 Cambodia 2 10.112 47 Portugal 2 0.871 88 Brazil 3 1.64
7 Korea, Republic
of 2 4.448 48 Belgium 2 1.784 89 Chile 2 5.445
8 China 2 4.349 49 Saudi Arabia 2 3.182 90 Falkland Islands
(UK) 2 5.514
1 The convergence is achieved due to the absence of changes or small changes in the cluster center. The
maximum absolute coordinate of any center is changed to .000. The current iteration is 6. The minimum
distance between the initial centers is 36.475.

24
9 Malta 2 2.363 50 Moldova 3 8.302 91 Colombia 3 14.431
10 Viet Nam 2 3.38 51 Saint Kitts
and Nevis 2 7.155 92 Spain 3 3.835
11 Bahamas 2 0.851 52 Switzerland 2 1.624 93 Equatorial
Guinea 2 9.443
12 Antigua and
Barbuda 2 4.416 53 Iran 2 3.197 94 Libya 2 5.557
13 Cyprus 2 2.217 54 Croatia 2 3.809 95 Ecuador 2 7.294
14 Belize 2 4 55 Luxemburg 2 1.251 96 Lithuania 2 5.287
15 Greece 2 1.871 56 Tanzania 3 3.781 97 Ukraine 2 7.542
16 Thailand 2 4.253 57 Curacao 2 1.156 98 Ship's registration
withdrawn 1 0
17 Russian
Federation 2 0.7 58 Sweden 2 4.464 99 Argentina 3 6.371
18 Sierra Leone 3 7.243 59 Barbados 2 3.951 100 Libyan Arab Jamahiriya
2 5.305
19 Malaysia 2 0.616 60 Cook Islands 3 8.763 101 Mauritius 2 5.694
20 Norway 2 1.243 61 Jamaica 2 4.226 102 Ireland 2 6.326
21 United Kingdom
(UK) 2 1.139 62 Niue 3 7.268 103 Tunisia 2 5.306
22 Kiribati 2 6.484 63 Kuwait 2 0.32 104 Finland 2 5.831

25
23 Germany 2 0.457 64 Egypt 3 6.807 105 Mexico 2 6.331
24
Korea,
Democratic
People's Republic
3 9.23 65 Dominica 2 6.651 106 Algeria 3 24.412
25 Philippines 2 4.532 66 Papua New
Guinea 3 1.411 107 Canada 2 5.315
26 Indonesia 3 8.48 67 Saint Kitts
and Nevis 2 8.41 108 Estonia 3 25.059
27 Isle of Man (UK) 2 0.987 68 Georgia 3 3.977 109 Jordan 2 6.058
28 Japan 2 2.668 69 Tonga 3 3.483 110 Bolivia 3 24.581
29 Saint Vincent and
the Grenadines 2 1.664 70 Pakistan 2 2.077 111 Fiji 2 6.948
30 Denmark 2 0.684 71 Sri Lanka 2 2.245 112 Nigeria 2 6.651
31 Netherlands 2 1.392 72 Maldives 2 5.704 113 Bulgaria 2 8.405
32 Italy 2 2.952 73 Myanmar 2 7.938 114 Faroe Islands 2 6.948
33 Tuvalu 2 2.09 74 Israel 2 1.677 115 Gambia 2 6.966
34 Mongolia 3 7.119 75 Palau 2 9.844 116 Iceland 2 5.841
35 Cayman Islands
(UK) 2 1.66 76 Ethiopia 2 2.146 117
Lao, People's
Democratic
Republic
2 6.948
36 Taiwan, China 2 2.205 77 Comoros 3 5.669 118 Lebanon 2 5.319

26
37 India 2 5.824 78 Brunei
Darussalam 3 5.02 119 Montenegro 2 6.329
38 Bermuda (UK) 2 3.242 79 Honduras 3 3.079 120 Romania 2 6.948
39 Vanuatu 2 3.818 80 Australia 2 5.922 121 Saint Helena
(UK) 2 10.038
40 Gibraltar (UK) 2 2.117 81 Peru 3 8.022 122 South Africa 2 6.948
41 Turkey 2 3.374 82 Qatar 2 9.099
From Table5-3 above, it can be seen in different types of flag countries. The first column
stands for the flag country number, the second column for the flag country, the third
column for the classification of the name, and the fourth column for the distance to the
cluster center.
Table 5-5: Final cluster center
Cluster
1 2 3
Average deficiencies per ship 11.43 4.47 7.50
Detention percentage (%) 85.71 5.28 25.67
Defect-free rate .13 .36 .16
Table 5-5 represents the center value of the final cluster for each category. Through this
table, we can see that the second class of defect-free pass rate is high, the average
number of deficiencies and detention rate are low, so this group is an excellent group
compared with others; the first class of defect-free pass rate is low, the average number
of deficiencies and detention rate are higher, so this group is an inferior group; the third
category is in between the first class and the second class, so it is the medium group.
Table.5-6: The final distance of cluster centers
Cluster 1 2 3
1 80.731 60.168
2 80.731 20.615
3 60.168 20.615
Table.8 represents the distance between the different categories.
27
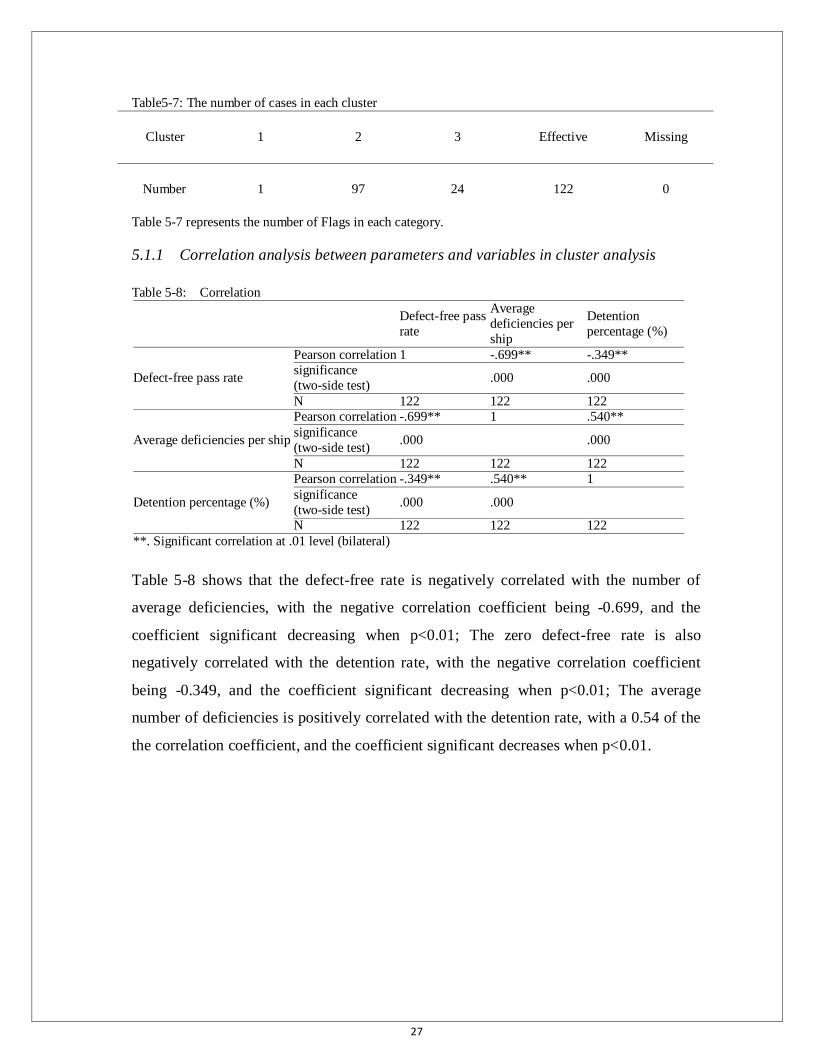
Table5-7: The number of cases in each cluster
Cluster 1 2 3 Effective Missing
Number 1 97 24 122 0
Table 5-7 represents the number of Flags in each category.
5.1.1 Correlation analysis between parameters and variables in cluster analysis
Table 5-8: Correlation
Defect-free pass
rate
Average
deficiencies per
ship
Detention
percentage (%)
Defect-free pass rate
Pearson correlation 1 -.699** -.349**
significance
(two-side test) .000 .000
N 122 122 122
Average deficiencies per ship
Pearson correlation -.699** 1 .540**
significance
(two-side test) .000 .000
N 122 122 122
Detention percentage (%)
Pearson correlation -.349** .540** 1
significance
(two-side test) .000 .000
N 122 122 122
**. Significant correlation at .01 level (bilateral) Table 5-8 shows that the defect-free rate is negatively correlated with the number of
average deficiencies, with the negative correlation coefficient being -0.699, and the
coefficient significant decreasing when p<0.01; The zero defect-free rate is also
negatively correlated with the detention rate, with the negative correlation coefficient
being -0.349, and the coefficient significant decreasing when p<0.01; The average
number of deficiencies is positively correlated with the detention rate, with a 0.54 of the
the correlation coefficient, and the coefficient significant decreases when p<0.01.

28
5.1.2 Regression analysis of parameters and variables in cluster analysis
Picture 5-1: Relationship between the number of average deficiencies and zero defect pass rate.
From this figure, the relationship between the zero defect rate and the number of average
deficiencies can be seen via linear regression, and the regression equation is:
Y=-0.067x+0.66,where X is the number of average deficiencies, and Y is the zero
defect pass rate.

29
Pictrue5-2 :Relationship between the detention rate and zero defect pass rate
From this figure, we can see that the relationship between the zero defect rate and the
detention rate through linear regression, and the regression equation is:
Y=-0.007z+0.388,where X is the detention rate, and Y is the zero defect pass rate.
5.2 Analysis of classification society - Cluster Analysis
Using the detention rate (%) and the Relevant Organization (RO) responsibility
percentage (%) as the variables of the cluster analysis, the case variable is the
―classification society‖. Using k-means clustering analysis algorithm, set k = 3, the
analysis results are as follows:
Table.11: Initial clustering center
Cluster
1 2 3
Detention percentage (%) .00 50.00 66.67
RO responsibility percentage (%) .00 50.00 11.11

30
Table 5-9 : Iteration history2
Iteration Changes in the cluster center
1 2 3
1 7.553 .000 13.355
2 .307 .000 5.633
3 .000 .000 .000
Table 5-10: Clusters of classification
Case NO. Classification
society
Clust
er
Dista
nce
Case
N
O.
Classification
society
Clus
ter
Dista
nce
Case
N
O.
Classification
society
Clus
ter
Dista
nce
1
Alfa Registe
r of
Shippin
g
1 7.247 31
Honduras
Bureau of
Shipping
1 7.247 61
Overseas Marine
Certificati
on
Services
1 4.692
2
Americ
an
Bureau of
Shippin
g
1 4.624 32
Honduras
International
Surveyin
g and Inspectio
n Bureau
1 7.247 62
Panama
Bureau of
Shipping
1 4.806
2 The convergence is achieved due to the absence of changes or small changes in the cluster center. The
maximum absolute coordinate of any center is changed to .000. The current iteration is 3. The minimum
distance between the initial centers is 42.312.

31
3
Americ
an
Registe
r of Shippin
g
1 1.083 33
INCLA
MAR
(Inspecti
on y Classific
ation
Maritime, S. de.
R.L.)
1 9.447 63
Panama Marine
Survey
and
Certification
Services,
Inc.
1 1.706
4
Asia
Classification
Society
1 0.638 34
Indian
Register of
Shipping
1 0.622 64
Panama Maritime
Document
ation
Services
1 2.729
5
Belize
Mariti
me
Bureau Inc.
1 2.487 35
Indonesia
n
Classific
ation Bureau
1 13.684 65
Panama
Maritime
Surveyors
Bureau Inc
1 5.146
6
Bulgarski
Korabe
n
Registar
3 2.778 36
Intermaritime
Certificat
ion
Services, S.A.
1 0.844 66
Panama
Register
Corporatio
n
1 0.802
7
Biro
Klasifikasi
Indones
ia
1 7.734 37
Marconi
Internatio
nal
Marine Company
Ltd.
1 7.247 67
Panama
Shipping
Certificate Inc.
1 1.907

32
8
Bulgars
ki
Koraben
Regista
r
3 2.778 38
Internatio
nal Maritime
Register
1 5.285 68
Panama
Shipping Registrar
Inc.
1 2.519
9
Bureau
Securitas
1 2.023 39
International Naval
Surveys
Bureau
1 3.003 69
Phoenix Register
of
Shipping
1 1.425
10 Bureau
Veritas 1 3.196 40
Internatio
nal Register
of
Shipping
1 6.713 70 Polski Rejestr
Statkow
1 0.987
11
C.T.M. Inspecti
on and
Classifi
cation Compa
ny, S.
de R.L
3 18.637 41
Internatio
nal Ship
Classification
1 3.382 71 R.J. Del
Pan 1 7.247
12
Ceskoslovensk
y Lodin
Registe
r
1 7.247 42
Iranian
Classific
ation Society
1 0.777 72
Registro Brasileiro
de Navios
de
Aeronaves
1 7.247

33
13
China
Classification
Society
1 6.299 43
Isthmus
Bureau of
Shipping
1 1.919 73
Registro
Internacional Naval
S.A.
1 3.343
14
China Corpor
ation
Registe
r of Shippin
g
1 1.109 44
Isthmus
Maritime Classific
ation
Society
S.A.
1 7.247 74
Registro
Italiano
Navale
1 2.935
15
Compa
nia Nacion
al de
Registr
o e
1 7.247 45
Korea
Classification
Society
(former Joson
Classific
ation
Society)
1 8.515 75
RINAVE
Portuguesa
1 0.608
16
Compa
nia Nacion
al de
Registro e
Inspecc
ion de
Naves
1 7.247 46
Korea
Ship Safety
Technolo
gy
Authority
1 6.798 76
Russian
Maritime
Register of
Shipping
1 1.458
17
Cosmos
Marine Bureau
1 5.285 47
Korean
Register
of
Shipping
1 5.609 77
Russian
River Register
1 7.247

34
18
CR
Classification
Society
1 2.529 48
Libyan
Surveyor Mr. Sif
Ennasar
1 7.247 78
Ship
Classification
Malaysia
1 5.033
19
Croatia
n Registe
r of
Shippin
g
1 6.095 49
Abdulha
mid Giahmi
. . 79
Shipping
Register of Ukraine
1 7.258
20
Cyprus
Bureau of
Shippin
g
1 7.247 50 Lloyd's
Register 1 4.3 80
SingClass Internation
al Pte Ltd
1 14.897
21
Det
Norske
Veritas
1 4.678 51
Macosna
r Corporati
on
1 3.096 81 Sing-Lloyd
1 13.771
22
DNV GL AS
(2014
年合
并)
1 4.371 52
Maritime Lloyd
Ltd,
Georgia
1 3.096 82 Turkish
Lloyd 1 0.719
23
Dromo
n
Bureau
of Shippin
g
1 14.993 53
Maritime
Lloyd
Ltd, Georgia
1 9.447 83 Turkish
Lloyd 1 7.247
24 Ferriby Marine
3 16.9 54
Maritime Technica
l Systems
and
Services
1 3.224 84
Union
Bureau of
Shipping
1 8.163

35
25 Fidenavis SA
1 1.064 55
National
Cargo Bureau
Inc.
1 0.456 85
Union Marine
Classificat
ion
Society
2 0
26
German
ischer Lloyd
1 3.087 56
National Shipping
Adjusters
Inc
1 0.93 86
Universal
Maritime Bureau
1 5.68
27
Global
Marine Bureau
1 6.68 57
New
United
Internatio
nal Marine
Services
Ltd
1 13.824 87
Universal
Shipping Bureau
1 2.439
28
Global
Shippin
g Bureau
1 9.633 58 Nippon Kaiji
Kyokai
1 3.945 88
Venezuela
n Register
of Shipping
1 1.909
29
Helleni
c
Register of
Shippin
g
1 2.802 59 NV Unitas
1 7.247 89 Vietnam Register
1 0.615

36
30
INCLA
MAR (Inspect
ion y
Classifi
cation Mariti
me, S.
de.
R.L.)
1 7.247 60
Novel
Classification
Society
S.A.
1 7.247 90 Other 1 4.352
Table 5-11: Final cluster center
Cluster
1 2 3
Detention percentage (%) 7.23 50.00 50.00
RO responsibility percentage (%) .45 50.00 2.78
Table 5-12: The final distance of cluster centers
Cluster 1 2 3
1 65.457 42.830
2 65.457 47.223
3 42.830 47.223
Table 5-13:The number of cases in each cluster
Cluster 1 2 3 Effective Missing
Number 84 1 4 89 1
With reference to Chapter 5.1, the initial cluster center, the number of iterations, the
final cluster center, and the number of cases per class in the process of clustering can be
seen. Utilizing the rate of detention as a reference standard, the first category is an
excellent group. On the basis of RO responsibility percentage (%) as a reference index,
the second category is the medium group, and the third category is the inferior group.
5.3 Analysis of type of ships - Cluster Analysis

37
Using the detention rate (%) and the average number of deficiencies as the variables of
the cluster analysis, the case variable is the ―type of ship‖. Using k-means clustering
analysis algorithm, set k = 3, the analysis results are as follows:
Table 5-14: Initial clustering center
Cluster
1 2 3
Average deficiencies per ship 8.78 5.27 .00
Detention percentage (%) 22.22 8.90 .00
Table 5-15 : Iteration history3
Iteration Changes in the cluster center
1 2 3
1 3.406 1.879 2.961
2 .000 .192 .738
3 .000 .185 .556
4 .000 .000 .000
Table 5-16: Clusters of type of ships
Case NO. Type of ships Cluster Distance Case NO. Type of
ships
Cluster Distance
1 NLS tanker 2 1.832 12 Woodchip carrier
2 2.486
2 Combination
carrier 2 .914 13
Livestock
carrier 2 4.956
3 Oil tanker 2 2.642 14
Ro-Ro
passenger
ship
2 3.078
4 Gas carrier 2 1.715 15 Passenger
ship 3 1.233
5 Chemical tanker 3 1.781 16 Factory
ship 1 3.406
6 Bulk carrier 2 .943 17 Heavy load
carrier 2 .880
7 Vehicle carrier 3 2.224 18
Offshore
service
vessel
2 .274
3 The convergence is achieved due to the absence of changes or small changes in the cluster center. The
maximum absolute coordinate of any center is changed to .000. The current iteration is 4. The minimum
distance between the initial centers is 10.343.

38
8 Container ship 2 2.494 19 MODU &
FPSO 1 3.406
9 Ro-Ro cargo ship 2 .779 20
High speed
passenger
craft
3 1.774
10
General
cargo/multi-purp
ose ship
2 2.595 21
Special
purpose
ship
2 1.072
11 Refrigerated cargo carrier
2 1.359 22 High speed cargo craft
3 3.917
12 Woodchip carrier 2 2.486 23 Tugboat 2 1.215
13 Livestock carrier 2 4.956 24 Others 2 1.511
Table 5-17: Final cluster center
Cluster
1 2 3
Average deficiencies per ship 6.81 4.83 3.11
Detention percentage (%) 19.45 7.45 2.39
Table 5-18: The final distance of cluster centers
Cluster 1 2 3
1
12.152 17.455
2 12.152
5.354
3 17.455 5.354
Table5-19: The number of cases in each cluster
Cluster 1 2 3 Effective Missing
Number 2 17 5 24 0
With reference to Chapter 5.1, we can see the initial cluster center, the number of
iterations, the final cluster center, and the number of cases per type of ships in the
process of clustering. The first category is the excellent group; the second category is the
medium group, and the third category is the inferior group.
Although it is not possible to actually predict the ship's defeciencies during the ship's
PSC selection process, yet we can determine the high-risk ship preferably by screening
the inherent attributes of the ship and the ship's priority. The results of the ship's inherent

39
attributes in the cluster analysis are given the value of 1, 2 and 3 respectively, expressed
as Flagx=(1,2,3), =(1,2,3), =(1,2,3). For simplicity, we obtain the ship's inherent
property matrix expressed as N = (3, 4, 5, 6, 7, 8, 9). The ship’s priority is given the
value of 0,1 and 2, where 0 means the inspection window is not open yet, expressed as
P= . In the next step, we multiply the two matrices, getting the result of P * N. And we
can use the table to indicate the performance of the ship which is going to be inspected.
Table 5-20: Evaluation grade classified by the grade
0~5 6~10 10~15 16~20
Inspection unavailable Low-risk Medium-risk Hight-risk
The more detailed the evaluation grade, the more accurate the evaluation, the higher
credibility of the evaluation, and correspondingly the more complex the corresponding
assessment process is (Wang Yong, & Li Zan, 2012). In the process of target ship
selection, PSCOs may add three values of inherent attributes of the ship added and
multiply the ship's priority level to obtain the prediction of the target ship's performance
in PSC inspection. For example, if the ship gets a score of 0 in the risk assessment,
which means the ship’s inspection window is not open, the PSC inspection should not be
carried out. If the ship gets a score of 9 in the risk assessment, it indicates that the
inherent value of the ship is large, but the ship’s inspection priority is not high; if the
ship risk assessment value is greater than 10, that indicates the ship has a higher risk of
ship property and it is Priority II ship. In this case,PSCOs should give more attention to
these kind of ships. After risk process, plenty of ships will be screened out, which will
surely reduce PSCOs’ workload.
6 Conclusion
There is no doubt about the importance of the PSC inspection of the ship, and how to
better carry out the PSC inspection is also a key issue for each country to protect the
crew, ensuring the ship’s safety and maintaining the marine environment. Based on the
analysis of PSC data of Tokyo-MOU 2011-2015, this paper summarizes the distribution

40
of ships’ deficiencies and the detention in the ship PSC inspection, and then finds out the
nature of the inherent attributes of the ship by cluster analysis to assess the ship's
performance under PSC’s inspection.
However, the situation of ship's deficiencies is not entirely determined by the ship's
inherent properties. In the author's statistics on the PSC inspection data of Lianyungang
ships in 2016, apart from the fact that most of the conclusions are consistent with this
paper, it is found that the deficiencies issued in the PSC reports are related to different
PSCOs to a certain extent. Every PSCO has different academic backgrounds, some of
them are experienced ocean-going captains, some are engineers, but they all have their
own characteristics and professional judgment when issuing the PSC report. Besides,
human factors could not be ignored. For example, PSC inspection result may be
different when the seafarers are changed. All these will have an impact on the
assessment results. However, the analysis of large data will help PSC lock sub-standard
ships to carry out key inspections and improve the efficiency of PSC inspection.
Maritime accidents are caused by the interactions of human factors, ship factors,
environmental factors and many other factors, among which the virtues or defect degree
of the ship’s management are directly reflected by the number of ship’s deficiencies or
detonable deficiencies in PSC inspection(Zhong Simiao,2011). As a PSCO, the author
deeply feels the responsibility of this work. To improve the efficiency of PSC inspection,
inspection skills is the goal that the author has always dreamed of achieving. Due to the
time limitation as well as personal ability, the author cannot fully detect the various
factors affecting the ship’s defects. The assessment of ships’ deficiencies is also within a
certain range. However, the author still sincerely hope that this article can have some
implications for the PSC inspection work in the future.

41
References
Ademuni-Odeke. (1997). Port state control and UK law.
Ai Yazhao. (2003). Analyses of the Background and Berth of Port State Con trol
(PSC). Transportation Science and Technology (6), 101-102.
Bao Junzhong. (2015). Paris Memorandum area announced inspection result of the CIC
about the crew rest time. China Maritime (2), 66-66.
Cariou, P., Jr, M. Q. M., & Wolff, F. C. (2008). On the effectiveness of port state control
inspections. Transportation Research Part E Logistics & Transportation Review, 44(3),
491-503
China MSA. (2016). Work objectives of China Maritime Safety Administration, 2016.
Unpublished
China Ministry of Transport. (2009). People’s Republic of China Ship Safety Inspection
Regulation
Chinrungrueng, C. (1993). Evaluation of heterogeneous architectures for artificial
neural networks.
CPCIS, 2017, Available from http://218.25.179.238:7001/pscchina/LoginAction.do?a
ction=login, Retrieved June 17th.
Domijan-Arneri, M. (2002). The role of port state control in the contemporary shipping
arena from the perspective of the paris memorandum of understanding. Nase More, 49
(5), 205-211.
42
Han, J., Kamber, M., & Chiang, J. (1997). Mining multi-dimensional association rules
using data cubes.
Hu Ronghua. (2013). Impact after implementation of the ―PROCEDURES FOR PORT
STATE CONTROL, 2011‖. Navigation Technology (3), 72-74.
Huang Zhi. (2011). Australia psc inspection ships’ defect analysis. World Shipping, 34
(10), 37-40.
IMO. (2011). PROCEDURES FOR PORT STATE CONTROL Resolution A.1052 (27)
IMO & ILO. (2006). MARITIME LABOUR CONVENTION
Jiang, D., Tang, C., & Zhang, A. (2004). Cluster analysis for gene expression data: a
survey. IEEE Transactions on Knowledge & Data Engineering, 16(11), 1370-1386.
Lloyd, S. (1982). Least squares quantization in pcm. IEEE Transactions on Information
Theory, 28(2), 129-137.
Moody, J., & Darken, C. J. (2008). Fast learning in networks of locally-tuned processing
units. Neural Computation, 1(2), 281-294.
Qin Junwei. (2016). The difficulties and way out for the shipping companies aunder
current economic situation. Market Weekly (5), 41-42
Raphael Baumler. (2017). 2017 C2HMF2 System approach. Teaching PPT
unpublished.
Sun Yujie, (2013). The influence and solutions after the implementation of Tokyo
Memorandum NIR. World Shipping, 36 (10), 22-26.

43
Tokyo MOU. (2017). website available from: http://www.tokyo-mou.org/
Tokyo MOU, 2014, NEW INSPECTION REGIME. Available from: http://www.to
kyo-mou.org/inspections_detentions/NIR.php
Tokyo MOU, 2011, ANNUAL REPORT ON PORT STATE CONTROL IN THE
ASIA-PACIFIC REGION
Tokyo MOU, 2012, ANNUAL REPORT ON PORT STATE CONTROL IN THE
ASIA-PACIFIC REGION.
Tokyo MOU, 2013, ANNUAL REPORT ON PORT STATE CONTROL IN THE
ASIA-PACIFIC REGION
Tokyo MOU, 2014, ANNUAL REPORT ON PORT STATE CONTROL IN THE
ASIA-PACIFIC REGION
Tokyo MOU, 2015, ANNUAL REPORT ON PORT STATE CONTROL IN THE
ASIA-PACIFIC REGION
Xu, R., Lu, Q., Li, K. X., & Li, W. (2007). Web Mining for Improving Risk Assessment
in Port State Control Inspection. International Conference on Natural Language
Processing and Knowledge Engineering (pp.427-434). IEEE.
Wang Qi. (2014). The PSC inspection of the crew rest time in CIC. Navigation
technology (4), 66-70.
Wang Yong & Li Zan. (2012). Study on navigation safety of harbor waters based on
FSA theory. Port Technology (8), 10-13.
44
Xiang, P. S. (2011). Survey of clustering algorithm. Journal of Southwest University for
Nationalities.
Xu Chunsong, & Han Jialin. (2017). Amendments to Maritime Conventions and Rules
to Enter into Force in 2017. China MSA (1), 55-55.。
Zhong Simiao. (2011). Research on ship safety status based on PSC inspection Results.
Doctoral dissertation, Dalian Maritime University.

45
Annex I: The structure of Tokyo MOU organization
There are 20 member authorities: Australia, Canada, Chile, China, Fiji, Hong Kong
(China), Indonesia, Japan, Republic of Korea, Malaysia, the Marshall Islands, New
Zealand, Papua New Guinea, Peru, the
Philippines, theRussianFederation, Singapore, Thailand, Vanuatu and Viet Nam;
One co-operating member Authority: Panama;
5 Observer authorities: Democratic People’s Republic of Korea, Macao
(China), Solomon Islands, Kingdom of Tonga and United States Coast Guard; and
7 Observer organizations: the International Maritime Organization (IMO), the
International Labour Organization (ILO), the Paris MOU, the Viña del Mar
Agreement, the Indian Ocean MOU, the Black Sea MOUand Riyadh MOU.
Source: Tokyo MOU website http://www.tokyo-mou.org/organization/organizational_
structure.php

46
Annex 2: List of certificates and documents
List of certificates and documents which are to some extent applicable should be
checked during the inspection referred to in paragraph 2.2.3 (as appropriate):
1 International Tonnage Certificate (1969);
2 Reports of previous port State control inspections;
3 Passenger Ship Safety Certificate (SOLAS reg.I/12);
4 Cargo Ship Safety Construction Certificate (SOLAS reg.I/12);
5 Cargo Ship Safety Equipment Certificate (SOLAS reg.I/12);
6 Cargo Ship Safety Radio Certificate (SOLAS reg.I/12);
7 Cargo Ship Safety Certificate (SOLAS reg.I/12);
8 Special Purpose Ship Safety Certificate (SOLAS reg.I/12, SPS Code reg.1.7);
9 For ro-ro passenger ships, information on the A/A-max ratio (SOLAS reg.II-1/8-1 );
10 Damage control plans and booklets (SOLAS reg.II-1/19);
11 Stability information (SOLAS reg.II-1/5-1 and LLC 66/88 reg.10);
12 Manoeuvring Booklet and information (SOLAS reg.II-1/28);
13 Unattended machinery spaces (UMS) evidence (SOLAS reg.II-I/46.3);
14 Exemption Certificate and any list of cargoes (SOLAS reg.II-2/10.7.1.4);
15 Fire control plan (SOLAS reg.II-2/15.2.4);
16 Fire safety operational booklet (SOLAS reg.II-2/16.3.1);
17 Dangerous goods special list or manifest, or detailed stowage plan (SOLAS
reg.II-2/19 and ILO Convention No.134 art.4.3(h));
18 Document of compliance Dangerous Goods (SOLAS reg.II-2/19.4);
19 Ship's logbook with respect to the records of drills, including security drills, and the
log for records of inspection and maintenance of life-saving appliances and
arrangements and fire-fighting appliances and arrangements (SOLAS regs.III/19.5
and 20.6);
20 Minimum Safe Manning Document (SOLAS reg.V/14.2); Refer to Resolution 1 of
the 1995 SOLAS Conference.
21 SAR coordination plan for passenger ships trading on fixed routes (SOLAS
reg.V/7.3);
22 LRIT Conformance Test Report;

47
23 Copy of the Document of compliance issued by the testing facility, stating the date of
compliance and the applicable performance standards of VDR (voyage data
recorder) (SOLAS reg.V/18.8);
24 For passenger ships, List of operational limitations (SOLAS reg.V/30.2);
25 Cargo Securing Manual (SOLAS reg.VI/5.6);
26 Bulk Carrier Booklet (SOLAS reg.VI/7.2);
27 Loading/Unloading Plan for bulk carriers (SOLAS reg.VI/7.3);
28 Document of authorization for the carriage of grain (SOLAS reg.VI/9);
29 INF (International Code for the Safe Carriage of Packaged Irradiated Nuclear Fuel,
Plutonium and High-Level Radioactive Wastes on Board Ships) Certificate of
Fitness (SOLAS reg.VII/16 and INF Code reg.1.3);
30 Copy of Document of Compliance issued in accordance with the International
Management Code for the Safe Operation of Ships and for Pollution Prevention
(DoC) ISM Code (SOLAS reg.IX/4.2);
31 Safety Management Certificate issued in accordance with the International
Management Code for the Safe Operation of Ships and for Pollution Prevention
(SMC) (SOLAS reg.IX/4.3);
32 High-Speed Craft Safety Certificate and Permit to Operate High-Speed Craft
(SOLAS reg.X/3.2 and HSC Code 94/00 reg.1.8.1);
33 Continuous Synopsis Record (SOLAS reg.XI-1/5);
34 International Certificate of Fitness for the Carriage of Liquefied Gases in Bulk, or the
Certificate of Fitness for the Carriage of Liquefied Gases in Bulk, whichever is
appropriate (IGC Code reg.1.5.4);
35 International Certificate of Fitness for the Carriage of Dangerous Chemicals in Bulk,
or the Certificate of Fitness for the Carriage of Dangerous Chemicals in Bulk,
whichever is appropriate (IBC Code reg.1.5.4 and BCH Code reg.1.6.3);
36 International Oil Pollution Prevention Certificate (MARPOL Annex I reg.7.1);
37 Survey Report Files (in case of bulk carriers or oil tankers) (SOLAS reg.XI-1/2);
38 Oil Record Book, parts I and II (MARPOL Annex I regs.17 and 36);
39 Shipboard Marine pollution emergency plan for Noxious Liquid Substances
(MARPOL Annex II reg.17);
40 (Interim) Statement of compliance Condition Assessment Scheme (CAS) (MARPOL
Annex I regs.20.6 and 21.6.1);
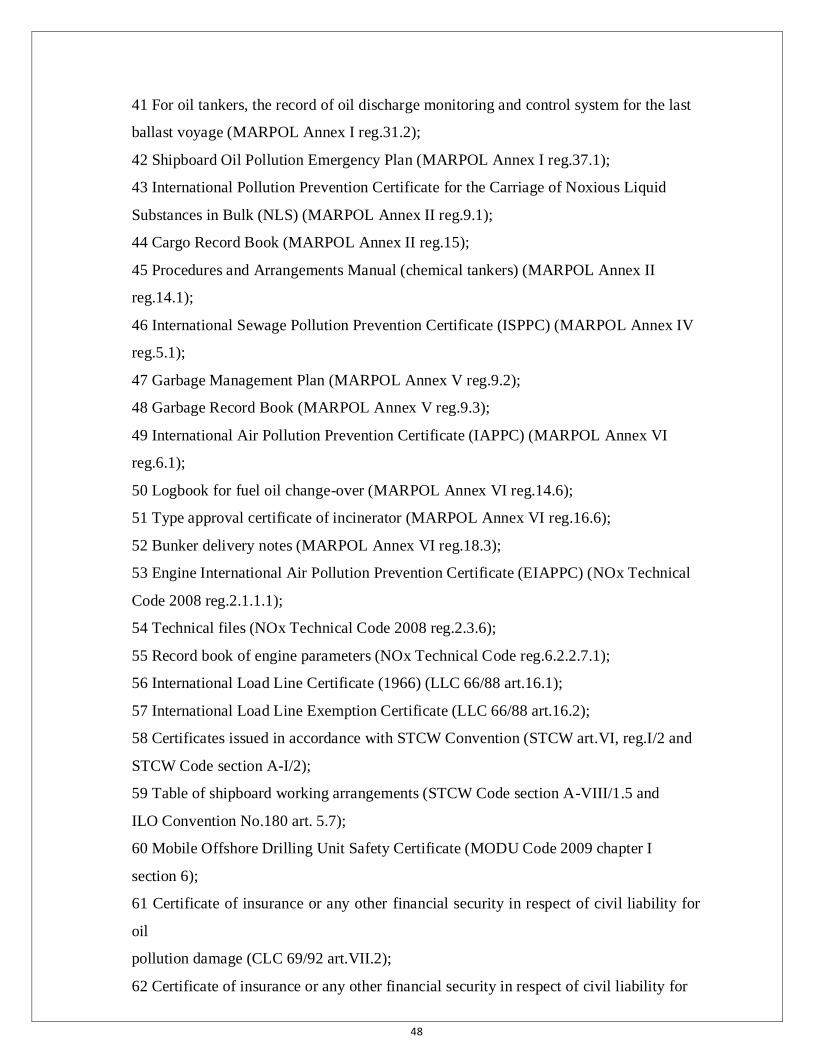
48
41 For oil tankers, the record of oil discharge monitoring and control system for the last
ballast voyage (MARPOL Annex I reg.31.2);
42 Shipboard Oil Pollution Emergency Plan (MARPOL Annex I reg.37.1);
43 International Pollution Prevention Certificate for the Carriage of Noxious Liquid
Substances in Bulk (NLS) (MARPOL Annex II reg.9.1);
44 Cargo Record Book (MARPOL Annex II reg.15);
45 Procedures and Arrangements Manual (chemical tankers) (MARPOL Annex II
reg.14.1);
46 International Sewage Pollution Prevention Certificate (ISPPC) (MARPOL Annex IV
reg.5.1);
47 Garbage Management Plan (MARPOL Annex V reg.9.2);
48 Garbage Record Book (MARPOL Annex V reg.9.3);
49 International Air Pollution Prevention Certificate (IAPPC) (MARPOL Annex VI
reg.6.1);
50 Logbook for fuel oil change-over (MARPOL Annex VI reg.14.6);
51 Type approval certificate of incinerator (MARPOL Annex VI reg.16.6);
52 Bunker delivery notes (MARPOL Annex VI reg.18.3);
53 Engine International Air Pollution Prevention Certificate (EIAPPC) (NOx Technical
Code 2008 reg.2.1.1.1);
54 Technical files (NOx Technical Code 2008 reg.2.3.6);
55 Record book of engine parameters (NOx Technical Code reg.6.2.2.7.1);
56 International Load Line Certificate (1966) (LLC 66/88 art.16.1);
57 International Load Line Exemption Certificate (LLC 66/88 art.16.2);
58 Certificates issued in accordance with STCW Convention (STCW art.VI, reg.I/2 and
STCW Code section A-I/2);
59 Table of shipboard working arrangements (STCW Code section A-VIII/1.5 and
ILO Convention No.180 art. 5.7);
60 Mobile Offshore Drilling Unit Safety Certificate (MODU Code 2009 chapter I
section 6);
61 Certificate of insurance or any other financial security in respect of civil liability for
oil
pollution damage (CLC 69/92 art.VII.2);
62 Certificate of insurance or any other financial security in respect of civil liability for
49
Bunker oil pollution damage (BUNKERS 2001 art.7.2);
63 International Ship Security Certificate (ISSC) (ISPS Code part A/19.2);
64 Record of AFS (AFS 2001 Annex 4 reg.2);
65 International Anti-Fouling System Certificate (IAFS Certificate) (AFS 2001 Annex 4
reg.2); and
66 Declaration on AFS (AFS 2001 Annex 4 reg.5).
For reference:
1 Certificate of Registry or other document of nationality (UNCLOS art.9.1.2);
2 Certificates as to the ship's hull strength and machinery installations issued by the
classification society in question (only to be required if the ship maintains its class
with a classification society);
3 Cargo Gear Record Book (ILO Convention No.32 art.9.2(4) and ILO Convention
No.152 art.25);
4 Certificates loading and unloading equipment (ILO Convention No.134 art.4.3(e) and
ILO Convention No.32 art.9(4));
5 Medical certificates (ILO Convention No.73); and
6 Records of hours of work or rest of seafarers (ILO Convention No.180 part II art. 8.1).
Source: PROCEDURES FOR PORT STATE CONTROL, 2011 APPENDIX 12

50
Annex 3: Comparison of Deficiencies by Categories
Nature of deficiency
Number of deficiencies
2011 2012 2013 2014 2015
Certificate &
Documentation
Crew
Certificates 4,502
1,275 1,074 1,534 1,593
Documents 5,359 5,345 6,416 4,500
Ship Certificates 2,754 2,348 2,445 1,910
Structural Conditions 8,257 3,593 3,511 2,671 2,422
Water/Weathertight conditions 8,139 6,753 5,899 5,812 5,584
Emergency Systems N/A 5,628 5,392 5,093 5,771
Radio Communications 3,073 2,987 2,500 2,259 2,231
Cargo operations including equipment 661 675 575 613 500
Fire safety 18,114 20,522 17,539 16,654 15,143
Alarms 704 798 754 634 577
Safety of Navigation 17,435 17,124 16,275 14,231 12,619
Life saving appliances 12,281 12,070 11,507 10,515 11,213
Dangerous goods 284 241 216 183 352
Propulsion and auxiliary machinery 7,166 5,470 5,458 4,549 4,137
Working and
Living Conditions
Living
Conditions 459 672 620 529 349
Working
Conditions 2,952 4,496 4,887 4,134 2,866
Labour Conditions
Minimum
requirements for
seafarers
N/A N/A 11 74 35
Conditions of
employment N/A N/A 33 363 515

51
Accommodation,
recreational
facilities, food
N/A N/A 199 1017 998
Health
protection,
medical
care, social
security
N/A N/A 66 983 1,699
Pollution
prevention
Anti Fouling 24 16 21 7 13
MARPOL
Annex I 5,643 2,335 2,037 1,679 1,607
MARPOL
Annex II 53 27 40 13 17
MARPOL
Annex III 37 17 14 33 30
MARPOL
Annex IV 996 1,013 1,070 1,199 1,301
MARPOL
Annex V 1,580 981 2,618 1,587 1,252
MARPOL
Annex VI 680 796 915 758 847
ISM 3,497 3,292 3,099 2,699 2,803
Other 7,012 1,436 1,240 876 722
Total
103,549 100,330 95,263 89,560 83,606
ISPS 2933 2,490 2,033 1,615 1,389
Grand total
106,492 102,820 97,296 91,175 84,995
Source: Author’s calculation, Data from
Annual Report on Port State Control in The Asia-pacific Region 2011 Table 6
Annual Report on Port State Control in The Asia-pacific Region 2014 Table 13
Annual Report on Port State Control in The Asia-pacific Region 2015 Table 144
4 ASIA-PACIFIC PORT STATE CONTROL MANUAL will be updated regularly, the old and new code
table is different, which leads to the missing of some data in 2011, 2012 ship deficiencies.

52
Annex 4: Comparison of most frequently reserved deficiencies
No. Most frequent deficiencies
Year
2011 2012 2013 2014 2015 Total
1 Lifeboats (Life
saving appliances) 165 155 190 136 136 782
2 Fire-dampers (Fire
safety) 135 155 120 119 103 632
3 Shipboard
operations (ISM) 62 96 76 81 82 397
4 Resources and personnel (ISM)
165 113 114 98 81 571
5
Ventilators, air pipes, casings
(Water/Weathertight conditions)
151 125 76 76 80 508
6
Emergency fire pump and its pipes
(Emergency Systems)
42 67 99 71 72 351
7 Oil filtering equipment
(MARPOL Annex I) 134 98 104 74 69 479

53
8 Fire detection and alarm system (Fire
safety) 76 76 85 60 67 364
9
Covers (hatchway-, portable-,
tarpaulins, etc.) (Water/Weathertight
conditions)
61 50 68 70 66 315
10
Fixed fire extinguishing
installation (Fire safety)
89 52 59 61 66 327
11 Others 482 434 404 357 331 2008
Total 1562 1421 1395 1203 1153 6734 Source: Author’s calculation Data from Annual Report on Port State Control in The Asia-pacific Region 2013 Table 13 Annual Report on Port State Control in The Asia-pacific Region 2015 Figure 13, Table 15

54
Annex 5: PORT STATE INSPECTIONS PER FLAG
Flag
No. of
inspect
ion
No of
inspecti
on with
deficien
cies
No. of
deficien
cies
No. of
deteti
ons
Average
deficien
cies per
ship
Detenti
on
percent
age (%)
1 Algeria 3 2 11 1 5.50 50.00
2 Antigua and Barbuda 2597 1671 7096 162 4.25 9.69
3 Argentina 7 5 23 1 4.60 20.00
4 Australia 25 10 18 0 1.80 0.00
5 Bahamas 3493 1751 6558 100 3.75 5.71
6 Bahrain 13 10 40 1 4.00 10.00
7 Bangladesh 259 227 1383 27 6.09 11.89
8 Barbados 93 65 293 6 4.51 9.23
9 Belgium 155 77 258 3 3.35 3.90
10 Belize 2213 2053 12964 181 6.31 8.82
11 Bermuda (UK) 368 175 565 4 3.23 2.29
12 Bolivia 2 2 8 1 4.00 50.00
13 Brazil 11 11 79 3 7.18 27.27
14 Brunei Darussalam 27 9 35 2 3.89 22.22
15 Bulgaria 1 1 11 0 11.00 0.00
16 Cambodia 7632 7461 57626 1108 7.72 14.85
17 Canada 3 1 5 0 5.00 0.00
18 Cayman Islands (UK) 537 194 551 10 2.84 5.15
19 Chile 11 7 22 0 3.14 0.00
20 China 4320 2116 8656 20 4.09 0.95
21 Colombia 10 10 92 4 9.20 40.00
22 Comoros 29 29 271 9 9.34 31.03
23 Cook Islands 93 58 297 10 5.12 17.24
24 Croatia 133 66 256 1 3.88 1.52
25 Curacao 116 59 197 3 3.34 5.08
26 Cyprus 2471 1391 5853 104 4.21 7.48
27 Denmark 728 400 1531 22 3.83 5.50
28 Dominica 66 53 384 6 7.25 11.32
29 Ecuador 8 8 28 1 3.50 12.50
30 Egypt 71 53 382 10 7.21 18.87
31 Equatorial Guinea 9 9 107 1 11.89 11.11
32 Estonia 3 2 27 1 13.50 50.00
33 Ethiopia 30 27 122 2 4.52 7.41
34 Falkland Islands (UK) 11 9 26 0 2.89 0.00
35 Fiji 2 0 0 0 0.00 0.00
36 Finland 4 3 6 0 2.00 0.00
37 Faroe Islands 1 0 0 0 0.00 0.00
38 France 206 118 336 1 2.85 0.85
39 Gambia 1 1 9 0 9.00 0.00
40 Georgia 43 41 365 9 8.90 21.95
41 Germany 1043 685 2763 37 4.03 5.40
42 Gibraltar (UK) 340 178 686 13 3.85 7.30
43 Greece 1700 834 3032 58 3.64 6.95
44 Honduras 26 26 268 7 10.31 26.92
45 Hong Kong, China 14253 7178 28121 163 3.92 2.27
46 Iceland 1 1 2 0 2.00 0.00
47 India 487 272 1465 30 5.39 11.03
48 Indonesia 918 814 5779 140 7.10 17.20
49 Iran 134 121 677 10 5.60 8.26

55
50 Ireland 6 2 2 0 1.00 0.00
51 Isle of Man (UK) 897 417 1471 23 3.53 5.52
52 Israel 33 30 161 2 5.37 6.67
53 Italy 711 389 1725 32 4.43 8.23
54 Jamaica 85 74 374 7 5.05 9.46
55 Japan 876 474 1735 13 3.66 2.74
56 Jordan 3 2 3 0 1.50 0.00
57 Kiribati 1077 934 6967 103 7.46 11.03
58 Korea, Democratic People's
Republic 1042 1038 9904 173 9.54 16.67
59 Korea, Republic of 6972 5238 24711 44 4.72 0.84
60 Kuwait 79 39 165 2 4.23 5.13
61 Lao, People's Democratic
Republic 1 0 0 0 0.00 0.00
62 Lebanon 1 1 5 0 5.00 0.00
63 Liberia 11038 6358 25489 447 4.01 7.03
64 Libyan Arab Jamahiriya 7 3 12 0 4.00 0.00
65 Libya 9 4 11 0 2.75 0.00
66 Lithuania 8 4 17 0 4.25 0.00
67 Luxemburg 127 70 231 4 3.30 5.71
68 Malaysia 1254 746 3786 40 5.08 5.36
69 Maldives 35 29 192 0 6.62 0.00
70 Malta 3963 2280 9651 174 4.23 7.63
71 Marshall Islands 8170 4067 15633 215 3.84 5.29
72 Mauritius 7 5 33 0 6.60 0.00
73 Mexico 4 1 1 0 1.00 0.00
74 Moldova 143 138 955 24 6.92 17.39
75 Mongolia 547 506 4115 94 8.13 18.58
76 Montenegro 1 1 1 0 1.00 0.00
77 Myanmar 34 31 207 4 6.68 12.90
78 Netherlands 713 375 1320 16 3.52 4.27
79 New Zealand 14 11 50 1 4.55 9.09
80 Nigeria 2 2 17 0 8.50 0.00
81 Niue 80 76 607 14 7.99 18.42
82 Norway 1227 585 2091 26 3.57 4.44
83 Pakistan 40 29 158 1 5.45 3.45
84 Palau 33 27 187 4 6.93 14.81
85 Panama 43960 27091 133042 1874 4.91 6.92
86 Papua New Guinea 56 52 424 14 8.15 26.92
87 Peru 23 17 129 3 7.59 17.65
88 Philippines 1028 705 3459 69 4.91 9.79
89 Portugal 166 98 355 5 3.62 5.10
90 Qatar 19 7 40 1 5.71 14.29
91 Romania 1 0 0 0 0.00 0.00
92 Russian Federation 1381 1232 6314 66 5.13 5.36
93 Saint Helena (UK) 1 1 13 0 13.00 0.00
94 Saint Kitts and Nevis 141 132 864 16 6.55 12.12
95 Saint Vincent and the
Grenadines 792 704 3860 28 5.48 3.98
96 Samoa 12 10 90 2 9.00 20.00
97 Saudi Arabia 145 86 282 2 3.28 2.33
98 Sierra Leone 1269 1220 11114 227 9.11 18.61
99 Singapore 9997 4642 17806 133 3.84 2.87
100 Solomon Islands 16 13 75 1 5.77 7.69
101 South Africa 1 0 0 0 0.00 0.00
102 Spain 10 4 15 1 3.75 25.00

56
103 Sri Lanka 40 32 124 1 3.88 3.13
104 Saint Kitts and Nevis 55 52 333 7 6.40 13.46
105 Sweden 114 42 130 4 3.10 9.52
106 Switzerland 136 74 282 5 3.81 6.76
107 Taiwan, China 508 274 1466 20 5.35 7.30
108 Tanzania 122 114 793 25 6.96 21.93
109 Thailand 1510 1132 6004 107 5.30 9.45
110 Togo 209 203 1503 23 7.40 11.33
111 Tonga 41 36 253 8 7.03 22.22
112 Tunisia 5 2 8 0 4.00 0.00
113 Turkey 296 139 571 12 4.11 8.63
114 Tuvalu 614 505 2900 35 5.74 6.93
115 Ukraine 8 8 53 1 6.63 12.50
116 United Arab Emirates
(UAE) 18 13 47 1 3.62 7.69
117 United Kingdom (UK) 1158 626 2119 35 3.38 5.59
118 United States 262 169 631 4 3.73 2.37
119 Vanuatu 232 151 714 5 4.73 3.31
120 Vanuatu 341 220 1037 20 4.71 9.09
121 Viet Nam 3745 2768 14107 238 5.10 8.60
122 Ship's registration
withdrawn 8 7 80 6 11.43 85.71
Source: Author’s calculation Data from
Annual Report on Port State Control in The Asia-pacific Region 2011, 2012, 2013 and 2014, Table 3
Annual Report on Port State Control in The Asia-pacific Region 2015 Table 4
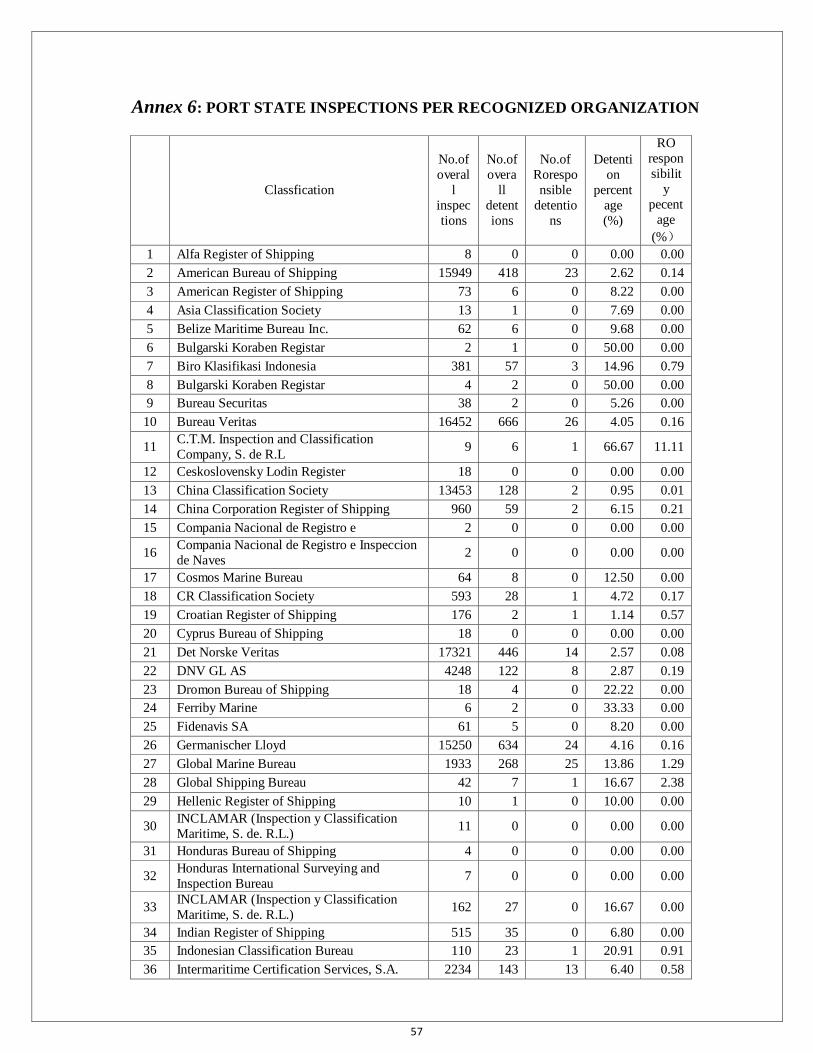
57
Annex 6: PORT STATE INSPECTIONS PER RECOGNIZED ORGANIZATION
Classfication
No.of
overal
l
inspec
tions
No.of
overa
ll
detent
ions
No.of
Rorespo
nsible
detentio
ns
Detenti
on
percent
age
(%)
RO
respon
sibilit
y
pecent
age
(%)
1 Alfa Register of Shipping 8 0 0 0.00 0.00
2 American Bureau of Shipping 15949 418 23 2.62 0.14
3 American Register of Shipping 73 6 0 8.22 0.00
4 Asia Classification Society 13 1 0 7.69 0.00
5 Belize Maritime Bureau Inc. 62 6 0 9.68 0.00
6 Bulgarski Koraben Registar 2 1 0 50.00 0.00
7 Biro Klasifikasi Indonesia 381 57 3 14.96 0.79
8 Bulgarski Koraben Registar 4 2 0 50.00 0.00
9 Bureau Securitas 38 2 0 5.26 0.00
10 Bureau Veritas 16452 666 26 4.05 0.16
11 C.T.M. Inspection and Classification
Company, S. de R.L 9 6 1 66.67 11.11
12 Ceskoslovensky Lodin Register 18 0 0 0.00 0.00
13 China Classification Society 13453 128 2 0.95 0.01
14 China Corporation Register of Shipping 960 59 2 6.15 0.21
15 Compania Nacional de Registro e 2 0 0 0.00 0.00
16 Compania Nacional de Registro e Inspeccion
de Naves 2 0 0 0.00 0.00
17 Cosmos Marine Bureau 64 8 0 12.50 0.00
18 CR Classification Society 593 28 1 4.72 0.17
19 Croatian Register of Shipping 176 2 1 1.14 0.57
20 Cyprus Bureau of Shipping 18 0 0 0.00 0.00
21 Det Norske Veritas 17321 446 14 2.57 0.08
22 DNV GL AS 4248 122 8 2.87 0.19
23 Dromon Bureau of Shipping 18 4 0 22.22 0.00
24 Ferriby Marine 6 2 0 33.33 0.00
25 Fidenavis SA 61 5 0 8.20 0.00
26 Germanischer Lloyd 15250 634 24 4.16 0.16
27 Global Marine Bureau 1933 268 25 13.86 1.29
28 Global Shipping Bureau 42 7 1 16.67 2.38
29 Hellenic Register of Shipping 10 1 0 10.00 0.00
30 INCLAMAR (Inspection y Classification
Maritime, S. de. R.L.) 11 0 0 0.00 0.00
31 Honduras Bureau of Shipping 4 0 0 0.00 0.00
32 Honduras International Surveying and
Inspection Bureau 7 0 0 0.00 0.00
33 INCLAMAR (Inspection y Classification
Maritime, S. de. R.L.) 162 27 0 16.67 0.00
34 Indian Register of Shipping 515 35 0 6.80 0.00
35 Indonesian Classification Bureau 110 23 1 20.91 0.91
36 Intermaritime Certification Services, S.A. 2234 143 13 6.40 0.58

58
37 Marconi International Marine Company Ltd. 4 0 0 0.00 0.00
38 International Maritime Register 16 2 0 12.50 0.00
39 International Naval Surveys Bureau 206 21 2 10.19 0.97
40 International Register of Shipping 1507 209 22 13.87 1.46
41 International Ship Classification 1468 154 20 10.49 1.36
42 Iranian Classification Society 127 10 0 7.87 0.00
43 Isthmus Bureau of Shipping 2564 234 19 9.13 0.74
44 Isthmus Maritime Classification Society S.A. 4 0 0 0.00 0.00
45 Korea Classification Society (former Joson Classification Society)
1115 175 15 15.70 1.35
46 Korea Ship Safety Technology Authority 221 1 0 0.45 0.00
47 Korean Register of Shipping 14304 235 4 1.64 0.03
48 Libyan Surveyor Mr. Sif Ennasar 1 0 0 0.00 0.00
49 Abdulhamid Giahmi 0 0 0 #DIV/0
!
#DIV/
0!
50 Lloyd's Register 20287 598 15 2.95 0.07
51 Macosnar Corporation 120 5 0 4.17 0.00
52 Maritime Lloyd Ltd, Georgia 24 1 0 4.17 0.00
53 Maritime Lloyd Ltd, Georgia 6 1 0 16.67 0.00
54 Maritime Technical Systems and Services 115 12 1 10.43 0.87
55 National Cargo Bureau Inc. 14 1 0 7.14 0.00
56 National Shipping Adjusters Inc 87 7 0 8.05 0.00
57 New United International Marine Services
Ltd 57 12 0 21.05 0.00
58 Nippon Kaiji Kyokai 48574 1603 73 3.30 0.15
59 NV Unitas 1 0 0 0.00 0.00
60 Novel Classification Society S.A. 1 0 0 0.00 0.00
61 Overseas Marine Certification Services 1803 215 12 11.92 0.67
62 Panama Bureau of Shipping 216 26 1 12.04 0.46
63 Panama Marine Survey and Certification
Services, Inc. 393 35 3 8.91 0.76
64 Panama Maritime Documentation Services 1788 178 10 9.96 0.56
65 Panama Maritime Surveyors Bureau Inc 89 11 0 12.36 0.00
66 Panama Register Corporation 291 23 0 7.90 0.00
67 Panama Shipping Certificate Inc. 96 6 2 6.25 2.08
68 Panama Shipping Registrar Inc. 523 51 3 9.75 0.57
69 Phoenix Register of Shipping 17 1 0 5.88 0.00
70 Polski Rejestr Statkow 111 9 1 8.11 0.90
71 R.J. Del Pan 2 0 0 0.00 0.00
72 Registro Brasileiro de Navios de Aeronaves 2 0 0 0.00 0.00
73 Registro Internacional Naval S.A. 102 4 0 3.92 0.00
74 Registro Italiano Navale 4018 174 1 4.33 0.02
75 RINAVE Portuguesa 44 3 0 6.82 0.00
76 Russian Maritime Register of Shipping 2274 132 4 5.80 0.18
77 Russian River Register 1 0 0 0.00 0.00
78 Ship Classification Malaysia 90 2 0 2.22 0.00
79 Shipping Register of Ukraine 13 1 1 7.69 7.69
80 SingClass International Pte Ltd 258 57 4 22.09 1.55
81 Sing-Lloyd 450 94 10 20.89 2.22

59
82 Turkish Lloyd 15 1 0 6.67 0.00
83 Turkish Lloyd 2 0 0 0.00 0.00
84 Union Bureau of Shipping 4956 760 74 15.33 1.49
85 Union Marine Classification Society 2 1 1 50.00 50.00
86 Universal Maritime Bureau 1620 208 22 12.84 1.36
87 Universal Shipping Bureau 290 28 2 9.66 0.69
88 Venezuelan Register of Shipping 11 1 0 9.09 0.00
89 Vietnam Register 3955 262 19 6.62 0.48
90 Other 1136 131 13 11.53 1.14
Source: Author’s calculation Data from
Annual Report on Port State Control in The Asia-pacific Region 2011, 2012, 2013 and 2014, Table 5
Annual Report on Port State Control in The Asia-pacific Region 2015 Table 6

60
Annex 7: PORT STATE INSPECTIONS PER SHIP TYPE
Type of ship
No. of
inspectio
ns
No. of inspectio
ns with
deficienci
es
No.of
deficienci
es
No.of
detentio
ns
Average
deficienci
es per ship
Detentio
n
percentage (%)
1 NLS tanker 292 130 570 12 4.38 9.23
2 Combination carrier 220 92 362 7 3.93 7.61
3 Oil tanker 9649 4342 18795 211 4.33 4.86
4 Gas carrier 3289 1531 6353 90 4.15 5.88
5 Chemical tanker 10278 5314 23083 195 4.34 3.67
6 Bulk carrier 52486 29994 135934 1968 4.53 6.56
7 Vehicle carrier 4093 1713 5289 79 3.09 4.61
8 Container ship 23379 13825 55046 707 3.98 5.11
9 Ro-Ro cargo ship 906 703 3693 57 5.25 8.11
10 General cargo/multi-purpose
ship 36622 29582 185057 2846 6.26 9.62
11 Refrigerated cargo carrier 3711 2699 14221 236 5.27 8.74
12 Woodchip carrier 1169 628 2312 33 3.68 5.25
13 Livestock carrier 282 212 1280 26 6.04 12.26
14 Ro-Ro passenger ship 434 384 2541 19 6.62 4.95
15 Passenger ship 1140 698 2961 20 4.24 2.87
16 Factory ship 7 6 29 1 4.83 16.67
17 Heavy load carrier 538 330 1308 25 3.96 7.58
18 Offshore service vessel 721 436 2214 32 5.08 7.34
19 MODU & FPSO 22 18 158 4 8.78 22.22
20 High speed passenger craft 142 128 494 1 3.86 0.78
21 Special purpose ship 274 165 746 14 4.52 8.48
22 High speed cargo craft 1 0 0 0 0.00 0.00
23 Tugboat 1201 785 3824 49 4.87 6.24
24 Others 1530 1146 6038 102 5.27 8.90
Source: Author’s calculation Data from
Annual Report on Port State Control in The Asia-pacific Region 2011, 2012, 2013 and 2014, Table 4
Annual Report on Port State Control in The Asia-pacific Region 2015 Table 5

61