a study on the characteristics of chitosan as an immobilization matrix ...
51
A STUDY ON THE CHARACTERISTICS OF CHITOSAN AS AN IMMOBILIZATION MATRIX FOR BIOSENSORS ANG LEE FUNG UNIVERSITI SAINS MALAYSIA 2007 A STUDY ON THE CHARACTERISTICS OF CHITOSAN AS AN IMMOBILIZATION MATRIX FOR BIOSENSORS 2007 M.Sc. ANG LEE FUNG
Transcript of a study on the characteristics of chitosan as an immobilization matrix ...

A STUDY ON THE CHARACTERISTICS OF CHITOSAN AS AN IMMOBILIZATION MATRIX
FOR BIOSENSORS
ANG LEE FUNG
UNIVERSITI SAINS MALAYSIA 2007
A S
TUD
Y O
N TH
E C
HA
RA
CTE
RIS
TICS
OF C
HITO
SA
N A
S
AN
IMM
OB
ILIZATIO
N M
ATR
IX FO
R B
IOS
EN
SO
RS
2007
M.S
c. A
NG
LEE
FUN
G

A STUDY ON THE CHARACTERISTICS OF CHITOSAN AS AN IMMOBILIZATION MATRIX FOR BIOSENSORS
by
ANG LEE FUNG
Thesis submitted in fulfillment of the requirements for the degree of Master of Science
November 2007

ii
ACKNOWLEDGEMENTS
I would like to convey my gratitude to my venerable supervisor Assoc. Prof. Dr.
Peh Kok Khiang and co-supervisor Assoc. Prof. Dr. Tham Sock Ying for their
invaluable guidance, encouragement, help and patience as well as the
stimulating discussion during the entire research period that lead to the
completion of this project.
I wish to express my sincere appreciation and gratitude to the staff of the
School of Pharmaceutical Sciences, Universiti Sains Malaysia, for their kind
assistance and guidance, especially to Assoc. Prof. Dr. Yvonne Tan Tze Fung.
I also extend my gratitude and regards to my beloved parents who have always
encouraged and supported me in all respects. Special thanks are also
extended to all my lab mates especially Mr. Yam Mun Fei, Ms. Tung Wai Hau,
Ms. Yo Li Chen and Mr. Lim Vuangao for their generous support and superb
cooperation.
Last but not the least, I would like to express my sincere thanks and
appreciation to Malaysia Toray Science Foundation (MTSF) and Your
Honorable Tan Sri Dato’ (Dr) Katsunosuke Maeda for supporting my study.
iii
TABLE OF CONTENTS
PAGE
ACKNOWLEDGEMENTS
ii
TABLE OF CONTENTS
iii
LIST OF TABLES
viii
LIST OF FIGURES
x
LIST OF PLATES
xiv
LIST OF ABBREVIATIONS
xv
LIST OF SYMBOLS
xx
LIST OF APPENDICES
xxii
ABSTRAK
xxiii
ABSTRACT
xxv
CHAPTER 1: INTRODUCTION
1
1.1 CHITOSAN
1
1.1.1 General Introduction and Functional Properties
1
1.1.2 Membrane Properties 5
1.1.3 Molecular Weight and Methods of Characterization 5
1.1.3(a) Viscometry
7
1.1.4 Degree of Deacetylation
9
1.1.5 Applications of Chitosan
12
1.2 BIOSENSOR
15
1.2.1 Introduction
15
1.2.2 Enzyme Immobilization
17
1.2.2(a) Properties of Free Enzyme vs. Immobilized Enzyme
17

iv
1.2.2(b) Support
19
1.2.2(c) Methods of Enzyme Immobilization
20
1.2.3 Transduction Elements
26
1.2.4 Electrochemical Glucose Biosensors
27
1.2.5 Applications of Glucose Biosensors
31
1.3 PROBLEM STATEMENT
32
1.4 SCOPE OF THE PRESENT STUDY
33
CHAPTER 2: MATERIALS AND METHODS
34
2.1 Materials
34
2.2
Determination of Viscosity-Average Molecular Weight of Chitosan
36
2.3 Determination of Density of Dilute Chitosan Solutions
37
2.4 Determination of Degree of Deacetylation of Chitosan Samples using First Derivative UV-Spectrophotometry
38
2.4.1 Calibration Curve of N-acetyl-D-glucosamine
38
2.4.2 Correction of Effect of D-glucosamine on H Values
39
2.4.3 Determination of Degree of Deacetylation of Chitosan
39
2.5 Solubility Studies of Chitosan in Various Organic Acids
40
2.6 Characterization of Chitosan Membranes
40
2.6.1 Appearance, Flexibility and Thickness
40
2.6.2 Mechanical Properties
41
2.6.3 Preparation of Enzyme-Chitosan Membranes
42
2.6.4 Study on the Morphologies of Unmodified and Modified Chitosan Membranes using Scanning Electron Microscopy
43
2.6.5 Fourier Transform Infrared Spectroscopy Analysis
44

v
2.6.5(a) Study on the Structural Characteristics of Chitosan Membranes Cast from Different Organic Acids
44
2.6.5(b) Investigation of Intermolecular Interactions of Immobilized GOD-Chitosan Membranes
44
2.6.6 Standardization of Hydrogen Peroxide and Study on the Diffusion of Hydrogen Peroxide through Chitosan Membranes
45
2.6.6(a) Standardization of Hydrogen Peroxide using Redox Titration
45
2.6.6(b) Study on the Diffusion of Hydrogen Peroxide through Chitosan Membranes
46
2.7 Colorimetric Determination of Glucose
46
2.8 Construction of GOD-Chitosan Electrode
47
2.9 Electrochemical Measurement
48
2.10 Optimization of Experimental Variables for Glucose Biosensor
50
2.11 Characteristics of Glucose Biosensor
51
2.11.1 Response Time
51
2.11.2 Calibration of Glucose Biosensor
51
2.11.3 Determination of Apparent Michaelis-Menten Constant
52
2.11.4 Repeatability and Reproducibility
52
2.11.5 Stability Study
53
2.11.6 Effect of Electroactive Compounds on Biosensor Response
54
2.11.7 Accuracy and Recovery
54
2.12 Statistical Analysis
55
CHAPTER 3: RESULTS AND DISCUSSION
56
3.1 Determination of Viscosity-Average Molecular Weight of Chitosan
56

vi
3.2 Determination of Degree of Deacetylation of Chitosan Samples using First Derivative UV-Spectrophotometry
62
3.3 Solubility Studies of Chitosan in Various Organic Acids
67
3.4 Characterization of Chitosan Membranes
69
3.4.1 Appearance, Flexibility and Thickness
69
3.4.2 Mechanical Properties (Tensile strength and Elongation at Break)
71
3.4.3 Morphologies of Unmodified and Modified Chitosan Membranes
81
3.4.4 Fourier Transform Infrared Spectroscopy Analysis
85
3.4.4(a) Study on the Structural Characteristics of Chitosan Membranes Cast from Different Organic Acids
85
3.4.4(b) Investigation of Intermolecular Interactions of Immobilized GOD-Chitosan Membranes using FTIR
88
3.4.5 Standardization of Hydrogen Peroxide and Study on the Diffusion of Hydrogen Peroxide through Chitosan Membranes
92
3.4.5(a) Standardization of Hydrogen Peroxide using Redox Titration
92
3.4.5(b) Study on the Diffusion of Hydrogen Peroxide through Chitosan Membranes
93
3.5 Catalytic Activity Measurements of Soluble and Immobilized Enzyme and Determination of Michaelis-Menten Constant for Soluble Enzyme using Spectrophotometric Method
96
3.5.1 Catalytic Activity Measurements of Soluble and Immobilized Enzyme
96
3.5.2 Determination of Michaelis-Menten Constant for the Soluble Enzyme
101
3.6 Steady-State Amperometric Response of Glucose Biosensor
102
3.7 Optimization of Experimental Variables for Glucose Biosensor
104
3.7.1 Selection of Applied Potential 104
vii
3.7.2 Effect of Membrane Thickness on Biosensor Response
106
3.7.3 Effect of Glutaraldehyde Concentration used in Immobilization on Biosensor Response
109
3.7.4 Effect of Enzyme Concentration used in Immobilization on Biosensor Response
111
3.7.5 Effect of Temperature on Biosensor Response
113
3.7.6 Selection of pH for Biosensor Analysis
115
3.7.7 Effect of Buffer Concentration on Biosensor Response
117
3.8 Characteristics of the Glucose Biosensor
119
3.8.1 Response Time
119
3.8.2 Calibration of Glucose Biosensor
121
3.8.3 Determination of Apparent Michaelis-Menten Constant
124
3.8.4 Repeatability and Reproducibility
128
3.8.5 Stability Study
130
3.8.6 Effect of Electroactive Compounds on Biosensor Response
133
3.8.7 Accuracy and Recovery
138
CHAPTER 4: CONCLUSION
141
CHAPTER 5: RECOMMENDATION FOR FUTURE RESEARCH
142
REFERENCES
144
APPENDICES
LIST OF PUBLICATIONS
viii
LIST OF TABLES
PAGE
Table 3.1(a) The results of density, pH, efflux time, relative viscosity, specific viscosity, reduced viscosity and inherent viscosity of FCHIT. Mean±S.E.M, n=6.
58
Table 3.1(b) The results of density, pH, efflux time, relative viscosity, specific viscosity, reduced viscosity and inherent viscosity of SCHIT. Mean±S.E.M, n=6.
58
Table 3.2(a) Pearson correlation results of FCHIT.
59
Table 3.2(b) Pearson correlation results of SCHIT.
59
Table 3.3 Intrinsic viscosity and viscosity-average molecular weight results of FCHIT and SCHIT. Mean±S.E.M, n=6.
59
Table 3.4 H values and degree of deacetylation of chitosan samples determined by first derivative spectrophotometer. Mean±S.E.M, n=5.
63
Table 3.5 Solubility results of chitosan in aqueous solutions of various organic acids. Mean±S.E.M, n=3.
68
Table 3.6 The physical appearance, flexibility, thickness and time to form membrane in oven at 60 °C.
70
Table 3.7(a) Mechanical properties of FCHIT and SCHIT membranes prepared in different organic acids. Mean±S.E.M, n=6.
73
Table 3.7(b) Mechanical properties of different thickness of FCHIT and SCHIT membranes prepared in acetic acid solution. Mean±S.E.M, n=6.
74
Table 3.8 Peak assignments in FTIR spectra of SCHIT-HAc, SCHIT-LA and SCHIT-MA.
87
Table 3.9 Standardization of KMnO4 with oxalic acid and subsequent determination of H2O2 concentration.
92
Table 3.10 Effect of membrane thickness on electrode response to 0.5 mM H2O2. aMean±S.E.M, n=6; bmean±S.E.M, n=3.
95
Table 3.11 Catalytic activity of different immobilized enzyme- membranes. Mean±S.E.M, n=3.
99

ix
Table 3.12 The repeatability and reproducibility of the biosensors.
129
Table 3.13 Influence of some electroactive compounds on glucose biosensor response. Mean±S.E.M, n=3.
135
Table 3.14 Comparison of glucose level in rat serum determined using glucose biosensors and ABTS-spectrophotometric method. Recovery test using glucose biosensors is also shown.
139
Table 3.15 Pearson correlation results of biosensors and spectrophotometric method in determination of glucose level in rat serum.
140
x
LIST OF FIGURES
PAGE
Figure 1.1 Production of crude chitosan.
2
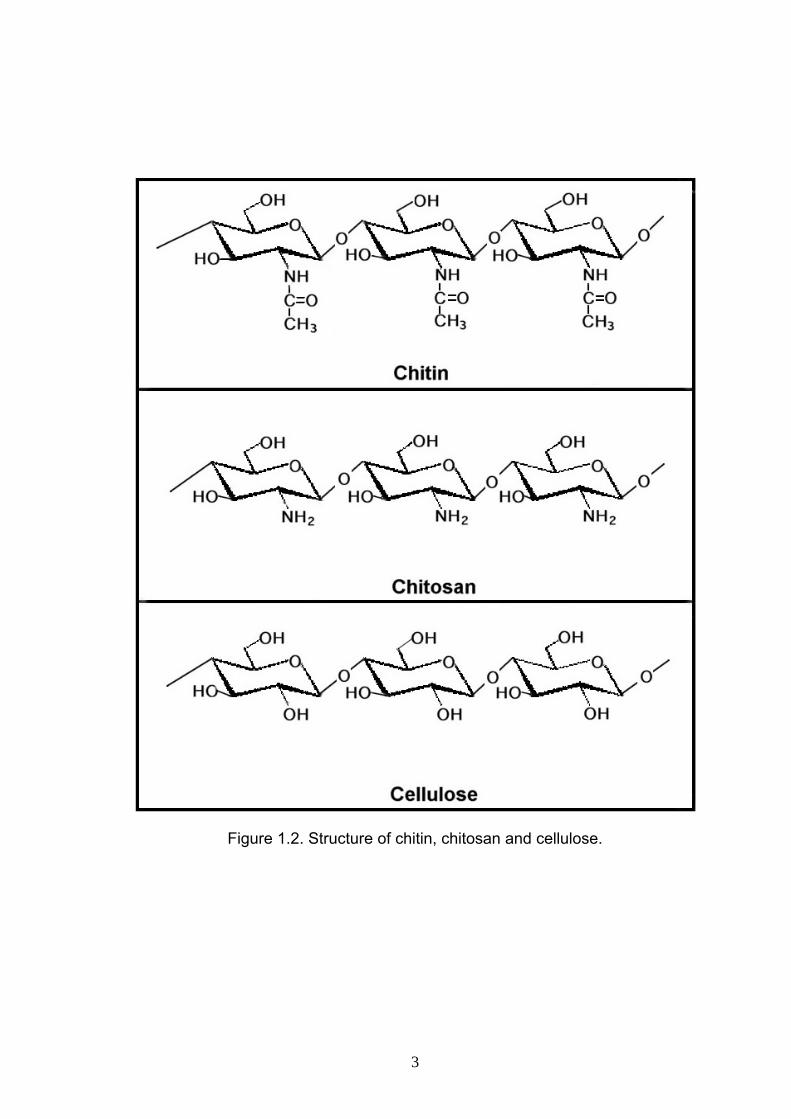
Figure 1.2 Structure of chitin, chitosan and cellulose.
3
Figure 1.3 Crosslinked structure between glutaraldehyde and enzyme. Adopted from Kennedy & Cabral (1987).
26
Figure 2.1 Schematic representation of the experimental set-up (WE: working electrode; RE: reference electrode; CE: counter electrode).
49
Figure 3.1 Huggins-Kraemer plot for intrinsic viscosity calculation of FCHIT.
60
Figure 3.2 Huggins-Kraemer plot for intrinsic viscosity calculation of SCHIT.
61
Figure 3.3(a) First derivative spectra of various standard solutions of N-acetylglucosamine and acetic acid solutions. I=0.005, II=0.01, III=0.02, IV=0.03, V=0.04 and VI=0.05 mg/ml of N-acetylglucosamine in 0.01 M acetic acid; A1=0.01 M, A2=0.02 M and A3=0.03 M acetic acid.
64
Figure 3.3(b) First derivative spectra of chitosan samples and acetic acid solutions. A1=0.01 M, A2=0.02 M and A3=0.03 M acetic acid; and S1=FCHIT and S2=SCHIT of chitosan samples.
65
Figure 3.4 Calibration curve of N-acetylglucosamine.
66
Figure 3.5 Correction curve for N-acetylglucosamine determination.
66
Figure 3.6 Comparison of tensile strength of FCHIT membranes prepared in different organic acids: acetic acid, lactic acid and maleic acid (mean±S.E.M, n=6). * and *** indicate significance level among the comparison groups at P<0.05 and P<0.001, respectively.
75
Figure 3.7 Comparison of tensile strength of SCHIT membranes prepared in different organic acids: acetic acid, lactic acid and maleic acid (mean±S.E.M, n=6). ** and *** indicate significance level among the comparison groups at P<0.01 and P<0.001, respectively.
76

xi
Figure 3.8 Comparison of elongation at break of FCHIT membranes prepared in different organic acids: acetic acid, lactic acid and maleic acid (mean±S.E.M, n=6). *** indicates significance level among the comparison groups at P<0.001.
77
Figure 3.9 Comparison of elongation at break of SCHIT membranes prepared in different organic acids: acetic acid, lactic acid and maleic acid (mean±S.E.M, n=6). *** indicates significance level among the comparison groups at P<0.001.
78
Figure 3.10 Comparison of membrane tensile strength between FCHIT-HAc and SCHIT-HAc prepared at different thickness (mean±S.E.M, n=6). ** and *** indicate significance level among the comparison groups at P<0.01 and P<0.001, respectively.
79
Figure 3.11 Comparison of membrane elongation at break between FCHIT-HAc and SCHIT-HAc prepared at different thickness (mean±S.E.M, n=6). * indicates significance level among the comparison groups at P<0.05.
80
Figure 3.12 FTIR spectra of SCHIT membranes cast from different organic acids: (a) acetic acid, (b) lactic acid and (c) maleic acid.
86
Figure 3.13 FTIR spectra of (a) crystalline GOD; (b) FCHIT membrane; (c) GOD-FCHIT membrane showing the interactions between GOD and chitosan membrane after immobilization.
90
Figure 3.14 FTIR spectra of (a) GOD-FCHIT membrane and (b) GOD-SCHIT membrane.
91
Figure 3.15 Effect of enzyme loading on the retention activity of GOD on chitosan.
100
Figure 3.16 Eadie-Hofstee plot for the determination of Michaelis-Menten constant of the soluble GOD.
101
Figure 3.17 Steady-state current-time response of GOD-FCHIT/PT to successive addition of 20 μl aliquots of 1.0 M glucose at an applied potential of 0.6 V.
103
xii
Figure 3.18 Effect of applied potential on the steady-state response with a bare platinum electrode in sensing 0.05 mM H2O2 and GOD-FCHIT/PT in detecting 2 mM glucose. Phosphate buffer was used as the medium in both cases. Mean±S.E.M, n=4.
105
Figure 3.19 Effect of chitosan membrane thickness on GOD-FCHIT/PT response for glucose in 0.1 M phosphate buffer (pH 7.0). Mean±S.E.M, n=6.
107
Figure 3.20 Effect of chitosan membrane thickness on GOD-SCHIT/PT response for glucose in 0.1 M phosphate buffer (pH 7.0). Mean±S.E.M, n=6.
108
Figure 3.21 Effect of glutaraldehyde concentration on GOD-FCHIT/PT response to 4.76 mM glucose (mean±S.E.M, n=3). * and *** indicate significance level among the comparison groups at P<0.05 and P<0.001, respectively.
110
Figure 3.22 Effect of enzyme concentration used in immobilization on biosensor response to 4.76 mM glucose. Mean±S.E.M, n=6.
112
Figure 3.23 Effect of temperature on GOD-FCHIT/PT response to 5.66 mM glucose. Mean±S.E.M, n=6.
114
Figure 3.24 Effect of pH on GOD-FCHIT/PT response to 5.66 mM glucose. Experiments were performed at 35 °C. Mean±S.E.M, n=4.
116
Figure 3.25 Effect of buffer concentration (pH 6.0) on GOD-FCHIT/PT response. The experiments were performed using 5.66 mM glucose at 35 °C (mean±S.E.M, n=4). *, ** and *** indicate significance level among the comparison groups at P<0.05, P<0.01 and P<0.001, respectively.
118
Figure 3.26 Response time curve for GOD-FCHIT/PT to glucose.
120
Figure 3.27 Response time curve for GOD-SCHIT/PT to glucose.
120
Figure 3.28 Calibration curve of the GOD-FCHIT/PT under optimal experimental conditions. Inset: Linear range from 10.0 µM to 10.8 mM glucose with linear regression equation y=0.0620x + 0.0058; R2=0.9942, n=6.
122
xiii
Figure 3.29 Calibration curve of the GOD-SCHIT/PT under optimal experimental conditions. Inset: Linear range from 10.0 µM to 11.4 mM glucose with linear regression equation y=0.0366x + 0.0037; R2=0.9969, n=5.
123
Figure 3.30 Eadie-Hofstee plot of GOD-FCHIT/PT. The glucose concentration range chosen was optimal for the determination of app
MK and Imax.
126
Figure 3.31 Eadie-Hofstee plot of GOD-SCHIT/PT. The glucose concentration range chosen was optimal for the determination of app
MK and Imax.
127
Figure 3.32 Stability of glucose biosensors over a period of 60 days. Data points shown are the mean value of three biosensors.
132
Figure 3.33 Ratio of currents for mixtures containing 0.1 mM electroactive compound and 5.0 mM glucose to 5.0 mM glucose alone (mean±S.E.M, n=3). ** and *** indicate significance level among the comparison groups at P<0.01 and P<0.001, respectively.
136
Figure 3.34 The response of different enzyme electrodes to 5.0 mM glucose under optimal experimental conditions (mean±S.E.M, n=4). *** indicates significance level among the comparison groups at P<0.001.
137

xiv
LIST OF PLATES
PAGE
Plates 3.1 SEM micrographs of (a) FCHIT and (b) SCHIT membranes at magnification of 500X.
82
Plates 3.2 SEM micrographs of (c) GOD-FCHIT and (d) GOD-SCHIT membranes at magnification of 5,000X.
83
Plates 3.3 SEM micrographs of (e) GOD-FCHIT and (f) GOD-SCHIT membranes at magnification of 10,000X.
84

xv
LIST OF ABBREVIATIONS
ABBREVIATIONS MEANING
% v/v Percent “volume in volume” expresses the number of
milliliters of an active constituent in 100 milliliters solution.
% w/v Percent “weight in volume” expresses the number of grams of an active constituent in 100 milliliters of solution.
% w/w Percent “weight in weight” expresses the number of grams of an active constituent in 100 grams of solution.
AA Ascorbic acid.
ABTS 2,2’-azino-bis(3-ethylbenzthiazoline)-6-sulfonic acid.
ABTS+ Oxidized 2,2’-azino-di-(3-ethylbenzthiazoline)-6-sulfonic acid.
Ag/AgCl Silver/silver chloride.
ANOVA Analysis of variance.
c Concentration by volume.
cm Centimeter.
Cys L-cysteine.
D Dextro (in configurational sense only).
DD Degree of deacetylation.
DTGS Deuterated tri-glycine sulfate.
E Elongation at break.
e.g. (example gratia) for example.
Eq. Equation.
et al. (et alii) and others, and other people: for three or more co-authors or co-workers.
FA Molar fraction of acetylated units.
xvi
FAD Flavin adenine dinucleotide.
FADH2 Reduced flavin adenine dinucleotide.
FCHIT Chitosan sample purchased from Fluka.
FDUVS First derivative ultraviolet spectrophotometry.
FET Field-effect transistor.
g Gram(s).
g/ml Gram per milliliter.
GFC Gel filtration chromatography.
GlcN D-glucosamine.
GlcNAc N-acetyl-D-glucosamine.
GOD Glucose oxidase.
GOD-FCHIT Immobilized GOD-FCHIT membrane.
GOD-FCHIT/PT Enzyme electrode of GOD-FCHIT.
GOD-SCHIT Immobilized GOD-SCHIT membrane.
GOD-SCHIT/PT Enzyme electrode of GOD-SCHIT.
GPC Gel permeation chromatography.
H Vertical distance (mm) from ZCP to each GlcNAc solution spectrum.
h Hour.
H1 H values of the pure GlcNAc solution.
H2 H values of the different percentages of GlcNAc solutions.
HAc Acetic acid.
HPLC High-pressure liquid chromatography.
I Steady state current.
i.e. (id est) that is.
xvii
Imax Maximum current.
IR Infrared.
kDa Kilo Dalton.
kg Kilogram(s).
kg/m3 Kilogram per cubic meter.
L Path length of light.
L Levo (in configurational sense only).
LA Lactic acid.
lim Limit.
ln Natural logarithms.
M1 Weight of the solvent or chitosan solution (g), obtained from weight of pycnometer containing solvent or solution – weight of empty pycnometer.
M2 Weight of water (g), obtained from weight of pycnometer containing water – weight of empty pycnometer.
MA Maleic acid.
mg Milligram.
mg/dl Milligram per deciliter.
mg/ml Milligram per millimeter.
min Minute.
ml Milliliter.
ml/cm2 Millimeter per square centimeter.
mm Millimeter.
mm2 Square millimeter.
MPa Mega Pascal.
Mv Viscosity-average molecular weight.

xviii
MW Molecular weight.
N Newton.
nA Nanoampere.
nm Nanometer.
NMR Nuclear magnetic resonance.
no. Number.
PCM Acetaminophen.
pH pondus Hydrogenii (acid-base scale; log of reciprocal of hydrogen ion concentration).
pI Isoelectric point.
pKa The negative logarithm of the dissociation constant.
POD Peroxidase.
Pt Platinum electrode.
R2 Correlation coefficient.
rpm Rotation per minute.
RSD Relative standard deviation.
s Second.
S.E.M Standard error mean.
S/N Signal-to-noise ratio.
SCHIT Chitosan sample purchased from Sigma.
SD Standard deviation.
SEA Specific enzyme activity.
SEC Size exclusion chromatography.
SEM Scanning electron microscopy.
TS Tensile strength.
UA Uric acid.

xix
UV Ultra violet.
UV/VIS Ultra violet-visible.
V Volt(s).
Vmax Maximal velocity.
vs. Versus.
W Mass of chitosan sample used.
ZCP Zero crossing point of aqueous acetic acid.
xx
LIST OF SYMBOLS
SYMBOLS MEANING
appMK Apparent Michaelis-Menten constant.
% Percent.
[η] Intrinsic viscosity.
< Greater than.
> Less than.
∆G°‡ Free energy of activation.
°C Centigrade degrees.
µl Microliter.
µmol Micromole.
A Absorbance.
a Mark-Houwink constant.
A Correction factor for the thrust of the air, 0.0012M2.
E Molar extinction coefficient.
K Mark-Houwink constant.
M Molar.
mM Millimolar.
N Normal (equivalents of solute per liter of solution, as
applied to concentration).
n Number of run.
t Efflux time of chitosan solution flow in viscometer (s).
t0 Efflux time of the solvent flow in viscometer (s).
U Unit of enzymatic activity.
α Alfa.
xxi
β Beta.
δ Delta.
η Viscosity of the solution or liquid.
η0 Viscosity of solvent.
ηinh Inherent viscosity.
ηred Reduced viscosity.
ηrel Relative viscosity.
ηsp Specific viscosity.
μA Micro ampere.
ρ Density of chitosan solution.
ρ0 Density of solvent.
xxii
LIST OF APPENDICES
Appendix I
Approval letter from Animal Ethic Committee
Appendix II Preparation of different concentrations of N-acetyl-D-glucosamine (GlcNAc) (% w/w)
Appendix III Calculation of degree of deacetylation of FCHIT
xxiii
KAJIAN CIRI-CIRI KITOSAN SEBAGAI MATRIKS IMMOBILISASI BAGI BIOSENSOR
ABSTRAK
Dua jenis kitosan (FCHIT dan SCHIT) telah diselidik sebagai matriks
immobilisasi bagi pembuatan biosensor glukosa. Kelikatan-purata berat
molekul bagi FCHIT and SCHIT telah ditentukan iaitu 981.80 kD dan 398.61 kD
masing-masing. Darjah deasetilasi yang ditentukan dengan FDUV
spektrofotometri didapati sebanyak 82.44% dan 77.20% masing-masing. Ciri-
ciri fizikal larutan dan membran kitosan telah dikaji dengan melarutkannya di
dalam pelbagai jenis pelarut asid organik (asid asetik, asid laktik dan asid
maleik). Kedua-dua jenis kitosan paling larut dalam asid asetik akueus, diikuti
dengan asid laktik dan akhir sekali asid maleik. Membran kitosan yang
disediakan dalam asid asetik adalah fleksibel, lutsinar, rata dan cepat kering.
Membran tersebut mempamerkan kekuatan mekanikal dan panjangan-pada-
takat-pecah yang baik serta nyata sekali lebih tinggi daripada yang disediakan
dalam asid laktik dan asid maleik. Hasil kajian analisis FTIR dan mikrograf
SEM menunjukkan interaksi intermolekular antara kitosan dan glukosa
oksidase (GOD). Aktiviti katalitik yang lebih tinggi telah diperhatikan pada
GOD-FCHIT daripada GOD-SCHIT dan juga melalui ikatan-silang dengan
glutaraldehid daripada penjerapan. Muatan enzim yang lebih tinggi daripada
0.6 mg boleh mengurangkan aktiviti. Reaksi terhadap glukosa paling tinggi
diperhatikan pada membran dengan ketebalan 0.21 ml/cm2 bagi GOD-
FCHIT/PT, manakala pada membran dengan ketebalan 0.35 ml/cm2 bagi GOD-
SCHIT/PT. Keadaan eksperimen yang optimum untuk menganalisis glukosa

xxiv
pada pH 6.0 melalui biosensor didapati ialah 35°C dengan keupayaan gunaan
pada 0.6 V. Dalam keadaan itu, masa reaksi pada 85 s dan 65 s telah
diperhatikan bagi GOD-FCHIT/PT dan GOD-SCHIT/PT masing-masing.
Michaelis-Menten tetap yang nyata didapati 12.7370 mM bagi GOD-FCHIT/PT
dan 17.6920 mM bagi GOD-SCHIT/PT. Ini menunjukkan bahawa GOD-
FCHIT/PT mempunyai afiniti yang lebih besar bagi enzim itu. Lagipun, GOD-
FCHIT/PT menunjukkan kepekaan yang lebih tinggi (52.3666 nA/mM glukosa)
apabila dibandingkan dengan GOD-SCHIT/PT (9.8579 nA/mM glukosa) pada
S/N>3. Kebolehan mengulang dan kebolehan menyalin yang lebih baik telah
dicapai oleh GOD-FCHIT/PT dibandingkan dengan GOD-SCHIT/PT dalam
sukatan glukosa. GOD-FCHIT/PT didapati menunjuk aktiviti enzim yang
tertinggi di kalangan elektrod yang diselidik selama 2 bulan dalam kajian. Takat
gangguan dihadapi oleh GOD-FCHIT/PT dan GOD-SCHIT/PT adalah tidak
berbeza dengan nyata sekali. Walaupun biosensor dengan selaput Nafion
dapat mengurangkan gangguan isyarat dengan nyata sekali, ia juga dapat
mengurangkan reaksi terhadap glukosa dengan signifikan. Perlaksanaan
biosensor dalam penentuan glukosa dalam serum tikus telah ditaksir.
Keputusan ketepatan dan dapat kembali yang lebih baik telah diperolehi oleh
GOD-FCHIT/PT. Maka, GOD-FCHIT/PT menunjukkan perlaksanaan yang lebih
baik apabila dibandingkan dengan GOD-SCHIT/PT. Sebagai kesimpulan,
membran kitosan mempunyai potensi untuk dijadikan suatu matriks yang
sesuai bagi perkembangan biosensor glukosa.
xxv
A STUDY ON THE CHARACTERISTICS OF CHITOSAN AS AN IMMOBILIZATION MATRIX FOR BIOSENSORS
ABSTRACT
Two chitosan samples (FCHIT and SCHIT) were investigated as an enzyme
immobilization matrix for the fabrication of glucose biosensor. The viscosity-
average molecular weight of FCHIT and SCHIT were determined to be 981.80
kD and 398.61 kD respectively. Their degree of deacetylation determined by
FDUV spectrophotometry were 82.44% and 77.20% respectively. The physical
properties of chitosan solution and membrane were studied by dissolving the
chitosan in different organic acids (acetic acid, lactic acid and maleic acid).
Both the chitosan samples were most soluble in aqueous acetic acid, followed
by lactic acid and maleic acid. Chitosan membranes prepared from acetic acid
were flexible, transparent, smooth and quick-drying. They exhibited good
mechanical strength and elongation at break and the values were significantly
higher than those prepared in lactic acid and maleic acid. FTIR spectra and
SEM micrographs showed the existence of intermolecular interactions between
chitosan and glucose oxidase (GOD). Higher catalytic activities were observed
on GOD-FCHIT than GOD-SCHIT and for those crosslinked with
glutaraldehyde than through the adsorption technique. Enzyme loading higher
than 0.6 mg could decrease its activity. The highest response for glucose was
observed at 0.21 ml/cm2 membrane thickness for GOD-FCHIT/PT and 0.35
ml/cm2 membrane thickness for GOD-SCHIT/PT. The optimum experimental
conditions for analyzing glucose at pH 6.0 using the biosensors were found to
be at 35 °C with an applied potential of 0.6 V. Under such conditions, response

xxvi
times of 85 s and 65 s were observed for GOD-FCHIT/PT and GOD-SCHIT/PT
respectively. The apparent Michaelis-Menten constant ( appMK ) was found to be
12.7370 mM for GOD-FCHIT/PT and 17.6920 mM for GOD-SCHIT/PT. This
indicated that the GOD-FCHIT/PT had greater affinity for the enzyme.
Moreover, GOD-FCHIT/PT showed higher sensitivity (52.3666 nA/mM glucose)
when compared with GOD-SCHIT/PT (9.8579 nA/mM glucose) at S/N>3. A
better repeatability and reproducibility were achieved by GOD-FCHIT/PT than
GOD-SCHIT/PT in the glucose measurement. GOD-FCHIT/PT was found to
give the highest enzymatic activity among the electrodes under investigation.
The extent of interference encountered by GOD-FCHIT/PT and GOD-
SCHIT/PT was not significantly different. Although the Nafion coated biosensor
significantly reduced the signal due to the interferents under study, it also
significantly reduced the response to glucose. The performance of the
biosensors in the determination of glucose in rat serum was evaluated.
Comparatively better accuracy and recovery results were obtained for GOD-
FCHIT/PT. Hence, GOD-FCHIT/PT showed a better performance when
compared with GOD-SCHIT/PT. In conclusion, chitosan membrane has the
potential to be a suitable matrix in the development of glucose biosensor.
1
CHAPTER 1: INTRODUCTION
1.1 CHITOSAN
1.1.1 General Introduction and Functional Properties
Chitosan, a linear binary heteropolysaccharide, is composed of β-1,4-linked
glucosamine (GlcN) with various degrees of N-acetylation of GlcN residues
(Kittur et al., 2003). Chitosan occurs naturally in some microorganisms, yeast
and fungi (Illum et al., 2001). Its occurrence is much less widespread than that
of chitin. Chitin is a linear chain consisting of N-acetyl-D-glucosamine (2-
acetamido-2-deoxy-β-D-gluconopyranose) joined together by β(1→4) linkage
(Krajewska, 2005). It is a non-toxic, biocompatible and biodegradable natural
polymer of high molecular weight (~500,000 kDa) (Yadav & Bhise, 2004). It is
the second most common polysaccharide occurring in nature after cellulose.
Chitin is found in abundance in shells of exoskeletons of insects, shells of
crustaceans and fungal cell wall (Illum et al., 2001; Tangpasuthadol et al.,
2003; Aberg et al., 2004).
Chitosan is prepared by alkaline N-deacetylation of chitin (Kittur et al., 2003;
Berger et al., 2004) using concentrated sodium hydroxide (NaOH) solutions at
high temperature for a long period of time. Another approach to produce
chitosan is by enzymatic N-deacetylation under relatively mild conditions
(Prashanth et al., 2002; Wang et al., 2004). The commercially available
chitosan is mostly derived by alkaline N-deacetylation from chitin of
crustaceans because it is easily obtainable from the shells of crabs, shrimps,
lobsters and krill (Amorim et al., 2003; Cervera et al., 2004a; Krajewska, 2005).

2
Figure 1.1 shows the two-step process in the production of chitosan. It involves
extraction of chitin and removal of calcium carbonate (CaCO3) with dilute
hydrochloric acid from shells of crustaceans and deproteination with dilute
aqueous sodium hydroxide. The second step is deacetylation of chitin by
treating it with 40-50% aqueous sodium hydroxide at 110-115 °C for several
hours without oxygen. Chitosan is produced when the degree of deacetylation
(DD) is greater than 50% (Steenkamp et al., 2002). However, it was also
reported that chitin with a DD of 75% or above is known as chitosan (Cervera
et al., 2004a).
The two polymers, chitin and chitosan have similar chemical structure and are
analogues of the homopolymer cellulose where the respective acetamido and
amino groups replace the hydroxyl group at carbon-2 as shown in Figure 1.2.
The difference between chitin and chitosan is in the acetyl content of the
polymer where they can be distinguished by their solubility.
Figure 1.1. Production of crude chitosan.
Shells of crustaceans
Removal of CaCO3 with HCl Removal of proteins with NaOH
Chitin
Deacetylation with NaOH
Chitosan
3
Figure 1.2. Structure of chitin, chitosan and cellulose.

4
The degree of deacetylation (DD) and molecular weight (MW) are two
fundamental parameters that can affect the properties and functionality of
chitosan (Berger et al., 2004; Baxter et al., 2005; Cho et al., 2006). These
properties include solubility (Rege & Block, 1999; Hwang & Shin, 2000; Duarte
et al., 2002), viscosity (Yadav & Bhise, 2004), reactivity such as heavy metal
ion chelation and proteinaceous material coagulation (Sabnis & Block, 2000;
Duarte et al., 2002; Gamage & Shahidi, 2007), loading (enzyme-loaded)
properties (Alsorra et al., 2002) and film properties such as tensile strength,
elasticity, elongation and moisture absorption (Lipscomb, 1995; Tan et al.,
1998; Nunthanid et al., 2001).
With the apparent pKa value of the amino group of about 6.5 (Taqieddin &
Amiji, 2004), chitosan is only soluble in aqueous acidic solutions and insoluble
in water and alkaline solutions (Krajewska, 2004). When dissolved, the amino
groups (–NH2) of the glucosamine are protonated to -NH3+ (Wang et al., 2006).
The cationic polyelectrolyte readily forms electrostatic interactions with other
anionic groups (Fee et al., 2003). In an acidic environment the majority of
polysaccharides are usually neutral or negatively charged (Chen & Tsaih, 1998;
Hwang & Shin, 2000). The cationic chitosan molecule interacts with negatively
charged surfaces and anionic systems leading to modification of the
physicochemical characteristics of these systems (Illum et al., 2001; Xu et al.,
2005), ultimately giving rise to its unique functional properties.

5
1.1.2 Membrane Properties
The mechanical property is one of the parameters considered in the selection
of the membrane in any application (Chen & Hwa, 1996). Tensile testing
provides an indication of the strength and elasticity of the membrane. Tensile
strength is a measurement of breaking strength applied per unit of cross-
sectional area. Elongation at break however, is a measure of the ductility of a
membrane, a characteristic that defines the ability of a membrane to deform
before failure occurs. Therefore, elongation is a type of deformation, which is
simply a change in shape under stress. Low values for elongation at break
imply brittleness in the membrane (Macleod et al., 1997). A membrane is
considered brittle when it cannot deform very much or stretch very far before it
breaks. Therefore, tensile strength and elongation at break take into account
the response of membranes to an external stress.
1.1.3 Molecular Weight and Methods of Characterization
The total length of the chitosan polymer formed by repeating units of D-
glucosamine is an important characteristic of the molecule. Hence, the
molecular weight (MW) is a key feature for its functional properties (Wang et
al., 2004). Nunthanid et al. (2001) reported that increase in molecular weight of
chitosan increased the tensile strength, elongation as well as moisture
absorption of the films. Chen and Hwa (1996) explored the effect of MW of
chitosan with the same degree of deacetylation (DD) on the tensile strength,
elongation at break, enthalpy and permeability properties of the chitosan
membrane. They showed that tensile strength, elongation at break and
enthalpy of membrane prepared from high MW chitosan were higher than those
6
of low MW chitosan. However, the permeability of membrane prepared from
high MW chitosan was lower than that prepared from low MW chitosan. Higher
MW chitosan was reported to have good film-forming properties because of
intra- and intermolecular hydrogen bonding (Cervera et al., 2004b).
Furthermore, high MW chitosan could affect the ability of chitosan to retard
drug release. Fukura et al. (2006) reported the use of high and low MW
chitosan as matrix tablet retardants and as drug release enhancers for poorly
water-soluble drugs respectively. The latter might be due to an improvement in
wettability resulting from better solubility of low MW chitosan in water. The
effect of MW of chitosan on its antibacterial activity has also been explored.
Increasing the MW of chitosan increased the antibacterial activity (Zhang et al.,
2003).
Due to the harsh deacetylation in commercial processing of native chitin
involving both alkaline N-deacetylation and acidic depolymerization,
commercial chitosan are available in the MW range of 50 to 2,000 kDa (Rege &
Block, 1999). MW of chitosan can be further lowered by acidic
depolymerization (Berger et al., 2004) and prolonged reaction time of
deacetylation (Blair et al., 1987).
MW of chitosan can be measured by gel permeation chromatography (Chen &
Hwa, 1996; Pochanavanich & Suntornsuk, 2002; Kumar et al., 2004), size-
exclusion chromatography coupled to multi-angle laser light scattering (Fee et
al., 2003), high-performance liquid chromatography (Wu et al., 1976), light
scattering (Rao, 1993; Chen & Tsaih, 1998) or viscometry (Maghami &
7
Roberts, 1988; Chen & Hwa, 1996; Schipper et al., 1996; Sabnis & Block,
2000; Berth & Dautzenberg, 2002). Among these techniques, viscometry is the
most commonly used method for determining the MW of polymers (Wang et al.,
2004). Use of light-scattering instrument usually requires prior experience and
unknown sources of dust in the sample can often corrupt the data. Although gel
permeation chromatography (GPC), size exclusion chromatography (SEC),
high-pressure liquid chromatography (HPLC) and gel filtration chromatography
(GFC) are by far the most versatile and useful techniques for the determination
of MW in a polymer sample, these would involve the use of expensive
instruments.
1.1.3(a) Viscometry
Polymers dissolved in solution may have polymer-solvent interactions, and
generally results in an increase in viscosity (Sekhon & Singh, 2004). The
viscosity of polymers is dependent on molecular weight (MW). The higher the
MW of polymer, the more viscous the polymer solution will be (Choi et al.,
2005). When a polymer has a higher MW, it has a bigger hydrodynamic
volume, that is, the volume of a polymer coil when it is in solution. The solvent
molecules will be bound more strongly to the polymer with increasing
hydrodynamic volume, leading to a decrease in the motion of the polymer in the
solvent. Hence, the viscosity of a polymer solution is proportional to the MW of
the polymer. Therefore, by measuring the viscosity of a polymer solution, the
MW of the polymer can be conveniently determined.

8
The viscosity of a fluid is a measure of its resistance to flow (Harding, 1997).
Several important viscosity functions are used in viscosity studies. The relative
viscosity, ηrel = η/η0, is the dimensionless ratio of solution viscosity, η, to solvent
viscosity, η0. The specific viscosity is given by ηsp = ηrel – 1. The reduced
viscosity, ηred = ηsp/c, is the increase in fluid viscosity per unit polymer solute
concentration, c. The unit of reduced viscosity is ml/g (or dl/g). A related term is
the inherent viscosity, ηinh = (lnηrel)/c. Owing to the effects of non-ideality and/or
associative phenomena, both ηred and ηinh are concentration dependent. The
limit as c→0 of both ηred and ηinh is defined as the intrinsic viscosity [η],
presumably so named because it is an intrinsic function of the
dissolved/dispersed macromolecule (Harding, 1997):
[η] = )(ηlim red0c→
= /c)(ηlim sp0c→
[η] = )(ηlim inh0c→
= )/c}{(lnηlim rel0c→
Extrapolation of zero polymer concentration will eliminate polymer
intermolecular interactions. When the polymer concentration is expressed in
g/ml, the units of [η] will be ml/g. The plots used to find the intrinsic viscosity are
called the Huggins plot (ηred versus c) which usually has a positive slope and
Kraemer plot [ln(η/η0) versus c] which has a negative slope. The curves of both
plots should be linear with a common intercept, which is the intrinsic viscosity
(Harding, 1997).
The intrinsic viscosity measured in a specific solvent is related to the viscosity-
average molecular weight, Mv, by the Mark-Houwink equation,
[η] = KMva
9
where K and a are Mark-Houwink constants, whose values depend on the
polymer type and the solute-solvent system (Laka & Chernyavskaya, 2006).
For chitosan, they are affected by the degree of deacetylation, pH, ionic
strength and temperature (Mao et al., 2004; Wang et al., 2004) but are
independent of MW over a wide range of values (Prashanth et al., 2002; Kittur
et al., 2003; Wang et al., 2004). The exponent ‘a’ is a function of polymer
geometry, and is equal to 0, 0.5~0.8 and 1.8 for sphere, random coil and rod
shape respectively. These constants can be determined experimentally by
measuring the intrinsic viscosities of several polymer samples for which the
MW can be determined by an independent method such as light scattering
(Wang et al., 1991).
1.1.4 Degree of Deacetylation
The chemical composition of different types of chitosan is characterized by the
FA value (molar fraction of acetylated units) or the degree of deacetylation [DD
= 100(1- FA)%] (Trzciński et al., 2002). DD is the mole fraction of the
glucosamine residue (GlcN) in the polymer chain (Shigemasa et al., 1996),
indicating the proportion of free amino groups (reactive after dissolution in weak
acid) on the polymer. This parameter is important since it indicates the cationic
charge on the molecule after dissolution in dilute acid.
Chitosan with high DD has high positive charges resulting in high reaction
activity because the relatively active primary amino groups of chitosan are
readily available for chemical modifications (Pochanavanich & Suntornsuk,
2002; Wang et al., 2004). Depending on its MW, the increase in DD of chitosan

10
could change the tensile strength of the membranes. Chitosan membranes
become more brittle and absorb less moisture at higher DD (Nunthanid, 2001).
Kim et al. (2006) reported that low DD chitosan films have lower water vapour
permeability and total soluble matter as well as higher tensile strength
compared with high DD chitosan films.
The N-deacetylation of chitin is almost never complete without inducing
degradation of the polysaccharide backbone (Prashanth et al., 2002; Cervera
et al., 2004a). The DD values close to 100% is rarely achieved with the
relatively mild and simple alkaline N-deacetylation method (Yong et al., 2000).
The DD of commercially available chitosan generally ranges from 60 to 90%,
depending on the manufacturing process (Rege & Block, 1999). Anyway, DD
can be lowered by reacetylation (Berger et al., 2004). Hwang et al. (2002)
reported that the MW of chitosan drastically decreased and DD increased with
an increase in temperature, reaction time and NaOH concentration.
Various methods have been reported for the determination of the DD of
chitosan. These include pH-metric titrimetry (Avadi et al., 2004), linear
potentiometric titrimetry (Tolaimate et al., 2000), colloid titrimetry (Berth &
Dautzenberg, 2002), sodium hydroxide titrimetry (Pochanavanich &
Suntornsuk, 2002), hydrogen bromide titrimetry (Domszy & Roberts, 1985;
Sabnis & Block, 1997), ninhydrin test (Curotto & Aros, 1993), 1H NMR
(Tolaimate et al., 2000; Mao et al., 2004; Freier et al., 2005), CP/MAS 13C NMR
(Prashanth et al., 2002; Kittur et al., 2003; Kumar et al., 2004), gel permeation
chromatography (Berth & Dautzenberg, 2002), pyrolysis-gas chromatography
11
(Muzzarelli et al., 1980; Lal & Hayes, 1984), infrared spectroscopy (Sabnis &
Block, 2000; Amorim et al., 2003; Mao et al., 2004;), near infrared spectroscopy
(Rathke & Hudson, 1993), first derivative ultraviolet spectrophotometry
(Muzzarelli & Rochetti, 1985; Tan et al., 1998; Khan et al. , 2002), ultraviolet
spectrophotometry (Aiba, 1986), pyrolysis-mass spectrometry (Mattai & Hayes,
1982) and circular dichroism measurements (Domard, 1987).
Although many methods are available for the determination of DD, it is
essential to choose a simple, rapid, user-friendly, cost effective and reliable
method that could tolerate the presence of impurities, especially the common
contaminant protein. Methods that measure directly the amine or acetyl amine
groups on the glycoside unit of chitosan would be preferred (Tan et al., 1998).
Sophisticated methods such as circular dichroism, NMR (nuclear magnetic
resonance) and thermogravimetry are not only costly for routine analyses but
require highly trained and skilled personnel (Tan et al., 1998). Infrared and near
infrared spectroscopy are primarily solid-state methods, and may yield
inaccurate results during the weighing of the hygroscopic chitosan sample.
Moisture content hence needs to be eliminated and the sample purity must be
determined separately. Furthermore, variation can be found in the results
obtained using different baselines with these methods (Shigemasa et al., 1996;
Tan et al., 1998). On the other hand, the hydrogen bromide titrimetry is limited
by the presence of protein contaminants remaining in the sample during the
extraction process, which resulted in lower DD values (Khan et al., 2002). Tan
et al. (1998) also reported the protein contaminants commonly present in crude
chitosan samples affecting the results of NMR, linear potentiometric titrimetry
12
and ninhydrin test. Titrimetry, NMR spectroscopy and gel permeation
chromatography methods depend on the sample solubility (Shigemasa et al.,
1996).
The first derivative ultraviolet spectrophotometry (FDUVS) was reported as the
simplest and most convenient method among all the presently available
methods (Tan et al., 1998). The method requires only very small amount of
sample, simple reagents and instrumentation. There is no interference problem
from protein contamination. Therefore, the FDUVS method was selected to
determine the DD of chitosan samples in the present study.
1.1.5 Applications of Chitosan
Chitosan is increasingly important in the areas of biomedical, agriculture,
cosmetics, environmental control, waste-water treatment and food processing.
In biomedical applications, chitosan has been employed as absorption
enhancer of hydrophilic drugs across mucosal surfaces (Fee et al., 2003),
accelerator for wound healing (Muzzarelli, 1977; Minagawa et al., 2007), wound
dressing (Martindale, 2000), haemodialysis membranes (Mallete et al., 1983;
Nasir et al., 2005), contact lenses (Ravi-Kumar, 2000), artificial skin (Ravi-
Kumar, 2000; Freier et al, 2005) and surgical sutures (Nakajima et al., 1986;
Tachibana et al., 1988). Chitosan has also been used in drug delivery systems
(Illum et al., 2001; Wang et al., 2001; Mi et al., 2002; Hsiue et al., 2003; Nie et
al., 2006), ophthalmology (Ravi-Kumar, 2000), tissue engineering (Zhong et al.,
2000; Anseth et al., 2002) and for enzyme immobilization (Zhou et al., 2002;
Hsieh et al., 2003; Wang et al., 2005).

13
The excellent membrane forming, high mechanical strength and adhesion
ability coupled with non-toxic and biocompatible characteristics make chitosan
an ideal immobilization matrix for the fabrication and construction of biosensors
(Yao et al., 2003; Wang et al., 2005; Lin et al., 2007). In addition, chitosan is
capable of adsorbing metal ions and various organic halogen substances thus
prevent the enzyme used in biosensors from damage (Wang et al., 2005).
Moreover, chitosan can form thermally and chemically inert film that is insoluble
in water (Wang et al., 2005). Yang et al. (2004b) reported the enzyme
immobilized on chitosan showed high activity due to its considerable protein-
binding capacity. Apart from this, the ability to form a transparent thin film is
another virtue for chitosan to be used in optical sensor (Zhao et al., 1998; Zhou
et al., 2002).
In agriculture, chitosan is used primarily as a plant growth enhancer, a
preservative coating and biofungicide that boosts the ability of plants to defend
against fungal infections (Oester et al., 2000). In the cosmetic area, chitosan is
used as a fungicidal and fungistatic agent in moisturizer, body creams, hair
lotion and bath lotion (Ravi-Kumar, 2000). Moreover, chitosan is effective in
treating acne. It is able to inhibit certain bacteria that cause inflammation
associated with acne (Oester et al., 2000).
Chitosan-based formulations have major applications in wastewater treatment
due to the coagulating, flocculating and metal-chelating properties of chitosan
originating from the high density of amino groups on its polymer chains
(Krawjewska, 2005). Chitosan is used as non-toxic flocculent in the treatment

14
of organic polluted wastewater and as a chelating agent or for the removal of
toxic (heavy and reactive) metals from industrial wastewater. Furthermore,
proteinaceous material from industrial wastewater can be removed through
coagulation mechanism (Krajewska, 2005).
Chitosan has been found to be safe for oral consumption. In food industry,
chitosan-based materials have been used as antimicrobial agents, beverage
clarification additives, flavour extenders, colouring and texture stabilizers
(Krajewska, 2005). Apart from these uses, chitosan is well known as a fat
binder (Hennen, 1996). It is an amino polysaccharide that has the ability to bind
lipids in the stomach before the lipids are absorbed through the digestive
system into the blood stream. Recent years, Hayashi and Ito (2002) reported
the antidiabetic action of chitosan. Accordingly, daily administration of chitosan
solutions as drinking water prevented the progression of non-obese and obese
type-2 (non-insulin dependent diabetes) diabetes mellitus through
normalization of hypertriglycaeridemia, hyperglycaemia and hyperinsulinism.
15
1.2 BIOSENSOR
1.2.1 Introduction
A biosensor is commonly described as an analytical device incorporating a
biological or biologically derived recognition element, either intimately
associated or integrated within a physicochemical transducer to produce a
signal proportional to the target analyte concentration (Singhal et al., 2002).
The biological component e.g. enzymes, antibodies, nucleic acids and
receptors is a biomolecule that contributes to the high specificity of the
biosensor in recognizing its target analyte. The analyte is first transformed by
the biological component to a quantifiable property and then into an electrical
signal by the transducer. Biological components can be distinguished as
bioconverting agents or biocapturing agents (Freitag, 1999). Bioconverting
agents such as enzymes catalyze oxidation or reduction involving specific
substrate(s) to product(s). Antibodies, nucleic acids and receptors are
examples of biocapturing agents where their selectivity are dependent on their
affinity towards the target analyte. Depending upon the biological recognition
elements used, biosensors can be divided into two groups, namely catalytic
and affinity biosensors (Tombelli et al., 2005).
The choice of biological component depends on the analyte under
investigation. What is important is a direct relationship between the biosensor
signal and the quantity of the analyte. Since the invention of the first oxygen
electrode by Clark and Lyons (1962), enzymes have been the most regularly
employed biorecognition elements encountered in catalytic biosensors for the
16
analysis of small molecules such as glucose which is widely monitored in
medicine, biotechnology and food industry (Freitag, 1999).
In the development of any biosensor, some critical performance requirements
for a particular application must be considered. A reliable biosensor should
respond selectively to an analyte of interest among a range of analytes.
Alternatively, the response may be to a group of analytes of similar chemical
structure such as carbonyl compounds. Apart from selectivity, a biosensor
needs to show high sensitivity. The signal-to-noise ratio must be large, with
detectable signals from small changes in analyte (e.g. 0.1 mM or approximately
2 mg/dl glucose) concentration (Wilkins & Atanasov, 1996). The linear dynamic
range of the calibration curve should be wide enough for the assay of the
analyte. For example, the determination of glucose in blood needs to be at
least 1X10⁻⁴ to 5X10⁻² M to cover the range of normal and diabetic blood
glucose levels. For the biosensor to be useful, the detection limit has to be
better than 10-5 M. Besides this, the response time has to be considered when
developing a reliable biosensor as this may affect the usefulness of the device
for repetitive routine analyses. The response time which refers to the time for
the system to reach equilibrium should not exceed 10 min ideally (Eggins,
2002).
Being analytical devices, the measurements by biosensors must be precise
where random errors must be below a certain level so that repetitive
measurements are reproducible within a certain range. With biosensors, the
expected reproducibility between replicate determinations should be at least
17
±(5-10)% (Eggins, 2002). Accuracy, which describes the proximity to the true
value, and affected by systematic errors is another important criterion. Together
with precision, they determine whether a method is suitable for a particular task
(validation) or whether data generated under the routine use of a bioanalytical
method are acceptable (acceptance criteria) (Karnes & March, 1993).
1.2.2 Enzyme Immobilization
The conversion of enzymes from a water-soluble, mobile state to a water-
insoluble immobile state fixed onto a support/matrix physically separates the
enzyme from the bulk of the solution (Krajewska, 2004; Milosavić et al., 2005).
Three important aspects must be considered prior to immobilization, namely, a)
properties of the free enzyme vs. the immobilized enzyme, b) type of support
used and c) methods of support activation and enzyme attachment (Worsfold,
1995).
1.2.2(a) Properties of Free Enzyme vs. Immobilized Enzyme
Enzymes are catalytic proteins which possess high selectivity towards a given
substrate. They increase the rate or velocity of a chemical reaction under mild
conditions by lowering the free energy of activation (∆G°‡) of the chemical
reaction without changing the overall process or equilibrium of a reaction.
Although enzymes can catalyze one reaction after another, they may have
lower activity after several runs. Unlike inorganic catalysts, enzymes are
specific. Most enzymes can break down a particular substrate or synthesize a
particular compound. The specific action of enzymes gives minimum unwanted

18
side-products. The various types of specificity of enzymes are stereo
specificity, absolute specificity, group specificity and low specificity.
Immobilized enzyme possesses a number of advantages compared to the free
enzyme (Pekel et al., 2003). Immobilization of enzymes onto a solid support
protects them against oxygen, humidity and biological contaminants (Miertuš et
al., 1998). The structure is therefore more stable and their handling easier
(Naik et al., 2005). Immobilized enzyme systems allow reuse of the enzyme
and easy recovery of the product, thus minimizing enzyme loss (Seo et al.,
1998; Akgöl et al., 2001; Tsai et al., 2003). If immobilization procedure is
reversible, the inactive enzyme can be desorbed and the matrix further
recharged with the fresh enzyme.
In analytical applications, immobilized enzyme is key to the development of
biosensors (Krajewska, 2004). The resultant biosensor must have good
sensitivity, selectivity, dynamic range, response time, stability and shelf-life
(Sakuragawa et al., 1998; Tsai et al., 2003). The performance of an enzyme
electrode may be affected by the thickness of the enzymic layer, the enzyme
loading as well as the conditions for the enzymatic reaction (Bardeletti et al.,
1991).
Immobilization may have a considerable effect on enzyme kinetics, stability (Xu
et al., 2001), changes in pH and temperature, Michaelis-Menten constant
( appMK ) and maximum reaction rate (Vmax) for the enzyme-catalyzed reaction
(Bartlett et al., 1992; Danisman et al., 2004). This could be due to structural
19
changes to the enzyme (Wang et al., 2003) with the creation of a distinct
microenvironment, different from the bulk solution around the enzyme
(Krajewska, 2004). The properties and functions of immobilized enzymes are
therefore characterized by three factors that include a) the biochemical
properties and the kinetic parameters of the enzyme, b) the chemical as well as
mechanical properties of matrices and c) the immobilization methods.
1.2.2(b) Support
The most important factor affecting the performance of an immobilized enzyme
is the support material (Krajewska, 2004). Different types of supports have
been used to immobilize enzymes namely beads and membranes (Ida et al.,
2000) using different immobilization techniques. There is no universal support
for all enzymes. The types of matrix and conditions for immobilization have to
be determined for each enzyme (Bickerstaff, 1997). The following
characteristics should be considered when choosing a support for immobilizing
an enzyme.
Physical properties
A suitable support must possess ease of assuming different geometrical
configurations providing the system with permeability and surface area suitable
for a chosen biotransformation (Krajewska, 2004). The surface density of the
binding site available to the enzyme determines the maximum binding capacity.
The support materials should also have good mechanical stability, rigidity and
good flow properties for enzyme stability and activity on storage (Danisman et
al., 2004; Krajewska, 2004).
20
Chemical properties
Hydrophilic matrices are generally preferred for enzyme immobilization. They
should be inert to enzyme(s), substrate(s) or co-factor(s) and possess available
functional groups for direct reactions and chemical modifications (Krajewska,
2004), have high affinity to proteins (Krajewska, 2004), have the ability to be
regenerated or reused and are compatible with certain buffers (Fortier et al.,
1990). They should also have a large surface area with a high content of the
reactive groups (Arica et al., 2000; Danisman et al., 2004). Apart from this, a
good support material should be non-degradable and biocompatible without
altering the native structure of the enzyme and affecting its biological activity
(Luo et al., 2004; Taqieddin & Amiji, 2004). In addition, an ideal support should
be resistant against bacterial or fungal attack, disruption by chemicals, pH,
temperature, organic solvents, or even enzymes such as proteases
(Bickerstaff, 1997). They should be non-toxic and biocompatible if the end
product is to be used for food, pharmaceuticals or agricultural products (Arica
et al., 2000; Taqieddin et al., 2002; Krajewska, 2004).
1.2.2(c) Methods of Enzyme Immobilization
Methods of enzyme immobilization can be broadly classified as physical or
chemical methods (Krajewska, 2004). The four common approaches to enzyme
immobilization are a) adsorption, b) entrapment, c) covalent coupling and d)
crosslinking (Eggins, 2002).

21
Adsorption
Adsorption is a simple, economical, reversible and quick way for immobilizing
an enzyme with the retention of its activity (Hsu & Tsai, 2001; Yağar &
Sağiroğlu, 2002; Debeche et al., 2005). In this procedure, links between the
matrix and the protein molecules can be hydrophobic or ionic in nature (Momić
et al., 2002) with little or no conformational changes of the enzyme (Tang et al.,
2004). The amount and stability of the immobilized enzyme might be low with
no formation of covalent bonds between the support and the amino acid
residues on the enzyme surface (Yağar & Sağiroğlu, 2002). Desorption of the
enzyme may occur with changes in temperature, pH, solvent, ionic strength,
concentration of enzyme or adsorbent (Zhu et al., 2005).
Entrapment method
This method is based on the localization of an enzyme within the lattice of a
polymer matrix or its enclosure in semi-permeable membranes tight enough to
prevent only the biocatalyst but not the substrate(s) or product(s) from diffusing
out into the reaction medium. Here the enzymes are entrapped in the interstitial
spaces of crosslinked and water-insoluble polymers without formation of bonds
or chemical coupling between the enzyme and the gel matrix or membrane
(Kennedy & Cabral, 1987).
The advantages of the technique include high viable enzyme concentration and
the possibility of co-immobilizing different types of enzymes physically
separated from each other. The technique does not alter the conformation of
the enzyme where only aqueous solvents are used (Scheller & Schubert,

22
1992). There are, however, some major drawbacks. Firstly, the diffusional
barriers as well as the steric hindrance to high molecular weight substrates
make the method unsuitable for enzymes such as ribonuclease, trypsin, and
dextranase acting on macromolecular substrates. The large diffusional barriers
to the substrate and product may slow down the reaction and the response
time of the biosensor. Secondly, some loss of enzyme activity due to the
production of free radicals during polymerization or leakage through the wide
pores in the gel could occur.
Another approach involves entrapping the enzyme within a hollow fibre of semi-
permeable membrane such as cellulose triacetate where the substrate solution
flows through the hollow fibre. The advantages of this method include high
resistance of the fibres to weak acids and alkalis, solutions of high ionic
strength and organic solvents. However, inactivation of the enzyme may occur
with the use of water-immiscible liquids, polymer solvents or precipitating
agents (Kennedy & Cabral, 1987).
The entrapment method also includes microencapsulation of the enzyme within
a semi permeable membrane without any bond formation (Sharma et al.,
2007). Microencapsulation provides a means of utilizing an enzyme
continuously in its native state over a long period of time. The advantages of
this immobilization technique include the extremely large surface area for
contact between substrate and enzyme within a relatively small volume and the
possibility of simultaneous entrapment of several (different) enzymes in a single
step (Kennedy & Cabral, 1987). The sequence of enzymatic reactions in

23
multiple enzyme systems will result in longer response time (Bardeletti et al.,
1991). Leakage of enzyme from the microcapsule may also take place
(Kennedy & Cabral, 1987).
Covalent-binding method
Covalent coupling of the enzyme molecules with the support material lead to
very stable preparations. The bond is normally formed between functional
groups on the carrier and groups on the enzyme not essential for the catalytic
activity (Lim et al., 1999; Eggins, 2002). Chemically reactive sites of a protein
are usually amino (NH2) groups from lysine or arginine, carboxyl (COOH)
groups from aspartic acid, glutamic acid, hydroxyl (OH) groups from serine,
threonine, phenol residues of tyrosine, sulfhydryl (SH) group from cysteine and
the imidazole group of histidine (Scheller & Schubert, 1992; Eggins, 2002).
Three main factors have to be considered for covalent immobilization of
enzymes, namely a) the functional groups of proteins suitable for covalent
binding, b) the coupling reactions between the enzyme and the support and c)
the functionalized supports suitable for enzyme immobilization (Kennedy &
Cabral, 1987).
The immobilization process is conducted in three steps namely activation of the
carrier, coupling of the enzyme and removal of adsorbed enzymes from the
support (Kennedy & Cabral, 1987). A wide variety of support materials have
been used for enzyme immobilization including Sepharose (beaded agarose),
cellulose, magnetic particles, silicates derived from China clay or diatomaceous
earth and glass. In all cases, the support materials must possess reactive
24
groups. If they do not, then the support can be activated by chemical means
using cyanogen bromide, carbodiimide, glutaraldehyde, aminosilane,
diazonium salts, acid chloride, isocyanate and isothiocyanate derivatives.
Selection of the crosslinker determines the type of covalent bond that will be
formed (Kennedy & Cabral, 1987).
An advantage of this method is that covalent bonding is strong with no release
of the enzyme into the solution even in the presence of substrate dissolved in
high ionic strength solutions (Kennedy & Cabral, 1987). The covalent bonding
between enzyme and carrier not only stabilizes the enzyme during catalytic
reactions at higher temperature, it also allows the enzyme to withstand
denaturants and organic solvents better (Arica et al., 2000). However, a loss in
enzymatic activity due to its conformational changes is encountered if amino
acids essential for the catalytic activity are involved in the covalent linkage to
the support (Scheller & Schubert, 1992) or harsh coupling conditions are used
(Afaq & Iqbal, 2001). To protect the active site, the enzyme can be immobilized
in the presence of a competitive inhibitor or substrate (Kennedy & Cabral,
1987).
Crosslinking
This approach is based on the production of three-dimensional crosslinked
insoluble enzyme aggregates by bi- or multifunctional reagents (Kennedy &
Cabral, 1987). The chosen crosslinking agent specifically binds functional
groups on the enzyme away from its active site to avoid inactivation, at
concentrations suitable for aggregation. The gelatinous nature of the product


![Radiation Modification of Natural Polymers - Hacettepe · matrix, plant growth stimulator ... CHITOSAN Food processing, ... Topic: Radiation Modification of Natural Polymers [13]](https://static.fdocuments.us/doc/165x107/5ac116db7f8b9a1c768c7345/radiation-modification-of-natural-polymers-plant-growth-stimulator-chitosan.jpg)